Financialization of the early Victorian economy and the ...odlyzko/doc/mania10.pdf ·...
62
Financialization of the early Victorian economy and the London Stock Exchange Andrew Odlyzko School of Mathematics University of Minnesota Minneapolis, MN 55455, USA [email protected] http://www.dtc.umn.edu/∼odlyzko Preliminary draft, May 31, 2016 Abstract. Previously unknown basic statistics are obtained about the opera- tions of the London Stock Exchange (LSE) in early Victorian times. Integration of data from the Bank of England Archive with price reports, press coverage, and other sources produces estimates for volume of transactions, distribution of earnings among dealers, efficiency of the market, and the coverage of avail- able price lists. For example, it is found that for some securities, prices were reported for under 20% of transactions. The LSE was surprisingly small and by some measures also surprisingly efficient. Much of its efficiency appears to have come from its deep involvement in the “shadow banking system” of that era, a connection that appears to have been misunderstood and almost com- pletely neglected in the past. The low levels of activity, the dominance of small investors, and low cost of the system show the very early stages of the “fi- nancialization” of the modern economy and provide interesting perspectives on modern developments. 1 Introduction The importance of the early Victorian period for the development of finance in Britain (and thereby, directly or indirectly, for the rest of the world) is widely recognized. However, not all aspects of that period are known well. As one example, recent moves by central banks have led to the appearance of negative interest rates, which are commonly claimed to have been regarded as impossible in economics. But while this claim may well be correct, it reflects ignorance of the negative interest rates that could be observed for some time in Britain in the 1850s, even though it was on a strict form of the gold standard 1 . Similarly, the wide acclaim for behavioral finance schemes that induce certain types of behavior from investors, and the description of them as novel, neglects the experiments in this direction by the British government in the 19th century. Aside from the amusing, although instructive, examples cited above, there are far more serious gaps in our knowledge of early Victorian finance. The two key institutions were the 1 See, for example, Economist, 19 Feb. 1853, p. 205, and 11 June 1853, pp. 641–42.
Transcript of Financialization of the early Victorian economy and the ...odlyzko/doc/mania10.pdf ·...
Financialization of the early Victorian economy
and the London Stock Exchange
Andrew Odlyzko
School of MathematicsUniversity of Minnesota
Minneapolis, MN 55455, [email protected]
http://www.dtc.umn.edu/∼odlyzko
Preliminary draft, May 31, 2016
Abstract. Previously unknown basic statistics are obtained about the opera-tions of the London Stock Exchange (LSE) in early Victorian times. Integrationof data from the Bank of England Archive with price reports, press coverage,and other sources produces estimates for volume of transactions, distributionof earnings among dealers, efficiency of the market, and the coverage of avail-able price lists. For example, it is found that for some securities, prices werereported for under 20% of transactions. The LSE was surprisingly small andby some measures also surprisingly efficient. Much of its efficiency appears tohave come from its deep involvement in the “shadow banking system” of thatera, a connection that appears to have been misunderstood and almost com-pletely neglected in the past. The low levels of activity, the dominance of smallinvestors, and low cost of the system show the very early stages of the “fi-nancialization” of the modern economy and provide interesting perspectives onmodern developments.
1 Introduction
The importance of the early Victorian period for the development of finance in Britain (andthereby, directly or indirectly, for the rest of the world) is widely recognized. However, notall aspects of that period are known well. As one example, recent moves by central bankshave led to the appearance of negative interest rates, which are commonly claimed to havebeen regarded as impossible in economics. But while this claim may well be correct, itreflects ignorance of the negative interest rates that could be observed for some time inBritain in the 1850s, even though it was on a strict form of the gold standard1. Similarly,the wide acclaim for behavioral finance schemes that induce certain types of behavior frominvestors, and the description of them as novel, neglects the experiments in this directionby the British government in the 19th century.
Aside from the amusing, although instructive, examples cited above, there are far moreserious gaps in our knowledge of early Victorian finance. The two key institutions were the
1 See, for example, Economist, 19 Feb. 1853, p. 205, and 11 June 1853, pp. 641–42.

2 Andrew Odlyzko
Bank of England (BoE) and the London Stock Exchange (LSE). Both have been subjects ofintensive research. However, while the coverage of BoE is comprehensive, that of the LSE islacking in many respects2. We have careful treatments of the institutional development ofthe LSE, of its dual governance structure, and of its internal self-regulation, for example.We also have some quantitative measures of the LSE, such as the number of membersand the capitalization of securities traded there. What we lack are various other importantstatistics, such as the volume of trading, the capital employed by LSE members, or the costof the LSE to the economy (and thus this institution’s contribution to the financializationof the UK). We also lack information about the accuracy and comprehensiveness of theprice lists that were published. These gaps in our knowledge reflect to a large extent theLSE’s decisions not to collect, or even to suppress, such information. This was driven, asoften happens, by traders’ desire for opaque markets. The LSE was a closed institution,where reporters and other outsiders were not admitted. It even had a special cry, “fourteenhundred,” that was raised when it was suspected that an interloper was in the building,as a signal to hunt and expel him ([18], p. 331). Kynaston commented that the lack ofpublications about internal LSE proceedings was “merely part of the larger aura of secrecyand anonymity that has traditionally surrounded the activities of [LSE],” and that inparticular “the world of jobbing [that of the dealers who bought and sold securities tobrokers, and thus made the market, see Section 2] remains an unpenetrated mystery”3.
This paper begins the task of penetrating some of the outstanding LSE mysteries, espe-cially those concerning the jobbers. We learn not just many of their names, but somethingof their roles and styles of work. The research reported here concentrates on the mid-19thcentury but has implications for other periods, and can be extended to obtain similar es-timates in those other times. The main previously unexploited source of information thatprovides the basis for this project are the records at the BoE Archive of trading in Britishgovernment debt, which dominated LSE activities in that period. These records have beenknown to scholars for a long time (cf. [10]), and have been utilized extensively for theperiod around the South Sea Bubble of 1720 by various investigators, such as Carlos andNeal [8], and by Carter [9] for the mid-18th century. However, those from the 19th centuryseem to have been neglected. This may have been due to the sheer volume of material,since, as a result of the huge growth in British national debt in the period around 1800,they cover around a quarter million accounts at any time during the 19th century. Forexample, Morgan and Thomas in one of the main modern histories of the LSE commentedthat “an exhaustive study of [BoE records] would be impossible” because of their volume,and were satisfied with a sampling done for them by the BoE archivists “for the year 1802,in itself a formidable task” ([35], p. 66).
An exhaustive study of BoE records might be possible in the future as a result ofimproving technology. While the records are all hand-written, often in barely legible script,they are largely in structured form and written by a small number of clerks. Hence it should
2 The main recent book-length treatments of the LSE are [30,34,35], and earlier works are representedby [15,16,17,18,43,44], although this is only a small sampling.
3 [30], pp. 16, 24. It should be noted that since Kynaston wrote those words, very valuable work on jobbers hasbeen published by Attard [5,6]. But it is still primarily qualitative, and based primarily on reminiscences of 20thcentury jobbers.
Financialization of British economy 3
be possible to write specialized OCR (optical character recognition) software to digitizethem with limited amount of human labor. But that will still take time and substantialresources. In the meantime, this paper shows that one can extract useful information withmanual labor by either digitizing completely small collections of records, or by extractingstatistics from larger sets. Although various records were used, and are cited in the paper,the main results come from study of two large data sets that were prepared using thosetwo strategies. One is that of all transactions and holdings of the South Sea Old Annuity(SO), which is described in Section 6, from October 1838 to 1854, when this security wasabolished. Digital transcriptions of those records are publicly available at
http://www.dtc.umn.edu/∼odlyzko/19finance/index.html
SO was a small and obscure financial instrument, when compared to several of the largerand better known British government bonds, but it was large compared to most privatecompany capitalizations. Hence patterns of investments and trades in SO probably doprovide some indication of the behavior of the joint stock securities that came to dominateLSE activities.
The other large data set that was obtained is a collection of less detailed statistics ontrades in Consols (CA) in the period 1837–36 by jobbers and other active traders. CA wasthe largest and most prominent of the British government bonds in the 19th century, andby itself amounted to over a third of the capitalization of all securities trading on the LSEwell past 1850.
The BoE transfer records were integrated with the market transaction prices that wereobtained from the standard source for such data, namely the Course of the Exchange,(CoE). In addition, various other published sources were drawn upon. So were the unpub-lished manuscript archives of C. Hoare & Co., the oldest bank in England. In the economichistory literature, this institution gained prominence through the work of Temin and Voth,who showed it rode the South Sea Bubble of 1720 to substantial profits [48]. Its generalreputation has been as one of the genteel West End banks, catering to a clientele drawnfrom the aristocracy and upper middle classes. This project shows that it was also a keyplayer on the LSE and in the short-term money market4. This unexpected finding is con-nected to the important and severely underappreciated role the LSE played in the moneymarket. While there are many references in the contemporary literature to this role, itappears to have been neglected or misinterpreted by most scholars of British banks andof the British “shadow banking” system. Even Bagehot does not mention it in his famousLombard Street [7]. A very illuminating source of information on this topic turns out to bethe 1842 report of the Royal Commission on the notorious Exchequer Bills forgery whichcame to light in late 1841 [50]. This report appears not to have been investigated by anymodern scholar of the LSE, most likely because forgery of a short-term government instru-ment did not seem relevant to any larger issues5. In fact, though, this Blue Book’s 450 or
4 In this paper, the term money market is used in the modern style, to denote short-term transactions. In theearly Victorian times, it usually also included gilts, and a common title for the financial column of a newspaperwas “Money market and City intelligence,” with City denoting the City of London, the commercial and financialhub of the London metropolitan area.
5 The only modern work that appears to have used this report was the book by Klaus [29], which is focused ongeneral investment fraud issues and not on the LSE itself.
4 Andrew Odlyzko
so pages of evidence are concerned primarily with the internal functioning of the LSE6,especially its role in accommodating short-term money flows. Among the instructive andamusing items there is a description of how members of the LSE looking to get funds wouldshout on the floor “Borrow money, borrow money” ([50], Q. 311). More important, butrelated, was the ability of LSE to move funds around quickly. The other parts of the Britishbanking and shadow banking systems moved ponderously. As an example, all importantdecisions at the BoE were handled by its board of directors, which, except for crisis times,met once a week. The LSE provided much greater flexibility, and the interest rates therevaried not just daily, but hourly, cf. [50].
An important feature of the LSE’s role in the London money market might turn outto be the ability to obtain precise quantitative measures of some parts of it, namely thosethat involved use of gilts as collateral. Such measures have proved impossible to obtainfor any part of the British financial system other than the BoE. But this will requiremuch more work to elucidate. This paper only does some very preliminary studies on thistopic. However, those studies are essential, since shadow banking did account for a largefraction of LSE transactions. Therefore it is necessary to estimate them in order to obtainmeasures of the LSE operations that have been the traditional focus of studies, namelythose associated with long-term investments. It appears that the jobbers were able tooperate with relatively small capital precisely because they could draw on the much largerholdings of some large financial operators, who used those long-term securities primarilyas collateral for money market dealings.
The findings about the shadow banking role of the LSE are preliminary and very ten-tative. Hence, more than anything else, they point to the need for more research on thistopic. On the other hand, other results of this project are far more definitive, even thoughthey often give rise to new puzzles. In particular, the integration of data on SO transactionswith Course of the Exchange prices provides the first ever quantitative measure for the de-gree to which published reports reflected actual market activities. The estimate that under20% of the market transactions showed up in price lists is necessarily a very rough one,since it fluctuated from year to year even for SO, the only security for which data has beencollected so far. But it serves as a useful guide and a reminder that the lack of publishedprices did not necessarily reflect lack of market activity, as has sometimes been asserted inthe literature. The price lists that have been the basis of all previous studies of Victorianmarkets provide just episodic evidence of the business that was done. This estimate almostsurely applies also to later parts of the 19th century and to other securities.
The estimates for turnover at the LSE, the capitalization of LSE members, the bid-ask spreads on some small securities, and other statistics on LSE operations are all newcontributions of this paper. One surprising conclusion is that the core of the LSE was avery small operation. In particular, the jobbers, who were often depicted in contemporaryliterature as powerful and shadowy agents who manipulated the markets to shamelesslydespoil the public (as in the title of [1], to take just one minor example), appear to havebeen a relatively small group of not very affluent but very hard working specialists who
6 For devotees of social network analysis, this report is is an outstanding early example of such work, as it delvesinto relations among the many witnesses and the diffusion of information among them.
Financialization of British economy 5
fought over a small flow of orders from the public. While many probably did have highearnings, most seemed to have to work hard to put bread on the table, as the large operatorsamong them had a disproportionate share of the business. David Ricardo’s famous comment([47], pp. 149–151) about his fellow jobbers, that few “have much knowledge of politicaleconomy, and consequently they pay little attention to finance” is consistent with theobserved behavior. They seem to have reacted quickly to news or rumor that might affectprices, but did not engage in strategic arbitrage, and strove to turn over their holdingsas rapidly as possible. But there were other LSE members who did not behave like mostjobbers, and appeared to carry out a variety of arbitrage and other operations, and thusmade that market more efficient. (It should be said that just one example of that specieshas been documented, namely William Hammond the Younger, who shows up in severalsections, and has Section 20 devoted to him.)
The British financial markets in the early Victorian times had huge capitalization,due primarily to the national debt that had accumulated in a century and a quarter ofincessant wars that only ended with the Battle of Waterloo in 1815. But this capital waslargely inert, as had been reputed historically, and as this paper confirms quantitatively.There were also rapidly growing banking and insurance industries, yet both were smallby modern standards. Therefore the British financial industry, while very sophisticated(“[a]lmost all the principal services provided by today’s City and today’s Wall Street werethen available in London,” in the words of some modern scholars, [24], p. 184) was onlya small tail on a large and somnolent dog that could not be wagged easily. One of thekey historical questions that the research of this paper should shed some light on is theextent to which the small LSE, the bridge between the large but immobile capital residingin gilts, and the more active finance sector, helped induce movement of that sleepy capitalinto joint stock investments in finance, commerce, and manufacturing.
The early Victorian financial markets differ by several orders of magnitude from oursin speed and complexity. Yet they provide interesting perspectives on modern times, sincethe basic laws and institutions were essentially the same, and so were the basic financialinstruments. So differences can be probed for indications of different approaches to thesame problems. We can marvel at the early Victorians tolerance of various types of ineffi-ciency. For example, Charles Darwin’s early investments were all in illiquid mortgages thatpresumably required unmeasured costs to find, negotiate, etc.. On the other hand, Dar-win’s contemporaries would surely claim that from their point of view the most strikingefficiency in the modern world is the one with which the financial sector extracts valuefrom the rest of the economy. James Gilbart, a prominent banker and writer on bankingin mid-19th century claimed ([21], p. 18):
A banker need not be a man of talent, but he should be a man of wisdom. ... He neednot possess any one remarkable quality by which he is distinguished from the restof mankind. He will possibly be a better banker without any of these distinctions.It is only necessary that he should possess a large portion of that practical qualitywhich is called commmon sense.
This might seem hopelessly outdated in our days of “Masters of the Universe” bankers, butif we consider the recent recommendations of Mervyn King [26], who was head of the BoE
6 Andrew Odlyzko
during the world financial crisis of 2008, they would basically take us back to Gilbart’sview that banking should be boring and safe. And Gilbart, were he to come alive and hada chance to look back at the last century and a half, would surely wonder what possessedthe world to disregard his advice.
While there are many potential implications of the findings of this project for the historyand current evolution of the financial system, this paper does not deal with them. (Forexample, it does not attempt to address the questions raised in [13,38] about comparativeadvantages of LSE versus other countries’ stock exchanges.) What it presents is primarily aprogress report on the ongoing study, detailing some of the new findings that are emergingabout the LSE. It is not meant to stand alone as an introduction to the LSE, and is bestregarded as a supplement to some of the existing studies, especially those of Kynaston [30],Michie [34], and of Morgan and Thomas [35].
The next few sections provide a brief overview of the LSE and the main securities thattraded there in the mid-19th century. Then Section 4 describes the main source of newdata for this project, the stock ledgers in the BoE Archive. This is followed by a reviewof the sources for security prices on the LSE. Section 6 starts by reviewing the SouthSea Company (SSC) and its securities, and that is followed by the results of the detailedinvestigation of trading in one of those bonds, the South Sea Old Annuity (SO). Section 12is the first of several that consider trading in Consols and other large bonds. Section 16starts the consideration of the British banking and shadow banking systems, and of LSE’srole in them. At the end, there are some sections on the various roles that LSE membersplayed, on the Hoare bank and its large presence on the LSE, and on William Hammondthe Younger, who appeared to be a unique and very influential actor at the LSE. The finalsection has the conclusions.
2 LSE members
The membership of the LSE grew to about 800 in 1850 under the influence of the expansionof equity investments during the Railway Mania. It then stabilized, and started growingagain in the 1860s, with almost 5,000 members in 1900. The two main categories of memberswere brokers and jobbers (or dealers). Brokers dealt with outside customers. The basic modeof operation was for brokers with orders to buy or sell from their clients to come to thefloor of the LSE and solicit quotes from jobbers. They would ask for such quotes withoutrevealing which side of the trade they wanted to execute, and the jobbers would respondwith their buy and sell prices, with the bid-ask spread, then called the “turn,” giving themthe margin of profit7.
By the end of the 19th century, the LSE began strictly enforcing the rule that memberscould be either brokers or jobbers, but not both. But even before that, combining the tworoles, with its obvious potential for conflict of interest, was frowned upon, and seemed tobe practiced only in the more exotic securities.
As this paper shows, there were many members of the LSE that did not fit neatly thebroker/jobber dichotomy, in particular some of those who were engaged in the short-term
7 For gilts, jobber offers were binding for amounts up to £1,000. In practice, the first interaction between a brokerand a jobber was often just the prelude to a lengthy negotiation for a deal with special conditions.
Financialization of British economy 7
money market transactions. Still, one of the major puzzles that emerges from the researchof this paper concerns the activities of LSE members. It appears that most of them musthave done very little LSE business, and perhaps only occasionally dropped in. This isdiscussed in some detail in Section 19.
3 LSE securities
The LSE as a formal institution opened in 1802 and its founding document specified that itwas “for the transacting of buying and selling the Public Stocks or Funds of this kingdom”8.This was natural, as there were very few other tradable securities (although some thatexisted were traded at the LSE). This started to change around 1822 with the arrivalof large loans to foreign governments, and later with joint stock company shares, mostprominently of railways. By the end of the 19th century, British national debt was a smallpart (under 15%) of the capital traded on the LSE, although it did represent its stable core.However, as late as 1853, it represented about 70% of the nominal value of all securitiesquoted on the LSE ([34], pp. 88-89), and around 1840 this fraction must have been around85%.
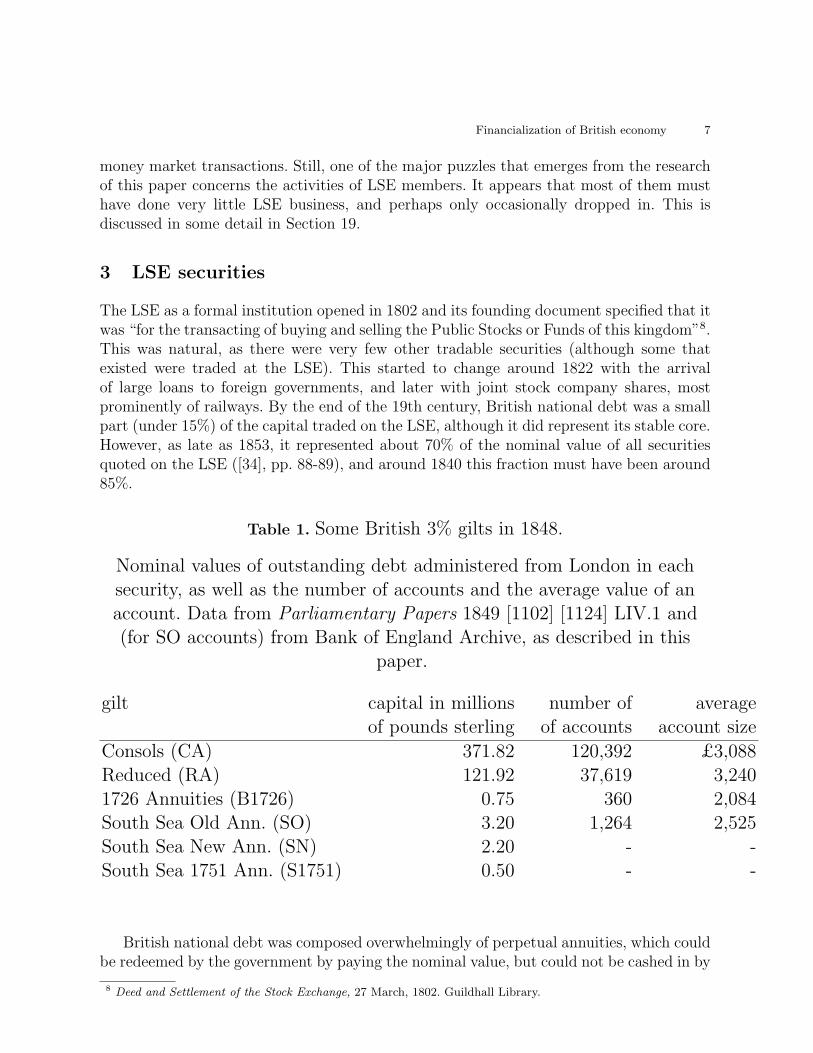
Table 1. Some British 3% gilts in 1848.
Nominal values of outstanding debt administered from London in eachsecurity, as well as the number of accounts and the average value of anaccount. Data from Parliamentary Papers 1849 [1102] [1124] LIV.1 and(for SO accounts) from Bank of England Archive, as described in this
paper.
gilt capital in millions number of averageof pounds sterling of accounts account size
Consols (CA) 371.82 120,392 £3,088Reduced (RA) 121.92 37,619 3,2401726 Annuities (B1726) 0.75 360 2,084South Sea Old Ann. (SO) 3.20 1,264 2,525South Sea New Ann. (SN) 2.20 - -South Sea 1751 Ann. (S1751) 0.50 - -
British national debt was composed overwhelmingly of perpetual annuities, which couldbe redeemed by the government by paying the nominal value, but could not be cashed in by
8 Deed and Settlement of the Stock Exchange, 27 March, 1802. Guildhall Library.
8 Andrew Odlyzko
investors otherwise, except through market sales to other investors. These annuities will becalled gilts in this paper, using modern terminology, even though this usage is anachronistic.Until the 1860s, they were strictly book-entry securities, and were often referred to as“Public Stocks” or “Funds,” as in the passage cited above, or similar expressions. Recordsof holdings and transfers were maintained at the BoE and SSC. Prices and transactionswere universally cited in units of nominal (par) value £100, although transactions couldbe, and were, carried out in amounts as low as one old English penny (1/240-th of onepound). (In this work, to improve readability, figures are presented in a decimal format,and are usually rounded either down or to the nearest pound, and sometimes even in largerquantities.)
Equity investments in the BoE and the SSC were also book-entry securities, and werealso referred to as “stock,” quoted in units of par value £100, and also almost infinitelydivisible. However, to distinguish them from annuities, and to conform to modern usage,they will be referred to as shares of par value £100 in this paper.
The main British government long-term securities that existed in mid-19th century andpaid 3% annually are listed in Table 1. This listing is dominated by the two “major” gilts,CA and RA, both of which dated to the 1750s. There was another major gilt in 1848, whichpaid 3.25% per year at that time (a rate that was scheduled to drop down to 3% at theend of 1854). Its capital was £215.7 million at the start of 1848, and it had been createdin 1844 through the conversion of four annuities that had been paying 3.5% annually.
There was also £3.66 million of capital of the South Sea Company that was a perpetualloan to the government at 3%. Investors owning it received 3.5% from the interest paid bythe government and some other earnings of the company. The BoE was the most prominentjoint stock company, and had nominal capital of £14.5 million. Of this capital, £11 millionwas on loan to the government at 3% per year, but other earnings allowed the BoE to payits investors dividends of around 7% per year in the 1840–55 period, with the result thatits market capitalization was usually in the range between £20 and 30 million.
It was only in the 1850s, after the huge expansion of the Railway Mania, that a fewrailways started to rival the BoE in market capitalization. For example, in 1854, the largestcompany in that industry, the London and North Western Railway, had equity capital ofabout £22 million, valued in the market at about par, and about £9 million of debt,at a time when the BoE equity was valued at about £30 million. The vast majority ofrailways, and all joint stock companies in other industries had capital far lower, lower eventhan that of the SSC. Hence in spite of the many differences between SSC annuities andprivate enterprise securities, patterns of investment behavior or of reporting of prices thatwe observe for SO were likely similar to those for joint stock company equities.
There were several material differences between government annuities (as well as BoEand SSC shares) on one hand and most joint stock or foreign securities. The former werefree from any taxes or transaction fees, with the costs of handling and processing therecords paid for by the government9. For the latter, there were transfer fees as well as astamp tax, which was about 0.5% of the transaction amount.
9 In the case of BoE and SSC shares, there were no taxes, but the companies levied minor transfer fees.
Financialization of British economy 9
Even more important, most government annuities traded only “for money,” meaningthat payment was due immediately on sale. In practice, this occasionally meant settlementin one or two business days, especially since it was only on some days of the week that theBoE and SSC recorded transfers without charge, and on others a fee had to be paid. Thismeans that the date of transfer, as available to us from the ledgers of the BoE and SSC,is sometimes a day or two after the transaction, whereas the transaction price, if it wasrecorded, is given on the day the deal was struck.
For joint stock and foreign securities, trading was done “for account,” to be settled atthe two account days in the middle and end of each month. There was one governmentannuity that also had trading “for account,” in addition to “for money,” and that wasthe largest and most important one, Consols, or CA10. There were 8 CA account days peryear until the middle of 1848, when a system of monthly account days was introduced. Inaddition to their stated purpose of settling CA deals, CA account days were also used tosettle a variety of short term financial transactions in London.
The balance between trading “for money” and “for account” in CA is an importantopen question that is discussed later. Some indications are that they were comparable, whileothers suggest that “for money” deals dominated. This is important in evaluating the datain the BoE ledgers. Those ledgers only record actual transactions in a given security. Adeal “for account” could be carried from one account period to another, and could be soldby multiple parties in the meantime and would only result in a record visible to us whenand if the transaction was carried out. In addition, jobbers dealing “for account” couldin principle operate with very little capital, and in some securities at the end of the 19thcentury this was common, cf. [30]. To operate “for money,” on the other hand, jobbers hadto have an inventory of a given security in their names in order to be able to sell. Both theBoE and the SSC had rules that the same security could not be transferred more than oncein a day, so the most that a jobber could sell of SO in a given day, say, was the amount hehad at the start11. Hence trading in almost all gilts, including CA “for money,” did requiresubstantial capital.
In mid-19th century, gilts (as well as other securities) had periodic “shuttings” whenregistration of transfers was suspended to allow custodial organizations to prepare thepayment of interest, which occurred on January 5 and July 5 for some gilts (in particular,CA, SN, S1751, and B1726), and April 5 and October 10 for others (such as RA, the3.25% annuity, and SO). Those shuttings had been as long as 6 weeks at the start of thecentury, but were shortened as time progressed. Eventually they were eliminated entirelyby introducing an ex-dividend day about a month before the interest was due, and allowingcontinuous trading. But that only happened in 1861, so is not relevant for this paper. Oneof the major advantages of CA until 1860 was that, with trading for account, it could betraded on the LSE at any time, although in a limited way during shuttings.
10 There was also trading “for account” in BoE shares. Later in the 19th century there were others, too.11 Some exceptions to this rule were found in the SO ledgers. All seemed to be cases where a new owner acquired
the security and immediately sold it. Whether officially or unofficially, the SSC seemed to allow this to happenin one day, as the risk of fraud in such cases was minimal.
10 Andrew Odlyzko
Organized exchange trading in gilts in Britain in the 19th century itself took place onlyat the LSE12. However, trading even in London was not restricted to the LSE, since BoE andSSC accepted all validated transfer instructions, and their ledgers carry no indication wherea deal was agreed. A frequent place for transactions (even by LSE members) was, until1838, the Rotunda of the BoE. There was also some trading on the Royal Exchange [34,35].In the 18th and early 19th century, there seemed to be strong popular interest in bypassingthe financial intermediaries that were perceived as being extortionate and corrupt, as canbe seen by the large number of editions of the book [36] that were published. That agitationappears to have died down as the 19th century progressed. There were practical difficultiesto bypassing brokers, since the BoE required that its clerks had to personally know thepeople executing transfers. That meant small investors pretty much had to go through abroker. However, their brokers could bypass the jobbers, and there are many contemporaryreferences to brokers doing this. It is likely that this happened primarily for frequentlytraded securities such as CA, and it would take much more detailed investigation than hasbeen carried out so far to detect this in the CA ledgers. For an illiquid security such asSO, such transactions were much less likely for small amounts. However, this paper showsthat quite a few of the large transactions did bypass the jobbers, both to save on thejobber bid-ask spread and because some of those transactions exceeded the capacity of thejobbers.
4 Bank of England (BoE) Archive
The main source for this paper are the stock ledgers preserved in the BoE Archive. Thereare over 7,000 volumes in this series, cataloged under reference number AC27. They recordthe holdings in the securities administered by the BoE between 1694 and 1963, includingthose of BoE shares, as well as of the SSC annuities13. These ledgers also include a certainnumber of index volumes, so-called ‘alphabets’ and ‘double alphabets.’
While a variety of the stock ledgers were consulted, and some will be cited, the mainstatistical information comes from
– AC27/6533 and AC27/6534, which contain the complete record of transactions in SOfrom October 1838 to the abolition of this security in 1854
– AC27/2693 through AC27/2703, which contain almost all transactions of jobbers14 andother active traders in CA from July 1837 to July 1846
Both BoE and SSC ledgers were made of high quality paper, and with careful custodyby the BoE Archive, there has been little physical deterioration. However, the BoE hadconsiderable difficulty in finding candidates for its generally prestigious and desirable clerkjobs who could write legibly, as is described in [37]. Hence the handwriting is often hard
12 There was also a gilts market at the Dublin Stock Exchange in Ireland which was created even before the LSEwas set up in its modern form in 1801–1802 [49].
13 The SSC annuity ledgers were transferred to the BoE when the SSC was dissolved in the late 1850s. Unfortu-nately, the ledgers for SSC shares appear not to have been preserved.
14 The main exception was a substantial collection of jobber records that ended up, undoubtedly through a mistake,in a general investor ledger AC27/2138. They were incorporated into this dataset.
Financialization of British economy 11
to decipher. Even more serious is the lack of good indexing. The SSC ledgers for the 19thcentury cover a relatively small number of accounts, and have good cross-referencing ofentries, so are relatively easy to work with. The BoE ones pose a much greater challenge,even aside from the far greater number of accounts (about 100 times as many for CA asfor SO). BoE archivists have written some guides to the rather idiosyncratic indexing thatis used there, but those are just rough guides, as the BoE clerks seemed to exercise a fairamount of discretion in the procedures they followed. Fortunately, starting in 1798 for CA,and later for the other major gilts (and in 1845 for BoE shares), the BoE started usingseparate stock ledgers for jobbers. Those “jobber” ledgers also include information abouttransactions of some other frequent traders, as will be discussed later. Such ledgers are ofgreat help in quickly extracting information about the dealings of agents they cover.
The statistics for CA trading that are reported in this paper are mostly high level aggre-gates, described in Section 12. More detailed information about CA and some informationabout other BoE gilts is in preparation.
All the transactions in SO from October 1838 to 1854 have been transcribed, and areavailable online at
http://www.dtc.umn.edu/∼odlyzko/19finance/index.html
In the near future similar transcriptions will be completed for the other SSC annuities, SNand S1751, as well as for the minor BoE annuity B1726. The SO financial data has beenchecked fairly carefully (considerably more carefully that for CA), and includes names onaccounts (which were not checked as carefully as the dates and amounts of transactions).The account lists can be used for studies that have not been pursued yet, such as those ofgender in investments. The SSC ledgers have more information than has been transcribed,such as addresses of account holders, and in many cases information about their status(’banker,’ ’spinster,’ retired Royal Navy officer, and so on), as well as about executors incases of death. That information could be transcribed with modest additional effort andused for further studies.
5 Price and volume data
Price reporting that is examined here is that of the Course of the Exchange, designatedas CoE. Until the appearance of the London Daily Stock & Share List in 1867, it was themost complete and most authoritative source of information about actual transactions ingilts, and is the most frequently used source for LSE price data in modern studies of themid-19th century. The CoE was published twice a week, on Tuesdays and Fridays, afterthe close of business on those days. For almost all British joint stock company securities,each issue would have a single entry reporting trading on that day and the two precedingtrading days. For gilts, though, each issue had separate reports for each of those threedays. The CoE was a private venture of the Wetenhall family, but, as it claimed most ofthe time, it was “Published by authority of the Committee of the Stock Exchange,” and itsaccuracy was scrutinized to some extent by that committee. The data in it was taken fromthe Official List of the LSE, which consisted of transaction prices reported by members.
12 Andrew Odlyzko
The CoE did not report all transactions, just representative ones throughout each day,ones that showed how prices moved. Only actual prices realized were reported, not closingquotes, which often could be found in various papers in more or less systematic ways.(The Economist will be used here, as it has been in most of previous studies.) There wereattempts to introduce spurious entries (although probably seldom for gilts) into the CoE,and there were typos in what was printed, with only occasional errata being published.
The Official List and the CoE did not have complete records of prices for the LSE,and of course none at all for transactions concluded outside the LSE. Only transactionsreaching certain thresholds (£500 in par value for gilts) were eligible for entry, and onlyif they were carried out during the official hours of the LSE15, whereas some trading tookplace both before and after. The most serious defect of the LSE price reporting system,though, is that it was optional. There was no requirement that anything be reported. Thiswas a frequent source of complaints, cf. [16,30,52], and gave rise to the question of justwhat purpose the system served. “[I]t is said that many [broker] members only record [theprice] when they feel they have made a bad bargain, and want to convince the outsideclient that the stock has actually been dealt in at that price” ([16], p. 48).
Another deficiency of the Official List and the CoE is that they had no data about thesizes of transactions. Only prices were reported and recorded, and there was no indicationwhether those were prices of sales or purchases by jobbers. Even knowledgeable insidershad only vague estimates of the turnover rates. In 1877, Mihill Slaughter, who was headof “essentially a statistical department of [the LSE],” testified that some LSE membersthought the volume of non-gilt transactions was several times higher than his best estimate([52], q. 955ff). This is noteworthy, since his was not an ad-hoc estimate in response toa question from the Royal Commission that was questioning him, but something he hadthought about before, and discussed with members of the LSE.
When the LSE Clearing House was created in 1874, initially for only a few securitiesand with only a few members, it provided statistics on its activities, which Giffen analyzedto get some information about the nature of LSE business [19]. However, soon thereafterall information releases from the Clearing House ceased (cf. Giffen testimony in [52]), mostlikely in order to deny ammunition to those critics of the LSE who claimed it was not muchmore than a gambling den, “that most fruitful cause of crime and misery” [3]16.
6 The South Sea Company and its securities
The South Sea Company (SSC), which was central to the South Sea Bubble of 1720,continued to exist until the 1850s. By that point it was basically just an agent for theadministration of the three annuities, SO, SN, and S1751, whose volumes in 1848 are listed
15 The official LSE hours were originally 10 am to 4 pm on all six working days of the week, and applied throughthe 1830s. They were then gradually reduced, so that by the mid-1850s they were 11 am to 3 pm on Mondaysthrough Fridays, and 11 am to 1 pm on Saturdays.
16 The cited source, as well as most other critics, attacked primarily “time bargains,” or what were essentiallyfutures transactions “for account.” It was the high volume of total transactions passing through the ClearingHouse, as opposed to actual final transfers of the underlying securities, that aroused the critics’ ire, as it was anindication such morally suspect deals were common.
Financialization of British economy 13
in Table 1. All paid 1.5% twice each year, with SO interest dates being 5 April and 10October, and those for SN and S1751 being 5 January and 5 July. Thus SO matched RAin payment dates, while SN and S1751 (as well as SSC shares) matched CA. Hence wemight expect that SO pricing might track that of RA, while SN and S1751 prices wouldfollow that of CA. And that is what we find, but with discounts that were fairly stable overperiods of months and even years, but did vary over longer periods. The tables contain allthe prices for SO that were published in the CoE from 1838 through 1854. For each daythat a price for SO is available, the final price for RA listed in CoE for that day is given.
The most labor-intensive part of this project, and the one that is key to most of theresults, was the transcription of all transactions in SO from October 1838 (when new ledgerswere started) to its abolition in 1854. These transcriptions are available online. Most ofthe statistics reported in this paper exclude transactions that took place in 1853 and 1854.The reason is that in April 1853, Gladstone, at that time the Chancellor of the Exchequer,proposed the abolition of the SSC securities, and his plan was quickly enacted into law byParliament. This led to an extremely high rate of turnover, with many financial operatorsentering the market, as these securities became short-term ones. Thus those transactionsare of an entirely different character from the ones that are the focus of this paper, sowill not be considered further here. But there is much that can be learned from them.As just one small example, the overwhelming majority of investors in SO (72%), with asimilarly overwhelming majority of its capital, opted to be repaid in cash in April 1854instead of taking one of the conversions offered to them by Gladstone. Payments could bereceived starting on 6 April 1854, and, as one might expect, most of the large and financiallysophisticated operators did get their money that day or the next. But there were manyinvestors who delayed, including some (about one third of the total, with about 10% of thecash) who had still not collected their money by the end of May 1854, when their accountswere turned over to the BoE, at which point we lose track of their fate. (No interest waspaid on money that was due but not collected, so there was an obvious incentive to actfast.) The Court of Chancery, which had by far the largest balance, £257,000, or about13% of the cash that was due (mostly on behalf of numerous trusts it was administering),took two and a half weeks to collect. This confirms its general reputation for corruptionand inefficiency, and for representing “dumb money” at the LSE. But the fact that onlyhalf of the cash had been collected in the first 10 days that it was available suggests therewas some combination of poor information diffusion, the usual procrastination, and likelysome cultural inhibitions that were at work to cause this delay. The date cash was to beavailable had been known for a year.
Much of the work reported in this paper is devoted to SO pricing. Had the 3% gilts allbeen irredeemable, their fundamental economic values would have been the same, as theywere all backed by the full faith and credit of the British government17. However, there
17 The institution of national debt in Britain around 1700 is well known to have been a crucial step in the evolution ofthe modern fiscal and financial systems. However, although Parliament was backing all the debt, there continuedto be some differences in terms of the primary designated sources for payment. Even when Pitt’s ConsolidatedFund was set up in 1787 to provide a unified account for all national debt payments, the enabling legislation,27 Geo. III c. 13, declared that interest on all debt was to be paid, but that administered by the SSC would bepaid first! This was to avoid violating the promises made to the SSC early in the 18th century.
14 Andrew Odlyzko
were two widely recognized reasons why the price of SO might not match that of RA, forexample18.
One possible reason for a discount on SO was liquidity. While some (including Keynes)have regarded the value placed by investors on liquidity as unjustifiably high, an exam-ple of a behavioral finance aberration, this high valuation is widespread. Therefore it isnot surprising that it might affect the pricing of SO adversely. And that is what manycontemporaries claimed led to SO trading at a substantial discount to RA.
The other reason that was cited for higher prices for RA was concern about earlyredemption of SO. The volume of SO (and the other SSC securities, including its shares)was so low that the government could redeem it easily at any time after 1830, say. On theother hand, RA capital was large, so redeeming it presented substantial obstacles. In the1844 conversion, which involved four annuities with total capital about twice that of RA,the government offered investors 2 to 3% more than it was obliged to, in order to get themto agree to the proposal and not insist on being paid off in cash. In that case, only two ofthe four annuities had large capital, but the government offered the same generous deal toowners of all four. But there was no guarantee it would always do so, and it did not followthat precedent with the SSC. When Gladstone decided to do away with SSC securities in1853, he forced SSC securities’ holders to accept either cash or some new securities, whilethe holders of CA and RA had the option, but not the obligation, to take part in theconversion19.
There are reasons for questioning both of the cited reasons for the discount on SOcompared to RA, similar although weaker than the reasons for questioning the frequentdiscount of RA compared to CA [40,41]. But that issue will not be addressed here, and willawait further work on the relative pricing of SO on one hand and of SN and S1751 on theother. This question arose in connection with the CA vs. RA mispricing, and presents in-teresting features, in that rational economic behavior demands essentially identical pricingfor SO and SN (after adjusting for accrued interest), as liquidity and redeemability factorsshould affect them both the same way. But that is not what is observed, as their irrationalrelative pricing reflects the CA vs. RA anomaly, and leads to the more liquid SO tradingat a substantial discount to SN. But that will be considered in a later work, when morecomplete data is collected. Here we just consider the pricing of SO relative to RA, and seewhat can be deduced from it. But first we look at the characteristics of the investors inSO.
7 South Sea Old Annuities (SO) accounts
This section discusses some of the technical issues that arise in analyzing stock ledgerdata. One problem is that there are many transactions that have no economic substance
18 The considerably wider bid-ask spread on SO than on RA, documented later in this paper, was yet anotherreason, but one that was usually not cited, perhaps because of its intimate connection to liquidity.
19 There were low limits on the total of CA and RA that could be converted, limits that turned out to be far higherthan needed, as few CA and RA investors chose that option. Most investors in SSC securities opted for cash,which ended up getting them about 10% more than if they had accepted the conversion. But that was primarilythe result of interest rates going up. One can attribute the success of the investors who opted for cash either toluck or to shrewd appreciation of money market trends.
Financialization of British economy 15
to them, reflecting just changes of names on the account. An example par excellence is theCourt of Chancery. It was by far the largest holder of SO (and almost certainly of all gilts),with almost 8% of the total in 1838. It had a single account for its SO holdings. This wasa consolidation of separate accounts at the Court, representing a variety of trusts, someperpetual ones administered by that Court, and some representing funds that were subjectto lawsuits, or else were held for minors who were wards of the Court. (Chancery had over20,000 accounts, but it is to be expected that only a small number had any SO in them.)This single account for this Court was held in the name of its Accountant General (who wasnot an accountant in the modern meaning of the word), so when the person holding thatoffice changed in 1839, this triggered the largest transaction recorded in the SO ledgers,one that came to over 3% of the sum of all transactions over the entire 16-year periodcovered by this study. This transfer had no significance for the market in SO, obviously.
At least in the case of the Court of Chancery the names of the two accounts includenot just the name of the Accountant General, but also his position. In the vast majorityof cases, that is lacking. Except for some enterprises (apparently the companies that hada government charter, such as BoE, SSC, and a few insurance companies, such as LondonAssurance), most business accounts were identified just by names of the trustees who hadauthority over the account. Normally no more than four names were permitted, and itappears that three or more names, especially involving different surnames, usually repre-sented a trust. When the entire balance of an account was transferred to another account,where just one name on the account changed, it seemed safe to assume that this repre-sented simply one trustee being replaced by another. An example is that of SO balancesthat were moved between the following accounts in the sequence listed:
– Sir Thomas Turton, James Deacon Hume, John Oliver Hanson, John Woolley,William George Prescott– Sir Thomas Turton, James Deacon Hume, John Oliver Hanson, William GeorgePrescott, Rear Adm. Sir Courtenay Boyle– Sir Thomas Turton, John Oliver Hanson, William George Prescott, Rear Adm.Sir Courtenay Boyle, John Peter Rasch– John Oliver Hanson, William George Prescott, Rear Adm. Sir Courtenay Boyle,John Peter Rasch– John Oliver Hanson, William George Prescott, John Peter Rasch, Donald Maclean,Sir William Baynes– John Oliver Hanson, William George Prescott, Donald Maclean, Sir WilliamBaynes, Thomas Chapman
The dates of transfers, together with press reports and ads that are too numerous andboring to list, lead to the overwhelmingly likely conclusion that all these accounts belongedto the Atlas insurance company, whose investments in SO will be discussed in Section 8.(Turton was its Chairman in 1838, and after his death in 1844 was replaced by Hanson,who had been Vice-Chairman.) These transfers added up to £404 thousand, or about 5%of the total of SO transactions that were studied. In most cases, though, we can’t come toany such conclusions, because it is impractical to investigate each case in enough detail.
16 Andrew Odlyzko
Some are easy, as in the case of David Barclay Chapman, who participated in a smallnumber of large transactions. He was a partner in the famous Overend, Gurney discountfirm, and his dealings almost surely reflect those of this enterprise. But he was unusuallyprominent, so it was easy to identify him.
Another large source of transactions that had no economic substance and significantlycomplicate statistics was transfers between partners. Transfers did not cost investors any-thing (and there were no capital gains taxes), so the only disadvantages came from havingto send an authorized agent to the BoE or the SSC, and from not being able to trans-fer the funds a second time that same day. Some entities were represented by a stablejoint account and so did not take advantage of this facility. For example, the private bankCoutts & Co. during the period studied here apparently had just a single account in thenames of Sir Edmund Antrobus and Edward Marjoribanks, two of its partners. The Hoarebank, at the other extreme, kept its gilts holdings in the names of individual partners. Thisresulted in large transfers, since the partners rotated the duty of residing in London andsupervising the bank’s operations [25]. This bank was very active in real SO trades, as isdiscussed in Section 8, although these appear to have been largely short-term money mar-ket transactions in which SO was used as collateral. But transfers between partners greatlymagnified the volume of their transactions as recorded in the ledgers. By the end of 1852,the Hoares accounted for £1.2 million, or about 15%, out of the total of £8.2 million of SOledger transactions, but of that amount, slightly over half consisted of transfers betweenpartners. (The extreme year was 1842, when these mere bookkeeping moves between Hoarepartners were almost 17% of the value of all SO transfers.) The Hoares were by far themost extreme in this respect, but similar partner-to-partner transfers took place amongother groups, such as the Goslings (who ran another well-known private bank) and theRothschilds.
8 Holders of the South Sea Old Annuities (SO) and theirbehavior
The SO ledgers that record all holdings between October 1838 and 1854 are cataloged asAC27/6533 and AC27/6534. Transcriptions are arranged in three parts, to make quantita-tive analyses easier. The first one is for the 1595 opening balances. The third one containsthe 1034 closing transactions, as balances were being converted into other gilts or cashedin. The main one is the second part, which contains the 5590 transfers in between. However,the studies below are based only on the 5079 transfers that occurred by the end of 1852, toeliminate the short-term activity that was generated by the Gladstone conversion move.
During this period before 1853, the CoE reported prices for SO on 607 days (a total of675 prices). Thus only 13% of the ledger transactions corresponded to reported prices. Butthis needs to be placed in context. 2907 of the 5079 transfers, of 57%, were for less than£500, so not eligible for reporting in the Official List. (They accounted for slightly over 5%of the volume, which is measured, as usual, in nominal value.) Further, many of the largetransactions were between financial organizations or professionals, who had no incentive to
Financialization of British economy 17
report their dealings. Finally, there were many private transactions, such as inheritances,or else changes in trustees. So we investigate SO trading in more detail in this section.
8.1 SO accounts
There were 1595 accounts in SO when the ledgers under consideration were started inOctober 1838, and the total of their par values was £3.5 million. Thus the average accountwas £2,191. The median was £770. There was one giant account, that of the Court ofChancery, representing many trust and lawsuit accounts, which had 7.5% of the total. Butthat was an exception. The largest 10 accounts (discussed in Section 8.3) represented only22% of total capital, and it took the top 100 to get to 50%.
Since the ledgers report a grand total of 5079 transfers by the end of 1852, or 3.2 peraccount in over 14 years, it is evident that most accounts were very inactive, and mostly justcollected the semi-annual interest payments20. But even this average of 3.2 overstates thelevel of activity. There were actually 465 accounts that had absolutely no activity duringthe period under consideration. (This is in addition to the approximately 100, almost allwith small balances, that were turned over to the government, since even interest on themhad not been collected in over 10 years.) These 465 accounts represented 29% of all accountsin 1838, and their value was 21% of the total. Furthermore, there were 228 accounts, or14%, with capital that was 13% of total, which underwent just one change in account name.That is, the only change was that the entire balance was transferred to another accountthat had not existed before, and which continued with that balance, without any changes,until the end of 1852. (In most cases this seemed to represent a change among trustees, orelse a single heir receiving the entire account and continuing the policy of only collectinginterest.)
8.2 SO jobbers
Jobber activity in SO was extremely concentrated. Over 30 jobbers did some business inSO during the period under consideration, but for most of them this was a small part oftheir work, most likely just some incidental deals. A list of the 26 most active (as rankedby number of transactions) jobbers was prepared, excluding various other frequent traders,such as CRND (the Commissioners for the Reduction of the National Debt, a governmentbody to be discussed at great length later), the Hoare partners, and evenWilliam Hammondthe Younger, who merits special discussion in Section 20. At the top of the jobber list wasWilliam Powell, with 1457 transactions, followed by Robert Field with 458, Peter StantonMitchell with 390, George Peckett with 375, and William Underhill at 326. These top fivehad their transaction numbers adding up to 3006 (which were not a total of 3006 separatetransactions, as there were some that involved pairs of these). The next 21 had their totaltransactions numbers adding up to 784.
There were substantial differences in the statistics of deals that different jobbers engagedin. For Powell, the average size of a transaction was £761, for Field it was £1,366, and
20 This confirms to the stereotype visible in contemporary literature, fiction as well as non-fiction, of investorsliving off the steady income produced by investments. Reinvestment of interest appears almost non-existent inSO records.
18 Andrew Odlyzko
for Underhill it was £404. Similar differences can be seen in statistics of CA jobbers, andlikely reflect the capital that various jobbers possessed, and perhaps their reputations.(Hammond’s transactions averaged £3,910, reflecting his special status.)
The completeness of the SO records allows for detailed analyses of the social networksand trust and cooperation levels among LSE members. Those have barely been started.But much can be learned. As just one example, Powell appeared to take a vacation eachyear in June, once CA was “shut,” and only come back after 5 July, when trading in CAreopened21. When he had a substantial inventory of SO in early June, he typically sold it toanother jobber (or William Hammond the Younger in one case), and on returning in Julyoften bought a substantial amount from the same or different LSE member. There may havebeen various special conditions involved in such transactions, such as prior commitmentsto reverse the earlier deal, but those are not visible to us. However, we can study who wasinvolved.
The comments in this section are based on a quick preliminary look at the data onjobber activity. Much more can be done, especially since one needs to consider variousfactors that the statistics cited here do not reflect. For example, the overall turnover ofSO dropped substantially in the late 1840s. Further, Powell was far less active (both inabsolute terms and compared to others) from the mid-1840s. So there are many obviousquestions to investigate to obtain a fuller picture of what was happening during this period.Such research will become easier and more definitive once we obtain data for additionalsecurities, such as SN.
8.3 Large SO accounts
The largest SO account in October 1838 was that of the Court of Chancery, at £261thousand. The next three largest, at £124, 98, and 63 thousand, respectively, all belongedto insurance companies. The next 7 all appeared to be charitable trusts. The smallest ofthose 7 belonged to Wadham College, Oxford. It shows what seems to have been typicalbehavior for the charitable trusts of the Victorian and pre-Victorian era that were meant tobe perpetual. By looking in some earlier ledgers, we find that in 1815, Wadham already had£11,800 of SO. This sum grew through sporadic additions to £30,300 in October 1838, andto £31,400 in May 1853, when, forced by the Gladstone policy to do something, the collegesold the entire balance to the Hoare bank. Unfortunately Wadham was one of the collegesthat refused to respond to the Oxford University Commission request for information in1852, so we do not know where its other investments were22.
That insurance companies were large and not totally inert investors of SO shows thatthis security was not an extremely obscure one held just by some ultra conservative orignorant individuals and trusts. Some financial institutions made conscious decisions tobuy and sell this annuity. Since SO seemed to be priced relative to RA, we consider howwell various of these companies did in their investments in SO as opposed to RA.
21 This was established by considering not only his trading in SO, but also in RA, as shown in RA ledgers.22 Parliamentary Papers 1851 [1482] XXII.1. By the 1860s, it was mostly into real estate, Parliamentary Papers
1864 [3288] XX.1, 349, XXI.1, 537.
Financialization of British economy 19
The insurance companies show varying types of behavior. The Royal Exchange company(ignoring the fact there were actually two of them, for life and fire insurance, with ourdiscussion treating the combination of their accounts) started out with £200 thousand ofSO in the ledger that begins in 1815. After a decade of inactivity, it sold its entire holdingin the summer of 1825 (thus almost half a year before the severe crash at the end of thatyear), all in one day. At that time, SO prices were only slightly under those of RA, but wedon’t know how much of a discount this company had to accept in order to sell such a largeamount quickly. Then, in 1832, it started rebuilding its account to reach £123,900 in 1834.At that time SO was at a substantial discount to RA. Royal Exchange sold £70,000 to theSSC in late 1845 and early 1846 (bypassing jobbers), and then sold some to the CRND,and cashed in a substantial sum in 1854. All those sales took place when SO prices wereclose to those of RA. So Royal Exchange did fairly well.
The London insurance company (again, sometimes presented as two separate compa-nies, for life and fire insurance) had £63,000 of SO in 1815, and continued at that leveluntil 1840, when it started selling it off (mostly to Hammond, often in large chunks, in onecase £20,000). At that time SO was at a substantial discount to RA. Hence this companydoes not appear to have been too successful.
Thus these two companies were not inert investors. But their investment strategieschanged very slowly and it is hard for us to tell what considerations drove them.
The most interesting behavior that has been found among insurance companies is thatof the Atlas company, which was cited earlier in connection with its accounts in the namesof trustees involving Sir Thomas Turton and John Oliver Hanson. It had been establishedin 1807–1808, and for a long time employed the prominent actuary Charles Ansell. Around1840, this company had total investments, shareholder equity and reserves, of about £1.2million23. In the late 1830s it appears to have made a decision to shift substantially intoSSC securities. On 3 January 1838 (as shown by an earlier ledger), Atlas started buying SO,so that by October of that year, it had £23,000, making this the 15th largest account in SO.It continued its purchases until the spring of 1844, when its holdings reached £130,000. Allthis time SO was at a substantial discount to RA (as is discussed later). Atlas sold £25,000in September 1845, when the discount on SO was very small. It then bought £40,000 inDecember 1848, when the discount was close to its local maximum. This produced thelargest account value, aside from the Court of Chancery, that can be found in SO before1853 (and after October 1838). Atlas then gradually liquidated the entire position startingin July 1850, when the discount was again minor as a result of the CRND purchases. Thismay have reflected a general shift of insurance companies’ reserve investments from giltsto real estate, a shift that was pronounced but gradual, taking a couple of decades for theindustry as a whole. Atlas’ market timing in the 1838–1853 period was impeccable, as allits purchases were done at times of large discounts, and sales when SO was close to paritywith RA. Furthermore, both sales and purchases were spaced out, and generally of modestsize. But it is the only example that has been found of such behavior24. Very differentbehavior was exhibited by the SSC, which can only be characterized as having pursued
23 Testimony of Ansell in Parliamentary Papers 1844 (119) VII.1.24 Atlas also invested in SN, the South Sea New Annuity. It bought £80,000 between 1839 and early 1844, a period
when SN was trading at a large discount to CA. It then sold £25,000 to a jobber in September 1845, and the
20 Andrew Odlyzko
a very poor investment policy, in spite of having some prominent financiers on its Boardof Directors, and of having other prominent financiers agitating to “unlock shareholdervalue.”
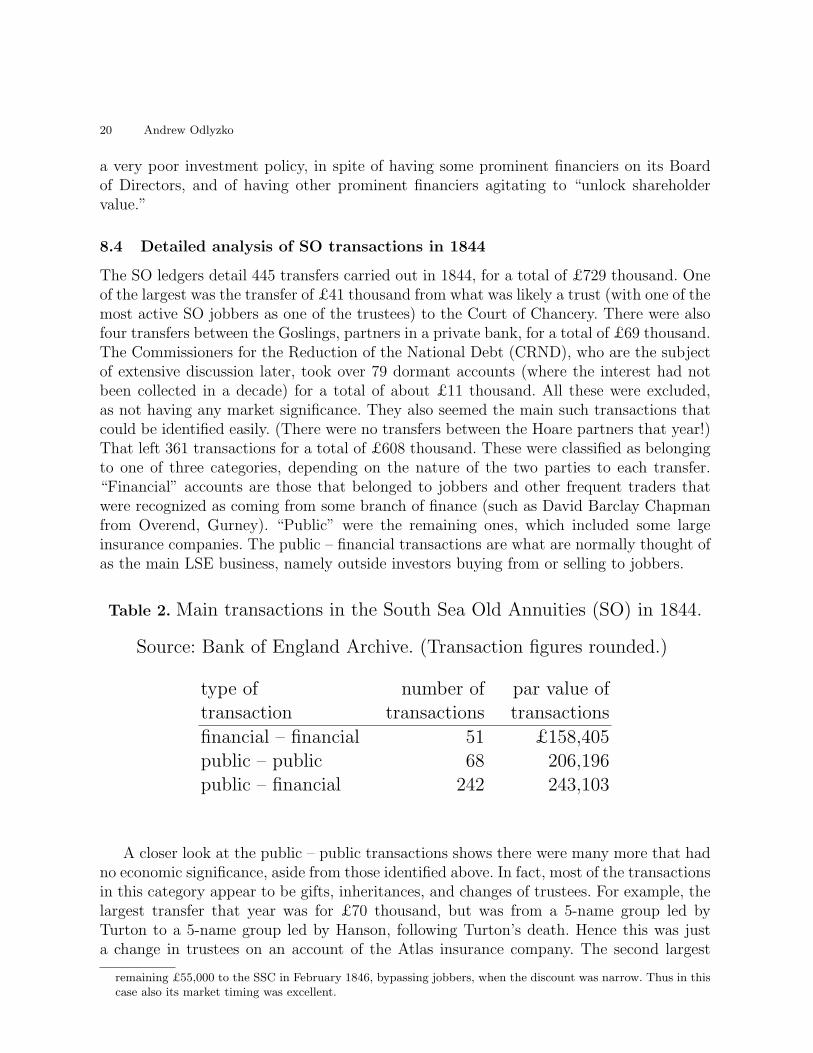
8.4 Detailed analysis of SO transactions in 1844
The SO ledgers detail 445 transfers carried out in 1844, for a total of £729 thousand. Oneof the largest was the transfer of £41 thousand from what was likely a trust (with one of themost active SO jobbers as one of the trustees) to the Court of Chancery. There were alsofour transfers between the Goslings, partners in a private bank, for a total of £69 thousand.The Commissioners for the Reduction of the National Debt (CRND), who are the subjectof extensive discussion later, took over 79 dormant accounts (where the interest had notbeen collected in a decade) for a total of about £11 thousand. All these were excluded,as not having any market significance. They also seemed the main such transactions thatcould be identified easily. (There were no transfers between the Hoare partners that year!)That left 361 transactions for a total of £608 thousand. These were classified as belongingto one of three categories, depending on the nature of the two parties to each transfer.“Financial” accounts are those that belonged to jobbers and other frequent traders thatwere recognized as coming from some branch of finance (such as David Barclay Chapmanfrom Overend, Gurney). “Public” were the remaining ones, which included some largeinsurance companies. The public – financial transactions are what are normally thought ofas the main LSE business, namely outside investors buying from or selling to jobbers.
Table 2. Main transactions in the South Sea Old Annuities (SO) in 1844.
Source: Bank of England Archive. (Transaction figures rounded.)
type of number of par value oftransaction transactions transactions
financial – financial 51 £158,405public – public 68 206,196public – financial 242 243,103
A closer look at the public – public transactions shows there were many more that hadno economic significance, aside from those identified above. In fact, most of the transactionsin this category appear to be gifts, inheritances, and changes of trustees. For example, thelargest transfer that year was for £70 thousand, but was from a 5-name group led byTurton to a 5-name group led by Hanson, following Turton’s death. Hence this was justa change in trustees on an account of the Atlas insurance company. The second largest
remaining £55,000 to the SSC in February 1846, bypassing jobbers, when the discount was narrow. Thus in thiscase also its market timing was excellent.
Financialization of British economy 21
transfer that year, though, for £44 thousand, appears to have been from the Hope to theImperial insurance companies, an example of a large financial transaction that did not gothrough the jobbers of the LSE.
It is easy to argue that, given the ambiguity about the nature of many of the public –public transactions, we should include the Gosling, Chancery, and CRND transfers in thatcategory. If we did that, its total would swell to £327 thousand, not far short of half.
The financial – financial group shows a variety of transactions. Some appear to be simple“repo” (repurchase) agreements. Thus on 1 March, Robert Field, a prominent jobber,transferred £16,000 to the Coutts bank (in the shape of the joint account of Sir EdmundAntrobus and Edward Marjoribanks). He received the same amount back from Coutts on12 April, which was a CA account day, traditionally a key day for settling deals on theLSE. But some of the deals are clearly much more intricate. For example, on 25 October,David Barclay Chapman (of Overend, Gurney) transferred £12,000 to Charles Keyser, ajobber. On 31 October, Keyser transferred that same amount to a joint account of BennettGosling (of the bank of Gosling & Sharpe) and of John Charles Sharpe, who may havebeen a clerk or partner-in-waiting in that bank (since he does not show up in [20] as apartner). Most other transactions in this category do not fit into any obvious pattern, andmay be just shadows of complicated dealings between the serious financial players. (CharlesKeyser, the jobber cited above, talked of the extremely complicated settlements of dealsbetween jobbers in his testimony before the Exchequer Bills Forgery Commission [50].)There is more discussion on this topic later, in Section 17. But it is certain that many ofthe deals that non-jobbers in this category were engaging in were not straight purchasesof SO. For example, over a decade later, Chapman testified that Overend, Gurney neverheld any CA nor any Exchequer Bills, as they were “fluctuating property,” and he “couldnot sleep” if he had any in his company’s account ([51], qq. 5102–5105). Yet SO ledgers (aswell as CA ones) show him with occasional large amounts of those gilts. This must havebeen collateral for the loans that Overend, Gurney was extending. Some further studies ofthe financial – financial are likely to lead to a better understanding of what was going on.
The basic conclusion is that recorded transfers of gilts covered a wide variety of transac-tions. In particular, the high volume of financial – financial transactions, most likely varioustypes of repo deals, is rather a surprise for a small security like SO. In 1844, only aboutone third of the volume of transfers of this security in the ledgers were of type normallythought of as providing the main business of the LSE, namely sales and purchases by theinvesting public.
The low volume of transactions between the jobbers and the general public also meansthat earnings from this source were not likely to be large. The £243,103 of such transactions,split about evenly into purchases and sales by jobbers, meant that only about 4% of thegeneral public’s holdings of SO turned over that year. This also means that, if we disregardthe unlikely possibility that the jobbers were extremely successful “market timers” andmade a lot of money from that, they only earned their typical spread, which the nextsection shows was around 0.5%, on about £120 thousand coming in and going out, orabout £600. Given the typical SO inventory of all jobbers of about £15 thousand (see
22 Andrew Odlyzko
Section 11.3), this was a miserable return, given that simply holding SO yielded slightlyover 3% per year.
SO was of course a small, obscure, and rather illiquid security. So it is hard to concludemuch about the LSE as a whole from the data presented here. However, we find somesimilarities in the data for CA, the main LSE security, considered in Section 12.
8.5 SO transactions in 1844 and reported prices
The more detailed analysis of 1844 transactions above lets us take another look at thecompleteness of the coverage provided by the Official List and the CoE of prices. In 1844,the CoE printed 36 prices for SO transactions (on 30 days). There were in total 445transfers of SO in the ledgers, so this appears as a coverage rate of just 8%. However, avariety of transactions, such as CRND taking over dormant accounts, or Goslings movingSO between partner accounts, were not real economic transfers. Furthermore, the financial– financial transactions were likely often repo deals, and even when they were ordinaryfinancial transactions, would not have been reported, as the jobbers were known not topost details of their deals. Thus the only relevant transfers were the 242 public – financialtransactions, and 36 is 15% of 242, quite a bit higher than the first estimate of 8% coverage.Of those 242 transactions, though, just 67 were for at least £500, the threshold for postingin the Official List. So these 67 transactions led to 36 prices, for a coverage rate of 54%. Sofrom this point of view, CoE provided a more complete picture of substantial transactionsthan might have appeared at first sight.
8.6 Effect of small fees
An amusing illustration of how investors and their brokers reacted to small price changesarose in connection with the change in the “public transfer days,” namely those on whichthe SSC did not charge for transfers. For SO, before 1844 those days were Mondays,Wednesdays, and Fridays (with other days for other securities). On other days, as well asfor transfers late in the day (normally after 1 pm), a fixed fee of £0.125 was levied. (Thiswas equal to the standard broker commission on £100 par value of a gilt, but did not dependon the sums involved.) In the spring of 1843, the BoE changed the public transfer days forall the gilts it administered to Tuesdays through Fridays. The SSC responded to a petitionfrom a group of LSE members by adopting the same schedule from January 1844. This ledto a noticeable change in the distribution of transfers at the SSC, and quite likely also todays when deals were made at the LSE. Before 1844, Fridays were the most frequent days,with Wednesdays just slightly behind, Mondays noticeably lower (20–40% below Fridays),and the other days far lower. Afterwards, and very quickly, Tuesdays became by far the mostpopular, with Fridays noticeably less active, and Mondays and Saturdays with practicallyno deals. (The effect was more noticeable for smaller transactions than for larger ones, asone might expect.) This behavior likely reflects the fact that financial considerations didplay a much larger role in the planning of the early Victorians than they thought proper toshow publicly. But it likely also reflects the well-known phenomenon of behavioral finance,that even small fees have impacts disproportionate to their size, as their existence alone isimportant.
Financialization of British economy 23
9 Commissioners for the Reduction of the National Debt(CRND)
An essential element of Pitt’s Sinking Fund of 1786 was the setting up of the Commissionersfor the Reduction of the National Debt (CRND). This was an official government body,headed by the Chancellor of the Exchequer, that was tasked with administering the SinkingFund, and its repurchases of the national debt. With time, CRND acquired other duties,such as administering the funds for savings banks, selling life annuities, and so on. CRNDpurchased gilts in the market through a designated government broker who also workedfor the BoE and for private clients. When operating on behalf of the savings bank fund,say, the government broker followed the usual procedure for brokers, namely solicited bidswithout revealing his customer. However, in cases of purchases for reduction of the nationaldebt, the broker followed a public reverse auction procedure. There were claims that thisresulted in the government not getting the best pricing, cf. [2,52].
The repurchases of gilts for debt reduction took place only on Tuesdays through Fridays.The amount to be bought in each quarter was announced at the beginning of that quarter,and for a long time daily purchases were required to be close to equal on the days eligible forthe broker’s actions. Furthermore, the amount of money that would be spent each quartercould be guessed accurately even before the official announcement, since it was exactly onequarter of the government’s revenue surplus over the preceding year, and of that, data forthree quarters was already known publicly, and that of the fourth quarter could usually beestimated fairly well.
What was not publicly announced was what would be bought by the government. Manyof the quarterly announcements specified how much would be spent on Exchequer Bills andhow much on gilts, but quite a few did not even do that, and only gave a total. Even whenthe amount of gilts repurchases was given, apparently nothing was ever said about whichgilts would be purchased.
Pitt’s Sinking Fund was in operation between 1786 and 1829. It bought SSC annuities,which tended to be underpriced relative to CA and RA (if we price them as perpetualsecurities, without potential for redemption by the government) at high rates. The resultwas that whereas the combined par value of SSC annuities was around £22 million in1786, or close to 10% of the national debt, by 1840 they had been whittled down to £7million, or about 1% of the total. (During that same period, CA went from £107 millionto £366 million, in spite of large repurchases, since those repurchases were dwarfed by newissues needed to fight the wars with France.) Because of budget deficits, there were nogilts repurchases by CRND between 1838, when our data for SO starts, and 1844. (SO hadnot been repurchased since 1831, in fact.) In the first quarter of 1844, the CRND startedbuying gilts again, but initially at a very low rate, between £30,000 and £62,000 perquarter, and in that year confined its operations just to CA and RA. In 1845, the volumeof gilts purchases jumped to almost £250,000 for the first quarter25, and from April 1845the minor gilts started being bought. CRND repurchases declined drastically in the second
25 It remained at that rate in the second and fourth quarters of 1845, with £590,000 spent in the third quarter.For exact numbers, see [53].
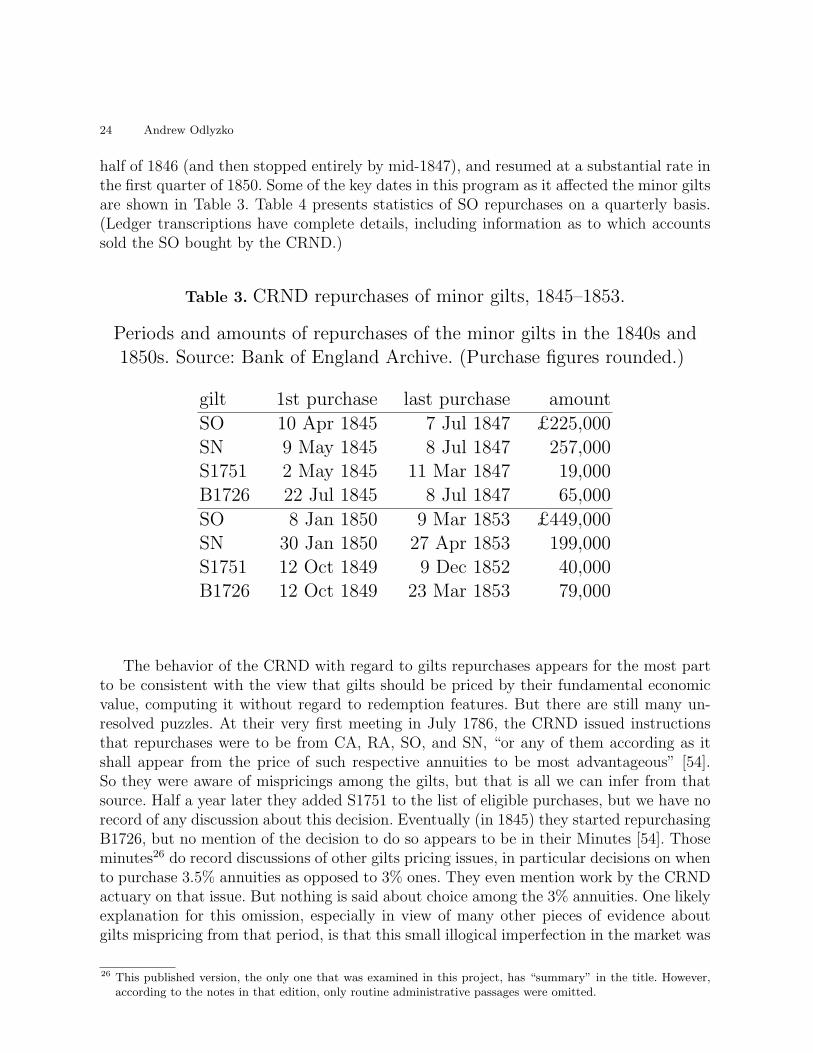
24 Andrew Odlyzko
half of 1846 (and then stopped entirely by mid-1847), and resumed at a substantial rate inthe first quarter of 1850. Some of the key dates in this program as it affected the minor giltsare shown in Table 3. Table 4 presents statistics of SO repurchases on a quarterly basis.(Ledger transcriptions have complete details, including information as to which accountssold the SO bought by the CRND.)
Table 3. CRND repurchases of minor gilts, 1845–1853.
Periods and amounts of repurchases of the minor gilts in the 1840s and1850s. Source: Bank of England Archive. (Purchase figures rounded.)
gilt 1st purchase last purchase amount
SO 10 Apr 1845 7 Jul 1847 £225,000SN 9 May 1845 8 Jul 1847 257,000S1751 2 May 1845 11 Mar 1847 19,000B1726 22 Jul 1845 8 Jul 1847 65,000
SO 8 Jan 1850 9 Mar 1853 £449,000SN 30 Jan 1850 27 Apr 1853 199,000S1751 12 Oct 1849 9 Dec 1852 40,000B1726 12 Oct 1849 23 Mar 1853 79,000
The behavior of the CRND with regard to gilts repurchases appears for the most partto be consistent with the view that gilts should be priced by their fundamental economicvalue, computing it without regard to redemption features. But there are still many un-resolved puzzles. At their very first meeting in July 1786, the CRND issued instructionsthat repurchases were to be from CA, RA, SO, and SN, “or any of them according as itshall appear from the price of such respective annuities to be most advantageous” [54].So they were aware of mispricings among the gilts, but that is all we can infer from thatsource. Half a year later they added S1751 to the list of eligible purchases, but we have norecord of any discussion about this decision. Eventually (in 1845) they started repurchasingB1726, but no mention of the decision to do so appears to be in their Minutes [54]. Thoseminutes26 do record discussions of other gilts pricing issues, in particular decisions on whento purchase 3.5% annuities as opposed to 3% ones. They even mention work by the CRNDactuary on that issue. But nothing is said about choice among the 3% annuities. One likelyexplanation for this omission, especially in view of many other pieces of evidence aboutgilts mispricing from that period, is that this small illogical imperfection in the market was
26 This published version, the only one that was examined in this project, has “summary” in the title. However,according to the notes in that edition, only routine administrative passages were omitted.
Financialization of British economy 25
regarded as too minor to be worth the attention of properly bred gentlemen. But this stillremains to be demonstrated conclusively27.
The history of the SSC in the 19th century, which will be treated in more detail inanother work, presents some amusing features. Some dissident investors were trying to“unlock shareholder value” by eliminating the discount on SSC securities by getting thegovernment to eliminate the SSC. In order to fight this move and to preserve their jobs,SSC management was telling those investors that the government would not do it, as itwould thereby lose the opportunity to repurchase SSC annuities at a discount. A few yearsearlier, though, this management was reminding the government of the opportunity tocarry out such repurchases in order to keep it from closing the SSC.
There certainly was some public awareness that the CRND were purchasing securitiesthat were underpriced, when evaluated by their fundamental value and disregarding liquid-ity and redemption issues. For example, we find in the contemporary press the claim that“South Sea Annuities command a lower price than [CA and RA], and therefore, when theyappear in the market, which is but seldom, they are selected by the Government broker,who is at liberty to purchase any of the Three per Cent. Stocks”28. As the CRND wereincreasing their market operations in early 1845, there was apparently some discussionabout the wisdom and likelihood of their buying SSC annuities. We find some reflection ofsuch discussions in the following item from the financial column of The Times written inthe evening of April 10, 1845, the day that the first purchase by CRND of any of the SSCannuities was made in that decade29:
For some time the complaint has been made that, in redeeming portions of thenational debt, the Government did not select South Sea Annuities in preference tothe other stocks, and thus effect a saving of the public money, on account of thelower price of the security. It has been answered that the South Sea Annuities areso limited in amount, that they would rise to the level of the other stocks directlyan operation of any magnitude was commenced; and that, therefore, it is incorrectto suppose the whole difference in price would be saved by a change of plan on thepart of the Government. To-day, however, the Government broker has, for the firsttime, employed the money at the disposal of the [CRND] in the purchase of SouthSea Annuities. He purchased [£4,900 of SO at 97.875 for debt reduction], and at thesame time purchased [£5,000 of RA for another fund at 98.375]. This shows thatthe saving to the Government was at the rate of [0.5% of par].
The periods of CRND repurchases (in the 1840s and 1850s) of SO as well as of theother SSC annuities, and of B1726, the small 3% annuity administered by the BoE, arelisted in Table 3. CRND activity was sporadic, and (as is visible in the SO tables) variedsubstantially, depending partially on availability of funds for repurchases. (For example,
27 One of the most puzzling features is that CRND did not repurchase any of the East India Annuities. Betweenthe start of CRND activities in 1786 and the conversion of those 3% annuities into RA in 1793, they were at ahigh discount to RA, typically 6–8%. That is a higher discount than has been observed between any other pairof 3% annuities.
28 The Times, 23 Jan. 1846, p. 7, reprinted in Glasgow Herald, 26 Jan. 1846, p. 2.29 The Times, April 11, 1845, p. 6.
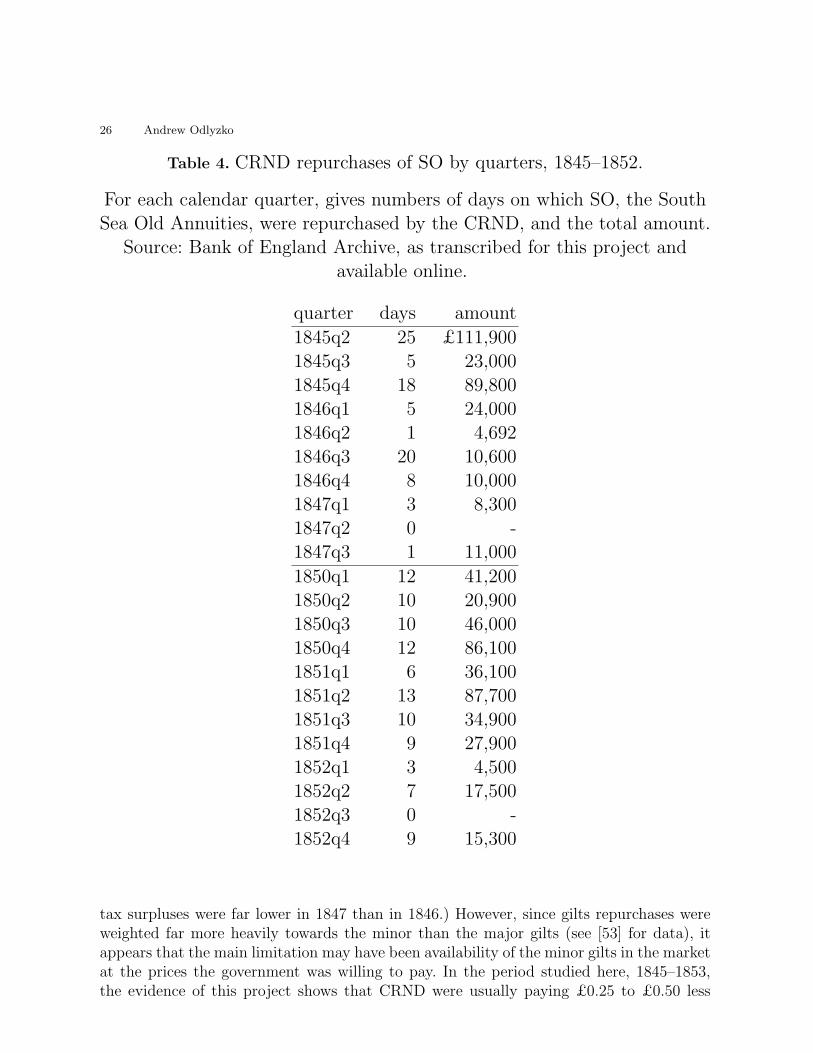
26 Andrew Odlyzko
Table 4. CRND repurchases of SO by quarters, 1845–1852.
For each calendar quarter, gives numbers of days on which SO, the SouthSea Old Annuities, were repurchased by the CRND, and the total amount.
Source: Bank of England Archive, as transcribed for this project andavailable online.
quarter days amount
1845q2 25 £111,9001845q3 5 23,0001845q4 18 89,8001846q1 5 24,0001846q2 1 4,6921846q3 20 10,6001846q4 8 10,0001847q1 3 8,3001847q2 0 -1847q3 1 11,000
1850q1 12 41,2001850q2 10 20,9001850q3 10 46,0001850q4 12 86,1001851q1 6 36,1001851q2 13 87,7001851q3 10 34,9001851q4 9 27,9001852q1 3 4,5001852q2 7 17,5001852q3 0 -1852q4 9 15,300
tax surpluses were far lower in 1847 than in 1846.) However, since gilts repurchases wereweighted far more heavily towards the minor than the major gilts (see [53] for data), itappears that the main limitation may have been availability of the minor gilts in the marketat the prices the government was willing to pay. In the period studied here, 1845–1853,the evidence of this project shows that CRND were usually paying £0.25 to £0.50 less
Financialization of British economy 27
for SO than for RA. When the CRND were active purchasers of SO, others paid about asmuch, while sellers usually received £0.50 less. When the CRND were not active in themarket, SO prices dropped compared to those of RA, while the spread between prices paidby purchasers and those received by sellers stayed the same or widened, as is discussed inSection 10.
10 Pricing and effective bid-ask spreads for South Sea OldAnnuities (SO)
For CA and RA, the major gilts, the bid-ask spread, called the “turn” at the LSE, wasalmost always £0.125, with slightly higher figures in times of financial stress30. But whatabout the minor gilts, which were far less liquid? There were many complaints that at theend of the 19th century, the majority of securities traded on the LSE were illiquid andfeatured very large bid-ask spreads. Often a straightforward quote could not be obtained,and the broker had to bargain with the jobber [16,30,52]. On the other hand, there werefrequent claims that the quoted spreads were artificially wide, to provide protection forthe jobbers in an illiquid market, and that brokers could, through bargaining, obtain muchbetter deals than the published figures suggested.
We can use SO data to infer something about pricing of small and illiquid securities.A major difficulty is that in mid-19th century, newspapers, even when they did report onSO pricing, almost invariably followed the CoE in printing just actual transaction data.Morier Evans ([17], p. 34), writing in 1845, claimed that in many gilts the spread was “asmuch as [£0.50 or £0.75].” We can make some surmises also by looking at data for the2.5% annuity that was created by Gladstone in 1853, as part of the financial maneuverthat abolished SO and the SSC. Initially this annuity started out with a nominal capitalof £3 million, which was augmented in 1863 by the addition of another £1 million, andthen, in the 1881–83 period, with the addition of almost £6 million. Thus in its first fewdecades it had capital not much different from SO, and it shared with SO the paucity oftransactions (as shown by listings of prices in CoE as well as by the stock ledgers). TheStatist appears to have started carrying closing bid-ask quotes for this security in 1880,and the spread appeared to be around £131. For 7 trading days in 1882, the Economisthad the closing spread at £1 on 5 days, and at £0.50 on two days32.
Another comparison can be made with BoE shares. These were traded far more fre-quently, and their market value was 5 to 10 times that of SO. The Economist listed thebid-ask spread on them as 2 (compared to market price of about 200) in the second half of1848, and of 1 in 1851. Therefore it seems reasonable to assume that for SO in the 1840s,the quoted spread for SO was around £1.
What was the effective spread on SO that faced investors with knowledgeable brokers?The evidence of this project suggests it was around £0.50 most of the time, but around£1.00 in 1847–49.
30 See [41] for some data, which shows that RA spread was higher somewhat more frequently than that of CA.31 It is reported at £1 in the 15 May and 14 August 1880 issues, and at £0.75 in the 21 August issue.32 Economist, 27 May 1882, p. 649.
28 Andrew Odlyzko
One can try to obtain estimates for bid-ask spreads from the distribution of transactionprices of any security, but this involves substantial uncertainties, since one has to disentan-gle the effects of the spread and of volatility. In the case of SO, though, the task is madeeasier by two favorable factors, namely that it tended to trade at a stable discount to RA,and that many transactions can be identified as being either sales or purchases by jobbers.
For the rest of this section we will use SO to denote the price of SO as reported inCoE. Similarly, RA will denote the price of RA that has been collected and is available inthe tables. This is in all cases the last price of the day given in CoE. We can consider RA
as being a random choice among the prices for RA that occurred on a particular day. Thuseven if there was a rigid relation between SO and RA, say SO = RA− 2, that held in themarket throughout each trading day, we would not observe it in our prices, since the SO
value (which in almost all cases is just a single price, and only occasionally two or more)would in general come from a time different than the time of the last RA price. But in theabsence of any consistent daily trend in prices, we should expect a stable distribution ofthe computed RA− SO values. And that is indeed what we find.
The observed values of RA − SO tended to be low, from zero to £1, when the thegovernment was repurchasing SO as part of its debt reduction strategy (which is discussedin more detail in Section 9). When such repurchases were not taking place, RA−SO tendedto be higher, usually in the £1–3 range. So it is important to consider separately periodswhen the government was active and when it was not. When that is done, essentially allperiods (with exceptions such as the financial crises of 1847 that caused a suspension of thegold standard when the bid-ask spread widened) lead to similar results. We illustrate withthe computations for the three years 1839 through 1841. During this period, CoE providesvalues of SO on 117 days. Eliminating the days when more than one value of SO wasreported, or when no RA value was given, reduces this to 105 days. An attempt was madeto identify each of those 105 SO prices with transactions in the SO ledgers. There werea total of 1213 transactions in those three years, but only the 556 that were for at least£500 were relevant. The systematic but not easily automated matching that was carriedout is illustrated by the example of the first SO value listed in the CoE in this period,which is for 16 January 1839. The SO ledger shows 5 transactions on that day. However,two of them are for less than £500, so can be discarded. Of the remaining three, one is adeal between two jobbers, which was assumed (on the basis of comments in contemporaryinvestment guides) not to have led to a price report. The final two transactions are bothfor jobber purchases. Hence it was assumed that reported value SO = 91.375 representeda price paid by a jobber.
Days where there were both jobber purchases and jobber sales were discarded. Therewere also various other ambiguities, including a few prices in the CoE that could not beplausibly matched to any transactions. These were either mistakes or perhaps actual dealsthat were cancelled by mutual agreement. The final list consisted of 71 transactions thatwere classified as 22 jobber purchases and 49 jobber sales. For the jobber acquisitions, themean value of RA − SO was 2.12, with standard deviation of 0.21. For the jobber sales,the mean value of RA− SO was 1.55 with standard deviation of 0.18. Hence it seems safeto conclude that on average, jobbers worked on an effective bid-ask spread of about £0.50.
Financialization of British economy 29
The estimate of £0.50 for the bid-ask spread on SO in quiet times is consistent withother observations. For example, over the 11 years 1839–1846 and 1850–1852, the yearswhere the previous procedure yielded an estimate of the spread of £0.50, we find 58 dayswith more than a single SO price. The gap between the lowest and highest in a day exceeds£0.625 just twice, and the mean and median are both £0.50. (There are quite a few smallvalues, £0.125 or £0.25, most likely arising from both transactions being either sales to orpurchases from jobbers, with the price difference caused largely by intra-day variation.)
More detailed quantitative studies can be carried out, but would be done best with moredata. As an example, in the period from 14 to 19 January 1848, we find three prices forSO in the CoE, and SO ledgers show they have to come from three of four qualifying salesby the general public to jobbers. The three values of RA−SO for those three CoE reportsare 2.375, 2.875, and 3. This might suggest that jobbers were extracting much better dealsfrom some customers than others. However, RA prices for those days show substantialvariation, by 0.50, 0.375, and 0.50, respectively, as opposed to more typical 0.125–0.25, sowhat we may be observing might be the effect of large intra-day variation in prices. Toestimate the degree to which there might have been inefficiency in the market, say in theform of poor information about SO pricing on the part of the brokers, it seems advisableto collect more complete data on volatility in prices of RA, the sizes of transactions, andrelated issues, and not just for SO but also for the other minor gilts.
11 CRND and the markets
This section explores the effect of CRND operations on the market for SO. It also studiesthe behavior of SO jobbers and ordinary SO investors. Only CRND repurchases for thepurpose of debt reduction are considered here (and are the only ones of noticeable size).
11.1 CRND purchase prices
The quote from The Times at the end of Section 9 showed that in its first purchase ofSO in 1845, CRND paid £0.50 less for SO than for RA. The integration of ledger entrieswith CoE prices shows that initially this was a typical discount for CRND purchases.With time, though, it seems to have narrowed. Between January 1844 and July 1846, theCoE frequently listed prices at which CRND had repurchased some of the gilts. The CoElistings were not complete, unfortunately, as we can tell from ledgers. However, on 16 days(between 11 July 1845 and 5 March 1846) they show prices for repurchases of both SO andRA, and in all cases the SO price is exactly £0.25 below that of RA. Thus it appears thatthe government broker lowered the discount, but did insist on some discount.
During the 1850–53 period, CRND purchases appear to have been made mostly atdiscounts of £0.50.
When the rate of CRND repurchases declined in 1846–47, the jobbers’ effective saleprices of SO continued in the range of 0.25–0.50 below those of RA, but their effectivepurchase prices dropped, so the bid-ask spread widened to about £1.00. Then, after thelast CRND repurchase in July 1847, the bid-ask spread continued at £1.00, but the sale
30 Andrew Odlyzko
price dropped by about £1.00, and later by about another £0.50, so that in 1848–49,jobbers were selling SO at about £1.75 below RA, and buying at about £2.75 below RA.
11.2 Anticipation of CRND purchases: Prices
To what extent did market pricing of SO anticipate CRND purchases? The discount on SOwas high (around £2, averaging over all transactions) and stable in the 1839–1842 period.It narrowed slightly in 1843, and then much more substantially in 1844. In early 1845, evenbefore CRND staring buying SO, it entered the range of £0.25–0.75 that prevailed laterwhen CRND was an active purchaser. This price action may have been in anticipation ofCRND entrance into the market. But it could also have been the result of an expectation ofan imminent redemption. The giant Goulburn conversion that reduced the 3.5% annuitiesto 3.25% (and, after 1854, to 3%) took place in 1844. Further, the relative prices of the3.25% annuity as compared to CA and RA (see [40,41]) support the high expectationsof further interest rate reductions that we find mentioned frequently in the contemporaryliterature. Various other pricing anomalies, such as that of RA versus CA also declined oreven disappeared completely in this period. Thus we cannot be sure whether the observedprice action was the result of market expectations that CRND would start repurchasing SO.The quote from The Times of 11 April 1845 in Section 9 shows that there was speculationabout this possibility, so this may have been a factor, but it is hard to be certain.
A much clearer picture emerges when we look at the resumption of CRND repurchasesof SO in January 1850. It appears to have caught the market largely by surprise. We find 6CoE prices for SO in November and December 1849 that can be associated unambiguouslywith transactions in SO ledgers. The first three are all jobber sales to outside investors,all in November, at RA − SO of 1.625, 1.375, and 1.625, respectively. The last three areall jobber purchases from outside investors, one in November, and the last two on 7 and13 December, and are at RA − SO of 2.875, 2.375, and 2.00, respectively. These wereprices typical of those that prevailed all through 1848 and 1849, but the narrowing of theSO discount may reflect some expectation of imminent government intervention. The firstprice for SO in 1850 in CoE can be identified with the first CRND purchase, and wasaccomplished at RA− SO of 0.75 or 1.00 (since the SO price was 96.375, and the two RAprices for the day that we have were 97.25 and 97.375). Subsequent purchases by CRNDand others appear to have been carried out at RA− SO = 0.50 or so.
That the market should have been caught by surprise in 1850 is very surprising. Therate of total CRND repurchases increased substantially in the first quarter of 1850 (froma negligible level in the fourth quarter of 1849), and this was easy to anticipate fromthe improved state of government finances. Further, already in October 1849 the CRNDstarted repurchasing the two extremely minor gilts S1751 and B1726, see Table 3. Hencerepurchases of SO should have been regarded as very likely. But we do not see real signsof that in SO prices.
11.3 Anticipation of CRND purchases: Inventory
Could some agents have profited from anticipation of CRND repurchases of SO by quietlybuying up this security as it came on the market, and do it inconspicuously enough so
Financialization of British economy 31
as not to affect the price? Here we consider the 26 top jobbers discussed in Section 8.2.Over the full period 1839–1852, the average holdings of SO of the top 5 of these 26 jobberstaken together were about £5,000, and of the other 21 were about £10,000. In 1844, theannual average holdings of these two groups were £7,250 and £20,850, respectively. In both1845 and in 1850, CRND purchases are correlated with the reduction of SO holdings by thejobbers. (The extreme example is 1846, when the five large ones had average inventory levelof £2,500, and the 21 small ones of just £1,000.) This was almost surely a causal relation.The jobbers most likely did this since there were few non-CRND buyers at the high pricesfor SO that prevailed (high relative to RA, that is), so there was less opportunity to makemoney that way, and also since they could get rid of any excess SO by selling it to CRND.Then, in 1848–49, they replentished their SO holdings, and then ran them down again in1850. Thus they profited by selling much of their inventory at the top of the market, andrebuilding it at the bottom. But it was not a large inventory, so the profits were not large,and there is no sign of its being built up shortly before CRND purchases started. Thus wefind no evidence of the regular jobbers accumulating SO in order to profit from the pricerise that CRND could be expected to bring.
The one case where the evidence strongly suggests substantial SO purchases that werecarried out in anticipation of a price rise is that of William Hammond the Younger, whoappears to have played a unique role at the LSE. He is the subject of Section 20. Hisholdings of SO over the entire period of this study fluctuated wildly, reaching a maximumof £58,000 for a short period (in 1842), and were probably dominated by repo-like short-term money market transactions, with some large transactions tossed in, when he steppedin with his capital to handle large purchases or sales. However, for the last few months of1844, his holdings were below £4,000, but in January 1845 he increased that to £16,000.When the CRND started its repurchases, Hammond was among the first sellers, and randown his inventory to zero by the end of that month. By itself, this would not meanmuch, since he was engaged in a variety of transactions with other financial agents, andhis holdings did vary a lot. However, when this evidence is combined with his actions inthe South Sea New Annuity (SN), discussed below, it strongly suggests shrewd investing.
The overall conclusion is that the general public obtained most of the benefits of theprices rises brought about by CRND repurchases. The jobbers gained comparatively little.
11.4 Anticipation of CRND purchases: South Sea New Annuity (SN)
Table 1 shows that the capital of SN was about two thirds that of SO. In 1845, CRNDstarted repurchasing it a month later than SO (Table 3). There appear to have been someinteresting financial maneuvers associated with this move. A slightly fuller picture will beavailable once the transcription of SN ledgers is completed. But it is already clear thatthere was a substantial buildup of SN holdings by some sophisticated agents. In particular,William Hammond the Younger ended 1844 with £18,851 in his account, and then builtit up to £37,250 by 7 May 1845 (with most of the accumulation in February 1845). Therewas probably some coordination among SN holders, and possibly some bargaining with thegovernment broker about the price that CRND would have to pay. What we do know is thaton 8 May 1845, SSC management was presented by their broker with a specific proposal
32 Andrew Odlyzko
to exchange some of their RA and CA holdings for a combination of SO, SN, and S1751.It was known publicly that in January 1845, the SSC had received £0.6 million of CA andRA from the government in settlement of their 1815 agreement, and so LSE members mayhave concocted the exchange proposal in their search for somebody who might be willingto take their SN inventory off their hands at an advantageous price. (There were manyprominent LSE members among the SSC shareholders who had been trying to liquidatethat company and thereby profit from the large gap between its share price and underlyingvalue.) SSC agreed, and the deal was carried out the next day, 9 May, and involved SSCacquiring £79,750 of SN for £0.50 under the price of CA (the major gilt that SN waspaired with). (As part of the deal, SSC also acquired slightly under £22,000 of SO andS1751.) Hammond contributed all of his SN holdings to this deal, and there were severalother sellers, some jobbers, and some not. That same day the government broker made hisfirst purchase of the year of SN, a single transfer of £4,900 from a banker (who was also aseller of £4,000 of SN to SSC). Was the government broker insisting on a greater discountthan £0.50, and was he persuaded to give up on that by the SSC deal? At this stage wedo not know, but in any case this appears a clear case of not quite strategic, but certainlytactical, action by some of the LSE players.
11.5 Direct sales to CRND that bypassed jobbers
CRND repurchases were conducted by a public process, and any members of the LSE, notjust jobbers, could participate. Still, most of the SO that was bought by the CRND camefrom either jobbers or other financial players. The Hoare partners provided almost 8% ofthe total of CRND purchases, William Hammond the Younger about 7%, and Rothschildsand others lesser amounts. There were some sizable direct sales by general investors, themost notable one of £19,200, or almost 3% of the total CRND repurchases, by the RoyalExchange Assurance Annuity Company. (This was the largest single purchase of SO by theCRND and may have been conducted outside the public purchase program.) But altogetherthese direct repurchases from outside investors amounted to less than 10% of the total. Thusit seems the financial sector was effectively getting about a 0.5% fee for collecting the SOfrom the investing public and conveying it to the CRND, on top of the brokerage feesthat had to be paid in any case. Why didn’t the brokers for those outside investors dealdirectly with the CRND? Some plausible reasons include the unpredictability of the dayswhen the government broker bought SO and the fact that brokers apparently visited thefloor of the LSE only occasionally, and so it might not have been convenient for them towait until the CRND purchase process started. The government broker also tended to buyin large quantities (when there were large sums at his disposal, we do find some smalltransfers in the ledgers at other times). Hence for small investments in SO, it is no surprisethat jobbers were involved. But there were some large sales by outside investors one mightexpect to have been done directly. This may reflect inefficiency in LSE. But it may alsoreflect our ignorance of the details of the deals. It is possible that some of the sales toCRND, especially by parties like Hammond or the Hoare partners, may have been done asagents on commission, or some similar arrangements.
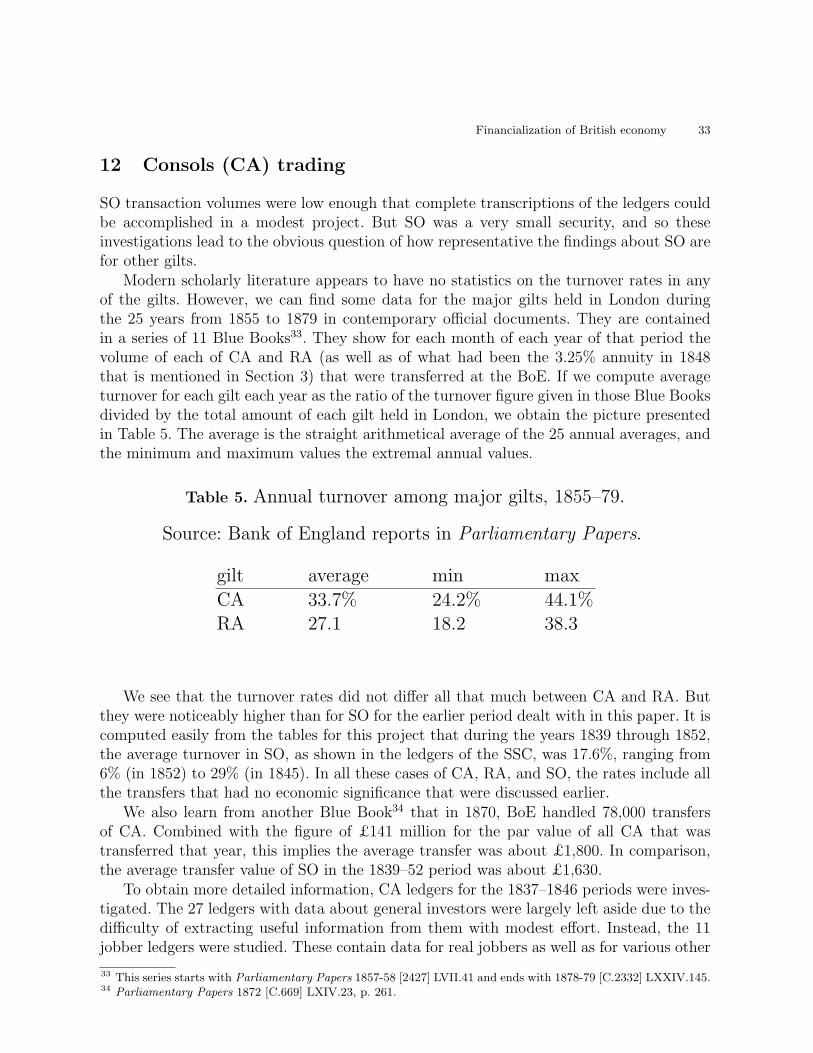
Financialization of British economy 33
12 Consols (CA) trading
SO transaction volumes were low enough that complete transcriptions of the ledgers couldbe accomplished in a modest project. But SO was a very small security, and so theseinvestigations lead to the obvious question of how representative the findings about SO arefor other gilts.
Modern scholarly literature appears to have no statistics on the turnover rates in anyof the gilts. However, we can find some data for the major gilts held in London duringthe 25 years from 1855 to 1879 in contemporary official documents. They are containedin a series of 11 Blue Books33. They show for each month of each year of that period thevolume of each of CA and RA (as well as of what had been the 3.25% annuity in 1848that is mentioned in Section 3) that were transferred at the BoE. If we compute averageturnover for each gilt each year as the ratio of the turnover figure given in those Blue Booksdivided by the total amount of each gilt held in London, we obtain the picture presentedin Table 5. The average is the straight arithmetical average of the 25 annual averages, andthe minimum and maximum values the extremal annual values.
Table 5. Annual turnover among major gilts, 1855–79.
Source: Bank of England reports in Parliamentary Papers.
gilt average min max
CA 33.7% 24.2% 44.1%RA 27.1 18.2 38.3
We see that the turnover rates did not differ all that much between CA and RA. Butthey were noticeably higher than for SO for the earlier period dealt with in this paper. It iscomputed easily from the tables for this project that during the years 1839 through 1852,the average turnover in SO, as shown in the ledgers of the SSC, was 17.6%, ranging from6% (in 1852) to 29% (in 1845). In all these cases of CA, RA, and SO, the rates include allthe transfers that had no economic significance that were discussed earlier.
We also learn from another Blue Book34 that in 1870, BoE handled 78,000 transfersof CA. Combined with the figure of £141 million for the par value of all CA that wastransferred that year, this implies the average transfer was about £1,800. In comparison,the average transfer value of SO in the 1839–52 period was about £1,630.
To obtain more detailed information, CA ledgers for the 1837–1846 periods were inves-tigated. The 27 ledgers with data about general investors were largely left aside due to thedifficulty of extracting useful information from them with modest effort. Instead, the 11jobber ledgers were studied. These contain data for real jobbers as well as for various other
33 This series starts with Parliamentary Papers 1857-58 [2427] LVII.41 and ends with 1878-79 [C.2332] LXXIV.145.34 Parliamentary Papers 1872 [C.669] LXIV.23, p. 261.
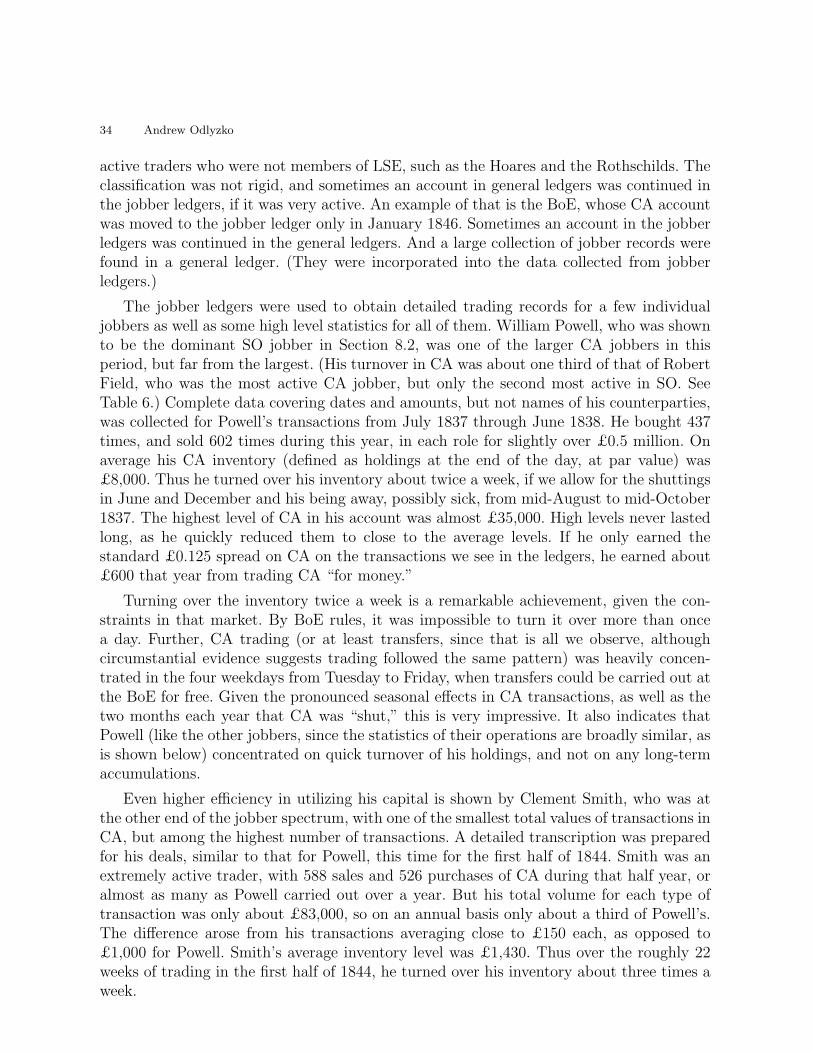
34 Andrew Odlyzko
active traders who were not members of LSE, such as the Hoares and the Rothschilds. Theclassification was not rigid, and sometimes an account in general ledgers was continued inthe jobber ledgers, if it was very active. An example of that is the BoE, whose CA accountwas moved to the jobber ledger only in January 1846. Sometimes an account in the jobberledgers was continued in the general ledgers. And a large collection of jobber records werefound in a general ledger. (They were incorporated into the data collected from jobberledgers.)
The jobber ledgers were used to obtain detailed trading records for a few individualjobbers as well as some high level statistics for all of them. William Powell, who was shownto be the dominant SO jobber in Section 8.2, was one of the larger CA jobbers in thisperiod, but far from the largest. (His turnover in CA was about one third of that of RobertField, who was the most active CA jobber, but only the second most active in SO. SeeTable 6.) Complete data covering dates and amounts, but not names of his counterparties,was collected for Powell’s transactions from July 1837 through June 1838. He bought 437times, and sold 602 times during this year, in each role for slightly over £0.5 million. Onaverage his CA inventory (defined as holdings at the end of the day, at par value) was£8,000. Thus he turned over his inventory about twice a week, if we allow for the shuttingsin June and December and his being away, possibly sick, from mid-August to mid-October1837. The highest level of CA in his account was almost £35,000. High levels never lastedlong, as he quickly reduced them to close to the average levels. If he only earned thestandard £0.125 spread on CA on the transactions we see in the ledgers, he earned about£600 that year from trading CA “for money.”
Turning over the inventory twice a week is a remarkable achievement, given the con-straints in that market. By BoE rules, it was impossible to turn it over more than oncea day. Further, CA trading (or at least transfers, since that is all we observe, althoughcircumstantial evidence suggests trading followed the same pattern) was heavily concen-trated in the four weekdays from Tuesday to Friday, when transfers could be carried out atthe BoE for free. Given the pronounced seasonal effects in CA transactions, as well as thetwo months each year that CA was “shut,” this is very impressive. It also indicates thatPowell (like the other jobbers, since the statistics of their operations are broadly similar, asis shown below) concentrated on quick turnover of his holdings, and not on any long-termaccumulations.
Even higher efficiency in utilizing his capital is shown by Clement Smith, who was atthe other end of the jobber spectrum, with one of the smallest total values of transactions inCA, but among the highest number of transactions. A detailed transcription was preparedfor his deals, similar to that for Powell, this time for the first half of 1844. Smith was anextremely active trader, with 588 sales and 526 purchases of CA during that half year, oralmost as many as Powell carried out over a year. But his total volume for each type oftransaction was only about £83,000, so on an annual basis only about a third of Powell’s.The difference arose from his transactions averaging close to £150 each, as opposed to£1,000 for Powell. Smith’s average inventory level was £1,430. Thus over the roughly 22weeks of trading in the first half of 1844, he turned over his inventory about three times aweek.
Financialization of British economy 35
One year of Powell’s work and half a year of Smith’s each involved slightly over athousand transactions. The 11 jobber ledgers that were studied cover 9 years, and aboutthree quarters of a million transactions, so it was not feasible to attempt a completetranscription. Instead, 5812 records were obtained, corresponding (with a few exceptionsfor technical reasons) to separate pages in those 11 ledgers. Aside from a few special cases, atypical page was devoted to a single jobber, and had two columns. In the right column wererecorded that jobber’s purchases of CA, in the left column his sales. At the top of the rightcolumn was given that jobber’s net balance in CA at that time, and at the bottom the sumof that initial balance and all purchases on the page. For each such page what was recordedwere the name of the jobber, the first date of a transaction on a page, the balance at thetop of the right column, and the total at the bottom of the page. The difference betweenthe last two numbers gives the sum of CA purchases (or, more precisely, transfers into hisaccount, since we do not have information about the exact nature of the transaction thatwas involved) by the jobber that are recorded on that page. This is an exact number, notan estimate, although to simplify the work, it was truncated to the nearest pound in thetranscriptions. The difference in dates between the one recorded for a page and that for thenext one for the same account can be used to obtain more fine-grained time informationthan will be used in this section.
The third entry, which will be called V, yields a value for the jobber’s holdings of CA.However, it is a distorted figure, as it does not necessarily correspond to his holdings at anyparticular time. It was usually the balance obtained by taking all the purchases in a day,but only some of the sales (the precise number depending on the space available on thepreceding page). Thus even though it was associated with a particular day, it represented anoverestimate of the jobber’s holdings at the end of that day. Based on the studies of Powell’sCA dealings in 1837–38, as well as his transactions in RA detailed in the next section, andSmith’s in CA in 1844, taking the average of V over the pages under consideration givesan estimate of the average holdings that is almost 50% higher than the true average. Sofor each jobber, an estimate of his average holdings of CA was formed by taking 70% ofthe average of the V values. This is probably too much of a reduction for the non-jobberbut relatively frequent traders whose activities are in the jobber ledgers, but that remainsto be estimated precisely.
Fairly substantial sampling of pages showed that for real jobbers, each page on averagerecorded about 57 purchases and 69 sales of CA. Thus all these pages contain around730,000 transaction records, although some of them are duplicates, the result of bothaccounts in a transaction being contained in the jobber ledgers. That is about 80,000 peryear, similar to the official figure from BoE for 1870 that is mentioned above.
The above procedure produced data for 216 accounts, most with few pages and fewtransactions, although some of those had very high volumes of transactions. (For example,the BoE has just one page, for 1846, for which the record shows opening balance of £658thousand, and purchases of £404 thousand.) Of these 216, 64 were tentatively classified asbelonging to ordinary jobbers.

36 Andrew Odlyzko
The remaining 152 accounts were consolidated into 141 by creating synthetic accountsfor several groups, in particular the Hoare bank partners, the various Rothschilds, as wellas accounts involving:
– Benjamin Cole andWilliam Herbert Mullens, partners in the government broker firm [55]– Frederick Harrison, Robert Hichens, and William Hichens, partners in a broker firm
that was also a major money market operator [50]– Lewis Loyd and Samuel Jones Loyd (the second a famous monetary theorist, later to
become Lord Overstone), father and son, partners in the private Lombard Street bankof Jones, Loyd & Co.
The transaction volumes listed below for each synthetic account include transfers betweenmembers of each group, which, as we saw in the discussion of SO trading, was substantialfor some cases, especially for the Hoares. Further work will be needed to eliminate suchtransactions.
The total volume of business (as measured by acquisitions of CA) over the 9 yearscovered by those ledgers came to £294 million, whereas the capital of CA was around£370 million, as shown in Table 1. So the annual inflow to the financial agent accountscovered by the jobber ledgers was only about 9% of the total capital of CA. But we needto consider this in more detail.
The 64 real jobbers handled about 2/3 of the volume, £202 million. Quite a substantialpart of their business was among themselves, or with other financial agents. But even if wedisregard that, and assume that their intake of CA represented all the market sales of CAby the general public35, we find that about 6% of the total volume of CA holdings wouldgo from investors to the market each year, and then out again, producing a contributionof 12% to the turnover rate that was measured in Table 5. That is low compared to the24–44% figures for CA in that table, but may not be unreasonable when we consider thecomplete analysis for SO transactions, where the market trades were also a small fractionof the total. Further confirmation that the jobber transactions may cover most of the run-of-the-mill public transfers comes from considering the average sizes of transactions. Forall transactions in CA in 1870, the average size was about £1,800, as was noted at thebeginning of this section, while for SO in the 1840s it was about £1,630. For the 5 mostactive jobbers in SO, the average acquisition in the 1840s was about £840, while for the64 jobbers in our CA data set for 1837–46, it was £685. The similarity in the figures forSO, where we have complete data, and for CA, suggests that we are not missing any majorfactors. So as a first estimate, it seems that most of the public’s financial transfers wereof moderate size and went through jobbers, and the large average transaction size overall transfers comes from non-jobber financial agents and the many non-financial transfers,such as inheritances or changes of trustees.
There was huge variation in the level of activity among the jobbers. The most activeone did 9.5% of the business (again, as measured by par value of CA acquisitions), the
35 This may not be entirely inaccurate. The money market deals of the jobbers which inflated this estimate oftheir dealings with the general public were counterbalanced by a substantial part of the business of the Hoares,Loyds, Rothschilds, and similar agents who are not among these 64 jobbers who also handled some transactionswith the general public, and not just the money market deals. Evidence of that was shown in the discussion ofSO transactions.
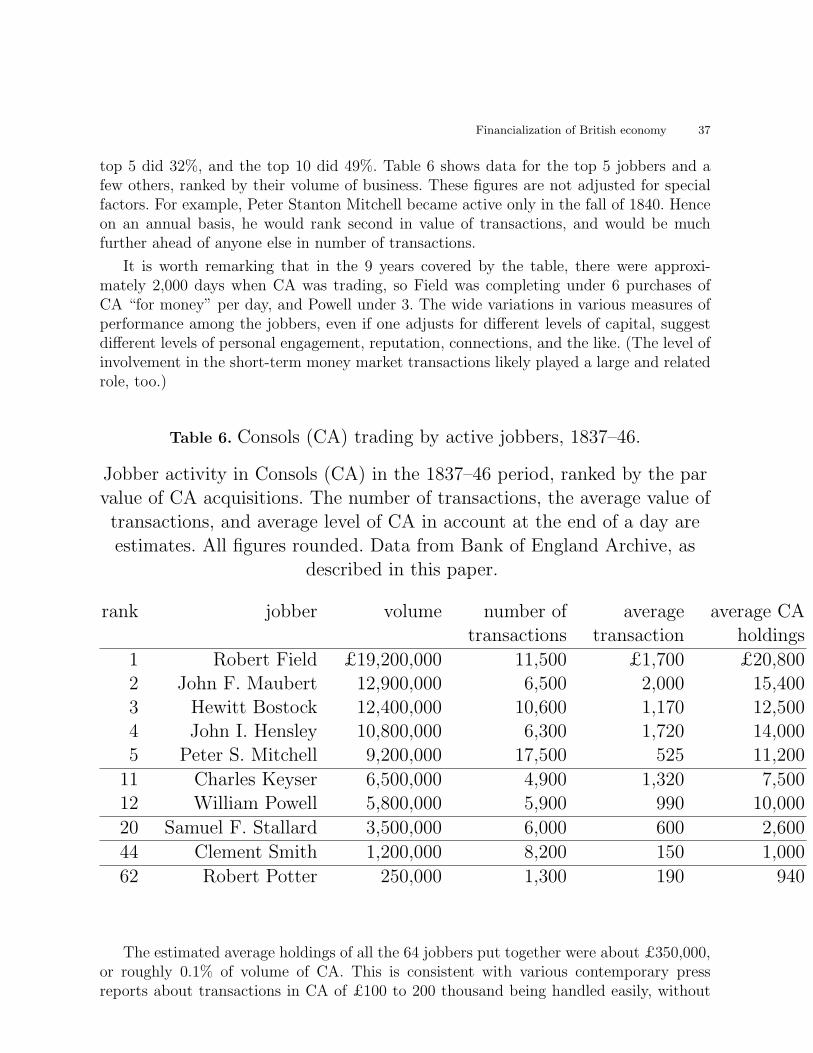
Financialization of British economy 37
top 5 did 32%, and the top 10 did 49%. Table 6 shows data for the top 5 jobbers and afew others, ranked by their volume of business. These figures are not adjusted for specialfactors. For example, Peter Stanton Mitchell became active only in the fall of 1840. Henceon an annual basis, he would rank second in value of transactions, and would be muchfurther ahead of anyone else in number of transactions.
It is worth remarking that in the 9 years covered by the table, there were approxi-mately 2,000 days when CA was trading, so Field was completing under 6 purchases ofCA “for money” per day, and Powell under 3. The wide variations in various measures ofperformance among the jobbers, even if one adjusts for different levels of capital, suggestdifferent levels of personal engagement, reputation, connections, and the like. (The level ofinvolvement in the short-term money market transactions likely played a large and relatedrole, too.)
Table 6. Consols (CA) trading by active jobbers, 1837–46.
Jobber activity in Consols (CA) in the 1837–46 period, ranked by the parvalue of CA acquisitions. The number of transactions, the average value oftransactions, and average level of CA in account at the end of a day areestimates. All figures rounded. Data from Bank of England Archive, as
described in this paper.
rank jobber volume number of average average CAtransactions transaction holdings
1 Robert Field £19,200,000 11,500 £1,700 £20,8002 John F. Maubert 12,900,000 6,500 2,000 15,4003 Hewitt Bostock 12,400,000 10,600 1,170 12,5004 John I. Hensley 10,800,000 6,300 1,720 14,0005 Peter S. Mitchell 9,200,000 17,500 525 11,200
11 Charles Keyser 6,500,000 4,900 1,320 7,50012 William Powell 5,800,000 5,900 990 10,000
20 Samuel F. Stallard 3,500,000 6,000 600 2,600
44 Clement Smith 1,200,000 8,200 150 1,000
62 Robert Potter 250,000 1,300 190 940
The estimated average holdings of all the 64 jobbers put together were about £350,000,or roughly 0.1% of volume of CA. This is consistent with various contemporary pressreports about transactions in CA of £100 to 200 thousand being handled easily, without
38 Andrew Odlyzko
affecting prices unless there was some suspicion being present in the market that the agentinvolved had some inside knowledge.
The activity of the 141 non-jobber accounts was far more concentrated than that ofthe jobbers. The top 5 accounted for almost half of the transaction volume, with theRothschilds in first place with £18.0 million of CA inflows (slightly less than for RobertField) which came to 19.7% (of the non-jobber volume, which was about 30% of the total).The Hoare bank was second at 8.9%, and the Jones, Loyd bank was third at 7.6%. (WilliamHammond the Younger was in 7th place, at 2.8%.) The average total holdings of CA ofthese 141 agents appear to have been around £1.7 million, about 5 times that of thejobbers.
How much did the jobbers earn from trading CA “for money”? (Such trading is allwe are considering now, trading “for account” is largely an unknown that is consideredin Section 14.) Given how quickly they turned over their inventory, they could not havebeen doing much market timing, so probably just earned the standard bid-ask spread of£0.125 on each unit of £100.00 of nominal value. Hence, with about £22 million comingin and going out of their accounts each year, jobbers collectively made about £25,000 ingross profits from this business. If we double this figure to allow for profits on trading inother gilts (which were about equal in volume to CA), we conclude they collectively earnedabout £50,000 each year. For a collective capital of what must have been around £1 million(since the £350,000 estimated for CA holdings should be doubled to account for holdingsin other gilts, as well as a substantial amount of cash), this is not very impressive. CAitself paid about 3% per year, and the general opinion of the time was that a competentand diligent merchant, tenant farmer, or other businessman should have been able to earnabout 10% annually on his capital. It is not impossible that LSE jobbers collectively didearn £100,000 per year on gilts, when one also adds in the profits on trading “for account”or from money market operations, but we do not as yet have hard data to substantiatethat.
For the public at large, the cost was higher. In addition to the jobber bid-ask spreadof £0.125 there was also the usual brokerage commission of the same amount. So if thepublic were selling and buying a total of £44 million of gilts (twice that estimated abovefor CA alone) annually, they paid a total about about £150,000 each year. Added to whatseems a very generous estimate of £100,000 per year for jobber earnings, this produces atotal cost of the financial services sector involved in the LSE of only about £250,000 eachyear. Yet that is also remarkably small, given the capital of all gilts of £800 million, and,for comparison, over £1 million that BoE annual revenues amounted to in this period.
Running the LSE infrastructure was very inexpensive. At an annual fee of 10 guineas permember, the Trustees and Managers (who represented the LSE shareholders and controlledthe facility) collected under £10,000 per year in the mid-19th centuty. But by paying strictattention to economy, they kept costs down. This enabled them to pay very generousdividends, around 20% annually on the original investment of £20,000 ([16], p. 16). As hasbeen seen in a variety of contexts, providing the infrastructure involved lower volatility andhigher profits than the more glamorous service that the public saw.
Financialization of British economy 39
The overall picture that emerges from these statistics is of a remarkably small groupof jobbers handling almost all of the market transactions in CA of the general publicwith relatively little capital, and scrambling to turn over their inventory as quickly aspossible. However, behind them was another class, even smaller, of large and financiallysavvy operators who apparently (see the discussion later) used CA primarily as collateralfor their money market dealings, but could and did step in to provide depth to the primaryCA market.
The conclusions section discusses the applicability of these results, derived from datafor the 1840s, for later periods. It is worth noting that there are some indications (inparticular, in the testimony of Richard Thorp, a gilts jobber, before the 1877–78 LondonStock Exchange Commission [52]) that by the late 1870s, at least some gilts jobbers hadmuch more capital and handled larger transactions. That suggests there were fewer of them.That is one of many issues raised by this paper that can be settled with some additionalresearch in the ledgers.
13 Reduced 3% Annuity (RA) and CA trading
Some data was also obtained about RA transactions from RA jobber ledgers in the set thatcovers the period from April 1840 to March 1847. The regular jobbers whose activities arecovered there appear to be a large subset of those who dealt in CA during this period. Aquick scan of the ledger volumes for the 3.25% annuity that arose in 1844 shows that thejobbers who dominated there were also the ones who dominated trading in CA and RA.This is consistent with various contemporary printed comments that jobbers specializingin large gilts dealt with all of them. But only a small subset did any substantial businessin the more exotic gilts, such as SO. Various contemporary accounts state that jobberswho dealt in foreign government securities or joint stock company shares were largely adifferent group, but we do not have quantitative data on this.
A complete record was obtained of the transactions of William Powell for the periodJanuary 1843 through March 1845. His average end-of-day holdings of RA were £5,300,and since his annual purchases and sales of RA were about £250,000 during the 9 months ofeach year he was active in the RA market (excluding the months of March and Septemberwhen RA was “shut,” as well as June, when he appeared to be taking a vacation), he wasturning over his RA inventory about 1.3 times each week, considerably slower than for CA.(The sizes of his sales and purchases of CA were between 12 and 30% larger than in RA,respectively, although this was for a different period.)
Less detailed statistics were collected for a wider sample of the accounts present inthe RA jobber ledgers. The information that was gathered was the same as for CA, asdescribed in the preceding section. Most of the accounts were for regular jobbers, such asPowell, but Lionel Nathan de Rothschild, the head of the London branch of the Rothschildfamily, was also included, to represent large financial agents who were not LSE members.The periods covered were slightly different (1837–46 for CA and 1840–47 for RA, reflectingdifferent coverage in ledgers for different securities), and Price, Ricardo, and Soden stoppedbeing active in 1845, so appropriate adjustments were made in the calculations. Given the
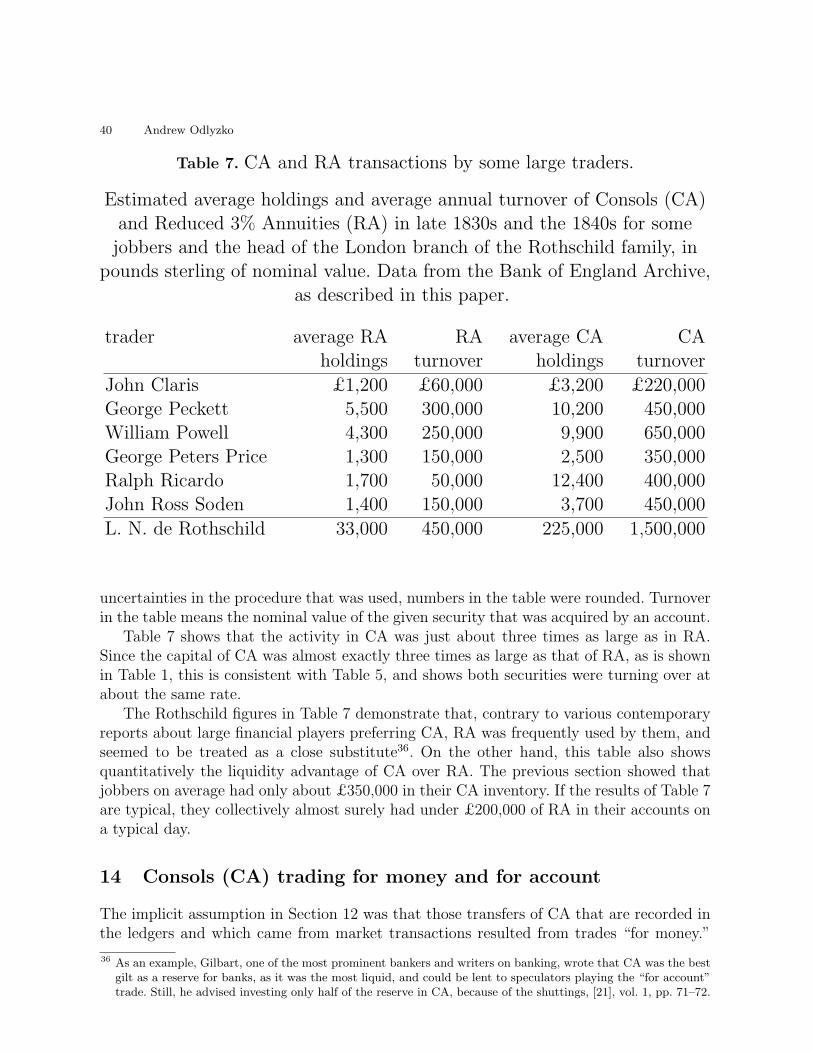
40 Andrew Odlyzko
Table 7. CA and RA transactions by some large traders.
Estimated average holdings and average annual turnover of Consols (CA)and Reduced 3% Annuities (RA) in late 1830s and the 1840s for somejobbers and the head of the London branch of the Rothschild family, in
pounds sterling of nominal value. Data from the Bank of England Archive,as described in this paper.
trader average RA RA average CA CAholdings turnover holdings turnover
John Claris £1,200 £60,000 £3,200 £220,000George Peckett 5,500 300,000 10,200 450,000William Powell 4,300 250,000 9,900 650,000George Peters Price 1,300 150,000 2,500 350,000Ralph Ricardo 1,700 50,000 12,400 400,000John Ross Soden 1,400 150,000 3,700 450,000
L. N. de Rothschild 33,000 450,000 225,000 1,500,000
uncertainties in the procedure that was used, numbers in the table were rounded. Turnoverin the table means the nominal value of the given security that was acquired by an account.
Table 7 shows that the activity in CA was just about three times as large as in RA.Since the capital of CA was almost exactly three times as large as that of RA, as is shownin Table 1, this is consistent with Table 5, and shows both securities were turning over atabout the same rate.
The Rothschild figures in Table 7 demonstrate that, contrary to various contemporaryreports about large financial players preferring CA, RA was frequently used by them, andseemed to be treated as a close substitute36. On the other hand, this table also showsquantitatively the liquidity advantage of CA over RA. The previous section showed thatjobbers on average had only about £350,000 in their CA inventory. If the results of Table 7are typical, they collectively almost surely had under £200,000 of RA in their accounts ona typical day.
14 Consols (CA) trading for money and for account
The implicit assumption in Section 12 was that those transfers of CA that are recorded inthe ledgers and which came from market transactions resulted from trades “for money.”
36 As an example, Gilbart, one of the most prominent bankers and writers on banking, wrote that CA was the bestgilt as a reserve for banks, as it was the most liquid, and could be lent to speculators playing the “for account”trade. Still, he advised investing only half of the reserve in CA, because of the shuttings, [21], vol. 1, pp. 71–72.
Financialization of British economy 41
For gilts other than CA, there was no official trading “for account” (although among thefinancially sophisticated agents all sorts of private deals were being done, many of whichlikely had a similar effect), so there this assumption is largely accurate. For CA, though,there was active dealing “for account,” and published prices and quotes for CA were givenseparately for both types of trades. Contemporary opinion was that “for account” tradingwas very large. For example, Morier Evans, one of the most respected financial journalistsof that era, wrote in 1845 ([17], p. 36) that
The very existence of the Stock Exchange, as at present constituted, almost dependsupon speculations in “time bargains;” inasmuch as when there exists a body of nearly800 members, the actual “money,” or bona fide business, would be utterly inadequateto provide employment for them all, notwithstanding the enormous magnitude ofthe National Debt, and the amount of foreign and other securities.
It is likely that Evans in the quote above, as well as other contemporary observers, over-estimated the volume of trading of CA “for account.” They were probably misled aboutthe nature of much of the activity at the LSE. They may have attributed much of theshort-term money market deals to “time bargains.” That is covered in Section 17.
When a trade “for account” was settled in cash on account day (as Evans describessuch trades), we would find no trace of it in the BoE ledgers. But it would still providebusiness for jobbers, as well as for brokers. At this moment, though, we have no way toestimate the volume of such transactions. Trades done “for account” but for the purposeof actually carrying out the transaction would show up in the ledgers on CA account days.A preliminary impression is that this was not a large factor in CA transfers, but this willneed to be confirmed by more careful studies of the ledgers.
Before 1860, though, trading in CA “for account” appears to have been about as activeas “for money.” In the absence of any solid statistics on volumes of trading in CA “foraccount,” indirect indicators were collected and are presented in Table 8. Information wascollected from CoE for the 5 periods 6 July to 5 August 1825 (26 trading days), 6 Aprilto 13 June 1848 (57 trading days), 11 October to 7 December 1853 (49 days), 6 July to4 August 1864 (26 trading days), and 2 May to 31 May 1879 (25 trading days), whichhappened to be periods when neither CA nor RA was “shut.” What was recorded foreach security were the number of prices for each security printed for that day and thedifference between the high and low prices of the day. (The number of prices was not thenumber of different prices, but the number of prices printed in CoE. Thus on 24 April1848, CoE lists the following prices for RA: 80.375, 80.625, 80.875, 80.625, and this wascounted as four prices.) Both should be positively correlated with the volume of trading.What we find is that through 1853, trading in CA “for account” appears to have beenabout as active as “for money,” and considerably more active than in RA. In the 1860s and1870s, though, trading “for account” appears to have diminished substantially. It was notuncommon to encounter several days when no transactions at all were reported for CAa.This was likely caused by the elimination of “shuttings” for gilts in 1861, and introductionof trading ex-dividend. A contributing factor may have been the growth in the number andvolume of volatile securities, which may have absorbed the capital looking for speculativeopportunities. (Trading in CA “for account” could be done with small margin, unlike
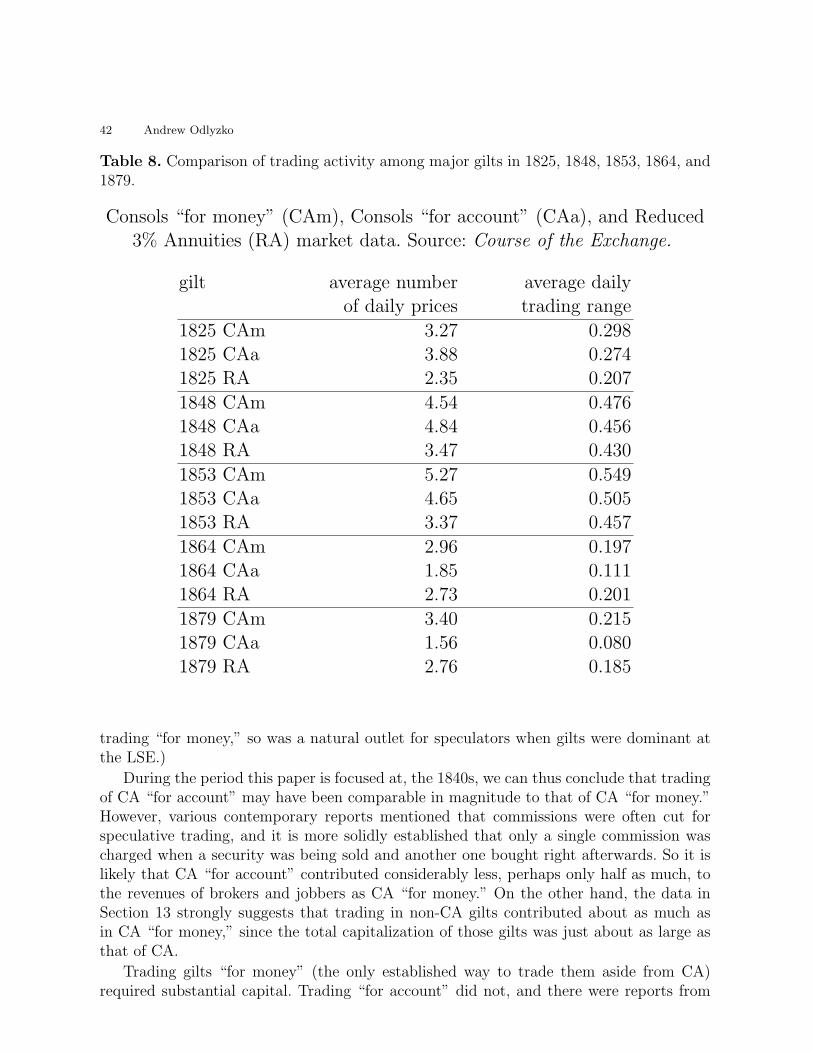
42 Andrew Odlyzko
Table 8. Comparison of trading activity among major gilts in 1825, 1848, 1853, 1864, and1879.
Consols “for money” (CAm), Consols “for account” (CAa), and Reduced3% Annuities (RA) market data. Source: Course of the Exchange.
gilt average number average dailyof daily prices trading range
1825 CAm 3.27 0.2981825 CAa 3.88 0.2741825 RA 2.35 0.207
1848 CAm 4.54 0.4761848 CAa 4.84 0.4561848 RA 3.47 0.430
1853 CAm 5.27 0.5491853 CAa 4.65 0.5051853 RA 3.37 0.457
1864 CAm 2.96 0.1971864 CAa 1.85 0.1111864 RA 2.73 0.201
1879 CAm 3.40 0.2151879 CAa 1.56 0.0801879 RA 2.76 0.185
trading “for money,” so was a natural outlet for speculators when gilts were dominant atthe LSE.)
During the period this paper is focused at, the 1840s, we can thus conclude that tradingof CA “for account” may have been comparable in magnitude to that of CA “for money.”However, various contemporary reports mentioned that commissions were often cut forspeculative trading, and it is more solidly established that only a single commission wascharged when a security was being sold and another one bought right afterwards. So it islikely that CA “for account” contributed considerably less, perhaps only half as much, tothe revenues of brokers and jobbers as CA “for money.” On the other hand, the data inSection 13 strongly suggests that trading in non-CA gilts contributed about as much asin CA “for money,” since the total capitalization of those gilts was just about as large asthat of CA.
Trading gilts “for money” (the only established way to trade them aside from CA)required substantial capital. Trading “for account” did not, and there were reports from
Financialization of British economy 43
later in the 19th century of jobbers with small assets [30]. It seems unlikely, though, thatthere would be jobbers in gilts who dealt strictly “for account,” since the bid-ask spreadwas low, and there were a few score of jobbers engaging in the trade “for money” andtherefore presumably also “for account.”
15 Financialization of the early Victorian economy
Financialization has usually referred to the increase in size and importance of the financialsector. In modern times it is often used to denote the perceived dominance of finance overall other parts of the economy. While the recent growth of finance has been striking (byone measure it grew from about 3% of the U.S. economy in 1950 to about 8% by 2010,and in 2007, before the crisis of the following year, and again by 2014, it earned over 30%of all American corporate profits), it is worth recalling that this process has been goingon for a long time, and has aroused controversy from the beginning. Thus we find DanielDefoe writing around 1700 (two decades before the notorious South Sea Bubble, even) apamphlet entitled The Villany of Stock-jobbers Detected, and the Causes of the Late Runupon the Bank and Bankers Discovered and Considered.
The early Victorian time were a particularly interesting period in the financialization ofthe British economy. While the basic ideas, laws, and institutions were similar to modernones, they were still relatively undeveloped. The discussion of gilts investments earlierin this paper, especially of SO, showed how different the long-term capital markets werefrom ours. Not only were gilts the predominant securities, but they were held largelyin small accounts. There were no mutual funds, no pension funds, no hedge funds, andno private equity groups. The only large financial investors in gilts were the insurancecompanies, which appeared as substantial holders of SO. Around 1840, the largest andmost prominent, the Equitable company, had about £7 million of its total investments ofaround £11 million in CA and RA. However, the Equitable was a giant in the industry.The first solid compilations of life insurance assets in Britain start around 1870, when thegovernment requries reports to be filed. They showed total assets of the industry at thattime of £94 million37. Around 1840, that total must have been no more than a third ofthat38.
A comprehensive table of total national assets of Great Britain from 1688 to 1977is available in Appendix A7 of [22]. As that treatise warns, “the figures now availablepermit only very guarded and preliminary statements about the level and movements offinancial assets until the mid-20th century,” but “the main trends are not likely to bemisrepresented” ([22], p. 230). In particular, financialization was still in the early stages.
37 Parliamentary Papers 1874 (275) LV.1.38 In the early early Victorian times, much, if not most, of insurance company investments seemed to be in gilts,
as in the case of the Equitable discussed in Section 8.3. By 1870 those appear to have shifted to other areas,primarily real estate.

44 Andrew Odlyzko
16 The early Victorian British banking and shadow bankingsystems
Even though the banking sector dominated the British financial industry in the middleof the 19th century, it was very small by modern standards. In the U.S., bank assets arearound 100% of GDP, while in Western Europe they are typically in the 200–400% range(with UK at the upper end). A century and a half ago, the ratio in Britain was around onethird, but only if we stretch the defition of banks to include the “shadow banking system,”that of financial intermediaries that are not subject to regulation. There are claims thatthis system helped bring about the global financial crisis of 2008, and suspicions that itmight facilitate the next one. By some estimates the current (2016) shadow banking systemmay be as large as a quarter of the entire world financial system, and it is of major concernfor regulators and policy makers.
In early Victorian times, it could be said that the shadow banking system was all thatexisted. There was very little regulation or transparency. The BoE is the only institutionthat was subject to serious scrutiny, but was forced to publish regular reports on its opera-tions only in 1844. The other banks were limited as to issuance of their own paper money,but otherwise were largely left alone. The 1844 legislation did impose a minor disclosurerequirement on banks, in that they had to report the names of all partners. Even that wasa cause for controversy. When James Gilbart collected some information about the num-bers and family relationships of various London private banks that had been submitted asa result of that law [20], his publication was “said to be offensive to some of the privatebankers”39.
Most contemporary observers (such as Bagehot in his famous Lombard Street [7]) clas-sified the British banking system into
– Bank of England (BoE)– private banks– joint stock banks– discount brokers and dealers (with Overend, Gurney the largest and most prominent
until its spectacular collapse in 1866)
The best contemporary quantitative estimates of those sectors appear to be those publishedby Palgrave [42] in 1873, the same year that Lombard Street appeared. For the BoE andjoint stock banks, the available figures are relatively precise and trustworthy. For privatebanks, the estimates are extremely vague, as they were very secretive then, and very littleof their hard data has been preserved. The volume of bills of exchange is somewhat betterknown. It was the subject of a series of studies in the 19th century, starting with Leatham inthe early 1840s. Their statistical sophistication and reliability grew with time, but still leftmuch uncertainty40. The London discount market, which was based on these bills, has beeninvestigated extensively, cf. [28,46]. It started out with bill brokers, who only put buyersand sellers together, and evolved into a mixture of bill brokerage and bill dealing, in which
39 The Times, 19 May 1845, p. 7.40 A thorough survey of those studies and the limitations of them is available in [39].
Financialization of British economy 45
the agencies actually bought the bills (relying primarily on money that was deposited withthem). The best estimates of the volume of bill market deposits for the mid-1840s are ofabout £11 million, with about £6 million of that accounted for by Overend, Gurney [27,28].
The estimates we have for all the financial institutions cited above, other than the BoE,are not only rough, but very coarse-grained. Thus for bill dealer deposits, King [27,28] couldonly conclude that they grew from about £11 million in the mid-1840s to £17.5–20.2 millionby the mid-1850s. We can learn nothing detailed about their behavior during the RailwayMania or the two financial crises of 1847.
It turns out there was yet another element of the British short-term money marketsome of whose parts might be quantifiable on a day-to-day basis. That is the lending withgilts as collateral, much of it conducted by the jobbers of the LSE.
17 The London Stock Exchange as key element of the moneymarket
The LSE’s role in the London short-term money market presents a perplexing picture.In spite of the flood of brief references to it, even serious contemporary observers (suchas Bagehot) ignored it, as if they were all engaged in a conspiracy of silence. Perhapsthe lack of information about the LSE helped conceal the size and importance of thisrole, or perhaps it was thought to be a minor adjunct to the other financial institutions.Whatever the reason, the picture that we obtain from published books appears seriouslymisleading. This section presents just a few brief comments on this topic (restricted to theearly Victorian times, too), which will require much more research to explicate. What iswritten here should be regarded as speculative, and not as solid findings with extensivedocumentary support.
The best description of this ignored aspect of LSE’s function is in the 1842 ExchequerBills Forgery Commission report [50]. It is not an ideal source for us, as it concentrateson its assigned mission, namely investigation of the forgery. The Commissioners were notexperts in finance and there is little statistical evidence. Further, the testimony of thewitnesses has to be treated with some care, as they all had direct or indirect incentives41
to convince the Commissioners that everyone at the LSE behaved properly, and that therehad not been any reason to be suspicious. Still, much of the evidence was very concrete,and was substantiated by production of documents.
The testimony in the Exchequer Bills report explains some of the phenomena notedin this paper, such as the high volume of transactions between financial agents, and helpselucidate many other issues about the British money market. It shows there was a richecology of different species of money market actors, centered on the LSE. Many wereoutsiders, many were LSE members. Generally speaking, those acting as brokers, justarranging deals but not handling the funds, were receiving 0.5% on the short-term loans,while those (including many jobbers) who were real intermediaries and so took some risksand had to have substantial capital took 1%. There is real color to the testimony, not just
41 In order to convince the government to take responsibility and reimburse the holders of the forged bills, whichthe government did do in the end.
46 Andrew Odlyzko
the cries “Borrow money, borrow money” cited in the Introduction, but detailed accountsof interactions, and how information about potential deals and trustworthiness of variousparties diffused at the LSE.
The short-term loans on the LSE appeared to be made essentially exclusively withcollateral that consisted of Exchequer Bills, gilts, or other securities traded at the LSE.However, there was a general tendency to arrange deals to expire on CA account days.Otherwise, though, there did not seem to be any special preference shown for CA over othergilts. This is consistent with the observations of this paper that CA and RA appeared to beused about equally, when adjusted for their capital, and that even small and obscure giltslike SO were accepted42. Thus the preponderance of citations to “borrowing on Consols”that one finds in contemporary literature was not a reflection of actual practice, but ofusage of Consols as a shorthand for all the 3% gilts, which appears implicated in theoverpricing of CA relative to RA, cf. [40,41].
It was not just banks that were utilizing the LSE to earn some money on their excesscash reserves. We find through [50] figures such as Alfred Bell and Samuel Steward, twolawyers in a partnership, resorting to the LSE to lend some of their savings on ExchequerBills. Similarly, Edward Sherman, a coaching business operator, put his money in LSE-centered loans until it was needed for his large monthly payments. Thus although thebulk of the British investing public was extremely inactive, just collecting their interest(called dividends then) twice a year, there was a substantial population that was activeand sophisticated in their use of available financial instruments.
Much of the money market business was handled by jobbers, which explains a sub-stantial part of the activity we see in the ledgers for CA and SO. A jobber would lendmoney to an outside customer, and transfer some CA, say, into his account as collateral,and then would turn around and transfer that CA to another customer who had moneyto invest. Although we do not yet have detailed transactions studies documenting this, itseems a reasonable conclusion that such operations enabled them to operate with smallergilt inventory than would be required otherwise. Gilts jobbers did accept Exchequer Billsfor collateral, but in the words of one of them, “we have rather have [collateral] on stock[i.e., gilts], because it is more useful to us jobbers” ([50], Q. 3019). Since CA was a book-entry security, a jobber who had £10,000 of CA that was transferred to him as collateralon a loan could sell that on the floor of the LSE in the belief he was going to be able toreplace it before the loan was repaid and he had to transfer that CA back. The borrowedcould not tell this was happening. Such action was not an option with Exchequer Bills,since those were bearer instruments, and the prevailing custom at the LSE was to returnthe same bills as had been offered as collateral.
Exchequer Bills forgery report also documents the existence of large non-jobber moneymarket operations at the LSE. In particular, the partnership of Frederick Harrison, RobertHichens, and William Hichens was mentioned in Section 12 as having their accounts com-
42 It should be mentioned that this is a provisional conclusion. It is possible that different amounts of margin, called“cover” then, were required, depending on the particular gilt that was used. Exchequer Bills were apparentlyaccepted at face value, gilts required modest margin of a few percent, while more volatile securities, such asSpanish government bonds, called for much higher margin. The precise amounts were not regulated, and seemedto be a matter of custom and individual negotiations.
Financialization of British economy 47
bined for the purposes of studying CA transactions. All three were LSE members. CAledgers say nothing about the existence of the partnership, but the Forgery Commissionhearings reveal its existence. They characterized their business as that of both ordinarybrokers and money dealers, lending £30 million in 1841, but, unfortunately, did not sayanything about the average duration of those loans.
The extensive money market operations on the LSE that are documented in the Ex-chequer Bills forgery report explain the frequent references to interest rates at the LSE incontemporary financial reports, even in the provincial press. We find many citations of theform “Money is very easy in the City on first-rate securities; it can be borrowed on [CA]at [1.5–2%]”43. Sometimes one finds more detailed reports, typically in a time of turmoil,as in the following case, dating to two months before the great financial crash of December1825:
There is again a great change in the value of money in the City; it may be borrowedon [CA] at the rate of [2 to 2.5%]; Bankers’ bills are discounted at about [3%], Mer-chants’ at about [4%]. So scarce are the [gilts with nominal yield of 4% that existedthen], that a person holding them may receive the market price, with the condition,that the stock shall be returned to him in a few weeks. By this operation the holdersof this stock have the use of the money for nothing, for whatever stipulated timethe stock may be borrowed44.
There was practically nothing said about these money market operations in the hearingsby the Royal Commission on the LSE [52], even when there were obvious opportunitiesto delve into this subject. For example, one of the witnesses was Percival Spurling ([52],Q1028ff), a member of the Committee for General Purposes (which governed the conductof business at the LSE). He represented the firm of Spurling and Skinner, who were brokersand “money-lenders all through the century.” (That phrase was meant quite literally, as hisfather became a clerk to a broker in 1798, in the old, less formal, stock exchange.) Of the 160questions that were addressed to him, only about 10 dealt with money market operations,although it has to be said his responses were very enlightening. Another witness who was amember of the LSE, Lionel Louis Cohen, was asked about 600 questions, but only about 10of them were about that institution’s money market operations ([52], Q3008ff). Yet Cohenhad much of interest to say. In particular, he had made a comparative study of LSE andcontinental European stock exchanges, and ascertained that the LSE was unique in beingpart of a money market.
That most of the contemporary investment guides and books about the Stock Exchange,such as [31], did not discuss this shadow banking operation of the LSE is natural, sincethose publications were aimed at ordinary investors45. What is most surprising is thateven some very knowledgeable people seemed oblivious to the implications of these moneymarket operations. A high volume of short-term loans terminating on account days hadto produce a high volume of financial transfers on those days, whether in cash (usually
43 Scotsman, 12 April 1837, p. 2. Brief references of this type typically cite just rates for loans on CA collateral.44 Taunton Courier, and Western Advertiser, 12 October 1825, p. 3.45 There were a few exceptions. Probably the best coverage, although still one that seems seriously deficient, is
in [11], in Chapter 12, “The open market.”
48 Andrew Odlyzko
meaning BoE notes) or checks (many of which went through the Bankers’ Clearing House).Yet the observed high volumes of such transfers were almost universally interpreted asindicating disreputable speculation. A particularly interesting and early case of that isJames William Gilbart, who was quoted several times before. He was certainly one of themost knowledgeable bankers of that era, and he does show up in some of the BoE jobberledgers as a name on an account that must have belonged to his employer, the Londonand Westminster Bank. In his main book on banking, which went through many editionsand garnered extensive praise, he did note that “short loans on the Stock Exchange”were one of the ways that bankers could use their “surplus funds”46. So he was definitelyfamiliar with LSE money market operations. Yet, in his description of trading “for account,”he railed against such trading that did not result in actual securities transfer, but wassettled in cash, as “gambling in the funds” ([21], p. 393). Further, although this is a littleambiguous, it seems that he regarded the increased volume of drafts processed at theBankers’ Clearing House on account days as resulting from just such operations. Such anunwarranted conclusion is much clearer in the case of Giffen. In his analysis of the LSEClearing House that had been set up in 1874, and which published some statistics of itsoperations for a while, he did not refer at all to the use of LSE securities as collateral forshort-term loans [19,52]. This is very surprising, as Giffen had been the financial editor forthe Economist and the Daily News and was regarded as one of the most knowledgeableobservers of the markets47.
Even more surprising is that LSE members did not cite money market operations asexplanations for high volume of cash transactions on account days. They and the wholeLSE were constantly denigrated for all the “gambling” activities that were apparentlytaking place there. The London Stock Exchange Commission of 1877–78 spent a lot of timegrilling witnesses about the prospect of being able to separate investing from speculativedealings [52]. They were constantly told this was impossible, that brokers and jobbers couldnot in general know what their customers’ intentions were. Yet none of those witnessesmade a clear statement that much of what seemed to be pure speculation was likely just areflection of the use of collateral for short-term loans. It would seem that this would havebeen a better defense, one much easier for their questioners and the public to accept. Butthis was not done by anyone, at least not very explicitly. (Several witnesses did cite theusefulness of some of the supposedly “speculative” deals, but without going into details.)
At the very end of the 19th century we find yet another instance of the obvious beingoverlooked. W. Cole, in his study of the relations of banks and stock exchanges, writes inone paragraph that most of the volumes of cash transactions on account days “representspeculation pure and simple,” and yet just two paragraphs later says that “the principalconnection between banks and stock exchanges [is the] advancing money by banks on StockExchange securities” ([12], p. 407). He somehow fails to allow for even the possibility that
46 [21], p. 67ff. The other outlets for such funds that he listed were (a) “Government securities,” (b) “loans to billbrokers, payable on demand,” and (c) “first-rate bills obtained through the bill brokers.”
47 A similar view was expressed a few years later by another editor at the Economist, in the article “The StockExchange Clearing-house, and its influence upon speculation,” 6 October 1883, pp. 1160–61, that was based onindirect observations of the operation of the new LSE clearing house that had been established in 1880.
Financialization of British economy 49
the latter would involve regular commercial money market operations, not just specuation,and would contribute to the former.
Just basic logic shows much of the money coming from banks must have been usednot for wild speculation in volatile foreign mining ventures, say, but rather in loans toestablished entities with solid balance sheets. When bank B lent £100,000 to jobber J, itreceived from J high-quality securities, such as gilts, to slightly higher value, say £103,000.But where did J get those gilts? Jobbers simply did not have enough capital of their ownto make a perceptible difference. What must have happened is that J obtained those giltsfrom some other investor, say C, as collateral for a loan. J’s own capital then served just asa swing element, bridging the time gap between receiving gilts from C and passing themon to B. With high volume of short-term transactions, J’s modest capital would then serveto power a far higher volume of transfers from outside lenders to outside borrowers.
The view presented here of large money market operations at the LSE mostly backedby collateral consisting of LSE-traded securities is consistent with all the evidence that hasbeen collected so far. It also helps explain various puzzles in the literature, and suggestssomewhat different interpretations to what other scholars have written. For example, wefind many references to loans through the LSE, as in [14], pp. 163–64 and in [45]. But oftenthese loans appear misinterpreted. For example, Cole wrote in 1899 that “nearly the wholeof the “professional” speculation on the Stock Exchange is carried on with bank money”([12], p. 409, cited also in [30], p. 107). However, that speculation seems more likely toconsist of solid loans, also against good collateral, to others, as opposed to purchases ofsecurities. The substantial profits earned by brokers from “interest” that have been foundin their accounts (cf. [30], p. 120) most likely do come largely from their fee (0.5% inthe early 1840s, according to the Exchequer Bills Forgery report) for lending customers’money to jobbers or specialist money dealers, who then lent it to borrowers outside theLSE. They are unlikely to be earned from lending by those brokers of their own money,since they seldom had enough assets to earn the large profits that are documented.
Among modern books about the LSE, Morgan and Thomas argue on the basis ofsome comments by the government broker before the London Stock Exchange Commissionabout operations by the BoE that “the process generally described in banking literature as‘borrowing on Consols’ was normally” a regular sale coupled with purchase “for account”([35], p. 121). This is surely incorrect in most cases, even though there is no reason todoubt it did apply to the transactions referred to by that broker48. First of all, while“borrowing on Consols” was a common term, it seems often to have been used to referto any borrowing with any gilts being used for collateral, of the kind that is documentedin this paper for SO and RA. And for gilts other than CA, there was no trading “foraccount,” so the maneuver assumed by Morgan and Thomas to be dominant was simplynot available for them. Second, simultaneous sale for cash and purchase for account incurredhigh costs in terms of broker commissions and jobber bid-ask spread, as is discussed in the
48 Such a procedure may have become common on the part of the BoE around that time, as it shows up with somefrequency in the Economist in the 1870s, and that paper even had a regular leader, not just a citation in itsfinancial column, to it on 18 October, 1872, p. 1262.

50 Andrew Odlyzko
Exchequer Bills forgery report [50]49. There was yet another factor that appeared to mattergreatly, namely a behavioral economics quirk, with investors being reluctant to sell. TheExchequer Bills Forgery Commission was puzzled by this and asked witnesses several timesabout it. What they heard was (to quote one jobber, Charles Keyser) that “[p]ersons willfrequently rather give [10% on gilts] than sell it,” that “[t]o any person conversant withstock business that is a matter of notoriety,” and that “it is a thing we cannot ourselvesunderstand; persons will go on from year to year giving [4–6% on gilts] rather than sell it.”
The most recent scholarly book account of the LSE, by Michie [34], does mention moneymarket operations at the LSE, but in a way that can be questioned50. For example, in theearly history of the London gilts market, in the first few decades of the 18th century, Michiedescribes the emergence of jobbers, and characterizes them as agents who “employed theirown money to buy securities in the expectation that the price would rise” (p. 23). That maypossibly have been true of the earliest jobbers, but not of the ones studied here, those of theearly Victorian era. Those had relatively small holdings which they were striving to turnover as quickly as possible, basically just providing a market for outside customers. LaterMichie describes the evolution during the 19th century of the system of “banks, directly orindirectly, employing part of their idle balance in transferable securities” (p. 27), with theimplication of the subsequent passage being that this money was used to purchase gilts,either by the bank or by those it was lent to. The lending of cash against collateral of gilts,which appears from these studies to have been the dominant form in which such funds wereused, is not mentioned. It could be that practices changed as time passed, and that duringthe period dealt with by Michie in that part of his book direct purchases were common (asindeed, holdings of gilts by private banks apparently were more common during the Frenchand Napoleonic wars). For the period after Waterloo, Michie does cite the use of gilts for“short-term investment” (p. 52), and makes the very good point that “what the publictook as meaningless speculation was but the ebb and flow of the money market adjustingto the constant fluctuations to the supply and demand for money at home and abroad.”But there is still no emphasis on borrowing with gilts as collateral. That only shows uplater, in the discussion of the LSE around 1900 (p. 133). But even then, the story seemsincomplete. Michie writes that for banks, “an increasingly common practice was to lendfunds to brokers and jobbers who would invest it on their own behalf, and accept the risksinvolved.” The picture that emerges from this study is that the brokers and jobbers werenot investing the banks’ money, rather passing it on to other institutions (often banks,again) and obtaining collateral that minimized their risks. And they were just continuinga practice that had prevailed for most of the preceding century.
Michie wrote ([34], p. 136):
49 It should be noted that those costs may have been much lower for the BoE, which may have induced it to relyon such moves to a greater extent. The government broker worked for both the government and the BoE, andwas paid a flat fee for government work. It is not known if this fee also covered transactions for the BoE. Even ifit did not, it is likely that the BoE had another flat fee deal, in which case its incremental cost for a commissionon a sale and purchase would have been zero. The BoE, due to its size, might also have been able to get lowereffective jobber bid-ask spreads than other investors.
50 Similar comments apply to the more focused coverage of the LSE and the money market in an earlier work byMichie, in Chapter 5 of [32].
Financialization of British economy 51
Over the 1867–1913 period Britain was free of major monetary crises ... Instrumentalin achieving this stability was the liquidity given to the monetary system by theability to employ and release funds, virtually at will, through the mechanism of theStock Exchange. It was this rather than any development of central bank policy bythe Bank of England or the developments in a national banking system, that wasthe crucial force at work.
These claims about the important role of the LSE in providing crucial flexibility to theBritish financial system are presented without quantitative evidence in [34]. However, theyare plausible. Banks, shadow banks, and other institutions of Victorian Britain tended tobe very conservative in their policies. The LSE seemed to be the central place that couldand did react quickly. The rapid changes in interest rates and variations in rates for lendingon different but seemingly equivalent securities that was perplexing to the Exchequer BillsForgery Commission in 1842 were likely just manifestations of the fact that a variety offinancial flows were being equilibrated. However, contrary to the implication of Michie’sbook, the LSE was playing this role not just by the end of the 19th century, but also by itsbeginning, and likely even sooner. And yet there were major financial crises in 1825, 1847,1857, and 1866, as well as many smaller ones. So we cannot attribute the stability of the1867–1913 period just to the LSE. But in order to understand its contribution, and howit may have changed so as to assist in preventing crises. we need to learn more about theLSE’s money market function. Unfortunately there is not much quantitative evidence wecan use for such studies.
The Exchequer Bills forgery report gives the impression that the most commonly usedcollateral for money market operations at the LSE were Exchequer Bills, with gilts second,and then a variety of other securities, such as East India Company bonds, BoE shares,Spanish government bonds, and so on. This evidence is likely biased by the fact thatthis commission was investigating a forgery involving Exchequer Bills, so concentrated ondealings in them, and talked primarily to the brokers, jobbers, and others who for onereason or another were heavy users of them. But it may reflect actual usage. AlthoughExchequer Bills were awkward instruments, they played an important role in the financialindustry, as their volume (over £50 million at the height of the Napoleonic Wars, andstill around £20 million by mid-19th century) was far larger than that of any other short-term risk-free and interest-bearing security51. Unfortunately Exchequer Bills were bearerinstruments, and we do not have any good source of data on their usage.
In fact, gilts are the only financial instruments for which we have comprehensive records,in the ledgers in the BoE Archive. Their role as collateral undoubtedly declined in thesecond half of the 19th century, as the volume of other securities grew. But they kept beingused, as they were the stable foundation of British securities markets. Hence careful studiesthat go far beyond what is presented in this paper might provide a more accurate view ofthe London money market.
51 The negative interest rates mentioned in the Introduction were an artifact of the shortage of Exchequer Bills,and led to a persistent mispricing for a while, until Gladstone’s move in early 1853 to reduce interest rateson them caused a sudden drop in their value. This was not exactly what we think of as negative rates today.Exchequer Bills declined in volume and importance later in the 19th century
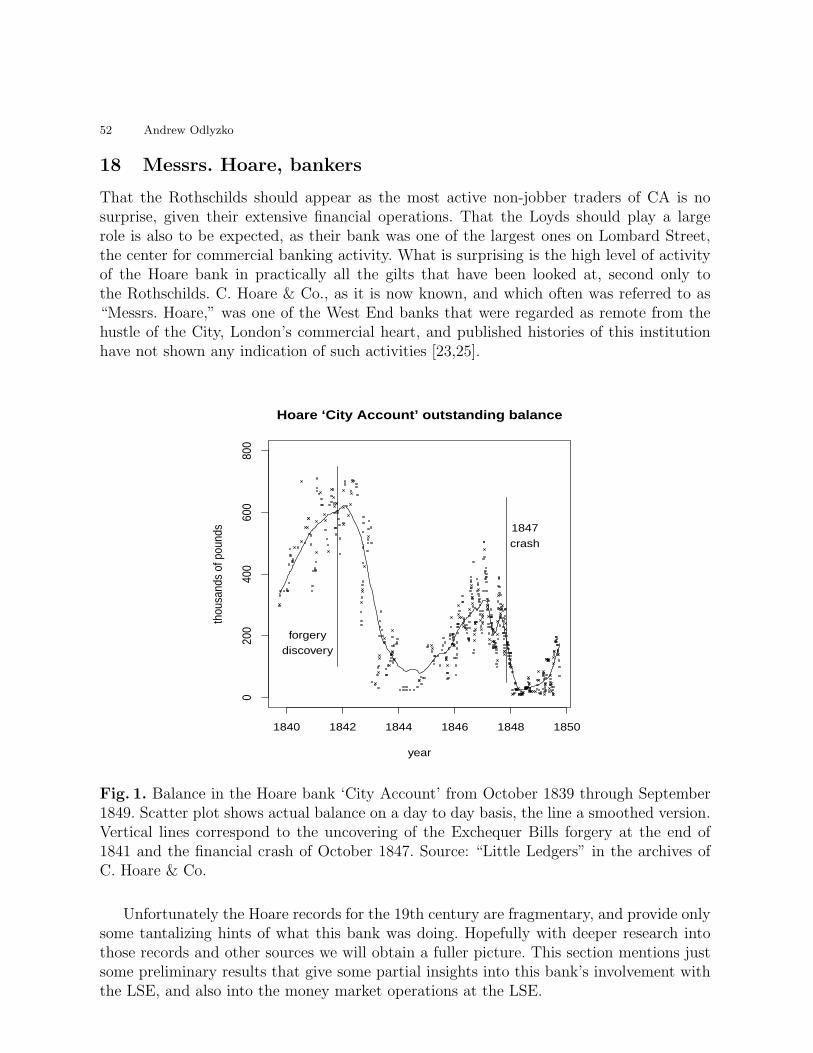
52 Andrew Odlyzko
18 Messrs. Hoare, bankers
That the Rothschilds should appear as the most active non-jobber traders of CA is nosurprise, given their extensive financial operations. That the Loyds should play a largerole is also to be expected, as their bank was one of the largest ones on Lombard Street,the center for commercial banking activity. What is surprising is the high level of activityof the Hoare bank in practically all the gilts that have been looked at, second only tothe Rothschilds. C. Hoare & Co., as it is now known, and which often was referred to as“Messrs. Hoare,” was one of the West End banks that were regarded as remote from thehustle of the City, London’s commercial heart, and published histories of this institutionhave not shown any indication of such activities [23,25].
1840 1842 1844 1846 1848 1850
020
040
060
080
0
year
thou
sand
s of
pou
nds
forgerydiscovery
1847
crash
Hoare ‘City Account’ outstanding balance
Fig. 1. Balance in the Hoare bank ‘City Account’ from October 1839 through September1849. Scatter plot shows actual balance on a day to day basis, the line a smoothed version.Vertical lines correspond to the uncovering of the Exchequer Bills forgery at the end of1841 and the financial crash of October 1847. Source: “Little Ledgers” in the archives ofC. Hoare & Co.
Unfortunately the Hoare records for the 19th century are fragmentary, and provide onlysome tantalizing hints of what this bank was doing. Hopefully with deeper research intothose records and other sources we will obtain a fuller picture. This section mentions justsome preliminary results that give some partial insights into this bank’s involvement withthe LSE, and also into the money market operations at the LSE.
Financialization of British economy 53
The main sources from the Hoare archives that were used in this investigation werethe “Little Ledgers” that contain records of some bank holdings and transactions, andthe “Michaelmas summaries” which were brief annual summaries of revenues, profits, andassets. (The Hoare fiscal years ended on Michaelmas, 29 September.) They do not showany noticeable holdings in gilts. On the other hand, as was shown before, BoE ledgers provethe Hoare partners were frequently substantial owners of a variety of gilts. The most likelyexplanation for this discrepancy is that the gilts were collateral for short-term moneymarket transactions (and, quite likely, occasionally some holdings on behalf of bankingclients), and were treated by the bank separately from their core assets. That is consistentwith the behavior of the Hoare gilts accounts, which show frequent transactions.
Starting in May 1813, the Little Ledgers contain itemized transactions in somethingcalled there the “City Account.” Those are not explained, but various remarks attachedto them together with internal evidence shows they correspond to short term loans, andthe interest rates are either stated explicitly or can be deduced from the entries in thoserecords. Many of the borrowers are recognizable names, frequently LSE jobbers. DavidRicardo, the famous economist who first gained prominence as a very successful jobberand “contractor” for government loans (i.e., leader of investor syndicates that bid in theauction for the giant loans that the British government was selling during the wars), showsup there, for example for £196,000 in early 1814, as well as other loans. Various otherRicardos, William Hammond the Younger and other Hammonds, several Rothschilds, andsuch money dealers as Harrison and the Hichens also appear.
Figure 1 shows the outstanding balance in the City Account from 29 September 1839to 29 September 1849. The large sums in the early 1840s are consistent with the testimonyin May 1842 before the Exchequer Bills forgery commission of Charles Keyser that ([50],Q3081ff.)
Messrs. Hoare lend about [£600,000 or 700,000] to us jobbers every [CA] account,and we have to lend the money again to other parties; we borrow it of them at [3%],and lend it to other parties at [4%], and very often make money of it in that way.
Keyser knew what he spoke about, since he was a large jobber, and he shows up in theCity Account as a frequent borrower. Keyser’s testimony implies that much of this lendingby the Hoare bank had been on the security of Exchequer Bills. However, Keyser explicitlyclaimed that after the forgery came to light, in late October of the preceding year, the Hoarebank stopped accepting this type of collateral. What he did not explain is what replacedit. The dramatic decline in the City Account that is visible in Figure 1 came in January1843, quite a bit later, and so some other collateral must have been used throughout 1842.We know, on the basis of CA ledger records, that it was not CA.
In general, the City Account balances were far larger than the amounts that have beenfound standing in Hoare names in gilts ledgers. A serious attempt to integrate the CityAccount data with the gilts holdings information in the BoE ledgers has not been attemptedyet, but it has been ascertained that many of the gilts transactions do not correspond withanything in the City Account. So it seems that the Hoare bank had several accounts forshort-term money market transactions.
54 Andrew Odlyzko
A very large fraction of the loans in the City Account had due dates on CA accountdates (although a very large fraction of those were then renewed). This supports the thesisdeveloped earlier, that much of the money flow on account days represented not speculationin CA, but money market operations.
It is not known where the money for the City Account or other money market lendingby the Hoare bank came from. As was noted before, it apparently was common for Britishbanks to lend some of their spare cash to the money market through the LSE. However,the Hoare bank during this period had total assets in the range of £2 to 2.5 million andcash holdings in the range of £200,000 to 400,000 (based on the Michaelmas summaries).That does not leave room for money market operations on the scale visible in Figure 1.The Coutts bank was another West End bank that, contrary to popular reputation, was alarge operator on the money market (and apparently strongly preferred Exchequer Bills ascollateral, [50], Q2030, which is consistent with its small presence in the gilts ledgers thathave been examined). However, Coutts was the London agent for many country banks,especially Scottish ones, so its lending may have been primarily on behalf of such clients,aggragating their excess cash reserves. The Hoare bank was not the agent for any otherbanks, though. Perhaps what it did was to gather some funds from its wealthier customersand invest those for them. That would explain another puzzle, namely that while thisbank, along with all the other private London banks, did not pay interest on its customers’regular accounts, the Michaelmas summaries show substantial amounts of interest expense.Some of that may have been this bank borrowing at the LSE (as various banks did) for itsgeneral operations, but most may have been payments to the institutions or individualsthat provided the sums that were lent out through the City Account.
Deeper investigation of Hoare archives may shed some light on some crucial periodsin world financial history. For example, Figure 1 shows that the outstanding balance ofthe City Account declined sharply just before the crisis of October 1847 that led to thesuspension of the gold standard. Various studies of BoE actions in that period have beencarried out. The Hoare data (and possibly data from other financial agencies, such as theCoutts bank) may provide new insights into this event.
The superficial investigation of the Hoare City Account that has been carried out sofar does not allow us to tell, say, what led to the changes in the outstanding balance in thefall of 1847. We can say, though, that it was not caused by a dramatic increase in the ratescharges by the bank. Its rate in this account was in the 4.5–5.5% range from June to thebeginning of November (after the crash, that is), with just four exceptions. The exceptionswere a couple of small loans at 6%, and two loans at 7%, the latter to jobbers, a smallone for £2,000 for one day to Underhill, and a big one for £100,000 to Maubert for anextended period52.
In general, the interest rates on City Account loans remained constant for extendedperiods of time, and to be generally uniform among the borrowers. (There were someinteresting exceptions, such as Overend, Gurney on many occasions paying 0.25% or 0.5%more than others.) This supports the general image of money flows between LSE and
52 The suspension of the gold standard was tied to an increase of the BoE discount rate to what was then viewedas an unprecedented rate of 8%. However, much higher rates were reported as prevailing in various privatetransactions at that crisis time.
Financialization of British economy 55
outside financial institutions coming in at stable rates but in varying volumes, dependingon the needs of those institutions, and the jobbers and other LSE member being theequilibrating agents keeping the whole system stable by moving that cash among differentcustomers and securities through variation of interest rates.
19 LSE members and their activities
Section 12 showed that almost all of the regular transactions of the general public in CAthat went to the floor of the LSE were handled by only about 60 jobbers. Inspection of asample of ledgers for some of the other gilts indicated that it was jobbers from this group(although often, as in the case of SO, just a small subset) that dominated all trading thereas well. There could still have been some jobbers who did not handle any trading of gilts“for money,” and only dealt in CA “for account,” possibly on a day-to-day basis, leaving atthe end of the day with no obligations. (Such a mode of operation was apparenly standardfor a class of jobbers later that century, presumably mostly in non-gilt securities.) Butthis seems unlikely, since the spreads in CA, the only gilt with “for account” transactions,were slim, and volatility was generally low, so it is hard to imagine anyone making a livingthat way. Further, we have no indications from contemporary sources that such jobbersexisted. Hence it seems likely that all the regular jobbing work in gilts was done by these60 or so individuals. This conclusion is strengthened by the data about the likely earningsof all jobbers, as the flow of orders, and therefore of earnings from the bid-ask spreadwas not large. Extrapolating from the data we have for CA “for money” dealings leads tothe conclusion that as a group those 60 jobbers earned substantial amounts, but not verymuch in terms of return on invested capital. Furthermore, earnings were very unequallydistributed among them, so the reports of some retiring very wealthy are credible, as arethe suspicions that many (possibly most) barely managed to make a living.
The estimate of about 150,000 transactions in gilts per year that were recorded in theBoE ledgers, spread over 60 jobbers, gives an average of about 12 transactions per dayover the four days per week (Tuesday through Friday) that gilts trading was concentratedin. Tossing in a few transactions “for account,” as well as some short-term money markettransactions, still gives what might seem to us very low level of activity. However, thathas to be put in context. The primitive paper-based technology as well as the rules of theBoE imposed limits on the speed and volume of transactions. Further, there were strongseasonal effects, as well a daily rhytm of business. Since avoiding extra charges at the BoEmeant having to fill out the required forms there by 1 pm, there was apparently a strongtendency to carry out as much of the business as possible before then and a temporaryemptying of the floor of the LSE just before that time (cf. [2], p. 59), and most likelynot much business later in the afternoon. Hence there must have been periods of franticactivity. As an example, the detailed study of Clement Smith’s dealings in CA “for money”during the first half of 1844 (which meant 5 months, as CA was “shut” in June) found atotal of about 1,100 transactions spread over slightly over 100 days, or about 10 per day.But on 10 days he carried out 20 or more deals (with a maximum of 31 in one day), andthis was just in CA “for money.” So it appears likely that on relatively rare occasions therewould be an hour or two of hustle, but most of the time not much was happening, aside
56 Andrew Odlyzko
from the constant gossiping and higgling that helped oil the markets. Hence there was a lotof time for the practical jokes and school-boy pranks that the LSE was notorious for [4,15].
There is still many interesting questions about the internal workings of the LSE thatare open. For example, most of the time the price of CA, say, was stable, with a singlebid-ask range being offered by all jobbers. What did competition among the jobbers looklike then? Even the superficial examination of the ledgers shows that there were largevariations among jobbers in the sizes of CA transactions they carried out. Just how didthis arise, and what were the relations with the brokers that helped maintain such a state?We might be able to get at least partial insight into this and related questions by moreintensive studies of the ledgers.
The results of this paper lead to a plausible picture of how the gilts trading at the LSEwas carried on, even though many issues are still open. But that picture has just 60 jobbersin it, and so we are left with the question of what the other 90% of LSE members weredoing. That is very unclear at the moment, and calls for more studies. There does not seemto have been enough money flowing around to enrich too many of them. Many were brokerswho brought gilts business to the jobbers. There were also all the jobbers who specializedin foreign government securities and joint stock company equity. Although the total volumeof such securities was probably under 15% of the total around 1840, anecdotally they weretraded more frequently, and were far more volative, with much higher bid-ask spreads.Since jobbers in those securities did not have to possess much capital, unlike those tradingin gilts “for money,” as essentially all trading was done “for account,” there was more scopefor people of meager means to try to earn a living there. Further, there were some LSEmembers who specialized in the “shadow banking” transactions discussed earlier. And, aswe can see in the Exchequer Bills forgery report [50], there were LSE members who didnot have fixed roles, and hung around looking for deals.
It is also possible that many members showed up on the floor of the LSE only occa-sionally. This was feasible, since financial costs of LSE membership were relatively light,with annual dues of £10.50. (This was not completely trivial, however, since the annualincome of a lower middle class family, and of senior bank clerks, was on the order of £200.)Such low levels of participation at the LSE seem forced by the limited space in its building,which would have been grossly overcrowded had all members shown up.
We can find some explicit examples of LSE members who were not very active. Forexample, Francis Stedman was a prominent jobber in SSC securities, especially in the verysmall and obscure S1751 (discussed in Section 6). However, he mostly handled very smalltransactions. He was a senior clerk at the SSC, and seemed to be slowly accumulating asubstantial personal investment in SSC securities. Yet he also did all that trading, perhapsallowing investors to bypass the LSE and do everything at the South Sea House, wherethey had to go to finalize the transactions. He was laid off by the SSC as part of theirrestructuring in 1845, yet kept up his membership in the LSE at least through 1848, eventhough practically no transactions on his part during that period have been found in theledgers. (He may, of course, have been active at the LSE in other types of trades, perhapsin foreign loans or joint stock company shares, which did not lead to entries in the ledgers
Financialization of British economy 57
that are available to us.) Presumably he only went to the LSE on special occasions evenwhile employed by the SSC and acting as a jobber in SSC securities.
Another case of LSE members who apparently did not spend much time on the floorof the LSE were Robert Cottle and Richard Harrison. From at least 1825 to 1846 theywere senior clerks at the Hoare bank, and carried out the bank’s brokerage business froman office near the LSE that was kept under their name. They “took alternate months totransact the Brokerage business,” apparently with one spending some time in or near theLSE each day and with the other working full time at the bank53.
20 William Hammond the Younger
Section 2 discussed the basic division of LSE members into brokers and jobbers. Variousinvestment guidebooks from the mid-19th century mention a third category of LSE mem-bers, “speculators.” Membership in the LSE was easy to obtain, so investors could joinand play directly in the market. The main prohibition was that LSE members could notengage in other businesses54. Such “speculator” members seemed to be mentioned less andless as the 19th century progressed. Whether this was because there were fewer of them, orwhether they were simply re-classified as jobbers is unknown. The latter is perhaps morelikely, since there was no way to tell the difference between a speculator and a jobber.Jobbers were not designated market makers, who are required to provide quotes. So inprinciple it was possible for a jobber to engage only in occasional transactions. (Indeed,jobbers apparently preferred to be called dealers, a term without the negative connotationsof jobber.) The Exchequer Bills forgery commission report [50] documents the presence of awide variety of LSE members who were hanging around, trying to find some deal they couldcatalyze and make some money on. However, they seemed to be mostly small fry. This pa-per does document the presence of rich and influential LSE members who were not regularjobbers, and may have played an important role in making that institution more efficient.But this documentation consists of basically one individual, namely William Hammond theYounger. (Outside agents, such as the Hoare and other banks, and non-bank agents likethe Rothschilds, were also important, as was shown earlier, but they were not members ofthe LSE and so acted through brokers.) It is possible that there were others, but ones whohad little capital or else confined their activities to the markets in foreign loans or jointstock company shares, and are thus not visible in the sources this paper draws on.
Hammond shows up prominently in practically all gilts ledgers from the 1840s that havebeen examined, as well as in BoE share transactions. In SO, in the October 1838 to endof 1852 period studied in this paper, he was involved in transactions with a higher valuethan any jobber, and higher than the Hoare bank. His presence is far more prominent in
53 Minutes of the Committee for General Purposes of the LSE, 6 April 1846.54 This prohibition was not absolute. It was apparently aimed at preventing LSE members from becoming insolvent
due to other commercial activities, or having their LSE-based insolvency complicated by other financial ties.Thus we find that brokers who were working for the Hoare bank appeared until the mid-1840s to be paid bythat bank, with the brokerage commission split among all the clerks of the bank [25]. Francis Stedman, who dida certain amount of work as a jobber in SSC annuities, most prominently in S1751, was a senior clerk of theSSC.
58 Andrew Odlyzko
the minor gilts, and in BoE shares, than in the major gilts such as CA. This suggests hewas looking for overlooked opportunities in the less active securities. His activities involvedsome apparent repo deals, but he also shows up as a large seller to the CRND and the SSC,and as a buyer and seller when insurance companies carried out large operations. The firstappearance by him that has been found is in the CA jobber ledgers in 1808. By the early1850s he appeared to be scaling down his activities. He died in December 1861 at age 83,leaving an estate of perhaps around £250,000, which, compared to the size of the economy,might be equivalent to £250 million today55. Based on the use of the designations “Sr.”and “Jr.” in ledgers, he must have been the son of William Hammond the Elder, a largejobber around the turn of the 19th century who was apparently the key person behind thecreation of the modern LSE in 1801–180256. William Hammond the Younger did not havea large public presence, but was active and clearly respected at the LSE. He was Vice-Chairman of the Committee for General Purposes for a while, an auditor of the Trusteesand Managers for a decade, and was Chairman of the LSE retirement fund. Unlike someof the other people whose accounts we see, such as the Hoares or the Rothschilds, he wasa member of the LSE, but his activities do not look like those of the regular jobbers, withvery few small transactions, and many more involving other wealthy players (such as theHoares and the Rothschilds). Since those of his investments that are visible to us are justone facet of his activities, and might have involved all sorts of special conditions commonamong market dealers, we can’t conclude much about his investment prowess, except tonote that the size of his estate indicates he must have been successful.
21 Conclusions
This paper demonstrates the opportunity for obtaining deeper knowledge of British secu-rities markets of the 19th century through the study of gilts ledgers in the BoE Archive.Various basic statistics for the operations of the LSE that were totally unknown, such asturnover rates, and the cost of that institution, have been derived. Estimates have alsobeen obtained for the degree to which published price reports reflected market transac-tions. The LSE turned out to be an important, and probably key, element of the Londonmoney market, not just a place for trading of long-term investments.
The detailed results of this paper are derived primarily from data for the 1840s, andjust for gilts trading. Still, that was still a time when gilts trading dominated the LSE, sothey tell us much about the entire institution. Further, since the institutional arrangemets
55 South London Chronicle, 5 April 1862, p. 7 reported that his personal property was listed as “under £250,000,”so it was probably not much under. Estate accounts of this type excluded real estate, so he may have been farwealthier.
56 The elder Hammond was consistently listed in first place in various documents about the setting up of the LSE,and he presided over the meetings of the Trustees and Managers of the LSE until his resignation in 1833, shortlybefore his death the next year at age 85. He had the maximal permitted holding of 4 out of the 400 shares ofthe LSE. It should be mentioned that there were two other Hammonds active at the LSE at about the sametime as the younger William, namely Anthony and Charles, and it is not known what their family connections,if any, were. Charles was listed in some directories as a broker, and he did a substantial business in CA in the1837–46 period, about 70% as large as William. Anthony was a partner to William for a while, and was oneof the Trustees and Managers of the LSE at the time of his death in 1843. One of the two sons of the youngerWilliam, George Dighton, was also a jobber starting in the 1840s.
Financialization of British economy 59
and cultures of finance are remarkably persistent (as shown, for example, by the workof Attard [6], where he found “continuity in the pattern, organisation and dynamics oftrading activity in the [LSE] during the century from the 1870s”), we can expect manypatterns to apply in later Victorian times. Especially since brokers and jobbers couldand did change areas they specialized in, we can also expect certain commonality in theprocesses used in different LSE submarkets, as well as in such things as jobber earnings.Hence by extrapolating from the findings of this paper, ideally supplemented by similarstudies of gilts trading later in the 19th century, we should be able to obtain a betterpicture of the functioning of the LSE at that time.
Acknowledgments
The many individuals and institutions that assisted in the project on technology bubblesfrom which this paper is derived are listed at
〈http://www.dtc.umn.edu/∼odlyzko/doc/mania-ack.html〉.
Special thanks for assistance crucial for this paper are due to Mai Duong for help withdata transcriptions, to the Bank of England Archive and their staff, and to C. Hoare & Co.and their archivist, Pamela Hunter. The Bank of England and C.Hoare & Co. graciouslyallowed the publication of the data presented here.
60 Andrew Odlyzko
References
1. Anonymous, The System of Stock-Jobbing Explained. Exposing the Ground of the Art,Secret Maneuvres, Tricks and Contrivances, ...: Proving, that to Gambling at the Stock-Exchange May be Traced the Cause of the Present Alarming Distress ..., “by A PracticalJobber,” C. Chapple, 1816.
2. Anonymous, An Expose Touching the Various Mysteries of the Bank – Stock Exchange –Bankers – Bankers’ Clearing House – the Minister - and the Public, ..., J. J. Beresford,1821.
3. Anonymous, The Stock Exchange and its Victims, “by Dot,” C. Cox, 1851.4. G. D. Atkin, House Scraps, 1887.5. B. Attard, “The jobbers of the London Stock Exchange: An oral history,” Oral History,
vol. 22, no. 1, Spring 1994, pp. 43–48.6. B. Attard, “Making a market. The jobbers of the London Stock Exchange, 1800–1986,”
Financial History Review, vol. 7, 2000, pp. 5–24.7. W. Bagehot, Lombard Street: A Description of the Money Market, Scribner, Armstrong
& Co., 1873.8. A. M. Carlos and L. Neal, “The micro-foundations of the early London capital mar-
ket: Bank of England shareholders during and after the South Sea Bubble, 1720–25,”Economic History Review, vol. 59, no. 3, August 2006, pp. 498–538.
9. A. C. Carter, Getting, Spending and Investing in Early Modern Times, Van Gorcum,1975.
10. J. Clapham, The Bank of England: A History, Cambridge Univ. Press, 1944.11. G. Clare, A Money-market Primer, And Key to the Exchanges, 2nd ed., Effingham
Wilson, 1896.12. W. A. Cole, “The relations between banks and stock exchanges,” Journal of the Insti-
tute of Bankers, vol. 20, part 7, October 1899, pp. 395–419.13. L. Davis and L. Neal, “Micro rules and macro outcomes: The impact of microstructure
on the efficiency of security exchanges: London, New York, and Paris, 1800–1914,”American Economic Review, vol. 88, 1998, pp. 40–45.
14. K. F. Dixon, The Development of the London Money Market 1780-1830, Ph.D. thesis,London School of Economics, 1962. Available electronically through the British Library.
15. C. Duguid, The Story of the Stock Exchange: Its History and Position, Grant Richards,1901.
16. C. Duguid, The Stock Exchange, Methuen, 1904.17. D. M. Evans, The City; or, The Physiology of London Business; with Sketches on
’Change, and at the Coffee Houses, Baily Brothers, 1845.18. J. Francis, Chronicles and Characters of the Stock Exchange, Willoughby, 1849.19. R. Giffen, “The Stock Exchange Clearing House,” J. Statistical Society of London,
vol. 37, June 1874, pp. 245–51.20. J. W. Gilbart, The London Bankers. An Analysis of the Returns ... by the Private and
Joint Stock Banks of London ..., Smith, Elder, & Co., 1845.21. J. W. Gilbart, A Practical Treatise on Banking, 6th ed., Longman, Brown, Green and
Longmans, 1849.
Financialization of British economy 61
22. R. W. Goldsmith, Comparative National Balance Sheets: A Study of Twenty Countries,1688–1978, Univ. Chicago Press, 1985.
23. H. P. R. Hoare, Hoare’s Bank: A Record, 1673 - 1932, C. Hoare & Co., 1932.
24. S. Homer and R. Sylla, A History of Interest Rates, 3rd ed., Rutgers Univ. Press, 1996.
25. V. Hutchings, Messrs Hoare Bankers: A History of the Hoare Banking Dynasty, Con-stable, 2005.
26. M. King, The End of Alchemy: Money, Banking, and the Future of the Global Economy,Norton, 2016.
27. W. T. C. King, “The extent of the London discount market in the middle of thenineteenth century,” Economica, new ser., vol. 2, no. 7, August 1935, pp. 321–326.
28. W. T. C. King, History of the London Discount Market, George Rutledge & Sons, 1936.
29. I. Klaus, Forging Capitalism: Rogues, Swindlers, Frauds, and the Rise of Modern Fi-nance, Yale Univ. Press, 2014.
30. D. T. A. Kynaston, The London Stock Exchange, 1870–1914: An Institutional History,Ph.D. thesis, London School of Economics, 1983. Available electronically through theBritish Library.
31. E. C. Maddison, On the Stock Exchange: An Explanation of Stocks and Stock-jobbing,And a Manual of Stock Exchange Practice and Customs, Layton, 1877.
32. R. C. Michie, The London and New York Stock Exchanges, 1850–1914, Allen & Unwin,1987.
33. R. C. Michie, “Different in name only? The London Stock Exchange and foreignbourses, c. 1850–1914,” Business History, vol. 30, no. 1, 1988, pp. 46–68.
34. R. C. Michie, The London Stock Exchange: A History, Oxford Univ. Press, 1999.
35. E. V. Morgan and W. A. Thomas, The Stock Exchange: Its History and Functions,Elek Books, 1962.
36. T. Mortimer, Every Man His Own Broker; Or, A Guide to the Stock-exchange, 14thed., W. J. and J. Richardson, 1807.
37. A. L. Murphy, “’Writes a fair hand and appears to be well qualified’: The recruitmentof Bank of England clerks, 1800–1815,” Financial History Review, vol. 22, no. 1, 2015,pp. 19–44.
38. L. Neal and L. Davis, “The evolution of the structure and performance of the LondonStock Exchange in the first global financial market, 1812–1914,” European Review ofEconomic History, vol. 10, 2006, pp. 279-300.
39. S. Nishimura, The Decline of Inland Bills of Exchange in the London Money Market1855–1913, Cambridge Univ. Press, 1971.
40. A. M. Odlyzko, “Economically irrational pricing of 19th century British governmentbonds,” available at 〈http://ssrn.com/abstract=2435399〉.
41. A. M. Odlyzko, “Supplementary material for “Economically irrational pricing of 19thcentury British government bonds,”” available at 〈http://ssrn.com/abstract=2435437〉.
42. R. H. I. Palgrave, Notes on Banking in Great Britain and Ireland, Sweden, Denmarkand Hamburg; ... John Murray, 1873.
43. E. T. Powell, The Mechanism of the City: An Analytical Survey of the Business Activ-ities of the City of London, P. S. King, 1910.
62 Andrew Odlyzko
44. E. T. Powell, The Evolution of the Money Market (1385–1915): An Historical andAnalytical Study of the Rise and Development of Finance as a Centralised, Co-ordinatedForce, Financial News, 1915.
45. R. S. Sayers, Lloyds Bank in the History of British Banking, Oxford Univ. Press, 1957.46. W. M. Scammell, The London Discount Market, Elek Books, 196847. P. Sraffa and M.H. Dobb, eds., The Works and Correspondence of David Ricardo,
Cambridge Univ. Press, vol. 6, 1952.48. P. Temin and H.-J. Voth, Prometheus Shackled: Goldsmith Banks and England’s Fi-
nancial Revolution After 1700, Oxford Univ. Press, 2013.49. W. A. Thomas, The Stock Exchanges of Ireland, Francis Cairns, 1986.50. United Kingdom, “Exchequer Bills Forgery. Report of the Commissioners,” Parliamen-
tary Papers 1842 [409] XVIII.139.51. United Kingdom, “Report from the Select Committee on Bank Acts; ...,” Parliamen-
tary Papers 1857 Session 2 (220) (220-I) X Pt.I.1, X Pt.II.1.52. United Kingdom, “London Stock Exchange Commission. Report of the commission-
ers,” Parliamentary Papers 1878 [C.2157] [C.2157-I] XIX.263, 295.53. United Kingdom, “National Debt. Report by the Secretary and Comptroller General
of the Proceedings of the Commissioners for the Reduction of the National Debt, from1786 to 31st March 1890,” Parliamentary Papers 1890-91 [6539] XLVIII.511.
54. United Kingdom, National Debt Office, A Summary of the Minutes of the Commis-sioners for the Reduction of the National Debt, 1786–1860, Her Majesty’s StationaryOffice, 1961.
55. D. Wainwright, Government Broker: The Story of an Office and of Mullens & Co.,Matham Publishing, 1990.