Financial System Stability Review2011
101
Central Bank of Sri Lanka Financial System Stability Review 2011
Transcript of Financial System Stability Review2011

Central Bank of Sri Lanka
Financial SystemStability Review2011

Financial System
Stability Review
2011
Central Bank of Sri LankaDecember 2011

ISBN 978 - 955 - 575 - 234 - 3
Printed at the Central Bank Printing Press, No. 58, Sri Jayewardenepura Mawatha, Rajagiriya and
Published by the Central Bank of Sri Lanka, Colombo 1.

iii
Financial System Stability Review 2011
ContentsPage
Governor’s Message … … … … … v
Financial System Stability and the Role of the Central Bank of Sri Lanka … vii
Introduction to the Financial System Stability Review 2011 … … ix
Financial System Stability Committee … … … … xi
Chapter 1 – Overall Stability Assessment … … … … 1
Chapter 2 – Macroeconomic Development … … … … 19
Chapter 3 – Financial Markets … … … … … 27
Chapter 4 – Banking Sector … … … … … 39
Chapter 5 – Other Financial Institutions … … … … 59
Chapter 6 – Financial Infrastructure … … … … 83
List of Box ArticlesPage
Box 1 – Financial Stress Indicator for Sri Lanka … … … … 6
Box 2 – Macro Stress Testing: A Credit Risk Model for the Banking System … 12
Box 3 – Exchange Traded Funds … … … … … 36
Box 5 – Basel III – Recent Developments … … … … 50
Box 4 – Customer Charter of Licensed Banks … … … … 57
Box 6 – Finance Business Act … … … … … 67
Box 7 – Mobile Phone Based Payment Systems … … … … 86

v
Financial System Stability Review 2011
Governor’s Message
In 2011, Sri Lanka’s financial system continued to remain stable and resilient, sustained by strong domestic economic growth, despite the increasingly turbulent global economic and financial environment. Credit grew robustly under the favourable domestic macroeconomic conditions to support the expansion in economic activities. The overall soundness of Sri Lanka’s financial institutions was strengthened, with growth in assets, higher capitalization, adequate liquidity buffers, low risk levels and healthy earnings.
During the year, the regulatory and prudential framework of the financial sector focused on capital enhancements and improvements to corporate governance and risk management infrastructure. The new Finance Business Act that came into effect in 2011, strengthened the law to combat unauthorized deposit-taking while improving the regulation of finance companies. Substantial progress was made in resolving the problems of distressed finance companies through restructuring and recapitalization to enable those companies to continue business operations and meet their obligations to depositors and creditors. A Customer Charter to be followed by Licensed Banks was introduced to safeguard the rights of customers as result of banks being required to adopt a code of conduct. With a view of addressing risk in an organization wide framework, banks were also required to adopt an integrated risk management framework. In addition, regulations were issued to facilitate mobile phone payments.
In the meantime, steps were taken to amend the Banking Act in the near future to enable consolidated supervision of banking groups, to facilitate mergers and acquisitions, and to strengthen bank resolution measures. The proposed Microfinance Act was also finalized and such new Act is expected to provide for a separate authority to regulate micro-finance institutions in order to strengthen their viability and to protect the interest of depositors and customers.
The main task ahead of the financial sector and regulators will be to deliver inclusive growth and stability in a challenging environment. To facilitate such an outcome, the financial sector will need to position itself to support the growth path of the economy and enhance its resilience to face the potentially greater risks of the future. Innovative strategies will have to be adopted to increase the capacity of the financial system to serve all sectors of the economy. Considerable institutional building and financial infrastructure development will also be necessary. The development of a vibrant domestic capital market to supplement the banking sector will be vital in order to meet the additional financial needs of the economy. In addition, international financial markets will have to be tapped to a greater degree, in a prudent manner. This will entail more integration with the global financial system, which will of course pose fresh challenges for both financial institutions and regulators. In that context, financial institutions will need to focus on maintaining high credit standards,
vi
Financial System Stability Review 2011
improving their risk management mechanisms, and being comfortably capitalized.
In the above background, the Central Bank will continue to pursue policies for the progressive expansion and development of the financial sector, while strengthening the regulatory, supervisory and macroprudential framework. The Central Bank will also continue to be vigilant
to identify risks and take prompt and necessary action to ensure financial system stability whilst achieving the goals of the economy.
Ajith Nivard Cabraal
GovernorCentral Bank of Sri Lanka
vii
Financial System Stability Review 2011
Maintaining financial system stability together with economic and price stability are the core objectives of the Central Bank of Sri Lanka.
Financial system stability is defined as the ability of the financial system to perform its key functions of resource mobilization and allocation, risk management and the settlement of payments, effectively at all times and even under stressful circumstances.
Financial system stability is founded on the confidence of the public in the financial system. This in turn is based on the soundness, efficiency, robustness and security of financial institutions, financial markets, financial infrastructure and financial regulation.
The stability of the financial system depends largely on the soundness and resilience of the principal components, i.e., financial institutions, financial markets and financial infrastructure to collectively withstand adverse disturbances and shocks.
The financial system in Sri Lanka consists of the following main components:
Financial institutions: Banks, f inance companies, other credit providing institutions (including microfinance institutions), leasing companies, insurance companies, primary dealers, stock brokers/dealers, investment managers, margin providers, stock underwriters, unit trusts, provident and pension funds.
The financial system in Sri Lanka is dominated by the Licensed Banks that account for about two
Financial System Stability and the Role of the Central Bank of Sri Lanka
thirds of the total assets of the financial system.
Financial markets: Money market, bond market, foreign exchange market and the equity market and the derivaties market.
Financial infrastructure: Payment and securities settlement systems, clearing systems and trading platforms. There are also infrastructure service providers, such as credit rating agencies, credit information registries and financial information providers.
Financial regulatory framework: The financial system is governed by a regulatory framework consisting of laws and rules which establish the bounds within which financial institutions, markets and systems must operate.
As the main components of the financial system are inter-connected, risks in one component can spread to another through a contagion effect causing instability in the entire financial system.
Financial system stability is maintained through three ways.
• Regulation and supervision of individual financial institutions, in terms of the regula-tory framework to ensure their soundness. In this regard, Sri Lanka has a multiple regulator system. The Central Bank regulates and supervises the banks, finance companies, leasing companies and primary dealers, while the Securities and Exchange Commission is responsible for supervising the stock exchange and the depository system, stock-brokers/dealers, investment managers,

viii
Financial System Stability Review 2011
margin providers, stock underwriters, unit trust management companies and credit rating agencies. The Insurance Board supervises insurance companies and brokers. The Central Bank is also responsible for the supervision of the payment, clearing and settlement systems. Micro-finance institutions will be brought under the purview of a separate regulatory authority when the proposed Microfinance Act is implemented. The Central Bank works closely with other financial regulators to ensure that financial institutions are regulated and supervised.
• Oversight of the whole financial system, through continuous surveillance, taking into account its interaction with the real economy, to detect systemic risks and threats and implement policies to safeguard the financial system. This is the responsibility of the Central Bank and in carrying out its mandate, the Central Bank works closely with the other financial regulators and the Ministry of Finance to ensure that the stability
of financial system is preserved. The Central Bank’s assessment of financial system stability is made known to the public through the Financial System Stability Review and other publications, as well as through press releases and notices.
• Crisis management and resolution, which relates to measures and safety nets designed to deal with crises in the financial system. Resolution measures include the rehabilitation and restructuring of problem financial institutions through suspension of operations, appointment of a new board of directors and recapitalization of the company. The deposit insurance scheme is a financial safety net which could be used compensate depositors of financial institutions that have gone into liquidation. In situations of imminent panic or crisis which directly threaten financial or monetary stability, the Central Bank, as lender of the last resort, may provide loans to banks that are facing liquidity problems against acceptable collateral.

ix
Financial System Stability Review 2011
In pursuing its objective of maintaining financial system stability, the Central Bank of Sri Lanka conducts surveillance to detect risks to the financial system, assesses its capacity to cope with such threats and implements policies to safeguard the financial system.
The Financial System Stability Review (FSSR), which is published annually since 2004, presents an overall assessment of the risks and threats to the financial system and an evaluation of its capacity to withstand systemic disturbances. The report also includes an account of the regulatory policies and measures taken by the CBSL and other regulators to safeguard the financial system and to strengthen its robustness.
The FSSR 2011 is prepared under the guidance of the Financial System Stability Committee, which is chaired by the Deputy Governor, in charge of financial system stability. The purpose of the FSSR is to provide information to financial market participants and other interested parties to prepare for and to manage these risks, as well
Introduction to the Financial System Stability Review 2011
as to encourage awareness and debate on the issues affecting financial system stability.
FSSR 2011 is based on the performance of the financial sector during the first nine months of 2011, except as otherwise stated. The FSSR 2011 is divided into six chapters. Chapter 1 presents the overall assessment of financial system stability, the potential risks and vulnerabilities that may arise in the future and the risk mitigating measures that should be implemented to address these risks. Chapter 2 discusses the global and domestic macroeconomic developments and risks. Chapter 3 deals with the recent developments in domestic financial markets. Chapter 4 covers the performance of the banking sector, while Chapter 5 deals with the developments in other financial institutions. Chapter 6 provides an overview of the financial infrastructure, particularly the systemically important payment and settlement systems and changes in the regulatory framework relating to the financial sector.

xi
Financial System Stability Review 2011
The Financial System Stability Review 2011 was produced by the Financial System Stability Department under the guidance of the Financial System Stability Committee chaired by the Deputy Governor in charge of Financial System Stability, with contributions from the Bank Supervision Department, Supervision of Non-Bank Financial Institutions Department, Economic Research Department, Payments and Settlements Department, Public Debt Department, Domestic Operations Department, International Operations Department, Exchange Control Department and the Financial Intelligence Unit.
Members of the Financial System Stability Committee(as at 30 November 2011)
1. B. D. W. A. Silva – Deputy Governor, Financial System Stability – Chairman
2. K. G. D. D. Dheerasinghe – Deputy Governor, Price Stability
3. Chandra Premaratne – Assistant Governor
4. P. Samarasiri – Assistant Governor
5. Janaki Mampitiya – Assistant Governor
6. Kumudhini Saravanamuttu – Director, Financial Stability Studies
7. K. D. Ranasinghe – Director, Economic Research
8. Yvette Fernando – Director, Bank Supervision
9. Nelumani Daulagala – Director, Supervision of Non-Bank Financial Institutions
10. Ranjani Weerasinghe – Director, Payments and Settlements
11. Mala Dayaratne – Director, Information Technology
12. R. A. A. Jayalath – Director, Domestic Operations
13. H. A. Karunaratne – Director, International Operations
14. S. S. Ratnayake – Director, Superintendent/Public Dept
15. E. A. Hettiarachchi – Director, Statistics
16. P. H. O. Chandrawansa – Controller of Exchange
17. D. M. Rupasinghe – Director, Financial Intelligence Unit
18. H. P. G. S. Ratnasiri – Additional Director, Financial Stability Studies, Secretary to the Committee
Financial System Stability Committee

xii
Financial System Stability Review 2011
Source : Central Bank of Sri Lanka
Table A Total Assets and Deposit Liabilities of the Financial System
Financial Institution
Assets Deposits
2010 (a)2011
September (b)2010 (a)
2011September (b)
Rs. billion
Share (%)
Rs. billion
Share (%)
Rs. billion
Share (%)
Rs. billion
Share (%)
Central Bank of Sri Lanka (CBSL) 976.7 14.8 1,158.4 15.6 n.a. n.a. n.a. n.a.
Institutions Regulated by the CBSL 4,064.1 61.8 4,620.1 62.2 2,732.2 97.6 3,089.0 98.2
Deposit Taking Instituions 3,784.2 57.5 4,315.8 58.1 2,732.2 97.6 3,089.0 98.2
Licensed Commercial Banks 2,974.6 45.2 3,387.6 45.6 2,153.4 76.9 2,425.7 77.1
Licensed Specialised Banks 576.0 8.8 627.2 8.5 432.6 15.5 481.0 15.3
Registered Finance Companies 233.6 3.6 301.0 4.1 146.1 5.2 182.3 5.8
Other Financial Institutions 279.9 4.3 304.3 4.1 n.a. n.a. n.a. n.a.
Primary Dealers 125.8 1.9 149.6 2.0 n.a. n.a. n.a. n.a.
Specialised Leasing Companies 154.1 2.3 154.7 2.1 n.a. n.a. n.a. n.a.
Institutions not Regulated by the CBSL 1,537.8 23.4 1,643.6 22.1 66.8 2.4 55.9 1.8
Deposit Taking Institutions 61.4 0.9 59.8 0.8 66.8 2.4 55.9 1.8
Rural Banks (c) 54.7 0.8 52.8 0.7 62.0 2.2 51.4 1.6
Thrift and Credit Co-operative Societies (c) 6.7 0.1 7.0 0.1 4.8 0.2 4.5 0.1
Contractual Savings Institutions 1,401.5 21.3 1,516.3 20.4 n.a. n.a. n.a. n.a.
Employees’ Provident Fund 902.0 13.7 987.0 13.3 n.a. n.a. n.a. n.a.
Employees’ Trust Fund 125.9 1.9 137.3 1.8 n.a. n.a. n.a. n.a.
Approved Private Provident Funds (d) 126.2 1.9 115.1 1.6 n.a. n.a. n.a. n.a.
Public Service Provident Fund 25.7 0.4 27.2 0.4 n.a. n.a. n.a. n.a.
Insurance Companies (e) 221.7 3.4 249.8 3.4 n.a. n.a. n.a. n.a.
Other Financial Institutions 74.9 1.1 67.5 0.9 n.a. n.a. n.a. n.a.
Stock Broking Companies (f) 13.2 0.2 14.6 0.2 n.a. n.a. n.a. n.a.
Unit Trusts / Unit Trust Management Companies (f) 23.0 0.3 27.8 0.4 n.a. n.a. n.a. n.a.
Market Intermediaries (f) (g)* 37.0 0.6 23.8 0.3 n.a. n.a. n.a. n.a.
Credit Rating Agencies (f) 0.1 0.0 0.2 0.0 n.a. n.a. n.a. n.a.
Venture Capital Companies 1.6 0.0 1.2 0.0 n.a. n.a. n.a. n.a.
Total Assets 6,578.6 100.0 7,422.0 100.0 2,798.9 100.0 3,144.9 100.0
(a) Revised.
(b) Provisional.
(c) Registered with the Department of Co-operative Development.
(d) Registered with the Department of Labour.
(e) Regulated by the Insurance Board of Sri Lanka.
(f) Regulated by the Securities and Exchange Commission of Sri Lanka.
(g) Market Intermediaries include Underwriters, Margin Providers and Investment Managers.
* Excluding the assets of Licensed Banks, Registered Finance Companies and Specialised Leasing Companies which are registered as Market Intermediaries.
n.a. – Not applicable
1
Chapter 1 – Overall Assessment of Financial System Stability
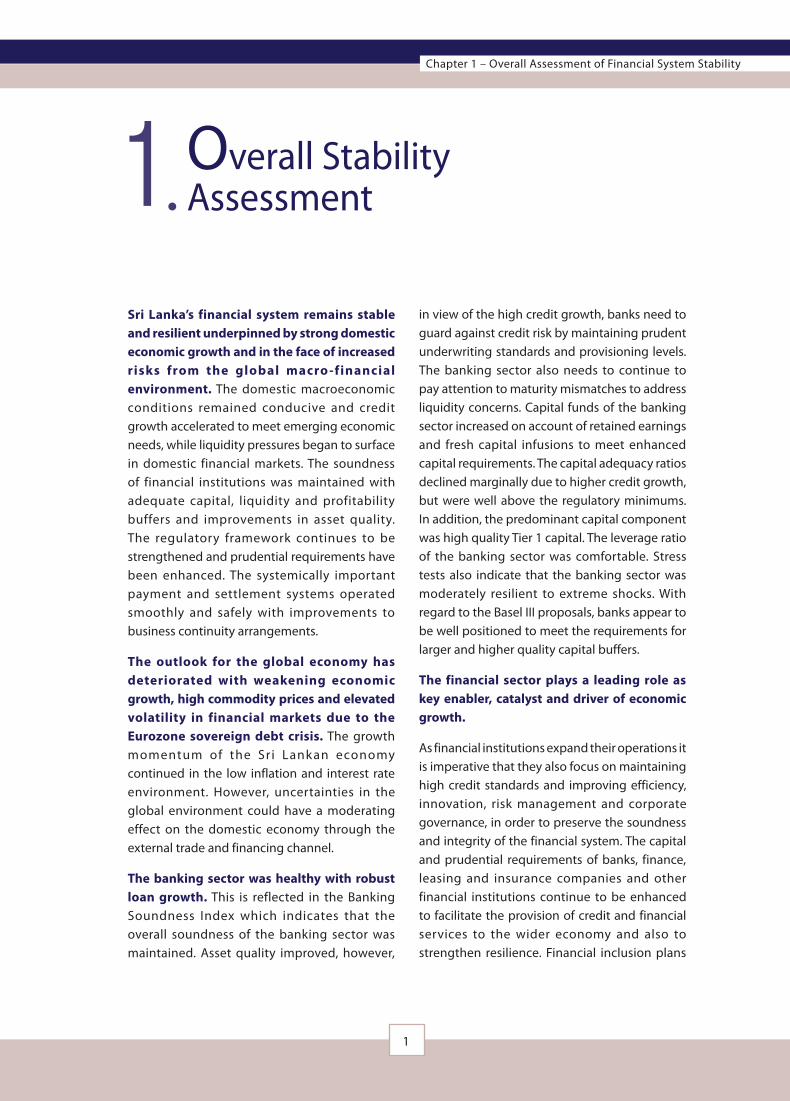
Sri Lanka’s financial system remains stable and resilient underpinned by strong domestic economic growth and in the face of increased risks from the global macro -financial environment. The domestic macroeconomic conditions remained conducive and credit growth accelerated to meet emerging economic needs, while liquidity pressures began to surface in domestic financial markets. The soundness of financial institutions was maintained with adequate capital, liquidity and profitability buffers and improvements in asset quality. The regulatory framework continues to be strengthened and prudential requirements have been enhanced. The systemically important payment and settlement systems operated smoothly and safely with improvements to business continuity arrangements.
The outlook for the global economy has deteriorated with weakening economic growth, high commodity prices and elevated volatility in financial markets due to the Eurozone sovereign debt crisis. The growth momentum of the Sr i Lank an economy continued in the low inflation and interest rate environment. However, uncertainties in the global environment could have a moderating effect on the domestic economy through the external trade and financing channel.
The banking sector was healthy with robust loan growth. This is reflected in the Banking Soundness Index which indicates that the overall soundness of the banking sector was maintained. Asset quality improved, however,
in view of the high credit growth, banks need to guard against credit risk by maintaining prudent underwriting standards and provisioning levels. The banking sector also needs to continue to pay attention to maturity mismatches to address liquidity concerns. Capital funds of the banking sector increased on account of retained earnings and fresh capital infusions to meet enhanced capital requirements. The capital adequacy ratios declined marginally due to higher credit growth, but were well above the regulatory minimums. In addition, the predominant capital component was high quality Tier 1 capital. The leverage ratio of the banking sector was comfortable. Stress tests also indicate that the banking sector was moderately resilient to extreme shocks. With regard to the Basel III proposals, banks appear to be well positioned to meet the requirements for larger and higher quality capital buffers.
The financial sector plays a leading role as key enabler, catalyst and driver of economic growth.
As financial institutions expand their operations it is imperative that they also focus on maintaining high credit standards and improving efficiency, innovation, risk management and corporate governance, in order to preserve the soundness and integrity of the financial system. The capital and prudential requirements of banks, finance, leasing and insurance companies and other financial institutions continue to be enhanced to facilitate the provision of credit and financial services to the wider economy and also to strengthen resilience. Financial inclusion plans
Overall Stability Assessment1

Financial System Stability Review 2011
2
should be implemented. The development of the domestic capital market and new financial products are also priorities. New challenges will emerge, particularly with the easing of the capital account restrictions and financial innovation which warrant continued monitoring by the regulatory authorities. The CBSL and other regulatory authorities will remain vigilant and stand ready to undertake the necessary measures to safeguard the stability of the financial system in Sri Lanka.
Global Developments Global economic growth has slowed down and downside risks have risen.
The multispeed global recovery process weakened during 2011 due to a confluence of factors such as a significant rise in energy, food and commodity prices, the Euro zone sovereign debt crisis, fiscal consolidation effects, structural issues and weaker demand in some advanced economies, the slow pace in addressing global imbalances and the earthquake and tsunami in Japan. As a result, world trade has also slowed down considerably. Consequently, the International Monetary Fund (IMF) revised its forecast for global economic growth downwards to about 4 per cent in 2011 and 2012, from over 5 per cent in 2010. Economic recovery continues to be uneven. Growth in the major advanced economies has faltered and is projected to be below 2 per cent in 2011, while growth in emerging and developing economies has moderated slightly to around 6 per cent. Developing Asia (including China and India) is expected to record a growth of about 8 per cent. With the escalation of the Euro zone sovereign debt crisis and its prolonged resolution, there is a possibility that some advanced countries could slip into recession. This would further drag down growth prospects of emerging and developing economies.
Risks to global financial stability increased significantly with the spiraling of the Euro zone sovereign debt crisis.
Systemic tensions escalated as Euro zone countries with high public debt burdens came under increased scrutiny about their fiscal sustainability. Initially, the focus was on the re-emergence of sovereign debt crisis in Greece and Portugal causing severe strains in global financial markets. Market concerns also extended to larger Euro zone countries with vulnerable sovereign debt positions like Italy and Spain. This financial contagion spread to other Euro countries, such as France, Belgium, Netherlands and Finland. Spreads on sovereign bonds and premia on credit default swaps of many Euro zone countries rose markedly. The European authorities introduced a package of measures to reduce short-term financial instability and to tackle the solvency concerns of banks with large exposures to these countries. The measures included the enlargement of the lending capacity of European Financial Stability Fund (EFSF), voluntary write-downs on Greek debt held by investors at discount of 50 percent and funds to the build up the capital buffers of banks. In addition, the European Central Bank also extended its Securities Market Programme to Italy and Spain. However, these measures failed to allay worsening sentiments and market strains, as investors were worried whether these packages provided adequate support for troubled sovereigns and banks. Furthermore, sovereign debt problems were not confined to the Euro countries. The extended approval process for raising the US debt ceiling also added to investor uncertainty. Both the US and Japan had a rating downgrade on sovereign debt. According to IMF estimates, the average gross public debt to GDP ratio for advanced countries has breached 100 per cent mark. The underlying causes of the sovereign debt problems such as unsustainable imbalances and lack of competiveness need to be addressed

3
Chapter 1 – Overall Assessment of Financial System Stability
monetary policy continued to be supportive of economic activity. The US Federal Reserve indicated that policy rates will remain low till mid 2013 at least. The European Central Bank has expanded liquidity operations and the central banks of Japan and Switzerland have also eased monetary conditions amid deflationary pressures on account of appreciating currencies. Inflation is forecast to moderate in 2012 as oil and food prices are expected to stabilize at current levels. However, uncertainty prevails and upside risks persist due to the increasing financialization of commodity markets and political tensions in the Middle East and North Africa. The IMF estimates that inflation would be around 7.5 per cent in 2011 and decline to around 5.9 per cent in 2012 for emerging and developing economies, while inflation in advanced economies was forecast at 2.6 per cent in 2011 and 1.4 per cent in 2012.
Domestic Macroeconomic Developments Economic growth momentum is expected to be sustained.
The Sri Lankan economy is projected to grow by 8.3 per cent in 2011 slightly over the 8 per cent growth rate achieved in 2010, underpinned by conducive macroeconomic conditions, higher capacity utilization, expanded economic activity in the Northern and Eastern provinces and increased external trade. GDP (output) growth was 8 per cent in the first half of 2011, driven by the improved performance of the industry sector (10.3 per cent) and services sector (9.1 per cent), while the agriculture sector (-1.8 per cent) experienced a setback due to adverse weather conditions. The continued robust performance of the industry and services sector and the recovery of the agriculture sector are expected to contribute to the growth momentum in the second half of the year. Economic growth is forecast to be sustained at a similar level in
through fiscal consolidation measures and structural reforms.
Renewed stress in global financial markets with sovereign debt and growth concerns.
Rising sovereign debt problems and increased uncertainty about the prospects of the global economy had a dampening effect on global financial markets and investors retreated from risk. There were concerns about the resilience of some banking systems that had large exposures to highly eurozone sovereigns. Wholesale funding conditions for banks became severely impaired and the pressure on already tight credit conditions increased. In debt markets, the spreads widened on the sovereign debt of a range of advanced countries. Spreads on corporate bonds also rose markedly. Global equity markets prices also fell sharply. Emerging economies that had substantial inflows of capital in 2010, experienced a reversal of capital flows due to deleveraging and a reduced risk appetite. Funding costs have also risen. Consistent with risk aversion, there was a “flight to safety” by investors. The prices of safe haven assets such as gold rose significantly. In addition, currencies such as the yen, Swiss franc and US dollar appreciated.
Inflationary pressures are expected to moderate in the future, although upside risks remain.
Headline and core inflation was on the rise in many countries in 2011. Emerging and developing countries experienced higher inflationary pressures due to the rise in energy and food prices in the first half of the year, increased domestic demand pressures and capacity constraints, higher capital flows from advanced countries fuelling asset price inflation. Policy rates in some emerging and developing economies were raised to slow credit growth. Inflationary pressures however declined in most advanced countries and accommodative

Financial System Stability Review 2011
4
deficit towards the targeted level. The public debt to GDP ratio is also expected to decline to 79 per cent in 2011 from 82 per cent in 2010. The share of short-term debt has risen slightly due to higher borrowings through Treasury bills, CBSL provisional advances and an increase in the government’s overdraft with the two state banks. With regard to foreign debt, the share of non-concessional debt has increased partly on account of the international sovereign bond of US $ 1 billion with a maturity of 10 years at 6.25 per cent in July 2011. Half the proceeds of this bond were used to settle high cost domestic debt and the balance proceeds will be utilised to service future debt obligations. The external debt sustainability indicators were below the threshold levels, placing Sri Lanka in the category of a “less indebted country” which indicates that the country is comfortably able to service its future external debt obligations.
The widening trade deficit has put pressure on the balance of payments.
Export earnings increased appreciably and expenditure on imports also rose substantially due to elevated international commodity prices and increased import demand on account of the expansion in economic activity. This resulted in a substantial trade deficit which was offset to some extent by strong growth in remittances and tourism. However, the current account deficit has doubled and is expected to be in the region of about of 7 per cent of GDP in 2011. With regard to the capital account, foreign funds to the government increased, while long-term loans to the private sector declined. Although, foreign direct investment is expected to exceed the US $ 1 billion mark, the overall balance of payments will be in deficit in 2011. Consequently, gross official reserves amounted to US $ 5.9 billion at end December 2011 which was equivalent to 3.6 months of imports. External reserves are an important buffer against the downside risk of a slowdown of exports and capital inflows.
2012 buoyed by strong domestic demand. The downside risks and challenges are a slowdown in global trade which could dampen external demand and less than expected investment flows.
Inflation is expected to remain at single digit levels in the near term.
Inf lation, as measured by the Colombo Consumers Price Index (CCPI), was broadly stable at around the mid single digit levels during 2011. The year on year inflation rate declined to 4.9 per cent in December 2011, while annual average inflation rate was 6.7 per cent. Inflationary pressures were contained on the supply side through a moderation in domestic food prices on account of improvements in supply conditions and a decl ine in the international prices of petroleum and other imported commodities from mid year. In addition, demand pressures were curtailed by the continuous liquidity management efforts by the CBSL which included an increase in the statutory reserve ratio (SRR) of all rupee deposit liabilities of commercial banks in April 2011 to reduce the high excess liquidity. Inflation is projected to be at single digit levels in 2012. However, there are upside risks emanating from possible rises in international commodity prices and domestic demand pressures from high credit growth.
The fiscal consolidation process is continuing and the budget deficit is being gradually reduced.
The overall budget deficit is targeted to be reduced to 7 per cent of GDP in 2011 from 8 per cent of GDP in 2010. Tax revenues are expected to increase due to the expansion in economic activity and the major reforms in the Government Budget for 2011 to simplify the tax system, reduce tax rates and widen the tax base. This coupled with the rationalizing of current expenditure, while maintaining public investment is expected to lower the fiscal

5
Chapter 1 – Overall Assessment of Financial System Stability
Government Securities Market Yield rates in the government securities market have also risen marginally.
Interest rates in the government securities market was broadly stable due in the first nine months of the year. This facilitated the issuance of Treasury bonds of longer term maturities. However, upward pressure on yield rates became evident as market liquidity became constrained in the second half of 2011. The increase was more pronounced in the short-end of the market. The limit for foreign investment in Treasury bills and Treasury bonds was raised from 10 per cent to 12.5 per cent of outstanding Treasury securities in December 2011. The higher foreign capital inflows into the government securities market is expected to contribute towards the stabilization of interest rates in this market. Looking forward, with the anchoring of inflationary expectations, the development of a deeper and more liquid government bond market is also necessary.
Foreign Exchange Market The Rupee depreciated moderately against most currencies.
Increased demand for foreign exchange by importers including the settlement of large petroleum bills led to pressure on the exchange rate in the second half of the year. This required the CBSL to supply foreign exchange to the market to prevent excessive fluctuations. The Rupee depreciated against the US Dollar by 3 per cent following the announcement in the Budget in November 2011 to facilitate export competiveness and in view of the exchange rate adjustments made by other countries. The Rupee has depreciated moderately against all major currencies, except the Indian Rupee at end November 2011. Forward premiums have risen indicating that pressure on the exchange rate remains, but is expected to ease with increased inflows, particularly from tourism, remittances,
Financial Markets Domestic financial markets reflected the tightening of liquidity conditions due to the growing needs of the economy and renewed volatility in global markets
The domestic financial markets, except for intermittent periods of volatility, were broadly stable during the year. Liquidity became constrained and there was upward pressure on interest rates in the second half of the year. The stock market indices declined resulting in a price correction. The recently constructed Financial Stress Indicator (FSI) which is a composite indicator of developments in the different segments of the domestic financial market, suggests a slight increase in stress levels in the near term – Box Article 1 on the Financial Stress Indicator.
Inter-Bank Call Money Market Liquidity conditions in the banking sector have tightened.
The CBSL revised policy rates downwards from 7.25 per cent and 9 per cent to 7 per cent and 8.5 per cent in January 2011 in view of the benign inflation outlook. The surplus liquidity position that prevailed since last year gradually declined during 2011 due to strong credit growth, net foreign exchange sales, repayment of foreign loans and liquidity management measures, including the increase in the Statutory Reserve Ratio from 7 per cent to 8 per cent in April 2011. Inter-bank call money rates moved upwards with the decline in surplus liquidity but remained within the policy rate corridor during most the year. The CBSL increased purchases of Treasury bills to provide required liquidity to the market. Recently, however, overnight rates have moved above the range on some occasions reflecting the further tightening of liquidity.
Financial System Stability Review 2011
6
Financial Stress Indicator for Sri Lanka
Box 1
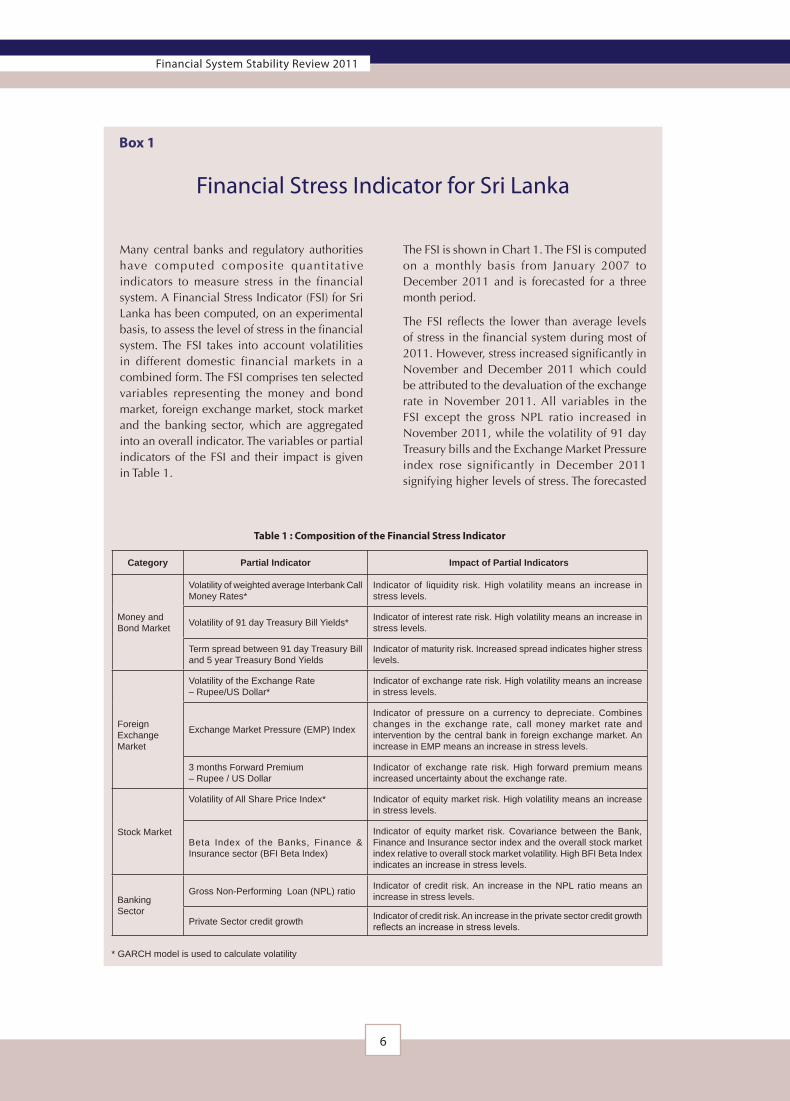
The FSI is shown in Chart 1. The FSI is computed on a monthly basis from January 2007 to December 2011 and is forecasted for a three month period.
The FSI reflects the lower than average levels of stress in the financial system during most of 2011. However, stress increased significantly in November and December 2011 which could be attributed to the devaluation of the exchange rate in November 2011. All variables in the FSI except the gross NPL ratio increased in November 2011, while the volatility of 91 day Treasury bills and the Exchange Market Pressure index rose significantly in December 2011 signifying higher levels of stress. The forecasted
Many central banks and regulatory authorities have computed composite quantitative indicators to measure stress in the financial system. A Financial Stress Indicator (FSI) for Sri Lanka has been computed, on an experimental basis, to assess the level of stress in the financial system. The FSI takes into account volatilities in different domestic financial markets in a combined form. The FSI comprises ten selected variables representing the money and bond market, foreign exchange market, stock market and the banking sector, which are aggregated into an overall indicator. The variables or partial indicators of the FSI and their impact is given in Table 1.
Category Partial Indicator Impact of Partial Indicators
Money and Bond Market
Volatility of weighted average Interbank Call Money Rates*
Indicator of liquidity risk. High volatility means an increase in stress levels.
Volatility of 91 day Treasury Bill Yields*Indicator of interest rate risk. High volatility means an increase in stress levels.
Term spread between 91 day Treasury Bill and 5 year Treasury Bond Yields
Indicator of maturity risk. Increased spread indicates higher stress levels.
Foreign Exchange Market
Volatility of the Exchange Rate – Rupee/US Dollar*
Indicator of exchange rate risk. High volatility means an increase in stress levels.
Exchange Market Pressure (EMP) Index
Indicator of pressure on a currency to depreciate. Combines changes in the exchange rate, call money market rate and intervention by the central bank in foreign exchange market. An increase in EMP means an increase in stress levels.
3 months Forward Premium – Rupee / US Dollar
Indicator of exchange rate risk. High forward premium means increased uncertainty about the exchange rate.
Stock Market
Volatility of All Share Price Index* Indicator of equity market risk. High volatility means an increase in stress levels.
Beta Index of the Banks, Finance & Insurance sector (BFI Beta Index)
Indicator of equity market risk. Covariance between the Bank, Finance and Insurance sector index and the overall stock market index relative to overall stock market volatility. High BFI Beta Index indicates an increase in stress levels.
Banking Sector
Gross Non-Performing Loan (NPL) ratioIndicator of credit risk. An increase in the NPL ratio means an increase in stress levels.
Private Sector credit growthIndicator of credit risk. An increase in the private sector credit growth reflects an increase in stress levels.
* GARCH model is used to calculate volatility
Table 1 : Composition of the Financial Stress Indicator

7
Chapter 1 – Overall Assessment of Financial System Stability
Box 1 (Contd.)
Methodology of the FSI – Sri Lanka
•The first step in the computation of the FSI is to normalise each partial indicator. To account for the time varying mean of partial indicators, it was necessary to identify different samples within the dataset. The ‘Quandt-Andrews Breakpoint Test’ was used to identify one or more breakpoints for each partial indicator. A dataset between two identified breakpoints was considered as one data sample.
•The normalised value of a variable = (XtXtX – µt – µt i,t) / σi,tσi,tσ . Where XtXtX is the value of the indicator in t is the value of the indicator in t
tth time period, µi,t and i,t and i,t σi,tσi,tσ are the time varying i,t are the time varying i,t
mean and the time varying standard deviation values of the correspondent data sample i.
•Each partial indicator was given an equal weight in the FSI.
•The time varying average of the partial indicators is denoted by zero in the FSI. Hence, the FSI above zero indicates a higher than average stress levels and vice versa.
•Partial indicators were forecasted using the ARMA model.
Source : Central Bank of Sri Lanka
Source : Central Bank of Sri Lanka
Jan
Feb
Mar
Apr
May
Jun
Jul
Aug Sep
Oct
Nov
Dec Jan
Feb
Mar
Apr
May
Jun
Jul
Aug Sep
Oct
Nov
Dec Jan
Feb
Mar
Apr
May
Jun
Jul
Aug Sep
Oct
Nov
Dec Jan
Feb
Mar
Apr
May
Jun
Jul
Aug Sep
Oct
Nov
Dec Jan
Feb
Mar
Apr
May
Jun
Jul
Aug Sep
Oct
Nov
Dec Jan
Mar
Feb
-1.00
-0.50
0
0.50
1.00
1.50
2007 2008 2009 2010 2011 2012
Volatility in Interbankcall money market rates
Volatility in 91 daysTreasury Bill rate
Term spread
Volatility in LKR-USDexchange rate
EMP index
3 months forward premium
Volatility in ASPI
BFI beta Index
GrossNPL ratio
Dec-10 Nov-11 Dec-11
-2
-10
1
2
3Private sectorcredit growth
values for the FSI point to slightly higher than average levels of stress in the near term. The movements of the partial indicators is shown in Chart 2.
Chart B1.1 Financial Stress Indicator –Sri Lanka
Chart B1.2 Partial indicators of the Financial Stress Indicator –Sri Lanka

Financial System Stability Review 2011
8
This will also facilitate the introduction of new products, such as exchange traded derivatives. The reform of the stock broker dealer system will also be addressed. The SEC Act is also to be amended to address a number of diverse issues, such as the regulation of demutualised stock and derivatives exchanges, investment banks, over the counter corporate bond markets and the provision of civil sanctions for capital market offences. A framework for the demutualization of the CSE to segregate ownership from trading rights is being prepared.
Corporate Debt MarketThe development of the corporate debt market is required to support the expansion in economic activities.
The corporate debt securities market is small in comparison with the government securities market. There is a need to develop both the short and long term segments of this market to provide alternate funding for financial institutions and corporates. The development of the corporate bond market in particular, will be beneficial to both private and public sector institutions to mobilise funds for medium and long-term investment. Furthermore, the development of a domestic capital market as a supplement to the banking sector would also strengthen the financial system through the diversification of risk and funding sources. The decision to permit foreigners to invest in corporate debt securities will broaden the investor base and add liquidity to the market. While the SEC has in place a regulatory framework for listed corporate debt, the bulk of the debt issues take place or are likely to be in the over the counter (OTC ) market. Hence it is necessary to introduce a regulatory framework for the OTC market which will include disclosure requirements, a price information platform, a dealer–broker system, trading rules and depository and settlement arrangements. In addition, a regulatory framework for asset
direct investments, government long-term loans and capital enhancements of commercial banks.
Stock Market The price indices of the stock market declined, while funds raised through initial public offerings (IPOs) and rights issues increased significantly.
Following the upsurge in the stock market in 2009 and 2010, the equity prices indices moved downwards during most of the year, mainly due to restrictions on credit extended by brokers and exposure limits on bank lending and continued net foreign capital outflows. The decline in the indices resulted in a price correction following the tightening of market liquidity. The current market price to earnings ratio (PER) is considered to be in line with company earnings. The number of companies listed in the market increased. There was also a considerable increase in the amount of funds mobilized from the market through IPO activity and rights issues. The market capitalisation of the Colombo Stock Exchange (CSE) is equivalent to about 35 per cent of GDP, which is still small by regional standards.
The SEC is implementing a number of measures to develop the capital market.
A new Unit Trust Code was introduced which includes the regulatory framework for the introduction of Exchange Traded Funds. The SEC also proposes to stipulate a minimum public float as a continuous listing requirement for companies listed in the Main Board to enhance the liquidity of the market. The major project that is being currently implemented by the SEC and the CSE is the introduction of a risk based margining system and the establishment of a central counter-party clearing arrangement which will enable the migration to a delivery versus payment mechanism for equity transactions in 2012, thereby eliminating settlement risk.

9
Chapter 1 – Overall Assessment of Financial System Stability
Deposits mobilization did not keep pace with loan growth.
Deposit mobilization increased by 12 per cent, while borrowings rose by 14 per cent. Consequently, the credit to deposit ratio rose to 81 per cent at end 3Q/2011 from 76 per cent at year end 2010 and is currently at a comfortable level. However, in view of the rising credit to deposit ratio, unless deposit growth picks up substantially, banks will be increasingly reliant on borrowings to fund credit growth in the future.
Credit risk declined and asset quality improved. However, it is desirable banks should maintain a higher provision coverage ratio as a counter-cyclical buffer.
Credit risk is the main risk faced by banks in Sri Lanka. Hence, a positive development is the decline in non–performing loans (NPLs). Both the gross and net NPL ratio declined to 4.5 per cent and 2.6 per cent at end September 2011. The sectors with NPL ratios higher than the industry average were manufacturing, construction, tourism and trading. The total loan loss provision coverage ratio declined to 55 per cent at end September 2011 from 58 per cent at end 2010. However, it is prudent that banks should have a provision coverage ratio of least 60 per cent in order to strengthen their resilience to credit risk. With regard to investments, over 90 per cent of the banking sector portfolio was in government securities indicating a low level of credit risk.
M aturit y mismatches have increased indicating greater exposure to liquidity risk.
The statutory liquid asset ratio (SLAR) of the banking sector was 34 per cent at end September 2011, which was well above the minimum requirement of 20 per cent. In addition, the liquid assets to total assets ratio was 29 per cent. Both liquidity ratios declined slightly from the 2010 levels due to higher credit growth in the current year. The liquidity ratios reflect to a
backed securities has also to be addressed to facilitate its development in a safe manner.
Corporate SectorThe overall performance of the corporate sector consolidated.
Based on data compiled from non-financial companies listed on the Colombo Stock Exchange (CSE), the financial indicators of the corporate sector were satisfactory. Profitability declined slightly but was at a healthy level at September 2011 compared to the same period last year. This was mainly on account of the lower earnings performance of the Diversified Holdings, Hotels & Travels and Beverage, Food & Tobacco sector due to higher outlays on investment projects. The level of debt in the corporate sector was low, while interest coverage which reflects the debt repayment capacity of companies was at a comfortable level.
Financial Institutions
BanksBank lending accelerated to support the growth momentum.
Credit provided by the banking sector rose by 19 per cent in the first nine months of 2011, compared with an increase of 12.5 per cent in the previous year. The year on year credit expansion was 31 per cent at September 2011 compared with 13 per cent in the previous year. Sectors that recorded high rates of credit growth were agriculture, consumption, financial services and transport, while the housing and construction, trading and manufacturing sector had moderate expansion. The Herfindahl Index which is used to measure sector concentration indicates that bank lending was moderately concentrated with a score of 0.16. The growth in investments decelerated to 5 per cent.

Financial System Stability Review 2011
10
The banking sector remains well capitalized, despite a marginal decline in capital adequacy ratios on account of high credit expansion.
The overall capital funds position of the banking sector strengthened in 2011 enlarging the buffer available for absorbing risks. Capital funds increased by 18 per cent at end 3Q/2011. The risk weighted total capital adequacy ratio (RWCAR) and the Tier I RWCAR under Basle II declined to 14.5 per cent and 13 per cent at end September 2011 due to the higher growth in risk weighted assets. However, both capital ratios were well above the international and domestic regulatory minimum standards. In addition, about 90 per cent of total capital was loss absorbing Tier 1 capital. The leverage ratio (Tier 1 capital to total assets) at 7 per cent was also at a comfortable level. The ratio of net NPL to capital funds declined to 14 per cent indicating an improvement. With regard to the Basel III proposals, banks appear to be well positioned to meet the requirements for larger and higher quality capital buffers.
The Banking Soundness Index indicates that the banking system has been sound and stable over the medium term.
The Banking Soundness Index (BSI) is an aggregate indicator that can be used to assess the soundness of the banking sector over time. The BSI is based on selected financial soundness indicators representing capital, asset quality, profitability, liquidity and sensitivity to market risk. The financial indicators are weighted based on the market share of each bank. The BSI is shown in Charts 1 & 2. The BSI declined marginally from 100.65 in 4Q/2010 to 100.55 in 3Q/2011 mainly due to a decrease in capital adequacy, liquidity and profitability ratios on account of the greater credit growth and a slight decline in interest margins. The BSI indicates that the soundness of the banking sector has improved from mid 2009.
great extent the large portion of investments in government securities. Liquidity risk based on the maturity gap analysis between short-term asset and liabilities shows that the negative gap up to 3 months had increased. The increase in the negative gap was most marked in the 0–7 days bucket. This indicates that banks were more exposed to liquidity risk. As the surplus liquidity position in the market has dried up, banks need to manage the mismatches in the asset liability maturity profile more effectively.
Exposure to market risk was manageable.
In the event of a rising interest rate scenario, banks should be able to re-price their loans to contain their exposure to interest rate risk. In general, banking sector exposure to market risk is not significant due to the low level of trading book activities. However, there has been an increasing trend in exposure to the equity market over the last few years, although it is still at a low level. In addition to existing limits on investments in listed equities, exposure to such asset price fluctuations was further mitigated by a direction issued in 2011 limiting credit to the stock market. The exposure to foreign exchange risk was also low. Furthermore, this risk is contained due to limits imposed by the CBSL on both the long and short net open positions of LCBs. Banks maintain a capital charge for market risk to cover any losses that may arise on their trading portfolio due to adverse fluctuations in prices.
The profitability of the banking sector marginally declined.
The interest margin declined to 4.2 per cent in 2011 from 4.6 per cent in 2010. The growth of net interest income decelerated, while non-interest income contracted. Consequently, profit before tax declined slightly. The profita-bility indicators, such as return on assets (ROA) and return on equity (ROE) also decreased to 1.6 per cent and 19.7 per cent, respectively at end September 2011.

11
Chapter 1 – Overall Assessment of Financial System Stability
A number of directions were issued during the year.
Banks were required to limit their credit exposure to the stock market. Credit facilities on margin finance and loans for share transactions provided to customers were limited to 5 per cent of total outstanding loans within a specified time period. A direction on Integrated Risk Management (IRM) along with guidelines was issued. The guidelines broadly covers the management of credit, market, operational, liquidity and interest rate risks, stress testing and disclosure requirements in an IRM framework, based on standard market practices. A guideline was issued on the Investment Fund Account (IFA). The Budget 2011 reduced the Value Added Tax and Corporate Income Tax of banks and financial institutions from April 2011 and these institutions are required to utilize these tax reductions for specified lending and investment activities.. Banks were required to transfer a proportion of profits to the IFA which could be utilized for long-term investments and lending to prescribed sectors, such as small & medium enterprises, agriculture, information technology, business processing outsourcing, infrastructure development, vocational training and tertiary education. A direction on Customer Charter of Licensed Banks was issued. The direction is intended to require banks to safeguard the
Stress tests based on sensitivity analysis indicate that the banking sector is resilient to withstand shocks.
The CBSL conducts regular stress tests on the banking sector to assess its capacity to cope with extreme but plausible shocks. Stress tests using single factor sensitivity analysis were conducted for credit risk, interest rate risk, foreign exchange risk and liquidity risk shocks to gauge the impact on banks’ capital adequacy and liquidity ratios. The results of the tests indicate that the banking sector is moderately resilient i.e., has adequate capital and liquidity buffers to withstand extreme shocks.
Macro stress testing indicated that the banking sector was adequately capitalized to withstand asset quality shocks stemming from adverse macroeconomic scenarios.
A credit risk model was developed to examine the impact of macroeconomic variables, such as GDP growth rate, unemployment rate and interest rates on the NPL ratio of the banking sector. It was found that GDP growth rate is negatively correlated with the NPL ratio, while the unemployment rate was positively correlated with the NPL ratio. The model can be used to forecast the NPL ratio under different stress scenarios. Box Article 2 on Macro Stress Testing.
Chart 1.1Banking Soundness Index
(2006 Q3 = 100)
Source : Central Bank of Sri Lanka
Chart 1.2 Partial Indicators of theBanking Soundness Index
Source : Central Bank of Sri Lanka
Q3
Q4
Q1
Q2
Q3
Q4
Q1
Q2
Q3
Q4
Q1
Q2
Q3
Q4
Q1
Q2
Q3
Q4
Q1
Q2
Q3
99.0
99.5
100.0
2006 2007 2008 2009 2010 2011
100.5
101.0
101.5
98
99
100
101
102
103Capital Adequacy
Credit Risk
Profitability
Liquidity
Foreign ExchangeRisk
Interest RateRisk
Dec-10 Sep-11

Financial System Stability Review 2011
12
Macro Stress Testing: A Credit Risk Model for the Banking System
Box 2
3. Economic theory suggests that macro economic variables such as GDP growth, inflation, unemployment, interest rates and exchange rate affect the NPLs of banks. For example, a higher GDP growth is expected to enhance the profitability of borrowers and improve their debt servicing capacity, resulting in lower NPLs for the banking sector. A high unemployment rate is expected to result in an increase in NPLs as loan defaults will be more widespread and prevalent. Similarly, higher interest rate is expected to result in higher NPLs as loan installments will be greater.
4. As the first step towards developing a macro stress testing model for Sri Lanka, an Ordinary Least Square (OLS) model was estimated to identify the relationship between macroeconomic variables and the gross NPL ratio of the banking sector. The regression uses quarterly data for the period 2000Q1 – 2011Q2.The regression model was specified as follows:
1. Macro stress testing is a technique used to assess the resilience of the financial system to extreme but plausible macroeconomic shocks. Macro stress testing is a forward-looking tool that could be used to identify systemic risk to the financial sector at an early stage, due to changes in macroeconomic variables.
2. The banking sector is the predominant sector in the financial system and credit risk is the major risk faced by banking institutions. The credit exposures of the banking sector to macroeconomic shocks can be developed through constructing a macroeconomic credit risk model. The model examines the impact of macroeconomic variables on the asset quality of the banking sector. Non- Performing Loans (NPLs) are used in the model to ascertain asset quality. NPLs are defined as loans on which the borrower does not make any payments in respect of interest or principal for a period exceeding three months.
Source : Central Bank of Sri Lanka
Q1
Q4
Q2
Q3
Q4
Q1
Q2
Q3
Q4
Q1
Q2
Q3
Q4
Q1
Q2
Q3
Q4
Q1
Q2
Q3
Q4
Q1
Q2
Q3
0123456789
1011121314
2006 2007 2008 2009 2010 2011 2012
Actual NPL Ratio Scenario I Scenario II Scenario III
Chart B2.1 Forecasted NPL Ratios under Stress Scenarios

13
Chapter 1 – Overall Assessment of Financial System Stability
Box 2 (Contd.)
Source : Central Bank of Sri Lanka
Q1
Q4
Q2
Q3
Q4
Q1
Q2
Q3
Q4
Q1
Q2
Q3
Q4
Q1
Q2
Q3
Q4
Q1
Q2
Q3
Q4
Q1
Q2
Q3
0
2
4
6
8
10
12
14
16
18
2006 2007 2008 2009 2010 2011 2012
Actual CAR Scenario I Scenario II Scenario III
The re gulator y framework governing t h e b a n k i n g s e c t o r c o n t i n u e d t o b e strengthened.
The proposed amendments to the Banking Act have been approved by the Cabinet and will be presented to Parliament shortly. The amendments would provide for the consolidated supervision of banking groups, facilitate mergers and acquisitions for the
rights of their customers which would improve customer confidence in banks and thereby promote stability in the banking sector. Banks are required to adopt a Code of Conduct on customer protection which should be published on their websites and made available to customers on request. The Charter also includes a set of customer obligations.
Chart B2.2 Forecasted CAR under Sterss Scenarios
NPLRt-i = t-i = t-i β0 + β1 GDPGt-i + t-i + t-i β2 UERt-i
+ β3 AWLRt-i
Where, NPLR = NPL ratio (%)
GDPG = GDP growth rate (%)
UER = Unemployment rate (%)
AWLR = Average Weighted Lending Rate (%)
5. Results of the OLS estimation reveal that the NPL ratio of the banking sector is correlated with real GDP growth rate, unemployment rate and interest rate. The real GDP growth rate and NPL ratio show a negative relationship, while the UER is highly correlated with NPL ratio showing a positive relationship. The AWLR and the NPL ratio is also positively correlated.
6. The model was used to forecast the gross NPL ratio under different scenarios.
(a) Scenario I – Real GDP growth rate of 8 per cent, UER reduced by 0.25 per cent and AWLR increase of 100 basis points.
(b) Scenario II – Real GDP growth of 6 per cent, UER increased by 1 per cent and AWLR increase of 200 basis points.
(c) Scenario III – Real GDP growth of 3 per cent, UER increased by 3 per cent and AWLR increase of 300 basis points.
The forecasted gross NPL ratios are shown in Chart 1 and the impact on Capital Adequacy Ratio (CAR) is shown in Chart 2.

Financial System Stability Review 2011
14
their governance and transparency. However, a few RFCs do not meet the regulatory liquidity requirements and need to take remedial action. The borrowings of some NBFI have increased significantly to finance business operations and close monitoring is required to maintain an acceptable of leverage. The high exposure of some RFCs to the stock market is a concern and requires close monitoring.
Measures are being taken to restructure and recapitalize distressed companies.
Of the seven distressed companies, f ive companies are being restructured by way of converting a proportion of deposits into equity capital. Other measures include the injection of capital by a strategic investor and the appointment of a new board of directors. These companies have now commenced normal business operations. The rehabilitation of the other companies is in progress.
The Finance Business Act was passed by Parliament in September 2011.
This law will replace the Finance Companies Act which has several limitations. The new law will combat the problem of unauthorised finance business and deposit- taking through several measures, including widening the definition of deposits to cover a broad range of fund mobilisation activities and strengthening the powers of the Central Bank for the investigation and examination of such unauthorised entities. The regulatory framework for RFCs has been upgraded with enhanced prudential, reporting and compliance requirements. Furthermore, a series of new and revised directions will be issued in line with the recently enacted Finance Business Act. Capital adequacy and liquidity requirements were introduced for SLCs.
The minimum capital requirements for NBFIs is being enhanced on a gradual basis to facilitate business expansion in a sound manner.
consolidation of the banking industry, strengthen bank resolution measures and provide for certain changes necessitated by the Companies Act. In addition, guidelines on Pillar II of Basle II (relating to additional prudential requirements following the supervisory process) have been finalized and will be issued in 2012. The CBSL is also facilitating the adoption of the Sri Lanka Accounting Standards (LKAS) 32 and 39 and Sri Lanka Financial Reporting Standards (SLFRS) 7 relating to the fair valuation of financial instruments and disclosures by Licensed Banks, which will come into effect from 2012. A regulatory framework for Islamic banking is being formulated. An on-line early warning and follow-up system will be implemented in 2012. In addition, the CBSL will introduce a corrective action mechanism based on the supervisory rating system in 2012. Work has also been initiated to implement the Basel III proposals from 2013 to enhance the quality and quantity of capital in line with the systemic risks faced by banks.
Non-Bank Financial Institutions (NBFIs)The financial condition and soundness of the NBFI sector improved.
The financial facilities provided by NBFIs i.e., Registered Finance Companies (RFCs) and Specialised Leasing Companies (SLCs) grew substantially with the sustained growth in finance leasing business. Accommodations expanded by 34 per cent in the first nine months of 2011 compared with an increase of 22 per cent in the same period of the previous year. Profitability rose considerably in the lower interest rate environment and asset quality also improved. Capital levels increased and RWCAR of the industry was above the minimum regulatory requirements. RFCs were required to list on the Colombo Stock Exchange to facilitate capital augmentation and to enhance

15
Chapter 1 – Overall Assessment of Financial System Stability
of amendments to the Regulation of Insurance Industry (RII) Act in January 2011.
The main features include empowering the Insurance Board of Sri Lanka to stipulate capital requirements for insurance companies and brokers, stipulation of fitness and propriety criteria for the board of directors of insurance companies, bringing the National Insurance Trust Fund under the purview of the insurance regulator, appointment of institutional agents and the requirement that long-term and general insurance business should be segregated into separate companies, with existing composite insurance companies being given four years to comply with this requirement. Directions were also issued to amend the solvency margin rules, particularly with regard to the valuation of assets. A major project is the strengthening of risk-based supervision in 2012 and the implementation of a risk-based capital adequacy framework in the medium term.
Unit TrustsThe unit trust industry needs to expand its outreach and product range.
The unit trust industry have received a number of incentives, including concessionary tax rates over the years in order to promote investment in the retail, financial and corporate sector. In 2011 a number of measures were introduced to promote the industry. The SEC issued a directive that 10 per cent of shares of all Initial Public Offering (IPOs) should be allocated to UTs to promote the participation of retail investors in the stock market. Permission has also been granted for foreign investment in all types of unit trusts, which will broaden the investor base and stimulate the formation of different types of unit trusts. A new Unit Trust Code came into effect in 2011. One of the main features is the inclusion of a regulatory framework for Exchange Traded Funds (ETFs) which will facilitate the introduction of these funds in Sri Lanka. ETFs are a type of unit
The core capital requirement of RFCs which is currently Rs. 200 million has been increased to Rs. 300 million by 2013 and Rs. 400 million by 2015. Similarly, the core capital requirements of SLCs has been raised from Rs. 75 million to Rs. 100 million in 2012 and by Rs. 50 million every year up to Rs. 300 million in 2016. A new on-line early warning and follow-up system as well as a new rating system for NBFIs will be developed in 2012. In addition, emphasis has been placed on improving the corporate governance, risk management systems and business standards of NBFIs. The fitness and propriety criteria applicable to directors of NBFIs will also be extended to senior management and key staff.
Insurance Companies The insurance sector recorded a growth in premium income, while the profitability and solvency ratio of general insurance industry has declined.
Premium income for both long-term and general insurance business rose significantly in the first nine months of 2011, the latter due to the growth in motor insurance business. Margins on general insurance however have declined due to increased competition and claims. Insurance companies face an elevated level of market risk on their investment portfolio in the current conditions. Insurance companies are subject to solvency ratio and exposure norms. All insurance companies complied with solvency requirements, although the overall industry ratio for general insurance declined. The minimum capital requirement for each class of insurance business was increased to Rs. 500 million to enable the expansion of the business in a prudent manner. The new minimum capital requirement is applicable to new entrants and existing companies have been given time to comply.
The regulatory framework of the insurance sector was strengthened with the enactment

Financial System Stability Review 2011
16
Diversified Financial GroupsA supervisory framework for diversified financial groups has to be formulated.
The proposed amendments to the Banking Act will facilitate the consolidated supervision of banking groups. In addition, there are a growing number of diversified financial groups that do not include banks that could also pose systemic concerns. The supervision of these entities on a consolidated group-wise basis, taking into account intra-group transactions, risk exposures and corporate governance issues, need to be addressed.
Payment and Settlement SystemsThe systemically important payment and settlement systems operated without disruption and a very high degree of system availability.
The LankaSettle System operated by the CBSL and the Cheque Imaging and Truncation System operated by LankaClear functioned at over 99 per cent availability in 2011. Business continuity arrangements were strengthened and tested.
The Colombo Stock Exchange (CSE) needs to move to a Delivery versus Payment (DVP) system for equity transactions to mitigate settlement risk.
Currently, securities are transferred from the seller ’s account to the buyer’s account on execution of the trade at T, while the seller receives payment on T+3. This exposes the seller and the seller’s broker to a settlement risk, if the buyer defaults on payment. There is also no risk-based margining system. The migration
trust that is traded on an exchange and invests in a basket of securities, assets or commodities that generally seek to track the performance of a specified index or benchmark. The penetration level of unit trusts in Sri Lanka is very low and action needs to be taken to expand outreach and cater to a wider group of investors. Unit trust management companies should conduct more publicity campaigns throughout the country to educate investors and to attract investment. Product innovation is another aspect that needs attention in order to cater to the diverse needs of investors. The unit trust industry also needs to make a concerted effort to expand its distribution network.
Microfinance Institutions A law to regulate and supervise micro-finance institutions will be enacted.
The different categories of micro-finance institutions are currently registered under various laws but are not regulated or supervised according to prudential standards. A separate body called the Microfinance Regulatory and Supervisory Authority will be established to license, regulate and supervise companies, non- government organizations, societies and co-operative societies carrying on micro-finance business. The objectives of authority will be to strengthen the viability and accountability of micro-finance institutions and to ensure that their operations are conducted in a transparent, professional and prudent manner with a view to safeguarding the interests of depositors and customers. Appropriate and effective standards of governance, accounting and disclosure will be enforced. The board of the authority will include representatives of the Ministry of Finance, Central Bank and a professional accounting body.

17
Chapter 1 – Overall Assessment of Financial System Stability
to a DVP system with a clearing house acting as a central counter-party (CCP) to take up the obligation of guaranteeing delivery of securities to the buyer and payment of funds to the seller, will address the settlement risk issue. The SEC and the CSE have commenced work to implement this project.
Regulation of mobile payments and internet banking were initiated.
Guidelines were issued to regulate mobile payments to facilitate the introduction and usage of mobile payment systems. The CBSL issued two guidelines to regulate bank based payment services and custodian account based services in 2011. The CBSL is also in the process
of finalizing internet banking guidelines which will be issued by the end of the year..
Establishment of a national payment switch to facilitate electronic retail payments.
A project has commenced to establish a Common Card and Payment Switch (CCAPS). The CCAPS would be implemented in three phases – Common Automated Teller Machine (ATM) Switch, Mobile Payment Switch and Point of Sales (POS) Switch. The CCAPS would create the backbone infrastructure for all future electronic payments in the country and would avoid duplication and provide benefits to participating banks and customers through economies of scale.

19
Chapter 2 – Macroeconomic Environment
2 MacroeconomicEnvironment
µGlobal economic recovery has been delayed with the resurgence of sovereign debt issues in the euro area and concerns over fiscal sustainability in advanced economies although economic activity in many emerging economies is progressing as expected. However, a sluggish recovery in advanced economies could affect emerging economies through a slowdown in external demand.
µ Inflation continued to rise through the early part of 2011, driven by international commodity prices although it has since moderated in many economies. Prevailing excess capacity in advanced economies could dampen inflationary pressures even as activity picks up while signs of overheating in emerging and developing economies could show less tolerance of inflationary pressures. Substantial policy adjustments have been carried out in many emerging economies to restrain inflation and anchor expectations.
µ However, inflation has been maintained at single-digit levels although some upward movement occurred on account of adverse weather related supply disruptions during the early months of the year. With the restoration of supply and stabilisation of international commodity prices, inflation declined to 4.7 per cent by December 2011.
µ Growth momentum of the Sri Lanka economy continued with the GDP recording a high growth in 2011 despite considerable disruptions to the Agriculture sector. The continued robust performance in Industry and Services sectors together with the recovery in the Agriculture sector is expected to underpin the growth momentum in the period ahead.
µ The external sector further strengthened supported by increased investor confidence brought about by the stable macroeconomic environment, improved financial market conditions, and the gradual recovery of the global economy.
µ On the fiscal front, the budget deficit in 2011 is expected to decline to 7 per cent of GDP from 8 per cent in 2010. This will be the combined outcome of an improvement in tax revenue collection and further rationalising recurrent expenditure, while public investment is expected to be maintained at a level required to sustain the current growth momentum.
µ Improved macroeconomic conditions, together with the low interest rate environment, has spurred domestic credit growth, underpinning the high growth of broad money. Demand pressures however are yet to become apparent as revealed by the moderation in core inflation. The Central Bank nevertheless continues to monitor closely the developments in credit and monetary aggregates.

Financial System Stability Review 2011
20
2.1 World Economy
Economic GrowthThe unravelling concerns about sovereign debt and fiscal performance in the advanced economies is now expected to delay recovery while economic activity in emerging and developing economies is expected to continue broadly on track. As per the World Economic Outlook (WEO) published by the International Monetary Fund in September 2011, projections for global output have been lowered from its projections in June 2011 on account of a steeper downward adjustment to growth prospects of developed countries. During the year 2011 developed economies are expected to expand by around 1.6 per cent, dragged down by the slowed activity in major economies such as the USA, euro area and Japan while some other economies, particularly those closely integrated with emerging Asia, are expected to uphold growth. Growth of emerging and developing economies, although affected by monetary tightening and slowing external demand, is expected to touch about 6.4 per cent. However, in the current context, downside risks to the
Table 2.2 Inflation Prospects
(per cent)
Region / Country
2008 2009 20102011
(Proj.)2012
(Proj.)2016
(Proj.)
Advanced Economies 3.4 0.1 1.6 2.6 1.4 1.8
USA 3.8 -0.3 1.6 3.0 1.2 1.7
Euro Area 3.3 0.3 1.6 2.5 1.5 1.9
UK 3.6 2.1 3.3 4.5 2.4 2.0
Japan 1.4 -1.4 -0.7 -0.4 -0.5 0.8
Developing Asia 7.4 3.1 5.7 7.0 5.1 3.5
China 5.9 -0.7 3.3 5.5 3.3 3.0
India 8.3 10.9 12.0 10.6 8.6 4.1
Source : World Economic Outlook – September 2011
Table 2.1 Economic Growth Prospects
(per cent)
Region / Country
2008 2009 20102011
(Proj.)2012
(Proj.)2016
(Proj.)
World 2.8 -0.7 5.1 4.0 4.0 4.9
Advanced Economies 0.1 -3.7 3.1 1.6 1.9 2.7
USA -0.3 -3.5 3.0 1.5 1.8 3.4
Euro Area 0.4 -4.3 1.8 1.6 1.1 1.7
UK -0.1 -4.9 1.4 1.1 1.6 2.7
Japan -1.2 -6.3 4.0 -0.5 2.3 1.3Emerging and
Developing Economies 6.0 2.8 7.3 6.4 6.1 6.7
Developing Asia 7.7 7.2 9.5 8.2 8.0 8.6
China 9.6 9.2 10.3 9.5 9.0 9.5
India 6.2 6.8 10.1 7.8 7.5 8.1
Source : World Economic Outlook – September 2011
projected growth appear to be more imminent. The WEO highlights four key reasons which give rise to concerns about the progress of the recovery; weak sovereigns and banks in a number of advanced economies; insufficiently strong policy measures to counter the impact of the crisis; vulnerabilities in a number of emerging economies, and geopolitical tensions and volatile commodity prices.
InflationMany economies continued to experience a rise in inflation in 2011 on the back of rising commodity prices but inflation has since moderated alongside a slowing down in commodity prices. Emerging market economies in particular, witnessed a higher increase in their inflation, which could be attributable to both a higher share of food in their consumption basket, and a consequential rise in inflation expectations. Core inflation in emerging economies also increased alongside these movements but appears to be moderating at present. In contrast, core inflation has remained relatively low in major advanced economies while headline inflation has also abated. Prevailing excess capacity in advanced economies could dampen inflationary pressures even as activity picks up while signs of overheating in emerging and

21
Chapter 2 – Macroeconomic Environment
earlier this year to rein in inflation expectations but looming issues over sovereign debt have warranted policy makers to implore the possibilities of reversing these measures to uphold weak economic activity. Policy rates in the UK were maintained unchanged despite firming prices due to concerns over the sustainability of the fiscal situation and the expectation of inflation falling to targeted levels by 2012. Several other economies such as Australia, Canada, Norway and Sweden had already tightened monetary policy earlier as both economic conditions and price pressures strengthened.
Almost all emerging economies have tightened their monetary conditions substantially as economic conditions remained strong and rising inflationary pressures were encountered. Inflation in India persisted at elevated near double-digit levels for a prolonged period surpassing the expected levels while inflationary pressures continued to remain broad based. In one of the most stringent monetary tightening witnessed, since March 2010, India raised the cash reserve ratio by 25 basis points while the policy rates have been raised twelve times - the repo rate by 400 basis points and the reverse repo rate by 350 basis points. China continued to experience near double-digit economic growth driven by strong consumption and investment. To restrain inflationary pressures, China raised its benchmark policy rates 3 times while the required reserve ratio was raised 6 times (with that pertaining to the largest banks increased to 21.5 per cent) in 2011. Continuing further with the policy tightening, Malaysia raised its benchmark policy rate in May 2011 amidst sustained economic growth leading to a possible expansion in domestic demand during the second half of the year nudging inflation higher. Responding to similar concerns, Thailand raised rates on several occasions in 2011 while Indonesia and the Philippines also tightened their policy stance during the year.
developing economies could show less tolerance of inflationary pressures.
Inflation in the period ahead would also depend to a very large extent on the behaviour of commodity prices in the international market. Both energy prices as well as food prices have declined from their peak levels seen earlier in 2011, although energy prices show a more pronounced drop. The FAO Food Price Index published by the Food and Agriculture Organisation (FAO) trended downward since May 2011 but remains at elevated levels well above the peak of 2008 and only marginally below the peak of February 2011. Forecasts by key international agencies envisage food and energy prices to stabilise at around their current levels.
Based on the above expectations, the IMF indicates that inflation in advanced economies is expected to be around 2.5 per cent in 2011 but taper off to about 1.5 per cent in 2012. Meanwhile, inflation in emerging and develop-ing economies would be higher at around 7.5 per cent but would come down to around 6 per cent by 2012. However, any upward risks to the assumptions above may well raise inflation and threaten global recovery.
Monetary ConditionsMonetary conditions continue to remain varied across the regions with advanced economies continuing with an accommodative monetary stance with a view to expand accommodation to uphold economic activity where as emerging and developing economies continued to tighten monetary conditions.
The USA has expressed its commitment to continue holding rates at the current excep-tionally low levels till around mid-2013 in a bid to support the protracted recovery. Similar concerns have arisen in the euro zone area, where the benchmark policy rates were raised

Financial System Stability Review 2011
22
2.2 Domestic Macroeconomic Developments
Economic GrowthThe growth momentum of the Sri Lankan economy is expected to accelerate in 2011 achieving 8.3 per cent growth compared to the growth rate of 8.0 per cent achieved in 2010. This growth is expected particularly from the Industry and Services sectors with higher growth in factory industry output, construction activity together with trade, transport and financial services. Further, the agriculture sector is expected to have a positive contribution to growth, particularly during the second half of the year, with the sector recovering from the negative repercussions of adverse weather conditions that prevailed in the first quarter of the year.
The economy recorded a growth of 8.0 per cent during the first half of 2011. This is particularly significant as it was achieved in a backdrop of unfavourable weather conditions, which contributed towards the 1.8 per cent contraction in the agriculture sector during the period under review. Meanwhile, the higher growth
Global Financial MarketsFinancial markets have come under increasing strain with increased volatility arising from uncertainties about economic recovery and concerns over the developments in the US and more recently, the resurfacing of concerns in the euro area. The sovereign debt rating of the USA was downgraded in 2011 over concerns about its fiscal position while larger countries in the euro area have also been downgraded in addition to Greece, Ireland and Portugal. Similarly, the deepening problems in the euro area and unavailability of coherent policy have resulted in a notable increase in sovereign risk premia for countries such as Italy and France, although to a lesser extent. In this context, the Global Financial Stability Review (GFSR) published by the IMF in September 2011 cautions that for the first time since October 2008 risks to global financial stability have increased.
As expressed in the GFSR, all key risk segments have moved further away from the safe zone compared to the risk position earlier in 2011. Fragile economic growth and heightened risks to the downside have fuelled concerns over debt sustainability in many countries, thus intensifying macroeconomic risk. Higher volatility and the uptrend in yield have challenged investor confidence and also the risk appetite of investors. Withdrawal of investors from these securities also adds further pressure on financing public debt, exacerbating the situation and increasing market and liquidity risks. Credit risks have also heightened as strains in sovereign debt market spill over to other markets. Meanwhile, monetary and financial conditions remain broadly unchanged while risk appetite of investors in markets has contracted as discussed above. In addition, the GFSR also highlights that risks for emerging markets have also increased. Rapid expansion of domestic credit growth, balance sheet re-leveraging, and rising asset prices may ultimately lead to weakening bank asset quality in emerging markets as the credit cycle matures. At the same time, these economies remain vulnerable to external shocks and any resulting reversals of capital flows.
Chart 2.1 Sectoral Growth Rates
0 1 2 3-3 -2 -1 4 5 6 8 97 1110
2011 (1st Half)
2010
2009
Per cent
Agriculture Industry Services
Source : Department of Census and Statistics

23
Chapter 2 – Macroeconomic Environment
deficit expanded to US dollars 1.6 billion mainly due to the increase in import expenditure with higher imports of investment and intermediate goods, mainly due to higher demand from reconstruction and rehabilitation activities in the former conflict affected areas and the continuation of key infrastructure development projects. Imports of consumer goods also increased with rising income levels and reduced tariffs.
Assisted by large fiscal and monetary stimulus policies by governments and inventor y restocking exercises carried out throughout the world, global demand recovered and world trade flows rebounded in 2010. This trend was somewhat checked in 2011 due to renewed fears of a global economic slowdown. However, the growth momentum in emerging market economies helped Sri Lanka to offset partly the setbacks arising from its slowing traditional markets. As a result, for the first eight months of 2011, the external trade continued to remain buoyant despite the withdrawal of EU GSP+ concessions since August 2010. Earnings from exports, which grew by 19 per cent to US dollars 5,416 million in the first eight months of 2010, recorded a growth of 28.6 per cent to US dollars 6,966 million during the first eight months of 2011. The largest contribution to the growth in exports was from the industrial sector, led by significant increases in exports of textile and garments. Expenditure on imports grew by 50.6 per cent to US dollars 12,926 million during the first eight months of 2011, reflecting higher oil prices and higher demand for consumer durables and investment goods, to support the development projects carried out throughout the country, reconstruction activities in the Northern and the Eastern provinces, and the development of the tourism industry and other export oriented industries. As expenditure on imports exceeded earnings from exports, the trade deficit expanded by 88.4 per cent to US dollars 5,960 million in the first eight months of 2011, compared to the corresponding period in 2010.
momentum in industry and services sectors sustained overall GDP growth during the first half of 2011. The industry sector recorded a higher growth of 10.3 per cent during this period with double digit growth in mining and quarrying, electricity, gas and water, and construction sub-sectors while manufacturing, which is the largest sub-sector, recorded a growth of 8.3 per cent. The services sector also recorded a commendable growth of 9.1 per cent during the first quarter of 2011, particularly with increased activity in wholesale and retail trade, hotels and restaurants and transport and communication sub-sectors which also recorded double digit growth. Further, the banking, insurance and real estate sector also recorded a growth of 7.6 per cent during the first half of the year.
In sustaining this higher growth momentum during 2011 and beyond, a favourable and continuous contribution would be required from most sectors of the economy. Hence, both internal and external shocks and set-backs would pose downside risks towards this higher growth momentum. Therefore, the continued flow of investment, which would increase production capacity, and increased market access would be a prerequisite towards achieving this growth. Further, in this high growth path the financial sector would have to play a crucial role in terms of financial intermediation in the economy in a manner which would be conducive towards economic expansion as well.
Developments in the External Sector
The external sector further strengthened during the first half of 2011 supported by increased investor confidence brought about by the stable macroeconomic environment, improved financial market conditions and the gradual recovery of the global economy. However, the outlook remains challenging due to recent global developments. The current account

Financial System Stability Review 2011
24
developments as well as global movements of major currencies, the Sri Lanka rupee appreciated by 1.23 per cent vis-à-vis the US dollar in the first half, while depreciating by 0.54 per cent during the third quarter of 2011. Accordingly, the rupee appreciated by 0.69 per cent vis-à-vis the US dollar in the first nine months of the year. Meanwhile, the rupee depreciated against most major currencies except the Indian Rupee. With the slowing down of foreign exchange inflows, the Central Bank had to intervene in the domestic foreign exchange market to mitigate the high demand pressure for foreign exchange which emanated from higher import demand, particularly for oil imports, and to avoid an undue fluctuation in the exchange rate.
Developments in the Fiscal Sector and Government DebtThe budget for 2011 focused on creating a conducive environment to enhance investment to support the expected higher economic growth while continuing with the fiscal consolidation efforts. In line with these broad objectives, the budget for 2011 introduced several major tax reforms to simplify the tax system while broadening the tax base. On the fiscal consolidation front, the budget deficit in 2011 is expected to decline to 6.8 per cent of GDP from 8 per cent in 2010. This will be the combined outcome of an improvement in tax revenue collection and further rationalisation of recurrent expenditure, while public investment is expected to be maintained at a level required to sustain the current growth momentum.
Government revenue improved during the first eight months of 2011, compared to the same period in 2010, despite the implementation of a series of tax reforms including the reduction in tax rates and the abolition of some taxes. Total government revenue increased by 15.7 per cent to Rs.581.8 billion during this period from Rs.502.9 billion during the same period of 2010. Higher revenue collection reflects the continued
The deficit in the trade account was partially offset by the higher inflows of workers’ remittances and surplus in the services account. Sharp revival in tourism, expansion of freight and port related activities sustained the upturn in the services sector. Facilitated by the measures taken by the government to enhance inward worker remittances, these inflows constitute an important and stable source of external financing for Sri Lanka. Remittances in 2011 have increased notably despite the increasing layoffs across the globe, with inflows increasing by 27 per cent to US dollars 3.38 billion in the first eight months of 2011 compared to the corresponding period of 2010. The current account, which stood at a deficit of US dollars 847.52 million in the first half of 2010, has widened to a deficit of US dollars 1,600 million in the first half of 2011.
Foreign fund inflows to the government in the form of loans, grants and investments in government securities increased during the first eight months of 2011. Improved outlook for the domestic economy coupled with lower international interest rates helped attract higher foreign inflows to the government securities. The positive investor sentiment was further strengthened with the rating agencies upgrading the sovereign rating for Sri Lanka and the successful issue of the fourth international sovereign bond of US dollars 1 billion in July 2011, which was oversubscribed by seven and a half times. Despite subdued inflows of private long-term investments and inflows to the equity market, total inflows to the capital and financial account exceeded the current account deficit. As a result, the overall balance of the balance of payments (BOP) by end August 2011 was US dollars 944 million. The gross official reserves (excluding Asian Clearing Union (ACU) balances) increased from US dollars 6.6 billion as at end 2010 to US dollars 8.1 billion by end August 2011, which was equivalent to 5.4 months of imports.
The exchange rate policy in 2011 focused on maintaining stability in the domestic foreign exchange market. Given the domestic
25
Chapter 2 – Macroeconomic Environment
sources, with the contribution of bank financing to total domestic financing increasing to 60.3 per cent in the first eight months of 2011 from 26.5 per cent during the corresponding period of 2010. Net foreign financing amounted to Rs.120.1 billion compared to Rs.143.8 billion envisaged in the budget for 2011. The proceeds from the International Sovereign Bond, which were utilised for budgetary financing purposes, mainly contributed to the increase in foreign financing during this period.
The total outstanding government debt stock increased by Rs. 514.8 billion during the year to Rs. 5,105 billion as at end August 2011. Domestic debt which comprises around 55 per cent of the total debt stock, increased by Rs. 236.0 billion to Rs. 2,801.7 billion, while the foreign debt stock increased by Rs. 278.8 billion to Rs. 2,303.3 billion. The increase in the foreign debt stock during the year was mainly on account of the issue of the International Sovereign Bond of US dollars 1 billion in July 2011.
Developments in the Monetary Sector
Continuing with the supportive monetary policy stance carried out since 2009, the Central Bank eased its policy rates further in January 2011 to encourage a further downward adjustment in market interest rates to reflect the lowered risk premium in the economy. The Repurchase rate is currently at 7.00 per cent while the Reverse Repurchase rate is at 8.50 per cent following the rate cut by 25 basis points and 50 basis points, respectively, in January. Meanwhile, the high level of excess liquidity that prevailed in the market and its possible adverse implications on both future inflation as well as the soundness of the financial system were a concern. Therefore, the Statutory Reserve Ratio was revised upward by 1 percentage point to 8 per cent in April to withdraw a portion of excess liquidity from the market on a permanent basis. Subsequently, as market liquidity declined further, the Central
expansion in economic activity. Foreign grant receipts during the first eight months of 2011 amounted to Rs.6.1 billion which was lower than the Rs.22.6 billion expected in the budget for 2011. Delays in recording foreign grant receipts and the graduation of Sri Lanka to lower middle income country status are some of the reasons for the lower grant receipts during this period.
During the first eight months of 2011, the government took several measures to curtail recurrent expenditure, while maintaining the public investment programme at a targeted level. As a percentage of estimated GDP, total expenditure and net lending during the first eight months of 2011 declined to 14.3 per cent from 14.6 per cent of GDP during the same period in 2010. Although in nominal terms, current expenditure increased by 8.8 per cent to Rs.691.1 billion, it declined to 10.6 per cent of estimated GDP during the first eight month of 2011 from 11.3 per cent in the corresponding period of 2010. This was mainly due to slower growth in interest payments although the reduction was partly negated by the increase in salaries of public sector employees and pensioners as a result of a special allowance being granted to all public servants and an increase in the monthly cost of living allowance (COLA) of public sector employees in non-staff grades with effect from January 2011.
Accordingly, key fiscal balances also improved during the period under consideration. In the first eight months of 2011, the overall fiscal deficit as a percentage of estimated GDP, declined to 5.3 per cent from 5.6 per cent in the corresponding period in 2010. Further, the current account deficit as a percentage of GDP declined to 1.8 per cent in the eight months to August 2011 from 2.5 per cent in the corresponding period of 2010, while the primary deficit (the overall deficit net of interest payments) increased marginally to 1.4 per cent of GDP during the period under review from 1.3 per cent of GDP in the corresponding period of 2010. Financing the overall deficit was mainly through domestic

Financial System Stability Review 2011
26
Chart 2.2 Deposit Rates of Commercial Banks, Treasury bill yield and Monthly AWPR
Source : Central Bank of Sri Lanka
liquidity conditions in the domestic money market. Nevertheless, the Central Bank will continue to closely monitor the movements in credit and take necessary measures if any imbalances are seen building in the financial sector as well as the economy at large.
InflationInflation, as measured by the year-on-year change in the CCPI (base=2006/07), returned to mid-single digit levels towards mid-year after some upward movement during the early part of the year on account of supply disruptions. Year-on-year inflation was 5.1 per cent in October compared to 6.8 per cent at end 2010 while annual average inflation was 7.1 per cent in October compared to 6.2 per cent at end 2010. Exhibiting a similar trend, core inflation, as measured by excluding fresh food, energy, transport, rice and coconut from the consumer basket, also declined to 5.6 per cent by October. The notable improvements in domestic supply as well as the easing of international commodity prices compared to the early part of the year, helped contain inflationary pressures. Inflation is expected to moderate further during the remaining months of the year.
Bank recommenced the conduct of daily auctions under open market operations in September to stabilise market interest rates. Benefiting from these measures, market interest rates remained broadly stable throughout the first ten months of the year. The growth of credit to the private sector remained high, thereby pushing up the growth of the money supply as well. Credit obtained by the government from the domestic banking sector had also surpassed targeted levels by end August, contributing further to monetary expansion. Average growth of the money supply during the first eight months remained high at 19 per cent compared to the target of 14.5 per cent for the year.
The prevai l ing posit ive macroeconomic environment and enhanced prospects for economic growth spurred credit utilisation, particularly by the private sector. Growth in credit to the private sector accelerated in the second half of 2010 and the trend continued into 2011 with growth increasing from 25 per cent at end 2010 to 34.4 per cent by August 2011. Credit expansion has been broad-based and channelled to all sectors of the economy. Going forward, credit expansion is expected to decelerate towards year end with tightening
Chart 2.3 Movement of Headline and Core Inflation
Source : Central Bank of Sri Lanka
Monthly AWPR
Per c
ent
Dec
07
Feb
08A
pr 0
8Ju
n 08
Aug
08
Oct
08
Dec
08
Feb
09A
pr 0
9Ju
n 09
Aug
09
Oct
09
Dec
09
Feb
10A
pr 1
0Ju
n 10
Aug
10
Feb
11A
pr 11
Jun
11A
ug 11
Oct
10
Dec
10
AWDR T-Bill yield (91-day) AWFDR
0
5
97
11
13
15
17
19
21
23
Per c
ent
Sep
11Ju
n 11
Dec
04
Jun
05
Dec
05
Dec
06
Jun
06
Dec
07
Jun
07
Dec
08
Jun
08
Dec
09
Jun
09
Dec
10
Jun
10
0
5
10
15
20
25
30
Headline (YoY) Headline (Annual Avg.) Core (xFFET+ RC)

27
Chapter 3 – Financial Markets
µThe inter-bank call money market was broadly stable in the first nine months of the year, with call money market rates within the policy rate corridor.
µ The stability of the Sri Lanka Rupee was maintained in the first nine months of 2011, mainly through foreign exchange flows into the government securities market, private remittances, trade related inflows, IMF Stand-By Arrangement, sovereign bond proceeds and supply by the Central Bank of Sri Lanka (CBSL).
µ Yield rates in the government securities market were flat during the first nine months of 2011 in the benign inflation environment.
µ The price indices of the Colombo Stock Exchange (CSE) declined mainly due a price correction, while funds raised by way of Initial Public Offerings (IPOs) and right issues increased significantly during the year.
3.1 Inter-bank Call Money Marketby the policy rates. Open Market Operations (OMO) and standing facilities are among the main instruments used by the CBSL in achieving stability of the benchmark overnight money market interest rate in Sri Lanka.
Since latter part of 2010, the CBSL abstained from conducting overnight repo auctions as a strategy to minimize the adverse consequences arose from the continuation of very high excess liquidity in the banking system. As a result, standing facility had been the main instrument in managing market liquidity position until the CBSL re-commenced conducting overnight auctions in September 2011. Fx-Swaps have also used intermittently during the period. Increase
Inter-bank Call money market facilitates banks to borrow and lend money at interbank rates. The loans in the call money market are very short term in nature and often used to help banks to meet their short-term liquidity requirements. Behaviour in the call money rate for overnight transactions reflects the demand for and supply of liquidity in the market. Implementation of monetary policy primarily aims at influencing the liquidity position in the market with a view to creating a substantial impact on the overnight call market interest rate. The CBSL directs its monetary policy operations aiming at minimizing the persistent deviations of the overnight money market rates from the intended path established
Financial Markets3

Financial System Stability Review 2011
28
of 7.11 per cent, almost in line with repo rate but still behaving closer to the floor of the interest rate corridor. Repurchase and reverse repurchase rates revised downward from 7.25 per cent and 9.00 per cent to 7.00 per cent and 8.50 per cent respectively on 11 January continued since then. The call market rates displayed a parallel drop until about end March 2011 after which the rates reflected a slight upward movement except the sudden drop observed at the end July with the receipt of sovereign bond proceeds.
The average gross transaction volume during the first five months in 2011 was as low as Rs. 6 billion. However, inter-bank call market became more active since mid-June 2011 with increased daily transaction volume, reporting a maximum volume of Rs.22 billion. The daily average of gross transaction volume stood at Rs.14 billion during that period while the weighted average call market rate moved between 7.80 per cent and 8.09 per cent. Continued borrowings by certain domestic banks, intensified the market activities. Reduced excess liquidity and skewed liquidity distribution in the banking system were the main contributors for increased market volume and elevated call rates. However, the spreads between maximum and minimum of the call market rates, narrowed down further from 115 bps (basis points) to 29 bps compared to the same period in 2010 indicating overall stability of call money market activities.
The average spread between inter-bank weighted average call money rate and the weighted average overnight market repurchase rate was about 82 bps in first three quarters of the year 2011 (Chart 3.2). Volatility of the spread was maintained a very low level compared with the same period in years 2009 and 2010, re-emphasizing the continued stability of the money market. Increasing volumes in uncollateralized call market and narrowed credit spreads may be reflecting the growing risk appetite and increasing confidence on the relative credit worthiness of the market
of Statutory Reserve Ratio (SRR) from 7 per cent to 8 per cent, on 29 April 2011 was capable of absorbing around Rs. 18 billion of excess liquidity prevailed in the market permanently. Further, the net foreign exchange sales and repayment of foreign loans have also contributed towards the continued decline in the excess market liquidity.
The market liquidity surplus which was visible throughout 2010 continued during the period ending September 2011 though with a gradual decline. At the beginning of the year 2011, excess market liquidity was as high as Rs. 121 billion and this has declined to Rs. 26 billion by end September. Excess market liquidity recorded its lowest level towards the end July but, the trend was revised with the receipt of sovereign bond proceeds in end July. Accordingly, during the first nine months daily excess liquidity varied from Rs. 20 billion to Rs. 129 billion with an average of Rs. 72 billion. The monthly average of excess liquidity recorded its highest level in January amounting to Rs. 123 billion, but fall in to a low of Rs. 33 billion in September.
The Weighted Average Call Money Rate (WACMR) hovered between 7.57 per cent and 8.11 per cent with an average of 7.90 per cent. Meanwhile, tax adjusted call money rate fluctuated between 6.81 per cent and 7.30 per cent with an average
Chart 3.1 Inter-bank Call Money Market (Interest Rates and Liquidity) – 2011
Source : Central Bank of Sri Lanka
Rate
s (%
)
03 Ja
n18
Jan
02 F
eb17
Feb
04 M
ar19
Mar
03 A
pr18
Apr
03 M
ay18
May
02 Ju
n17
Jun
02 Ju
l17
Jul
01 A
ug16
Aug
31 A
ug15
Sep
30 S
ep
Volu
mes
(Rs
. bill
ion)
2011
6.5
7.0
7.5
8.0
8.5
9.0
9.5
10.0
0
20
40
60
80
100
120
140
Excess Liquidity (Volume) Weighted Average Call Money RateTax Adjusted Call Rate
Repo RateReverse Repo Rate
Middle Rate

29
Chapter 3 – Financial Markets
net open positions of commercial banks, moral suasion, prudential regulations and interventions in the domestic forex market.
CBSL purchased US Dollar 248.44 million from the domestic forex market and sold US Dollar 1,571.79 million resulting in a net sale of US Dollar 1,323.35 million during the first nine months of 2011 with the view of mitigating volatility in the foreign exchange market.
The exchange rate of Sri Lanka rupee in terms of US dollar reported as at 03.01.2011 was Rs.110.96 compared to Rs.110.19 per US dollar reported as at 30.09.2011. Accordingly, appreciation reported in the Sri Lanka rupee against the US dollar was 0.70 per cent during the first nine months of 2011. Further, the Sri Lanka rupee has appreciated against the Indian Rupee and the Sterling Pound, while it depreciated against the Euro and Japanese Yen during the first nine months of 2011.
Trading VolumeThe daily average turnover in the inter-bank FX market (including the forward market) was US dollar 66 million during the first nine months of 2011, with a range of US dollar 19.5 million to US dollar 161.65 million. In the corresponding period of 2010, the daily average turnover was
participants. However, with lower level internal credit limits, the market participation of certain foreign banks remained restrained.
3.2 Domestic Foreign Exchange Market
The Sri Lanka rupee appreciated marginally against the US dollar during the first nine months of the year 2011. The foreign exchange inflows during the period were mainly from IMF standby arrangement, International Sovereign bond issue, foreign investments, private remittances and trade related inflows. However, there were significant outflows of foreign exchange due to continuous increase of imports particularly investment and intermediate goods. Central Bank of Sri Lanka intervened in the domestic foreign exchange market whenever necessary in order to curb the excessive volatility arising from both inflows and outflows of foreign exchange.
Inter-bank Foreign Exchange Market
Exchange RateThe measures taken by CBSL in order to maintain an orderly forex market, were the monitoring of foreign currency transactions and over night
Chart 3.2 Spread between Call Rates and Repo Rates
Source : Central Bank of Sri Lanka
Rate
(%)
-2.0
-1.5
-1.0
-0.5
0.0
0.5
1.0
1.5
2.0
Jan Feb Mar Apr May Jun Jul Aug Sep
2009 Spread 2010 Spread 2011 Spread
Chart 3.3 Movements of Rupee per USD(01.01.2007 – 30.09.2011)
Rup
ees
01-0
1-20
0712
-04-
2007
20-0
7-20
0724
-10-
2007
01-0
2-20
0815
-05-
2008
21-0
8-20
0827
-11-
2008
11-0
3-20
0922
-06-
2009
28-0
9-20
0908
-04-
2010
21-0
7-20
1027
-10-
2010
02-0
2-20
1120
-05-
2011
24-0
8-20
11
88
93
98
103
108
113
118
123
Source : Central Bank of Sri Lanka

Financial System Stability Review 2011
30
during the period was US dollars 30.08 million. However, net increase in reserves recorded as US dollars 108.80 million during the period of January to September 2011 due to favourable exchange rate movements prevailed. The CBSL invested reserves position level was US dollars 6,555.0 million as at end September 2011, which was sufficient for 4.5 months of imports of the country.
3.3 Treasury Bill MarketTreasury bills continued to be the most liquid and largely traded instrument operating in the financial market in 2011, reflecting their popularity as a repo market and short-term investment instrument. Improved conditions in the domestic financial market allowed the Monetary Board to cut policy rates beginning of the year in a bid to stimulate economic growth. The CBSL cut the policy interest rates in January by reducing the repurchase rate by 25 bps to 7 per cent and the reverse repurchase rate by 50 bps to 8.50 per cent. Easing of the monetary policy, benign inflation, increased foreign investor participation in the Treasury bill market, excess liquidity position of the market and downward inflationary expectations kept the Treasury bill yield rates flat during the first
US dollar 47 million, with a range of US dollar 13.87 million and US dollar 142.20 million. The total volume of inter-bank FX transactions, including the forward market transactions, was US dollar 11,884 million in the first nine months of 2011, in comparison to US dollar 8,270.55 million in the respective period of 2010 recording an increase of 43 per cent. The forward volume in the inter-bank FX market increased to US dollar 4,095.17 million (34.46 per cent of total volume) during January to September 2011 from US dollar 2,831.81 million (34.24 per cent of total volume) in the corresponding period of 2010.
Foreign Reserves Total foreign exchange inflows during the period January to September 2011 amounted to US dollars 3,186.74 million. Major inflows during the period were IMF standby arrangements, receipts from International Sovereign bond issue, Sri Lanka Developments Bonds (SLDBs) issuance receipts, foreign exchange purchases from the domestic market, project loans and grants, swap transactions, realized trading profit and interest income and FCBU loans. Total foreign exchange outflows including swap transactions during the period were US dollars 3,216.82 million. The major outflows were foreign exchange sales to the domestic market, debt service payments, payments to SLDBs and FCBUs. Net outflow
Chart 3.4 Daily Inter-Bank FX Volumes (01.10.2010–30.09.2011)
Chart 3.5 Monthly Inter-Bank FX Volumes
Spot, Tom & Cash
Dec
Mar
Jun
Sep
Dec
Mar
Jun
Sep
Dec
Mar
Jun
Sep
Dec
Mar
Jun
Sep
Dec
Mar
Jun
Sep
Dec
Mar
Jun
Sep
Dec
Mar
Jun
Sep
Forward
0
200
2005
US
$ m
illio
n
2006 2007 2008 2009 2010 2011
400
600
800
1,000
1,200
1,400
1,600
1,800
Source : Central Bank of Sri Lanka
Source : Central Bank of Sri Lanka
US $
mill
ion
01 O
ct
25 O
ct
16 N
ov
08 D
ec
30 D
ec
21 Ja
n
14 F
eb
10 M
ar
31 M
ar
05 Ju
l
27 Ju
l
17 A
ug
08 S
ep
27 A
pr
29 S
ep
23 M
ay
13 Ju
n
0
20
40
60
2010 2011
80
100
120
140
160
180

31
Chapter 3 – Financial Markets
Treasury bills with odd maturities in addition to conventional maturities, to fund the Treasury cash flow operations during the first nine months of 2011. These strategies enabled the Central Bank to service the Treasury cash flow smoothly during the period under review.
3.4 Treasury Bond MarketInterest rates in the Treasury bond market remained flat during the course of first nine months of 2011. A large volume of long dated securities was issued during this period. As a result, the weighted average maturity of debt issuance during this period increased to 5.64 years from 3.90 years during the previous year. Accordingly, the weighted average maturity of the outstanding stock increased to 3 years as on 30 September 2011 from 2.48 years as on 30 September 2010.
Foreign investments in Treasury bonds recorded the highest level of Rs. 198.5 billion on a face value basis as at 30 September 2011, with an inflow of Rs. 17 billion during the first nine months of 2011.
During the first nine months of 2011, the PDD was able to issue a Treasury bond with a maturity of 15 years at a yield rate of 9.30 per cent. This enabled the extension of the benchmark yield curve up to 15 years extending it by 5 years compared to last year.
3.5 Corporate Debt Securities Market
Commercial Paper MarketThe commercial paper (CP) market was sluggish in the first nine months of 2011. The total value of CP issued with the support of banks amounted to Rs. 7 billion in the first nine months of 2011 in comparison with Rs. 9 billion in the first nine
nine months of the year. The secondary market Treasury bill yield rates of 3 month were at 7.10 per cent, 6 month at 7.19 per cent and one year at 7.27 per cent by end September 2011.
In the primary market, total gross Treasury bill issues during the first nine months of 2011 amounted to Rs. 533.9 billion registering an increase of 31.4 per cent, while net issues at Rs. 121.9 billion rose by 2.18 per cent from a sum of Rs. 2.6 billion recorded in the same period of the previous year. By end September the Treasury bill outstanding amounted to Rs. 693.6 billion with a maturity profile consisted of 63 per cent of 364 day bills, 26 per cent of 182 day bills and 11 per cent of 91 day bills.
The yield rates of Treasury bills in the primary market showed an overall declining trend during the first nine months of 2011. The primary market weighted average yield rates for 91 days, 182 days, and 364 days Treasury bills which were 7.24 per cent, 7.33 per cent and 7.55 per cent at the beginning of the year, declined to 7.15 per cent, 7.23 per cent and 7.31 per cent respectively at end September 2011.
Foreign investment in Sr i Lank a Rupee denominated Treasury bills continued in 2011 and it led to a significant inflow of funds to the domestic capital market. Favourable interest rate differentials, stability in exchange rate, and overall improvements in the domestic financial market conditions resulted in this steady inflow of funds into the government securities market. These inflows facilitated to stabilize the interest rates in the domestic market and assisted to ease the pressure in the government borrowing programme. Treasury bill holdings of foreign investors increased to Rs. 66.7 billion at end September 2011 from Rs. 53.2 billion at end September 2010.
The Public Debt Department (PDD) continued to use fund mobilization techniques such as pre-funding arrangements, forward funding arrangements, reducing auction size and issuing

Financial System Stability Review 2011
32
Asset Securitization MarketThe asset securitization market is small but is growing steadily. Trust Certificates is an instru-ment for the securitization of lease receivables and is used by Registered Finance Companies (RFCs) and Specialized Leasing Companies (SLCs) to raise medium term funds. The lease agreements are mortgaged to the trustee, which is usually a bank. There are no reporting requirements or regulations relating to this market and hence data is not comprehensive. However, information from a leading trustee bank shows that there were 38 issues of Trust Certificates amounting to Rs. 24 billion for the year up to November 2011 compared to 31 issues amounting to Rs. 13 billion in the corresponding period of 2010. The total outstanding amount of Trust Certificates was Rs. 32 billion.
3.6 Share MarketThe share price indices of the Colombo Stock Exchange (CSE) were on a downward trend for most of 2011. Equity prices rose in the first two months of 2011 but declined thereafter. Consequently, the CSE slipped to Asia’s fourth best performer at end October 2011 from the top position in 2009 and 2010.
months of 2010. The high level of liquidity that prevailed in the banking system and the easy availability of bank credit was largely responsible for the low level of activity in the CP market. The interest rate on CPs declined and varied between 8 per cent to 13 per cent in the first nine months of 2011 from a range of 7 per cent to 16 per cent in the corresponding period of 2010. CPs with a maturity of 3 months accounted for 82 per cent of the market, while the share of CPs of 6 month maturity was 13 per cent. The total outstanding value of CPs amounted to Rs. 4.2 billion as at end September 2011 compared to Rs. 3.7 billion at the end of September 2010.
Corporate Bond Market
There was one new issue of debentures (by way of introduction) listed on the Colombo Stock Exchange in the first nine months of 2011 which raised Rs. 204 million. A number of debenture issues are in the pipeline particularly by financial institutions and will be issued in the latter part of the year. The trading turnover of debentures listed on the Debt Securities Trading System (DEX) of the Colombo Stock Exchange (CSE) rose to Rs. 2.7 billion in the first nine months of 2011 from Rs. 53 million in the same period of 2010.
Chart 3.7 Listed Debenture Issues
Rs.
billi
on
0
2
4
6
8
10
12
14
16
18
2006 2007 2008 2009 2010 2011(Jan-Sep)
0
1
2
3
4
5
6
7
8
Value of Debenture Issues (Left Axis)No. of Issues (Right Axis)
Source : Colombo Stock Exchange
Chart 3.6Commercial Paper Issues
(Supported by Commercial Banks)
Rs.
billi
on
0
4
8
12
16
20
24
28
32
2006 2007 2008 2009 2010 2011(Jan - Sep)
< 3 Months Maturity 6 Months Maturity > 6 Months Maturity
Source : Central Bank of Sri Lanka

33
Chapter 3 – Financial Markets
The All Share Price Index (ASPI) declined by 5 per cent at end October 2011 in contrast with a rise of 96 per cent in 2010. The Milanka Price Index (MPI) which consists of the 25 most liquid stocks, also fell by 20 per cent at end October 2011 from an increase of 83 per cent in 2010. Restrictions on credit extended by brokers and exposure limits imposed on bank lending and the continued outflows of foreign portfolio investment largely contributed to the downturn in the market. The decline in the price indices resulted was in a market correction following the upsurge in the CSE since mid 2009. The volatility of the ASPI and MPI declined during the first ten months of 2011 compared with the same period last year.
Chart 3.9 ASPI, MPI and Market Capitalisation of the CSE
Source : Colombo Stock Exchange
There was a significant increase in the amount funds mobilized from the market. There were 12 IPOs which raised Rs. 12 billion and 22 right issues which mobilized Rs. 28 billion during the first ten months of the year. The number of companies listed on the CSE increased by 28 to 269 by end October 2011.
The market capitalisation of the CSE stood at Rs. 2.3 trillion at end October 2011 which is equivalent to about 35 per cent of GDP. The size of the CSE is still small by regional standards. The largest four sectors in terms of market capitalization were Diversified Holdings (23 per cent) , Banking, Finance & Insurance (22 per
Chart 3.8 Broad Equity Market Index Performances of Asian Stock Exchange (end October 2011)
Per cent
-16 -14 -12 -10 -8 -6 -4 -2 0 2 4
Thaiwan
India
Japan
Hong Kong
China
Singapore
South Korea
Thailand
Sri Lanka
Malaysia
Philippine
Indonesia
Source : World Federation of Exchanges
Inde
x Va
lue
Rs. b
illio
n
0
1,000
2,000
3,000
4,000
5,000
6,000
7,000
8,000
2006 2007 2008 2009 2010 20110
500
1,000
1,500
2,000
2,500
3,000
3,500
4,000
Market Capitalisation(Right Axis)
ASPI(Left Axis)
MPI(Left Axis)
Chart 3.10 Volatility in the Equity Market (CSE)
Source : Colombo Stock Exchange
Per c
ent
2006 2007 2008 2009 2010 2011
All Share Price Index Milanka Price Index
0
10
20
30
40
50
60
70
80
Table 3.1Market Capitalisation to GDP Ratio of
selected Asia-Pacific CountriesPer cent
Sources : World Federation of Exchanges World Economic Outlook Database – International Monetary Fund
Country 2009 2010 2011 (October)
Hong Kong 1,095 1,206 968Singapore 255 273 227Taiwan 168 175 138Malaysia 146 165 150India 102 98 72South Korea 91 106 94Thailand 65 83 75Japan 65 65 56China 54 46 36Philippine 52 81 75Indonesia 36 60 47Sri Lanka 23 40 35

Financial System Stability Review 2011
34
Tim
es
0
5
10
15
20
25
30
35
2001Jan
2002Jan
2003Jan
2004Jan
2005Jan
2006Jan
2007Jan
2008Jan
2009Jan
2010Jan
2011Jan
Price Earnings Ratio (PER) Ten Year Average
cent), Food, Beverage & Tobacco (13 per cent) and Hotels & Travel (7 per cent). The five largest companies accounted for 24 per cent of market capitalization.
The market price to earnings ratio (PE ratio) of the CSE declined from a peak of 29 in February 2011 to 16 at end October 2011 indicating the on-going price correction. The current market PE ratio of the CSE is now slightly higher than its long term average of 13 for the period 2001 – 2010. However, the current market PE ratio is considered to be broadly in line with company earnings potential, indicating that the market is not overvalued. The current market PE ratio is on par with the PE ratios of other Asian stock exchanges.
Chart 3.11 Price Earnings Ratio of the CSE(2001–2011)
Source : Colombo Stock Exchange
Table 3.2 Price Earnings Ratios of selected Asia-Pacific Countries
Per cent
Source : World Federation of Exchanges
Country 2009 2010 2011 (October)
Hong Kong 16 13 9Singapore 14 11 7Taiwan 29 16 17Malaysia 22 17 16India 22 23 19South Korea 25 16 13Thailand 27 15 12Japan 17 54 27China 22 17 14Philippine 16 14 15Indonesia 35 21 17Sri Lanka 17 25 16
Chart 3.12 Equity Market Turnover Velocity Ratio
Source : Colombo Stock Exchange
Per c
ent
0.0
0.1
0.2
0.3
0.4
0.5
0.6
0.7
0.8
0.9
1.0
1.1
2006 2007 2008 2009 2010 2011
Turnover Velocity Ratio 30 day Moving Average
Table 3.3 Equity Market Turnover Velocity Ratio*
Per cent
Source : World Federation of Exchanges
* The turnover velocity is calculated as share turnover/average market capitalization for the year
Country 2009 2010 2010 2011 (October) (October)
Hong Kong 78.6 62.7 51.7 48.7Singapore 67.1 53.2 45.2 39.7Taiwan 179.7 137.1 113.7 101.2Malaysia 34.1 32.7 26.6 28.6India 27.4 18.0 15.5 9.3South Korea 240.9 176.8 147.6 152.4Thailand 89.8 96.5 78.3 70.0Japan 119.5 109.8 92.4 95.4China 231.0 180.7 139.6 118.3Philippine 19.9 19.4 16.4 14.0Indonesia 50.6 36.5 30.4 25.0Sri Lanka 18.3 33.4 30.8 20.8
The CSE generated an equity turnover of Rs. 508 billion during the first ten months of 2011. The average daily turnover of the CSE rose from Rs. 2.4 billion in 2010 to Rs. 2.6 billion in the first ten months of 2011. Domestic investors accounted for about 89 per cent of the turnover, 97 per cent of transactions and 95 per cent of shares traded on the CSE. Of them, retail investors accounted for around 60 per cent of the turnover.
Market liquidity measured by turnover velocity ratio (the ratio of total turnover to average market capitalization for the year) has marginally declined. The turnover velocity ratio of the CSE

35
Chapter 3 – Financial Markets
shares for the Main Board and 10 per cent for the Diri Savi Board.
The Securities and Exchange Commission (SEC) took several measures to facilitate the smooth functioning of the stock market. Concerns that the stock market had become overheated and in view of the large amount of unregulated credit extended by stockbrokers, the SEC introduced measures to restrict the provision of credit by stock brokers from 2011. Accordingly, stock-brokers were prohibited from providing credit to investors and were required to force sell securities in arrears at T+5 days from January 2011. In addition, stock brokers were required to clear outstanding debtor positions by 50 per cent by end March 2011 and by 100 per cent by end June 2011. The time period for clearing debtor balances was subsequently extended to end September 2011 and end December 2011. In August 2011, the SEC relaxed the prohibition on provision of stock broker credit subject to certain prudential requirements, in view of the difficulties faced by retail investors. Accordingly, stock-brokers were permitted to extend credit to investors over T+3 days based on the computation of liquid assets less obligations, maintaining leverage at zero level. Other regulatory changes included the reduction in the number of days a security is captured in the 10 per cent price band to 5 market days from 10 market days. Regulations relating to the provision of credit by margin providers were also tightened.
The SEC also introduced a policy that IPOs should allot a minimum of 40 per cent of the offered shares to the retail individual investors and another 10 per cent to Growth and Balanced Unit Trusts. In addition, a new Unit Trust Code has been gazetted by the SEC setting out the regulatory framework for Exchange Traded Funds (ETFs) and the CSE working with Standard and Poor (S&P) to introduce a CSE - S&P Index to facilitate the operation of ETFs.
declined to 21 per cent in the first ten months of 2011 from 31 per cent in the same period of the previous year. The liquidity on the CSE still remains lower when compared to other exchanges in the region. Low turnover velocity implies higher impact cost of trading and low participation levels in the market.
Foreigners were net sellers in the market continu-ing a trend which started in the latter part of 2009. Foreign sales amounted to Rs. 62 billion, while foreign purchases totaled Rs. 45 billion, resulting in a net foreign outflow was Rs. 17 billion in the first ten months of 2011 compared to a net outflow of Rs. 26 billion in the corresponding period of 2010.
The CSE revised the listing rules relating to the eligibility criteria for companies listed on the Main Board and Diri Savi Board. The stated capital requirements for companies listing on the Main Board were increased from Rs. 100 million to Rs. 500 million and for the Diri Savi Board from Rs. 35 million to Rs. 100 million. In addition, companies listed on the Main Board should have positive net assets for 2 years and net profits after tax for 3 years, while companies listed on the Diri Savi Board should have positive net assets for 1 year. The minimum public holding of shares was also increased to 25 per cent of issued
Chart 3.13 Foreign Participation in the CSE
Rs.
billi
on
-30
0
30
60
90
120
150
2006 2007 2008 2009 2010 2011(Jan-Oct)
Foreign Purchases Foreign Sales Net Cummulative Foreign Purchases
Source : Colombo Stock Exchange

Financial System Stability Review 2011
36
requirement for companies listed in the Main Board to enhance the liquidity of the market. The SEC Act is also to be amended to provide for civil sanctions such as punitive penalties and disgorgement for offenders involved in market manipulation and insider trading. A framework for the demutualization of the CSE to segregate ownership from trading rights is being prepared.
The SEC and CSE have also initiated a project to establish a central counter-party clearing corporation which will enable the migration to a delivery versus payment mechanism for equity transactions thereby eliminating settlement risk. This will also facilitate the introduction of new products, such as exchange traded derivatives. This project is expected to be completed in 2012. The SEC also proposes to stipulate a minimum public float as a continuous listing
Exchange Traded Funds
Box 3
General risks in an ETF are market risk, tracking risk and potential currency risk (if unhedged).
The benefits of investing in ETFs are as follows.
• Flexibility – ETFs can be bought on margin, sold short, or held for the long-term, exactly like common stock. As its value is based on an underlying index, ETFs enjoy the additional benefits of broader diversification than shares in single companies.
• Low cost – As ETFs are typically able to achieve lower operating costs, the management fees (commonly referred to as MERs - Management Expense Ratios) are significantly lower than other managed funds or the expense in holding physical commodities directly.
• Returns from capital appreciation and income – An ETF will change in value as the underlying portfolio of assets changes in value. Depending on the benchmark being tracked, investors can earn returns through capital appreciation and/or distributions.
• Fair value – ETFs are designed to ensure that they trade close to their underlying value. This provides the investor with certainty that the on-market price will closely reflect the value of the underlying assets held in the fund. This is commonly referred to as trading at NAV.
• Taxation advantages – The turnover of the underlying portfolio tends to be low with the constituents of ETFs changing only when there is a rebalance of the index. This means
Exchange Traded Funds (ETF) are investment funds, traded on an exchange, that invest in a basket of securities or other assets that generally seek to track the performance of a specified index or benchmark. An ETF holds assets such as shares, bonds or commodities and trades close to its net asset value (NAV) over the course of the trading day. ETFs are similar to Unit Trusts (UTs).
ETFs are typically registered managed investment schemes (MIS) and investors hold units in an ETF/ unit trust rather than shares in a company that operates the investment fund. Each ETF security (or unit) represents an interest in a portfolio of securities, currencies or commodities.
ETFs are normally open-ended funds, which means that the number of units on offer is not fixed but can increase or decrease in response to demand and supply from investors, which helps to ensure that the ETF units trade at or near their NAV.
If an ETF trades above its NAV, because of high demand (typically because buyers expect an index to appreciate) investors are allowed to buy new units from the fund manager by exchanging underlying stocks for a large batch of new units. If the ETF is trading below the price indicated by the NAV, an investor could buy a large batch of units and exchange redeem it for the underlying stock. Under US regulations retail investors can only buy ETFs in the secondary market.

37
Chapter 3 – Financial Markets
Introduction of ETFs in Sri Lanka Securities & Exchange Commission of Sri Lanka (SEC) has gazetted Regulations under the Unit Trust Code in September 2011 for the establishment and operation of ETFs. In terms of the Regulations, an ETF is defined as an unit trust which tracks an index or the price of gold or any other commodity approved by the SEC, the units of which are listed on a stock exchange and can be bought/sold at prices, which shall reflect the NAV of such an unit trust. The Colombo Stock Exchange has initiated action to facilitate the listing of ETFs. The formation of ETFs will increase the range of products available for investors.
that the level of capital gains tax that needs to be paid by the fund and its investors can be greatly reduced.
ETF Landscape
There are around 2600 ETFs from 142 managers listed on 48 exchanges around the world by with assets under management (AUM) of US $ 1.4 trillion at end 1Q/2011. The geographic distribution of ETFs are as follows : USA (950 ETFs with AUM of US $ 950 billion), Europe (1,110 ETFs with AUM of 307 billion), Asia and Pacific (308 ETFs with AUM US $ 87 billion), South America and Canada (197 ETFs with AUM US $ 53 billion).
Box 3 (Contd.)

39
Chapter 4 – Banking Sector
BankingSector4
µ The Sri Lankan banking sector performance improved significantly during the first nine months of 2011, while prudential indicators were maintained at satisfactory levels.
µ Significant business expansion, favourable capital, liquidity and profitability, enhanced risk management frameworks and strong regulatory framework supported the stability of the banking sector.
µ Significant expansion in banking activities, both fund based and fee based, was reflected in high growth in assets base (year on year growth of 19 per cent).
µ Credit expansion accelerated at 31 per cent, recording one of the highest credit growths during the recent times.
µ Asset quality improved significantly as depicted in the declined non performing loans to total loans ratio of 4.5 per cent.
µ Deposits recovered from its slower growth prevailed during the year 2010 and indicated a year on year growth of 20 per cent by end September 2011.
µ Borrowings also indicated a growth of 20 per cent which slowed down with the improved growth in deposits.
µ Overall, the banking system’s exposure to credit, market, liquidity and operational risks has been maintained at a healthy level.
µ Central Bank strengthened its regulatory and supervisory framework further considering the rapid business expansion of the banking industry.

Financial System Stability Review 2011
40
Table 4.1 Banking Sector Network as at 30 September 2011
during the first nine months, 101 were out of the Western province which included 29 branches and 19 extension offices established in the Northern and Eastern provinces. Accordingly, by end September 2011, there were 2,042 branches, 1,023 extension offices, 2,976 other banking outlets and 2,117 ATMs island wide.
DevelopmentsAmana Bank Ltd., was issued with the commercial banking licence on 24 January 2011 which commenced operations on 01 August 2011 to offer an array of Islamic banking products/services. Further, information technology based banking products, investment banking and fund management services indicated an increasing trend where banks introduced new banking solutions.
Assets and LiabilitiesAssets : The year on year growth in total assets increased significantly by the end of September 2011 and was at 19 per cent (14 per cent in end September 2010). Loans and advances indicated an accelerated growth which increased from 13 per cent in September 2010 to 31 per cent in September 2011 (Table 4.2). The growth in loans and advances was mainly contributed by the licensed commercial banks
4. The Banking SectorThe banking sector remained the key player in the financial system contributing to 58 per cent of the financial sector’s total assets. The activities of the banking sector was further accelerated during the first nine months of 2011, as reflected in the high credit growth, improved asset quality and healthy levels of profitability, liquidity and capital.
4.1 Business Operations / Developments
OutreachAs at end September 2011, the number of banks in operation increased to 32, comprising 12 domestic licensed commercial banks, 11 foreign commercial banks and 09 licensed specialised banks. The Central Bank issued a licence to establish Amana Bank Ltd., with a view of introducing an exclusive Islamic bank in Sri Lanka.
During the first nine months, the banking network further expanded with the opening of 87 branches, 53 ex tension off ices and 96 automated teller machines (ATMs). Out of the branches and extension offices opened
Type of BankNumber of Institutions
Number of Main
Branches
Total Assets
Rs. BnMarket Share
(%)
Licensed Commercial Banks 23 1,540 3,388 84.4
– State banks 2 646 1,406 35.0
– Private domestic banks 10 846 1,526 38.0
– Foreign banks 11 48 456 11.4
Licensed Specialised Banks 9 510 627 15.6
– State banks 3 444 546 13.6
– Private banks 6 66 81 2.0
Banking Industry 32 2,006 4,015 100.0
Source : Central Bank of Sri Lanka

41
Chapter 4 – Banking Sector
Overall, the assets structure of the banking industry was changed considerably, where the share of loans and advances increased from 53 per cent in September 2010 to 58 per cent in September 2011 and the share of investments declined from 32 per cent to 28 per cent (Table 4.2).
The accelerated growth in credit and its increased significance in the assets structure require the banking industry to monitor the credit risk exposures closely and to strengthen the credit risk management measures.
Liabilities : Slow growth in deposits prevailed in end September 2010 was improved and deposits base of the banking industry indicated a higher growth of 20 per cent by end September 2011 against 13 per cent in September 2010 (Table 4.3). The growth was mainly contributed by the growth in rupee deposits (90 per cent of the total growth) which was at 21 per cent while the growth of foreign currency deposits was at 11 per cent
with annual growth of 32 per cent. Further, the growth in rupee loans and advances was higher than the growth in foreign currency loans and advances (Chart 4.1). With the high growth in loans and advances, the significant growth of 26 per cent in investments recorded in September 2010 declined to 4 per cent by end September 2011.
Table 4.2 Composition of Assets
ItemSep-2010 Sep-2011 Growth (%)
Rs. Bn % of Total Rs. Bn % of Total Sep-10 Sep-11
Loans and Advances 1,795 53.4 2,350 58.5 12.9 30.9
Investments 1,089 32.4 1,133 28.2 25.7 4.0
Others 478 14.2 532 13.3 -1.5 11.5
Total Assets 3,362 100.0 4,015 100.0 14.3 19.4
Source : Central Bank of Sri Lanka
Chart 4.1 LKR Vs. Foreign Currency Loans & Advances
Source : Central Bank of Sri Lanka
Table 4.3 Composition of Liabilities
ItemSep-2010 Sep-2011 Growth (%)
Rs. Bn % of Total Rs. Bn % of Total Sep-10 Sep-11
Capital Funds 278 8.3 347 8.6 15.9 24.7
Deposits 2,432 72.3 2,907 72.4 12.5 19.5
Borrowings 480 14.3 577 14.4 22.6 20.0
Others 172 5.1 184 4.6 16.3 8.2
Total Liabilities 3,362 100.0 4,015 100.0 14.3 19.4
Source : Central Bank of Sri Lanka
Gro
wth
, %
-20
-10
0
10
20
30
40
2007 2008 2009 2010 Sep-11
Growth - LKR Loans Growth - FX Loans

Financial System Stability Review 2011
42
The forex sales and purchases contributed to 39 per cent of the growth in off-balance sheet exposure which jointly accounted for 42 per cent of the total exposure as well (Chart 4.4). Further, documentary credit, acceptances and undrawn credit lines also indicated a higher growth by end September 2011, reflecting on the increased trading and business activities.
The off-balance sheet exposure as a percentage of the total on-balance sheet assets increased from 50 per cent in end September 2010 to 57 per cent by end September 2011. Further, this exposure is seven times of the capital base of the banking industry.
(Chart 4.2). Further, the time deposits, accounting for 54 per cent of the total deposit base (Chart 4.3) recovered from its slow growth of 6 per cent in September 2010 to 18 per cent in September 2011.
Borrowings of the banking industry indicated a growth of 20 per cent by end September 2011 which declined marginally from the 23 per cent growth recorded by end September 2010. Further, the capital funds of the banking industry indicated a higher growth of 25 per cent by end September 2010, mainly resulting from the fresh injection of capital. However, the funding structure of the banks has not changed significantly where deposits continued to be the main funding source of the banking industry (Table 4.3). The banks are required to monitor the concentration of deposits on a customer basis and product basis in order to avoid any potential liquidity difficulties through sudden withdrawals.
Off-balance sheet exposures : The off-balance sheet exposure of the banking industry increased significantly by end September 2011. Accordingly, the exposure increased from Rs. 1.7 billion in end September 2010 to Rs. 2.3 billion in end September 2011, indicating a significant year on year growth of 36 per cent.
Chart 4.2 LKR Vs. Foreign Currency Deposits Chart 4.3 Composition of Depositsas at 30/09/2011
Source : Central Bank of Sri Lanka Source : Central Bank of Sri Lanka
Gro
wth
, %
-5.0
0.0
5.0
10.0
15.0
20.0
25.0
2007 2008 2009 2010 Sep-11
Growth - LKR Deposits Growth - FX Deposits
54%
34%
9%3%
Demand Deposits Time Deposits
Savings Accounts Other Deposits
Chart 4.4 Composition of Off-Balance Sheet Exposures as at 30/09/2011
Source : Central Bank of Sri Lanka
Letters of Credit
Guaranteesand Bonds
Acceptances
FX Purchases
FX Sales
Derivatives
UndrawnCredit Lines
Others
13%
13%
8%
19%
23%
3%
19%2%
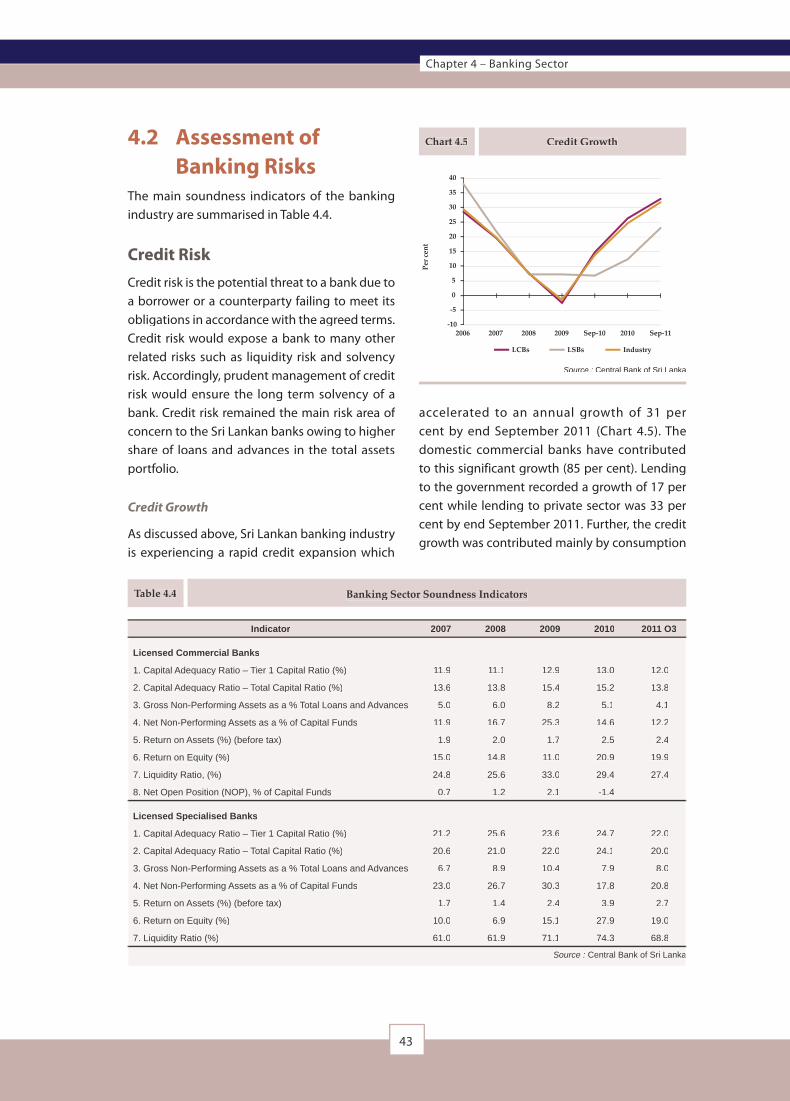
43
Chapter 4 – Banking Sector
Table 4.4 Banking Sector Soundness Indicators
Indicator 2007 2008 2009 2010 2011 Q3
Licensed Commercial Banks
1. Capital Adequacy Ratio – Tier 1 Capital Ratio (%) 11.9 11.1 12.9 13.0 12.0
2. Capital Adequacy Ratio – Total Capital Ratio (%) 13.6 13.8 15.4 15.2 13.8
3. Gross Non-Performing Assets as a % Total Loans and Advances 5.0 6.0 8.2 5.1 4.1
4. Net Non-Performing Assets as a % of Capital Funds 11.9 16.7 25.3 14.6 12.2
5. Return on Assets (%) (before tax) 1.9 2.0 1.7 2.5 2.4
6. Return on Equity (%) 15.0 14.8 11.0 20.9 19.9
7. Liquidity Ratio, (%) 24.8 25.6 33.0 29.4 27.4
8. Net Open Position (NOP), % of Capital Funds 0.7 1.2 2.1 -1.4
Licensed Specialised Banks
1. Capital Adequacy Ratio – Tier 1 Capital Ratio (%) 21.2 25.6 23.6 24.7 22.0
2. Capital Adequacy Ratio – Total Capital Ratio (%) 20.6 21.0 22.0 24.1 20.0
3. Gross Non-Performing Assets as a % Total Loans and Advances 6.7 8.9 10.4 7.9 8.0
4. Net Non-Performing Assets as a % of Capital Funds 23.0 26.7 30.3 17.8 20.8
5. Return on Assets (%) (before tax) 1.7 1.4 2.4 3.9 2.7
6. Return on Equity (%) 10.0 6.9 15.1 27.9 19.0
7. Liquidity Ratio (%) 61.0 61.9 71.1 74.3 68.8
Source : Central Bank of Sri Lanka Central Bank of Sri Lanka
4.2 Assessment of Banking Risks
The main soundness indicators of the banking industry are summarised in Table 4.4.
Credit RiskCredit risk is the potential threat to a bank due to a borrower or a counterparty failing to meet its obligations in accordance with the agreed terms. Credit risk would expose a bank to many other related risks such as liquidity risk and solvency risk. Accordingly, prudent management of credit risk would ensure the long term solvency of a bank. Credit risk remained the main risk area of concern to the Sri Lankan banks owing to higher share of loans and advances in the total assets portfolio.
Credit Growth
As discussed above, Sri Lankan banking industry is experiencing a rapid credit expansion which
accelerated to an annual growth of 31 per cent by end September 2011 (Chart 4.5). The domestic commercial banks have contributed to this significant growth (85 per cent). Lending to the government recorded a growth of 17 per cent while lending to private sector was 33 per cent by end September 2011. Further, the credit growth was contributed mainly by consumption
Chart 4.5 Credit Growth
Source : Central Bank of Sri Lanka
Per c
ent
-10
-5
0
5
10
15
20
25
30
35
40
2006 2007 20092008 2010Sep-10 Sep-11
LCBs LSBs Industry

Financial System Stability Review 2011
44
(20 per cent), Agriculture (17 per cent), trading (12 per cent), construction and financial services (both 11 per cent each) sectors.
Assets quality
The assets quality of the banking industry improved significantly as reflected in the declined non performing loans (NPLs) to total loans ratio and satisfactory provision coverage ratios. The banks are required to move towards identifying the NPLs with potential risk of default based on the borrower rather than the single facility. Accordingly, more stringent asset quality management processes are expected to be developed in the Sri Lankan banking sector.
The gross NPL ratio recorded an improvement which declined from 6.7 per cent in end September 2010 to 4.5 per cent in end September 2011 (Chart 4.6). Further, by end September 2011, NPL volumes indicated a declining trend (Chart 4.7). NPLs in doubtful category declined significantly by 67 per cent by end September 2011 contributing to 73 per cent of the decline in total NPLs volume. Contributing to 37 per cent of the reduction in total NPLs, the substandard NPLs also indicated a significant decline of 24 per cent . Accordingly, the share of sub-standard and doubtful NPLs in the total NPLs were lower whilst loss category remained the main type of NPLs (Chart 4.8).
Chart 4.6 NPL Ratio
Source : Central Bank of Sri Lanka
Chart 4.7 Trend in NPLs
Source : Central Bank of Sri Lanka
Chart 4.8 Composition of NPLs as at 30/09/2010
Source : Central Bank of Sri Lanka
Chart 4.9 Sector-wise NPL Ratio as at 30/09/2010
Source : Central Bank of Sri Lanka
Per c
ent
0
2
4
6
8
10
12
LCBs LSBs Industry
2006 2007 20092008 2010Sep-10 Sep-11 Special Mention Substandard
Doubtful Loss
17%
11%
4%68%
Rs.
billi
on
2009 2010 2011
100
110
120
130
140
150
Jan Feb Mar Apr May Jun Jul Aug Sep Oct Nov Dec
%2.8
8.1
10.1
3.9
9.1
5.5
1.8
3.5
3.7
1.3
3.0
0.0 2.0 4.0 6.0 8.0 10.0 12.0
Agri. & Fishing
Manufacturing
Tourism
Transport
Construction
Trading
Fin. Services
Infrastructure
Other Services
Consumption
Other Loans

45
Chapter 4 – Banking Sector
Tourism (10 per cent), Construction (9 per cent), Manufacturing (8 per cent) and trading (6 per cent) sectors indicated high NPL ratios (NPLs as a percentage of own sector loans and advances) indicating the need for the banks to monitor lending in these sectors (Chart 4.9).
In order to absorb any potential credit risk arising from deterioration in the quality of assets, the banks are required either to obtain adequate collaterals or to maintain provisions for loan losses. Sri Lankan banks are required to maintain a general provision as well as a specific provision for the NPLs that do not have acceptable collaterals.
As at end September 2011, the total provision coverage of the industry was 55.0 per cent in comparison to 53.8 per cent as at end September 2010 (Chart 4.10). With the improved provisions coverage the net NPL ratio of the banking industry declined from 3.2 per cent in September 2010 to 2.1 per cent in September 2011 (Chart 4.11).
The Central Bank allowed the banks to reduce the minimum general provision requirement from 1 per cent to 0.5 per cent by end 2011, on a staggered basis. However, given the excessive credit expansion, the banks should implement prudential policies in monitoring and mitigating
the credit risk arising from the declined provision coverage of the banks.
Distribution of credit
The credit concentration to few sectors/products/customers would also expose the banks to credit risk. The banks are required to monitor such concentration risks through implementing and complying with prudential limits on economic sector-wise exposures, product-wise exposures and individuals or groups of companies.
The sector-wise distribution of credit indicates that more than 67 per cent of the loans and advances of the banking industry are concentrated on five sectors. These five sectors include construction (15 per cent), agriculture (14 per cent), trading (13 per cent), consumption (13 per cent) and manufacturing (12 per cent) which are expected to contribute to the economic development (Chart 4.12).
Lending in the form of term loans, overdrafts and pawning were 36 per cent, 17 per cent and 16 per cent of total loans and advances, respectively. Balance 31 per cent was distributed among trade credit facilities, housing loans, leasing and credit card advances (Chart 4.13).
Chart 4.10 Ratio of Loan Loss Provisions to NPL
Source : Central Bank of Sri Lanka
Chart 4.11 Ratio of Net NPL to Total Advances
Source : Central Bank of Sri Lanka
Per c
ent
0
10
20
30
40
50
60
70
80
LCBs LSBs Industry
2006 2007 20092008 2010Sep-10 Sep-11
Per c
ent
0
1
2
3
4
5
6
7
8
LCBs LSBs Industry
2006 2007 20092008 2010Sep-10 Sep-11

Financial System Stability Review 2011
46
on the interest related sources. Over the recent period the interest rates structure of the banking industry followed the Central Bank policy rates and indicated a declining trend and is currently stabilised (Chart 4.14).
This declined interest rates trend is reflected in the marginal ly decl ined net interest margin of the banking industry, which was at 4.2 per cent by end September 2011 against 4.6 per cent recorded in September 2010 (Chart 4.15). Further, significant gains on treasury bills reported during the year 2010 due to declining trend in interest rates is easing out with the stagnated interest rates. Accordingly, at present, the drop in interest rates is indicating
Considering the potential risks arising from high concentration in few customers, banks are required to comply with the maximum amount of accommodation limits stipulated by the Central Bank. Accordingly, lending to customers exceeding 15 per cent of a bank’s capital base is expected to be within a limit of 55 per cent of the total outstanding loans and advances of the bank.
The banking industry operated with such exposures amounting to Rs. 765 bil l ion representing 35 per cent by the end of June 2011. Further, the banks’ exposure to subsidiaries, associates, other investee entities and top 20 groups/customers as at 31 December 2010 was Rs. 925 billion, accounting for nearly 291 per cent of capital funds and 24 per cent of banking sector assets.
Market RiskMarket risk is where the value of assets is decreasing due to the volatility in the market risk factors namely, interest rates, stock prices and exchange rates.
Interest rates
Banks are inherently exposed to the interest rate risk due to the nature of business, assets and funding structure and dependability of earnings
Chart 4.12 Sector-wise Credit Exposureas at 30/09/2011
Source : Central Bank of Sri Lanka
Chart 4.13 Types of Loans and Advancesas at 30/09/2011
Source : Central Bank of Sri Lanka
14%
15%
12%
13%
6%
6%
1%
1%
28%
2%2%
Agri. & Fishing
Manufacturing
Tourism
Transport
Construction
Trading
Fin. Services
Infrastructure
Other Services
Consumption
Other Loans
1%
4%
5%
58%
13%
1%8%
8%
0%
2%
Import bills
Export bills
Overdrafts
Pawning Advnces
Credit Cards
Housing Loans
Lease Rentals
Short-term LoansMedium and Long-term LoansOther
Chart 4.14 CBSL Policy Rates and Bank Interest Rates
Source : Central Bank of Sri Lanka
Per c
ent
Jun
Jul
Aug
Sep
Jun Jul
Aug
Sep
Oct
Nov
2010
Dec Jan
Feb
Mar
Apr
May
2011CBSL Repo Rate CBSL Rev. Repo Rate AWPLR AWDR
5
6
7
8
9
10
11

47
Chapter 4 – Banking Sector
Chart 4.15 Net Interest Margin
Source : Central Bank of Sri Lanka
Per c
ent
LCBs LSBs Industry
2006 2007 20092008 2010Sep-10 Sep-11
2.0
3.0
4.0
2.5
3.5
4.5
5.0
marginal impact earnings of the banking industry.
Prices of Investments
The banking sector’s exposure to share market was low at 3 per cent of the total investments and recorded an annual growth of 23 per cent while the exposure to debt market also improved by 6 per cent. Further, the year on year growth in the exposure to government securities was lower at 7 per cent in September 2011 against high growth of 24 per cent in end September 2010. As such the investment focus of the banking sector has moved from government securities to the equity market resulting from the lowered returns on the government securities. Accordingly, the total investments of the banking sector displayed a slower growth of 4 per cent declined from the significant growth of 26 per cent in September 2010 (Chart 4.16).
The increasing trend in exposure to the share market by banks in terms of investments and lending, results in increasing market risks. Considering any potential threat to the banking industry due to high exposure to the market risk, Central Bank issued prudential regulations to restrict the exposure to the share market
Chart 4.16 Investment to Total Assets Ratio
Source : Central Bank of Sri Lanka
Per c
ent
LCBs LSBs Industry
0
10
20
30
40
50
60
2006 2007 20092008 2010Sep-10 Sep-11
in addition to the limits on investments in listed equity. Further, the lower share of equity investments in the total investments portfolio ensures that the market risk of the banking industry due to price volatilities is at a manageable level.
Exchange rates
Volatility in the exchange rates would expose the banks to market risk due to the open positions in both on-balance sheet and off-balance sheet assets and liabilities.
During the period from end September 2010 to end September 2011, the market risk arising from exchange rates to the banking industry was at a manageable level due to the lower net exposure to foreign currency assets and liabilities (Table 4.5).
The exposure of the Sri Lankan banking industry to exchange rate risk is further limited by the restrictions on the net open position of individual banks which is decided based on the capital base of each bank. Further, the prudential Directions on foreign exchange risk management and derivative products are expected to minimize the adverse foreign currency exposures of the banks.

Financial System Stability Review 2011
48
Item
2010 - September 2011 - September Growth (%)
Rs. Bn% of Total
on-balance sheet Assets
Rs. Bn% of Total
on-balance sheet Assets
Sep - 10 Sep - 11
On-balance sheet Assets 404.6 12.0 455.5 11.3 -9.1 12.6
Loans and advances 64.7 1.9 73.4 1.8 -14.4 13.4
Investments 99.3 3.0 67.6 1.7 43.3 -31.9
Placements with CBSL, Banks & FIs 89.20 2.7 128.16 3.2 -42.1 43.7
Others 151.4 4.5 186.4 4.6 3.8 23.1
Off-balance sheet Assets 566.4 16.8 676.7 16.9 35.5 19.5
On-balance sheet Liabilities 420.1 12.5 443.9 11.1 -4.4 5.7
Deposits 295.3 8.8 313.4 7.8 -0.8 6.1
Borrowings 14.2 0.4 19.0 0.5 9.5 33.8
Other 110.6 3.3 111.5 2.8 -14.3 0.7
Off-balance sheet Liabilities 575.0 17.1 670.6 16.7 34.5 16.6
Net Exposure -24.1 -0.7 17.7 0.4 507.5 -173.5
Table 4.5 Foreign Currency Assets and Liabilities
Source : Central Bank of Sri Lanka
Statutory liquid assets ratio (SLAR)
The Central Bank requires all the banks to maintain a minimum liquid assets ratio of 20 per cent consisting only with the allowed liquid assets. Nevertheless, banks have the discretion to maintain a prudential ratio above the statutory ratio in accordance with the bank specific liquidity requirement. Further, a bank should ensure not to maintain excessive liquid assets which would curtail the banking activities and earning capacity.
The surplus liquidity position of the banking industry is easing out with the accelerated lending as reflected in the declining SLAR and increasing credit to deposits and borrowings ratio (Chart 4.17). Investments in Government securities, including treasury bills (29 per cent), treasury bonds (31 per cent) and Sri Lanka Development Bonds (15 per cent), accounted for about 75 per cent of the liquid assets by end September 2011. Despite the declined growth in liquid assets and declined liquid assets ratio, SLAR
Capital charge for market risk
The capital charge for market risk under the existing capital adequacy requirement is also expected to cushion any market risk arising due to unhealthy market volatilities. Accordingly, the banking sector maintained a capital charge of Rs.7.7 billion including capital charges for interest rate risk, equity risk and foreign currency risk.
Liquidity Risk The maturity transformation process of banks which transforms short term deposits into less liquid medium and long term assets base would always expose banks to liquidity risk. Liquidity risk is where a bank fails to raise funds to meet its obligations towards depositors or lenders, without incurring a loss. Sri Lankan banks are required to maintain adequate liquid assets (measured in terms of statutory liquid assets ratio) and implement sound assets and liability management policies.

49
Chapter 4 – Banking Sector
should focus on using appropriate models and well tested stress testing procedures to evaluate, measure and manage liquidity risk as guided in the Instructions on integrated risk management issued by the Central Bank. Such procedures would enhance the validity of the liquidity risk analysis of banks and strengthen the liquidity risk management framework of the banks.
Operational Risk
The operational risk is simply the possibility of a bank incurring losses due to the failure of systems, processes, people and unexpected events. The increasing exposure of the Sri Lankan banks to advanced banking products with high dependence on information technology, use of advanced technologies for transaction processing and outsourcing the non-core banking activities has increased the operational risk of the banks. In such circumstances, banks are required to adopt more vigilant and widened operational risk management systems.
Sri Lankan banks are required to maintain a capital charge for operational risk following the basic indicator approach as guided in the Basel II Capital Accord. Accordingly, by end September 2011, banks have set aside Rs 28.0 billion which is 9 per cent of the capital base to cover
of the banking industry was maintained at 35 per cent, well above the minimum requirement of 20 per cent (Chart 4.17).
Policies for liquidity management and asset and liability management
The banks are also required to maintain bank specific prudential limits on assets and liabilities maturity mismatches as one of the assets and liability management strategy. The banks are expected to identify the liquidity requirements with such analysis and develop funding strategies or adjust the structure of assets and liabilities in order to prevent any losses due to unanticipated liquidity requirements.
The analysis of the current context of the Sri Lankan banking industry in terms of the maturity mismatches depicts that the negative gaps between the assets and liabilities have widened in view of the lower interest rates environment (Chart 4.18).
However, it is important to identify the behavioural maturity of the assets and liabilities where such analysis would provide more insights to the liquidity risk management process rather than the currently used contractual maturity based analysis. Further, the Sri Lankan banks
Chart 4.17 Statutory Liquid Assets Ratio
Source : Central Bank of Sri Lanka
Per c
ent
70.468.3
62.267.5
70.0
31.6 31.9
40.2 39.034.6
30.0
61.6
20.0
30.0
40.0
50.0
60.0
70.0
80.0
Sep-07 Sep-08 Sep-09 Sep-10 Sep-11 Projected
Credit to Deposits & Borrowings SLAR – Total
Chart 4.18 Cumulative Maturity Gap (% of Cumulative Liabilities)
Source : Central Bank of Sri Lanka
Per c
ent
-32.2-26.0 -28.1
-25.4-18.6
-3.52.0
-39.6-35.2 -35.2
-29.3-22.6
-8.0-0.6
-60.0
-40.0
-20.0
0.0
20.0
Less than 7 Days
7-30Days
1-3Months
3-6Months
6-12Months
1-3Years
3-5Years
Sep-10 Sep-11

Financial System Stability Review 2011
50
Basel III – Recent Developments
Box 4
2. Basel III Framework
Having the above shortcomings in mind, the Basel Committee on Banking Supervision (BCBS) has collectively reached on an agreement on reforms to “strengthen global capital and liquidity rules with the goal of promoting a more resilient banking sector”, which is being referred to as “Basel III”.
Basel III strengthens bank capital requirements with the introduction of new regulatory requirements on bank liquidity and bank leverage and highlights the following key changes:
2.1 Capital Standards
(i) Increase in quality and quantity of capital
(a) Total capital ratio will be retained at 8 per cent of risk weighted assets (RWAs) – (In Sri Lanka, regulatory minimum total Capital Adequacy Ratio (CAR) is 10 per cent).
Tier 1 Capital
- Tier 1 – Common equity will be comprised of ordinary share capital and retained profits.
- Tier 1 – Non-common equity (Additional Tier 1) will be made of perpetual non-cumulative preference shares and other qualifying instruments.
Tier 2 Capital
– Tier 2 will be made of dated term preference shares, subordinated debt and certain perpetual preferred instruments.
Tier 3 Capital
– Tier 3 capital (unsecured subordinated debt that is fully paid up) will be abolished.
The recent global financial crisis has resulted in a multitude of proposals from stakeholders at global, regional and national levels for a fundamental restructuring of the approach to risk and regulation in the financial sector. One of the proposals is the introduction of Basel III framework.
1. Basel I and II Frameworks
Many financial regulators and obser vers have identified that the existing approach on calculating Capital Adequacy based on “Basel I” and “Basel II” frameworks as one of the key factors contributed to the global financial turmoil.
It was observed that under the capital adequacy rules formulated based on Basel I and Basel II frameworks before the crisis, the minimum regulatory capital levels of banks were insufficient to mitigate the risks from the exposures and actual losses of the banks suffered during the financial crisis.
Further, it was noted that the quality of regulatory capital appeared often insufficient to absorb bank losses effectively. In addition, the capital adequacy rules of Basel I and Basel II were not adequate enough to capture risks arising from bank exposures to transactions such as securitizations, derivatives and repurchase agreements or take into account the systemic risks associated with the increase of leverage in the financial system.
The Basel I and II frameworks were mainly focused on capital only and they did not have any internationally accepted quantitative standards for liquidity. This phenomenon is often observed as a serious shortcoming and the outcome of this has been revealed when the financial crisis unfolded in 2007 with the erosion of liquidity in the key funding markets used by many banks and bank-sponsored vehicles.

51
Chapter 4 – Banking Sector
Box 4 (Contd.)
(ii) Reduction in leverage through backstop leverage ratio
(a) The leverage ratio acts as a non-risk sensitive backstop measure to reduce the risk of the accumulation of excessive leverage in the financial institution and in the financial system as a whole.
(b) A backstop 3 per cent ratio of Tier 1 capital on a bank’s total assets (including both on and off-balance sheet assets) will be introduced with effect from January 2018.
(c) The assets will be treated on a non-risk adjusted basis with limited or no recognition of collateralization or credit risk mitigation associated with assets (i.e., on a gross and un-weighted basis) and the leverage ratio should not be more than 33 times bank capital, i.e., 33:1.
2.2 Liquidity Standards
(i) Increase in short-term liquidity coverage and stable long-term balance sheet funding – Liquidity ratios
(a) Short term liquidity – Liquidity Coverage Ratio (LCR) – Banks will be required from
Deductions from Capital
– Deductions from capital (i.e., regulatory adjustments) will be applied to the Tier 1 – Common equity component and not to overall capital.
(b) Minimum “common equity” component will be increased to 4.5 per cent from the current 2 per cent minimum when fully phased in by 2015.
(c) Overall Tier 1 element of the capital base (including common equity) will be increased to 6 per cent from the current 4 per cent minimum when fully phased in by 2015 – (in Sri Lanka, the minimum ratio is 5 per cent).
(d) Capital conservation buffer – In addition, there will be a “capital conservation buffer” made up of common equity and amounting to 2.5per cent of Risk Weighted Assets (RWAs) when fully phased in by 2019 with the intention of creating capital buffers in good times that can be used to absorb shocks in periods of stress.
(e) An institution with capital falling within the buffer range (i.e., with common equity of between 4.5 per cent and 7 per cent) will be subject to restrictions on dividend payouts, share buybacks and bonuses as a measure of imposing good governance. In effect, most banks will be required to maintain a ratio of 7 per cent of RWAs in common equity (i.e., 4.5per cent minimum plus a 2.5 per cent capital conservation buffer).
(f ) Counter-cyclical buffer to reduce pro-cyclicality – A further “counter-cyclical capital buffer” may be imposed to prevent excessive credit growth. It would be made up of common equity of up to an additional 2.5 per cent of RWAs. This buffer is expected to be imposed at a national level only during times of excessive credit growth, and will be allowed to be released during times of credit contraction.
Source : Central Bank of Sri Lanka
Cap
ital R
atio
(%)
2
4.52
1.5
2
4
2.5
2.5
0
2
4
6
8
10
12
14
Basel II Basel III
Tier 1 - Common Equity Tier 1 - Non-Common EquityTier 2 Tier 2 and Tier 3Capital Conservation Buffer Countercyclical Capital Buffer
Chart B4.1 Basel II and III Frameworks

Financial System Stability Review 2011
52
(b) Lack of internal expertise is another concern as Basel III provides a more comprehensive way to measure risk. The organization culture of the banks need to be developed and will require a lot of investment in training personnel.
(c) Complexity of the Basel framework has been considered even in the past when Basel II was introduced. With the new changes mentioned above the framework will be much more complex to smaller banks.
(d) Inadequate clarity of proposed regulations would be raised by banks as two new global liquidity ratios are introduced. Banks will have concerns on the definitions of such ratios and can cause international arbitrage.
(e) Technological capabilities will be an issue as this will revamp the management information system and allocation of resources by banks.
2015 to maintain a high-quality liquid assets buffer compared with expected net cash outflow over a 30 day stress scenario, in order to promote short-term resilience to potential liquidity disruptions.
(b) Longer term liquidity – Net Stable Funding Ratio (NSFR) – Banks will be required from 2018 to have stable funding sources in place to meet the funding needs resulting from the assets over a one year stress scenario, in order to encourage the banks to use stable sources to fund their activities and to reduce the dependency on short-term wholesale funding.
3. Overall concerns for banks in Asia
(a) Asian Banks are concerned about the high cost of capital that they will incur in order to raise the equity to desired levels. However, Banks in Asia are in a better position than the Western financial institutions as Asia’s collectively Tier 1 capital is more than 10 per cent.
Box 4 (Contd.)
the prevailing operational risk. Capital charge under basic indicator approach is the minimum standard for the banks. Hence, the banks have the freedom to decide on advanced models to decide on a more prudent capital charge above the minimum requirement, which would be based on the bank specific operational risk exposure.
In addition to the close monitoring of the adherence of banks to the Directions on Corporate Governance, the Central Bank initiated a process to assess the fit and propriety of the officers who are performing executive functions of the banks, on a continuous basis. Further, the Central Bank is to introduce the advanced approaches for computing capital for operational risk to be
in line with the increased risk exposures of the banks. Under the advance approach, banks are required to compute capital charges for each business segment separately which is assigned with a proxy for the industry-wide relationship between the operational risk loss experience for a given business line and the aggregate level of gross income for that business line.
In addition to monitoring the compliance of the banks to prudential directions on corporate governance, internal controls and capital buffer on operational risk, the Central Bank examines internal policies and guidelines of banks for sound operational risk management within the scope of its Examinations of the banks.

53
Chapter 4 – Banking Sector
The Return on Assets (ROA) of the banking industry had decreased from 3.0 per cent in 2010 to 2.4 per cent in September 2011 (Chart 4.19). The Return on Equity (ROE) displayed a similar trend decreasing from 23.6 per cent to 19.3 per cent (Chart 4.20). However, it should be noted that the high profitability of the banking industry recorded during 2010 is partially due to certain exceptional events of few banks. As such the profitability of the banking industry, considering the general trend, has improved over the time and remains at healthy levels.
4.4 Adequacy of Resources to deal with Potential Risks
The banking sector has remained strong and improved its capacity to mitigate risks through healthy levels of profits and capital. In addition, prudential directions and guidelines were issued during the period to ensure the resilience of banks. These include exposure to stock market, disclosure on corporate governance for foreign banks and introduction of Insurance of Deposit Liabilities to ensure good governance, minimise potential losses of banks from volatility of stock market operations and to safeguard the customers from unforeseen circumstances.
Profitability The profitability of the banking industry displayed a marginal decline mainly resulting in from the declined net non interest income and slower year on year growth in net interest income which was 11 per cent against 18 per cent growth in September 2010. Accordingly, profit before tax of the banking industry for the nine months ended September 2011 was at Rs. 69 billion, marginally declined from Rs. 70.5 billion recorded in the corresponding period in 2010 (Table 4.6).
Interest income remained the main source of income and the share increased from 82 per cent in September 2010 to 85 per cent by end September 2011. The significant drop in the non interest income has resulted in the increased dependency of the banking industry earnings on the interest income. The significant decline in non-interest income (by 16 per cent) is primarily due to the reduction in the exceptional gains recorded on the trading government securities during the year 2010. Further, with the increased staff costs and establishment costs, the non-interest expenses of the banking industry increased by 14 per cent resulting in reduced net non interest income of the industry.
Table 4.6 Profit and Loss Account
Item
Sep-2010 Sep-2011
Amount (Rs. Bn)
As a % of Avg.Assets
Amount (Rs. Bn)
As a % of Avg.Assets
Total Interest Income 244.2 10.3 260.0 9.1
Total Interest Expenses 135.6 5.7 138.9 4.9
Net Interest Income 108.6 4.6 120.1 4.2
Non-Interest Income 52.9 2.2 44.2 1.6
Foreign Exchange Income 8.4 0.3 10.2 0.3
Non-Interest Expenses 74.3 3.1 84.5 1.3
Staff Cost 34.2 1.4 37.6 1.3
Loan Loss Provisions -3.7 -0.2 -1.8 -0.1
Profit Before Tax (After VAT) 70.5 3.0 69.0 2.4
Profit After Taxes 46.0 1.9 46.8 1.6
Source : Central Bank of Sri Lanka
Chart 4.19 Return on Assets (Before Tax)
Source : Central Bank of Sri Lanka
Per c
ent
LCBs LSBs Industry
2006 2007 20092008 2010Sep-10 Sep-11
0.5
0.0
1.0
1.5
2.0
2.5
3.0
3.5
4.0
4.5

Financial System Stability Review 2011
54
The banks are expected to improve the operational efficiencies and enhance the cost structure of the banks in order to pass the benefits of the high returns to the customers. Further, the banks shall adopt measures to enhance the risk absorption capacity of earnings and improve the capital positions of the banks utilizing the excessive earnings.
Capital funds and capital adequacy
Capital funds of the banking industry indicated a significantly higher year on year growth of 25 per cent by end September 2011, as against the growth of 16 per cent in September 2010. This growth was mainly due to the significant growth in the retained profits recorded in December 2010 and fresh capital infusion by few banks to maintain the capital base at healthy levels.
Nevertheless, the total Capital Adequacy Ratio declined marginally from 15.5 per cent in September 2010 to 14.5 per cent owing to the high credit expansion, which increased the risk weighted asset by 25 per cent since September 2010. Despite the marginal decline in the ratio, it was maintained well above the required rate of 10 per cent. Further, the core capital ratio,
Chart 4.20 Return on Equity
Source : Central Bank of Sri Lanka
Per c
ent
LCBs LSBs Industry
0
5
10
15
20
25
30
35
2006 2007 20092008 2010Sep-10 Sep-11
which represents the high quality capital of the banks, was at 13 per cent by end September 2011 (Chart 4.21).
With a view of addressing the increasing risks and exposures of the banks, the Central Bank issued guidelines to enhance the minimum capital requirement on a staggered basis. The banks are required to introduce capital augmentation plans to enhance the capital positions, where necessary, given the accelerated growth in credit and banking activities. Further, the guidelines on implementation of the internal capital adequacy assessment process under Basel II Capital Accord are to be issued upon which the capital buffer to absorb the bank specific risk is expected to be enhanced.
At present, the Sri Lankan banking industry is in compliance with the upcoming requirements of the Basel III capital guidelines which focus more on the quality of the capital. However, with the expansion of the baking activities, the banks are required to widen their scope on the capital management to adhere to the international best practices recognised under the Basel III accord.
Management
A well structured management in a bank, consisting of fit and proper persons, is expected
Chart 4.21 Capital Adequacy Ratio
Source : Central Bank of Sri Lanka
Per c
ent
LCBs LSBs Industry
2006 2007 20092008 2010Sep-10 Sep-1110.0
15.0
20.0
12.5
17.5
22.5
25.0

55
Chapter 4 – Banking Sector
to enhance the proper functioning of such banks without emanating system-wide risks to the banking industry. Accordingly, the Central Bank introduced prudential directions on assessing the fitness and propriety of the officers in banks who are performing the executive functions. The Central Bank approved the suitability of the senior management of the banking industry to continue with the assigned duties and responsibilities. In this context, fitness and propriety of over 450 officers performing executive functions was confirmed by end September 2011.
Further, during the year 2011, two banks had appointed two eminent professionals as consultants to the Audit Committee in view of strengthening the Audit Committee and improve the Corporate Governance of the banks.
4.5 Policy measures and regulations
The Central Bank of Sri Lanka initiated several policy measures and regulations during the year September 2010 to September 2011, in keeping abreast with international regulatory bodies and its core objective of maintaining financial system stability.
• Fit and Proper Assessment – The assessment of the fitness and propriety has been extended to officers performing executive functions by introduction of the Banking Act Determination No. 3 of 2010. The assessment will cover officers currently in office and new appointments, including renewal of employment contracts. The categories of officers whose fitness and propriety will be assessed include:
– Additional General Manager, Senior Deputy General Manager , Deputy General Managers, Assistant General Managers, Chief Operating Officer, Chief Risk Officer, Chief Accountant,
Chief Financial Officer, Chief Internal Auditor, Compliance Officer, Head of Treasury, Head of Legal, Head of Information Technology and Board Secretary, Officers serving as consultants or advisors to the Board or bank, and Any other officers falling under the definition of section 3(1)(i)(f ) of the Banking Act, Directions No. 11 and 12 of 2007 on Corporate Governance for Licensed Banks in Sri Lanka.
• Exposure to Stock Market – In view of the current market scenario, the excessive exposure of banks to the stock market may expose banks to systemic risks arising from possible volatility and price bubbles of assets. Such risks which arise from the speculative behaviour of participants of such assets markets may adversely affect the assets quality, liquidity, profitability and capital of banks. In order to mitigate such risks at prudent levels and to promote the safety and soundness of the banking system, the Monetary Board introduced a maximum cap for facilities granted for purchase of listed shares and facilities granted against collateral of listed shares for a period of less than 1 year on total loan outstanding as at the end of the preceding quarter.
• Establishment of an Investment Fund Account – As proposed in budget 2011, every person or partnership that is in the business of banking or financial services, is required to establish and operate an investment fund account. In this regard, taxes are paid after 01 January 2011, every licensed bank shall transfer the funds to the investment fund account in following manner.
(i) 8 per cent of the profits calculated for the payment of Value Added Tax on financial services
(ii) 5 per cent of the profits before tax calculated for the purpose income taxes

Financial System Stability Review 2011
56
Accordingly, banks shall utilise funds in the investment fund account for the purposes as prescribed by the guideline on the operations of the investment fund account issued by the Central Bank of Sri Lanka within three months from the date of transfer to such account.
• In order to enhance disclosure requirements, foreign banks are required to submit disclosures prescribed by the Direction 3(8)(ii) along with annual audited financial statement to the Director Bank Supervision. Further, a summary of the parent bank’s annual corporate governance report shall be published in three languages in the press with the publication of annual audited financial statement with view to enhance corporate governance disclosures.
• Display of Interest Rates, Exchange Rates, Service Charges and Fees and Commissions – To further improve the market efficiency by promoting healthy competition among banks, the Central Bank instructed all the banks to expand the disclosures on interest rates of deposits and lending products, exchange rates and to display details of fees commissions and other service charges in all banking outlets and publish it in bank’s web sites, commencing from 01 August 2011.
• Exposure draft on moving to advanced approaches in calculating the capital charge for operational risk under Pillar I of Basel II capital accord was issued to the banks.
4.6 Global regulatory reforms
• The most significant change for the banking sector will be the new financial instruments standard, IFRS 9. It will replace the current IAS 39 Financial Instruments: Recognition and Measurement and consist of three phases: classification and measurement, impairment, and hedge accounting. The impact of IFRS 9 for banks will be considerable. Almost the entire asset side of the balance sheet will be affected, while the processes for determining the loan loss provision for items at amortized cost will be dramatically different. However, a greater use of hedge accounting should be possible. It should also be noted that the issues related to portfolio hedging will only be addressed by the International Accounting Standard Board when it publishes a separate exposure draft.
• Further, on the liquidity regime side, several major initiatives are underway. The BASEL committee has proposed a liquidity coverage ratio requirement for globally active banks. In essence, this standard would require that large, internationally active banks hold sufficient short-term, liquid assets so that a bank could fund its operations for at least 30 days, without needing to borrow funds from the Central Bank. By creating a pool of liquid assets that the bank could sell or allow to mature, the liquidity buffer would buy time for the bank to explore options to restore market confidence.
57
Chapter 4 – Banking Sector
Customer Charter of Licensed Banks
Box 5
to resolve their disputes: It has been highlighted that many banks did not have proper complaints resolution mechanisms and their customers have to wait longer period to get resolution from banks. Further, most of the customers did not know the formal dispute resolution mechanism for their grievances through the Financial Ombudsman or legal system.
(d) Lack of understanding of customers’ knowledge: The banks did not have a mechanism to ensure that their customers p o s s e s s e n o u g h k n o w l e d g e a n d understanding of banks’ products/services. The technology innovations and market competitions have created new products/services in the financial market. Even though the people are with enough funds to invest, but they are not aware about the new investment opportunities.
(e) Failure of customers to fulfil their obligations towards banks: The lapses on the part of customers on their obligations towards banks have affected their relationships with banks and the ability to continue similar services from banks. Certain customers behave in a manner that would jeopardise the good services offered by banks especially the non-payment of loan dues in time.
The above position, if left unattended, would have lead to a situation where the general public lose their confidence/faith in the banking sector and the growth-enhancing benefits of financial inclusion may be curtailed or severely undermined. In this context, Central Bank of Sri Lanka felt that it is imperative to introduce certain ethical standards and norms for the banking sector on customer protection in order to safeguard the interests of both bank customers and banks and to build up a healthy relationship between the two. This would ensure customer confidence and stability in the banking sector. The recent global financial
The customer-bank relationship is the key to financial inclusion and financial system stability. During the recent past, the Central Bank has observed an increasing trend in disputes between banks and their customers in the recent past. Closure scrutiny of a large number of complaints of banks’ customers revealed several lapses on the part of banks on customer care and protection while customers of banks also have displaced their disinclination to comply with certain requirements that they were willing to comply with at the time of initiating the relationship with banks as stated below:
(a) Failure to disseminate information: Many banks have failed to ensure that their customers receive all the relevant information about each and every product or service that they offer and clearly understand the contents to make their informed decisions. Further, non-display of information such as interest rates on deposits and advances, exchange rates etc., in banks, branches and other banking outlets have caused problems to the customers in making their decisions early.
(b) Failure to ensure that customers are not subject to unfair or deceptive practices: Such practices as publication of misleading and unethical advertisements in the media, unhealthy sales promotion and recovery methods by outsourced parties of banks, discontinuation or premature withdrawal of a product or service offered before its maturity, breach of confidentiality and security of customers’ data and sharing customer information with entities which are legally authorised/permitted to receive without the customer’s knowledge have lead to tarnish the relationship between banks and their customers.
(c) Failure of banks to ensure that customers have access to recourse mechanisms

Financial System Stability Review 2011
58
Box 5 (Contd.)
(e) Displaying information such as interest rates, foreign exchange rates, contact details of the Financial Ombudsman, banking hours and holidays, in the head offices, branches and other banking outlets.
(f) Improving customer awareness on financial products/services.
(g) Protecting customers from any harassment, abusive debt collection practices, disclosure of personal information to others, by agents appointed by banks.
(h) Assisting elderly, differently-abled, or customers with low financial literacy, to have fair access to banking services.
The Charter also incorporates certain customer obligations towards banks. These would cover, inter alia;
(a) Disclosing of all relevant information and any changes relating to the customers to the banks,
(b) Acquiring full knowledge and understanding of the product/service offered by banks before entering into contract,
(c) Exercising due care in all transactions,
(d) Notifying the bank of any fraudulent transaction/s.
Finally, the banks and customers are expected to adhere to these minimum standards stipulated in the charter and strengthen their relationships. It is envisaged that the banks would adopt further improvements in their norms, standards and code of conduct in relation to customer protection in line with the charter and ensure the financial system stability in the country.
crisis highlighted the importance of financial consumer protection for the long-term stability of the global financial system. At the same time, rapid technology innovations and increases in the use of financial services in the financial sector have indicated the need for strengthened financial regulation and consumer education to protect and empower consumers.
The Central Bank has issued the ‘Customer Charter of Licensed Banks’ with a Direction, mandating the charter to be followed by licensed banks and adopt a ‘Code of Conduct’ in banking operations. The Customer Charter includes certain rights and obligations of the banks and customers. The key obligations to be fulfilled by the banks, as set out in the Charter are as follows:
(a) Providing factual information to customers; e.g., description of the products/services; financial and other benefits; fees and charges; commissions; interest rates; procedures to be followed; major terms and conditions; complaint procedures and relief; restrictions on accounts and transactions; compensations on pre-mature withdrawal/termination or cancellation of products/services by banks or by customers; procedures to be followed on foreclosure of properties.
(b) Providing information in languages preferred by customers i.e., Sinhala, Tamil or English.
(c) Assisting customers to fully understand the “Terms & Conditions’ on products/services.
(d) Providing factual information to customers in all advertisements in any media and promotional mater ials , and fur ther clarification or information on those advertisements, if required.

59
Chapter 5 – Other Financial Institutions
µ The performance of the non-bank financial institution sector (registered finance companies and specialized leasing companies) improved as business activity expanded. There were notable improvements in asset quality, profitability and capital adequacy. Several companies listed on the stock exchange and the new Finance Business Act to regulate finance business and to strengthen the supervision of registered finance companies was passed.
µ The rehabilitation of distressed companies through restructuring and recapitalization is being carried out to enable them resume business operations and implement plans to meet depositor obligations.
µ The insurance company sector recorded a higher growth in premium income in the improved business environment, while maintaining its soundness. A new regulatory framework is being put in effect following the amendments to the insurance law.
µ The primary dealer system was stable, healthy and sound with an increase in the capital base and a low level of liquidity and market risks.
µ The unit trust industry expanded with the formation of a number of new funds.
µ Earnings of stock-brokers dipped as the stock market declined, while capital funds increased.
µ Superannuation funds were able to manage their risks adequately.
quality, credit growth and deposit base recorded notable positive performances. The economic progression and improved depositor’s confidence level enabled the NBF sector to expand business volumes. The resolution measures adopted with regard to distressed companies during the year, contributed considerably towards restoring the stability in the sector. Further, several policy measures were also introduced with a view to strengthening the financial soundness and corporate governance in the sector.
5.1 Non-Bank Financial Sector
OverviewThe Non-Bank Financial (NBF) sector showed signs of consolidation during the first nine months of 2011, by strengthening its overall financial position, after a gradual recovery in 2010. The main indicators on capital, profitability, asset
5 Other FinancialInstitutions

60
Financial System Stability Review 2011
Business Growth / Developments
OutreachAt present there are 38 Registered Finance Companies (RFCs) and 18 Specialised Leasing Companies (SLCs) representing the Non-Bank Financial sector. During the first nine months of the year the total number of NBF Institutions (NBFI) in operation decreased to 56 from 57 with the cancellation of one SLC license. Further, during the period, the branch network of NBFIs increased by 48 to 648, out of which 22 branches were opened in the Northern and Eastern provinces.
Sector Growth With the consolidation and expansion of the industry, the number of large NBFIs with assets
over Rs.5 billion has increased from 16 to 21 (Table 5.3). This is reflected in the percentage share of the large NBFI category growing to a share of 86 per cent with an asset base of Rs. 390 billion.
Assets and Liabilities Assets
The total assets base of NBFIs increased by 17 per cent to Rs. 455 billion during the first nine months of 2011 compared to the 18 per cent growth recorded in the corresponding period of 2010. This was mainly attributed to NBFIs being able to carry out their normal business activities
Indicator (Ratio)As at end of September
2009 2010 2011
Net Interest Margin % 3.6 7.5 8.8
Gross NPA Ratio % 9.2 9.7 5.5
Net NPA Ratio % 4.8 4.8 1.9
Specific Provision Coverage Ratio %
37.0 38.7 44.9
Total CAR % 11.5 8.5 10.6
Return on Assets (ROA) % 0.4 3.6 6.3
Return on Equity (ROE) % (2.8) 15.2 38.5
Source : Central Bank of Sri lanka
Table 5.1 Key Financial Indicators of NBF Sector
ProvinceAs at end of No. of
branchesDec. 2010 Sep. 2011
Western 191 205 14
Southern 76 81 5
Sabaragamuwa 45 47 2
North Western 62 64 2
Central 62 64 2
Uva 32 34 2
North Central 46 45 (1)
Eastern 54 63 9
Northern 32 45 13
Total 600 648 48
Source : Central Bank of Sri lanka
Table 5.2 Branch Distribution of NBF by Province
Table 5.3 Market share of NBFIs (in terms of the total assets)
Asset Category
No. of NBFIs(End September)
Total Assets (Gross)
Assets(End September)
(Rs. Bn.)
Share (%)
2010 2011 2010 2011 2010 2011
Small (Assets < Rs.1 bn) 15 13 7.6 7.4 2.2 1.6
Medium (Assets between Rs. 1 bn – Rs. 5 bn) 26 22 69.7 56.8 19.8 12.5
Large (Assets > Rs. 5 bn) 16 21 273.6 390.4 78.0 85.9
All Companies 57 56 350.9 454.6 100.0 100.0
Source : Central Bank of Sri lanka

61
Chapter 5 – Other Financial Institutions
through funds mobilized by way of new deposits and borrowings. Due to the prevailing positive economic milieu, the loan portfolios of NBFIs grew by 34 per cent to Rs. 356 billion during the first nine months of 2011 (Chart 5.1), whereas the previous year’s corresponding period recorded a growth of only 22 per cent. Loans and advances accounted for 78 per cent of NBF sector (Table 5.4) assets and out of that finance leasing and hire purchases accounted for around 41 per cent and 32 per cent, respectively.
Liabilities
Deposits were the major source of funding representing 40 per cent of the total liabilities
while borrowings represent 34 per cent (Table 5.5). The total deposits increased by 24 per cent to Rs. 182 billion during the first nine months of 2011 (Chart 5.2), compared to a growth of 15 per cent of the corresponding period in 2010. The borrowings also rose by 13 per cent for the period under review compared to a growth of 27 per cent in the previous year.
Capital funds increased by a robust 30 per cent to Rs. 57 billion as at end of September 2011, compared to an increase of 6 per cent in 2010. Sustained profitability and the revival of the distressed companies have been instrumental in strengthening the capital funds of the sector.
Deposits (Rs.Mn) Growth (%)
(Rs.Mn) (%)
28.4
18.7
4.0
52.2
50,000
0
100,000
150,000
200,000
250,000
Sep-07 Sep-08 Sep-09 Sep-10 Sep-11
10.0
10.0
20.0
30.0
40.0
50.0
60.0(Rs.Mn)
0
50,000
100,000
150,000
200,000
250,000
Jan Feb Mar Apr May Jun Jul Aug Sep Oct Nov Dec
2010 2011
Trend in Loans and AdvancesLoans and Advances – Amount and Growth
Chart 5.1 Total Accommodations of Non-Bank Financial Sector
Source : Central Bank of Sri Lanka
Table 5.4 Market share of NBFIs (in terms of the total assets)
Item
As at end of September 2010
As at end of September 2011(a)
Growth % during the first nine months of the year
Amount(Rs. Bn.)
% of shareAmount(Rs. Bn.)
% of Share 2010 2011
Advances 240.1 68.4 356.0 78.3 22.4 34.1
Investments 19.0 5.4 14.2 3.1 70.5 (43.7)
Other Assets 91.8 26.2 84.4 18.6 2.3 (12.8)
Total Assets 350.9 100 454.6 100 18.1 17.3
(a) Provisional Source : Central Bank of Sri Lanka

62
Financial System Stability Review 2011
2013 in order to meet the revised minimum core capital requirement of Rs. 300 million. Fifteen companies (including six distressed RFCs) would need to raise this amount. The distressed companies represent 95 per cent of the funding deficit and five of these companies have not obtained listing on the CSE yet. Further, in order to meet the minimum core capital threshold of Rs. 400 million by end 2014, the industry would need to further source circa Rs. 2 billion.
ii. As RFCs expand and grow in size, there could be high competition for funds which may affect the small entities with lower asset and capital bases leading to liquidity constraints.
Listing RequirementAll RFCs were required to obtain a listing on the Colombo Stock Exchange. This listing requirement for RFCs is expected to improve transparency and accountability in the sector while increasing the depositor confidence. Further, this would enable the industry to opt for new capital by accessing public funds in order to meet the future capital requirements.
Risk AssessmentRFC Sector
i. The industry requires to find new capital worth of circa Rs.12 billion by end of year
Table 5.5 Composition of Liabilities
Item
As at end of September 2010
As at end of September 2011(a)
Growth % during the first nine months of the year
Amount(Rs. Bn.)
% of shareAmount(Rs. Bn.)
% of Share 2010 2011
Capital Funds 41.9 11.9 57.2 12.6 5.5 29.7
Deposits 137.5 39.3 181.7 40.0 14.8 24.4
Borrowings 118.4 33.7 156.8 34.4 27.2 12.9
Other Liabilities 53.1 15.1 58.9 13.0 19.3 1.0
Total Liabilities 350.9 100 454.6 100 18.1 17.3
(a) Provisional Source : Central Bank of Sri Lanka
Chart 5.2 Total Deposits of Non-Bank Financial Sector
Trend in DepositsTotal Deposits – Amount and Growth
Deposits (Rs.Mn) Growth (%)
(Rs.Mn) (%)
0
21.1
36.5
12.1
32.2
40,000
80,000
120,000
160,000
200,000
Sep-07 Sep-08 Sep-09 Sep-10 Sep-11
5.0
0.0
10.0
15.0
20.0
25.0
30.0
35.0
40.0(Rs.Mn)
0Jan Feb Mar Apr May Jun Jul Aug Sep Oct Nov Dec
2010 2011
50,000
100,000
150,000
200,000
Source : Central Bank of Sri Lanka

63
Chapter 5 – Other Financial Institutions
minimum capital requirement being raised from Rs. 75 million to Rs. 300 million over a period of 5 years, the capital base of SLCs is expected to improve.
ii. SLCs’ contribution to the leasing industry is at 28 per cent of the industry. Some SLCs have leasing portfolios smaller than 10 per cent of their total assets. Banks are the main provider of finance leasing to the industry and it represents 38 per cent of the industry. RFCs contribution is about 34 per cent. Therefore, about 72 per cent of the market demand for lease facilities is met by banks and RFCs.
iii. The large SLCs category represents 87 per cent of the sector assets base. These large SLCs are larger than some of the RFCs, but are being regulated under the less stringent Finance Leasing Act. Hence, the large SLCs are encouraged to register under the RFC status.
Credit RiskAsset quality of the NBF sector has shown a noteworthy improvement during the period under review. In terms of non-performing advances to total advances ratio (NPA ratio)
iii. The overall RFC industry has an exposure of 27 per cent of capital funds to equity investment as at September 2011, whereas according to the RFC directions the threshold is 25 per cent of capital funds. The exposure to equity as a percentage of industry asset base remains 3 per cent. However the exposure to equity has abated during 2011, with the rapid growth of capital funds attributable to fresh capital and healthy profits. Hence, it’s envisaged that the overall exposure to equity would reduce further in the future periods.
iv. The RFC sector needs to adopt best practices in corporate governance and risk management frameworks as most of the companies are still entrenched with traditional practices which hinders the industry repositioning to a sustainable growth phase.
SLC Sector
i. SLC sector has concentrated more on borrowings, rather than maintaining a healthy level of capital funds. Borrowings represent 70 per cent of total liabilities while capital funds represent only 18 per cent of total liabilities. However, with the
Chart 5.3 Credit Risk Indicators of Non-Bank Financial Sector
Trend in Non-Performing AdvancesNon-Performing Advances – Amount and Ratios(Rs.Mn) (%)
8,126 11,682 17,652 23,395 19,810
4.95.9
9.29.7
1.92.9
4.8 4.8
1.9
5.6
4,000
0
8,000
12,000
16,000
20,000
24,000
28,000
Sep-07 Sep-08 Sep-09 Sep-10 Sep-11
2.0
0.0
4.0
6.0
8.0
10.0
12.0
Gross Non-PerformingAdvances (Rs.Mn)
GrossNPA Ratio (%)
NetNPA Ratio (%)
0
19,810
4,000
8,000
12,000
16,000
20,000
24,000
28,000
Jan Feb Mar Apr May Jun Jul Aug Sep Oct Nov Dec
2009 2010 2011
(Rs.Mn)
Source : Central Bank of Sri Lanka

64
Financial System Stability Review 2011
2011 compared to Rs. 12 billion reported in the corresponding period of 2010. The core capital to Risk Weighted Assets ratio and the capital base to Risk Weighted Assets ratio of sector increased to 10 per cent and 11 per cent respectively as at end of September 2011 from 5 per cent and 6 per cent in 2010.
Profitability
NBFIs continued to augment profitability levels during 2011. For the first nine months of 2011, the total interest income increased by 26 per cent to Rs. 48 billion and the net-interest income increased by 42 per cent to Rs. 23 billion (Table 5.6). This is largely due to the reduced funding costs and renewed business activities. Consequently, the sector profitability increased substantially recording a profit before tax of Rs. 20 billion for the period under review compared to a Rs. 9 billion profit before tax recorded for the same period in 2010. Increase in profits was reflected in improved annualized Return on Assets and Returns on Equity which stood at 6 per cent and 39 per cent, respectively, as at end of September 2011 compared to 4 per cent and 16 per cent, respectively in 2010 (Chart 5.4).
which is an indicator of the credit risk, has improved from 7.9 per cent as at end of 2010 to 5.6 per cent as at end of September 2011 (Chart 5.3), mainly due to growth in advances portfolio. The total amount of non-performing accommodations abated by 5 per cent to Rs.19.8 billion from Rs.20.9 billion during the period under review. Further, the asset quality of the sector is envisaged to improve with rapidly expanding loan portfolio and efforts taken by the distressed companies to reduce their exposures in NPAs.
Liquidity Risk
The overall liquidity position of the sector has improved significantly owing to the rapid deposits growth and fresh capital infusion. Improved liquidity position has enabled the NBFIs to increase their lending portfolios. However, as at end September 2011, nine RFCs were unable to maintain the regulatory liquidity requirement due to continued losses and excessive demand for the deposit withdrawals. The statutory liquidity requirements were introduced for SLCs to be effective from 2012.
Availability of Resources to Mitigate Risks
Capital
Capital funds of the NBF sector increased by 30 per cent to Rs. 57 billion during the first nine months in 2011 compared to the 6 per cent growth recorded in the corresponding period of 2010. This was mainly due to increasing in profitability and infusion of fresh capital. The sector has reported Tier I capital of Rs. 52 billion while Tier II capital was Rs. 3 billion at end September 2011. The capital base of the sector has significantly increased by 325 per cent to Rs. 51 billion during the first nine months in
Item
Amount(During the nine
months period ended)(Rs. bn)
Growth (%)
Sep. 2010
Sep. 2011(a)
Interest Income 38.5 48.3 25.5
Interest Expenses 22.2 25.2 13.7
Net Interest Income 16.3 23.1 41.6
Non-Interest Income 9.2 14.0 52.4
Non-Interest Expenses 14.7 18.8 27.8
Profit Before Tax 9.1 19.8 117.3
Profit After Tax 4.9 14.9 205.4
(a) Provisional Source : Central Bank of Sri lanka
Table 5.6 Composition of Profit and Loss Account
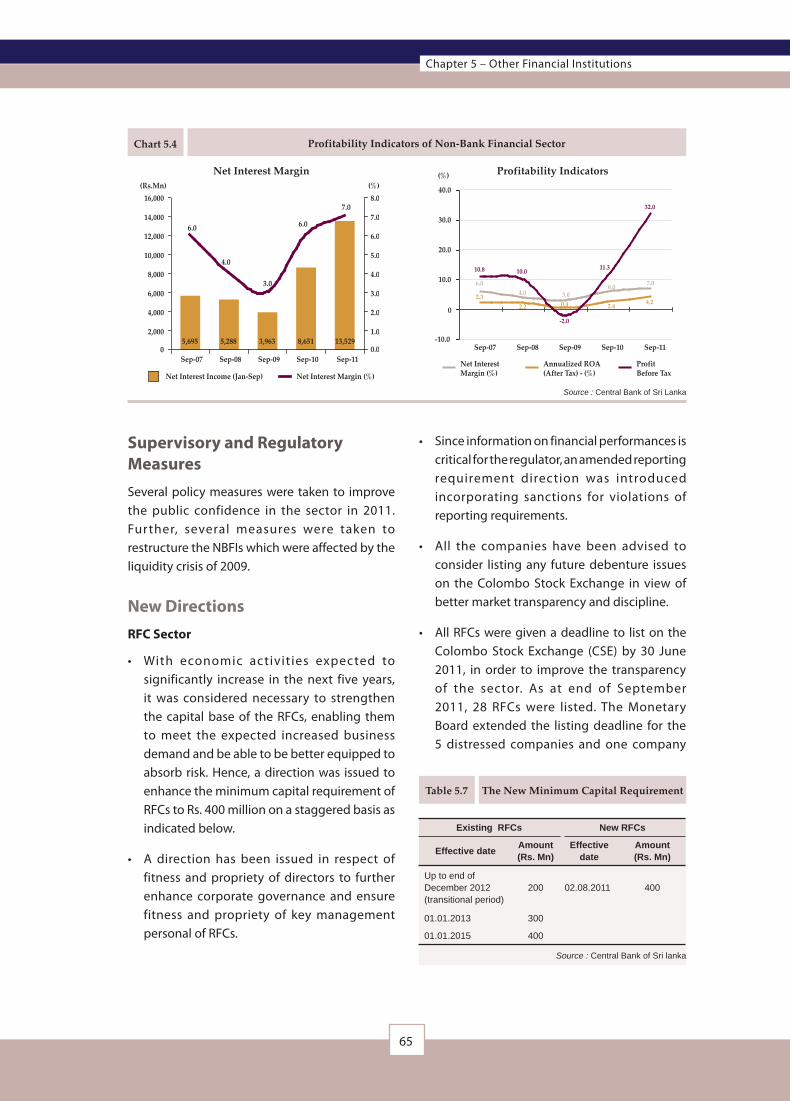
65
Chapter 5 – Other Financial Institutions
0
(%)
6.0
10.0
4.0 3.06.0 7.0
2.32.2 0.4 2.4 4.2
10.8
-2.0
11.3
32.0
-10.0
10.0
20.0
30.0
40.0
Sep-07 Sep-08 Sep-09 Sep-10 Sep-11
Net InterestMargin (%)
Annualized ROA(After Tax) - (%)
ProfitBefore Tax
• Since information on financial performances is critical for the regulator, an amended reporting requirement direction was introduced incorporating sanctions for violations of reporting requirements.
• All the companies have been advised to consider listing any future debenture issues on the Colombo Stock Exchange in view of better market transparency and discipline.
• All RFCs were given a deadline to list on the Colombo Stock Exchange (CSE) by 30 June 2011, in order to improve the transparency of the sector. As at end of September 2011, 28 RFCs were listed. The Monetary Board extended the listing deadline for the 5 distressed companies and one company
Supervisory and Regulatory MeasuresSeveral policy measures were taken to improve the public confidence in the sector in 2011. Further, several measures were taken to restructure the NBFIs which were affected by the liquidity crisis of 2009.
New DirectionsRFC Sector
• With economic activities expected to significantly increase in the next five years, it was considered necessary to strengthen the capital base of the RFCs, enabling them to meet the expected increased business demand and be able to be better equipped to absorb risk. Hence, a direction was issued to enhance the minimum capital requirement of RFCs to Rs. 400 million on a staggered basis as indicated below.
• A direction has been issued in respect of fitness and propriety of directors to further enhance corporate governance and ensure fitness and propriety of key management personal of RFCs.
Chart 5.4 Profitability Indicators of Non-Bank Financial Sector
Profitability IndicatorsNet Interest Margin(Rs.Mn) (%)
05,695 5,288 3,963 8,651 13,529
4.0
6.06.0
3.0
7.0
2,000
4,000
6,000
8,000
10,000
12,000
14,000
16,000
Sep-07 Sep-08 Sep-09 Sep-10 Sep-11
1.0
0.0
2.0
3.0
4.0
5.0
6.0
7.0
8.0
Net Interest Income (Jan-Sep) Net Interest Margin (%)
Source : Central Bank of Sri Lanka
Existing RFCs New RFCs
Effective dateAmount (Rs. Mn)
Effective date
Amount (Rs. Mn)
Up to end of December 2012 (transitional period)
200 02.08.2011 400
01.01.2013 300
01.01.2015 400
Table 5.7 The New Minimum Capital Requirement
Source : Central Bank of Sri lanka

66
Financial System Stability Review 2011
was exempt from the listing requirement pending a merger and another was given a one year period. The remaining two companies are expected to be listed by 31.12.2011.
• The Finance Business Act, No.42 of 2011, with more investigative powers, a broadened definition for finance business and enhanced penalties for offences has been passed in parliament, repealing and replacing the existing the Finance Companies Act. Below are some of the main features of the Act;
– Making deposit taking without authority an offence
– Defining the term “deposit”
– Enhancing the Examination/Investigative powers
– Enhancing powers to curb unauthorized finance business
– Restricting the use of the words ‘finance’, ‘financing’ and ‘financial’ in a name or description of an entity
– Prohibiting the use of name, abbreviated name or acronym of a licensed finance company by any other company
– Enhancing supervisory action on licensed finance companies
– Enhancing public disclosure
SLC Sector
• The risk weighted capital adequacy ratios were introduced to SLCs sector to ensure that SLCs are adequately capitalized to mitigate risks. Currently, such ratios are implemented for banks and finance companies in compliance with best practices/Basel standards.
• As SLCs mobilize funds through issuing debt instruments, a liquid assets direction was introduced to minimize liquidity risk of SLCs. All SLCs are required to maintain 5 per cent
of the total liabilities excluding shareholder funds with effect from 01.01.2012 and 10 per cent with effect from 01.01.2013.
• A structural changes direction was issued requiring SLCs to obtain prior approval from the Central Bank with regard to selling of the business, establishment of subsidiary companies and any corporate changes by SLCs.
Resolution Measures
• During the year 2011, seven distressed companies (six RFCs and one SLC) affected by the liquidity crisis were restructured. The major measures included appointment of Managing Agents for 5 companies, restructuring of the balance sheet and identifying strategic investors.
• Managing Agents have now been released from 4 companies.
• Balance sheets of 4 companies have been restructured by way of converting deposits and debt into equity (one is fully completed and three are in progress).
• Strategic investments have been completed in 6 companies.
• Boards of Directors were reconstituted in six companies.
• Special directions have been issued to facilitate the revival of business.
• Five companies have commenced normal business operations.
• All distressed RFCs & SLCs are envisaged to revitalise their businesses fully during the first half of 2012 and obtain listing in 2012 or 2013.

67
Chapter 5 – Other Financial Institutions
Finance Business Act
Box 6
is empowered to make further exclusions by notice published in the Gazette. Further, the Monetary Board is vested with the power to determine whether a sum of money transacted is a deposit in certain instances having regard to the frequency of those occasions and to the characteristics thereof.
• Accepting deposits without authority is an offence punishable on conviction after a trial before the High Court.
(b) Easy identification of a finance company by its name
• It has been made mandatory for any licensed finance company to have the word ‘finance’, ‘financing’ or ‘financial’ as part of its name. Every licensed finance company which does not have one of those words in their name currently will have to comply with the requirement within six months from the Act.
• The other institutions are prohibited from using the word ‘finance’ ‘financing’ or ‘financial’ or any of its derivatives, or its transliterations or their equivalent in any other language in their name or description without the prior written approval of the Monetary Board. All the entities i.e., companies, societies, non governmental organisat ions, partnerships, sole proprietorships which currently use one of those words are required to delete such words from their names within six months from the commencement of the operation of the Act.
These provisions will enable the public to identify a licensed finance company by its very name, thus preventing fraudulent companies from misleading the public.
The Finance Business Act, No. 42 of 2011 came into force on 09.11.2011 repealing and replacing the Finance Companies Act, No. 78 of 1988 for the better regulation of finance business. The need to amend the Finance Companies Act which was enacted over 20 years ago, has been felt by the financial sector as well as the regulator considering the developments in the sector over the years. The new Act has enhanced the examination and supervisory powers of the Regulator in respect of the licensed finance companies and further enhanced the legal provisions to effectively curb unauthorised deposit taking businesses.
Salient Features
Several new provisions have been introduced in the Act for the effective regulation and supervision of finance business, with a view to ensuring financial system stability.
(a) Definition of “Deposit”
• As accepting a deposit is an integral part of finance business, a definition for the term “deposit” is a long felt need. A “deposit” is defined in the Act as a sum of money paid on terms under which it will be repaid, with or without interest or a premium, and either on demand or at a time or in circumstances agreed to by or on behalf of the person making the payment and the person receiving it.
• This broad definition however, has been contained to a certain extent by several exclusions. For example, money paid to an Insurer under the Regulation of Insurance Industry Act, bonds or debentures fully secured by assets of the company and listed debt instruments do not come within the definition of deposit. The Monetary Board of the Central Bank

68
Financial System Stability Review 2011
Box 6 (Contd.)
(f) Enhanced Regulatory powers
• Examina t ion powers have been enhanced in respect of licensed finance companies.
• Investigation powers have been enhanced in respect of persons accepting deposits without authority.
• Disqualification criteria have been speci f ied for d i rec tors and key management personnel of licensed finance companies to ensure their fitness and propriety and good governance for companies.
(g) Abetting to commit an offence
• The Act states that any person who abets, conspires or attempts to commit an offence under the Act will be guilty of an offence and shall be punishable in the same manner as punishable for the substantive offence.
• Hence placing of deposits with persons accepting deposits without authority is an offence of abetting and will be liable on conviction for the same penalty as for unauthorised deposit taking i.e., imprisonment not exceeding five years, fine not exceeding five million rupees or both.
(h) Stringent penalties
• Carrying on finance business without authority and accepting deposits without authority are made offences punishable on conviction after a trial before the High Court with an imprisonment not exceeding five years, fine not exceeding five million rupees or both. For the other offences, on conviction after a trial before a Magistrate, a penalty not exceeding three year imprisonment, fine not exceeding three million rupees or both can be imposed as specified in the Act.
(c) Use o f name s o f l ice nse d f i nance companies by others is restricted
• Prohibits the use of name, abbreviated name or acronym of a licensed finance company by any other company in any of its advertisements promoting its business in order to prevent fraudulent companies from misrepresenting and misleading the public by using names similar to names or acronyms of licensed finance companies.
• Prohibits a company to register with a name that contains as part of it, the abbreviated name or acronym of any finance company without the approval of the Director of the Department of Supervision of Non-Bank Financial Institutions of the Central Bank of Sri Lanka.
(d) Ban on advertising soliciting deposits without authority
• Advertising to solicit deposits without authority is an offence.
• In addition, publication of advertisements soliciting deposits without authority is an offence. Media institutions are required to verify from the advertiser whether he is authorised to accept deposits before publishing an advertisement which solicits deposits.
(e) Responsibility on employees of banks and finance companies
• Employees of licensed banks and finance companies are required under the Act to inform the Director of the Department of Supervision of Non-Bank Financial Institutions of the Central Bank of Sri Lanka of any person whom he has reasonable suspicion of accepting deposits from the public without authority.

69
Chapter 5 – Other Financial Institutions
7 insurance companies that are listed on the Colombo Stock Exchange (CSE). The National Insurance Trust Fund (NITF) which was established by the National Insurance Trust Fund Act was now brought under the purview of the IBSL.
The insurance sector is highly concentrated, with 2 companies accounting for 62 per cent of total assets and 5 companies accounting for 90 per cent of total assets of the sector at end September 2011. The state-owned composite insurance company accounts for 40 per cent of total assets and 42 per cent of composite insurance assets. The life insurance sub-sector is dominated by 3 insurers accounting for 83 per cent of total assets and the 2 largest general insurers account for 57 per cent of the assets of this sub-sector.
The insurance company sector accounts for about 3 per cent of the total assets of the financial sector. Insurance penetration measures the level of insurance activity relative to the size of the economy. Insurance penetration (total premium as a percentage of GDP) in Sri Lanka was 1.2 per cent, with general insurance accounting for 0.7 per cent and long-term insurance accounting for 0.5 per cent. The average level of insurance penetration in Asian countries is 6.2 per cent (general insurance – 1.6 per cent and long-term insurance – 4.5 per cent). Insurance density (the ratio of premiums to total popula-tion) in Sri Lanka was 30, while the average for Asian countries was 282. These figures indicate that insurance penetration and density in Sri Lanka is relatively low in comparison with other Asian countries which points to immense potential for the further expansion of the industry.
AssetsTotal assets of insurance companies amounted to Rs. 250 billion as at end September 2011, registering an increase of 12 per cent from the end of 2010. The average annual growth of total
Action Taken to Combat Unauthorized Finance Institutions • The CBSL continued its investigations on
institutions allegedly engaging in finance business without authorization and has taken legal action against such institutions while continuously educating public of the risk of investing in unauthorized finance business.
• During the period under review, the customer complaints received by the Department on unauthorized institutions have reduced compared to the previous corresponding period which reflects the downward trend of the activities of unauthorized finance business. Further, noted increased vigilance of public on the legality of institutions prior to making investment decision. Increased awareness among public specifically in rural areas through seminars and audio programs conducted jointly with Sri Lanka Broadcasting Corporation on the activities of registered institutions and unauthorized finance businesses complements the situation. At the same time, legal action was taken against the institutions engaged in unauthorized finance business.
• Steps are being taken to establish a separate regulatory and supervisory mechanism to regularize business activities of microfinance institutions in the country.
5.2 Insurance Companies
OverviewThere are 19 insurance companies registered by the Insurance Board of Sri Lanka (IBSL). Of these, 12 companies are composite insurers engaged in both long-term and general insurance business, while 5 companies are only in general insurance business and 2 companies are only in long-term insurance business. There are

70
Financial System Stability Review 2011
accounted for 32 per cent of the total insurance assets.
PremiumsThe premium income of insurance companies grew robustly in 2011 on account of the improved business environment. The total gross written premium (GWP) of insurance companies rose by 23 per cent to Rs. 59 billion in the first nine months of 2011 compared with an increase of 17 per cent in the same period of 2010. The average annual growth of GWP for the last ten years was 17 per cent
The GWP for long-term insurance (which accounted for 44 per cent of total GWP) grew by 21 per cent to Rs. 26 billion in the first nine months of 2011 compared with an increase of 31 per cent in the first nine months of 2010. The average annual growth of GWP for long-term insurance was 18 per cent for the period 2001 – 2010.
The GWP of general insurance (which accounted for 56 per cent of total GWP) increased by 24 per
assets of insurance companies for the last 5 year and 10 year period was 16 per cent and 23 per cent respectively. The total assets of long-term insurance increased by 15 per cent to Rs. 169 billion at end September 2011 and accounted for 68 per cent of total insurance assets. The total assets of general insurance increased by 9 per cent to Rs. 81 billion at end September 2011 and
Chart 5.5 Total Assets of Insurance Companies
Rs. b
illio
n
Life Insurance General Insurance
0
40
80
120
160
200
2007 2008 2009 2010 2011September
Source : Insurance Board of Sri Lanka
Table 5.8 Insurance Penetration and Density in selected countries of Asia – 2010
Insurance penetration(in per cent)
Insurance Density(premiums per capita USD)
Total Business Life General Total Business Life General
Japan 10.1 8.0 2.1 4,390 3,473 917
Singapore 6.1 4.6 1.6 2,823 2,101 722
India 5.2 4.6 0.6 64 56 9
Malaysia 4.8 3.2 1.6 421 283 138
Thailand 4.3 2.6 1.7 154 92 63
PR China 3.8 2.5 1.3 158 107 53
Philippines 1.1 0.7 0.4 23 14 8
Sri Lanka* 1.2 0.5 0.7 30 14 16
Indonesia 1.5 1.0 0.5 46 31 15
Pakistan 0.7 0.3 0.3 6 3 3
Europe 7.5 4.5 3.0 1,850 1,111 740
Asia 6.2 4.5 1.6 282 208 74
Africa 3.9 2.7 1.1 65 46 19
World 7.0 4.0 3.0 595 341 254
* The indicators for Sri Lanka have been calculated Source : Swiss Re, Sigma No. 2/2010 World Insurance in 2010 by the Central Bank of Sri Lanka.

71
Chapter 5 – Other Financial Institutions
cent to Rs. 33 billion in the first nine months of 2011, compared with an increase of 8 per cent in the first nine months of 2010. The annual growth of GWP for general insurance was 16 per cent for the period 2001 – 2010.
All major sub-classes of general insurance except marine insurance contributed to premium growth in the first nine months of 2011. The GWP of motor insurance (which is the largest segment of general insurance accounting for 61 per cent) increased by 32 per cent. The reduction in import duty on motor vehicles and access to leasing finance at attractive interest rates boosted the motor insurance business. The GWP of miscellaneous insurance representing 20 per cent of total premium, increased by 17 per cent, while the GWP of fire insurance representing 16 per cent of total premiums, increased by 11 per cent. Premium income for marine insurance which constitutes 4 per cent of the total premiums declined by 6 per cent.
The net premium income (GWP minus reinsurance premium) for general insurance rose by 29 per cent in the first nine months of 2011, due to significant increase in premium income. The net premium income in all classes of general insurance increased. The net premium for long
term insurance also increased by 21 per cent in the first nine months of 2011.
The retention ratio (the ratio of net premium to total GWP) of general insurance sector increased to 78 per cent in the first nine months of 2011 from 75 per cent in the same period of 2010. Consequently, the ceded ratio (reinsurance premium to total GWP) which covers the large risks of insurance companies declined to 22 per cent in the first nine months of 2011. Motor insurance continued to maintain the highest retention ratio of 98 per cent. The retention ratios for miscellaneous and marine insurance were 74 per cent and 46 per cent, respectively. Fire insurance recorded the lowest retention ratio of 20 per cent. The retention ratio of long-term insurance remained unchanged at 96 per cent.
The total claims of insurance companies increased by 7 per cent to Rs. 24 billion in the first nine months of 2011. General insurance claims increased by 26 per cent, while the claims on long-term insurance declined by 16 per cent. Consequently, the ratio of claims to earned premium (earned premium is GWP adjusted by the unearned premium provisions at the beginning and end of the accounting period)
Chart 5.6Premium Income and Growth of
Insurance Companies
GeneralInsurance
LifeInsurance
Total PremiumGrowth
(Rs.Bn) (%)
-10
0
10
20
30
40
50
2007 2008 2009 2010 2011(Estimated)
-5
0
5
10
15
20
25
Source : Insurance Board of Sri Lanka
Chart 5.7Sector-wise Premium Distribution of
General Insurance
Per c
ent
Motor Miscellaneous Fire Marine
0
10
20
30
40
50
60
70
2007 2008 2009 2010 2011September
Source : Insurance Board of Sri Lanka

72
Financial System Stability Review 2011
for general insurance increased to 66 per cent in the first nine months of 2011 from 65 per cent in the same period of 2010, due to higher claims recorded for motor and marine insurance. The claims ratio for long-term insurance declined from 51 per cent to 35 per cent, mainly due to a decline in claims of long-term insurance and higher growth in earned premium during the period under review. The bulk of the claims were on account of motor insurance, which recorded a claims ratio of 66 per cent in the first nine months of 2011. The claims ratio for miscellaneous, fire and marine insurance were 65 per cent, 44 per cent and 30 per cent, respectively, in the first nine months of 2011.
InvestmentsTotal investment income of insurance companies declined by 21 per cent to Rs. 18 billion during the first nine months of 2011, as against an increase of 96 per cent in the same period of 2010 on account of the decline in stock market prices and yields on government securities. The investment income ratio (investment income to net premium) of insurance companies declined to 36 per cent at end September 2011 from 57 per cent at end September 2010. The decline in investment income is likely to continue in
the latter part of the of the year. This may have adverse impact on the profitability of insurance companies in 2011. Investments in government securities accounted for 43 per cent of the total assets of insurance companies. (Government securit ies accounted for 51 per cent of long-term insurance assets and 28 per cent of general insurance assets). The total share of equities and corporate debt securities in the total assets of insurance companies amounted to 16 per cent and 6 per cent, respectively.
Insurance companies are required to invest a minimum of 20 per cent of technical reserves of general insurance and 30 per cent of long-term funds in government securities. All insurance companies complied with this statutory requirement.
ProfitsThe combined operating ratio is a financial measure of insurance underwriting (core) profitability and is expressed as the total of claims costs, commissions and management expenses as a percentage of premiums. The combined operating ratio for both general and long-term insurance declined reflecting increased underwriting profits in the first nine
Chart 5.8 Distribution of Assets of Insurace Companies
General InsuranceLife Insurance
Source : Central Bank of Sri Lanka
Fixed Assets4.6%Investmentin Associates0.3%Loans3.1%
GovernmentSecurities50.8%
Equities16.6%
Corporate Debt6.8%
ReinsuranceReceivable
0.2%
Cash and Deposits 12.2%
Other Assets5.2% Fixed Assets
10.1%
Investmentin Associates11.7%
Loans0.9%
GovernmentSecurities27.5%Equities
13.1%
Corporate Debt3.0%
ReinsurancePremium and
Receivable16.8%
Cash and Deposits 8.2%
Other Assets8.7%

73
Chapter 5 – Other Financial Institutions
on investments. The majority of the companies made overall profits. Profit before tax of general insurance declined by 55 per cent, while profit on long-term insurance increased by 310 per cent. Consequently, the return on equity (ROE) for general insurance declined to 6 per cent in the first nine months of 2011 from 16 per cent in the same period of the previous year. The return on assets (ROA) for general insurance declined to 3 per cent in the first nine months of 2011 from 7 per cent in the same period of 2010. The ROA for long-term insurance rose to 3 per cent in the first nine months of 2011 from 1 per cent in the same period of 2010.
SolvencyThe solvency margin is the main indicator of soundness of insurance companies, as it measures the adequacy of capital to meet obligations. All insurance companies met the statutory solvency margin requirement for both general and long-term insurance at end September 2011. The solvency margin ratio for the long-term insurance increased to 7.5 times at end September 2011 from 7.2 times at end September 2010. The solvency margin ratio for general insurance declined to 1.8 times at end September 2011 from 3.3 times at end September 2010, on account of higher liabilities and lower admissible assets. The IBSL revised the solvency margin rules in 2011 with regard to the valuation of assets.
All insurance companies were able to meet their claims in 2011. The IBSL requires insurance companies to obtain a rating of Insurers’ Financial Strength (IFS) indicating their ability to pay claims, from a recognized rating agency and 5 companies had obtained this rating. The IBSL administers the Policy Holders Protection Fund which is funded from a cess collected from insurance companies and is invested in government securities.
months of 2011. The combined operating ratio for general insurance marginally declined to 87.8 per cent in the first nine months of 2011 from 88.1 per cent in the same period of 2010. The combined operating ratio for long-term insurance also declined to 61.0 per cent in the first nine months of 2011 from 72.4 per cent in the corresponding period of the previous year. The improved claims ratio of long-term insurance and management expenses ratio of general insurance mainly contributed to a decline of the combined operating ratio for both long-term and general insurance.
The underwriting profits of general insurance increased by 7 per cent in the first nine months of 2011. However, the underwriting ratio (the ratio of underwriting profit to net earned premium) of general insurance declined to 18 per cent in the first nine months of 2011 from 21 per cent in the first nine months of 2010, mainly due to higher growth in net earned premium. All companies, except four, made underwriting profit during the period under review.
The overall profits of insurance companies increased by 22 per cent in the first nine months of 2011 on account of the higher growth in premium income and despite the lower earnings
Chart 5.9Combined Operating Ratio of
Insurance Companies (as at end period)Pe
r cen
t
1Q 2Q 3Q 4Q 1Q 2Q 3Q 4Q 1Q 2Q 3Q
2009 2010 2011
Life Insurance General Insurance
40
60
80
100
120
Source : Insurance Board of Sri Lanka

74
Financial System Stability Review 2011
RisksThe main risks that insurance companies face are underwriting risk and market risk. With regard to underwriting risks, insurance companies have improved their underwriting results. However, insurance companies will have to focus on expanding their core business in the growing economy. As business activity expands there will be greater opportunities for the growth of general insurance business. In addition, there is huge potential for the growth of life insurance products, such as single premium insurance policies, unit linked insurance products, pension and retirement products, annuities and takaful insurance. The availability of a steady supply of long term investment instruments, such as government and corporate bonds will facilitate the growth of a greater variety of life insurance products. Insurance companies are exposed to market risk on their investments. The downturn
CapitalAll operating insurance companies met the minimum regulatory capital requirements for both general and long-term insurance. The ratio of shareholder funds to total assets increased to 19 per cent at end September 2011 and is at an adequate level. The ratio of capital to technical reserves also increased to 163 per cent. The IBSL has enhanced the minimum capital requirement for each class of insurance business to Rs. 500 million to enable the expansion of the business in a sound manner. The new minimum capital requirement is applicable to new entrants and existing companies have been given time to comply. The IBSL has initiated a project to move to a risk-based capital adequacy framework for insurance companies. The risk-sensitive capital model will apply different capital requirements for different risk profiles based on the asset structure and business mix of companies.
Table 5.9 Key Financial Indicators of Insurance Companies
Sector Indicators 2009 2010 2010 Sep. 2011 Sep.
General Insurance
Solvency Ratio 2.8 2.6 3.3 1.8
Retention (Reinsurance) Ratio 72.7 75.7 74.6 78.2
Liquidity Ratio 62.0 63.0 63.0 64.0
Premium Stability Ratio (3.09) 11.5 7.5 23.5
Claim Ratio 63.2 61.8 64.8 65.9
Combined Operating Ratio 91.0 86.0 88.1 87.9
Underwriting Ratio 21.0 32.0 21.1 18.1
Return on Assets (ROA) 4.0 18.1 7.1 2.5
Return on Equity (ROE) 9.0 36.9 16.0 6.2
Profitability Ratio 7.2 35.3 17.2 6.3
Investment Yield Ratio 10.2 20.6 13.3 5.5
Management Expense Ratio 27.8 24.3 23.3 22.0
Capital to Technical Reserves 131.0 165.0 127.0 163.0
Technical Reserve Ratio 110.1 110.1 75.9 87.9
Long-term (Life) Insurance
Solvency Ratio 4.9 5.1 7.2 7.5
Retention (Reinsurance) Ratio 96.4 97.0 96.7 96.3
Liquidity Ratio 69.0 65.0 70.0 68.0
Premium Stability Ratio 0.7 31.1 21.9 21.2
Claim Ratio 43.6 38.3 51.0 35.3
Combined Operating Ratio 69.7 60.4 72.5 61.0
Return on Assets (ROA) 2.4 2.6 0.9 3.3
Profitability Ratio 10.8 10.9 5.7 19.5
Investment Yield Ratio 14.4 18.5 15.8 11.2
Management Expense Ratio 26.1 22.2 21.9 25.7
Source : Central Bank of Sri Lanka

75
Chapter 5 – Other Financial Institutions
5.3 Primary Dealers in Government SecuritiesPrimary Dealers in government securities (PDs) continued to perform at a satisfactory level. The PD industr y mainta ined the R epo Transactions to Assets Ratio, Capital Leverage, and Risk Weighted Capital Adequacy Ratio (RWCAR) at healthy levels, enhancing stability of the sector. As a result of accumulated profits, capital base of the PD industry increased by 11 per cent compared to the corresponding period of the previous year. Every PD maintained capital base above the regulatory minimum of Rs. 300 million and the RWCAR beyond the required minimum level of 8 per cent. With the slight increase in yield rates on government securities, the key profitability indicators, Return on Assets and Return on Equity decreased due to the revaluation losses and reduction in capital gains during the first nine months of the year, compared to the corresponding period of the previous year. Secondary market activities of PDs improved during the period, compared to the first nine months of 2010.
in the stock market and the lower yields on government paper has increased this risk. In past few years, the favourable condition in the government securities and the stock market has enabled insurance companies to make significant gains on their investments. However, in the low interest rate environment and moderation in the growth in equity prices in the future, insurance companies will need to more actively manage their portfolios and match the duration in their asset and liabilities structure, in order to effectively manage market risk.
Regulations
The Regulation of Insurance Industry (RII) Act was amended in 2011 to strengthen the prudential regulation and supervision of the entire insurance industry. The revisions to the law will increase the powers of the IBSL to issue directions to insurance companies, brokers and loss adjusters. Henceforth, the IBSL will be able to stipulate capital requirements for insurance companies and brokers, make rules and determinations, engage in dispute resolution and prescribe “fit and proper” criterion for boards of directors of insurance companies and brokers. The other revisions include the appointment of institutions as agents of insurance companies, which will improve access to insurance products. Insurance companies are required to separate long-term and general insurance business into separately incorporated companies, with existing composite insurers being given time (3/5 years) to comply. All insurance companies will also be required to list on the stock exchange within a given time frame. In addition to the enhancement of the minimum capital requirements for insurance companies, work has also commenced on the migration to a risk based capital adequacy framework for insurance companies in keeping with international best practices and emerging standards of the International Association of Insurance Supervisors (IAIS).
Data / Indicator UnitJan. – Sep.
2010 2011
Total Assets Rs. mn 146,596 149,558
Total Portfolio Rs. mn 143,510 148,077
Net Profit Before Tax Rs. mn 4,986 2,449
RWCAR % 19.3 20.1
Tier I Capital (RWCAR) % 19.3 20.1
Capital Leverage Ratio Time 5.9 6.4
Return On Assets (Before Tax) % 5.4 2.3
Return on Equity (Before Tax) % 46.6 20.5
Operating Expenses to Gross Income
% 2.7 2.9
Total Cost to Total Income % 60.0 -75.4
Duration of Assets & Liabilities % 1.5 1.2
Source : Central Bank of Sri lanka
Table 5.10 Selected Financial Data and Indicators of Primary Dealers
76
Financial System Stability Review 2011
duration of trading portfolio had come down to 1.1 as at end September 2011 compared to 1.5 recorded as at end September 2010.
Liquidity Risk
PLiquidity risk of PDs was low during the first half of the year. The cumulative negative mismatches of PDs for overnight, up to one week, and up to one month maturity buckets had been respectively about 5.2 per cent, 9.0 per cent and 18.2 per cent of the total trading and reverse repo portfolios, as at end September 2011. The overnight and 8–30 days exposures had increased while 2–7 days exposure had decreased by end September 2011 compared to the corresponding period of the previous year. The position did not indicate any undue risk to the PD industry.
Operational Risk
Operational risk for PDs could arise from the failures of internal control systems and disasters that may affect their day-to-day businesses. Public Debt Department continues to carry out its risk based supervision through on-site examinations and off-site surveillance ensuring a lower operational risk exposure in PD industry as well as each PD.
5.4 Unit TrustsUnit trusts (UTs) are a type of pooled investment fund. UT management companies offer different kinds of UTs to enable investors to choose appropriate funds in line with their investment goal and risk tolerance level. There were 24 UTs in operation (including new 5 UTs) managed by 6 UT management companies at end September 2011. Of these, 20 UTs are open-ended funds and 4 UTs are close-ended funds. UTs can also be categorized according to their investment focus. Accordingly, there were 8 income funds, 5 growth funds, 4 balanced funds and 7 specialised funds (money market, equity
Market Development Activities
Primary Market
During January-September 2011, the PD units of Licensed Commercial Banks recorded the highest effective participation at Treasury bill auctions, subscribing to 74.2 per cent of the amount offered compared to 69.4 per cent in the corresponding period of the previous year. However, those units recorded a considerable decline in effective participation in Treasury Bond auctions, by decreasing their share from 32.45 per cent to 6.84 per cent. Effective participation of non-bank PDs at both Treasury Bill and Treasury Bond auctions had declined to 5.29 and 5.33 per cent from 7.6 per cent and 7.4 per cent, respectively.
Secondary Market
Secondary market transactions, which consist of outright sales and outright purchases, repurchase transactions and reverse repurchase transactions of PDs, stood high at Rs.5,359 billion during January–September 2011, which was an increase of 14 per cent compared to the corresponding period in 2010. The increase was mainly due to increase in repurchase transactions by 22.8 per cent.
Assessment of Risks
Market Risk
Market risk which could be treated as the main risk in the PD industry as the core business of PDs is dealing in fixed income government securities was low during the first nine months of 2011 due to stabilization of yield rates on the government securities. The stress test results, which are used to measure the sensitivity of capital base and RWCAR for a change in interest rate, revealed that if interest rate increases by 100 basis points, the capital base of PDs would erode by 9.0 per cent (Rs. 1,304 million) and RWCAR would decline by 1.8 per cent. The modified

77
Chapter 5 – Other Financial Institutions
Table 5.11 Selected Data of the Unit Trust Industry
Details 2007 2008 2009 2010 2011 (Sep.)
No. of Unit Trusts 14 17 18 21 24
Total No. of Unit Holders 23,191 22,699 23,116 24,640 26,491
No. of Units in Issues (mn) 470 638 564 1,159 1,659
Total Assets (Rs. bn) 6.3 6.8 10.0 22.2 26.7
Net Assets Value – NAV (Rs. bn) 6.3 6.8 10.0 22.1 26.6
Investments in Equities (Rs. bn) 3.6 2.6 6.0 11.7 10.7
% of Total Assets 58 38 60 53 40
Investments in Government Securities (Rs. bn) 0.8 2.6 3.0 7.5 14.0
% of Total Assets 13 38 30 34 52
NAV per Unit (Rs.) 13 11 18 19 16
Source : Unit Trust Assuciation of Sri Lanka
index linked, tourism, finance and Sharia). One close-ended fund is listed on the Colombo Stock Exchange.
The net asset value (NAV) of the UT industry increased by 21 per cent to Rs. 27 billion at end September 2011 from year end 2010. Funds with significant investments in equities were somewhat affected by the decline in stock market prices during the year. However, these funds were able to perform better than the CSE price indices on account of portfolio management and diversification. The share of equities in the investment portfolio of UT declined to 40 per cent of NAV, while the share of investments in government securities (Treasury bills and bonds and Reverse Repos) rose to 52 per cent of NAV
at end September 2011. The share of other fixed income securities declined to 7 per cent at end September 2011. A positive development was the higher increase in the total number of unit holders to 26,491 and the number of units issued to 1,659 million as at end September 2011.
UT management companies are licensed and supervised by the Securities and Exchange Commission (SEC) in accordance with the SEC’s Unit Trust Code and the investment guidelines and limitations set out in the relevant Trust Deeds. The net profits (before tax) of the UT management companies increased by 146 per cent to Rs. 174 million in the first nine months of 2011 compared with the same period of the previous year.
A number of regulatory changes were made to promote the UT industry during the year. The SEC issued a directive that 10 per cent of shares of all Initial Public Offering (IPOs) should be allocated to UTs to promote the participation of retail investors in the stock market. Permission has also been granted for foreign investment in all types of UTs, which will broaden the investor base and stimulate the formation of different types of UTs. A new Unit Trust Code came into effect in 2011. One of the main features is the inclusion of a regulatory framework for Exchange Traded Funds (ETFs) which will facilitate the introduction
Chart 5.10 Investment Portfolio of Unit Trusts
Source : Unit Trust Association of Sri Lanka
Equities
Treasury Bills
Treasury Bonds
Reverse Repos
Others
17%
13%
23%
7%
40%

78
Financial System Stability Review 2011
by 1 per cent and 22 per cent respectively, in the first nine months of 2011 compared with the same period of 2010 due to a decline in stock market prices and restrictions on the provision of credit to investors.
The SEC issued a directive to stock brokers prohibiting the extension of credit to investors beyond T+3 days and requirement to force sell customer securities in arrears at T+5 days, with effect from January 2011. In addition, stock brokers were required to clear outstanding debtor positions by at least 50 per cent by end March 2011 and by 100 per cent by June 2011. Subsequently, as a relief measure for small retail investors, the time given to clear debtor positions was extended to end September and end December 2011. In view of the difficulties faced by retail investor and stock brokers, the SEC in August 2011 relaxed the restriction on credit provided by brokers subject to certain prudential requirements. Accordingly, stock-brokers were permitted to extend credit to investors over T+3 days based on the computation of liquid assets less obligations, maintaining leverage at zero level. Settlement risk for seller and selling broker in equity transactions remains, as securities are transferred at T+0 while payment is made in T+3. In order to eliminate settlement risk, the CSE has commenced work to migrate to risk based margining and a delivery versus payment system and the project is expected to be completed in 2012.
of these funds in Sri Lanka. ETFs are a type of unit trust that is traded on an exchange and invests in a basket of securities, assets or commodities that generally seek to track the performance of a specified index or benchmark.
The prospects for the growth of the UTs and the investor base are good. UTs can cater to diverse groups of investors (retail investors, pensioners, companies and institutional investors) because of the different investment focus of funds. UTs is particularly suitable to investors that do not have time or resources to manage their portfolios effectively and for companies and institutional investors for investment diversif ication purposes.
The penetration level of UTs in Sri Lanka is very low and action needs to be taken to expand outreach and cater to a wider group of investors. UT management companies should conduct more publicity campaigns throughout the country to educate investors on UTs and to attract investment. Product innovation is another aspect that needs attention in order to cater to the diverse needs of investors. The UT industry also needs to make a concerted effort to expand its distribution network.
5.5 Stock Brokers and Market IntermediariesStock brokers are authorized by the Securities and Exchange Commission (SEC) to buy and sell equity on behalf of investors on the Colombo Stock Exchange (CSE). There are 28 stock broker companies who are members of the CSE. The total net capital funds of the stock brokers increased by 15 per cent to Rs. 4 billion at end September 2011, strengthening the capital position of the industry. All stock broker companies complied with the regulatory minimum net capital requirement of Rs. 35 million. The income and net profits (before tax) of stock-brokers declined
Item 2009 20102010Sep.
2011Sep.
Turnover 1,944 6,599 5,128 5,095
Net Profit Before Tax 823 3,661 2,964 2,318
Total Assets* 6,429 13,210 17,343 14,588
Total Liabilities* 3,827 6,973 12,989 8,996
Net Capital* 2,076 4,468 3,600 4,147
* At end period Source : Securities and Exchange Commission
Table 5.12Selected Data of the
Stock Broking IndustryRs. million

79
Chapter 5 – Other Financial Institutions
The SEC also registers and supervises a category of companies as market intermediaries to ensure that they comply with applicable rules and regulations. Under this category, companies engaging in business as margin providers, investment managers and underwriters are registered. The income and net profit (before tax) of market intermediaries increased by 90 per cent and 357 per cent to Rs. 3.8 billion and Rs. 2.3 billion respectively in the first nine months of 2011 compared with the same period of 2010. In order to reduce risk exposure, the rules relating to margin providers were amended in 2011. Accordingly, all margin providers that are registered with the SEC are required to limit exposure on the aggregate value of loans extended as margin to not more than four times of their net capital funds (from ten times). The margin trading facility given to any customer shall not exceed 50 per cent of the market value of the customers’ share portfolio. The minimum net capital requirement of margin providers is Rs. 30 million.
5.6 Superannuation Funds
The superannuation funds sector accounts for 17 per cent of financial sector assets. The sector consists of two major publicly managed funds – the Employees Provident Fund (EPF) and the Employee Trust Fund (ETF) and about 170 privately managed Approved Pension and Provident Funds (APPF). There is also a state sector Public Service Provident Fund (PSPF). The superannuation funds sector is dominated by the EPF, which accounts for about 80 per cent of the sector assets.
Employees’ Provident Fund (EPF)The EPF is administered by the Commissioner of Labor, while the responsibility for the
management of the fund lies with the Monetary Board of the Central Bank. The EPF has a total of about 13.5 million accounts, of which 2.3 million are active accounts. Total contributions increased by 18 per cent to Rs. 47 billion, while refunds rose by 45 per cent to Rs.36 billion in the first nine months of 2011, resulting in a net contribution (contribution less refunds) of Rs. 11 billion, which was slightly below the amount recorded in the corresponding period of 2010. Total net assets amounted to Rs. 987 billion as at end September 2011 recording an increase of 14 per cent at end September 2010. Total liability to members increased by 15 per cent to Rs. 879 billion at end September 2011. The increase in both the income of fund and the member contributions favorably contributed to the growth of the fund during the period under consideration.
The EPF investment portfolio which consists of government securities, equities and corporate securities and trust certificates amounted to Rs. 960 billion as at end September 2011. The share of government securities was 91 per cent, while equities accounted for 7 per cent. The investment strategy of the EPF is to prudently diversify its portfolio to earn a long-term positive real rate of return for its members, while maintaining the safety of the fund and adequate l iquidity for refund payments and other expenditure.
Chart 5.11Assets Distribution of
Superannuation Fund Sector
Source : Unit Trust Association of Sri Lanka
Employees’Provident Fund (EPF)
Employees’Trust Fund (ETF)
Approved PrivateProvident Funds(APPFs)
Public Service Provident Fund(PSPF)
11%
9%2%
78%

80
Financial System Stability Review 2011
accounts, of which about 2.1 million are active accounts. The number of employers contributing to the fund increased to 66,189 at end September 2011 from 61,695 at end September 2010. Total contributions increased by 13 per cent to Rs. 8 billion, while superannuation benefits paid to members increased by 28 per cent to Rs. 6 billion in the first nine months of 2011. Accordingly, the net contribution of the ETF declined by 15 per cent to Rs. 2 billion in the first nine months of 2011. Total assets of the ETF increased by 13 per cent to Rs. 137 billion at end September 2011. The outstanding members’ balances in the ETF increased to Rs,. 122 billion as at end September 2011. As in the case of the EPF, the investment portfolio was heavily concentrated in government securities which account for 90 per cent of the total portfolio. Investment in equities and corporate debt securities accounted for 5 per cent and 1 per cent respectively, of the total portfolio at end September 2011.
Public Service Provident Fund (PSPF)Public service provident fund (PSPF) is managed by the Department of Pensions and had 231,368 active members at end September 2011. The
Investment income increased by 2 per cent to Rs. 87 billion during the first nine months of 2011. Lower market interest rates and the decline in the stock market dampened earnings growth.
The EPF was able to manage its risks adequately in the first nine months of 2011. The main risks faced by the EPF are credit risk, market risk and liquidity risk. Credit risk is negligible as over 90 per cent of the investment portfolio is in default risk free government securities. Interest rate risk was mitigated by investing in a variety of fixed income securities of differing yields and maturities. The decline in share prices is expected to adversely affect the fund due to its holding ability and long-term perspective. The liquidity risk was adequately managed as receipts of contributions are higher than the payment of refunds. However, in the event of a progressive decline in net contributions in the future, the EPF would have to devise effective strategies to deal with the situation.
Employees’ Trust Fund (ETF)
The Employees’ Trust Fund (ETF) which is administrated by the Employees’ Trust Fund Board and comes under the purview of the Ministry of Finance. The ETF has about 9.5 million
Table 5.13 Key Indicators of Major Superannuation Funds (as at end June 2011)
Item2010 – End December 2011 – End June (a)
EPF ETF EPF ETF
Number of Accounts (mn) 13.4 9.1 13.5 9.5
o/w, Active Accounts (%) 2.2 2.1 2.3 2.1
Total Contributions (Rs. bn) 54.8 9.8 47.2 8.2
Total Refunds (Rs. bn) 34.9 6.4 36.4 6.0
Total Assets (Rs. bn) 902.0 125.9 987.3 137.3
Total Investments Portfolio (Rs. bn) 867.1 118.9 959.8 122.1
o/w, Government Securities (%) 94.1 90.5 91.3 90.0
Gross Income (Rs. bn) 121.3 15.5 86.5 10.3
(a) Provisional Sources : Central Bank of Sri Lanka Employees’ Trust Fund Board

81
Chapter 5 – Other Financial Institutions
total assets of PSPF increased by 14 per cent to Rs. 27 billion at end September 2011. Total contributions and refunds during the first nine months of 2011 amounted to Rs. 1 billion and Rs. 369 million respectively.
Approved Provident and Pension Funds (APPFs)There were 171 privately managed APPFs with around 167,000 members, which are monitored by the Department of Labour. The total assets of
APPFs declined by 10 per cent to Rs. 115 billion as at end September of 2011.The investments of APPFs amounted to Rs. 164 billion as at end September 2011. The absence of a prudential regulator for APPFs has been identified as a gap in the regulation of this sector. Hence, in order to ensure that these finds are better safeguarded and more professionally managed, the CBSL initiated action to have them supervised by the Insurance Board of Sri Lanka and proposals have been submitted to the Ministry of Finance.

83
Chapter 6 – Financial System Infrastructure and the Regulatory Framework
µThe key payment and settlement systems – the LankaSettle System and the Cheque Imaging and Truncation System operated without disruption and recorded a very high degree of system availability and safety.
µ The CBSL commenced monitoring compliance of card issuers with the Credit Card Operational Guidelines in 2011.
µ Guidelines were issued to regulate mobile payments to facilitate the introduction and usage of mobile payment systems. The CBSL issued two guidelines to regulate bank based and custodian account based mobile payment sevices in 2011.
µ The CBSL is in the process of preparing Internet banking guidelines which are expected to be issued during 2012.
6.1 Payment and Settlement SystemsWith the introduction of new advanced and efficient payment instruments, methods of settling transactions have migrated from conventional paper based payment instruments to electronic payment instruments. Hence, it became necessary to ensure safety, reliability and efficiency while reducing risks when migrating to electronic payments to achieve stability in the payment and settlement system. Accordingly, the CBSL strengthened legal provisions as well as its regulatory and supervisory activities to promote safe and efficient electronic fund transfer systems in the country.
The Central Bank of Sri Lanka (CBSL) as the responsible authority for promoting safety stability and efficiency of the payment and sett lement systems adopted measures through the powers vested by the Payment and Settlement Systems Act (PSSA), No. 28 of 2005, to maintain secure, reliable and efficient payment and settlement systems in Sri Lanka. Accordingly, the CBSL monitored supervised and regulated the payment and settlement systems to achieve payment and settlement system stability to ensure financial system stability, a core function of the CBSL. In addition, the CBSL facilitated development of payment and settlement systems through guidance to all stakeholders.
Financial SystemInfrastructure6

Financial System Stability Review 2011
84
The corporate and individual customer accounts maintained by the LankaSecure stood at 75,871 as at end September 2011 compared to 74,480 accounts maintained as at end September 2010. The value of transfers of government securities during the first three quarters of 2011 accounted to Rs. 51,286 billion (face value) representing a 51 per cent increase compared to the corres-ponding period of 2010.
The LankaSecure continued to issues three types of statements namely, Transaction Summary, Payments Statement and Statement of Holdings to the respective investors to confirm their investments with government securities. During the first three quarters of 2011, LankaSecure issued 164,755 such statements. LankaSecureNet facility is another free service provided by LankaSecure, providing online access to the investors’ CDS account to view their balance of Government Securities. It would lead to increase the confidence of investors since they are in a position to monitor and ensure their investments at CDS as soon as their investments are taken place.
Retail Payment and Settlement Systems Retail payment and settlement systems have undergone a rapid change with innovations in electronic retail payment and settlement systems. New electronic payment methods such as payment cards, mobile and internet banking have become popular methods of settling transactions. Further, mobile banking solutions developed by using the mobile telecommunication technology was considered as a economical and faster method of providing banking facilities to the unbanked populations and the CBSL provided guidance to encourage financial institutions to offer safe and secure mobile banking services.
LankaSettle SystemThe LankaSettle system, which is a systemically important payment system, comprises of two well integrated systems, i.e., the Real Time Gross Settlement (RTGS) system and the LankaSecure system. The RTGS system facilitates settlement of high value and time critical payments on real time gross basis and the LankaSecure facilitates settlement of securities transactions on a delivery versus payment basis. The CBSL, as the operator of the LankaSettle system continued to maintain the RTGS system to provide a safe and reliable mechanism for efficient settlement of transactions. Accordingly, the CBSL adopted measures to maintain the system with a high and consistent level of resilience and operated the system at 99.8 per cent availability during the first nine months of 2011. The RTGS system accounted for 90 per cent of the total value of non cash payments during the period of January – September 2011 and continued to be the main interbank fund transfer system in the country. The daily average volume of transactions in the RTGS system was 1,103 and daily average value of transactions was Rs. 261 billion during the first nine months of 2011.
Further, considering the systemic importance of the LankaSettle system, the CBSL strengthened its business continuity arrangements to ensure readiness of the system to operate during contingency events and the CBSL successfully conducted a live operation from its disaster recovery site in May 2011.
LankaSecureThe Scripless Securities Settlement System (SSSS) and the Central Depository System (CDS) for Government Securities, collectively known as the LankaSecure, held scripless Treasury Bills and Treasury Bonds totaling Rs. 2,693 billion (face value) consisting of Treasury Bills amounting to Rs. 694 billion and Treasury Bonds amounting to Rs. 1,999 billion as at 30 September 2011.

85
Chapter 6 – Financial System Infrastructure and the Regulatory Framework
secure reliable and efficient payment mechanism, the CBSL issued the General Direction on Sri Lanka Interbank Payment System, No. 01 of 2011 to the Participants of the system and the LCPL. During the first nine months of 2011, the volume and value of SLIPS transactions effected was 9,100,210 and Rs. 305 billion respectively.
Business Continuity PlansConsidering the risk that can be caused by an operational failure of a Participating Institution (PI) of the LankaSettle system, the CBSL carried out evaluation and supervision of Business Continuity Plans (BCP) and Disaster Recovery (DR) sites prepared in accordance with the Business Continuity Planning Guideline. During the first phase of evaluations recommendations were given to improve their BCP arrangements and DR sites to maintain an uninterrupted system availability and minimize the risk. Implementation of these recommendations and conducting of test runs were supervised during the second phase of evaluations. In 2011, the CBSL continued the supervision of advance noticed test runs of PIs of LankaSettle system and supervised the implementation of recommendations given during the first phase of surveillance to ascertain their adherence to the Business Continuity Planning guideline issued in 2006.
As the operator of systemically important CIT system, SLIPS and other retail payment systems, LCPL was required to maintain uninterrupted operations to reduce settlement r isk of transactions settling through these payment mechanisms. Therefore, LCPL tested its BCP arrangements in 2011 in order to ensure its readiness for contingency events. DR site of the Lanka Financial Services Bureau, which was established to provide SWIFTNet connectivity to PIs of the LankaSettle system was also supervised during the year 2011.
Cheque Imaging and Truncation (CIT) SystemCheque Imaging and Truncation system, which is a systemically important retail payment system, was introduced in 2006 and is operated by the Lanka Clear (Pvt) Ltd., (LCPL). The CIT system was introduced with the objectives of eliminating costs involved in manual cheque clearing process, reducing settlement risk involved in the lengthy clearing cycle to T+1 (where T is the day on which LankaClear receives the cheque for clearing and 1 is the following business day) and eliminating the regional disparities in accessing payment means. Cheque images captured at the collecting branch were submitted to LCPL through their Head Offices for clearing. Further, in order to enhance the efficiency of the cheque clearing process, LCPL successfully migrated the settlement clearing to Direct Connectivity mode in March 2011, enabling advancement of cut-off time window to 1.30 p.m. Accordingly, this new development have enabled commercial banks to release cheque proceeds to customers’ accounts before 3.00 p.m. As at end September 2011 CIT system cleared 34,121,287cheques to the value of Rs. 4,589 billion.
Sri Lanka Interbank Payment System Sri Lanka Interbank Payment System (SLIPS), which was introduced in 1994 gained popularity over the years as an off-line interbank retail payment mechanism. Considering the importance of enhancing the capacity, efficiency, security and reliability and reducing the risks inherent to off-line payment systems, LCPL upgraded the SLIPS in September 2010 to an on-line payment system facilitating same day settlements (T+0) and 2 settlements per day. Subsequent to the upgrade, SLIPS now has a capacity of handling 1.2 million transactions during a normal business day. With the objective of facilitating smooth operations of the SLIP system and promoting SLIP system as a

Financial System Stability Review 2011
86
guideline, which was issued with the objective of promoting the credit card as a safe, secure and efficient payment instrument and protecting the interests of card holders.
Considering the importance of promoting mobile payment mechanisms to operate in a secure environment, the CBSL issued 2 mobile payment guidelines in 2011. The Mobile Payment Guideline, No. 1 of 2011 was issued to regulate bank account based payment services while Mobile Payment Guideline, No. 2 of 2011 was issued to regulate custodian account based mobile payment services. The CBSL expects to begin off-site supervision of mobile payment service providers to ensure compliance to these guidelines in 2012.
In order to facilitate secure and reliable Internet based electronic fund transfer mechanisms, the CBSL is in the process of preparing Internet banking guidelines, which is expected to be issued during 2012.
RegulationsWith the objective of strengthening legal provisions to minimise risks associated with the existence of non regulated businesses and their negative impact on the financial system, the CBSL issued the Service Providers of Payment Cards Regulation, No. 01 of 2009. The Regulation mandated service providers to obtain a licence, which is renewed annually to continue their operations in the payment card industry. Accordingly, licences issued to 17 financial institutions to operate as service providers of payment cards were renewed after evaluating their suitability to continue payment card operations. Based on the powers vested by the Regulation to issue guidelines, directions and circulars to streamline the operations of the payment card industry in Sri Lanka, the CBSL issued the Credit Card Operational Guideline, No. 1 of 2010. The CBSL continued off-site supervision of credit card issuers in 2011 to ensure compliance to the credit card operational
Mobile Phone Based Payment Systems
Box 7
unbanked population. More importantly, in achieving financial inclusion and branchless banking solutions which are major concerns of policy makers and financial regulators in the globe, mobile phone based payment mechanism is becoming increasingly popular as its ubiquitous nature enables service providers to access unbanked segment of the population to provide banking facilities anywhere at any time, regardless of geographical barriers.
Mobile Payments in Sri Lanka:
Following the global trend, banks and other financial institutions in Sri Lanka have also been moving towards mobile phone based payment instruments. The use of mobile phones
Introduction
Driven by technological advancement, financial sector requirement of speed payment solutions and changing consumer needs, payment and settlement systems have been moving towards new electronic-based, advanced payment instruments to facilitate settling of financial transactions. With these developments, payments systems have changed from cash and paper based payment instruments to cashless electronic payment instruments such as payment cards, mobile phone based payment channels and e-money. At present, all over the globe, mobile phone based payment systems have been identified as the most economical method of providing financial services to banking and

87
Chapter 6 – Financial System Infrastructure and the Regulatory Framework
Box 7 (Contd.)
offering payment alternative to cash, cheques and payment cards. Non-bank led mobile payment system models are operated by non-bank service providers such as telecommunication network providers. Under the non-bank led mobile payment models, non-bank service providers can issue e-money to their clients accepting physical money. E-money holders can purchases goods and services, pay utility bills and effect third party fund transfers through the virtual e-money accounts maintained by non-bank service providers.
Risk Mitigation:
Although there are several benefits of adopting mobile payment mechanisms, risks inherent to other electronic payment methods will affect mobile payment systems as well. Customers using mobile payment systems could face information security issues while making mobile payments due to certain technological constraints and characteristics of wireless technologies, which should be minimized to avoid any negative impact on customers and the financial system. Therefore, banks and other non bank service providers must ensure to implement adequate information security measures and install reliable systems that properly address risks and threats on mobile payment mechanisms. In addition, custodian account based mobile payment models are confronted with a risk exclusive to the system, due to the involvement of non bank entities in banking functions; such as accepting deposits and facilitating withdrawals of funds, Therefore, extensive responsibilities have to be laid down on the custodian bank in order to mitigate risks associated with such systems.
Role of the CBSL as the regulator:
The CBSL well recognized the need to regulate electronic payment systems due to the associated risks. Accordingly, with the objective of providing a safe and secure environment for electronic payment instruments including mobile payment systems, the CBSL issued the ‘Service Providers of Payment Cards Regulations No. 1 of 2009’ (Regulations). In terms of
has greatly increased over the past few years and therefore, mobile payment systems have been explored by the financial industry as an option to provide electronic payment services in Sri Lanka. Mobile payment applications which allow customers to perform a number of banking functions reduces the operating cost of banks by eliminating the need to operate conventional branches while providing a convenient and easy to access payment mechanism to customers. The Central Bank of Sri Lanka as the regulator of the banking and financial system in Sri Lanka, including payment and settlement systems has identified two different models of mobile payment systems that could be operated to provide banking and financial services in country, namely;
1. Bank-led mobile Payment Services Model: Banks use mobile payment services to allow their account holders to access own accounts for information and make payments through mobile phones. Under the bank-led mobile payment services, three types of mobile payment facilities may be offered.
i. Basic Type: Under this category, facilities are provided to obtain information on account balance, record of previous transactions and payment orders which do not relate to fund transfers.
ii. Standard Type: In addition to the facilities provided under the basic type, account holders registered for this type of mobile payment services will have the facility of effecting fund transfers and issuing stop payment orders. Fund transfers may include utility bill payments, own account fund transfers and third party fund transfers, on the basis of instructions remitted through the mobile phone.
iii. Extended Type: In addition to the basic and standard type services, some banks offer facilities to deposit/withdraw cash through agents appointed by them.
2. Non-bank led mobile payment services model (Custodian account based system): This type of mobile payment systems can provide fund transfer facilities even for unbanked population in remote areas

Financial System Stability Review 2011
88
Box 7 (Contd.)
e-money holders by non-bank entities, it has been mandated to deposit collected funds by non-bank service provider, in exchange of e-money, in a custodian account maintained at a licensed commercial bank.
Way forward:
Mobile payment applications, to be accepted as a mode of payment, should have basic characteristics such as simplicity, usability and interoperability. With the financial integration as well as rapid development of payment models, it is required to maintain inter-operability among mobile payment services operators in order to have the full benefit of the mechanism. As such, the long term goal of the CBSL is to ensure the ability to effect fund transfers from anywhere at any time from an account in one bank to another account in the same or a different bank, on real time basis irrespective of the mobile network operator that is being used by the customer. Therefore the guidelines emphasized the importance of having such inter-operability of the mobile payments system and LCBs operating bank-led model mobile payment systems have been instructed to note this objective when developing solutions or entering into agreements with mobile payment solution providers.
the Regulations, bank and non-bank service providers are required to obtain a licence from the CBSL to operate mobile payment systems. Further, as per the powers vested under the Regulations, the CBSL issued two mobile payment guidelines namely; Mobile Payments Guidelines No.1 for Bank Led Mobile Payment Services and Mobile Payments Guidelines No. 2 for Custodian Account Based Mobile Payment Services. These guidelines were issued with the objective of promoting safety and effectiveness of mobile payment services and thereby enhancing user confidence and reducing risks while ensuring smooth functioning of the payment and settlement systems which is crucial for maintaining financial system stability in the country.
Both these guidelines provide procedures to be followed by service providers with regard to registration of customers, technology and information security standards, customer protection and grievance and redress mechanism along with the regulatory and supervisory provisions. The CBSL has given much concern relating to the customer protection in preparing the guidelines for the non-bank service providers considering the risk involved in such payments models. Accordingly, under the custodian account based mobile payment model, in order to protect the funds collected from

89
Appendix Tables
Appendix Tables
Financial Soundness Indicators – All Banks
Appendix Table 1
Source : Central Bank of Sri Lanka
1. Capital Adequacy
1.1 Regulatory Capital to Risk Weighted Assets (RWCAR) 1.2 Tier 1 Capital / Risk Weighted Assets (Tier 1 RWCAR) 1.3 Net Non-Performing Loans to Total Capital Funds 1.4 Debt to Capital Funds 1.5 Capital to Assets Ratio
2. Asset Quality
2.1 Gross Non-Performing Loans (NPL) to Total Gross Loans (w/o Interest in Suspense) 2.2 Gross Non-Performing Loans (NPL) to Total Gross Loans (with Interest in Suspense) 2.3 Net Non-Performing Loans to Total Gross Loans 2.4 Provision Made against Gross Loans 2.6 Provision Coverage Ratio (Total) 2.5 Provision Coverage Ratio (Specific) 2.7 Sector-wise NPL to Total Sector Loans Agriculture & Fishing Manufacturing Tourism Transport Construction Traders New Economy Financial and Business Services Infrastructure Other Services Other Customer 2.8 Sectoral Distribution of Loans to Total Gross Loans Agriculture & Fishing Manufacturing Tourism Transport Construction Traders New Economy Financial and Business Services Infrastructure Others Services Other Customer 2.9 Provision Made against Total Assets 2.10 Total Loans (Gross) to Total Assets 2.11 Investments to Total Assets 2.12 Total Income to Total Assets 2.13 Net Interest Income to Total Assets 2.14 Operating Income to Total Assets
3. Earnings & Profitability
3.1 Return on Equity (ROE) – After Tax 3.2 Return on Assets (ROA) – Before Tax 3.3 Return on Assets (ROA) – After Tax 3.4 Interest Income to Gross Income 3.5 Net Interest Income to Gross Income 3.6 Non-Interest Income to Total Income 3.7 Non-Interest Expenses (Operating Expenses) to Total Income 3.8 Staff Expenses to Non-Interest Expenses 3.9 Personnel Expenses to Total Income 3.10 Provisions to Total Income 3.11 Total Cost to Total Income 3.12 Efficiency Ratio 3.13 Interest Margin
4. Liquidity
4.1 Liquid Assets to Total Assets 4.2 Statutory Liquid Assets Ratio
5. Assets / Funding Structure
5.1 Deposits 5.2 Borrowings 5.3 Capital to External Funds 5.4 Credit to Deposits 5.5 Credit to Deposits & Borrowings 5.6 Credit to Deposits & Borrowings & Capital
14.5 16.1 16.2 14.5 12.5 14.1 14.3 13.1 18.5 26.2 15.2 13.8 209.4 160.1 172.0 166.1 8.1 8.1 8.3 8.6
6.3 8.5 5.4 4.5 8.1 10.7 7.3 7.1 3.4 5.0 3.0 2.6 3.8 4.5 3.1 2.5 60.9 53.0 58.1 55.0 47.6 42.8 45.3 43.6 7.1 4.2 3.2 2.8 8.3 11.4 8.7 8.1 3.7 5.3 4.7 10.1 7.4 6.7 4.2 3.9 8.6 12.5 8.4 9.1 10.1 10.9 7.5 5.5 3.1 4.4 3.4 3.0 2.3 4.4 2.4 1.8 3.1 5.5 3.9 3.5 2.1 6.3 3.2 3.7 3.3 5.5 3.3 2.4 5.2 10.7 13.4 13.8 17.3 15.1 13.0 11.9 2.4 2.7 2.1 2.1 2.1 1.6 1.7 2.3 16.8 17.2 16.5 15.3 12.9 13.8 14.0 13.1 1.3 1.4 0.9 0.9 5.6 4.1 4.6 5.8 1.3 1.3 1.3 1.3 5.7 4.9 6.4 5.8 29.4 27.2 26.0 27.8 2.3 2.4 1.8 1.5 60.6 53.0 55.6 58.5 25.0 30.8 30.4 28.2 14.8 14.1 11.3 10.1 4.3 4.3 4.2 4.0 6.3 6.3 6.2 5.5
13.4 11.8 22.2 19.7 1.9 1.8 2.7 2.4 1.1 1.0 1.8 1.6 86.3 86.0 83.1 85.4 28.9 30.8 37.7 39.7 13.7 14.0 16.9 14.6 22.3 22.8 26.6 27.9 44.5 46.5 45.2 44.3 9.9 10.6 12.0 12.4 4.2 6.2 0.6 1.0 79.8 78.1 71.9 73.7 55.6 56.3 47.4 51.8 4.4 4.6 4.6 4.2
28.4 35.3 31.4 29.2 31.3 39.2 36.6 34.0
69.6 74.1 72.8 72.4 17.0 12.9 14.3 14.4 9.4 9.3 9.5 10.0 87.0 71.5 76.4 80.8 70.0 60.9 63.9 67.5 64.0 55.7 58.3 61.3
2011September 2008 2009 2010
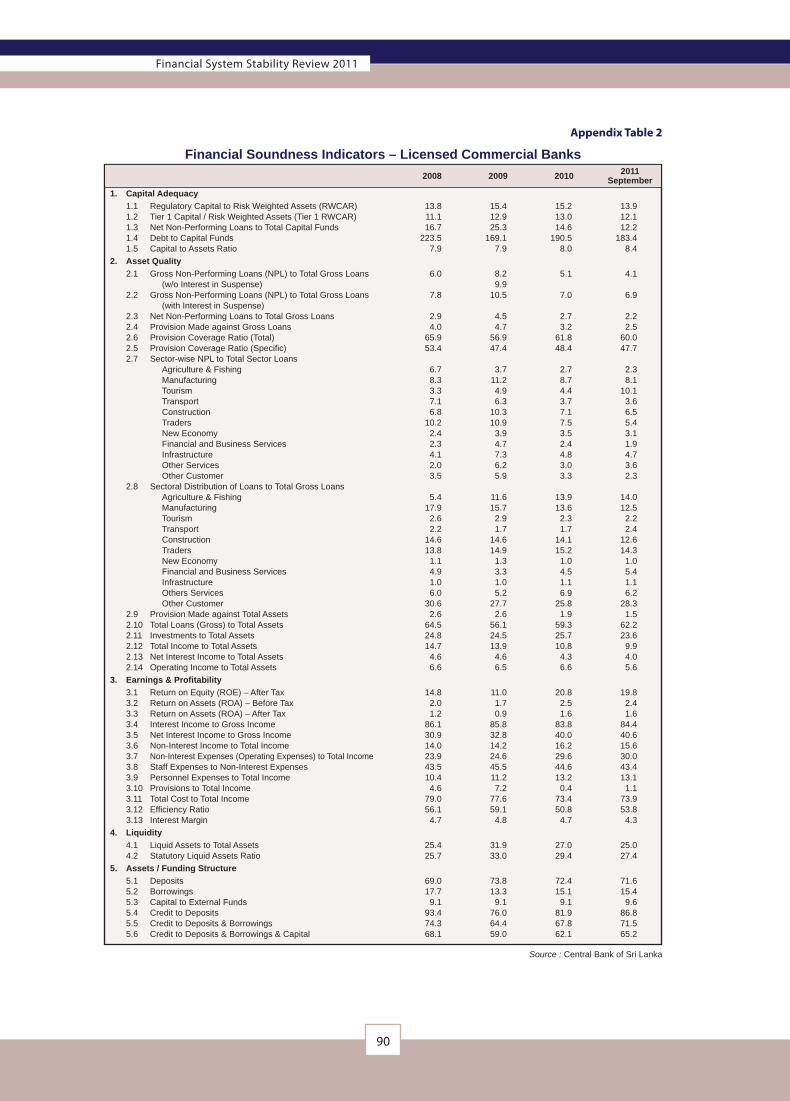
90
Financial System Stability Review 2011
Financial Soundness Indicators – Licensed Commercial Banks
Appendix Table 2
Source : Central Bank of Sri Lanka
1. Capital Adequacy
1.1 Regulatory Capital to Risk Weighted Assets (RWCAR) 1.2 Tier 1 Capital / Risk Weighted Assets (Tier 1 RWCAR) 1.3 Net Non-Performing Loans to Total Capital Funds 1.4 Debt to Capital Funds 1.5 Capital to Assets Ratio
2. Asset Quality
2.1 Gross Non-Performing Loans (NPL) to Total Gross Loans (w/o Interest in Suspense) 2.2 Gross Non-Performing Loans (NPL) to Total Gross Loans (with Interest in Suspense) 2.3 Net Non-Performing Loans to Total Gross Loans 2.4 Provision Made against Gross Loans 2.6 Provision Coverage Ratio (Total) 2.5 Provision Coverage Ratio (Specific) 2.7 Sector-wise NPL to Total Sector Loans Agriculture & Fishing Manufacturing Tourism Transport Construction Traders New Economy Financial and Business Services Infrastructure Other Services Other Customer 2.8 Sectoral Distribution of Loans to Total Gross Loans Agriculture & Fishing Manufacturing Tourism Transport Construction Traders New Economy Financial and Business Services Infrastructure Others Services Other Customer 2.9 Provision Made against Total Assets 2.10 Total Loans (Gross) to Total Assets 2.11 Investments to Total Assets 2.12 Total Income to Total Assets 2.13 Net Interest Income to Total Assets 2.14 Operating Income to Total Assets
3. Earnings & Profitability
3.1 Return on Equity (ROE) – After Tax 3.2 Return on Assets (ROA) – Before Tax 3.3 Return on Assets (ROA) – After Tax 3.4 Interest Income to Gross Income 3.5 Net Interest Income to Gross Income 3.6 Non-Interest Income to Total Income 3.7 Non-Interest Expenses (Operating Expenses) to Total Income 3.8 Staff Expenses to Non-Interest Expenses 3.9 Personnel Expenses to Total Income 3.10 Provisions to Total Income 3.11 Total Cost to Total Income 3.12 Efficiency Ratio 3.13 Interest Margin
4. Liquidity
4.1 Liquid Assets to Total Assets 4.2 Statutory Liquid Assets Ratio
5. Assets / Funding Structure
5.1 Deposits 5.2 Borrowings 5.3 Capital to External Funds 5.4 Credit to Deposits 5.5 Credit to Deposits & Borrowings 5.6 Credit to Deposits & Borrowings & Capital
13.8 15.4 15.2 13.9 11.1 12.9 13.0 12.1 16.7 25.3 14.6 12.2 223.5 169.1 190.5 183.4 7.9 7.9 8.0 8.4
6.0 8.2 5.1 4.1 9.9 7.8 10.5 7.0 6.9 2.9 4.5 2.7 2.2 4.0 4.7 3.2 2.5 65.9 56.9 61.8 60.0 53.4 47.4 48.4 47.7 6.7 3.7 2.7 2.3 8.3 11.2 8.7 8.1 3.3 4.9 4.4 10.1 7.1 6.3 3.7 3.6 6.8 10.3 7.1 6.5 10.2 10.9 7.5 5.4 2.4 3.9 3.5 3.1 2.3 4.7 2.4 1.9 4.1 7.3 4.8 4.7 2.0 6.2 3.0 3.6 3.5 5.9 3.3 2.3 5.4 11.6 13.9 14.0 17.9 15.7 13.6 12.5 2.6 2.9 2.3 2.2 2.2 1.7 1.7 2.4 14.6 14.6 14.1 12.6 13.8 14.9 15.2 14.3 1.1 1.3 1.0 1.0 4.9 3.3 4.5 5.4 1.0 1.0 1.1 1.1 6.0 5.2 6.9 6.2 30.6 27.7 25.8 28.3 2.6 2.6 1.9 1.5 64.5 56.1 59.3 62.2 24.8 24.5 25.7 23.6 14.7 13.9 10.8 9.9 4.6 4.6 4.3 4.0 6.6 6.5 6.6 5.6
14.8 11.0 20.8 19.8 2.0 1.7 2.5 2.4 1.2 0.9 1.6 1.6 86.1 85.8 83.8 84.4 30.9 32.8 40.0 40.6 14.0 14.2 16.2 15.6 23.9 24.6 29.6 30.0 43.5 45.5 44.6 43.4 10.4 11.2 13.2 13.1 4.6 7.2 0.4 1.1 79.0 77.6 73.4 73.9 56.1 59.1 50.8 53.8 4.7 4.8 4.7 4.3
25.4 31.9 27.0 25.0 25.7 33.0 29.4 27.4
69.0 73.8 72.4 71.6 17.7 13.3 15.1 15.4 9.1 9.1 9.1 9.6 93.4 76.0 81.9 86.8 74.3 64.4 67.8 71.5 68.1 59.0 62.1 65.2
2011September 2008 2009 2010

91
Appendix Tables
Financial Soundness Indicators – Licensed Specialised Banks
Appendix Table 3
Source : Central Bank of Sri Lanka
1. Capital Adequacy
1.1 Regulatory Capital to Risk Weighted Assets (RWCAR) 1.2 Tier 1 Capital / Risk Weighted Assets (Tier 1 RWCAR) 1.3 Net Non-Performing Loans to Total Capital Funds 1.4 Debt to Capital Funds 1.5 Capital to Assets Ratio
2. Asset Quality
2.1 Gross Non-Performing Loans (NPL) to Total Gross Loans (w/o Interest in Suspense) 2.2 Gross Non-Performing Loans (NPL) to Total Gross Loans (with Interest in Suspense) 2.3 Net Non-Performing Loans to Total Gross Loans 2.4 Provision Made against Gross Loans 2.6 Provision Coverage Ratio (Total) 2.5 Provision Coverage Ratio (Specific) 2.7 Sector-wise NPL to Total Sector Loans Agriculture & Fishing Manufacturing Tourism Transport Construction Traders New Economy Financial and Business Services Infrastructure Other Services Other Customer 2.8 Sectoral Distribution of Loans to Total Gross Loans Agriculture & Fishing Manufacturing Tourism Transport Construction Traders New Economy Financial and Business Services Infrastructure Others Services Other Customer 2.9 Provision Made against Total Assets 2.10 Total Loans (Gross) to Total Assets 2.11 Investments to Total Assets 2.12 Total Income to Total Assets 2.13 Net Interest Income to Total Assets 2.14 Operating Income to Total Assets
3. Earnings & Profitability
3.1 Return on Equity (ROE) – After Tax 3.2 Return on Assets (ROA) – Before Tax 3.3 Return on Assets (ROA) – After Tax 3.4 Interest Income to Gross Income 3.5 Net Interest Income to Gross Income 3.6 Non-Interest Income to Total Income 3.7 Non-Interest Expenses (Operating Expenses) to Total Income 3.8 Staff Expenses to Non-Interest Expenses 3.9 Personnel Expenses to Total Income 3.10 Provisions to Total Income 3.11 Total Cost to Total Income 3.12 Efficiency Ratio 3.13 Interest Margin
4. Liquidity
4.1 Liquid Assets to Total Assets 4.2 Statutory Liquid Assets Ratio
5. Assets / Funding Structure
5.1 Deposits 5.2 Borrowings 5.3 Capital to External Funds 5.4 Credit to Deposits 5.5 Credit to Deposits & Borrowings 5.6 Credit to Deposits & Borrowings & Capital
21.0 22.0 24.1 20.0 25.6 23.6 24.7 22.0 26.7 30.3 17.8 20.8 146.0 120.9 97.2 87.5 9.1 8.9 10.1 10.0
8.9 10.4 7.9 8.0 10.5 12.2 9.5 9.4 7.6 8.9 5.8 6.1 3.0 3.1 3.1 2.6 33.3 30.2 38.2 32.8 15.7 15.5 29.0 25.5 14.4 20.0 8.8 8.3 9.7 13.8 9.6 8.2 13.6 18.1 14.7 10.6 12.9 12.3 8.6 7.1 15.5 19.5 12.8 16.3 8.4 9.5 8.0 7.0 5.5 6.8 2.2 2.1 2.6 3.5 2.7 1.2 0.6 1.1 1.1 0.3 4.0 8.8 8.0 6.7 0.4 0.6 3.2 3.4 3.1 3.0 9.3 11.4 10.8 9.7 8.3 6.9 0.9 0.9 0.7 0.7 1.4 1.0 1.7 1.7 38.8 39.6 37.6 37.6 4.4 3.9 3.7 3.9 3.2 2.1 0.3 0.2 12.9 10.5 5.6 9.4 3.9 3.9 3.1 3.1 2.7 2.5 2.2 1.9 18.0 23.0 27.4 23.2 1.2 1.2 1.1 1.0 40.7 37.4 36.7 38.8 50.1 54.5 55.1 53.3 14.9 14.8 13.9 11.2 2.8 3.2 4.0 4.0 4.6 5.1 6.8 5.0
6.9 15.1 27.1 19.0 1.4 2.4 3.8 2.7 0.6 1.4 2.6 1.9 87.8 87.0 80.1 90.4 18.6 21.4 28.7 35.3 12.2 13.0 19.9 9.6 14.4 14.4 14.8 18.0 53.4 54.4 50.0 51.4 7.7 7.8 7.4 9.3 2.0 1.7 1.7 0.6 83.6 80.0 66.2 73.1 51.0 40.8 31.0 40.0 2.9 3.4 4.1 4.1
43.7 52.4 54.0 51.6 61.9 71.1 74.3 68.8
72.7 75.2 75.1 76.7 13.3 10.8 9.8 8.8 10.6 10.4 11.9 11.7 56.1 49.7 48.8 50.6 47.4 43.5 43.2 45.4 42.9 39.4 38.6 40.7
2011September 2008 2009 2010
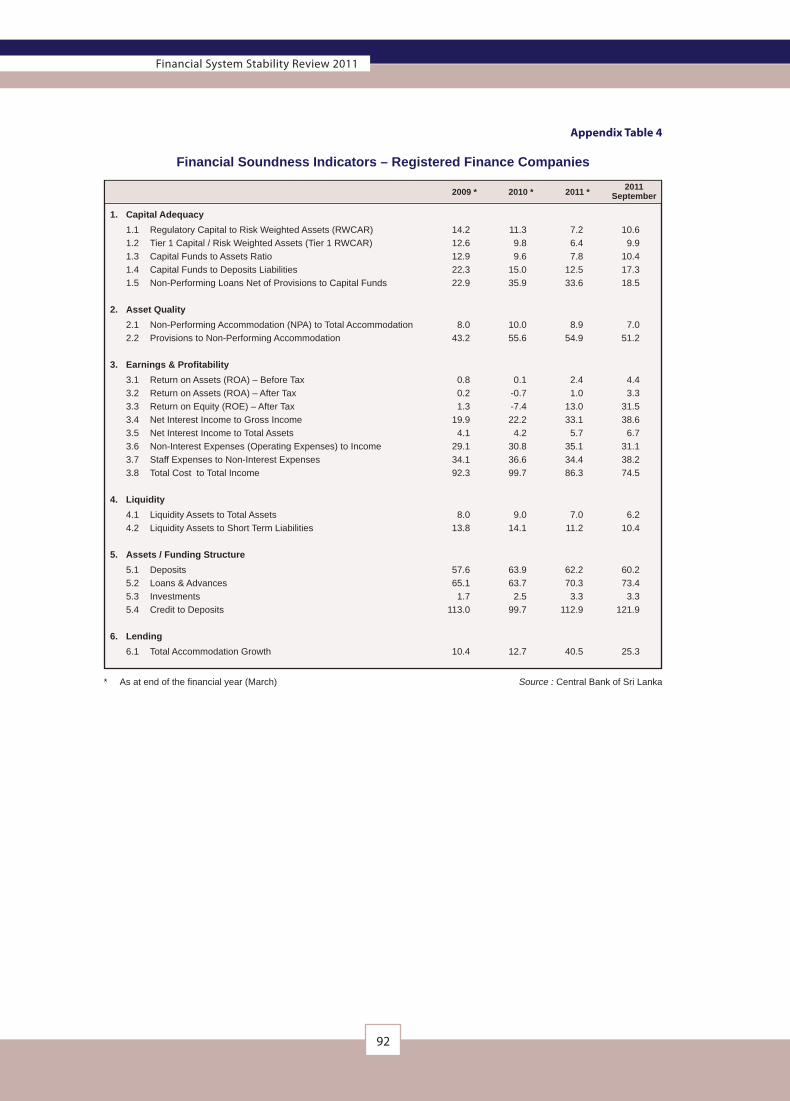
92
Financial System Stability Review 2011
Financial Soundness Indicators – Registered Finance Companies
Appendix Table 4
* As at end of the financial year (March) Source : Central Bank of Sri Lanka
1. Capital Adequacy
1.1 Regulatory Capital to Risk Weighted Assets (RWCAR)
1.2 Tier 1 Capital / Risk Weighted Assets (Tier 1 RWCAR)
1.3 Capital Funds to Assets Ratio
1.4 Capital Funds to Deposits Liabilities
1.5 Non-Performing Loans Net of Provisions to Capital Funds
2. Asset Quality
2.1 Non-Performing Accommodation (NPA) to Total Accommodation
2.2 Provisions to Non-Performing Accommodation
3. Earnings & Profitability
3.1 Return on Assets (ROA) – Before Tax
3.2 Return on Assets (ROA) – After Tax
3.3 Return on Equity (ROE) – After Tax
3.4 Net Interest Income to Gross Income
3.5 Net Interest Income to Total Assets
3.6 Non-Interest Expenses (Operating Expenses) to Income
3.7 Staff Expenses to Non-Interest Expenses
3.8 Total Cost to Total Income
4. Liquidity
4.1 Liquidity Assets to Total Assets
4.2 Liquidity Assets to Short Term Liabilities
5. Assets / Funding Structure
5.1 Deposits
5.2 Loans & Advances
5.3 Investments
5.4 Credit to Deposits
6. Lending
6.1 Total Accommodation Growth
14.2 11.3 7.2 10.6
12.6 9.8 6.4 9.9
12.9 9.6 7.8 10.4
22.3 15.0 12.5 17.3
22.9 35.9 33.6 18.5
8.0 10.0 8.9 7.0
43.2 55.6 54.9 51.2
0.8 0.1 2.4 4.4
0.2 -0.7 1.0 3.3
1.3 -7.4 13.0 31.5
19.9 22.2 33.1 38.6
4.1 4.2 5.7 6.7
29.1 30.8 35.1 31.1
34.1 36.6 34.4 38.2
92.3 99.7 86.3 74.5
8.0 9.0 7.0 6.2
13.8 14.1 11.2 10.4
57.6 63.9 62.2 60.2
65.1 63.7 70.3 73.4
1.7 2.5 3.3 3.3
113.0 99.7 112.9 121.9
10.4 12.7 40.5 25.3
2011September 2009 * 2010 * 2011 *

93
Appendix Tables
Financial Soundness Indicators – Specialised Leasing Companies
Appendix Table 5
Source : Central Bank of Sri Lanka
1. Capital Adequacy
1.1 Capital Funds to Total Assets
1.2 Total Borrowings to Capital Funds (Gearing) - (Times)
2. Asset Quality
2.1 Non-Performing Accommodation (NPA) to Total Accommodation
2.2 Provisions to NPA
2.3 Total Advances to Total Assets
2.4 Total Advances to Total Borrowings
2.5 Provision Made against Total Advances
3. Liquidity
3.1 Net Loans to Total Borrowings
3.2 Liquid Assets to Total Assets
3.3 Liquid Assets to Total Borrowings
4. Earnings & Profitability
4.1 Net Profits Before Tax to Total Assets (ROA)
4.2 Operating Profit Before Provision to Total Assets
4.3 Profit After Tax to Capital Funds (ROE)
4.4 Interest Income to Interest Expenses
4.5 Net Interest Income to Gross Income
4.6 Net Interest Income to Total Assets
4.7 Net Interest Income to Net Profit Before Tax
4.8 Operating Cost to Net Interest Income
5. Assets / Funding Structure
5.1 Borrowings
5.2 Investments
6. Lending
6.1 Total Accommodation Growth
17.4 19.1 18.1 18.0
4.0 3.5 3.8 3.9
5.2 6.0 3.8 3.2
61.5 63.9 87.9 77.1
80.7 74.3 74.4 87.7
116.1 111.4 109.6 124.9
3.2 3.8 3.3 2.5
111.5 105.8 104.7 120.9
5.3 10.2 4.2 3.4
7.6 15.3 6.1 4.9
2.4 3.8 5.3 10.8
3.1 5.0 5.7 9.0
7.6 11.8 20.5 47.9
137.5 158.8 205.6 217.0
23.1 29.4 39.9 40.1
4.9 5.8 6.7 8.1
203.8 154.9 127.1 75.1
102.6 83.1 71.3 53.5
69.5 66.7 67.9 70.2
4.1 6.7 11.5 2.8
9.6 -3.6 41.8 12.1
2011September 2009 * 2010 * 2011 *