FINANCIAL STATEMENTS -...
66
1 FINANCIAL STATEMENTS Statement of responsibility ............. 02 Statement of compliance by the company secretary .............. 02 Report of the independent auditors .......................................... 03 Audit committee report ................... 04 Directors’ report ............................. 05 Consolidated statement of financial position ......................... 07 Consolidated statement of financial performance.................. 08 Consolidated statement of other comprehensive income ...... 09 Consolidated statement of changes in equity ........................... 10 Consolidated statement of cash flows .................................. 12 Principal accounting policies ........... 13 Notes to the consolidated financial statements ........................ 20 Company statement of financial position ............................. 62 Company statement of financial performance ..................... 62 Company statement of changes in equity ........................... 63 Company statement of cash flows ...................................... 63 Notes to the company financial statements ........................ 64 Annexure 1 ..................................... 65 Annexure 2 ..................................... 66 Shareholder analysis ....................... 67 GRI index ....................................... 69 Notice of annual general meeting .... 73 Administration................................. 77 Shareholders’ diary ......................... 77 Form of proxy ................................. 78
Transcript of FINANCIAL STATEMENTS -...

1
FINANCIAL STATEMENTS
Statement of responsibility ............. 02
Statement of compliance
by the company secretary .............. 02
Report of the independent
auditors .......................................... 03
Audit committee report ................... 04
Directors’ report ............................. 05
Consolidated statement
of financial position ......................... 07
Consolidated statement
of financial performance .................. 08
Consolidated statement
of other comprehensive income ...... 09
Consolidated statement of
changes in equity ........................... 10
Consolidated statement
of cash flows .................................. 12
Principal accounting policies ........... 13
Notes to the consolidated
financial statements ........................ 20
Company statement of
financial position ............................. 62
Company statement of
financial performance ..................... 62
Company statement of
changes in equity ........................... 63
Company statement of
cash flows ...................................... 63
Notes to the company
financial statements ........................ 64
Annexure 1 ..................................... 65
Annexure 2 ..................................... 66
Shareholder analysis ....................... 67
GRI index ....................................... 69
Notice of annual general meeting .... 73
Administration................................. 77
Shareholders’ diary ......................... 77
Form of proxy ................................. 78
2 WBHO ANNUAL REPORT 2011
STATEMENT OF RESPONSIBILITY BY THE BOARD OF DIRECTORS
The directors are responsible for the preparation, integrity
and fair presentation of the financial statements of Wilson
Bayly Holmes-Ovcon Limited and its subsidiaries. The
financial statements, presented on pages 7 to 66, have been
prepared in accordance with International Financial Reporting
Standards (IFRS) and the Companies Act of South Africa and
include amounts based on judgements and estimates made
by management. The directors have also prepared any other
information included in the annual report and are responsible
for both its accuracy and its consistency with the financial
statements.
The directors acknowledge that they are ultimately responsible
for the system of internal financial control established by the
group and place considerable importance on maintaining a
strong control environment. To enable directors to meet these
responsibilities, the board sets standards for internal control
aimed at reducing the risk of error or loss in a cost-effective
manner. These standards include the proper delegation of
responsibilities within a clearly defined framework, effective
accounting procedures and adequate segregation of duties to
ensure an acceptable level of risk.
These controls are monitored throughout the group and
all employees are required to maintain the highest ethical
standards in ensuring the group’s business is conducted
in a manner that in all reasonable circumstances is above
reproach. The focus of risk management within the group is
to identify, assess and monitor all known forms of risk across
the group. Whilst operating risk cannot be fully eliminated, the
group endeavours to minimise it by ensuring that appropriate
infrastructure, controls, systems and ethical behaviour are
applied and managed within predetermined procedures and
constraints.
The directors are of the opinion, based on information and
explanations given by management and the internal auditors,
that the system of internal control provides reasonable
assurance that the financial records may be relied on for the
preparation of the financial statements. However, a system of
internal control can provide only reasonable, and not absolute,
assurance against material misstatement or loss.
The going-concern basis has been adopted in preparing the
financial statements. The directors have no reason to believe
that the company or the group will not be going concerns
in the foreseeable future based on forecasts and available
cash resources. The viability of the company and the group is
supported by the financial statements.
The financial statements have been audited by the independent
auditors, BDO South Africa Inc., who were given unrestricted
access to all financial records and the related data, including
minutes of all meetings of shareholders, the board of directors
and committees of the board. The directors believe that all
representations made to the independent auditors during
their audit were valid and appropriate. BDO South Africa Inc’s
unqualified audit report is presented on page 3.
The financial statements were approved by the board of
directors on 2 September 2011 and are signed on its behalf.
Mike Wylie Louwtjie Nel
Chairman Chief Executive Officer
2 September 2011
STATEMENT OF COMPLIANCE BY THE COMPANY SECRETARY
I confirm that the company has lodged with the Registrar of Companies in respect of the year ended 30 June 2011 all returns which
are required to be lodged by a public company in terms of the Companies Act, as amended, and that all such returns are true,
correct and up to date.
Mrs S Vally-Kara
Company secretary
2 September 2011

3FINANCIAL STATEMENTS
REPORT OF INDEPENDENT AUDITORS
TO THE MEMBERS OF WILSON BAYLY
HOLMES-OVCON LIMITED
We have audited the group annual financial statements and
annual financial statements of Wilson Bayly Holmes-Ovcon
Limited, which comprise the consolidated and company
statements of financial position as at 30 June 2011, the
consolidated and company statements of financial performance
and statements of other comprehensive income, the
consolidated and company statements of changes in equity
and consolidated and company statements of cash flows for
the year then ended, and a summary of significant accounting
policies and other explanatory notes, and the directors’ report,
as set out on pages 5 to 66.
DIRECTORS’ RESPONSIBILITY FOR THE
FINANCIAL STATEMENTS
The group’s directors are responsible for the preparation and
fair presentation of these financial statements in accordance
with International Financial Reporting Standards, and in the
manner required by the Companies Act of South Africa.
This responsibility includes: designing, implementing and
maintaining internal control relevant to the preparation and
fair presentation of financial statements that are free from
material misstatement, whether due to fraud or error; selecting
and applying appropriate accounting policies; and making
accounting estimates that are reasonable in the circumstances.
AUDITOR’S RESPONSIBILITY
Our responsibility is to express an opinion on these financial
statements based on our audit. We conducted our audit in
accordance with International Standards on Auditing. Those
standards require that we comply with ethical requirements
and plan and perform the audit to obtain reasonable assurance
whether the financial statements are free from material
misstatement.
An audit involves performing procedures to obtain audit
evidence about the amounts and disclosures in the financial
statements. The procedures selected depend on the
auditor’s judgement, including the assessment of the risks of
material misstatement of the financial statements, whether
due to fraud or error. In making those risk assessments,
the auditor considers internal control relevant to the entity’s
preparation and fair presentation of the financial statements
in order to design audit procedures that are appropriate in
the circumstances, but not for the purpose of expressing an
opinion on the effectiveness of the entity’s internal control.
An audit also includes evaluating the appropriateness of
accounting principles used and the reasonableness of
accounting estimates made by management, as well as
evaluating the overall presentation of the financial statements.
We believe that the audit evidence we have obtained is
sufficient and appropriate to provide a basis for our audit
opinion.
OPINION
In our opinion, these financial statements present fairly, in all
material respects, the consolidated and company financial
position of Wilson Bayly Holmes-Ovcon Limited as at 30 June
2011, and its consolidated and company financial performance
and consolidated and company cash flows for the year then
ended in accordance with International Financial Reporting
Standards, and in the manner required by the Companies Act
of South Africa.
BDO South Africa Incorporated
Registered Auditor
Per SD Shaw
13 Wellington Road
Parktown
2193
2 September 2011
4 WBHO ANNUAL REPORT 2011
AUDIT COMMITTEE REPORTFOR THE YEAR ENDED 30 JUNE 2011
The audit committee report has been prepared in terms of
section 94(7)(f) of the Companies Act No 71 of 2008, as
amended.
The audit committee has complied with the requirements of the
King III Report and has conducted its work in accordance with
the terms of reference which has been approved by the board
and is recorded in the Corporate Governance Report for the
financial year ended 30 June 2011.
Audit committee members and attendance at meetings:
The committee comprises of Ms Nomgando Matyumza, the
chairperson, Ms Nonhlanhla Mjoli-Mncube and Mr James
Ngobeni, all independent non-executive board members.
Mr Malcolm McCulloch resigned from the committee effective
16 February 2011.
A table setting out the attendance at the audit committee
meetings appears on page 21 of the Integrated Report. Their
CVs appear on pages 18 and 19.
The CEO, CFO, the partner in charge of external audit, the
manager responsible for internal audit and other senior
managers attend the audit committee meetings by invitation.
The committee discharges all audit committee responsibilities
of all the subsidiary companies within the group. The committee
performed the following activities during the year:
INTERNAL CONTROLS
During the financial year under the review, the audit committee
considered the effectiveness of the internal audit procedures
and approved the one year operational internal audit work plan.
The committee also monitored the adherence of the internal
audit department to its annual plan.
Both the internal and external audit management reports
concerning the effectiveness of the internal control
environment, the systems adopted and processes conducted
were reviewed and assessed.
The committee dealt with all matters raised in the reports of
both internal and external auditors requesting appropriate
responses and actions from management.
Furthermore, the audit committee reviewed the processes in
place for reporting matters of concern relating to accounting
practices, internal audit procedures and practices, the
adequacy of the auditing of the group’s financial statements,
the internal controls of the company and any related matters.
During the year the audit committee made appropriate
recommendations to the board regarding the corrective actions
that had to be adopted as a consequence of the audit findings.
The group’s fraud policy was reviewed by the committee and
they satisfied themselves that any instances of whistle-blowing
were appropriately resolved.
The ethical conduct of the group, its executives and senior
management was found to be acceptable during the year.
STATUTORY DUTIES
In terms of the audit committee’s statutory duties, the
committee ensured that any extra or non-audit services that
were provided by the external auditors were such that their
independence would not be impaired and were approved and
ratified by the board. The audit charter together with the audit
committee working plan was approved by the board.
The committee was satisfied and reported to the board that
the group was operating as a going concern. It had also been
satisfied that the group has reported in terms of International
Financial Reporting Standards. The audit committee was also
satisfied that the group had complied with the JSE Listings
requirements.
The committee ensured that both the internal and external audit
functions were conducted independently and held separate
meetings with both the internal audit department and the
external auditors, BDO South Africa Incorporated (“BDO”)
during the year.
The committee had ensured that in agreeing the audit fee for
the year, that the audit environment would not be curtailed in
any way and the appropriate level of scope be adopted.
The committee reviewed the performance, appropriateness and
expertise of the chief financial officer and confirms his suitability
for appointment as financial director in terms of the JSE Listings
Requirements.
The committee confirmed that it is satisfied with the
independence of the group’s external auditors and the
respective audit partners.
The audit committee reviewed the performance and
independence of the external auditor, BDO South Africa Inc.
and nominated their appointment and further approval at the
annual general meeting, as well as accepting Mr S Shaw as the
designated audit partner for the 2012 financial year.
The audit committee is therefore satisfied that the group has
adhered and complied with all the statutory requirements for
the year ended 30 June 2011.
NNA Matyumza
Audit committee chairman
2 September 2011

5FINANCIAL STATEMENTS
DIRECTORS’ REPORT
NATURE OF BUSINESS
The company is listed on the securities exchange operated
by JSE Limited and is the holding company of a number of
subsidiary companies principally engaged in civil engineering
and building contracting activities in the Republic of South
Africa and internationally.
GROUP RESULTS
Revenue decreased by 2,9% to R14,8 billion (2010:
R15,2 billion) while operating profit before non-trading items
decreased to R1,1 billion (2010: R1,3 billion). Headline
earnings attributable to shareholders amounted to R733 million
(2010: R961 million). The consolidated statement of financial
performance provides further details.
INTERESTS IN SUBSIDIARIES
Details of the group’s principal subsidiary companies are
included in annexure 1. A full list of subsidiary companies is
available on request from the company secretary.
The holding company is an investment company and
consequently all profits recognised within the consolidated
statement of financial performance were earned by subsidiary
companies.
On 30 June 2011, the group acquired 60% of the issued share
capital of Renniks Construction (Pty) Ltd (Renniks) at a cost of
R32,5 million. Renniks’ activities consist of civil contracting and
sliding processes. A 51% interest in CARR Civil Contracting
Pty Ltd was acquired by WBHO Australia on 1 July 2010 at a
cost of R41,3 million. Through its Australian subsidiary, Probuild
Constructions (Australia) Pty Ltd, the group acquired a 60%
interest in Monaco Hickey Pty Ltd on 1 July 2010 and a 50%
interest in Contexx Holdings Pty Ltd on 1 November 2010 for
R23,2 million and R37 million respectively.
The group has furthermore increased its shareholding in
Roadspan Holdings (Pty) Ltd and Insitu Pipelines (Pty) Ltd to
100% and its shareholding in Probuild Constructions (Australia)
Pty Ltd from 69,4% to 75,19%.
LOSSES IN SUBSIDIARIES
Included in the group’s profit before tax of R1,2 billion are
pre-tax losses from the following subsidiaries:
WBHO Construction Zambia Ltd R2,2 million
CARR Civil Contracting Pty Ltd R2,3 million
Contexx Holdings Pty Ltd R9,1 million
DIVIDENDS
Dependent upon profits earned and the availability of cash,
the policy of the group is to pay an interim dividend in April and
a final dividend in October of each year. The final dividend is
approximately twice the value of the interim dividend.
A final dividend of 220 cents per share in respect of the 2011
year was declared on 2 September 2011 which together with
the interim dividend of 110 cents per share results in a total
payment to shareholders for the year of 330 cents per share
(2010: 330 cents).
SHARE CAPITAL
The company’s issued share capital is 66 000 000 ordinary
shares.
Subject to the regulations of the JSE, 10% of the unissued
ordinary shares are under the control of the directors, until the
next annual general meeting (AGM) to be held on 9 November
2011. At this meeting, shareholders will be requested to grant
the directors the same authority until the next annual general
meeting in 2012.
SHARE SCHEMES
A summary of transactions undertaken by the WBHO Share
Trust, the WBHO Management Trust, Akani Investment
Holdings (Pty) Ltd and the Broad-Based Employee Share
Incentive Trust during the year appear in note 28.
In terms of the trust deeds a further 5 548 750 shares could be
issued to eligible employees.
There have been no changes to the trustees of the share
schemes for the year under review.
Participants in the schemes were advanced interest-free loans
by the trust to enable them to purchase the shares offered.
The trusts are consolidated for the purposes of the
consolidated annual financial statements.
BORROWING POWERS
The articles of association place no restrictions on the directors
concerning the amount of money the company may borrow.
DIRECTORATE
Details concerning the company’s directors, secretary, business
and postal addresses are set out at the end of the annual
report.
In terms of the company’s articles of association, Messrs Wylie,
Matyumza and Nel retire at the forthcoming annual general
meeting and are eligible for re-election. Mr Abbott retires from
the board and will not make himself available for re-election.
Mr Henwood will be appointed in his place.
6 WBHO ANNUAL REPORT 2011
DIRECTORS’ REPORT CONTINUED
DIRECTORS’ SHAREHOLDING
The interests of the directors and those of their families appear
under note 26.
There have been no material changes to directors’
shareholdings between the balance sheet date and the date
of this report. The composition of the board is disclosed in the
annual report.
RELATED PARTY TRANSACTIONS
Related party transactions are disclosed under note 26.
PROPERTY, PLANT AND EQUIPMENT
Full details of the property, plant and equipment are reflected
under note 2.
SUBSEQUENT EVENTS
There were no subsequent events at the time of going to press.
SPECIAL RESOLUTIONS
There were no special resolutions passed during the year.
However, on 2 September 2011, the following special
resolution was passed:
AUTHORITY TO PROVIDE FINANCIAL ASSISTANCE TO
ANY GROUP COMPANY
It was resolved that, in accordance with section 45 of the
Companies Act, No 71 of 2008, as amended (the “Companies
Act”), the provision of any financial assistance by the company
to any company or corporation which is related or inter-related
to the company (as defined in the Companies Act), on the
terms and conditions which the directors may determine be
and is hereby approved.
7FINANCIAL STATEMENTS
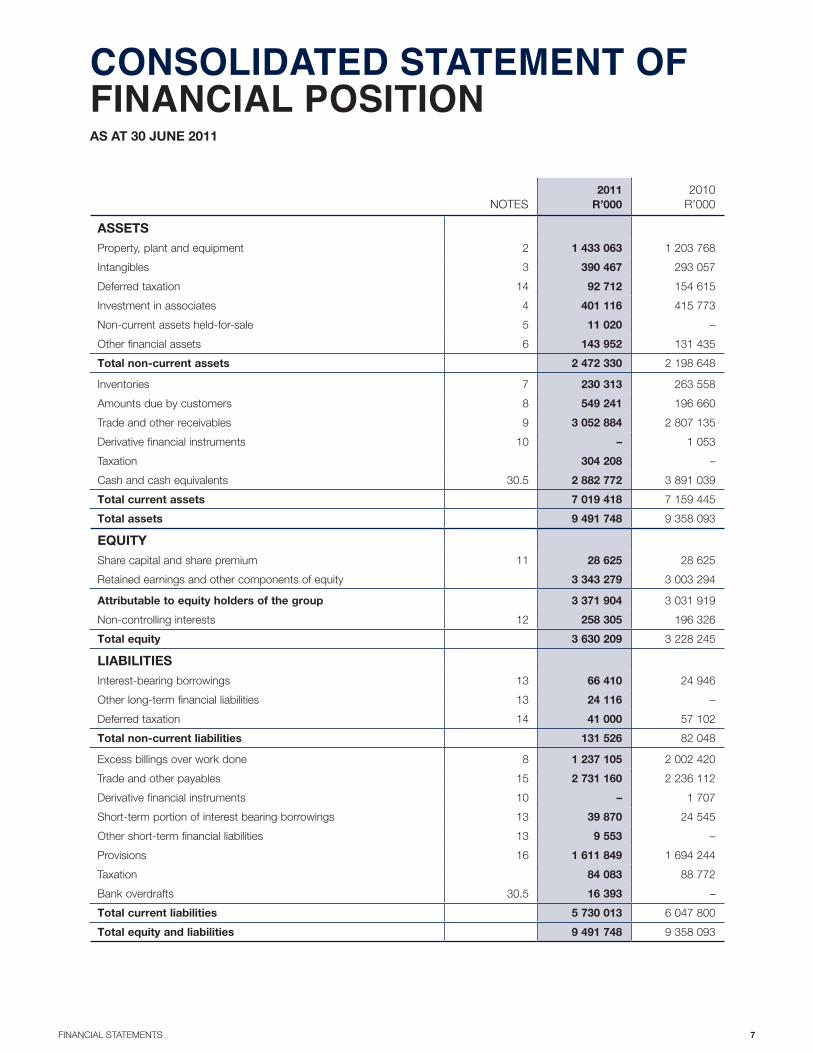
CONSOLIDATED STATEMENT OF FINANCIAL POSITIONAS AT 30 JUNE 2011
NOTES
2011
R’000
2010
R’000
ASSETS
Property, plant and equipment 2 1 433 063 1 203 768
Intangibles 3 390 467 293 057
Deferred taxation 14 92 712 154 615
Investment in associates 4 401 116 415 773
Non-current assets held-for-sale 5 11 020 –
Other financial assets 6 143 952 131 435
Total non-current assets 2 472 330 2 198 648
Inventories 7 230 313 263 558
Amounts due by customers 8 549 241 196 660
Trade and other receivables 9 3 052 884 2 807 135
Derivative financial instruments 10 – 1 053
Taxation 304 208 –
Cash and cash equivalents 30.5 2 882 772 3 891 039
Total current assets 7 019 418 7 159 445
Total assets 9 491 748 9 358 093
EQUITY
Share capital and share premium 11 28 625 28 625
Retained earnings and other components of equity 3 343 279 3 003 294
Attributable to equity holders of the group 3 371 904 3 031 919
Non-controlling interests 12 258 305 196 326
Total equity 3 630 209 3 228 245
LIABILITIES
Interest-bearing borrowings 13 66 410 24 946
Other long-term financial liabilities 13 24 116 –
Deferred taxation 14 41 000 57 102
Total non-current liabilities 131 526 82 048
Excess billings over work done 8 1 237 105 2 002 420
Trade and other payables 15 2 731 160 2 236 112
Derivative financial instruments 10 – 1 707
Short-term portion of interest bearing borrowings 13 39 870 24 545
Other short-term financial liabilities 13 9 553 –
Provisions 16 1 611 849 1 694 244
Taxation 84 083 88 772
Bank overdrafts 30.5 16 393 –
Total current liabilities 5 730 013 6 047 800
Total equity and liabilities 9 491 748 9 358 093

8 WBHO ANNUAL REPORT 2011
CONSOLIDATED STATEMENT OF FINANCIAL PERFORMANCEFOR THE YEAR ENDED 30 JUNE 2011
NOTES
2011
R’000
2010
R’000
Revenue 17 14 766 631 15 201 095
Operating costs (12 815 172) (13 088 158)
Administrative costs (861 410) (838 763)
Operating profit before non-trading items 1 090 049 1 274 174
Impairment of goodwill/negative goodwill realised 3 (36 266) (219)
Share-based payment expense 28 (32 418) (8 922)
Profit/(loss) on disposal of investment 57 921 (5 682)
Impairment of loans to associates 4 (65 867) –
Fair value adjustments to financial assets 97 2 583
Operating profit 18 1 013 516 1 261 934
Investment income 19 224 727 279 505
Finance costs 20 (18 089) (17 018)
Share of profits and losses from associates 4 (51 388) (30 386)
Profit before taxation 1 168 766 1 494 035
Taxation 21 (380 000) (466 524)
Profit for the year 788 766 1 027 511
Profit attributable to:
Equity shareholders of Wilson Bayly Holmes-Ovcon Limited 733 475 961 485
Non-controlling interests 12 55 291 66 026
Profit for the year 788 766 1 027 511
Weighted average number of shares (000) 22 54 727 54 791
Diluted weighted average number of shares (000) 22 55 237 54 987
Earnings per share (cents) 22 1 340,2 1 754,8
Diluted earnings per share (cents) 22 1 327,9 1 748,6
Dividend per share (cents) 330,0 330,0
9FINANCIAL STATEMENTS
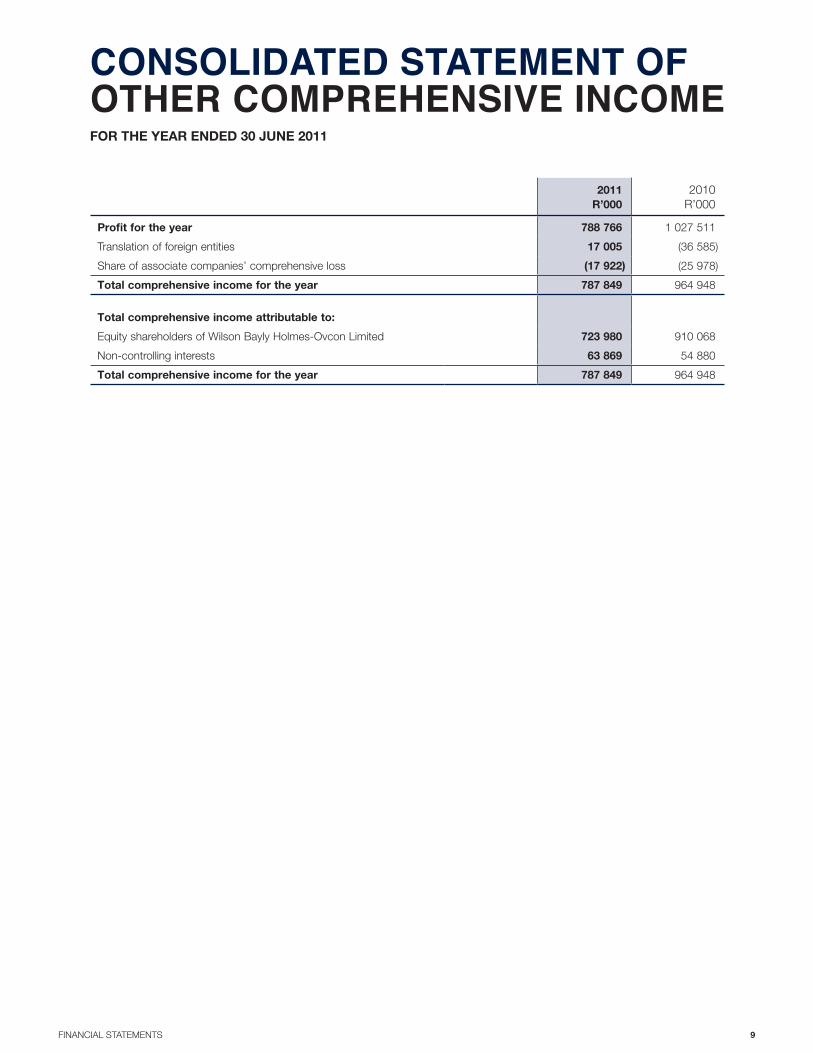
CONSOLIDATED STATEMENT OF OTHER COMPREHENSIVE INCOMEFOR THE YEAR ENDED 30 JUNE 2011
2011
R’000
2010
R’000
Profit for the year 788 766 1 027 511
Translation of foreign entities 17 005 (36 585)
Share of associate companies’ comprehensive loss (17 922) (25 978)
Total comprehensive income for the year 787 849 964 948
Total comprehensive income attributable to:
Equity shareholders of Wilson Bayly Holmes-Ovcon Limited 723 980 910 068
Non-controlling interests 63 869 54 880
Total comprehensive income for the year 787 849 964 948

10 WBHO ANNUAL REPORT 2011
CONSOLIDATED STATEMENT OF CHANGES IN EQUITYFOR THE YEAR ENDED 30 JUNE 2011
ORDINARY
SHARES
ISSUED
R’000
TREASURY
SHARES
R’000
SHARE
PREMIUM
R’000
GOODWILL
R’000
Balance at 30 June 2009 547 113 27 965 –
Profit for the year – – – –
Other comprehensive income – – – –
Share of movement in associates’ equity – – – –
Dividend paid – – – –
Treasury shares acquired (2) 2 – –
Share-based payments expense – – – –
Recognised on acquisition of subsidiaries – – – –
Change in shareholding of subsidiaries – – – –
Goodwill recognised in equity – – – (63 170)
Equity loans advanced by non-controlling interests – – – –
Balance at 30 June 2010 545 115 27 965 (63 170)
Profit for the year – – – –
Other comprehensive income – – – –
Share of movement in associates’ equity – – – –
Dividend paid – – – –
Treasury shares acquired (3) 3 – –
Cash-settled equity instruments raised – – – –
Share-based payments expense – – – –
Recognised on acquisition of subsidiaries – – – –
Change in shareholding of subsidiaries – – – –
Goodwill recognised in equity – – – (169 745)
Equity loans advanced by non-controlling interests – – – –
Balance at 30 June 2011 542 118 27 965 (232 915)

11FINANCIAL STATEMENTS
NON-DISTRIBUTABLE RESERVES
FOREIGN
CURRENCY
TRANSLATION
RESERVE
R’000
EMPLOYEE
SHARE-
SCHEME
RESERVE
R’000
OTHER
RESERVES
R’000
DISTRIBUTABLE
RESERVES
R’000
SHAREHOLDERS’
EQUITY
R’000
NON-
CONTROLLING
INTERESTS
R’000
TOTAL
EQUITY
R’000
82 971 73 883 – 2 199 071 2 384 550 195 443 2 579 993
– – – 961 485 961 485 66 026 1 027 511
(36 585) – (25 978) – (62 563) (11 146) (73 709)
– – (6 918) – (6 918) – (6 918)
– – – (193 974) (193 974) (18 280) (212 254)
– 3 587 – – 3 587 – 3 587
– 8 922 – – 8 922 – 8 922
– – – – – – –
– – – – – (49 217) (49 217)
– – – – (63 170) – (63 170)
– – – – – 13 500 13 500
46 386 86 392 (32 896) 2 966 582 3 031 919 196 326 3 228 245
– – – 733 475 733 475 55 291 788 766
17 005 – (17 922) – (917) 8 578 7 661
– – (24 812) – (24 812) – (24 812)
– – – (209 721) (209 721) (14 841) (224 562)
– – – – – – –
– (1 632) – – (1 632) – (1 632)
– 13 337 – – 13 337 – 13 337
– – – – – 61 202 61 202
– – – – – (60 352) (60 352)
– – – – (169 745) – (169 745)
– – – – – 12 101 12 101
63 391 98 097 (75 630) 3 490 336 3 371 904 258 305 3 630 209

12 WBHO ANNUAL REPORT 2011
CONSOLIDATED STATEMENT OF CASH FLOWSFOR THE YEAR ENDED 30 JUNE 2011
NOTES
2011
R’000
2010
R’000
Cash flow from operating activities
Cash generated from operations 30.1 345 276 1 064 789
Adjustments for:
Investment income 19 224 727 279 505
Finance costs 20 (18 089) (17 018)
Taxation paid 30.2 (650 624) (608 154)
Dividend paid (224 562) (193 974)
Net cash flow from operating activities (323 272) 525 148
Cash flow from investing activities
Increase in other financial assets (99 034) (133 743)
Proceeds from sale of financial assets 86 516 –
Acquisitions net of cash acquired 31.3 (296 841) (180 561)
Acquisition of associates – (5 000)
Increase in advances to associates (104 404) (79 005)
Proceeds on disposal of plant and equipment 42 842 42 981
Purchase of property, plant and equipment
– to maintain operations (85 030) (138 866)
– to expand operations (204 197) (117 544)
Net cash flow from investing activities (660 148) (611 738)
Cash flow from financing activities
Decrease in long-term financial liabilities (53 341) (68 134)
Increase in equity loans from non-controlling interests 12 101 13 500
Net cash flow from financing activities 30.4 (41 240) (54 634)
Decrease in cash and cash equivalents for the year (1 024 660) (141 224)
Cash and cash equivalents at beginning of year 3 891 039 4 032 263
Cash and cash equivalents at the end of year 30.5 2 866 379 3 891 039

13FINANCIAL STATEMENTS
PRINCIPAL ACCOUNTING POLICIESFOR THE YEAR ENDED 30 JUNE 2011
STATEMENT OF COMPLIANCE
The consolidated and company financial statements are
prepared in accordance with International Financial Reporting
Standards (IFRS) and the interpretations adopted by the
International Accounting Standards Board (IASB) and the
International Financial Reporting Interpretations Committee of
the IASB.
BASIS OF PREPARATION
The consolidated and company financial statements have
been prepared on the historical cost basis, except for specific
financial assets and derivative financial instruments which are
measured at fair value through profit and loss. The accounting
policies adopted have been consistently applied throughout the
group to all the periods presented.
SIGNIFICANT JUDGEMENTS AND ESTIMATES
In preparing the annual financial statements, management
is required to make estimates and assumptions that affect
the amounts represented in the financial statements and
related disclosures. Judgements and estimates are continually
evaluated and are based on historical experience and other
factors, including expectations of future events that are believed
to be reasonable under the circumstances. Actual results in the
future could differ from these estimates, which may be material
to the financial statements. Significant estimates include:
IMPAIRMENT OF TRADE AND OTHER RECEIVABLES
Estimates based on management’s assessment of the
likelihood of collecting receivables outstanding for longer than
120 days.
INVENTORIES
Where inventories are recognised at net realisable value,
estimates are made of the expected selling price, cost of
completion and marketing, selling and distribution costs.
PROPERTY, PLANT AND EQUIPMENT
Management uses the best available information to make
estimates of the residual values and useful lives of items of
property, plant and equipment.
IMPAIRMENT OF ASSETS
In determining the recoverable amount of an asset, estimates
are made of suitable discount rates, growth rates and working
capital requirements in order to calculate present value as well
as the future cash flows expected to arise from a specific asset
or cash-generating unit.
FAIR VALUE OF ASSETS ACQUIRED IN BUSINESS
COMBINATIONS
On the acquisition of a company, fair values are attributed to
the identifiable assets (including intangibles), liabilities, and
contingent liabilities acquired. Fair values are determined by
reference to active market value or, if unavailable, by reference
to the current market price of similar assets or obligations, or by
discounting expected future cash flows to their present values.
PROVISIONS
Provisions are recognised when deemed necessary by
management and are based on the estimate of expected
outflows using the relevant information available.
CONTRACTING PROFIT OR LOSS RECOGNITION
Estimates are made of the total expected costs of individual
contracts when applying the stage of completion method.
In certain instances management are required to exercise
judgement to determine whether the outcome of a contract can
be reliably estimated.
TAXATION
The group is subject to taxes in numerous jurisdictions.
Judgement is required in determining the provision for taxes
as the tax liability and treatment thereof cannot be finally
determined until a formal assessment has been made by the
relevant tax authority.
BUSINESS COMBINATIONS
SUBSIDIARIES
Subsidiaries are entities in which the group has an interest
of more than half of the voting rights or the power to govern
the financial and operating policies relevant to the entity.
Subsidiaries are incorporated into the consolidated financial
statements from the date control is obtained until it is
classified as held for sale, at which time it is accounted for in
accordance with IFRS 5 “Non-current Assets Held-for-Sale and
Discontinued Operations”, or any other date where there is a
change in shareholding such that there is no longer control.
The cost of an acquisition is measured as the fair value of
assets transferred (including intangibles), equity instruments
issued and liabilities (including contingent liabilities) incurred or
assumed. Non-controlling interests are determined as the non-
controlling shareholders’ proportionate share of the fair value of
the net assets of subsidiaries at the acquisition date and their
further interest in the subsidiary company’s equity from the date
of acquisition.
Changes in the shareholding of a subsidiary that do not result
in a loss of control are accounted for as equity transactions
(ie transactions with owners in their capacity as owners). After
adjusting the non-controlling interests to reflect the changes in
their relative interests in the subsidiary any difference between
the amounts by which the non-controlling interests are adjusted
and the fair value of the consideration paid or received shall be
recognised directly in equity and attributed to the owners of
the parent.
ASSOCIATES
An associate company is an entity over which the group has
the ability to exercise significant influence, but not control.
Investments in associates are initially recognised at cost.
14 WBHO ANNUAL REPORT 2011
The group’s share of the post-acquisition earnings and reserves
of its associates are incorporated in the financial statements
using the equity method of accounting, from the effective dates
of their acquisition until the effective dates of their disposal
or any other date where there is a change in shareholding or
control such that the entity becomes or ceases to be classified
as an associate. The group’s share of post-acquisition losses
are recognised until such time as the carrying amount of the
investment including any post-acquisition losses, are written
down to nil. Post-acquisition losses in excess of the group’s
interest in an associate are not recognised unless there is an
obligation to make good those losses.
In the company’s separate annual financial statements,
investments in associates are carried at cost less any
accumulated impairment.
JOINT VENTURES
Joint ventures are contractual agreements where the group
and third parties undertake an economic activity that is subject
to joint control and usually take the form of jointly-controlled
entities. The financial and operational decisions surrounding the
activities require the unanimous consent of all parties.
Interests in joint ventures are accounted for using the
proportionate consolidation method where the group
aggregates its share of the assets and liabilities, revenues and
expenses, and cash flows on a line-by-line basis with similar
items within its own financial statements.
GOODWILL
The purchase method is used when an entity is acquired. On
the acquisition date, fair values are attributed to the identifiable
assets, liabilities, and contingent liabilities. Fair values of the
identifiable assets and liabilities and contingent liabilities, are
determined by reference to market values of those or similar
items, where available, or by discounting expected future cash
flows to achieve present values. Assets which are held-for-sale
in accordance with IFRS 5 are measured at fair value less costs
to sell.
The excess of the cost of acquisition over the fair value of
the group’s share of the net identifiable assets is recorded as
goodwill on the acquisition date.
Goodwill is subject to an annual impairment test and any
impairment is recognised immediately in the statement of
financial performance and is not subsequently reversed. To
the extent that the fair value of the net identifiable assets
of the entity acquired exceeds the cost of acquisition, the
excess is recognised in the consolidated statement of financial
performance at the acquisition date.
Goodwill recognised on the acquisition of a subsidiary or a joint
venture is included in intangible assets. Goodwill recognised
on the acquisition of an associate company is included in
investment in associates. On disposal of a subsidiary the
attributable goodwill is included in the determination of the
profit or loss on disposal. The same principle is applicable for
partial disposals, where a portion of the attributable goodwill is
recognised as part of the cost of the disposed assets.
BASIS OF CONSOLIDATION
The consolidated financial statements include the financial
position, financial performance and cash flow information
of the holding company, its subsidiaries, joint ventures and
associates. All financial results are consolidated with similar
items on a line-by-line basis with the exception of investments
in associates.
Where subsidiaries, associates or joint ventures use accounting
policies other than those adopted in the consolidated financial
statements, appropriate adjustments are made in preparing the
consolidated financial statements.
Inter-company and inter-segment transactions and balances
as well as unrealised gains and losses between entities are
eliminated on consolidation.
Unrealised gains and losses in respect of associates are
eliminated against the investment in the associate to the extent
of the group’s interest in these entities.
Gains and losses on transactions between the group and
jointly-controlled entities are recognised only to the extent of
unrelated investors’ interest in the joint venture. The parent’s
share in the jointly-controlled entity’s profits and losses resulting
from these transactions is eliminated against the asset or
liability of the jointly-controlled entity arising on the transaction.
Special-purpose entities are consolidated on a line-for-line basis
where the group is deemed to have control over the entity.
SEGMENTAL REPORTING
Operating segments are reported in a manner consistent with
the internal reporting provided to the chief operating decision-
makers, identified as the executive directors. The group’s
reportable segments represent strategic business units that
offer the main services of the group.
FINANCIAL INSTRUMENTS
Financial instruments are recognised when the entity becomes
a party to the contractual provisions of the instruments.
Financial instruments are derecognised when substantially all
risks and rewards of ownership have been transferred.
Financial instruments are recognised initially on transaction
date at fair value. For financial instruments carried at fair value
through profit and loss, transaction costs are either added to or
deducted from the fair value on recognition.
The group classifies its financial instruments into the following
categories depending on the purpose for which the instrument
was acquired. Management determines the classification at the
time of initial recognition.
The group’s categories are as follows:
Financial assets and liabilities at fair value through profit
and loss
Loans and receivables
Financial liabilities held at amortised cost
PRINCIPAL ACCOUNTING POLICIESFOR THE YEAR ENDED 30 JUNE 2011

15FINANCIAL STATEMENTS
FINANCIAL ASSETS AND LIABILITIES AT FAIR VALUE
THROUGH PROFIT AND LOSS
These instruments include trading investments, non-trading
investments and derivative financial instruments and are
measured at fair value. Changes in fair value are recognised
annually in the statement of financial performance.
The fair value of instruments that are actively traded in
organised financial markets are determined by reference to
quoted market prices at the close of business on the statement
of financial position date. For instruments where there is
no active market, fair value is determined using valuation
techniques. Such techniques include using recent arm’s
length market transactions, referencing to the current market
value of another instrument which is substantially the same or
discounted cash flow analysis.
Financial assets and liabilities at fair value on the face of the
consolidated statement of financial position include:
Concessions
These investments are revalued based on the present value
of expected future cash flows and are carried as non-current
assets on the face of the consolidated statement of financial
position.
Listed share investments
The value of these investments varies according to the share
price as traded on the Johannesburg Stock Exchange (JSE).
These assets are represented as non-current assets on the
face of the consolidated statement of financial position.
Derivatives
Derivative financial assets and liabilities are financial instruments
whose value changes in response to underlying conditions and
require little or no initial investment. Derivatives are separated
between their current and non-current portions on the face of
the statement of financial position depending on their expected
maturity dates.
LOANS AND RECEIVABLES
Loans and receivables are non-derivative financial assets with
fixed or determinable payments that are not quoted in an active
market and are subsequently measured at amortised cost.
Amortised cost is calculated using the effective interest rate
method.
Gains and losses are recognised in the statement of financial
performance when the loans and receivables are derecognised
or impaired, as well as through the amortisation process.
The recoverable amount of the group’s loans and receivables
is calculated as the present value of estimated future cash
flows, discounted at the original effective interest rate (ie the
effective interest rate computed at initial recognition of these
financial assets).
An impairment loss in respect of loans and receivables carried
at amortised cost is reversed if the subsequent increase in
the recoverable amount can be related objectively to an event
occurring after the impairment loss was recognised.
Loans and receivables on the face of the consolidated
statement of financial position include:
Trade and other receivables
Trade and other receivables are measured at cost less provision
for impairment. An impairment arises when there is objective
evidence that the group will be unable to collect the balance
owed in respect of the receivable’s trade terms. The provision
is recognised in the consolidated statement of financial
performance.
Cash and cash equivalents
Cash and cash equivalents include cash on hand, deposits held
on call with banks, investments in money market instruments
and bank overdrafts. Cash on hand is measured at fair value.
Loans receivable
Loans are recognised at amortised cost and include accrued
interest (where applicable). Loans are classified as current
assets in terms of the loan agreements.
FINANCIAL LIABILITIES HELD AT AMORTISED COST
These instruments include trade payables, accruals and
amounts owed for assets held under finance lease agreements
and are carried at amortised cost. Financial liabilities shown
on the face of the consolidated statement of financial position
include:
Trade and other payables
These instruments are recognised at amortised cost using the
effective interest rate method. The obligation arising is expected
to be settled within 12 months of the statement of financial
position date.
Interest-bearing borrowings
Borrowings are recognised at amortised cost net of finance
costs. Borrowings are subdivided between current and non-
current portions on the consolidated statement of financial
position depending on when the obligation will fall due.
PROPERTY, PLANT AND EQUIPMENT
MEASUREMENT
Property, plant and equipment is stated at historical cost
less accumulated depreciation and impairment. Land is not
depreciated. Cost includes all qualifying expenditure that is
directly attributable to the acquisition of the item.
SUBSEQUENT COSTS
Subsequent costs are included in an asset’s carrying value
only when it is probable that the future economic benefits
associated with the item will flow to the group and these costs
can be measured reliably.
SITE RESTORATION AND DISMANTLING COSTS
Where there is an obligation to dismantle items of property,
plant and equipment and to restore a site to its original
condition before those assets were placed there, a provision

16 WBHO ANNUAL REPORT 2011
is recognised. The cost of the item of property, plant and
equipment includes the estimated present value of any future
unavoidable costs of dismantling and removing the assets.
Any changes in the estimated costs of dismantling and site
restoration are added to, or deducted from, the cost of the
related asset in the current period or in the statement of
financial performance if the cost adjustment exceeds the
carrying value of the asset. If the adjusted cost results in an
addition to the cost of the asset, management should consider
if the new carrying amount of that asset is fully recoverable. If
not, an impairment test should be carried out and any resulting
loss recognised in the statement of financial performance.
REVALUATIONS
Property, plant and equipment are not revalued.
COMPONENTS
Where plant and equipment comprises major components with
different useful lives, such components are accounted for and
depreciated as separate items. Expenditure incurred to replace
or modify a significant component is capitalised and any
remaining book value of the component replaced is written off
in the consolidated statement of financial performance.
DEPRECIATION
Property, plant and equipment is depreciated to its estimated
residual values over its expected useful life. The depreciation
methods, estimated remaining useful lives and residual values
are reviewed at least annually. The depreciation methods and
average depreciation periods are set out in note 2.
INTANGIBLES
Certain companies within the group hold intangible assets in
the form of mining rights. These assets are held at cost and
assessed for impairment annually. Once the asset comes into
use, it will be amortised over its useful life.
CONTRACTS IN PROGRESS
Profits or losses in respect of long-term contracts are
recognised on an individual contract basis using the stage of
completion method. Where the outcome of a construction
contract can be estimated reliably, the stage of completion
is determined on the basis of actual costs incurred at the
statement of financial position date compared to the estimated
total costs of the contract. Anticipated losses on incomplete
contracts are fully provided for as soon as the loss is foreseen
and includes any loss related to future work on the contract.
Contracts in progress are stated at cost plus profit taken to
date less cash received or receivable less any provision for
losses. On contracts where the outcome cannot be reliably
estimated, revenue is recognised to the extent that the
recoverability of costs incurred is probable.
INVENTORIES
Inventories are valued at the lower of cost or net realisable
value.
Cost is determined on the following basis:
materials on site, consumable stores and trading stock are
valued at cost on the weighted-average basis; and
property for development is stated at cost together with
development expenditure incurred during the development
stage, unless the capitalisation of such expenditure would
result in the value of the property exceeding the value
which, in the opinion of the directors, would be realised
when sold.
Net realisable value represents the estimated selling price less
all estimated costs to completion and costs to be incurred in
marketing, selling and distribution.
NON-CURRENT ASSETS HELD-FOR-SALE
Non-current assets are classified as held-for-sale if their
carrying value will be recovered through a sale transaction
rather than through continuing use. This condition is regarded
as being met only when the sale is highly probable and the
asset is available for immediate sale in its present condition.
Management must be committed to the sale, which should be
expected to qualify for recognition as a completed sale within
one year from the date of classification. Non-current assets
held-for-sale are stated at the lower of the carrying amount and
fair value less costs to sell.
IMPAIRMENT OF ASSETS
Impairment tests are undertaken bi-annually at each reporting
period or whenever events or changes in circumstances
indicate that the carrying amount of an asset may not be
recoverable. Where the carrying amount of an asset exceeds
its recoverable amount (being the higher of value in use or fair
value less costs to sell), the asset is impaired accordingly.
The recoverable amount is the greater of an asset’s fair value
less costs to sell and value in use. In assessing value in use,
the estimated future cash flows are discounted to their present
value using a pre-tax discount rate that reflects current market
assessments of the time value of money and the risks specific
to the asset. For an asset that does not generate cash inflows
largely independent of those from other assets (including
goodwill), the recoverable amount is determined for the cash-
generating unit to which the asset relates. Impairment losses
recognised in respect of cash-generating units are allocated
first to reduce the carrying amount of any goodwill allocated
to such cash-generating units and thereafter, to reduce the
carrying amounts of the other assets in the unit on a pro rata
basis.
Impairment charges are shown on the face of the consolidated
statement of financial performance. An impairment loss
recognised for goodwill is not reversed.
In respect of other assets an impairment loss is only reversed
if there is an indication that the impairment loss may no
longer exist and there has been a change in the estimates
used to determine the recoverable amount. However, the
amount of the impairment reversed cannot result in the final
balance exceeding the carrying amount that would have
been determined (net of depreciation or amortisation), had no
impairment loss been recognised in previous years.
PRINCIPAL ACCOUNTING POLICIES CONTINUED
FOR THE YEAR ENDED 30 JUNE 2011
17FINANCIAL STATEMENTS
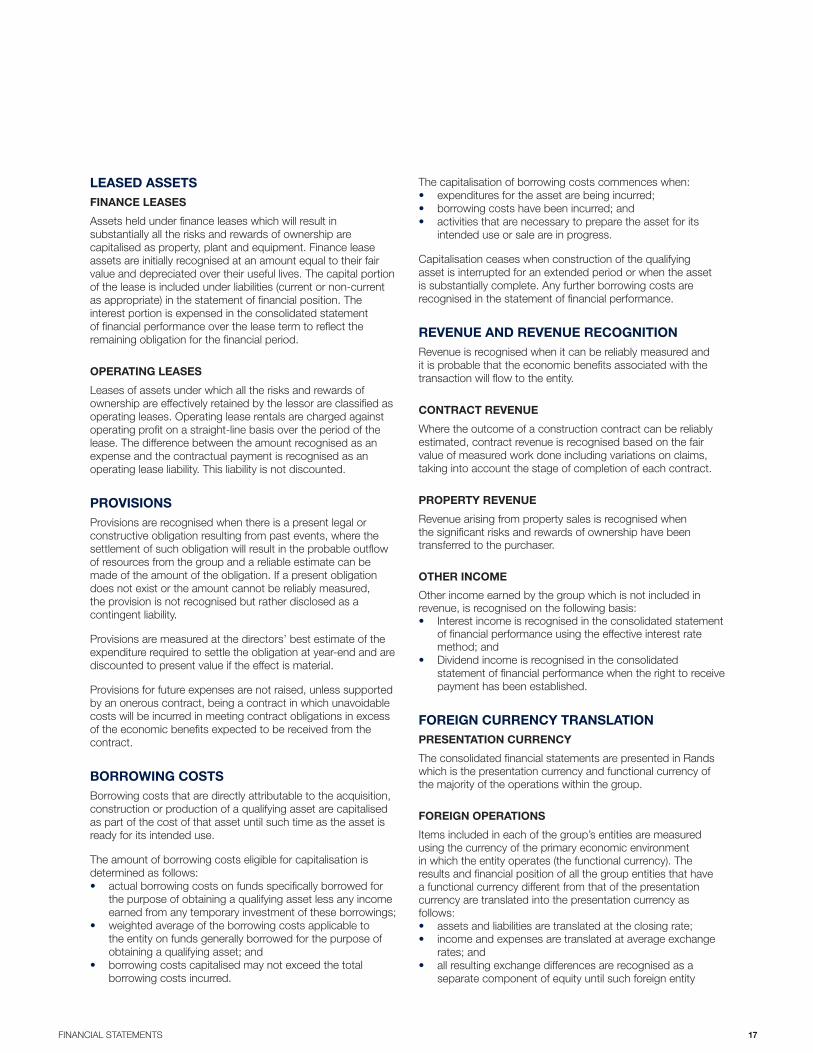
LEASED ASSETS
FINANCE LEASES
Assets held under finance leases which will result in
substantially all the risks and rewards of ownership are
capitalised as property, plant and equipment. Finance lease
assets are initially recognised at an amount equal to their fair
value and depreciated over their useful lives. The capital portion
of the lease is included under liabilities (current or non-current
as appropriate) in the statement of financial position. The
interest portion is expensed in the consolidated statement
of financial performance over the lease term to reflect the
remaining obligation for the financial period.
OPERATING LEASES
Leases of assets under which all the risks and rewards of
ownership are effectively retained by the lessor are classified as
operating leases. Operating lease rentals are charged against
operating profit on a straight-line basis over the period of the
lease. The difference between the amount recognised as an
expense and the contractual payment is recognised as an
operating lease liability. This liability is not discounted.
PROVISIONS
Provisions are recognised when there is a present legal or
constructive obligation resulting from past events, where the
settlement of such obligation will result in the probable outflow
of resources from the group and a reliable estimate can be
made of the amount of the obligation. If a present obligation
does not exist or the amount cannot be reliably measured,
the provision is not recognised but rather disclosed as a
contingent liability.
Provisions are measured at the directors’ best estimate of the
expenditure required to settle the obligation at year-end and are
discounted to present value if the effect is material.
Provisions for future expenses are not raised, unless supported
by an onerous contract, being a contract in which unavoidable
costs will be incurred in meeting contract obligations in excess
of the economic benefits expected to be received from the
contract.
BORROWING COSTS
Borrowing costs that are directly attributable to the acquisition,
construction or production of a qualifying asset are capitalised
as part of the cost of that asset until such time as the asset is
ready for its intended use.
The amount of borrowing costs eligible for capitalisation is
determined as follows:
actual borrowing costs on funds specifically borrowed for
the purpose of obtaining a qualifying asset less any income
earned from any temporary investment of these borrowings;
weighted average of the borrowing costs applicable to
the entity on funds generally borrowed for the purpose of
obtaining a qualifying asset; and
borrowing costs capitalised may not exceed the total
borrowing costs incurred.
The capitalisation of borrowing costs commences when:
expenditures for the asset are being incurred;
borrowing costs have been incurred; and
activities that are necessary to prepare the asset for its
intended use or sale are in progress.
Capitalisation ceases when construction of the qualifying
asset is interrupted for an extended period or when the asset
is substantially complete. Any further borrowing costs are
recognised in the statement of financial performance.
REVENUE AND REVENUE RECOGNITION
Revenue is recognised when it can be reliably measured and
it is probable that the economic benefits associated with the
transaction will flow to the entity.
CONTRACT REVENUE
Where the outcome of a construction contract can be reliably
estimated, contract revenue is recognised based on the fair
value of measured work done including variations on claims,
taking into account the stage of completion of each contract.
PROPERTY REVENUE
Revenue arising from property sales is recognised when
the significant risks and rewards of ownership have been
transferred to the purchaser.
OTHER INCOME
Other income earned by the group which is not included in
revenue, is recognised on the following basis:
Interest income is recognised in the consolidated statement
of financial performance using the effective interest rate
method; and
Dividend income is recognised in the consolidated
statement of financial performance when the right to receive
payment has been established.
FOREIGN CURRENCY TRANSLATION
PRESENTATION CURRENCY
The consolidated financial statements are presented in Rands
which is the presentation currency and functional currency of
the majority of the operations within the group.
FOREIGN OPERATIONS
Items included in each of the group’s entities are measured
using the currency of the primary economic environment
in which the entity operates (the functional currency). The
results and financial position of all the group entities that have
a functional currency different from that of the presentation
currency are translated into the presentation currency as
follows:
assets and liabilities are translated at the closing rate;
income and expenses are translated at average exchange
rates; and
all resulting exchange differences are recognised as a
separate component of equity until such foreign entity

18 WBHO ANNUAL REPORT 2011
is disposed of at which time such translation difference
is recognised in the consolidated statement of financial
performance.
TRANSACTIONS AND BALANCES
Foreign currency transactions are translated into the functional
currency using the exchange rates prevailing at the transaction
dates. Foreign exchange gains and losses resulting from the
settlement of such transactions and from the translation at
year-end exchange rates of monetary assets and liabilities
denominated in foreign currencies are recognised in the
consolidated statement of financial performance.
Goodwill and fair value adjustments arising on the acquisition
of foreign entities are treated as assets of the foreign entity and
translated at the closing rate.
TAXATION
CURRENT TAXATION
The current tax charge is the calculated tax payable on the
taxable income for the year using substantively enacted tax
rates and includes any adjustments to tax payable in respect of
prior years.
DEFERRED TAXATION
Deferred taxation is provided using the liability method to
calculate all temporary differences between the carrying
amounts for financial reporting purposes and the amounts used
for taxation purposes.
No deferred tax is provided on temporary differences relating to:
goodwill;
the initial recognition of an asset or liability to the extent
that neither accounting nor taxable profit is affected on
acquisition; and
investments in subsidiaries to the extent they will probably
not reverse in the foreseeable future.
A deferred tax asset is recognised to the extent that it is
probable that future taxable profits will be available against
which the unused tax losses and deductible temporary
differences can be utilised. Enacted or substantively enacted
tax rates that are expected to apply when the asset is realised
or liability settled, are used to determine the deferred taxation
provision at statement of financial position date.
SECONDARY TAXATION ON COMPANIES (STC)
STC is recognised as a component of the current tax charge
in the statement of financial performance when the related
dividend is declared. When dividends received in the current
year can be offset against future dividend payments to reduce
the STC liability, a deferred tax asset is recognised to the extent
of the future reduction in STC.
EMPLOYEE BENEFITS
DEFINED CONTRIBUTION BENEFITS
Under defined contribution plans the group’s legal or
constructive obligation is limited to the amount that it agrees
to contribute to the fund. Consequently the risk that assets
invested will be insufficient to meet the expected benefits is
borne by the employees.
Contributions to a defined contribution plan in respect of
service in a particular period are recognised as an expense in
that period.
DEFINED BENEFIT FUNDS
The cost of providing benefits under the defined benefit plan is
determined using the projected unit credit actuarial valuation
method. Actuarial gains and losses are recognised as income
or expense when the net cumulative unrecognised actuarial
gains and losses for each individual plan at the end of the
previous reporting period exceeded 10% of the higher of the
defined benefit obligation and the fair value of plan assets at
that date (the corridor method).
These gains or losses are recognised over the expected
average remaining working lives of the employees participating
in the plan.
The past service cost is recognised as an expense on a straight
line basis over the average period until the benefits vest. If
the benefits have already vested immediately following the
introduction of, or changes to a pension plan, past service cost
is recognised immediately.
The defined benefit asset or liability comprises the present
value of the defined benefit obligation less past service cost
not yet recognised and less the fair value of plan assets out
of which the obligations are to be settled directly. The value of
any asset is restricted to the sum of any past service cost not
yet recognised and the present value of any economic benefits
available in the form of refunds from the plan or reductions in
the future contributions to the plan.
LEAVE PAY
Employee entitlements to annual leave are recognised when
they accrue to employees. An accrual is made for the liability
for annual leave, as a result of services by employees, up to the
statement of financial position date.
BONUS PLANS
A liability for employee benefits in the form of bonus plans is
recognised as a provision as past practice has created a valid
expectation by employees that they will receive a bonus and
amounts can be determined before the time of issuing the
financial statements.
SHARE-BASED COMPENSATION
The group operates both equity-settled and cash-settled share
based schemes.
Equity-settled
The fair value of shares and deferred delivery shares granted
to employees is recognised as an employee expense with a
corresponding increase in equity. The fair value is measured
at grant date taking into account the structure of the grant,
and expensed over the period during which the employees are
PRINCIPAL ACCOUNTING POLICIES CONTINUED
FOR THE YEAR ENDED 30 JUNE 2011
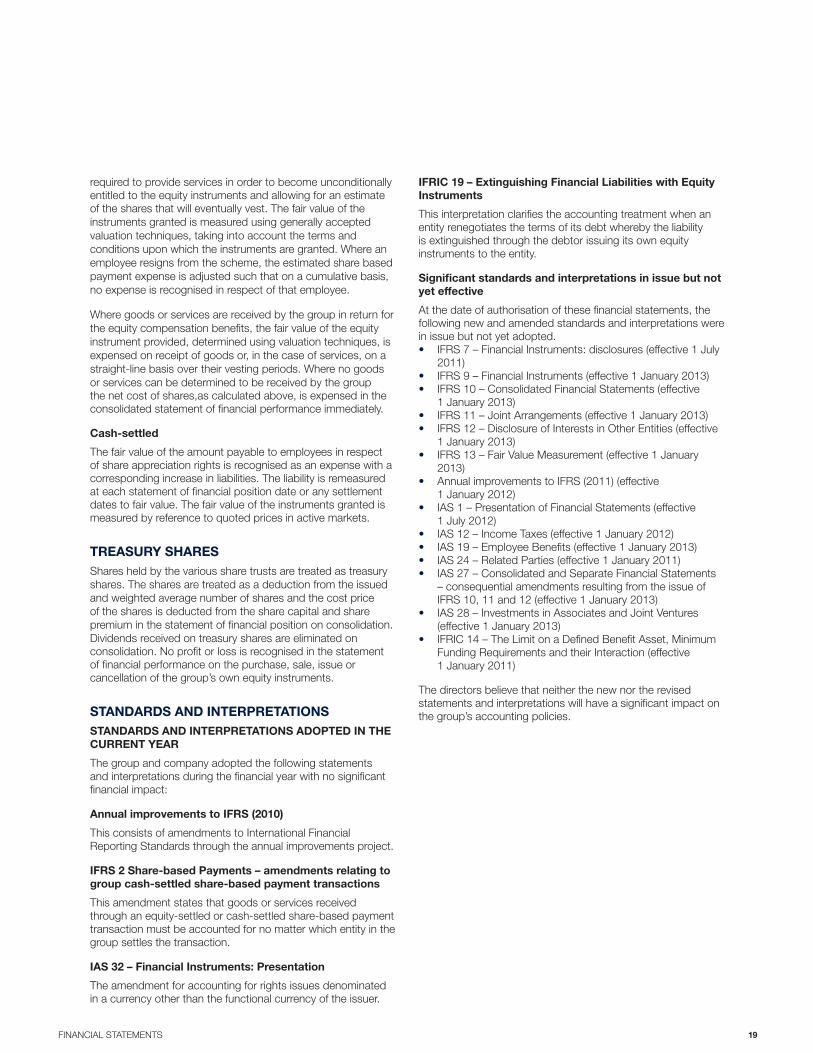
19FINANCIAL STATEMENTS
required to provide services in order to become unconditionally
entitled to the equity instruments and allowing for an estimate
of the shares that will eventually vest. The fair value of the
instruments granted is measured using generally accepted
valuation techniques, taking into account the terms and
conditions upon which the instruments are granted. Where an
employee resigns from the scheme, the estimated share based
payment expense is adjusted such that on a cumulative basis,
no expense is recognised in respect of that employee.
Where goods or services are received by the group in return for
the equity compensation benefits, the fair value of the equity
instrument provided, determined using valuation techniques, is
expensed on receipt of goods or, in the case of services, on a
straight-line basis over their vesting periods. Where no goods
or services can be determined to be received by the group
the net cost of shares,as calculated above, is expensed in the
consolidated statement of financial performance immediately.
Cash-settled
The fair value of the amount payable to employees in respect
of share appreciation rights is recognised as an expense with a
corresponding increase in liabilities. The liability is remeasured
at each statement of financial position date or any settlement
dates to fair value. The fair value of the instruments granted is
measured by reference to quoted prices in active markets.
TREASURY SHARES
Shares held by the various share trusts are treated as treasury
shares. The shares are treated as a deduction from the issued
and weighted average number of shares and the cost price
of the shares is deducted from the share capital and share
premium in the statement of financial position on consolidation.
Dividends received on treasury shares are eliminated on
consolidation. No profit or loss is recognised in the statement
of financial performance on the purchase, sale, issue or
cancellation of the group’s own equity instruments.
STANDARDS AND INTERPRETATIONS
STANDARDS AND INTERPRETATIONS ADOPTED IN THE
CURRENT YEAR
The group and company adopted the following statements
and interpretations during the financial year with no significant
financial impact:
Annual improvements to IFRS (2010)
This consists of amendments to International Financial
Reporting Standards through the annual improvements project.
IFRS 2 Share-based Payments – amendments relating to
group cash-settled share-based payment transactions
This amendment states that goods or services received
through an equity-settled or cash-settled share-based payment
transaction must be accounted for no matter which entity in the
group settles the transaction.
IAS 32 – Financial Instruments: Presentation
The amendment for accounting for rights issues denominated
in a currency other than the functional currency of the issuer.
IFRIC 19 – Extinguishing Financial Liabilities with Equity
Instruments
This interpretation clarifies the accounting treatment when an
entity renegotiates the terms of its debt whereby the liability
is extinguished through the debtor issuing its own equity
instruments to the entity.
Significant standards and interpretations in issue but not
yet effective
At the date of authorisation of these financial statements, the
following new and amended standards and interpretations were
in issue but not yet adopted.
IFRS 7 – Financial Instruments: disclosures (effective 1 July
2011)
IFRS 9 – Financial Instruments (effective 1 January 2013)
IFRS 10 – Consolidated Financial Statements (effective
1 January 2013)
IFRS 11 – Joint Arrangements (effective 1 January 2013)
IFRS 12 – Disclosure of Interests in Other Entities (effective
1 January 2013)
IFRS 13 – Fair Value Measurement (effective 1 January
2013)
Annual improvements to IFRS (2011) (effective
1 January 2012)
IAS 1 – Presentation of Financial Statements (effective
1 July 2012)
IAS 12 – Income Taxes (effective 1 January 2012)
IAS 19 – Employee Benefits (effective 1 January 2013)
IAS 24 – Related Parties (effective 1 January 2011)
IAS 27 – Consolidated and Separate Financial Statements
– consequential amendments resulting from the issue of
IFRS 10, 11 and 12 (effective 1 January 2013)
IAS 28 – Investments in Associates and Joint Ventures
(effective 1 January 2013)
IFRIC 14 – The Limit on a Defined Benefit Asset, Minimum
Funding Requirements and their Interaction (effective
1 January 2011)
The directors believe that neither the new nor the revised
statements and interpretations will have a significant impact on
the group’s accounting policies.

20 WBHO ANNUAL REPORT 2011
NOTES TO THE FINANCIAL STATEMENTSFOR THE YEAR ENDED 30 JUNE 2011
LAND AND
BUILDINGS
R’000
AIRCRAFT
R’000
PLANT,
VEHICLES AND
EQUIPMENT
R’000
OFFICE AND
COMPUTER
EQUIPMENT
R’000
TOTAL
R’000
2. PROPERTY, PLANT AND EQUIPMENT
2011
Cost
At 30 June 2010 212 708 28 645 1 740 916 70 996 2 053 265
Additions 26 595 – 247 778 14 854 289 227
Acquisition of subsidiaries 22 086 – 216 315 1 840 240 241
Disposals – – (114 594) (7 195) (121 789)
Translation of foreign entities 11 895 – 27 315 3 593 42 803
At 30 June 2011 273 284 28 645 2 117 730 84 088 2 503 747
Accumulated depreciation
At 30 June 2010 14 655 5 140 775 188 54 514 849 497
Depreciation 2 942 557 195 524 9 042 208 065
Disposals – – (74 793) (6 656) (81 449)
Acquisition of subsidiaries – – 77 578 1 249 78 827
Translation of foreign entities 511 – 12 830 2 403 15 744
At 30 June 2011 18 108 5 697 986 327 60 552 1 070 684
Net book value at 30 June
2011 255 176 22 948 1 131 403 23 536 1 433 063
2010
Cost
At 30 June 2009 193 466 28 645 1 540 050 66 969 1 829 130
Additions 17 384 – 234 005 5 055 256 444
Acquisition of subsidiaries – – 70 184 1 803 71 987
Disposals – – (99 748) (3 476) (103 224)
Translation of foreign entities 1 858 – (3 575) 645 (1 072)
At 30 June 2010 212 708 28 645 1 740 916 70 996 2 053 265
Accumulated depreciation
At 30 June 2009 9 216 3 801 655 387 47 054 715 458
Depreciation 5 445 1 339 168 546 8 655 183 985
Disposals (5) – (61 750) (2 190) (63 945)
Acquisition of subsidiaries – – 14 295 603 14 898
Translation of foreign entities (1) – (1 290) 392 (899)
At 30 June 2010 14 655 5 140 775 188 54 514 849 497
Net book value at 30 June 2010 198 053 23 505 965 728 16 482 1 203 768
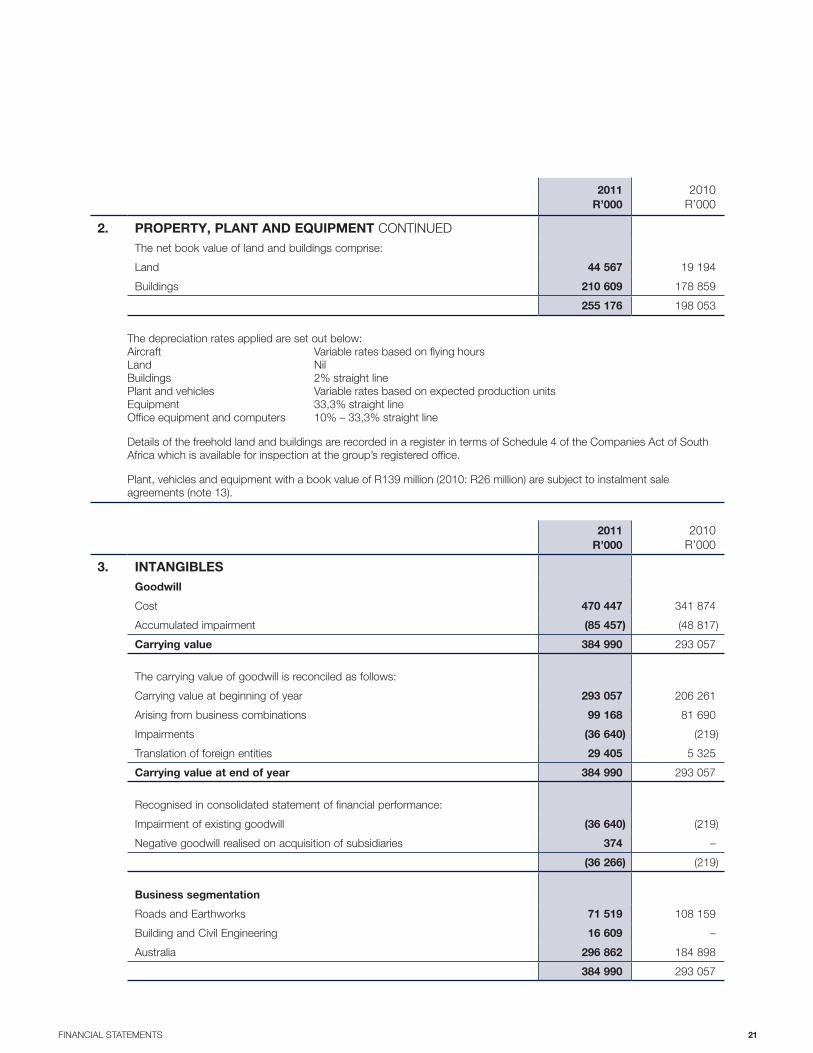
21FINANCIAL STATEMENTS
2011
R’000
2010
R’000
2. PROPERTY, PLANT AND EQUIPMENT CONTINUED
The net book value of land and buildings comprise:
Land 44 567 19 194
Buildings 210 609 178 859
255 176 198 053
The depreciation rates applied are set out below:
Aircraft Variable rates based on flying hours
Land Nil
Buildings 2% straight line
Plant and vehicles Variable rates based on expected production units
Equipment 33,3% straight line
Office equipment and computers 10% – 33,3% straight line
Details of the freehold land and buildings are recorded in a register in terms of Schedule 4 of the Companies Act of South
Africa which is available for inspection at the group’s registered office.
Plant, vehicles and equipment with a book value of R139 million (2010: R26 million) are subject to instalment sale
agreements (note 13).
2011
R’000
2010
R’000
3. INTANGIBLES
Goodwill
Cost 470 447 341 874
Accumulated impairment (85 457) (48 817)
Carrying value 384 990 293 057
The carrying value of goodwill is reconciled as follows:
Carrying value at beginning of year 293 057 206 261
Arising from business combinations 99 168 81 690
Impairments (36 640) (219)
Translation of foreign entities 29 405 5 325
Carrying value at end of year 384 990 293 057
Recognised in consolidated statement of financial performance:
Impairment of existing goodwill (36 640) (219)
Negative goodwill realised on acquisition of subsidiaries 374 –
(36 266) (219)
Business segmentation
Roads and Earthworks 71 519 108 159
Building and Civil Engineering 16 609 –
Australia 296 862 184 898
384 990 293 057

22 WBHO ANNUAL REPORT 2011
NOTES TO THE FINANCIAL STATEMENTS CONTINUED
FOR THE YEAR ENDED 30 JUNE 2011
2011
R’000
2010
R’000
3. INTANGIBLES CONTINUED
Impairment of goodwill
The recoverable amount of a cash-generating unit is determined based on value-
in-use calculations. The calculations use discounted cash flow projections based
on financial forecasts over a five-year period. The discount rates used in the cash
flow models are between 10% and 18% (2010: 11% and 15%).
These estimates are pre-tax discount rates that reflect the current market
assessments of the time value of money and specific risk to the cash-generating
unit.
The discount rates are arrived at after taking into account the following factors:
fluctuations in operating conditions
fluctuations in estimated growth rates; and
expected working capital requirements.
The growth rates used in forecasting cash flows are at a constant 10%
(2010: 10%).
Other intangible assets
Cost 5 477 –
Rights, owned by CARR Civils Contracting Pty Ltd, an Australian subsidiary, to
source up to 800 000 tons of soil at the rate of AU$1 per ton. The asset is
carried at cost and will be amortised on a systematic basis over the 800 000
tons, as and when the soil is sourced. To date, no soil has been sourced.
Total intangible assets 390 467 293 057
4. INVESTMENTS IN ASSOCIATES
Unlisted
Investment at cost 97 335 104 335
Attributable post-acquisition gains, losses and equity movements (159 217) (62 205)
Loans advanced 462 998 373 643
401 116 415 773
The carrying value of investments in associates is reconciled as follows:
Carrying value at the beginning of the year 415 773 428 502
Changes in shareholding – (25 430)
Share of profits and losses (51 388) (30 386)
Share of comprehensive loss and equity movements (42 734) (32 896)
Dividends received (2 889) (3 022)
Loans advanced 170 271 79 005
Impairment of loans (65 867) –
Fair value adjustments (11 030) –
Transfer to non-current assets held-for-sale (note 5) (11 020) –
Carrying value at the end of the year 401 116 415 773

23FINANCIAL STATEMENTS
4. INVESTMENTS IN ASSOCIATES CONTINUED
Investments in associates include:
COUNTRY OF
INCORPORATION
EFFECTIVE INTEREST INVESTMENTS AT COST LOANS ADVANCED
2011
%
2010
%
2011
R’000
2010
R’000
2011
R’000
2010
R’000
Gigajoule
International
(Pty) Ltd South Africa 26,6 26,6 7 770 7 770 20 384 18 254
Capital Africa
Steel (Pty) Ltd South Africa 50,0 50,0 89 562 89 562 442 612 351 489
Ilembe Airport
Construction
Services (Pty)
Ltd South Africa 28,3 28,3 3 3 2 –
Bunengi Mining
Services (Pty)
Ltd South Africa – 21,3 – 7 000 – 3 900
97 335 104 335 462 998 373 643
The group has elected to dispose of its interest in Bunengi Mining Services (Pty) Ltd and has transferred the asset to non-
current assets held for sale (note 5).
The aggregate assets and liabilities and the aggregate results from operations of associates are summarised as follows:
2011
R’000
2010
R’000
Non-current assets 822 211 904 223
Current assets 658 162 800 524
Total assets 1 480 373 1 704 747
Shareholders’ equity (277 668) (178 010)
Non-current liabilities 1 310 556 1 340 855
Current liabilities 447 485 541 902
Total equity and liabilities 1 480 373 1 704 747
Revenue 1 390 752 3 714 087
Operating loss (15 617) (96 046)
The group's share of profit and losses in associates for the year. (51 388) (30 386)
The loans are unsecured and will not be repaid within the next 12 months in terms of the loan agreements.
The loan with Gigajoule International (Pty) Ltd bears interest at prime.
The loan with Capital Africa Steel (Pty) Ltd bears interest at prime plus 2%.
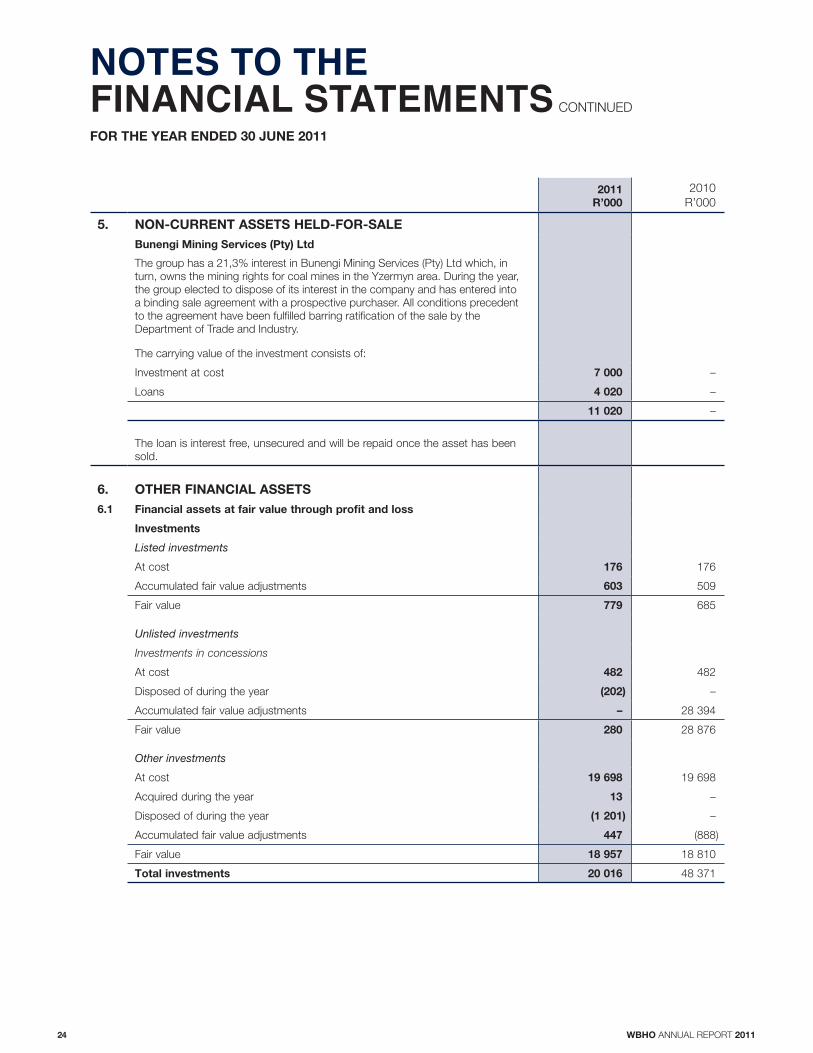
24 WBHO ANNUAL REPORT 2011
NOTES TO THE FINANCIAL STATEMENTS CONTINUED
FOR THE YEAR ENDED 30 JUNE 2011
2011
R’000
2010
R’000
5. NON-CURRENT ASSETS HELD-FOR-SALE
Bunengi Mining Services (Pty) Ltd
The group has a 21,3% interest in Bunengi Mining Services (Pty) Ltd which, in
turn, owns the mining rights for coal mines in the Yzermyn area. During the year,
the group elected to dispose of its interest in the company and has entered into
a binding sale agreement with a prospective purchaser. All conditions precedent
to the agreement have been fulfilled barring ratification of the sale by the
Department of Trade and Industry.
The carrying value of the investment consists of:
Investment at cost 7 000 –
Loans 4 020 –
11 020 –
The loan is interest free, unsecured and will be repaid once the asset has been
sold.
6. OTHER FINANCIAL ASSETS
6.1 Financial assets at fair value through profit and loss
Investments
Listed investments
At cost 176 176
Accumulated fair value adjustments 603 509
Fair value 779 685
Unlisted investments
Investments in concessions
At cost 482 482
Disposed of during the year (202) –
Accumulated fair value adjustments – 28 394
Fair value 280 28 876
Other investments
At cost 19 698 19 698
Acquired during the year 13 –
Disposed of during the year (1 201) –
Accumulated fair value adjustments 447 (888)
Fair value 18 957 18 810
Total investments 20 016 48 371

25FINANCIAL STATEMENTS
2011
R’000
2010
R’000
6. OTHER FINANCIAL ASSETS CONTINUED
6.1 Financial assets classified as fair value through profit and loss continued
A register of listed investments is available for inspection at the registered office of
the group in terms of section 113 of the Companies Act of South Africa.
Investments in concessions
These investments comprise a 2,5% interest in the Department of Trade and
Industry office campus and the group’s 3,6% interest in the Bakwena Plantinum
Corridor Concession Company (Pty) Ltd which was disposed of during the year.
Other investments
These investments consist of investments in Australia and South Africa. The
Australian investments include a 50% interest in a headlease, a 40% interest in
Rhombus Investments and a 100% interest in Monaco Hickey (NZ) Pty Ltd and
Plumber’s Supplies Co-operative Ltd. A 4,8% interest in the Victorian Opportunity
Fund was disposed of during the year. The South African investment is a 2,5%
interest in Savana Property (Pty) Ltd.
6.2 Financial assets carried at amortised cost
Long-term receivables
Secured loans1 Interest-bearing between 10% and 20% – Property development loans 155 755 52 441
Less: Short-term portion (note 9) (54 504) –
2 Interest-bearing at 16% – Concession investment loans 2 594 2 644
3 Interest-free loans to employees for shares 56 223 27 979
4 Less: Short-term portion (note 9) (40 287) –
4 Interest-bearing at prime less 2% – Property development loan 4 155 –
Total long-term receivables 123 936 83 064
1 Property development loans are secured by second mortgage bonds over property and rank
either ahead of the developer or have no fixed terms of repayment.
2 The loan to concession investments is secured through an option to excercise rights in terms
of the preference share terms and has no fixed terms of repayment.
3 Loans to employees are secured by shares received in terms of the share scheme and are
repayable five years from the date of sale of the shares (note 28).
4 The property development loan is secured by a lien and will be repaid at the end of the
contract in July 2012.
Total other financial assets 143 952 131 435
7. INVENTORIES
Consumable stores 45 715 41 320
Properties for development 173 398 211 038
Trading stock 11 200 11 200
230 313 263 558
Properties for development with a carrying value of R170 million (2010: R149 million) are secured by mortgage bonds as
described in notes 13 and 15.

26 WBHO ANNUAL REPORT 2011
NOTES TO THE FINANCIAL STATEMENTS CONTINUED
FOR THE YEAR ENDED 30 JUNE 2011
2011
R’000
2010
R’000
8. CONTRACTS IN PROGRESS
Costs incurred to date 41 377 071 38 556 381
Plus: Profit recognised to date 4 783 043 4 463 383
46 160 114 43 019 764
Less: Work certified to date (46 932 896) (44 915 650)
Net amounts due to customers (772 782) (1 895 886)
Payments received in advance (note 15) 84 918 90 126
Excess billings over work done 1 237 105 2 002 420
Amounts due by customers 549 241 196 660
9. TRADE AND OTHER RECEIVABLES
Contract debtors 2 117 542 2 215 516
Provisions for irrecoverable debts (48 993) (43 789)
Contract retentions 222 864 242 754
Other trade debtors 136 478 –
Dividend receivable 75 007 –
Prepayments 33 149 17 508
Amounts owing by joint venture partners (note 26) 163 340 165 909
Staff debtors 697 1 493
Staff debtors for shares (note 6) 40 287 –
Short-term loans 4 438 10 100
Short-term portion of property development loans (note 6) 54 504 –
Value added taxation 97 737 101 328
Debtor for repayment of purchase consideration on business combination 37 252 –
Other receivables 118 582 96 316
3 052 884 2 807 135
The carrying values of these receivables approximate their fair values due to the
short-term nature of the instruments.
10. DERIVATIVE FINANCIAL INSTRUMENTS
Current assets
Forward exchange contracts – 1 053
Current liabilities
Forward exchange contracts – 1 707
Details in respect of derivative financial instruments and the group’s financial risk policy are set out in note 27.
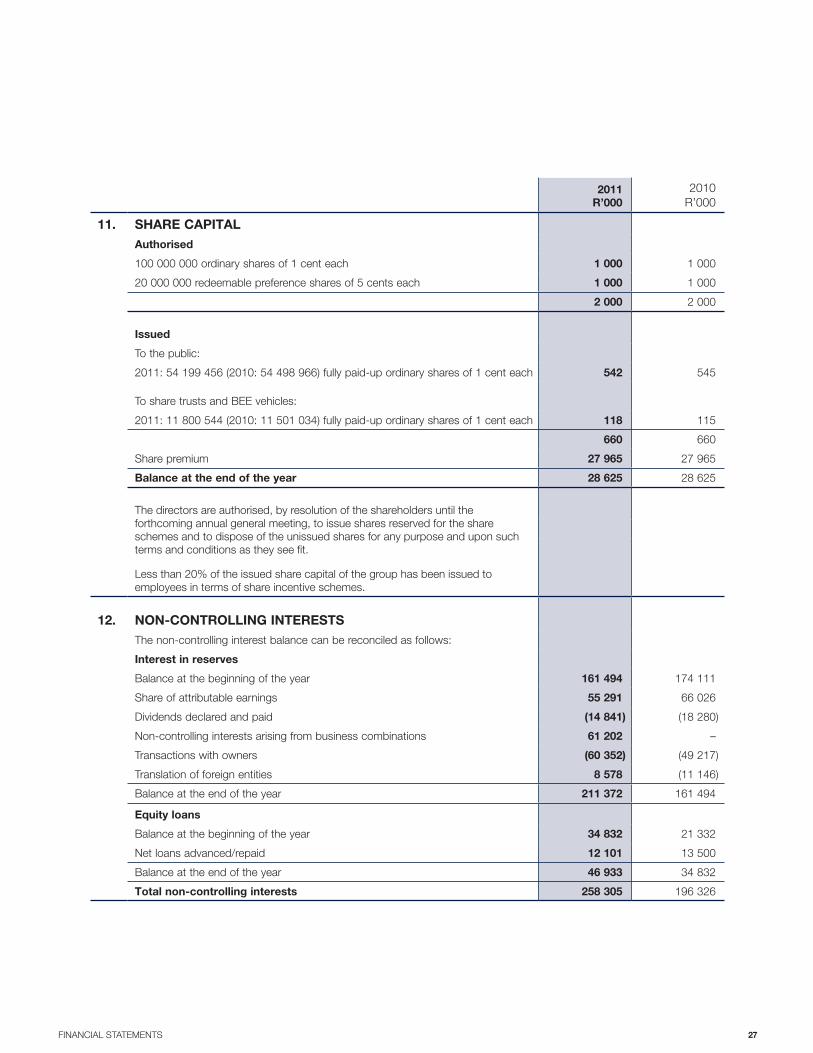
27FINANCIAL STATEMENTS
2011
R’000
2010
R’000
11. SHARE CAPITAL
Authorised
100 000 000 ordinary shares of 1 cent each 1 000 1 000
20 000 000 redeemable preference shares of 5 cents each 1 000 1 000
2 000 2 000
Issued
To the public:
2011: 54 199 456 (2010: 54 498 966) fully paid-up ordinary shares of 1 cent each 542 545
To share trusts and BEE vehicles:
2011: 11 800 544 (2010: 11 501 034) fully paid-up ordinary shares of 1 cent each 118 115
660 660
Share premium 27 965 27 965
Balance at the end of the year 28 625 28 625
The directors are authorised, by resolution of the shareholders until the
forthcoming annual general meeting, to issue shares reserved for the share
schemes and to dispose of the unissued shares for any purpose and upon such
terms and conditions as they see fit.
Less than 20% of the issued share capital of the group has been issued to
employees in terms of share incentive schemes.
12. NON-CONTROLLING INTERESTS
The non-controlling interest balance can be reconciled as follows:
Interest in reserves
Balance at the beginning of the year 161 494 174 111
Share of attributable earnings 55 291 66 026
Dividends declared and paid (14 841) (18 280)
Non-controlling interests arising from business combinations 61 202 –
Transactions with owners (60 352) (49 217)
Translation of foreign entities 8 578 (11 146)
Balance at the end of the year 211 372 161 494
Equity loans
Balance at the beginning of the year 34 832 21 332
Net loans advanced/repaid 12 101 13 500
Balance at the end of the year 46 933 34 832
Total non-controlling interests 258 305 196 326

28 WBHO ANNUAL REPORT 2011
NOTES TO THE FINANCIAL STATEMENTS CONTINUED
FOR THE YEAR ENDED 30 JUNE 2011
2011
R’000
2010
R’000
13. FINANCIAL LIABILITIES AT AMORTISED COST
Interest-bearing borrowings
Secured
– Capitalised finance leases (priced at market-related interest rates linked to
prime) 77 576 36 924
– Property development loan (priced at prime less 1%) 18 424 1 809
96 000 38 733
Less: Current portion of capitalised finance leases (39 870) (24 545)
56 130 14 188
Unsecured
Loans (priced between prime less 0,5% and prime less 2%) 10 280 10 758
Total interest-bearing borrowings 66 410 24 946
Capitalised finance leases are for periods up to 48 months and are secured
by certain plant, vehicles and equipment reflected in note 2. The property
development loan is secured by a mortgage over the land (note 7).
The present value of future minimum payments on capitalised finance lease
agreements is as follows:
Due:
Within 1 year 39 975 26 735
Within 2 – 5 years 42 216 14 587
Total capitalised finance lease obligation 82 191 41 322
Less: Future finance costs (4 615) (4 398)
Present value of finance lease obligations 77 576 36 924
Other financial liabilities
Cash-settled portion of share trust liability (note 28) 24 116 –
Deferred consideration arising from business combinations (due within 12 months) 9 553 –
33 669 –
Current portion of other financial liabilities (9 553) –
Total other financial liabilities 24 116 –
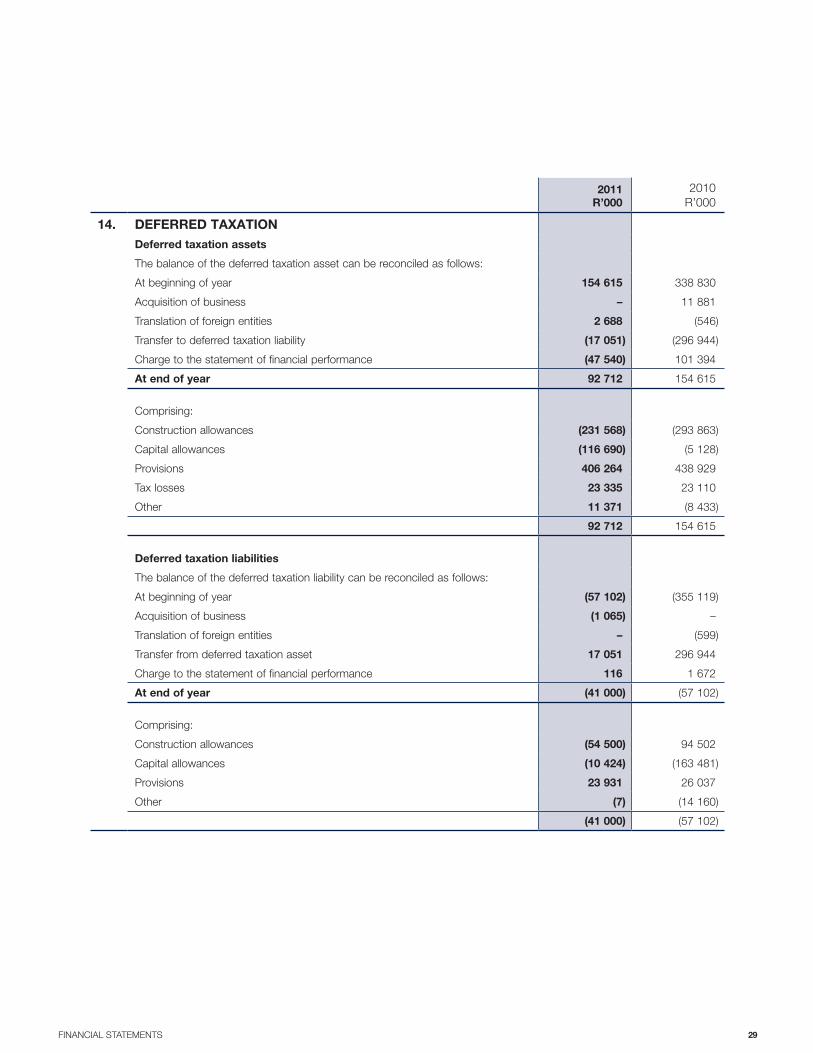
29FINANCIAL STATEMENTS
2011
R’000
2010
R’000
14. DEFERRED TAXATION
Deferred taxation assets
The balance of the deferred taxation asset can be reconciled as follows:
At beginning of year 154 615 338 830
Acquisition of business – 11 881
Translation of foreign entities 2 688 (546)
Transfer to deferred taxation liability (17 051) (296 944)
Charge to the statement of financial performance (47 540) 101 394
At end of year 92 712 154 615
Comprising:
Construction allowances (231 568) (293 863)
Capital allowances (116 690) (5 128)
Provisions 406 264 438 929
Tax losses 23 335 23 110
Other 11 371 (8 433)
92 712 154 615
Deferred taxation liabilities
The balance of the deferred taxation liability can be reconciled as follows:
At beginning of year (57 102) (355 119)
Acquisition of business (1 065) –
Translation of foreign entities – (599)
Transfer from deferred taxation asset 17 051 296 944
Charge to the statement of financial performance 116 1 672
At end of year (41 000) (57 102)
Comprising:
Construction allowances (54 500) 94 502
Capital allowances (10 424) (163 481)
Provisions 23 931 26 037
Other (7) (14 160)
(41 000) (57 102)
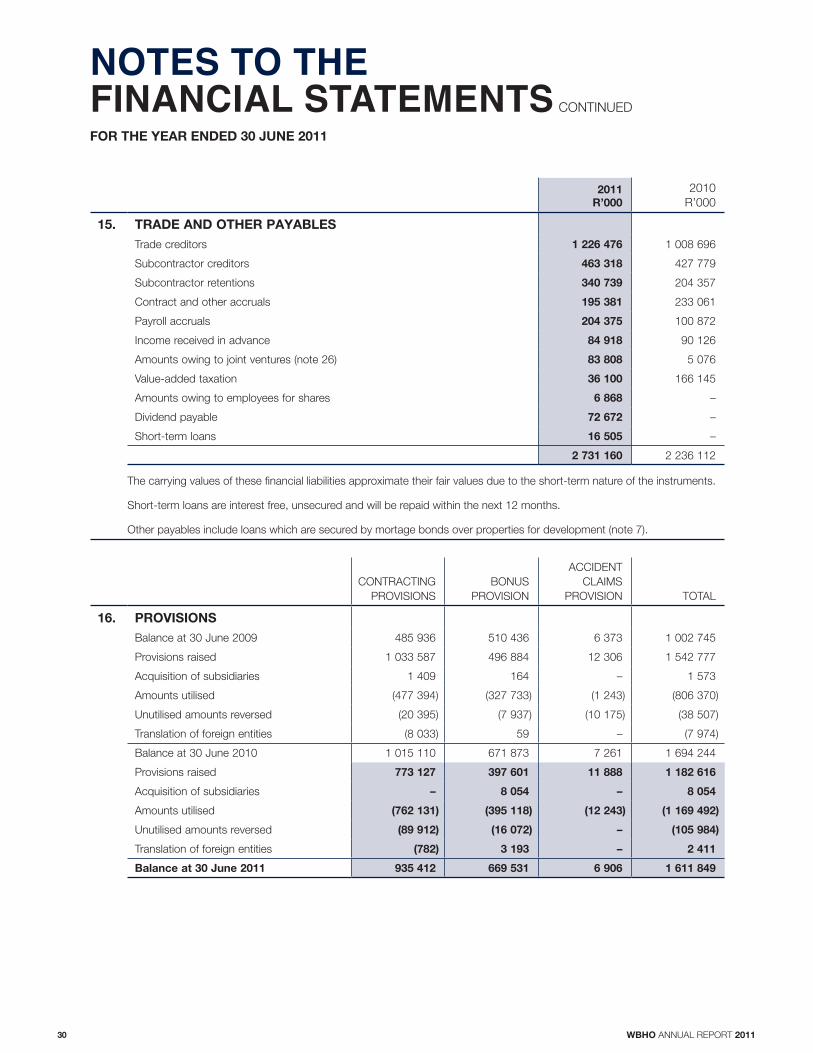
30 WBHO ANNUAL REPORT 2011
NOTES TO THE FINANCIAL STATEMENTS CONTINUED
FOR THE YEAR ENDED 30 JUNE 2011
2011
R’000
2010
R’000
15. TRADE AND OTHER PAYABLES
Trade creditors 1 226 476 1 008 696
Subcontractor creditors 463 318 427 779
Subcontractor retentions 340 739 204 357
Contract and other accruals 195 381 233 061
Payroll accruals 204 375 100 872
Income received in advance 84 918 90 126
Amounts owing to joint ventures (note 26) 83 808 5 076
Value-added taxation 36 100 166 145
Amounts owing to employees for shares 6 868 –
Dividend payable 72 672 –
Short-term loans 16 505 –
2 731 160 2 236 112
The carrying values of these financial liabilities approximate their fair values due to the short-term nature of the instruments.
Short-term loans are interest free, unsecured and will be repaid within the next 12 months.
Other payables include loans which are secured by mortage bonds over properties for development (note 7).
CONTRACTING
PROVISIONS
BONUS
PROVISION
ACCIDENT
CLAIMS
PROVISION TOTAL
16. PROVISIONS
Balance at 30 June 2009 485 936 510 436 6 373 1 002 745
Provisions raised 1 033 587 496 884 12 306 1 542 777
Acquisition of subsidiaries 1 409 164 – 1 573
Amounts utilised (477 394) (327 733) (1 243) (806 370)
Unutilised amounts reversed (20 395) (7 937) (10 175) (38 507)
Translation of foreign entities (8 033) 59 – (7 974)
Balance at 30 June 2010 1 015 110 671 873 7 261 1 694 244
Provisions raised 773 127 397 601 11 888 1 182 616
Acquisition of subsidiaries – 8 054 – 8 054
Amounts utilised (762 131) (395 118) (12 243) (1 169 492)
Unutilised amounts reversed (89 912) (16 072) – (105 984)
Translation of foreign entities (782) 3 193 – 2 411
Balance at 30 June 2011 935 412 669 531 6 906 1 611 849

31FINANCIAL STATEMENTS
2011
R’000
2010
R’000
16. PROVISIONS CONTINUED
Contracting provisions
The balance represents estimated amounts relating to obligations to third parties
at the statement of financial position date including provisions for estimated claims
arising on contracts. The provisions will be utilised as and when investigations into
the claims are finalised and settled.
Bonus provision
The bonus provision arises from a constructive obligation to staff members, where
an annual bonus based on the performance of the group is calculated. The actual
bonus is approved by the board of directors.
Accident claims provision
The balance represents provisions for probable claims relating to past motor
vehicle accidents. The provisions are utilised within twelve months, once
investigations into the claims are expected to be finalised.
The carrying values of these provisions approximate their fair values due to their
short-term nature.
17. REVENUE
Contract revenue 14 702 441 15 102 364
Property revenue 58 886 21 912
Sundry income 5 304 76 819
14 766 631 15 201 095
18. OPERATING PROFIT
Operating profit is arrived at after taking into account the following:
Auditors’ remuneration 12 836 6 903
Audit fees 12 573 6 784
Advisory services 263 119
Irrecoverable debts 10 097 21 157
Irrecoverable debts written off 4 893 13 451
Provision for irrecoverable debts 5 204 7 706
Consulting and technical fees 11 703 17 193
Depreciation (note 2) 208 065 183 985
Aircraft 557 1 339
Buildings 2 942 5 445
Plant, vehicles and equipment 195 524 168 546
Office and computer equipment 9 042 8 655
Employee benefits (note 28) 2 478 594 2 523 763
Net foreign exchange gains/(losses) 2 790 (39 237)
Realised 9 704 (14 524)
Unrealised (6 914) (24 141)
Forward exchange contracts – (572)
Operating lease rentals 10 012 7 712
Land and buildings 9 176 7 712
Plant, vehicles and equipment 836 –
Profit on disposal of property, plant and equipment 2 502 3 702

32 WBHO ANNUAL REPORT 2011
NOTES TO THE FINANCIAL STATEMENTS CONTINUED
FOR THE YEAR ENDED 30 JUNE 2011
2011
R’000
2010
R’000
19. INVESTMENT INCOME
Interest received
– Bank accounts 165 119 227 304
– Unlisted investments 34 202 11 135
– Other 15 745 7 715
Dividends received 9 661 33 351
224 727 279 505
20. FINANCE COSTS
Bank overdrafts 14 636 4 980
Long-term financial liabilities – 2 163
Instalment sale agreements 2 700 4 603
Other 753 5 272
18 089 17 018
21. TAXATION
South African normal tax
Current taxation
– Current year 227 630 483 547
– Prior year under/(over)provision 3 963 (5 145)
Deferred taxation
– Current year (note 14) 54 722 (103 122)
– Prior year under/(over)provision 23 (253)
286 338 375 027
Foreign taxation (including withholding tax)
Current taxation
– Current year 101 085 78 039
– Prior year (over)/underprovision (2 225) 8 579
Deferred taxation
– Current year (note 14) (7 321) (13 891)
– Prior year under/(over)provision – 14 200
91 539 86 927
Secondary tax on companies (STC) 2 123 4 570
Total tax charge 380 000 466 524
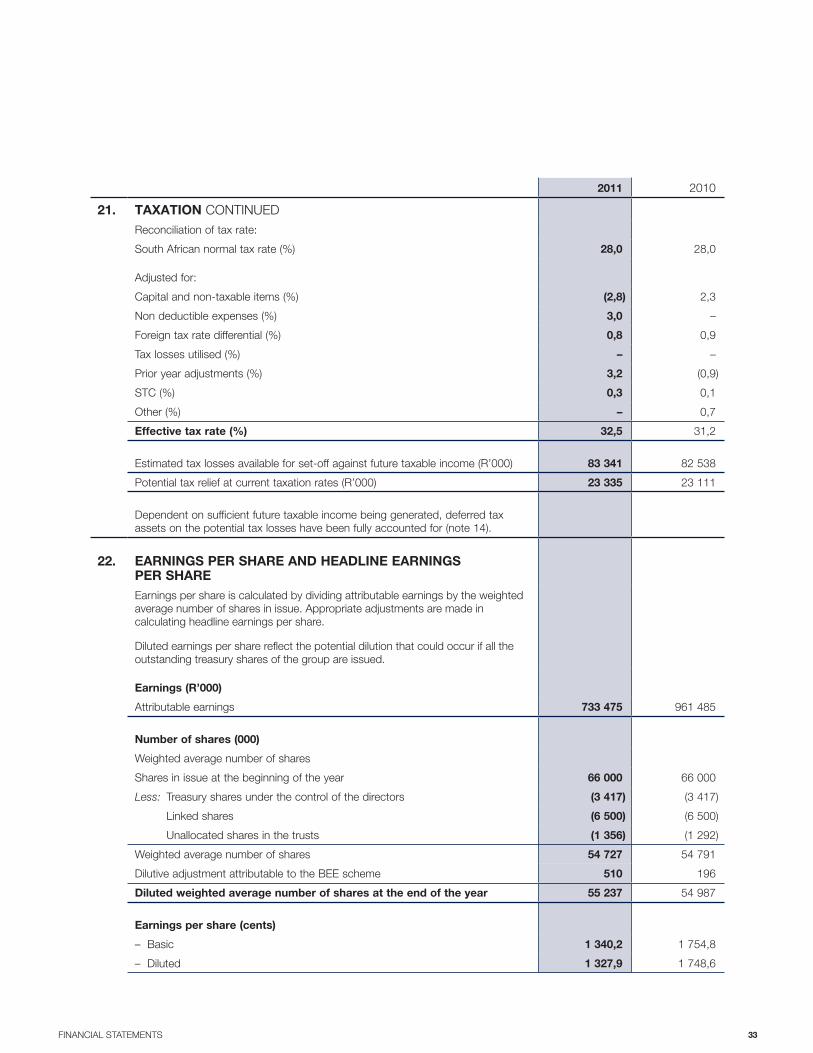
33FINANCIAL STATEMENTS
2011 2010
21. TAXATION CONTINUED
Reconciliation of tax rate:
South African normal tax rate (%) 28,0 28,0
Adjusted for:
Capital and non-taxable items (%) (2,8) 2,3
Non deductible expenses (%) 3,0 –
Foreign tax rate differential (%) 0,8 0,9
Tax losses utilised (%) – –
Prior year adjustments (%) 3,2 (0,9)
STC (%) 0,3 0,1
Other (%) – 0,7
Effective tax rate (%) 32,5 31,2
Estimated tax losses available for set-off against future taxable income (R’000) 83 341 82 538
Potential tax relief at current taxation rates (R’000) 23 335 23 111
Dependent on sufficient future taxable income being generated, deferred tax
assets on the potential tax losses have been fully accounted for (note 14).
22. EARNINGS PER SHARE AND HEADLINE EARNINGS PER SHARE
Earnings per share is calculated by dividing attributable earnings by the weighted
average number of shares in issue. Appropriate adjustments are made in
calculating headline earnings per share.
Diluted earnings per share reflect the potential dilution that could occur if all the
outstanding treasury shares of the group are issued.
Earnings (R’000)
Attributable earnings 733 475 961 485
Number of shares (000)
Weighted average number of shares
Shares in issue at the beginning of the year 66 000 66 000
Less: Treasury shares under the control of the directors (3 417) (3 417)
Linked shares (6 500) (6 500)
Unallocated shares in the trusts (1 356) (1 292)
Weighted average number of shares 54 727 54 791
Dilutive adjustment attributable to the BEE scheme 510 196
Diluted weighted average number of shares at the end of the year 55 237 54 987
Earnings per share (cents)
– Basic 1 340,2 1 754,8
– Diluted 1 327,9 1 748,6

34 WBHO ANNUAL REPORT 2011
NOTES TO THE FINANCIAL STATEMENTS CONTINUED
FOR THE YEAR ENDED 30 JUNE 2011
2011
R’000
2010
R’000
22. EARNINGS PER SHARE AND HEADLINE EARNINGS PER SHARE CONTINUED
Headline earnings
Attributable earnings basis 733 475 961 485
Adjusted for:
Impairment of goodwill/negative goodwill realised 36 266 219
Impairment of loan to associate 65 867
(Profit)/loss on disposal of investment (57 921) 5 682
Profit from the disposal of property, plant and equipment (2 502) (3 703)
Tax effect thereof (412) 1 036
Headline earnings 774 773 964 719
Headline earnings per share (cents)
– Basic 1 415,7 1 760,7
– Diluted 1 402,4 1 754,4
23. GUARANTEES AND CONTINGENT LIABILITIES
Guarantees issued in respect of due performance of contracts by:
Subsidiaries 1 532 744 2 154 544
Associates and joint ventures 1 526 320 1 433 661
Third parties 782 096 711
3 841 160 3 588 916
It is the opinion of the directors that the possibility of any loss is improbable and it
is not anticipated that any material liabilities will arise.
Contingent liabilities
On 1 February 2011, as part of its investigation into the Construction sector, the
Competition Commission published details of a “Fast track settlement process”.
The group submitted a detailed application as part of this process.
The outcome of the Commission’s assessment of the group’s application will
possibly result in an administrative penalty. The quantum of such a penalty cannot
be reliably measured at the financial position date and hence no provision has
been made.
The group is subject to various pending litigations. These are not material in nature
and it is expected that these litigations will be successfully defended. In aggregate,
the total estimated claim amounts to R10 million.
Secondary tax on companies (STC)
Undistributed earnings subject to STC 3 490 336 2 941 749
Tax effect if distributed 317 303 267 432

35FINANCIAL STATEMENTS
2011
R’000
2010
R’000
24. CAPITAL COMMITMENTS
Capital commitments include expenditure relating to property, plant and
equipment for which specific board approval has been obtained.
Authorised and contracted for 181 937 68 441
Authorised but not yet contracted for 254 922 333 142
436 859 401 583
Expenditure on estimated commitments will occur within one year. Capital
commitments will be funded from internal cash resources and existing facilities.
25. COMMITMENTS UNDER OPERATING LEASES
The minimum lease rentals to be paid under non-cancellable leases at 30 June
2011 are as follows:
Buildings
Due within 1 year 10 591 8 466
Due later than 1 year but less than 5 years 15 413 12 414
Greater than 5 years – 775
26 004 21 655
Plant and equipment
Due within 1 year – 780
Due later than 1 year but less than 5 years – 46
– 826
26. RELATED PARTY TRANSACTIONS
26.1 Identification of related parties
The group has a related party relationship with its subsidiaries (annexure 1),
associates (note 4), joint ventures (annexure 2) and directors and executive
officers.
26.2 Related party transactions and balances
During the year, group companies, in the ordinary course of business, entered into
various inter-group sale and purchase transactions.
These transactions are no less favourable than those arranged with third parties.
Transactions and balances between the group companies have, where
appropriate, been eliminated on consolidation and are not disclosed. Details of
transactions and balances with other related parties are set out below.
Amounts owed by related parties
Amounts owed by associate companies are disclosed under (note 4 and note 5). 467 018 373 643
Amounts owed by joint ventures (note 9) 163 340 165 909
The amounts are unsecured, interest free and have no fixed terms of repayment.

36 WBHO ANNUAL REPORT 2011
NOTES TO THE FINANCIAL STATEMENTS CONTINUED
FOR THE YEAR ENDED 30 JUNE 2011
2011
R’000
2010
R’000
26. RELATED PARTY TRANSACTIONS CONTINUED
26.2 Related party transactions and balances continued
Amounts owing to related parties
Amounts owing to joint ventures (note 15) 83 808 5 076
The amounts are unsecured, interest free and have no fixed terms of repayment
Transactions with related parties
Sales and purchase transactions with associated companies 107 781 167 499
Uneliminated portion of sale and purchase transactions with joint ventures 41 845 43 657
Interest and dividends received from related parties 59 608 46 619
209 234 257 775
Directors’ emoluments
DIRECTORS'
FEES
R’000
SALARIES
R’000
INCENTIVE
BONUSES
R’000
RETIREMENT
AND MEDICAL
R’000
OTHER
BENEFITS
R’000
TOTAL
EMOLUMENTS
R’000
2011
Executive
MS Wylie – 802 12 615 409 156 13 982
EL Nel – 968 8 413 298 224 9 903
JW Abbott – 907 4 933 273 251 6 364
JP Botha – 915 8 965 294 189 10 363
– 3 592 34 926 1 274 820 40 612
Non-executive
MW McCulloch 197 – – – – 197
NS Maziya 194 – – – – 194
NS Mjoli-Mncube 203 – – – – 203
NNA Matyumza 264 – – – – 264
JM Ngobeni 288 – – – – 288
1 146 – – – – 1 146
Total 1 146 3 592 34 926 1 274 820 41 758
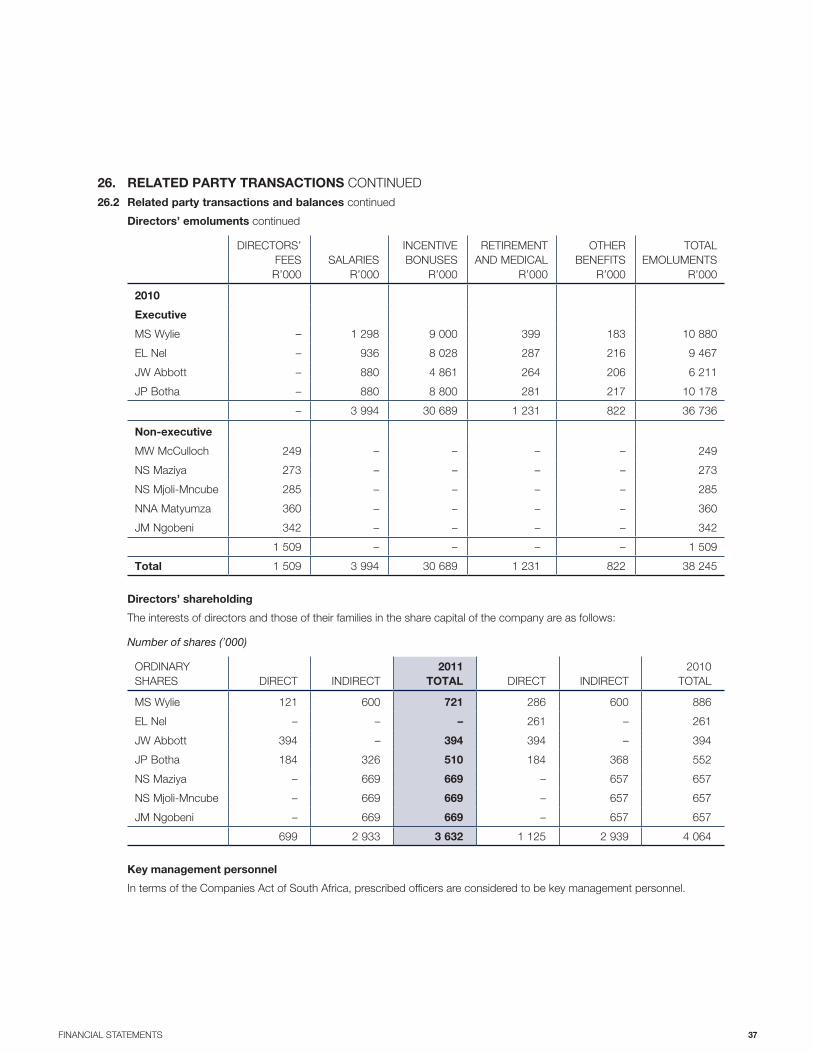
37FINANCIAL STATEMENTS
26. RELATED PARTY TRANSACTIONS CONTINUED
26.2 Related party transactions and balances continued
Directors’ emoluments continued
DIRECTORS’
FEES
R’000
SALARIES
R’000
INCENTIVE
BONUSES
R’000
RETIREMENT
AND MEDICAL
R’000
OTHER
BENEFITS
R’000
TOTAL
EMOLUMENTS
R’000
2010
Executive
MS Wylie – 1 298 9 000 399 183 10 880
EL Nel – 936 8 028 287 216 9 467
JW Abbott – 880 4 861 264 206 6 211
JP Botha – 880 8 800 281 217 10 178
– 3 994 30 689 1 231 822 36 736
Non-executive
MW McCulloch 249 – – – – 249
NS Maziya 273 – – – – 273
NS Mjoli-Mncube 285 – – – – 285
NNA Matyumza 360 – – – – 360
JM Ngobeni 342 – – – – 342
1 509 – – – – 1 509
Total 1 509 3 994 30 689 1 231 822 38 245
Directors’ shareholding
The interests of directors and those of their families in the share capital of the company are as follows:
Number of shares (’000)
ORDINARY
SHARES DIRECT INDIRECT
2011
TOTAL DIRECT INDIRECT
2010
TOTAL
MS Wylie 121 600 721 286 600 886
EL Nel – – – 261 – 261
JW Abbott 394 – 394 394 – 394
JP Botha 184 326 510 184 368 552
NS Maziya – 669 669 – 657 657
NS Mjoli-Mncube – 669 669 – 657 657
JM Ngobeni – 669 669 – 657 657
699 2 933 3 632 1 125 2 939 4 064
Key management personnel
In terms of the Companies Act of South Africa, prescribed officers are considered to be key management personnel.

38 WBHO ANNUAL REPORT 2011
NOTES TO THE FINANCIAL STATEMENTS CONTINUED
FOR THE YEAR ENDED 30 JUNE 2011
26. RELATED PARTY TRANSACTIONS CONTINUED
26.2 Related party transactions and balances continued
Prescribed officers
SALARIES
R’000
INCENTIVE
BONUSES
R’000
RETIREMENT
AND MEDICAL
R’000
OTHER
BENEFITS
R’000
TOTAL
EMOLUMENTS
R’000
2011
Prescribed officer 1 890 4 075 277 197 5 439
Prescribed officer 2 872 7 231 274 189 8 566
Prescribed officer 3 946 1 250 226 338 2 760
Prescribed officer 4 641 281 140 120 1 182
3 349 12 837 917 844 17 947
2010
Prescribed officer 1 868 3 600 269 181 4 918
Prescribed officer 2 828 5 523 261 198 6 810
Prescribed officer 3 76 500 18 63 657
Prescribed officer 4 626 263 135 119 1 143
2 398 9 886 683 561 13 528
Prescribed officers’ shareholding
The interests of prescribed officers and those of their families in the share capital of the company are as follows:
Number of shares (’000)
ORDINARY SHARES DIRECT INDIRECT
2011
TOTAL
2010
TOTAL
Prescribed officer 1 13 564 577 578
Prescribed officer 2 112 – 112 222
Prescribed officer 3 – 100 100 –
Prescribed officer 4 – – – –
125 664 789 800
Other material transactions with directors
Mr MW McCulloch has a 50% interest in Carlmac Holdings (Pty) Ltd, a company which has a 10% interest in Capital Africa
Steel (Pty) Ltd, of which the group is also a shareholder. Mr McCulloch is also a director of Capital Africa Steel (Pty) Ltd.
Ms NS Maziya is a director, and has a 78,7% interest, in Bunengi Mining Services (Pty) Ltd, a company in which the group
holds a 21,3% interest. The asset is currently held-for-sale (note 5).
There were no other transactions with directors or entities in which directors have a material interest.
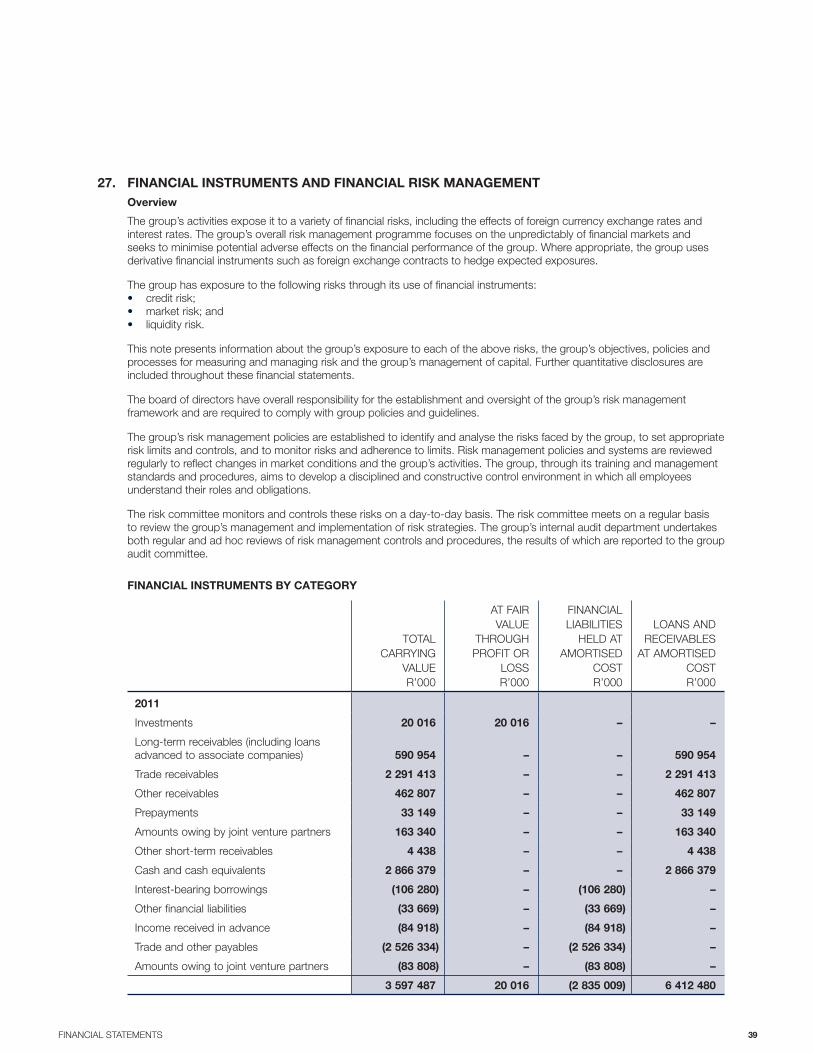
39FINANCIAL STATEMENTS
27. FINANCIAL INSTRUMENTS AND FINANCIAL RISK MANAGEMENT
Overview
The group’s activities expose it to a variety of financial risks, including the effects of foreign currency exchange rates and
interest rates. The group’s overall risk management programme focuses on the unpredictably of financial markets and
seeks to minimise potential adverse effects on the financial performance of the group. Where appropriate, the group uses
derivative financial instruments such as foreign exchange contracts to hedge expected exposures.
The group has exposure to the following risks through its use of financial instruments:
credit risk;
market risk; and
liquidity risk.
This note presents information about the group’s exposure to each of the above risks, the group’s objectives, policies and
processes for measuring and managing risk and the group’s management of capital. Further quantitative disclosures are
included throughout these financial statements.
The board of directors have overall responsibility for the establishment and oversight of the group’s risk management
framework and are required to comply with group policies and guidelines.
The group’s risk management policies are established to identify and analyse the risks faced by the group, to set appropriate
risk limits and controls, and to monitor risks and adherence to limits. Risk management policies and systems are reviewed
regularly to reflect changes in market conditions and the group’s activities. The group, through its training and management
standards and procedures, aims to develop a disciplined and constructive control environment in which all employees
understand their roles and obligations.
The risk committee monitors and controls these risks on a day-to-day basis. The risk committee meets on a regular basis
to review the group’s management and implementation of risk strategies. The group’s internal audit department undertakes
both regular and ad hoc reviews of risk management controls and procedures, the results of which are reported to the group
audit committee.
FINANCIAL INSTRUMENTS BY CATEGORY
TOTAL
CARRYING
VALUE
R’000
AT FAIR
VALUE
THROUGH
PROFIT OR
LOSS
R’000
FINANCIAL
LIABILITIES
HELD AT
AMORTISED
COST
R’000
LOANS AND
RECEIVABLES
AT AMORTISED
COST
R’000
2011
Investments 20 016 20 016 – –
Long-term receivables (including loans
advanced to associate companies) 590 954 – – 590 954
Trade receivables 2 291 413 – – 2 291 413
Other receivables 462 807 – – 462 807
Prepayments 33 149 – – 33 149
Amounts owing by joint venture partners 163 340 – – 163 340
Other short-term receivables 4 438 – – 4 438
Cash and cash equivalents 2 866 379 – – 2 866 379
Interest-bearing borrowings (106 280) – (106 280) –
Other financial liabilities (33 669) – (33 669) –
Income received in advance (84 918) – (84 918) –
Trade and other payables (2 526 334) – (2 526 334) –
Amounts owing to joint venture partners (83 808) – (83 808) –
3 597 487 20 016 (2 835 009) 6 412 480
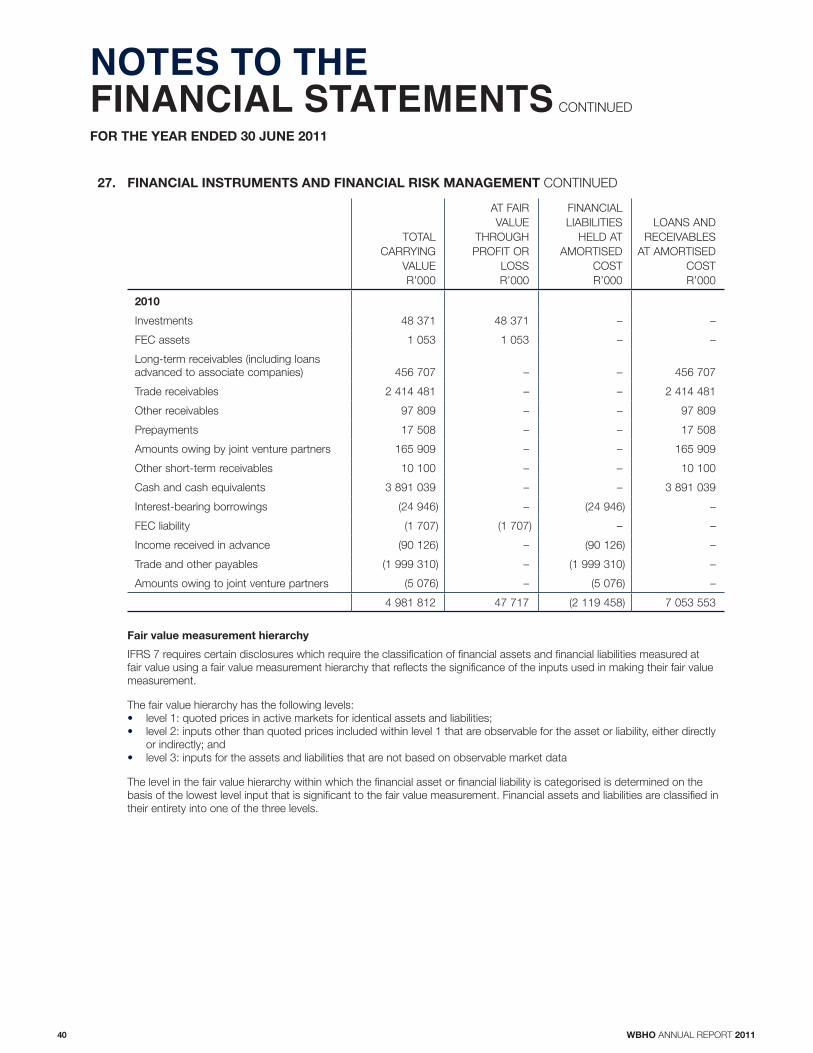
40 WBHO ANNUAL REPORT 2011
NOTES TO THE FINANCIAL STATEMENTS CONTINUED
FOR THE YEAR ENDED 30 JUNE 2011
27. FINANCIAL INSTRUMENTS AND FINANCIAL RISK MANAGEMENT CONTINUED
TOTAL
CARRYING
VALUE
R’000
AT FAIR
VALUE
THROUGH
PROFIT OR
LOSS
R’000
FINANCIAL
LIABILITIES
HELD AT
AMORTISED
COST
R’000
LOANS AND
RECEIVABLES
AT AMORTISED
COST
R’000
2010
Investments 48 371 48 371 – –
FEC assets 1 053 1 053 – –
Long-term receivables (including loans
advanced to associate companies) 456 707 – – 456 707
Trade receivables 2 414 481 – – 2 414 481
Other receivables 97 809 – – 97 809
Prepayments 17 508 – – 17 508
Amounts owing by joint venture partners 165 909 – – 165 909
Other short-term receivables 10 100 – – 10 100
Cash and cash equivalents 3 891 039 – – 3 891 039
Interest-bearing borrowings (24 946) – (24 946) –
FEC liability (1 707) (1 707) – –
Income received in advance (90 126) – (90 126) –
Trade and other payables (1 999 310) – (1 999 310) –
Amounts owing to joint venture partners (5 076) – (5 076) –
4 981 812 47 717 (2 119 458) 7 053 553
Fair value measurement hierarchy
IFRS 7 requires certain disclosures which require the classification of financial assets and financial liabilities measured at
fair value using a fair value measurement hierarchy that reflects the significance of the inputs used in making their fair value
measurement.
The fair value hierarchy has the following levels:
level 1: quoted prices in active markets for identical assets and liabilities;
level 2: inputs other than quoted prices included within level 1 that are observable for the asset or liability, either directly
or indirectly; and
level 3: inputs for the assets and liabilities that are not based on observable market data
The level in the fair value hierarchy within which the financial asset or financial liability is categorised is determined on the
basis of the lowest level input that is significant to the fair value measurement. Financial assets and liabilities are classified in
their entirety into one of the three levels.
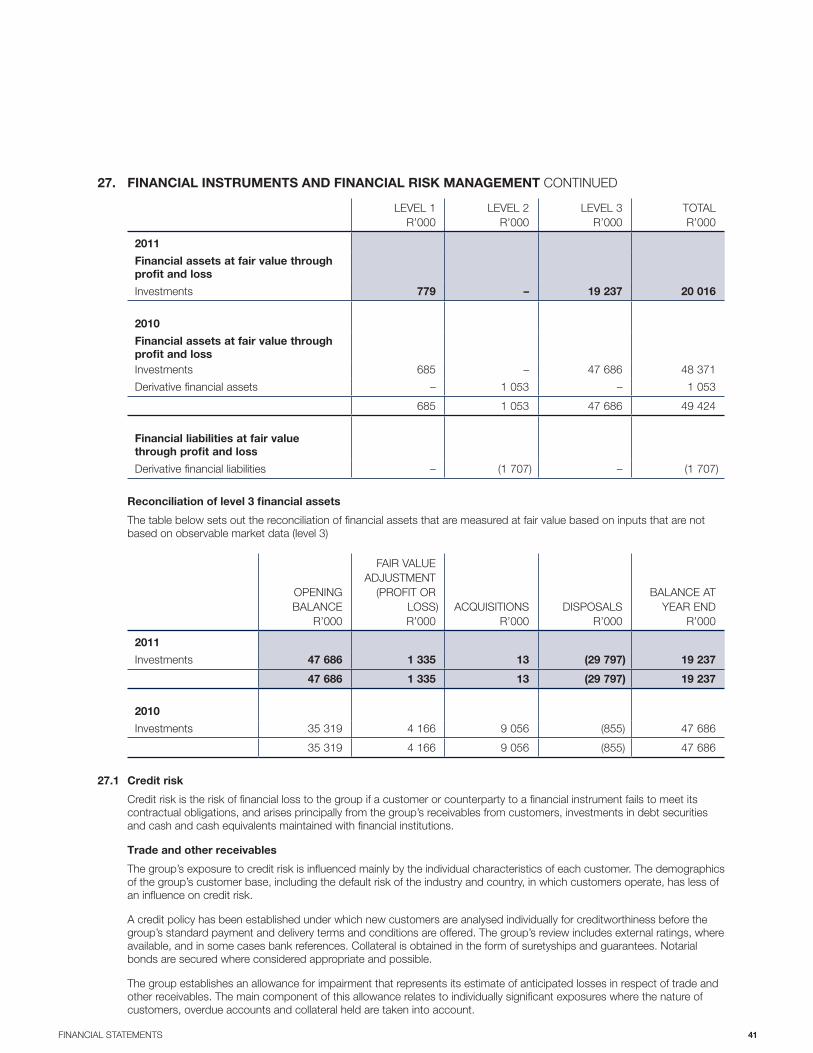
41FINANCIAL STATEMENTS
27. FINANCIAL INSTRUMENTS AND FINANCIAL RISK MANAGEMENT CONTINUED
LEVEL 1
R’000
LEVEL 2
R’000
LEVEL 3
R’000
TOTAL
R’000
2011
Financial assets at fair value through
profit and loss
Investments 779 – 19 237 20 016
2010
Financial assets at fair value through
profit and loss
Investments 685 – 47 686 48 371
Derivative financial assets – 1 053 – 1 053
685 1 053 47 686 49 424
Financial liabilities at fair value
through profit and loss
Derivative financial liabilities – (1 707) – (1 707)
Reconciliation of level 3 financial assets
The table below sets out the reconciliation of financial assets that are measured at fair value based on inputs that are not
based on observable market data (level 3)
OPENING
BALANCE
R’000
FAIR VALUE
ADJUSTMENT
(PROFIT OR
LOSS)
R’000
ACQUISITIONS
R’000
DISPOSALS
R’000
BALANCE AT
YEAR END
R’000
2011
Investments 47 686 1 335 13 (29 797) 19 237
47 686 1 335 13 (29 797) 19 237
2010
Investments 35 319 4 166 9 056 (855) 47 686
35 319 4 166 9 056 (855) 47 686
27.1 Credit risk
Credit risk is the risk of financial loss to the group if a customer or counterparty to a financial instrument fails to meet its
contractual obligations, and arises principally from the group’s receivables from customers, investments in debt securities
and cash and cash equivalents maintained with financial institutions.
Trade and other receivables
The group’s exposure to credit risk is influenced mainly by the individual characteristics of each customer. The demographics
of the group’s customer base, including the default risk of the industry and country, in which customers operate, has less of
an influence on credit risk.
A credit policy has been established under which new customers are analysed individually for creditworthiness before the
group’s standard payment and delivery terms and conditions are offered. The group’s review includes external ratings, where
available, and in some cases bank references. Collateral is obtained in the form of suretyships and guarantees. Notarial
bonds are secured where considered appropriate and possible.
The group establishes an allowance for impairment that represents its estimate of anticipated losses in respect of trade and
other receivables. The main component of this allowance relates to individually significant exposures where the nature of
customers, overdue accounts and collateral held are taken into account.

42 WBHO ANNUAL REPORT 2011
NOTES TO THE FINANCIAL STATEMENTS CONTINUED
FOR THE YEAR ENDED 30 JUNE 2011
27. FINANCIAL INSTRUMENTS AND FINANCIAL RISK MANAGEMENT CONTINUED
27.1 Credit risk continued
Cash and cash equivalents
The group limits its exposure to credit risk by only investing in liquid securities and only with reputable financial institutions.
Past due analysis and allowance for impairment:
CARRYING
AMOUNT
R’000
NOT
PAST DUE
R’000
PAST DUE
1-30 DAYS
R’000
PAST DUE
31-120 DAYS
R’000
PAST DUE
> 120 DAYS
R’000
IMPAIRMENT
ALLOWANCE
R’000
2011
Accounts receivable 2 068 549 1 904 985 71 930 27 397 113 230 (48 993)
Cash and cash
equivalents 2 882 772 2 882 772 – – – –
Forward exchange
contracts at fair value – – – – – –
4 951 321 4 787 757 71 930 27 397 113 230 (48 993)
2010
Accounts receivable 2 171 727 1 859 555 156 779 191 795 7 387 (43 789)
Cash and cash
equivalents 3 891 039 3 891 039 – – – –
Forward exchange
contracts at fair value 1 053 1 053 – – – –
6 063 819 5 751 647 156 779 191 795 7 387 (43 789)
Impairment allowance movement analysis:
ACCOUNTS
RECEIVABLE
R’000
2011
Balance at beginning of the year 43 789
Impairment losses recognised 5 204
Amounts written off –
Balance at end of the year 48 993
2010
Balance at beginning of the year 36 083
Impairment losses recognised/(reversed) 9 927
Amounts written off (2 221)
Balance at end of the year 43 789
The allowance account is used to record the anticipated impairment losses within the group. When management is
satisfied that no recovery of the amount is possible, the amount considered irrecoverable is written off directly to the
statement of comprehensive income.

43FINANCIAL STATEMENTS
27. FINANCIAL INSTRUMENTS AND FINANCIAL RISK MANAGEMENT CONTINUED
27.2 Market risk (Currency risk)
The group’s transactions occur in various foreign currencies and consequently, are exposed to exchange rate fluctuations
that have an impact on cash flows and financing activities. These transactions are predominantly entered into in the
respective functional currencies of the individual operations. The group mitigates this risk by maintaining cash balances
in the various currencies utilised. Some operations are exposed to foreign currency risk in connection with contracted
payments in currencies not in their individual functional currencies. The group manages this risk through the selective use
of forward exchange contracts and cross currency swaps.
Forward exchange contracts are used primarily to reduce foreign currency exposure relating to imports into South Africa.
The group’s exposure to significant currency risk was as follows:
US
DOLLAR
R’000
MOZAMBIQUE
METICALS
R’000
AUSTRALIAN
DOLLAR
R’000
BOTSWANA
PULA
R’000
ZAMBIA
KWACHA
R’000
GHANAIN
CEDI
R’000
MAURITIAN
RUPEE
R’000
2011
Trade and other
receivables 82 031 13 445 1 177 787 109 497 11 369 57 870 (733)
Cash and cash
equivalents 527 240 35 764 882 787 57 528 3 752 7 072 21 021
Trade and other
payables (298 086) (20 473) (1 395 240) (55 114) (4 311) (26 796) (13 945)
Long-term
liabilities – – 41 810 – – – –
311 185 28 736 707 144 111 911 10 810 38 146 6 343
Closing rate 6,80 0,24 7,27 1,03 0,0014 4,49 0,25
Average rate 7,01 0,21 6,91 1,05 0,0015 4,75 0,24
2010
Trade and other
receivables 248 002 14 172 453 952 77 232 16 425 54 411 –
Cash and cash
equivalents 161 779 23 641 857 916 80 644 61 670 9 194 –
Trade and other
payables (216 826) (10 604) (727 044) (52 229) (83 795) (19 836) –
Long-term
liabilities – – (1 508) – – – –
192 955 27 209 583 316 105 647 (5 700) 43 769 –
Closing rate 7,68 0,23 6,53 1,07 0,0014 5,266 –
Average rate 7,59 0,25 6,68 1,11 0,0016 5,410 –
Forward exchange contracts
The group closed out its existing forward exchange contracts during the year and no further contracts have been
entered into.

44 WBHO ANNUAL REPORT 2011
NOTES TO THE FINANCIAL STATEMENTS CONTINUED
FOR THE YEAR ENDED 30 JUNE 2011
27. FINANCIAL INSTRUMENTS AND FINANCIAL RISK MANAGEMENT CONTINUED
27.2 Market risk (Currency risk) continued
The following forward exchange contracts and cross currency swaps were closed out during the year:
FOREIGN
CURRENCY
AMOUNT
FC’000
RAND
EQUIVALENT
AMOUNT
R’000
AVERAGE
RATE OF
EXCHANGE
(CALCULATED)
ACTUAL/
ESTIMATED
FAIR VALUE
GAIN/(LOSS)
R’000
2011
Relating to transactions which have already occurred:
US Dollar 7 435 56 902 7,7 948
Euro 960 10 628 11,1 (1 521)
2010
Relating to transactions which have already occurred:
US Dollar 17 396 154 194 8,9 11 091
Euro 23 036 266 276 11,6 (36 453)
Deutch Kroner 15 180 27 924 1,8 (5 765)
Pound Sterling 112 1 489 13,3 (66)
Related to future commitments
US Dollar 7 435 56 902 7,7 948
Euro 960 10 628 11,1 (1 521)
A 10% strengthening of the Rand against the following currencies at 30 June would have increased or decreased profit by
the amounts shown below. The analysis assumes that all other variables, in particular interest rates, remain constant and is
applied against the gross statement of financial position exposure and forward exchange contracts at statement of financial
position date.
US
DOLLAR
R’000
MOZAMBIQUE
METICALS
R’000
AUSTRALIAN
DOLLAR
R’000
BOTSWANA
PULA
R’000
ZAMBIA
KWACHA
R’000
GHANAIN
CEDI
R’000
MAURITIAN
RUPEE
R’000
2011
Trade and other
receivables 8 203 1 344 117 777 10 949 1 136 5 787 (73)
Cash and cash
equivalents 52 724 3 576 88 278 5 752 375 707 2 102
Trade and other
payables (29 808) (2 047) (139 524) (5 511) (431) (2 679) (1 394)
Long-term
liabilities – – 4 181 – – – –
Forward
exchange
contracts – – – – – – –
Total 31 119 2 873 70 712 11 190 1 080 3 815 635

45FINANCIAL STATEMENTS
27. FINANCIAL INSTRUMENTS AND FINANCIAL RISK MANAGEMENT CONTINUED
27.2 Market risk (Currency risk) continued
US
DOLLAR
R’000
MOZAMBIQUE
METICALS
R’000
AUSTRALIAN
DOLLAR
R’000
BOTSWANA
PULA
R’000
ZAMBIA
KWACHA
R’000
GHANAIN
CEDI
R’000
MAURITIAN
RUPEE
R’000
2010
Trade and other
receivables 24 800 1 417 45 395 7 723 1 614 5 440 –
Cash and cash
equivalents 16 178 2 364 85 792 8 064 6 166 918 –
Trade and other
payables (21 683) (1 060) (72 704) (5 223) (8 378) (1 982) –
Long-term
liabilities – – (151) – – – –
Forward
exchange
contracts 5 690 – – – – – –
Total 24 985 2 721 58 332 10 564 (598) 4 376 –
A 10% weakening of the Rand against the above currencies at 30 June would have had the equal but opposite effect to the
amount shown above, on the basis that all other variables remain constant.
27.3 Market risk (Interest rate risk)
The group has adopted a policy where exposure to interest rate risk is on a floating rate basis linked to market rates on
interest-bearing bank deposits and borrowings, loans advanced and investments.
At the reporting date the interest rate profile of the group’s financial instruments was:
CARRYING
AMOUNT
R’000
INTEREST-
BEARING
LINKED TO
PRIME
R’000
FIXED RATE
R’000
INTEREST
FREE
R’000
2011
Investments 20 016 – – 20 016
Trade and other receivables 2 791 807 – 54 504 2 737 303
Amounts owing by joint venture partners 163 340 – – 163 340
Loans to associate companies 467 018 467 018 – –
Cash and cash equivalents 2 866 379 2 866 379 – –
Long-term receivables 123 936 – 113 618 10 318
Amounts owing to joint venture partners (83 808) – – (83 808)
Interest-bearing borrowings (139 950) (139 950) – –
Trade and other payables (2 695 060) – – (2 695 060)
3 513 678 3 193 447 168 122 152 109
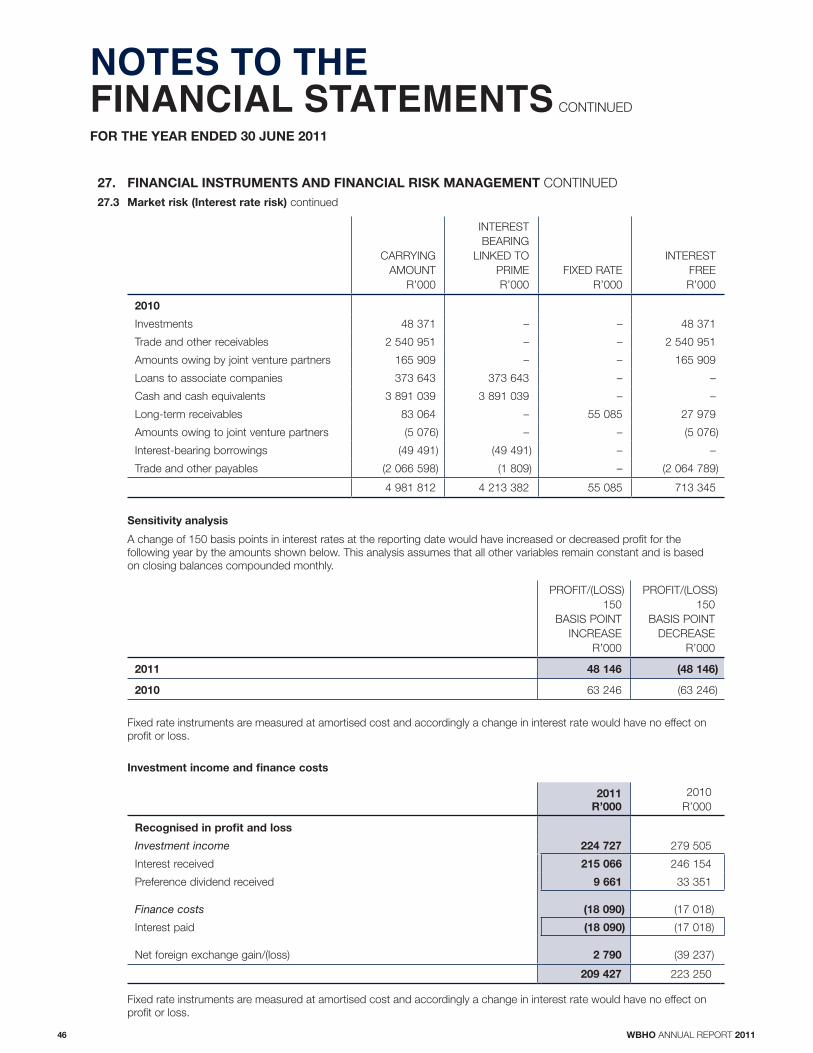
46 WBHO ANNUAL REPORT 2011
NOTES TO THE FINANCIAL STATEMENTS CONTINUED
FOR THE YEAR ENDED 30 JUNE 2011
27. FINANCIAL INSTRUMENTS AND FINANCIAL RISK MANAGEMENT CONTINUED
27.3 Market risk (Interest rate risk) continued
CARRYING
AMOUNT
R’000
INTEREST
BEARING
LINKED TO
PRIME
R’000
FIXED RATE
R’000
INTEREST
FREE
R’000
2010
Investments 48 371 – – 48 371
Trade and other receivables 2 540 951 – – 2 540 951
Amounts owing by joint venture partners 165 909 – – 165 909
Loans to associate companies 373 643 373 643 – –
Cash and cash equivalents 3 891 039 3 891 039 – –
Long-term receivables 83 064 – 55 085 27 979
Amounts owing to joint venture partners (5 076) – – (5 076)
Interest-bearing borrowings (49 491) (49 491) – –
Trade and other payables (2 066 598) (1 809) – (2 064 789)
4 981 812 4 213 382 55 085 713 345
Sensitivity analysis
A change of 150 basis points in interest rates at the reporting date would have increased or decreased profit for the
following year by the amounts shown below. This analysis assumes that all other variables remain constant and is based
on closing balances compounded monthly.
PROFIT/(LOSS)
150
BASIS POINT
INCREASE
R’000
PROFIT/(LOSS)
150
BASIS POINT
DECREASE
R’000
2011 48 146 (48 146)
2010 63 246 (63 246)
Fixed rate instruments are measured at amortised cost and accordingly a change in interest rate would have no effect on
profit or loss.
Investment income and finance costs
2011
R’000
2010
R’000
Recognised in profit and loss
Investment income 224 727 279 505
Interest received 215 066 246 154
Preference dividend received 9 661 33 351
Finance costs (18 090) (17 018)
Interest paid (18 090) (17 018)
Net foreign exchange gain/(loss) 2 790 (39 237)
209 427 223 250
Fixed rate instruments are measured at amortised cost and accordingly a change in interest rate would have no effect on
profit or loss.
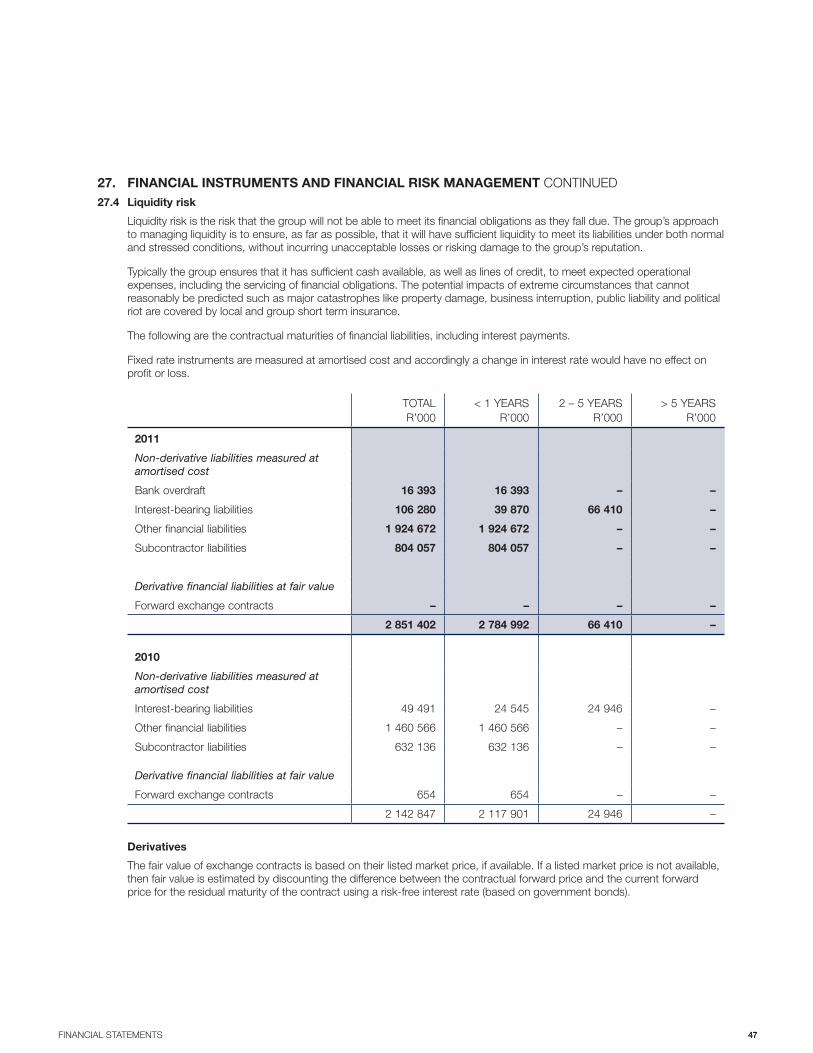
47FINANCIAL STATEMENTS
27. FINANCIAL INSTRUMENTS AND FINANCIAL RISK MANAGEMENT CONTINUED
27.4 Liquidity risk
Liquidity risk is the risk that the group will not be able to meet its financial obligations as they fall due. The group’s approach
to managing liquidity is to ensure, as far as possible, that it will have sufficient liquidity to meet its liabilities under both normal
and stressed conditions, without incurring unacceptable losses or risking damage to the group’s reputation.
Typically the group ensures that it has sufficient cash available, as well as lines of credit, to meet expected operational
expenses, including the servicing of financial obligations. The potential impacts of extreme circumstances that cannot
reasonably be predicted such as major catastrophes like property damage, business interruption, public liability and political
riot are covered by local and group short term insurance.
The following are the contractual maturities of financial liabilities, including interest payments.
Fixed rate instruments are measured at amortised cost and accordingly a change in interest rate would have no effect on
profit or loss.
TOTAL
R’000
< 1 YEARS
R’000
2 – 5 YEARS
R’000
> 5 YEARS
R’000
2011
Non-derivative liabilities measured at amortised cost
Bank overdraft 16 393 16 393 – –
Interest-bearing liabilities 106 280 39 870 66 410 –
Other financial liabilities 1 924 672 1 924 672 – –
Subcontractor liabilities 804 057 804 057 – –
Derivative financial liabilities at fair value
Forward exchange contracts – – – –
2 851 402 2 784 992 66 410 –
2010
Non-derivative liabilities measured at amortised cost
Interest-bearing liabilities 49 491 24 545 24 946 –
Other financial liabilities 1 460 566 1 460 566 – –
Subcontractor liabilities 632 136 632 136 – –
Derivative financial liabilities at fair value
Forward exchange contracts 654 654 – –
2 142 847 2 117 901 24 946 –
Derivatives
The fair value of exchange contracts is based on their listed market price, if available. If a listed market price is not available,
then fair value is estimated by discounting the difference between the contractual forward price and the current forward
price for the residual maturity of the contract using a risk-free interest rate (based on government bonds).

48 WBHO ANNUAL REPORT 2011
NOTES TO THE FINANCIAL STATEMENTS CONTINUED
FOR THE YEAR ENDED 30 JUNE 2011
2011
R’000
2010
R’000
27. FINANCIAL INSTRUMENTS AND FINANCIAL RISK MANAGEMENT CONTINUED
27.4 Capital risk management
To provide returns for shareholders and benefits for other stakeholders and to
maintain optimal structure to reduce the cost of capital, the group policy maintains
an adequate capital base.
Capital comprises shareholders’ equity, including capital and reserves. In order
to maintain or adjust the capital structure, the group may adjust the amount of
dividends paid to shareholders, return capital to shareholders, issue new shares
or sell assets to reduce debt.
The level of dividends paid by the group is determined with reference to the liquidity
and solvency of the group as well as consideration of budgets and forecasts.
The group monitors capital on the basis of a gearing ratio. This ratio is calculated
as net debt divided by total capital. Net debt is calculated as total interest-bearing
borrowings less cash and cash equivalents.
Total interest-bearing borrowings including overdrafts (122 673) (49 491)
Cash on hand 2 882 772 3 891 039
Net debt 2 760 099 3 841 548
Total equity 3 371 904 3 057 769
Debt/equity ratio N/A N/A
There were no changes in the group’s approach to capital management during
the year. The group is not subject to any externally imposed capital requirements.
28. EMPLOYEE BENEFITS
28.1 Staff costs
Wages and salaries 2 273 885 2 414 099
Pension cost – defined benefit fund 759 935
Provident cost – defined contribution funds 119 108 72 901
Medical aid 18 143 14 440
Other contributions 66 699 21 388
2 478 594 2 523 763
28.2 Defined benefit fund
Present value of obligation 41 274 41 513
Fair value of fund assets (42 616) (39 544)
Funded status (1 342) 1 969
Net unrecognised actuarial loss 1 342 (1 969)
Liability recognised – –
Defined benefit obligationOpening balance 41 513 37 868
Service cost 577 553
Interest cost 3 788 3 552
Members’ contributions 167 205
Actuarial loss 1 821 2 207
Benefits paid (6 542) (2 779)
Risk premiums (50) (93)
Closing balance 41 274 41 513
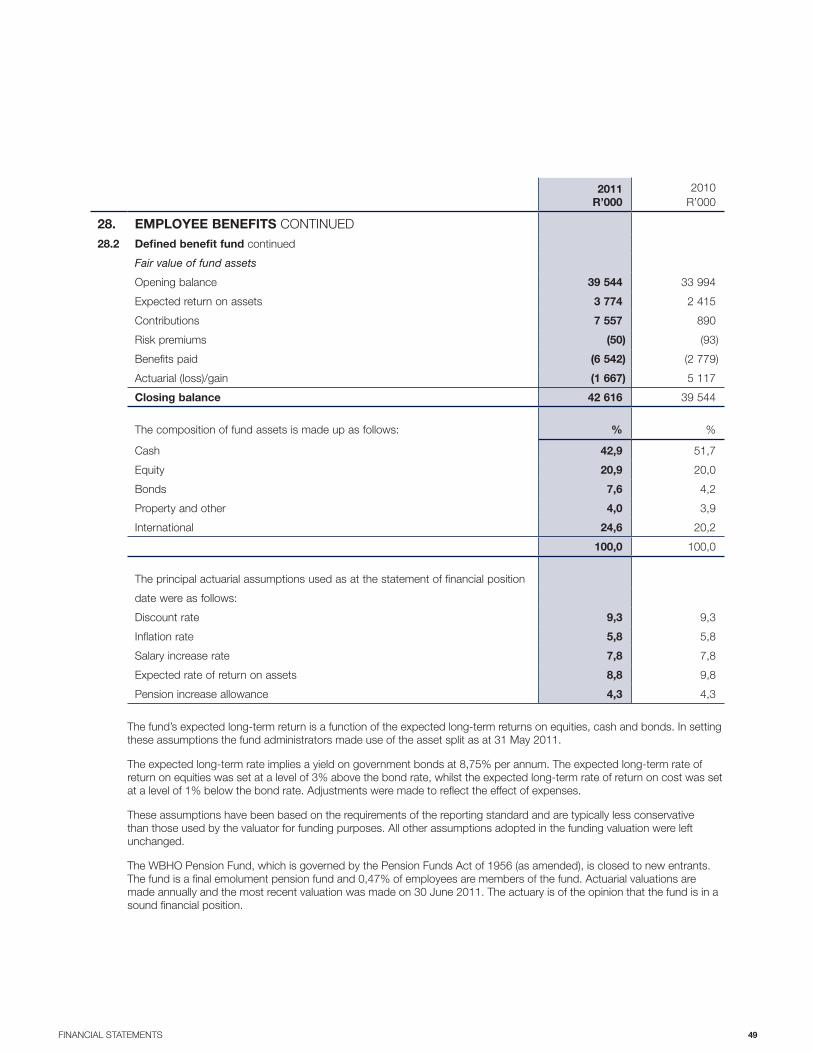
49FINANCIAL STATEMENTS
2011
R’000
2010
R’000
28. EMPLOYEE BENEFITS CONTINUED
28.2 Defined benefit fund continued
Fair value of fund assets
Opening balance 39 544 33 994
Expected return on assets 3 774 2 415
Contributions 7 557 890
Risk premiums (50) (93)
Benefits paid (6 542) (2 779)
Actuarial (loss)/gain (1 667) 5 117
Closing balance 42 616 39 544
The composition of fund assets is made up as follows: % %
Cash 42,9 51,7
Equity 20,9 20,0
Bonds 7,6 4,2
Property and other 4,0 3,9
International 24,6 20,2
100,0 100,0
The principal actuarial assumptions used as at the statement of financial position
date were as follows:
Discount rate 9,3 9,3
Inflation rate 5,8 5,8
Salary increase rate 7,8 7,8
Expected rate of return on assets 8,8 9,8
Pension increase allowance 4,3 4,3
The fund’s expected long-term return is a function of the expected long-term returns on equities, cash and bonds. In setting
these assumptions the fund administrators made use of the asset split as at 31 May 2011.
The expected long-term rate implies a yield on government bonds at 8,75% per annum. The expected long-term rate of
return on equities was set at a level of 3% above the bond rate, whilst the expected long-term rate of return on cost was set
at a level of 1% below the bond rate. Adjustments were made to reflect the effect of expenses.
These assumptions have been based on the requirements of the reporting standard and are typically less conservative
than those used by the valuator for funding purposes. All other assumptions adopted in the funding valuation were left
unchanged.
The WBHO Pension Fund, which is governed by the Pension Funds Act of 1956 (as amended), is closed to new entrants.
The fund is a final emolument pension fund and 0,47% of employees are members of the fund. Actuarial valuations are
made annually and the most recent valuation was made on 30 June 2011. The actuary is of the opinion that the fund is in a
sound financial position.
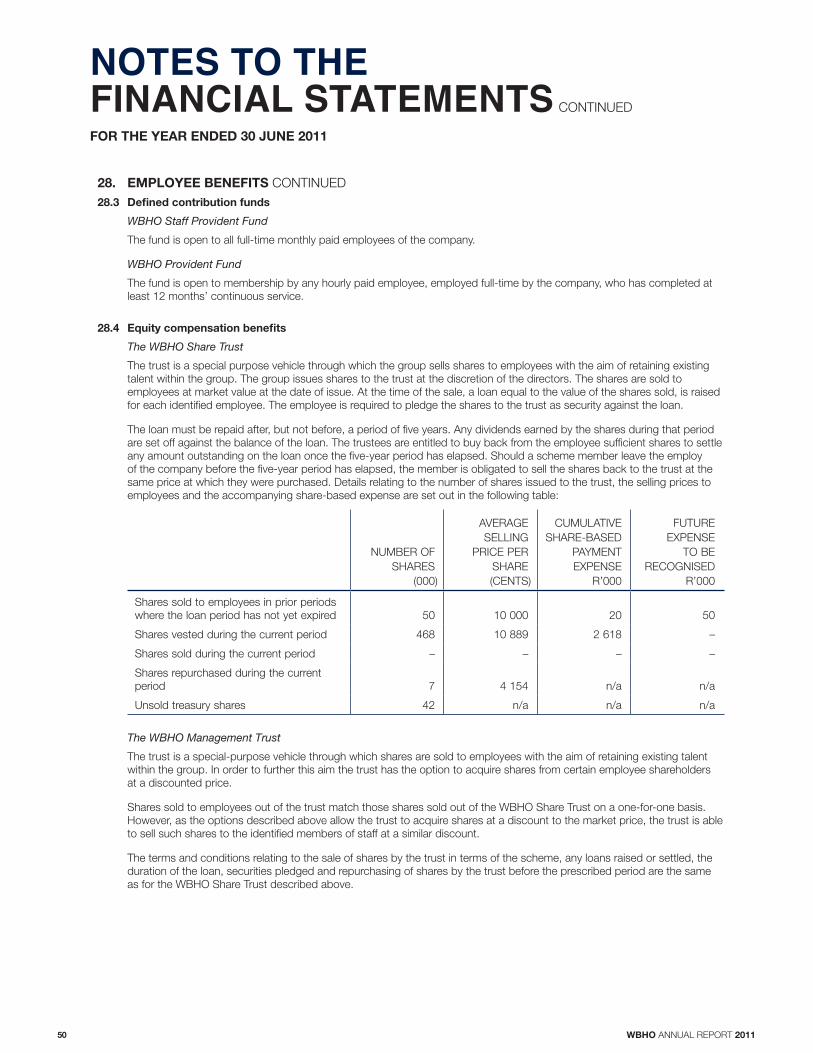
50 WBHO ANNUAL REPORT 2011
NOTES TO THE FINANCIAL STATEMENTS CONTINUED
FOR THE YEAR ENDED 30 JUNE 2011
28. EMPLOYEE BENEFITS CONTINUED
28.3 Defined contribution funds
WBHO Staff Provident Fund
The fund is open to all full-time monthly paid employees of the company.
WBHO Provident Fund
The fund is open to membership by any hourly paid employee, employed full-time by the company, who has completed at
least 12 months’ continuous service.
28.4 Equity compensation benefits
The WBHO Share Trust
The trust is a special purpose vehicle through which the group sells shares to employees with the aim of retaining existing
talent within the group. The group issues shares to the trust at the discretion of the directors. The shares are sold to
employees at market value at the date of issue. At the time of the sale, a loan equal to the value of the shares sold, is raised
for each identified employee. The employee is required to pledge the shares to the trust as security against the loan.
The loan must be repaid after, but not before, a period of five years. Any dividends earned by the shares during that period
are set off against the balance of the loan. The trustees are entitled to buy back from the employee sufficient shares to settle
any amount outstanding on the loan once the five-year period has elapsed. Should a scheme member leave the employ
of the company before the five-year period has elapsed, the member is obligated to sell the shares back to the trust at the
same price at which they were purchased. Details relating to the number of shares issued to the trust, the selling prices to
employees and the accompanying share-based expense are set out in the following table:
NUMBER OF
SHARES
(000)
AVERAGE
SELLING
PRICE PER
SHARE
(CENTS)
CUMULATIVE
SHARE-BASED
PAYMENT
EXPENSE
R’000
FUTURE
EXPENSE
TO BE
RECOGNISED
R’000
Shares sold to employees in prior periods
where the loan period has not yet expired 50 10 000 20 50
Shares vested during the current period 468 10 889 2 618 –
Shares sold during the current period – – – –
Shares repurchased during the current
period 7 4 154 n/a n/a
Unsold treasury shares 42 n/a n/a n/a
The WBHO Management Trust
The trust is a special-purpose vehicle through which shares are sold to employees with the aim of retaining existing talent
within the group. In order to further this aim the trust has the option to acquire shares from certain employee shareholders
at a discounted price.
Shares sold to employees out of the trust match those shares sold out of the WBHO Share Trust on a one-for-one basis.
However, as the options described above allow the trust to acquire shares at a discount to the market price, the trust is able
to sell such shares to the identified members of staff at a similar discount.
The terms and conditions relating to the sale of shares by the trust in terms of the scheme, any loans raised or settled, the
duration of the loan, securities pledged and repurchasing of shares by the trust before the prescribed period are the same
as for the WBHO Share Trust described above.

51FINANCIAL STATEMENTS
28. EMPLOYEE BENEFITS CONTINUED
28.4 Equity compensation benefits continued
The WBHO Management Trust
Details relating to the number of shares purchased and sold by the trust, the respective share prices, and the accompanying
share base payment expense are set out in the following table.
NUMBER OF
SHARES
(000)
AVERAGE
SELLING
PRICE
(CENTS)
CUMULATIVE
SHARE-BASED
PAYMENT
EXPENSE
R’000
FUTURE
EXPENSE
TO BE
RECOGNISED
R’000
Shares sold to employees in prior periods
where the loan period has not yet expired 50 5 000 728 1 842
Shares vested during the current period 468 10 889 18 472 –
Options exercised in the current period – – – –
Shares sold during the current period – – – –
Shares repurchased during the current
period 7 2 089 – –
Unallocated share stock 1 314 n/a n/a n/a
Akani Investment Holdings (Pty) Ltd and the Broad-Based Employee Share Incentive Trust
The company and trust are special purpose vehicles created to give effect to the group’s black economic empowerment
initiative, aimed to source strategic black partners and reward black employees who have been in the service of the group
for more than five years.
Akani Investment Holdings (Pty) Ltd (Akani) has been incorporated and will have as its main business and object the
subscription for and holding of Wilson Bayly Holmes-Ovcon Limited (WBHO) shares. The shareholders of Akani at the
issue date comprise the Broad-Based Employee Share Incentive Trust (BBE Trust), three black partners and WBHO.
On 16 October 2006, WBHO issued shares to Akani and Akani issued an equal number of shares to the shareholders,
the effect being that each Akani share held by the shareholders is linked to one WBHO share (linked shares).
Black partners:
The black partners subscribed for the Akani shares at par value, in cash on the issue date. In terms of the BEE agreement,
the black partners may not dispose of the Akani shares held by them for a period of 10 years from the issue date (the lock-
up period).
The last day of the lock-up period is determined to be the date of repurchase. On the date of repurchase, WBHO will
purchase from Akani (with Akani immediately repurchasing an equal number of Akani shares from the relevant black
partners) so many of the WBHO shares, at their par value, based on the repurchase formula. The repurchase formula is
calculated as follows:
A = [(B+D)/C] x E
Where:
A = number of WBHO shares to be repurchased
B = notional initial amount being the 15 trading days VWAP (volume weighted average price) of a WBHO share for the period
preceding the issue date
C = market value of a WBHO share on the date of repurchase
D = an amount determined by applying the hurdle rate to the notional initial amount less the subscription price paid for the
subscription share for the period from the issue date until the date of repurchase
E = original number of WBHO shares subscribed for by the black partner in question
The hurdle rate is defined as being the nominal annual growth rate of 8,33% compounded annually.
In terms of the BEE agreement a reinvestment obligation is imposed on the black partners whereby they are obliged to
utilise two-thirds of the proceeds from all cash distributions received during the lock-up period for the subscription for
shares in Akani to purchase WBHO shares on the open market. Any shares acquired by the black partners arising from the
reinvestment obligation will also be subject to the lock-up period and two-thirds of any distributions received will be subject
to the reinvestment obligation.
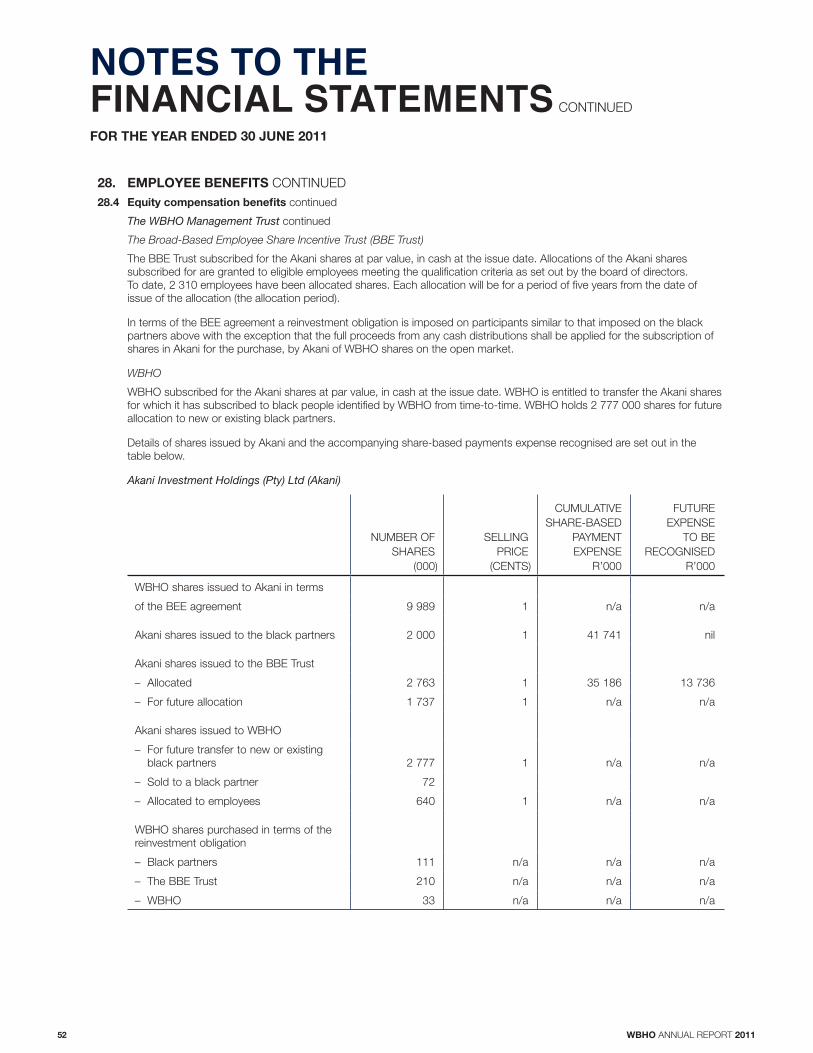
52 WBHO ANNUAL REPORT 2011
NOTES TO THE FINANCIAL STATEMENTS CONTINUED
FOR THE YEAR ENDED 30 JUNE 2011
28. EMPLOYEE BENEFITS CONTINUED
28.4 Equity compensation benefits continued
The WBHO Management Trust continued
The Broad-Based Employee Share Incentive Trust (BBE Trust)
The BBE Trust subscribed for the Akani shares at par value, in cash at the issue date. Allocations of the Akani shares
subscribed for are granted to eligible employees meeting the qualification criteria as set out by the board of directors.
To date, 2 310 employees have been allocated shares. Each allocation will be for a period of five years from the date of
issue of the allocation (the allocation period).
In terms of the BEE agreement a reinvestment obligation is imposed on participants similar to that imposed on the black
partners above with the exception that the full proceeds from any cash distributions shall be applied for the subscription of
shares in Akani for the purchase, by Akani of WBHO shares on the open market.
WBHO
WBHO subscribed for the Akani shares at par value, in cash at the issue date. WBHO is entitled to transfer the Akani shares
for which it has subscribed to black people identified by WBHO from time-to-time. WBHO holds 2 777 000 shares for future
allocation to new or existing black partners.
Details of shares issued by Akani and the accompanying share-based payments expense recognised are set out in the
table below.
Akani Investment Holdings (Pty) Ltd (Akani)
NUMBER OF
SHARES
(000)
SELLING
PRICE
(CENTS)
CUMULATIVE
SHARE-BASED
PAYMENT
EXPENSE
R’000
FUTURE
EXPENSE
TO BE
RECOGNISED
R’000
WBHO shares issued to Akani in terms
of the BEE agreement 9 989 1 n/a n/a
Akani shares issued to the black partners 2 000 1 41 741 nil
Akani shares issued to the BBE Trust
– Allocated 2 763 1 35 186 13 736
– For future allocation 1 737 1 n/a n/a
Akani shares issued to WBHO
– For future transfer to new or existing
black partners 2 777 1 n/a n/a
– Sold to a black partner 72
– Allocated to employees 640 1 n/a n/a
WBHO shares purchased in terms of the
reinvestment obligation
– Black partners 111 n/a n/a n/a
– The BBE Trust 210 n/a n/a n/a
– WBHO 33 n/a n/a n/a

53FINANCIAL STATEMENTS
28. EMPLOYEE BENEFITS CONTINUED
28.4 Equity compensation benefits continued
Akani Investment Holdings (Pty) Ltd (Akani) continued
In calculating the share-based payments expense applicable to the black partners and the BBE trust it was necessary to
estimate the number of shares that could vest at the end of the lock-up period and allocation period respectively. The
following assumptions and judgements were used in arriving at the estimate:
BBE TRUST
BLACK
PARTNERS
Hurdle rate (%) 8,3 8,3
Weighted average expected volatility (%) 24,0 24,0
Weighted average dividend yield (%) 2,7 2,7
Weighted average risk-free interest rate (%) 8,8 8,8
Vesting period (years) 5,0 10,0
28.5 Cash-settled compensation benefits
Edwin Construction Employee Share Incentive Trust (Edwin Trust)
The trust is a special purpose vehicle through which Edwin Construction (Pty) Ltd aims to retain existing talent within
the company. The company issues Edwin Construction shares to the trust at the discretion of the directors. The shares
are allocated to employees in the form of units at market value at the date of issue. A loan equal to the value of the units
acquired, is raised for each identified employee and the units may not be disposed of prior to the five-year vesting period
without the explicit approval of the trustees. The employee is required to pledge the units to the trust as security for the loan.
Any dividends earned by the units during that period are set off against the balance of the loan. The loan must be repaid
no later than the date on which the employee disposes of all his units. Should a scheme member leave the employ of the
company during the five-year vesting period, the member has an obligation to offer the units back to the trust at either the
deemed value or the higher of R1 and the outstanding balance of the loan. Should the employee leave the company after
the five-year vesting period, the member has an obligation to offer the units back to the trust at either the deemed value or
the higher of the original cost and 50% of the deemed value. The deemed value is calculated as the higher of five times the
profit after tax or the tangible net asset value as disclosed in the company’s most recent annual financial statements.
Details relating to the number of shares issued to the trust, the selling price to employees and the accompanying share-
based expense are set out in the following table:
NUMBER OF
UNITS
(000)
SELLING
PRICE
(CENTS)
CUMULATIVE
SHARE-BASED
PAYMENTS
EXPENSE
R’000
Edwin Construction shares issued to the trust in terms of the
BEE agreement 600 n/a n/a
Units issued 333 1512 19 080
Units remaining to be issued 267 n/a n/a
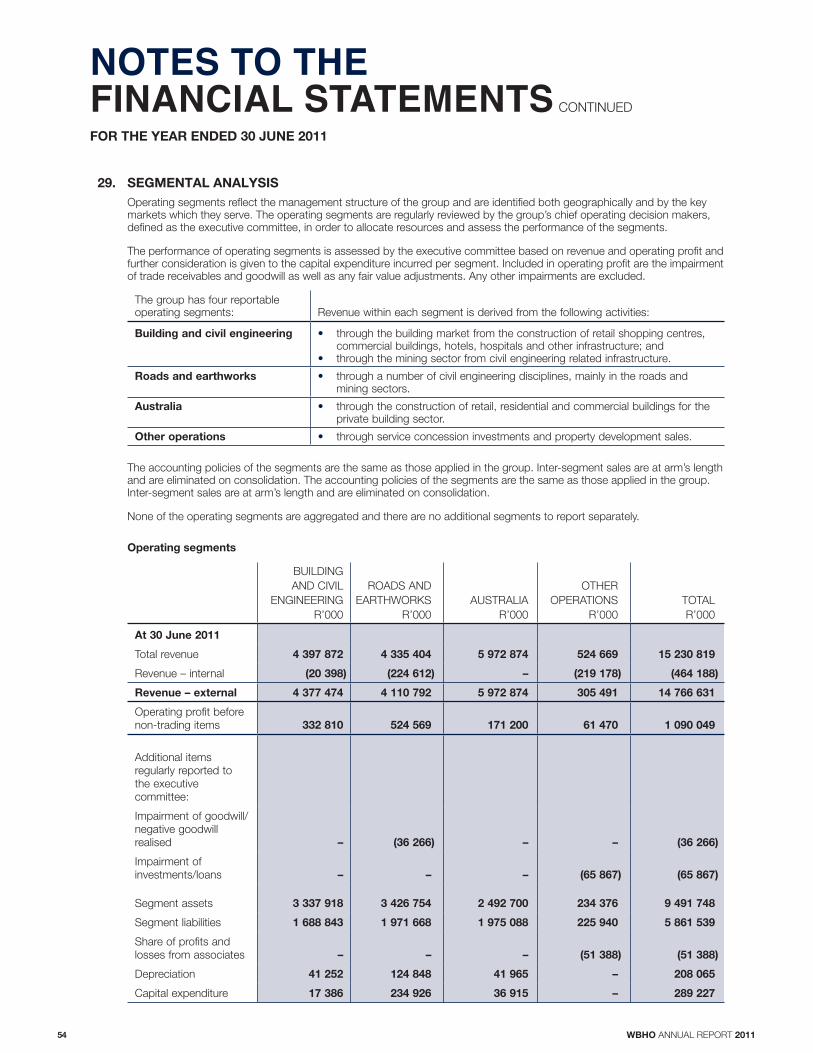
54 WBHO ANNUAL REPORT 2011
FOR THE YEAR ENDED 30 JUNE 2011
NOTES TO THE FINANCIAL STATEMENTS CONTINUED
29. SEGMENTAL ANALYSIS
Operating segments reflect the management structure of the group and are identified both geographically and by the key markets which they serve. The operating segments are regularly reviewed by the group’s chief operating decision makers, defined as the executive committee, in order to allocate resources and assess the performance of the segments.
The performance of operating segments is assessed by the executive committee based on revenue and operating profit and further consideration is given to the capital expenditure incurred per segment. Included in operating profit are the impairment of trade receivables and goodwill as well as any fair value adjustments. Any other impairments are excluded.
The group has four reportable operating segments: Revenue within each segment is derived from the following activities:
Building and civil engineering through the building market from the construction of retail shopping centres, commercial buildings, hotels, hospitals and other infrastructure; and
through the mining sector from civil engineering related infrastructure.
Roads and earthworks through a number of civil engineering disciplines, mainly in the roads and mining sectors.
Australia through the construction of retail, residential and commercial buildings for the private building sector.
Other operations through service concession investments and property development sales.
The accounting policies of the segments are the same as those applied in the group. Inter-segment sales are at arm’s length and are eliminated on consolidation. The accounting policies of the segments are the same as those applied in the group. Inter-segment sales are at arm’s length and are eliminated on consolidation.
None of the operating segments are aggregated and there are no additional segments to report separately.
Operating segments
BUILDING
AND CIVIL
ENGINEERING
R’000
ROADS AND
EARTHWORKS
R’000
AUSTRALIA
R’000
OTHER
OPERATIONS
R’000
TOTAL
R’000
At 30 June 2011
Total revenue 4 397 872 4 335 404 5 972 874 524 669 15 230 819
Revenue – internal (20 398) (224 612) – (219 178) (464 188)
Revenue – external 4 377 474 4 110 792 5 972 874 305 491 14 766 631
Operating profit before
non-trading items 332 810 524 569 171 200 61 470 1 090 049
Additional items
regularly reported to
the executive
committee:
Impairment of goodwill/
negative goodwill
realised – (36 266) – – (36 266)
Impairment of
investments/loans – – – (65 867) (65 867)
Segment assets 3 337 918 3 426 754 2 492 700 234 376 9 491 748
Segment liabilities 1 688 843 1 971 668 1 975 088 225 940 5 861 539
Share of profits and
losses from associates – – – (51 388) (51 388)
Depreciation 41 252 124 848 41 965 – 208 065
Capital expenditure 17 386 234 926 36 915 – 289 227
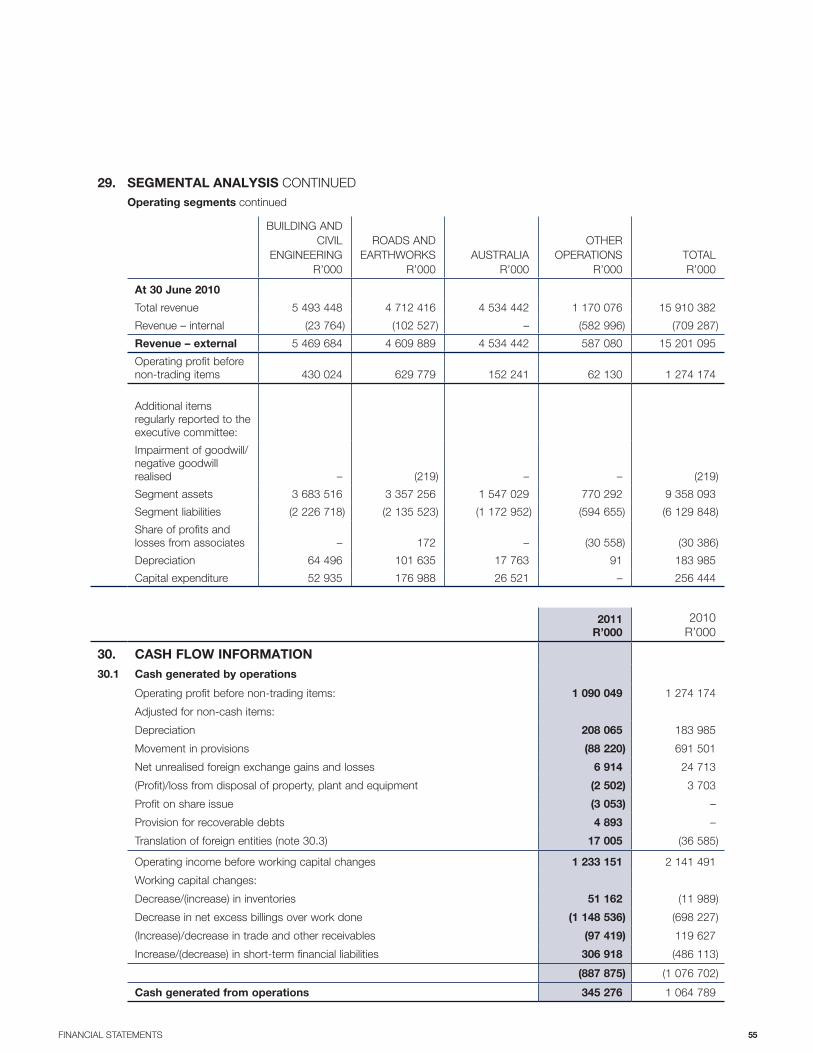
55FINANCIAL STATEMENTS
29. SEGMENTAL ANALYSIS CONTINUED
Operating segments continued
BUILDING AND
CIVIL
ENGINEERING
R’000
ROADS AND
EARTHWORKS
R’000
AUSTRALIA
R’000
OTHER
OPERATIONS
R’000
TOTAL
R’000
At 30 June 2010
Total revenue 5 493 448 4 712 416 4 534 442 1 170 076 15 910 382
Revenue – internal (23 764) (102 527) – (582 996) (709 287)
Revenue – external 5 469 684 4 609 889 4 534 442 587 080 15 201 095
Operating profit before
non-trading items 430 024 629 779 152 241 62 130 1 274 174
Additional items
regularly reported to the
executive committee:
Impairment of goodwill/
negative goodwill
realised – (219) – – (219)
Segment assets 3 683 516 3 357 256 1 547 029 770 292 9 358 093
Segment liabilities (2 226 718) (2 135 523) (1 172 952) (594 655) (6 129 848)
Share of profits and
losses from associates – 172 – (30 558) (30 386)
Depreciation 64 496 101 635 17 763 91 183 985
Capital expenditure 52 935 176 988 26 521 – 256 444
2011
R’000
2010
R’000
30. CASH FLOW INFORMATION
30.1 Cash generated by operations
Operating profit before non-trading items: 1 090 049 1 274 174
Adjusted for non-cash items:
Depreciation 208 065 183 985
Movement in provisions (88 220) 691 501
Net unrealised foreign exchange gains and losses 6 914 24 713
(Profit)/loss from disposal of property, plant and equipment (2 502) 3 703
Profit on share issue (3 053) –
Provision for recoverable debts 4 893 –
Translation of foreign entities (note 30.3) 17 005 (36 585)
Operating income before working capital changes 1 233 151 2 141 491
Working capital changes:
Decrease/(increase) in inventories 51 162 (11 989)
Decrease in net excess billings over work done (1 148 536) (698 227)
(Increase)/decrease in trade and other receivables (97 419) 119 627
Increase/(decrease) in short-term financial liabilities 306 918 (486 113)
(887 875) (1 076 702)
Cash generated from operations 345 276 1 064 789
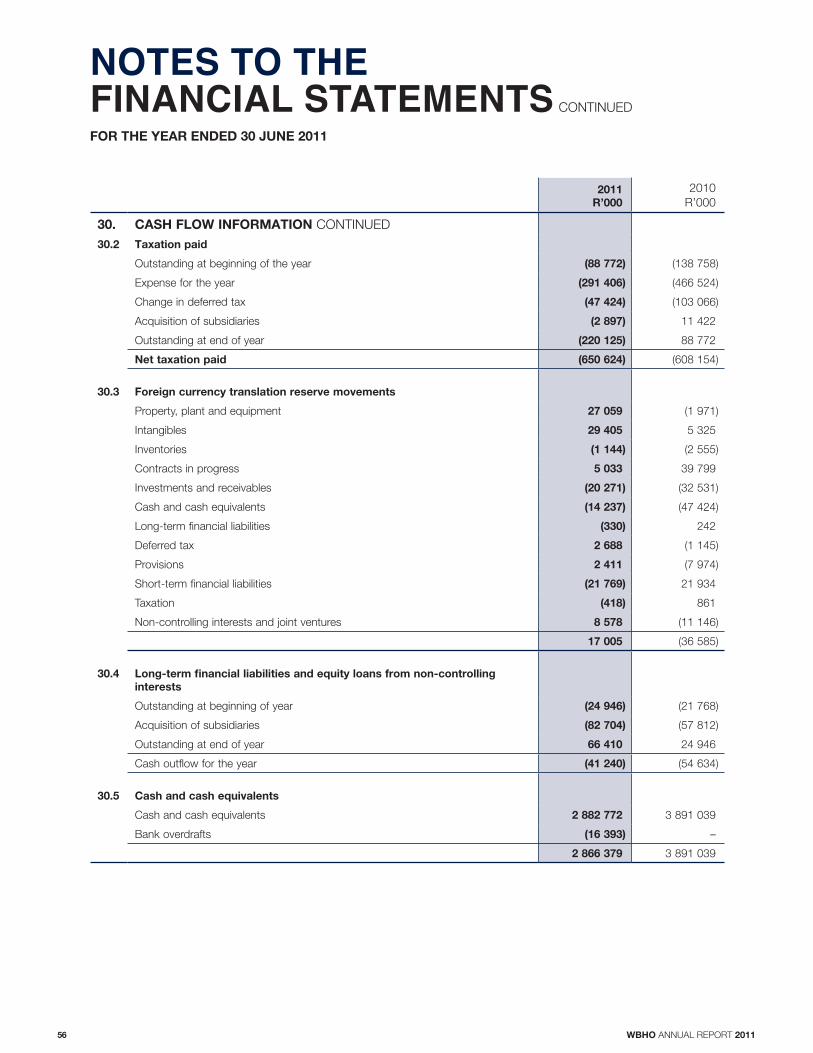
56 WBHO ANNUAL REPORT 2011
FOR THE YEAR ENDED 30 JUNE 2011
NOTES TO THE FINANCIAL STATEMENTS CONTINUED
2011
R’000
2010
R’000
30. CASH FLOW INFORMATION CONTINUED
30.2 Taxation paid
Outstanding at beginning of the year (88 772) (138 758)
Expense for the year (291 406) (466 524)
Change in deferred tax (47 424) (103 066)
Acquisition of subsidiaries (2 897) 11 422
Outstanding at end of year (220 125) 88 772
Net taxation paid (650 624) (608 154)
30.3 Foreign currency translation reserve movements
Property, plant and equipment 27 059 (1 971)
Intangibles 29 405 5 325
Inventories (1 144) (2 555)
Contracts in progress 5 033 39 799
Investments and receivables (20 271) (32 531)
Cash and cash equivalents (14 237) (47 424)
Long-term financial liabilities (330) 242
Deferred tax 2 688 (1 145)
Provisions 2 411 (7 974)
Short-term financial liabilities (21 769) 21 934
Taxation (418) 861
Non-controlling interests and joint ventures 8 578 (11 146)
17 005 (36 585)
30.4 Long-term financial liabilities and equity loans from non-controlling
interests
Outstanding at beginning of year (24 946) (21 768)
Acquisition of subsidiaries (82 704) (57 812)
Outstanding at end of year 66 410 24 946
Cash outflow for the year (41 240) (54 634)
30.5 Cash and cash equivalents
Cash and cash equivalents 2 882 772 3 891 039
Bank overdrafts (16 393) –
2 866 379 3 891 039

57FINANCIAL STATEMENTS
2011
R’000
31. ACQUISITIONS
31.1 Business combinations
CARR Civil Contracting Pty Ltd
On 1 July 2010, WBHO Australia acquired a 51% interest in CARR Civil Contracting Pty Ltd.
The company was consolidated into the group’s results from the acquisition date. Included in the
group’s results is revenue of R576 million and a loss before tax of R0,8 million.
The fair value of assets and liabilities at the acquisition date were as follows:
Property, plant and equipment 79 544
Inventory 5 076
Trade and other receivables 70 332
Long-term financial liabilities (37 081)
Trade and other payables (93 220)
Taxation and deferred taxation (1 395)
Goodwill 1 614
Cash and cash equivalents 31 967
Equity value 56 837
Equity value attributable to non-controlling interests (27 850)
Share of the equity value attributable to the group 28 987
Goodwill 12 310
Purchase price 41 297
Monaco Hickey Pty Ltd
On 1 July 2010, Probuild Constructions Australia acquired a 60% interest in Monaco Hickey Pty Ltd.
The company was consolidated into the group’s results from the acquisition date. Included
in the group’s results is revenue of R255 million and a profit before tax of R12,4 million.
The fair value of assets and liabilities at the acquisition date were as follows:
Property, plant and equipment 1 259
Investments and guarantees 6
Inventory 39
Trade and other receivables 9 048
Long-term financial liabilities (1 104)
Trade and other payables (13 116)
Taxation and deferred taxation 504
Goodwill 38 748
Cash and cash equivalents 3 365
Equity value 38 749
Equity value attributable to non-controlling interests (15 499)
Share of the equity value attributable to the group 23 250
Goodwill –
Purchase price 23 250
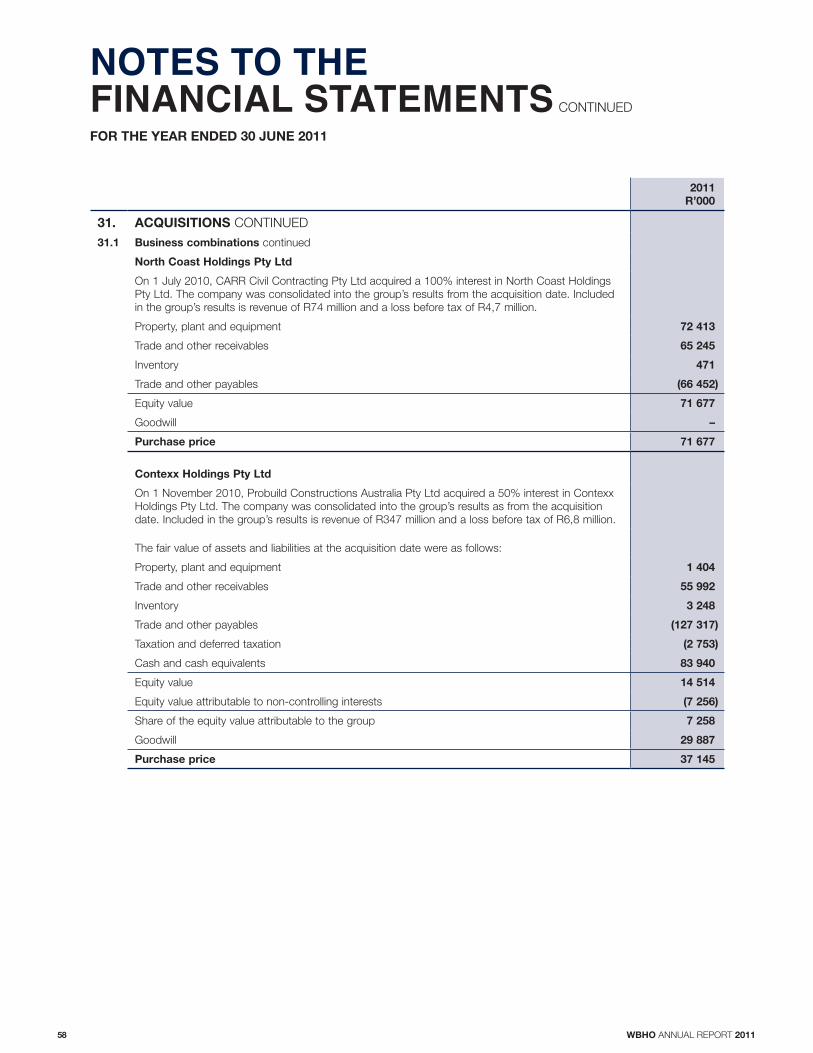
58 WBHO ANNUAL REPORT 2011
NOTES TO THE FINANCIAL STATEMENTS CONTINUED
FOR THE YEAR ENDED 30 JUNE 2011
2011
R’000
31. ACQUISITIONS CONTINUED
31.1 Business combinations continued
North Coast Holdings Pty Ltd
On 1 July 2010, CARR Civil Contracting Pty Ltd acquired a 100% interest in North Coast Holdings
Pty Ltd. The company was consolidated into the group’s results from the acquisition date. Included
in the group’s results is revenue of R74 million and a loss before tax of R4,7 million.
Property, plant and equipment 72 413
Trade and other receivables 65 245
Inventory 471
Trade and other payables (66 452)
Equity value 71 677
Goodwill –
Purchase price 71 677
Contexx Holdings Pty Ltd
On 1 November 2010, Probuild Constructions Australia Pty Ltd acquired a 50% interest in Contexx
Holdings Pty Ltd. The company was consolidated into the group’s results as from the acquisition
date. Included in the group’s results is revenue of R347 million and a loss before tax of R6,8 million.
The fair value of assets and liabilities at the acquisition date were as follows:
Property, plant and equipment 1 404
Trade and other receivables 55 992
Inventory 3 248
Trade and other payables (127 317)
Taxation and deferred taxation (2 753)
Cash and cash equivalents 83 940
Equity value 14 514
Equity value attributable to non-controlling interests (7 256)
Share of the equity value attributable to the group 7 258
Goodwill 29 887
Purchase price 37 145
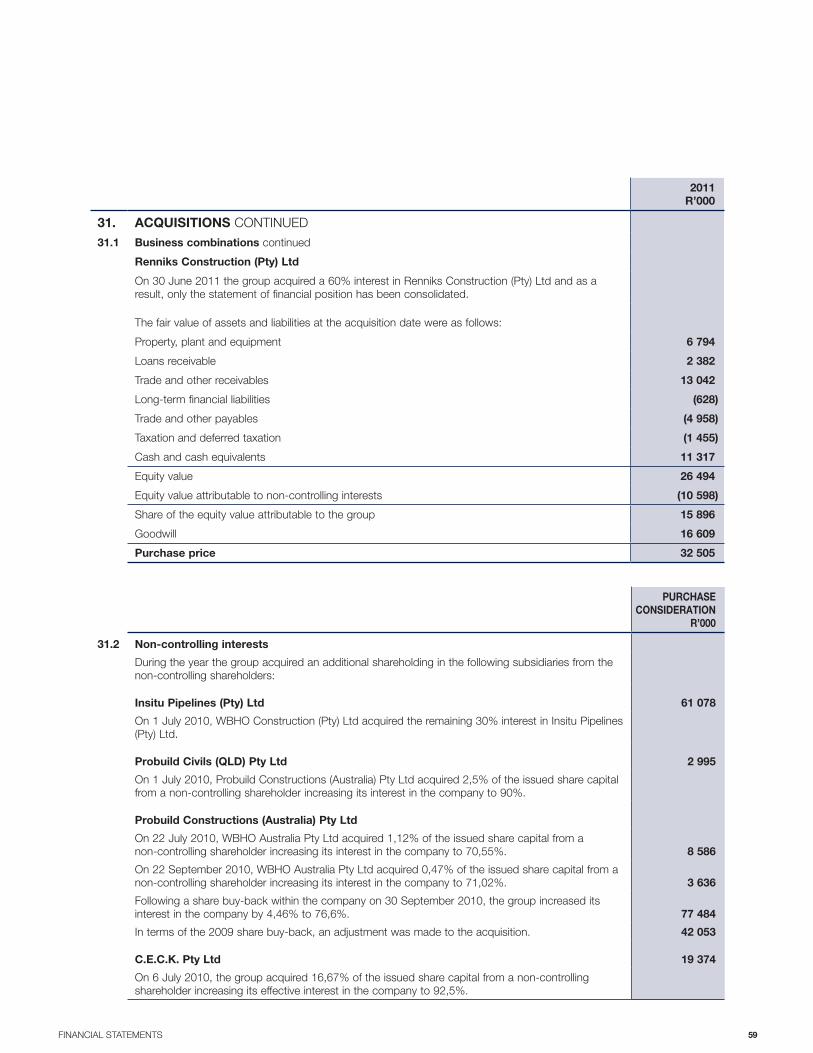
59FINANCIAL STATEMENTS
2011
R’000
31. ACQUISITIONS CONTINUED
31.1 Business combinations continued
Renniks Construction (Pty) Ltd
On 30 June 2011 the group acquired a 60% interest in Renniks Construction (Pty) Ltd and as a
result, only the statement of financial position has been consolidated.
The fair value of assets and liabilities at the acquisition date were as follows:
Property, plant and equipment 6 794
Loans receivable 2 382
Trade and other receivables 13 042
Long-term financial liabilities (628)
Trade and other payables (4 958)
Taxation and deferred taxation (1 455)
Cash and cash equivalents 11 317
Equity value 26 494
Equity value attributable to non-controlling interests (10 598)
Share of the equity value attributable to the group 15 896
Goodwill 16 609
Purchase price 32 505
PURCHASE
CONSIDERATION
R’000
31.2 Non-controlling interests
During the year the group acquired an additional shareholding in the following subsidiaries from the
non-controlling shareholders:
Insitu Pipelines (Pty) Ltd 61 078
On 1 July 2010, WBHO Construction (Pty) Ltd acquired the remaining 30% interest in Insitu Pipelines
(Pty) Ltd.
Probuild Civils (QLD) Pty Ltd 2 995
On 1 July 2010, Probuild Constructions (Australia) Pty Ltd acquired 2,5% of the issued share capital
from a non-controlling shareholder increasing its interest in the company to 90%.
Probuild Constructions (Australia) Pty Ltd
On 22 July 2010, WBHO Australia Pty Ltd acquired 1,12% of the issued share capital from a
non-controlling shareholder increasing its interest in the company to 70,55%. 8 586
On 22 September 2010, WBHO Australia Pty Ltd acquired 0,47% of the issued share capital from a
non-controlling shareholder increasing its interest in the company to 71,02%. 3 636
Following a share buy-back within the company on 30 September 2010, the group increased its
interest in the company by 4,46% to 76,6%. 77 484
In terms of the 2009 share buy-back, an adjustment was made to the acquisition. 42 053
C.E.C.K. Pty Ltd 19 374
On 6 July 2010, the group acquired 16,67% of the issued share capital from a non-controlling
shareholder increasing its effective interest in the company to 92,5%.

60 WBHO ANNUAL REPORT 2011
FOR THE YEAR ENDED 30 JUNE 2011
NOTES TO THE FINANCIAL STATEMENTS CONTINUED
PURCHASE
CONSIDERATION
R’000
31. ACQUISITIONS CONTINUED
31.2 Non-controlling interests continued
Roadspan Holdings (Pty) Ltd 6 350
On 1 April 2011, WBHO Construction (Pty) Ltd acquired the remaining 30% interest in Roadspan
Holdings (Pty) Ltd.
The aggregate effect of the acquisitions of non-controlling interests on goodwill recognised in equity
amounts to: 169 745
31.3 Cash flow on acquisitions
Comprising:
Acquisition of businesses 205 874
Acquisition of non-controlling interests 221 556
Cash acquired (130 589)
296 841
2010
R’000
31.4 Business combinations
Roadspan Holdings (Pty) Ltd
On 31 October 2009 the group acquired an additional 40% interest in Roadspan Holdings increasing
its total interest to 70%. Roadspan was equity accounted for until the acquisition date and then
subsequently consolidated into the group’s results. Included in the group’s results is revenue of
R439 million and a loss before tax of R45 million.
The fair value of assets and liabilities at the acquisition date were as follows:
Property, plant and equipment 57 123
Trade and other receivables 89 119
Inventory 6 717
Long-term financial liabilities (57 813)
Trade and other payables (71 895)
Taxation and deferred taxation 11 422
Goodwill 3 702
Non-controlling interests (13 650)
Cash and cash equivalents 9 088
Equity value 33 813
Equity value attributable to non-controlling interests 7 388
Share of the equity value attributable to the group 41 201
Goodwill 29 139
Purchase price 70 340
30% reacquired at fair value 5 100
40% acquisition 65 240
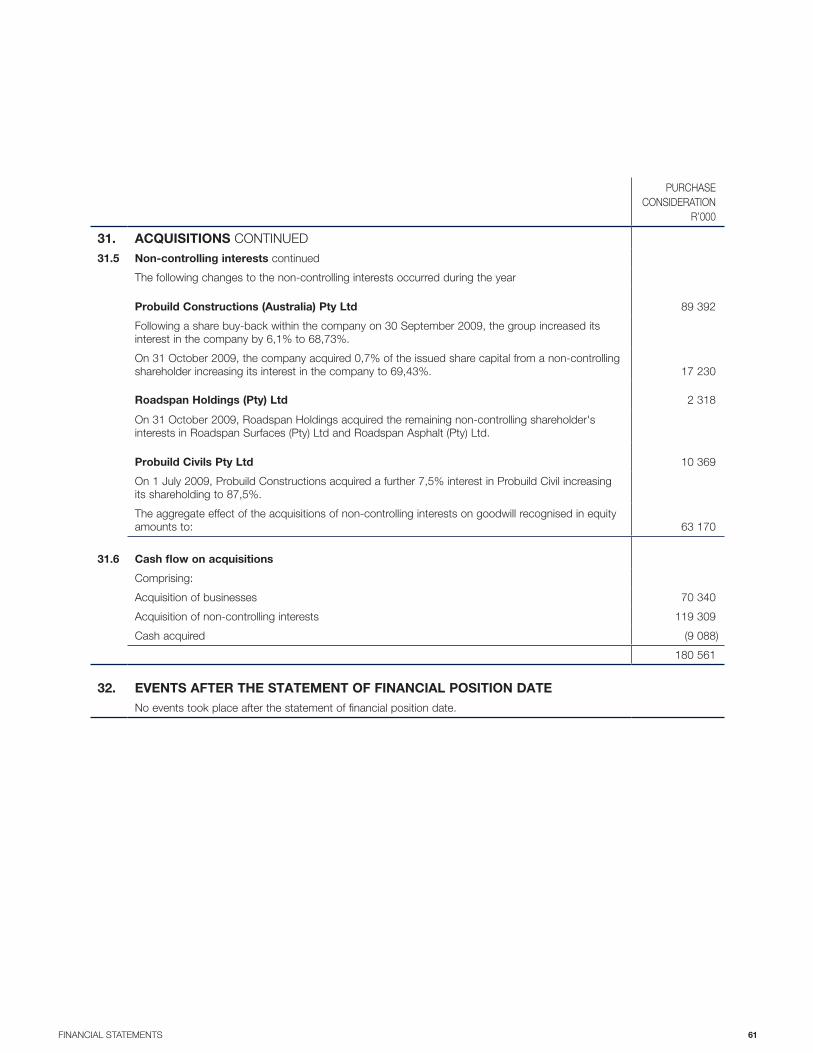
61FINANCIAL STATEMENTS
PURCHASE
CONSIDERATION
R’000
31. ACQUISITIONS CONTINUED
31.5 Non-controlling interests continued
The following changes to the non-controlling interests occurred during the year
Probuild Constructions (Australia) Pty Ltd 89 392
Following a share buy-back within the company on 30 September 2009, the group increased its
interest in the company by 6,1% to 68,73%.
On 31 October 2009, the company acquired 0,7% of the issued share capital from a non-controlling
shareholder increasing its interest in the company to 69,43%. 17 230
Roadspan Holdings (Pty) Ltd 2 318
On 31 October 2009, Roadspan Holdings acquired the remaining non-controlling shareholder's
interests in Roadspan Surfaces (Pty) Ltd and Roadspan Asphalt (Pty) Ltd.
Probuild Civils Pty Ltd 10 369
On 1 July 2009, Probuild Constructions acquired a further 7,5% interest in Probuild Civil increasing
its shareholding to 87,5%.
The aggregate effect of the acquisitions of non-controlling interests on goodwill recognised in equity
amounts to: 63 170
31.6 Cash flow on acquisitions
Comprising:
Acquisition of businesses 70 340
Acquisition of non-controlling interests 119 309
Cash acquired (9 088)
180 561
32. EVENTS AFTER THE STATEMENT OF FINANCIAL POSITION DATE
No events took place after the statement of financial position date.

62 WBHO ANNUAL REPORT 2011
NOTES
2011
R’000
2010
R’000
ASSETS
Investments in subsidiaries and special-purpose entities 1 42 772 44 086
Other financial assets 2 186 266 216 594
Total non-current assets 229 038 260 680
Cash and cash equivalents 615 180
Total current assets 615 180
Total assets 229 653 260 860
EQUITY
Share capital and share premium 31 175 31 175
Retained earnings 16 628 118 706
Total equity attributable to equity holders of the company 47 803 149 881
Liabilities
Long-term financial liabilities 3 181 224 110 550
Total non-current liabilities 181 224 110 550
Short-term financial liabilities 4 626 429
Total current liabilities 626 429
Total liabilities 181 850 110 979
Total equity and liabilities 229 653 260 860
AS AT 30 JUNE 2011
COMPANY STATEMENT OF FINANCIAL POSITION
NOTES
2011
R’000
2010
R’000
Investment income 5 107 555 145 694
Other income 8 472 –
Other direct costs (306) –
Loan from subsidiary written off – 9 968
Net profit for the year 115 721 155 662
Attributable to:
Equity shareholders of Wilson Bayly Holmes-Ovcon Limited 115 721 155 662
FOR THE YEAR ENDED 30 JUNE 2011
COMPANY STATEMENT OF FINANCIAL PERFORMANCE

63FINANCIAL STATEMENTS
COMPANY STATEMENT OF CHANGES IN EQUITYFOR THE YEAR ENDED 30 JUNE 2011
ORDINARY
SHARES
ISSUED
R’000
SHARE
PREMIUM
R’000
DISTRIBUTABLE
RESERVES
R’000
TOTAL
EQUITY
R’000
Balance at 30 June 2009 660 30 515 167 644 198 819
Net profit for the year – – 155 662 155 662
Dividend paid – – (204 600) (204 600)
Balance at 30 June 2010 660 30 515 118 706 149 881
Net profit for the year – – 115 721 115 721
Dividend paid – – (217 799) (217 799)
Balance at 30 June 2011 660 30 515 16 628 47 803
2011
R’000
2010
R’000
Cash flow from operating activities
Cash generated from operations 8 364 10 120
Investment income 107 555 145 694
Dividend paid (217 799) (204 600)
Net cash flow from operating activities (101 880) (48 786)
Decrease/(increase) in investments 1 314 (1 305)
Decrease in other financial assets 30 327 3 371
Net cash flow from investing activities 31 641 2 066
Increase in long-term financial liabilities 70 674 46 810
Net cash flow from financing activities 70 674 46 810
Increase in cash and cash equivalents for the year 435 90
Cash and cash equivalents at beginning of year 180 90
Cash and cash equivalents at the end of year 615 180
FOR THE YEAR ENDED 30 JUNE 2011
COMPANY STATEMENT OF CASH FLOWS
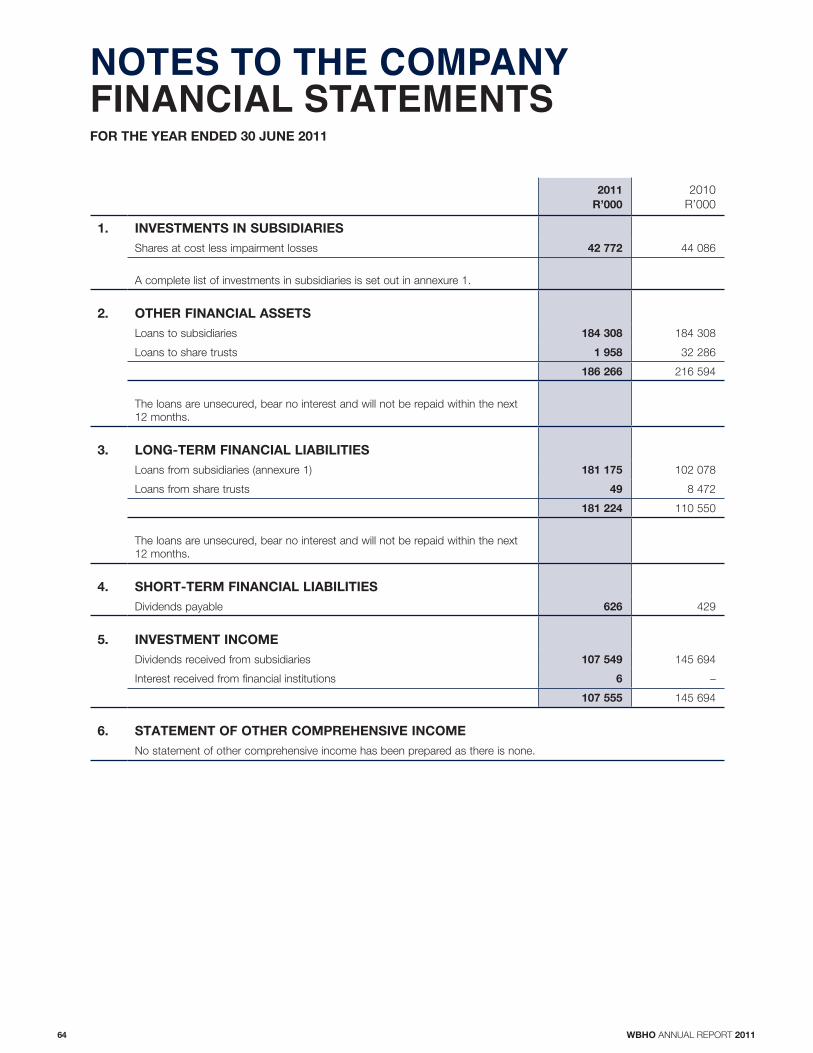
64 WBHO ANNUAL REPORT 2011
NOTES TO THE COMPANY FINANCIAL STATEMENTSFOR THE YEAR ENDED 30 JUNE 2011
2011
R’000
2010
R’000
1. INVESTMENTS IN SUBSIDIARIES
Shares at cost less impairment losses 42 772 44 086
A complete list of investments in subsidiaries is set out in annexure 1.
2. OTHER FINANCIAL ASSETS
Loans to subsidiaries 184 308 184 308
Loans to share trusts 1 958 32 286
186 266 216 594
The loans are unsecured, bear no interest and will not be repaid within the next
12 months.
3. LONG-TERM FINANCIAL LIABILITIES
Loans from subsidiaries (annexure 1) 181 175 102 078
Loans from share trusts 49 8 472
181 224 110 550
The loans are unsecured, bear no interest and will not be repaid within the next
12 months.
4. SHORT-TERM FINANCIAL LIABILITIES
Dividends payable 626 429
5. INVESTMENT INCOME
Dividends received from subsidiaries 107 549 145 694
Interest received from financial institutions 6 –
107 555 145 694
6. STATEMENT OF OTHER COMPREHENSIVE INCOME
No statement of other comprehensive income has been prepared as there is none.

65FINANCIAL STATEMENTS
ANNEXURE 1 INVESTMENT IN SUBSIDIARIESFOR THE YEAR ENDED 30 JUNE 2011
COUNTRY OF
INCORPORATION ISSUED CAPITAL
EFFECTIVE
HOLDING
%
SHARES AT COST
AMOUNTS OWING
BY/(TO) SUBSIDIARIES
2011
R’000
2010
R’000
2011
R’000
2010
R’000
Held directly
Akani Investment Holdings
(Pty) Ltd South Africa R103 438 34 34 1 348 (41) (736)
WBHO Construction
(Pty) Ltd South Africa R900 000 100 42 738 42 738 (181 134) (101 342)
WBHO Industrial Holdings
(Pty) Ltd South Africa R100 100 – – 184 308 184 308
Held indirectly
CARR Civil Contracting
Pty Ltd Australia AUS$4,650 51
C.E.C.K. Civil Construction
Pty Ltd Australia AUS$600 82
Contexx Holdings Pty Ltd Australia AUS$10,177 38,3
Edwin Construction
(Pty) Ltd South Africa R100 57
Insitu Pipelines (Pty) Ltd South Africa R100 100
Kalcon (Pty) Ltd Botswana P2 100
Matkovich & Hayes
(Pty) Ltd South Africa R10 000 51
Monaco Hickey Pty Ltd Australia AUS$6 000 46,0
Probuild Civil (QLD)
Pty Ltd Australia AUS$140 004 68,9
Probuild Constructions
(Australia) Pty Ltd Australia AUS$37 946 003 76,6
Renniks Construction
(Pty) Ltd South Africa R405 600 60
Roadspan Holdings
(Pty) Ltd South Africa R9 900 100
Simbithi Eco Estate
(Pty) Ltd South Africa R100 100
St Francis Links (Pty) Ltd South Africa R100 80
WBHO Australia (Pty) Ltd Australia AUS$26 400 000 100
WBHO Construcao
Mozambique Limitada Mozambique US$403 910 100
WBHO Construction Sierra
Leone Ltd Sierra Leone Le100 000 100
WBHO Ghana (Pty) Ltd Ghana $500 000 100
WBHO Mozambique
Projectos Limitada Mozambique Mt10 000 000 100
WBHO Properties Pty Ltd Australia AUS$12 100
WBHO Construction
Zambia Ltd Zambia ZMK100 000 100
42 772 44 086 3 133 82 230
Investments in dormant subsidiaries have been omitted.
WBHO Construcao Mozambique Limitada and WBHO Mozambique Projectos Limitada have 31 December reporting dates.
Changes to the reporting dates are not permitted per Mozambique’s legislation. Management information for the period to
30 June 2011, which has been reviewed, has been consolidated.
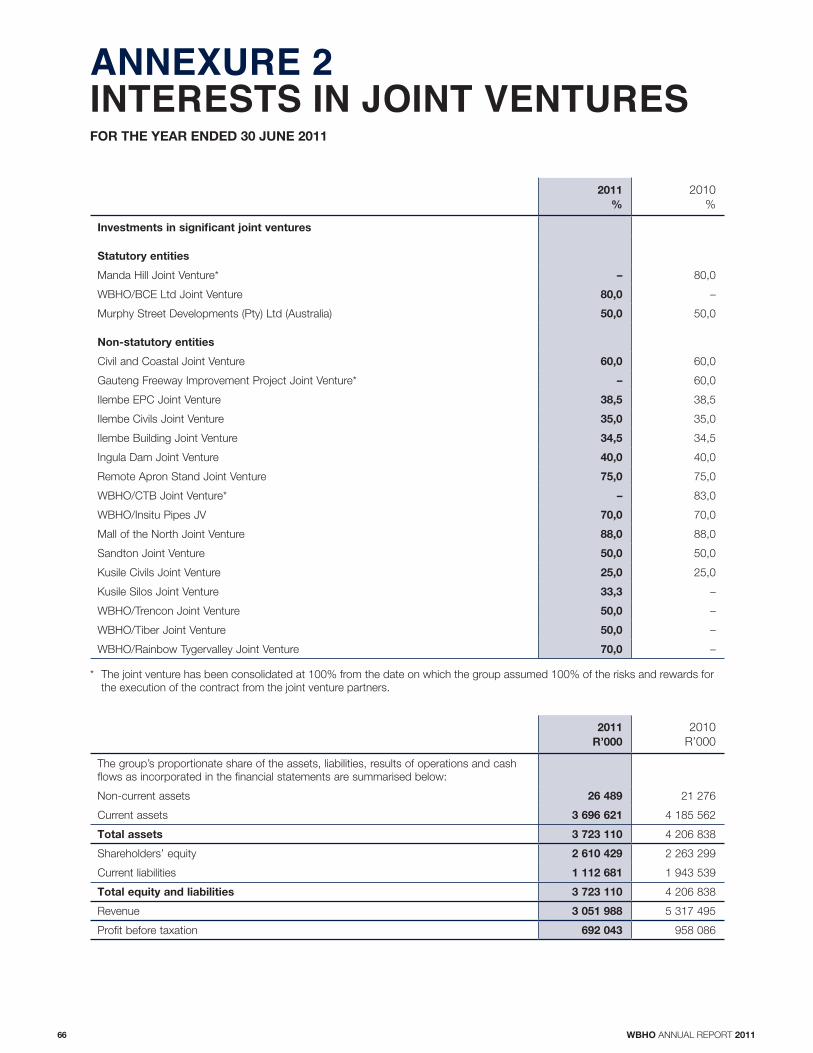
66 WBHO ANNUAL REPORT 2011
ANNEXURE 2 INTERESTS IN JOINT VENTURESFOR THE YEAR ENDED 30 JUNE 2011
2011
%
2010
%
Investments in significant joint ventures
Statutory entities
Manda Hill Joint Venture* – 80,0
WBHO/BCE Ltd Joint Venture 80,0 –
Murphy Street Developments (Pty) Ltd (Australia) 50,0 50,0
Non-statutory entities
Civil and Coastal Joint Venture 60,0 60,0
Gauteng Freeway Improvement Project Joint Venture* – 60,0
Ilembe EPC Joint Venture 38,5 38,5
Ilembe Civils Joint Venture 35,0 35,0
Ilembe Building Joint Venture 34,5 34,5
Ingula Dam Joint Venture 40,0 40,0
Remote Apron Stand Joint Venture 75,0 75,0
WBHO/CTB Joint Venture* – 83,0
WBHO/Insitu Pipes JV 70,0 70,0
Mall of the North Joint Venture 88,0 88,0
Sandton Joint Venture 50,0 50,0
Kusile Civils Joint Venture 25,0 25,0
Kusile Silos Joint Venture 33,3 –
WBHO/Trencon Joint Venture 50,0 –
WBHO/Tiber Joint Venture 50,0 –
WBHO/Rainbow Tygervalley Joint Venture 70,0 –
* The joint venture has been consolidated at 100% from the date on which the group assumed 100% of the risks and rewards for
the execution of the contract from the joint venture partners.
2011
R’000
2010
R’000
The group’s proportionate share of the assets, liabilities, results of operations and cash
flows as incorporated in the financial statements are summarised below:
Non-current assets 26 489 21 276
Current assets 3 696 621 4 185 562
Total assets 3 723 110 4 206 838
Shareholders’ equity 2 610 429 2 263 299
Current liabilities 1 112 681 1 943 539
Total equity and liabilities 3 723 110 4 206 838
Revenue 3 051 988 5 317 495
Profit before taxation 692 043 958 086