Financial StatementS OF icici BanK limited ScHedUleS
77
161 Integrated Report Statutory Reports Financial Statements SCHEDULE 17 SIGNIFICANT ACCOUNTING POLICIES Overview ICICI Bank Limited (ICICI Bank or the Bank), incorporated in Vadodara, India is a publicly held banking company engaged in providing a wide range of banking and financial services including commercial banking and treasury operations. ICICI Bank is a banking company governed by the Banking Regulation Act, 1949. The Bank also has overseas branches in Bahrain, China, Dubai, Hong Kong, Singapore, South Africa, United States of America and Offshore Banking units. Basis of preparation The financial statements have been prepared in accordance with requirements prescribed under the Third Schedule of the Banking Regulation Act, 1949. The accounting and reporting policies of ICICI Bank used in the preparation of these financial statements conform to Generally Accepted Accounting Principles in India (Indian GAAP), the guidelines issued by Reserve Bank of India (RBI) from time to time and the Accounting Standards notified under Section 133 of the Companies Act, 2013 read together with paragraph 7 of the Companies (Accounts) Rules, 2014 to the extent applicable and practices generally prevalent in the banking industry in India. The Bank follows the historical cost convention and the accrual method of accounting, except in the case of interest and other income on non-performing assets (NPAs) where it is recognised upon realisation. Use of estimates The preparation of financial statements requires management to make estimates and assumptions that are considered in the reported amounts of assets and liabilities (including contingent liabilities) as of the date of the financial statements and the reported income and expenses during the reporting period. Management believes that the estimates used in the preparation of the financial statements are prudent and reasonable. Actual results could differ from these estimates. The impact of any revision in these estimates is recognised prospectively from the period of change. SIGNIFICANT ACCOUNTING POLICIES 1. Revenue recognition a) Interest income is recognised in the profit and loss account as it accrues, including for cases where moratorium has been extended for payments of principal and/or interest as per RBI guideline dated March 27, 2020, except in the case of non-performing assets (NPAs) where it is recognised upon realisation, as per the income recognition and asset classification norms of RBI. b) Income on discounted instruments is recognised over the tenure of the instrument on a constant yield basis. c) Dividend income is accounted on accrual basis when the right to receive the dividend is established. d) Loan processing fee is accounted for upfront when it becomes due. e) Project appraisal/structuring fee is accounted for on the completion of the agreed service. f) Arranger fee is accounted for as income when a significant portion of the arrangement is completed and right to receive is established. g) Commission received on guarantees and letters of credit issued is amortised on a straight-line basis over the period of the guarantee/letters of credit. h) The annual/renewal fee on credit cards and debit cards are amortised on a straight line basis over one year. i) Fees paid/received for priority sector lending certificates (PSLC) is amortised on straight-line basis over the period of the certificate. j) All other fees are accounted for as and when they become due where the Bank is reasonably certain of ultimate collection. FINANCIAL STATEMENTS OF ICICI BANK LIMITED SCHEDULES forming part of the Accounts
Transcript of Financial StatementS OF icici BanK limited ScHedUleS

161
Integrated Report Statutory Reports Financial Statements
ScHedUle 17
SiGniFicant accOUntinG pOlicieS
OverviewICICI Bank Limited (ICICI Bank or the Bank), incorporated in Vadodara, India is a publicly held banking company engaged in providing a wide range of banking and financial services including commercial banking and treasury operations. ICICI Bank is a banking company governed by the Banking Regulation Act, 1949. The Bank also has overseas branches in Bahrain, China, Dubai, Hong Kong, Singapore, South Africa, United States of America and Offshore Banking units.
Basis of preparationThe financial statements have been prepared in accordance with requirements prescribed under the Third Schedule of the Banking Regulation Act, 1949. The accounting and reporting policies of ICICI Bank used in the preparation of these financial statements conform to Generally Accepted Accounting Principles in India (Indian GAAP), the guidelines issued by Reserve Bank of India (RBI) from time to time and the Accounting Standards notified under Section 133 of the Companies Act, 2013 read together with paragraph 7 of the Companies (Accounts) Rules, 2014 to the extent applicable and practices generally prevalent in the banking industry in India. The Bank follows the historical cost convention and the accrual method of accounting, except in the case of interest and other income on non-performing assets (NPAs) where it is recognised upon realisation.
Use of estimatesThe preparation of financial statements requires management to make estimates and assumptions that are considered in the reported amounts of assets and liabilities (including contingent liabilities) as of the date of the financial statements and the reported income and expenses during the reporting period. Management believes that the estimates used in the preparation of the financial statements are prudent and reasonable. Actual results could differ from these estimates. The impact of any revision in these estimates is recognised prospectively from the period of change.
SiGniFicant accOUntinG pOlicieS
1. Revenue recognition a) Interest income is recognised in the profit and loss account as it accrues, including for cases where moratorium
has been extended for payments of principal and/or interest as per RBI guideline dated March 27, 2020, except in the case of non-performing assets (NPAs) where it is recognised upon realisation, as per the income recognition and asset classification norms of RBI.
b) Income on discounted instruments is recognised over the tenure of the instrument on a constant yield basis.
c) Dividend income is accounted on accrual basis when the right to receive the dividend is established.
d) Loan processing fee is accounted for upfront when it becomes due.
e) Project appraisal/structuring fee is accounted for on the completion of the agreed service.
f) Arranger fee is accounted for as income when a significant portion of the arrangement is completed and right to receive is established.
g) Commission received on guarantees and letters of credit issued is amortised on a straight-line basis over the period of the guarantee/letters of credit.
h) The annual/renewal fee on credit cards and debit cards are amortised on a straight line basis over one year.
i) Fees paid/received for priority sector lending certificates (PSLC) is amortised on straight-line basis over the period of the certificate.
j) All other fees are accounted for as and when they become due where the Bank is reasonably certain of ultimate collection.
Financial StatementS OF icici BanK limited
ScHedUleSforming part of the Accounts

FINANCIAL STATEMENTS OF ICICI BANK LIMITED
SChEDuLESforming part of the Accounts (Contd.)
2. investments Investments are accounted for in accordance with the extant RBI guidelines on investment classification and valuation.
The Bank follows trade date method of accounting for purchase and sale of investments, except for government of India and state government securities where settlement date method of accounting is followed in accordance with RBI guidelines.
Classification: All investments are classified into ‘Held to Maturity’ (HTM), ‘Available for Sale’ (AFS) and ‘Held for Trading’ (HFT) on
the date of purchase as per the extant RBI guidelines on investment classification and valuation. Reclassifications, if any, in any category are accounted for as per RBI guidelines. Under each classification, the investments are further categorised as (a) government securities, (b) other approved securities, (c) shares, (d) bonds and debentures, (e) subsidiaries and joint ventures and (f) others.
Investments that are held principally for resale within 90 days from the date of purchase are classified as HFT securities. Investments which the Bank intends to hold till maturity are classified as HTM securities. Investments which are not classified in either of the above categories are classified under AFS securities. Investments in the equity of subsidiaries/joint ventures are classified under HTM or AFS categories.
Cost of acquisition: Costs, including brokerage and commission pertaining to investments paid at the time of acquisition and broken period
interest (the amount of interest from the previous interest payment date till the date of purchase of instruments) on debt instruments, are charged to the profit and loss account.
Valuation: Securities are valued scrip-wise. Depreciation/appreciation on securities, other than those acquired by way of
conversion of outstanding loans, is aggregated for each category. Net appreciation in each category under each investment classification, if any, being unrealised, is ignored, while net depreciation is provided for. The depreciation on securities acquired by way of conversion of outstanding loans is fully provided for. Non-performing investments are identified based on the RBI guidelines.
HTM securities are carried at their acquisition cost or at amortised cost, if acquired at a premium over the face value. Any premium over the face value of fixed rate and floating rate securities acquired is amortised over the remaining period to maturity on a constant yield basis and straight line basis respectively.
AFS and HFT securities are valued periodically as per RBI guidelines. Any premium over the face value of fixed rate and floating rate investments in government securities, classified as AFS, is amortised over the remaining period to maturity on constant yield basis and straight line basis respectively. Quoted investments are valued based on the closing quotes on the recognised stock exchanges or prices declared by Primary Dealers Association of India (PDAI) jointly with Fixed Income Money Market and Derivatives Association (FIMMDA)/Financial Benchmark India Private Limited (FBIL), periodically.
The market/fair value of unquoted government securities which are in nature of Statutory Liquidity Ratio (SLR) securities included in the ‘Available for Sale’ and ‘Held for Trading’ categories is as per the rates published by FIMMDA/FBIL. The valuation of other unquoted fixed income securities, including Pass Through Certificates, wherever linked to the Yield-to-Maturity (YTM) rates, is computed with a mark-up (reflecting associated credit risk) over the YTM rates for government securities published by FIMMDA. The sovereign foreign securities and non-INR India linked bonds are valued on the basis of prices published by the sovereign regulator or counterparty quotes.
Treasury bills, commercial papers and certificate of deposits being discounted instruments, are valued at carrying cost.
The units of mutual funds are valued at the latest repurchase price/net asset value declared by the mutual fund. Unquoted equity shares are valued at the break-up value, if the latest balance sheet is available, or at `1, as per RBI guidelines.
162
Annual Report 2020-21

FINANCIAL STATEMENTS OF ICICI BANK LIMITED
SChEDuLESforming part of the Accounts (Contd.)
At the end of each reporting period, security receipts issued by the asset reconstruction companies are valued in accordance with the guidelines applicable to such instruments, prescribed by RBI from time to time. Accordingly, in cases where the cash flows from security receipts issued by the asset reconstruction companies are limited to the actual realisation of the financial assets assigned to the instruments in the concerned scheme, the Bank reckons the net asset value obtained from the asset reconstruction company from time to time, for valuation of such investments at each reporting period end. The security receipts which are outstanding and not redeemed as at the end of the resolution period are treated as loss assets and are fully provided for.
The Bank assesses investments in subsidiaries for any permanent diminution in value and appropriate provisions are made.
Disposal: Gain/loss on sale of investments is recognised in the Profit and Loss Account. Cost of investments is computed based
on the First-In-First-Out (FIFO) method. The profit from sale of investment under HTM category, net of taxes and transfer to statutory reserve is transferred to “Capital Reserve” in accordance with the RBI Guidelines.
Short sale: The Bank undertakes short sale transactions in dated central government securities in accordance with RBI guidelines.
The short positions are categorised under HFT category and are marked to market. The mark-to-market loss is charged to profit and loss account and gain, if any, is ignored as per RBI guidelines.
Repurchase transactions: Market repurchase, reverse repurchase and transactions with RBI under Liquidity Adjustment Facility (LAF) are
accounted for as borrowing and lending transactions in accordance with the extant RBI guidelines.
3. provision/write-offs on loans and other credit facilities
Classification: The Bank classifies its loans and investments, including at overseas branches and overdues arising from crystallised
derivative contracts, into performing and NPAs in accordance with RBI guidelines. Loans and advances held at the overseas branches that are identified as impaired as per host country regulations but which are standard as per the extant RBI guidelines are classified as NPAs to the extent of amount outstanding in the respective host country. In accordance with the RBI circular dated April 17, 2020, the moratorium granted to certain borrowers is excluded from the determination of number of days past-due/out-of-order status for the purpose of asset classification. Further, NPAs are classified into sub-standard, doubtful and loss assets based on the criteria stipulated by RBI. Interest on non-performing advances is transferred to an interest suspense account and not recognised in profit and loss account until received.
The Bank considers an account as restructured, where for economic or legal reasons relating to the borrower’s financial difficulty, the Bank grants concessions to the borrower, that the Bank would not otherwise consider. The moratorium granted to the borrowers based on RBI guidelines is not accounted as restructuring of loan. The RBI guidelines on ‘Resolution Framework for COVID-19-related Stress’ provide a prudential framework for resolution plan of certain loans. The borrowers where resolution plan was implemented under these guidelines are classified as standard restructured.
Non-performing and restructured loans are upgraded to standard as per the extant RBI guidelines or host country regulations, as applicable.
Provisioning: In the case of corporate loans and advances, provisions are made for sub-standard and doubtful assets at rates
prescribed by RBI. Loss assets and the unsecured portion of doubtful assets are fully provided. For impaired loans and advances held in overseas branches, which are performing as per RBI guidelines, provisions are made as per the host country regulations. For loans and advances held in overseas branches, which are NPAs both as per the RBI guidelines and host country regulations, provisions are made at the higher of the provisions required under RBI guidelines
Integrated Report Statutory Reports Financial Statements
163

FINANCIAL STATEMENTS OF ICICI BANK LIMITED
SChEDuLESforming part of the Accounts (Contd.)
and host country regulations. Provisions on homogeneous non-performing retail loans and advances, subject to minimum provisioning requirements of RBI, are made on the basis of the ageing of the loan. The specific provisions on non-performing retail loans and advances held by the Bank are higher than the minimum regulatory requirements.
In respect of non-retail loans reported as fraud to RBI the entire amount, is provided for over a period not exceeding four quarters starting from the quarter in which fraud has been detected. In respect of non-retail loans where there has been delay in reporting the fraud to the RBI or which are classified as loss accounts, the entire amount is provided immediately. In case of fraud in retail accounts, the entire amount is provided immediately. In respect of borrowers classified as non-cooperative borrowers or willful defaulters, the Bank makes accelerated provisions as per RBI guidelines.
The Bank holds specific provisions against non-performing loans and advances and against certain performing loans and advances in accordance with RBI directions, including RBI direction for provision on accounts referred to the National Company Law Tribunal (NCLT) under the Insolvency and Bankruptcy Code, 2016.
Provision due to diminution in the fair value of restructured/rescheduled loans and advances is made in accordance with the applicable RBI guidelines.
In terms of RBI guidelines, the NPAs are written-off in accordance with the Bank’s policy. Amounts recovered against bad debts written-off are recognised in the profit and loss account.
The Bank maintains general provision on performing loans and advances in accordance with the RBI guidelines, including provisions on loans to borrowers having unhedged foreign currency exposure, provisions on loans to specific borrowers in specific stressed sectors, provision on exposures to step-down subsidiaries of Indian companies and provision on incremental exposure to borrowers identified as per RBI’s large exposure framework. For performing loans and advances in overseas branches, the general provision is made at higher of aggregate provision required as per host country regulations and RBI requirement.
In addition to the provisions required to be held according to the asset classification status, provisions are held for individual country exposures including indirect country risk (other than for home country exposure). The countries are categorised into seven risk categories namely insignificant, low, moderately low, moderate, moderately high, high and very high, and provisioning is made on exposures exceeding 180 days on a graded scale ranging from 0.25% to 25%. For exposures with contractual maturity of less than 180 days, provision is required to be held at 25% of the rates applicable to exposures exceeding 180 days. The indirect exposure is reckoned at 50% of the exposure. If the Bank’s net funded exposure in respect of a country is less than 1% of its total assets, no provision is required on such country exposure.
The Bank makes additional provisions as per RBI guidelines for the cases where viable resolution plan has not been implemented within the timelines prescribed by the RBI, from the date of default. These additional provisions are written-back on satisfying the conditions for reversal as per RBI guidelines.
The Bank has granted moratorium towards the payment of principal and/or interest in case of certain borrowers in accordance with RBI guidelines. Further, the RBI guidelines on ‘Resolution Framework for COVID-19-related Stress’ provide a prudential framework for resolution plan of certain loans. The Bank makes general provision on such loans at rates equal or higher than requirements stipulated in RBI circular. The Bank has also made additional Covid-19 related provision.
The Bank makes floating provision as per the Board approved policy, which is in addition to the specific and general provisions made by the Bank. The floating provision is utilised, with the approval of Board and RBI, in case of contingencies which do not arise in the normal course of business and are exceptional and non-recurring in nature and for making specific provision for impaired loans as per the requirement if extant RBI guidelines or any regulatory guidance/instructions. The floating provision is netted-off from advances.
Depreciation/provision on non-performing investments is made based on the RBI guidelines.
164
Annual Report 2020-21

FINANCIAL STATEMENTS OF ICICI BANK LIMITED
SChEDuLESforming part of the Accounts (Contd.)
4. transfer and servicing of assets The Bank transfers commercial and consumer loans through securitisation transactions. The transferred loans are
de-recognised and gains/losses are accounted for, only if the Bank surrenders the rights to benefits specified in the underlying securitised loan contract. Recourse and servicing obligations are accounted for net of provisions.
In accordance with the RBI guidelines for securitisation of standard assets, with effect from February 1, 2006, the profit/premium arising from securitisation is amortised over the life of the securities issued or to be issued by the special purpose vehicle to which the assets are sold. With effect from May 7, 2012, the RBI guidelines require the profit/premium arising from securitisation to be amortised based on the method prescribed in the guidelines. The Bank accounts for any loss arising from securitisation immediately at the time of sale.
Net income arising from sale of loan assets through direct assignment with recourse obligation is amortised over the life of underlying assets sold and net income from sale of loan assets through direct assignment, without any recourse obligation, is recognised at the time of sale. Net loss arising on account of direct assignment of loan assets is recognised at the time of sale.
In accordance with RBI guidelines, in case of non-performing/special mention account-2 loans sold to securitisation company (SC)/reconstruction company (RC), the Bank reverses the excess provision in profit and loss account in the year in which amounts are received. Any shortfall of sale value over the net book value on sale of such assets is recognised by the Bank in the year in which the loan is sold.
5. Fixed assets Fixed assets, other than premises, are carried at cost less accumulated depreciation and impairment, if any. Premises
are carried at revalued amount, being fair value at the date of revaluation less accumulated depreciation. Cost includes freight, duties, taxes and incidental expenses related to the acquisition and installation of the asset.
Depreciation is charged over the estimated useful life of fixed assets on a straight-line basis. Assets purchased/sold during the year are depreciated on a pro-rata basis for the actual number of days the asset has been capitalised. Assets individually costing upto ` 5,000/- are depreciated fully in the year of acquisition.
In case of revalued/impaired assets, depreciation is provided over the remaining useful life of the assets with reference to revised asset values. In case of premises, which are carried at revalued amounts, the depreciation on the excess of revalued amount over historical cost is transferred from Revaluation Reserve to General Reserve annually. The profit on sale of premises is appropriated to Capital Reserve, net of transfer to Statutory Reserve and taxes, in accordance with RBI guidelines.
The useful lives of the groups of fixed assets are given below.
asset Useful lifePremises owned by the Bank 60 yearsLeased assets and improvements to leasehold premises 60 years or lease period whichever is lowerATMs1 6 - 8 yearsPlant and machinery1 (including office equipment) 5 -10 yearsElectric installations and equipments 10 - 15 yearsComputers 3 yearsServers and network equipment1 4 – 10 yearsFurniture and fixtures1 5 – 10 yearsMotor vehicles1 5 yearsOthers (including software and system development expenses)1 1-10 years
1. The useful life of fixed assets is based on historical experience of the Bank, which is different from the useful life as prescribed in Schedule II to the Companies Act, 2013.
2. Assets at residences of Bank’s employees are depreciated over the estimated useful life of 5 years.
Integrated Report Statutory Reports Financial Statements
165

FINANCIAL STATEMENTS OF ICICI BANK LIMITED
SChEDuLESforming part of the Accounts (Contd.)
Non-banking assets Non-banking assets (NBAs) acquired in satisfaction of claims are valued at the market value on a distress sale basis or
value of loan, whichever is lower. Further, the Bank creates provision on these assets as per the extant RBI guidelines or specific RBI directions.
6. translation of foreign currency items Foreign currency income and expenditure items of domestic operations are translated at the exchange rates prevailing
on the date of the transaction. Income and expenditure items of integral foreign operations (representative offices) are translated at daily closing rates, and income and expenditure items of non-integral foreign operations (foreign branches and offshore banking units) are translated at quarterly average closing rates.
Monetary foreign currency assets and liabilities of domestic and integral foreign operations are translated at closing exchange rates notified by Foreign Exchange Dealers’ Association of India (FEDAI) relevant to the balance sheet date and the resulting gains/losses are recognised in the profit and loss account.
Both monetary and non-monetary foreign currency assets and liabilities of non-integral foreign operations are translated at relevant closing exchange rates notified by FEDAI at the balance sheet date and the resulting gains/losses from exchange differences are accumulated in the foreign currency translation reserve until the disposal of the net investment in the non-integral foreign operations. Pursuant to RBI guideline, the Bank does not recognise the cumulative/proportionate amount of such exchange differences as income or expenses, which relate to repatriation of accumulated retained earnings from overseas operations.
Contingent liabilities on account of guarantees, endorsements and other obligations denominated in foreign currencies are disclosed at the closing exchange rates notified by FEDAI relevant to the balance sheet date.
7. Foreign exchange and derivative contracts The forward exchange contracts that are not intended for trading and are entered into to establish the amount of
reporting currency required or available at the settlement date of a transaction are effectively valued at closing spot rate. The premium or discount arising on inception of such forward exchange contracts is amortised over the life of the contract. All other outstanding forward exchange contracts are revalued based on the exchange rates notified by FEDAI for specified maturities and at interpolated rates for contracts of interim maturities. The contracts of longer maturities where exchange rates are not notified by FEDAI are revalued based on the forward exchange rates implied by the swap curves in respective currencies. The resultant gains or losses are recognised in the profit and loss account.
The swap contracts entered to hedge on-balance sheet assets and liabilities are structured such that they bear an opposite and offsetting impact with the underlying on-balance sheet items. The impact of such derivative instruments is correlated with the movement of underlying assets and liabilities and accounted pursuant to the principles of hedge accounting. The Bank identifies the hedged item (asset or liability) at the inception of the transaction itself. Hedge effectiveness is ascertained at the time of the inception of the hedge and periodically thereafter. Hedge swaps are accounted for on an accrual basis and are not marked to market unless their underlying transaction is marked to market. Gains or losses arising from hedge ineffectiveness, if any, are recognised in the Profit and Loss Account. Based on RBI circular issued on June 26, 2019, the accounting of hedge relationships established after June 26, 2019 is in accordance with the Guidance note on Accounting for Derivative Contracts issued by ICAI.
The derivative contracts entered into for trading purposes are marked to market and the resulting gain or loss is accounted for in the profit and loss account. Pursuant to RBI guidelines, any receivables under derivative contracts which remain overdue for more than 90 days and mark-to-market gains on other derivative contracts with the same counter-parties are reversed through profit and loss account.
8. employee Stock Option Scheme (eSOS) The Employees Stock Option Scheme (the Scheme) provides for grant of options on the Bank’s equity shares to
wholetime directors and employees of the Bank and its subsidiaries. The options granted vest in a graded manner and may be exercised within a specified period. The Bank follows the intrinsic value method to account for its stock-based
166
Annual Report 2020-21

FINANCIAL STATEMENTS OF ICICI BANK LIMITED
SChEDuLESforming part of the Accounts (Contd.)
employee compensation plans. Compensation cost is measured as the excess, if any, of the fair market price of the underlying stock over the exercise price on the grant date and amortised over the vesting period. The fair market price is the closing price on the stock exchange with highest trading volume of the underlying shares, immediately prior to the grant date.
9. employee Benefits
Gratuity The Bank pays gratuity, a defined benefit plan, to employees who retire or resign after a minimum prescribed period of
continuous service and in case of employees at overseas locations as per the rules in force in the respective countries. The Bank makes contribution to recognised trust which administers the funds on its own account or through insurance companies.
Actuarial valuation of the gratuity liability is determined by an actuary appointed by the Bank. Actuarial valuation of gratuity liability is determined based on certain assumptions regarding rate of interest, salary growth, mortality and staff attrition as per the projected unit credit method. The actuarial gains or losses arising during the year are recognised in the profit and loss account.
Superannuation Fund and National Pension Scheme The Bank has a superannuation fund, a defined contribution plan, which is managed and administered by insurance
companies. The Bank contributes 15.0% of the total annual basic salary for certain employees to superannuation funds. Further, the Bank contributes upto 10.0% of the total basic salary of certain employees to National Pension Scheme (NPS), a defined contribution plan, which is managed and administered by pension fund management companies. The employees are given an option to receive the amount in cash in lieu of such contributions along with their monthly salary during their employment.
The amounts so contributed/paid by the Bank to the superannuation fund and NPS or to employees during the year are recognised in the profit and loss account. The Bank has no liability towards future benefits under superannuation fund and national pension scheme other than its annual contribution.
Pension The Bank provides for pension, a defined benefit plan, covering eligible employees of erstwhile Bank of Madura,
erstwhile Sangli Bank and erstwhile Bank of Rajasthan. The Bank makes contribution to a trust which administers the funds on its own account or through insurance companies. The plan provides for pension payment including dearness relief on a monthly basis to these employees on their retirement based on the respective employee’s years of service with the Bank and applicable salary.
Actuarial valuation of the pension liability is determined by an actuary appointed by the Bank. Actuarial valuation of pension liability is calculated based on certain assumptions regarding rate of interest, salary growth, mortality and staff attrition as per the projected unit credit method. The actuarial gains or losses arising during the year are recognised in the profit and loss account.
Employees covered by the pension plan are not eligible for employer’s contribution under the provident fund plan.
Provident Fund The Bank is statutorily required to maintain a provident fund, a defined benefit plan, as a part of retirement benefits to
its employees. Each employee contributes a certain percentage of his or her basic salary and the Bank contributes an equal amount for eligible employees. The Bank makes contribution as required by The Employees’ Provident Funds and Miscellaneous Provisions Act, 1952 to Employees’ Pension Scheme administered by the Regional Provident Fund Commissioner. The Bank makes balance contributions to a fund administered by trustees. The funds are invested according to the rules prescribed by the Government of India. The Bank recognises such contribution as an expense in the year in which it is incurred.
Integrated Report Statutory Reports Financial Statements
167

FINANCIAL STATEMENTS OF ICICI BANK LIMITED
SChEDuLESforming part of the Accounts (Contd.)
Interest payable on provident fund should not be lower than the statutory rate of interest declared by the Central Government under the Employees Provident Funds and Miscellaneous Provisions Act, 1952. Actuarial valuation for the interest obligation on the provident fund balances is determined by an actuary appointed by the Bank.
The actuarial gains or losses arising during the year are recognised in the profit and loss account.
The overseas branches of the Bank and its eligible employees contribute a certain percentage of their salary towards respective government schemes as per local regulatory guidelines. The contribution made by the overseas branches is recognised in profit and loss account at the time of contribution.
Compensated absences The Bank provides for compensated absence based on actuarial valuation conducted by an independent actuary.
10. income taxes Income tax expense is the aggregate amount of current tax and deferred tax expense incurred by the Bank. The current
tax expense and deferred tax expense is determined in accordance with the provisions of the Income Tax Act, 1961 and as per Accounting Standard 22 - Accounting for Taxes on Income respectively. Deferred tax adjustments comprise changes in the deferred tax assets or liabilities during the year and change in tax rate.
Deferred tax assets and liabilities are recognised by considering the impact of timing differences between taxable income and accounting income for the current year, and carry forward losses. Deferred tax assets and liabilities are measured using tax rates and tax laws that have been enacted or substantively enacted by the balance sheet date. The impact of changes in deferred tax assets and liabilities is recognised in the profit and loss account.
Deferred tax assets are recognised and re-assessed at each reporting date, based upon management’s judgement as to whether their realisation is considered as reasonably certain. However, in case of unabsorbed depreciation or carried forward loss, deferred tax assets will be recognised only if there is virtual certainty of realisation of such assets.
11. impairment of assets The Bank follows revaluation model of accounting for its premises and the recoverable amount of the revalued assets
is considered to be close to its revalued amount. Accordingly, separate assessment for impairment of premises is not required.
For assets other than premises, the Bank assesses at each balance sheet date whether there is any indication that an asset may be impaired. Impairment loss, if any, is provided in the profit and loss account to the extent the carrying amount of assets exceeds their estimated recoverable amount.
12. provisions, contingent liabilities and contingent assets The Bank estimates the probability of any loss that might be incurred on outcome of contingencies on the basis of
information available up to the date on which the financial statements are prepared. A provision is recognised when an enterprise has a present obligation as a result of a past event and it is probable that an outflow of resources will be required to settle the obligation, in respect of which a reliable estimate can be made. Provisions are determined based on management estimates of amounts required to settle the obligation at the balance sheet date, supplemented by experience of similar transactions. These are reviewed at each balance sheet date and adjusted to reflect the current management estimates. In cases where the available information indicates that the loss on the contingency is reasonably possible but the amount of loss cannot be reasonably estimated, a disclosure to this effect is made in the financial statements. In case of remote possibility neither provision nor disclosure is made in the financial statements. The Bank does not account for or disclose contingent assets, if any.
The Bank estimates the probability of redemption of customer loyalty reward points using an actuarial method by employing an independent actuary and accordingly makes provision for these reward points. Actuarial valuation is determined based on certain assumptions regarding mortality rate, discount rate, cancellation rate and redemption rate.
168
Annual Report 2020-21

FINANCIAL STATEMENTS OF ICICI BANK LIMITED
SChEDuLESforming part of the Accounts (Contd.)
13. earnings per share (epS) Basic earnings per share is calculated by dividing the net profit or loss after tax for the year attributable to equity
shareholders by the weighted average number of equity shares outstanding for the year.
Diluted earnings per share reflect the potential dilution that could occur if contracts to issue equity shares were exercised or converted during the year. Diluted earnings per equity share is computed using the weighted average number of equity shares and dilutive potential equity shares outstanding during the year, except where the results are anti-dilutive.
14. Share issue expenses Share issue expenses are deducted from Share Premium Account in terms of Section 52 of the Companies Act, 2013.
15. Bullion transaction The Bank deals in bullion business on a consignment basis. The bullion is priced to the customers based on the price
quoted by the supplier. The difference between price recovered from customers and cost of bullion is accounted for as commission at the time of sales to the customers. The Bank also deals in bullion on a borrowing and lending basis and the interest expense/income is accounted on accrual basis.
16. lease transactions Lease payments, including cost escalations, for assets taken on operating lease are recognised as an expense in the
profit and loss account over the lease term on straight line basis. The leases of property, plant and equipment, where substantially all of the risks and rewards of ownership are transferred to the Bank are classified as finance lease. Minimum lease payments under finance lease are apportioned between the finance costs and outstanding liability.
17. cash and cash equivalents Cash and cash equivalents include cash in hand, balances with RBI, balances with other banks and money at call and
short notice.
Integrated Report Statutory Reports Financial Statements
169

FINANCIAL STATEMENTS OF ICICI BANK LIMITED
SChEDuLESforming part of the Accounts (Contd.)
ScHedUle 18
nOteS FORminG paRt OF tHe accOUntS
The following disclosures have been made taking into account the requirements of Accounting Standards (ASs) and Reserve Bank of India (RBI) guidelines.
1. earnings per share Basic and diluted earnings per equity share are computed in accordance with AS 20 – Earnings per share. Basic
earnings per equity share is computed by dividing net profit/(loss) after tax by the weighted average number of equity shares outstanding during the year. Diluted earnings per equity share is computed using the weighted average number of equity shares and weighted average number of dilutive potential equity shares outstanding during the year.
The following table sets forth, for the periods indicated, the computation of earnings per share.
` in million, except per share data
particularsYear ended
march 31, 2021Year ended
march 31, 2020Net profit/(loss) attributable to equity share holders 161,926.8 79,308.1
Nominal value per share (`) 2.00 2.00
Basic earnings per share (`) 24.01 12.28
Effect of potential equity shares (`) (0.34) (0.20)
Diluted earnings per share (`)1 23.67 12.08
Reconciliation between weighted shares used in computation of basic and diluted earnings per share
Basic weighted average number of equity shares outstanding 6,743,363,854 6,460,003,715
Add: Effect of potential equity shares 98,497,002 106,767,566
Diluted weighted average number of equity shares outstanding 6,841,860,856 6,566,771,281
1. The dilutive impact is due to options granted to employees by the Bank.
2. Business/information ratios The following table sets forth, for the periods indicated, the business/information ratios.
Sr. no.
particularsYear ended
march 31, 2021Year ended
march 31, 20201. Interest income to working funds1 6.95% 7.68%
2. Non-interest income to working funds1 1.67% 1.69%
3. Operating profit to working funds1,2 3.20% 2.88%
4. Return on assets3 1.42% 0.81%
5. Net profit/(loss) per employee4 (` in million) 1.7 0.8
6. Business (average deposits plus average advances) per employee4,5
(` in million) 149.2 127.5
1. For the purpose of computing the ratio, working funds represent the monthly average of total assets computed for reporting dates of Form X submitted to RBI under Section 27 of the Banking Regulation Act, 1949.
2. Operating profit is profit for the year before provisions and contingencies. 3. For the purpose of computing the ratio, assets represent the monthly average of total assets computed for reporting dates of Form
X submitted to RBI under Section 27 of the Banking Regulation Act, 1949. 4. Computed based on average number of employees which include sales executives, employees on fixed term contracts and interns. 5. The average deposits and the average advances represent the simple average of the figures reported in Form A to RBI under
Section 42(2) of the Reserve Bank of India Act, 1934.
170
Annual Report 2020-21

FINANCIAL STATEMENTS OF ICICI BANK LIMITED
SChEDuLESforming part of the Accounts (Contd.)
3. capital adequacy ratio The Bank is subject to the Basel III capital adequacy guidelines stipulated by RBI with effect from April 1, 2013. The
guidelines provide a transition schedule for Basel III implementation till March 31, 2021. As per the guidelines, the Tier-1 capital is made up of Common Equity Tier-1 (CET1) and Additional Tier-1.
At March 31, 2021, Basel III guidelines require the Bank to maintain a minimum Capital to Risk-Weighted Assets Ratio (CRAR) of 11.08% with minimum CET1 CRAR of 7.58% and minimum Tier-1 CRAR of 9.08%. The minimum total CRAR, Tier-1 CRAR and CET1 CRAR requirement include capital conservation buffer of 1.88% and additional capital requirement of 0.20% on account of the Bank being designated as Domestic Systemically Important Bank.
The following table sets forth, for the periods indicated, computation of capital adequacy as per Basel III framework.
` in million, except percentages
particularsat
march 31, 2021at
march 31, 2020CET1 CRAR (%) 16.80% 13.39%
Tier-1 CRAR (%) 18.06% 14.72%
Tier-2 CRAR (%) 1.06% 1.39%
Total CRAR (%) 19.12% 16.11%
Amount of equity capital raised1 150,000.0 -
Amount of Additional Tier-1 capital raised; of which
1. Perpetual Non-Cumulative Preference Shares - -
2. Perpetual Debt Instruments - -
Amount of Tier-2 capital raised; of which
1. Debt Capital Instruments - 9,450.0
2. Preference Share Capital Instruments [Perpetual Cumulative Preference Shares (PCPS)/Redeemable Non-
Cumulative Preference Shares (RNCPS)/Redeemable Cumulative Preference Shares (RCPS)]
- -
1. Additionally ` 5,306.3 million raised pursuant to exercise of employee stock options during the year ended March 31, 2021 (year ended March 31, 2020: ` 5,505.1 million).
4. liquidity coverage ratio The Basel Committee on Banking Supervision (BCBS) had introduced the liquidity coverage ratio (LCR) in order to
ensure that a bank has an adequate stock of unencumbered high quality liquid assets (HQLA) to survive a significant liquidity stress lasting for a period of 30 days. LCR is defined as a ratio of HQLA to the total net cash outflows estimated for the next 30 calendar days. As per the RBI guidelines, the minimum LCR required to be maintained by banks effective from January 1, 2019 is 100.0%. In order to accommodate the burden on banks’ cash flows on account of the Covid-19 pandemic, RBI permitted banks to maintain LCR at 80.0% with effect from April 17, 2020, 90.0% from October 1, 2020 and 100.0% from April 1, 2021.
Integrated Report Statutory Reports Financial Statements
171

FINANCIAL STATEMENTS OF ICICI BANK LIMITED
SChEDuLESforming part of the Accounts (Contd.)
The
follo
win
g ta
ble
s se
t fo
rth,
for t
he p
erio
ds
ind
icat
ed, t
he q
uart
erly
ave
rage
of u
nwei
ghte
d a
nd w
eigh
ted
val
ues
of t
he L
CR
of t
he B
ank.
The
sim
ple
av
erag
e ha
s b
een
com
put
ed b
ased
on
dai
ly v
alue
s. `
in m
illio
n
Sr.
n
o.
par
ticu
lars
thr
ee m
ont
hs e
nded
m
arch
31,
202
1t
hree
mo
nths
end
ed
mar
ch 3
1, 2
020
thr
ee m
ont
hs e
nded
d
ecem
ber
31,
202
0t
hree
mo
nths
end
ed
Sep
tem
ber
30,
202
0t
hree
mo
nths
end
ed J
une
30, 2
020
tota
lun
wei
ghte
d
valu
e (a
vera
ge)
to
tal
wei
ghte
d
valu
e (a
vera
ge)
tota
lun
wei
ghte
d
valu
e (a
vera
ge)
to
tal
wei
ghte
d
valu
e (a
vera
ge)
tota
l un
wei
ghte
d
valu
e (a
vera
ge)
to
tal
wei
ghte
d
valu
e (a
vera
ge)
tota
l un
wei
ghte
d
valu
e (a
vera
ge)
to
tal
wei
ghte
d
valu
e (a
vera
ge)
tota
l un
wei
ghte
d
valu
e (a
vera
ge)
to
tal
wei
ghte
d
valu
e (a
vera
ge)
Hig
h q
ualit
y liq
uid
ass
ets
1.To
tal h
igh
qua
lity
liqui
d a
sset
sn
.a.
2,76
7,44
3.6
N.A
.1,
827,
380.
8N
.A.
2,72
9,88
6.5
N.A
.2,
685,
953.
6N
.A.
2,48
1,87
6.6
cas
h o
utfl
ow
s
2.R
etai
l dep
osi
ts a
nd d
epo
sits
fro
m s
mal
l b
usin
ess
cust
om
ers,
of w
hich
:5,
392,
909.
344
7,80
2.9
4,28
7,87
1.7
369,
466.
75,
169,
064.
642
7,29
5.7
4,91
8,17
1.7
405,
457.
54,
680,
378.
838
5,08
8.5
(i)S
tab
le d
epo
sits
1,82
9,76
0.4
91,4
88.0
1,18
6,40
9.5
59,3
20.5
1,79
2,21
4.2
89,6
10.7
1,72
7,19
2.8
86,3
59.6
1,65
8,98
9.0
82,9
49.5
(ii)
Less
sta
ble
dep
osi
ts3,
563,
148.
935
6,31
4.9
3,10
1,46
2.2
310,
146.
23,
376,
850.
433
7,68
5.0
3,19
0,97
8.9
319,
097.
93,
021,
389.
830
2,13
9.0
3.U
nsec
ured
who
lesa
le fu
ndin
g, o
f whi
ch:
2,81
7,20
0.6
1,51
5,03
9.4
2,14
4,02
7.5
1,03
3,80
1.0
2,60
3,96
0.9
1,38
8,69
4.8
2,51
9,57
2.4
1,31
9,52
5.7
2,43
9,15
6.6
1,27
6,78
9.0
(i)O
per
atio
nal d
epo
sits
(a
ll co
unte
rpar
ties)
--
544,
448.
713
6,11
2.2
--
--
--
(ii)
No
n-o
per
atio
nal d
epo
sits
(all
coun
terp
artie
s)2,
801,
735.
11,
499,
573.
91,
505,
459.
580
3,56
9.5
2,56
5,60
2.6
1,35
0,33
6.5
2,47
7,19
4.9
1,27
7,14
8.2
2,39
5,47
2.8
1,23
3,10
5.2
(iii)
Uns
ecur
ed d
ebt
15,4
65.5
15,4
65.5
94,1
19.3
94,1
19.3
38,3
58.3
38,3
58.3
42,3
77.5
42,3
77.5
43,6
83.8
43,6
83.8
4.S
ecur
ed w
hole
sale
fund
ing
n.a
.-
N.A
.-
N.A
.-
N.A
.-
N.A
.35
.4
5.A
dd
itio
nal r
equi
rem
ents
, of w
hich
:34
3,75
4.5
134,
921.
830
4,36
7.8
105,
629.
732
5,36
8.7
127,
991.
530
7,43
7.3
123,
675.
030
4,56
1.3
124,
367.
4
(i)O
utflo
ws
rela
ted
to d
eriv
ativ
e ex
po
sure
s an
d o
ther
co
llate
ral r
equi
rem
ents
104,
742.
910
4,74
2.9
77,0
21.2
77,0
21.2
99,3
51.5
99,3
51.5
97,0
48.9
97,0
48.9
96,1
60.1
96,1
60.1
(ii)
Out
flow
s re
late
d to
loss
of f
und
ing
on
deb
t pro
duc
ts15
5.2
155.
218
8.0
188.
014
4.3
144.
313
7.4
137.
494
.594
.5
(iii)
Cre
dit
and
liq
uid
ity
Faci
litie
s23
8,85
6.4
30,0
23.7
227,
158.
628
,420
.522
5,87
2.9
28,4
95.7
210,
251.
026
,488
.720
8,30
6.7
28,1
12.8
6.O
ther
co
ntra
ctua
l fun
din
g o
blig
atio
ns21
9,03
3.2
219,
033.
215
8,05
9.6
158,
059.
619
4,94
7.8
194,
947.
816
1,54
5.4
161,
545.
413
4,69
1.8
134,
691.
8
7.O
ther
co
ntin
gent
fund
ing
ob
ligat
ions
3,25
5,89
5.0
138,
972.
92,
766,
693.
111
1,72
7.6
3,02
3,08
7.4
127,
603.
72,
908,
001.
512
1,26
7.5
2,90
2,56
5.4
120,
422.
1
8.t
ota
l cas
h o
utfl
ow
sn
.a.
2,45
5,77
0.2
n.a
.1,
778,
684.
6n
.a.
2,26
6,53
3.5
n.a
.2,
131,
471.
1n
.a.
2,04
1,39
4.2
9.S
ecur
ed le
ndin
g (e
.g. r
ever
se r
epo
s)36
0,13
4.0
9.0
132,
524.
03.
551
2,76
0.6
7.2
464,
875.
410
.146
8,47
2.0
5.6
10.
Inflo
ws
fro
m fu
lly p
erfo
rmin
g ex
po
sure
s52
0,37
0.5
397,
448.
138
1,80
3.1
282,
842.
345
9,36
2.5
354,
307.
539
7,03
4.9
297,
212.
139
7,79
2.6
296,
587.
8
11.
Oth
er c
ash
inflo
ws
80,4
50.7
54,7
60.8
63,0
38.4
38,4
16.1
70,7
74.2
46,5
30.3
70,3
44.7
47,0
62.1
68,1
05.8
44,5
11.5
12.
to
tal c
ash
infl
ow
s96
0,95
5.2
452,
217.
957
7,36
5.5
321,
261.
91,
042,
897.
340
0,84
5.0
932,
255.
034
4,28
4.3
934,
370.
434
1,10
4.9
13.
to
tal H
Qla
n.a
.2,
767,
443.
6n
.a.
1,82
7,38
0.8
n.a
.2,
729,
886.
5n
.a.
2,68
5,95
3.6
n.a
.2,
481,
876.
6
14.
Tota
l net
cas
h o
utflo
ws
(8)-
(12)
n.a
.2,
003,
552.
3N
.A.
1,45
7,42
2.7
N.A
.1,
865,
688.
5N
.A.
1,78
7,18
6.8
N.A
.1,
700,
289.
3
15.
liq
uid
ity
cove
rage
rat
io (
%)
n.a
.13
8.13
%n
.a.
125.
38%
n.a
.14
6.32
%n
.a.
150.
29%
n.a
.14
5.97
%
172
Annual Report 2020-21

FINANCIAL STATEMENTS OF ICICI BANK LIMITED
SChEDuLESforming part of the Accounts (Contd.)
Liquidity of the Bank is managed by the Asset Liability Management Group (ALMG) under the central oversight of the Asset Liability Management Committee (ALCO). For the domestic operations of the Bank, ALMG-India is responsible for the overall management of liquidity. For the overseas branches of the Bank, a decentralised approach is followed for day-to-day liquidity management, while a centralised approach is followed for long-term funding in co-ordination with Head-Office. Liquidity in the overseas branches is maintained taking into consideration both host country and the RBI regulations.
The Bank during the three months ended March 31, 2021 maintained average HQLA (after haircut) of ` 2,767,443.6 million (March 31, 2020: ` 1,827,380.8 million) against the average HQLA requirement of ` 1,803,197.1 million (March 31, 2020: ` 1,457,422.7 million) at minimum LCR requirement of 90.0% (March 31, 2020: 100.0%). HQLA primarily includes government securities in excess of minimum statutory liquidity ratio (SLR) and to the extent allowed under marginal standing facility (MSF) and facility to avail liquidity for LCR (FALLCR) of ` 2,320,760.1 million (March 31, 2020: ` 1,600,071.6 million).
RBI permitted banks to reckon an additional 0.5% of their Net Demand and Time Liabilities (NDTL) with effect from April 1, 2020 under FALLCR within the mandatory Statutory Liquidity Requirement (SLR), as level 1 high quality liquid assets (HQLA) for the purpose of computing their LCR. Hence, the carve-out from SLR under FALLCR is 15.0% compared to 14.5% as of March 31, 2020. RBI allowed banks to continue with the increased limits of 3.0% for Marginal Standing Facility (MSF) under which banks can borrow overnight at their discretion by dipping into their SLR till September 30, 2021. This takes the total carve out from SLR available to banks at 18.0% of their NDTL including 3.0% of MSF. Additionally, cash, balance in excess of cash reserve requirement with RBI and balances with central banks of countries where the Bank’s branches are located amounted to ` 241,664.2 million (March 31, 2020: ` 135,769.6 million). Further, average level 2 assets primarily consisting of AA- and above rated corporate bonds and commercial papers, amounted to ` 83,472.8 million (March 31, 2020: ` 59,552.0 million).
At March 31, 2021, top liability products/instruments and their percentage contribution to the total liabilities of the Bank were term deposits 40.71% (March 31, 2020: 38.53%), savings account deposits 24.01% (March 31, 2020: 22.36%), current account deposits 11.07% (March 31, 2020: 9.31%) and bond borrowings 4.41% (March 31, 2020: 6.47%). Top 20 depositors constituted 5.38% (March 31, 2020: 4.88%) of total deposits of the Bank at March 31, 2021. Further, the total borrowings mobilised from significant counterparties (from whom the funds borrowed were more than 1.00% of the Bank’s total liabilities) were 1.43% (March 31, 2020: 6.67%) of the total liabilities of the Bank at March 31, 2021.
The weighted cash outflows are primarily driven by unsecured wholesale funding which includes operational deposits, non-operational deposits and unsecured debt. During the three months ended March 31, 2021, unsecured wholesale funding contributed 61.69% (March 31, 2020: 58.12%) of the total weighted cash outflows. The non-operational deposits include term deposits with premature withdrawal facility. Based on discussions with the RBI, the Bank has re-classified ‘Operational Deposits’ as ‘Non-operational Deposits’ with effect from March 31, 2020. Retail deposits including deposits from small business customers and other contingent funding obligations contributed 18.23% (March 31, 2020: 20.77%) and 5.66% (March 31, 2020: 6.28%) of the total weighted cash outflows, respectively. The other contingent funding obligations primarily include bank guarantees (BGs) and letters of credit (LCs) issued on behalf of the Bank’s clients.
RBI through its circular dated March 27, 2020 permitted banks to grant a moratorium to their customers on the payment of instalments and/or interest, falling due between March 1, 2020 and May 31, 2020. This period was extended by RBI till August 31, 2020 through its circular dated May 23, 2020. The Bank extended the moratorium to borrowers in accordance with its Board approved policies. The LCR computation includes the impact of the moratorium as implemented in the Bank’s systems.
In view of the margin rules for non-centrally cleared derivative transactions issued by the Basel Committee on Banking Supervision and discussion paper issued by the RBI, certain derivative transactions would be subject to margining and consequent collateral exchange would be as governed by Credit Support Annex (CSA). The Bank has entered into CSAs which would require maintenance of collateral. The Bank considers the increased liquidity requirement
Integrated Report Statutory Reports Financial Statements
173

FINANCIAL STATEMENTS OF ICICI BANK LIMITED
SChEDuLESforming part of the Accounts (Contd.)
on account of valuation changes in the transactions settled through Qualified Central Counterparties (QCCP) in India including the Clearing Corporation of India (CCIL) and other exchange houses as well as for transactions covered under CSAs. The potential outflows on account of such transactions have been considered based on the look-back approach prescribed in the RBI guidelines.
The average LCR of the Bank for the three months ended March 31, 2021 was 138.13% (March 31, 2020: 125.38%). During the three months ended March 31, 2021, other than Indian Rupee, USD was the only significant foreign currency which constituted more than 5.00% of the balance sheet size of the Bank. The average LCR of the Bank for USD currency, computed based on daily LCR values, was 333.26% for the three months ended March 31, 2021 (March 31, 2020: 52.44%).
5. information about business and geographical segments Business Segments Pursuant to the guidelines issued by RBI on AS 17 - Segment Reporting - Enhancement of Disclosures dated April 18,
2007, effective from year ended March 31, 2008, the following business segments have been reported.
• Retail Banking includes exposures which satisfy the four criteria of orientation, product, granularity and low value of individual exposures for retail exposures laid down in Basel Committee on Banking Supervision (BCBS) document ‘International Convergence of Capital Measurement and Capital Standards: A Revised Framework’. This segment also includes income from credit cards, debit cards, third party product distribution and the associated costs.
• Wholesale Banking includes all advances to trusts, partnership firms, companies and statutory bodies, which are not included under Retail Banking.
• treasury includes the entire investment and derivative portfolio of the Bank.
• Other Banking includes leasing operations and other items not attributable to any particular business segment.
• Unallocated includes items such as tax paid in advance net of provision, deferred tax and provisions to the extent reckoned at the entity level.
Income, expenses, assets and liabilities are either specifically identified with individual segments or are allocated to segments on a systematic basis.
All liabilities are transfer priced to a central treasury unit, which pools all funds and lends to the business units at appropriate rates based on the relevant maturity of assets being funded after adjusting for regulatory reserve requirements.
The transfer pricing mechanism of the Bank is periodically reviewed. The segment results are determined based on the transfer pricing mechanism prevailing for the respective reporting periods.
174
Annual Report 2020-21

FINANCIAL STATEMENTS OF ICICI BANK LIMITED
SChEDuLESforming part of the Accounts (Contd.)
The following tables set forth, for the periods indicated, the business segment results on this basis.
` in million
Sr. no.
particulars
For the year ended march 31, 2021
Retail Banking
Wholesale Banking
treasuryOther
Banking Business
total
1. Revenue 756,692.9 371,945.2 668,735.9 14,890.3 1,812,264.32. Less: Inter-segment revenue 831,396.33. Total revenue (1)-(2) 980,868.04. Segment results 77,399.7 58,199.5 110,803.7 2,924.3 249,327.25. Unallocated expenses 47,500.06. Operating profit (4)-(5) 201,827.27. Income tax expenses
(including deferred tax credit) 39,900.48. net profit/(loss) (6)-(7) 161,926.89. Segment assets 4,124,986.5 3,259,375.0 4,597,998.9 188,139.9 12,170,500.310. Unallocated assets 133,826.511. total assets (9)+(10) 12,304,326.812. Segment liabilities 6,869,207.9 2,821,639.2 2,475,854.01 75,021.1 12,241,722.213. Unallocated liabilities 62,604.614. total liabilities (12)+(13) 12,304,326.815. Capital expenditure 9,228.1 4,745.0 866.6 222.3 15,062.016. Depreciation 7,249.4 2,859.8 481.0 127.7 10,717.9
1. Includes share capital and reserves and surplus.
` in million
Sr. no.
particulars
For the year ended march 31, 2020
Retail Banking
Wholesale Banking
treasuryOther
Banking Business
total
1. Revenue 725,542.4 399,423.4 619,292.6 16,710.1 1,760,968.52. Less: Inter-segment revenue 848,499.13. Total revenue (1)-(2) 912,469.44. Segment results 89,930.2 9,272.3 50,550.9 5,831.9 155,585.35. Unallocated expenses 15,104.96. Operating profit (4)-(5) 140,480.47. Income tax expenses
(including deferred tax credit) 61,172.38. net profit/(loss) (6)-(7) 79,308.19. Segment assets 3,513,412.1 3,073,070.6 4,131,058.3 117,410.5 10,834,951.510. Unallocated assets 148,700.011. total assets (9)+(10) 10,983,651.512. Segment liabilities 5,732,467.7 2,307,128.6 2,877,977.61 50,972.7 10,968,546.613. Unallocated liabilities 15,104.914. total liabilities (12)+(13) 10,983,651.515. Capital expenditure 9,947.7 3,008.0 - 121.7 13,077.416. Depreciation 6,865.4 2,515.8 0.4 103.8 9,485.4
1. Includes share capital and reserves and surplus.
Integrated Report Statutory Reports Financial Statements
175

FINANCIAL STATEMENTS OF ICICI BANK LIMITED
SChEDuLESforming part of the Accounts (Contd.)
Geographical segments The Bank reports its operations under the following geographical segments.
• domestic operations comprise branches in India.
• Foreign operations comprise branches outside India and offshore banking units in India.
The following tables set forth, for the periods indicated, geographical segment results.` in million
RevenuesYear ended
march 31, 2021Year ended
march 31, 2020
Domestic operations 963,482.4 879,210.2
Foreign operations 17,385.6 33,259.2
total 980,868.0 912,469.4
` in million
assetsat
march 31, 2021at
march 31, 2020
Domestic operations 11,312,467.2 10,075,025.4
Foreign operations 858,033.1 759,926.1
total 12,170,500.3 10,834,951.5
1. Segment assets do not include tax paid in advance/tax deducted at source (net) and deferred tax assets (net).
The following table sets forth, for the periods indicated, capital expenditure and depreciation thereon for the geographical segments.
` in million
particularscapital expenditure incurred during depreciation provided during
Year ended march 31, 2021
Year ended march 31, 2020
Year ended march 31, 2021
Year ended march 31, 2020
Domestic operations 14,948.5 12,929.2 10,633.0 9,390.5
Foreign operations 113.5 148.2 84.9 94.9
total 15,062.0 13,077.4 10,717.9 9,485.4
176
Annual Report 2020-21

FINANCIAL STATEMENTS OF ICICI BANK LIMITED
SChEDuLESforming part of the Accounts (Contd.)
6. maturity pattern The following table sets forth, the maturity pattern of assets and liabilities of the Bank at March 31, 2021.
` in million
maturity buckets loans & advances1
investment securities1 deposits1 Borrowings1
total foreign currency
assets2
total foreign currency
liabilities2
Day 1 11,625.4 923,302.8 155,016.2 1,176.4 416,573.0 5,209.2
2 to 7 days 64,049.3 79,752.3 662,866.8 6,429.9 179,976.7 9,616.6
8 to 14 days 95,261.8 53,445.9 243,908.6 11,627.5 52,342.0 48,587.3
15 to 30 days 138,736.2 62,359.9 182,399.2 8,334.7 63,326.9 17,081.5
31 days to 2 months 295,311.6 50,560.3 227,386.8 8,173.9 93,017.8 13,975.1
2 to 3 months 332,684.1 52,067.9 205,901.2 13,527.3 63,173.6 25,236.4
3 to 6 months 634,526.1 106,729.7 397,960.0 43,023.9 142,099.4 76,162.7
6 months to 1 year 820,003.2 146,590.9 554,556.5 91,673.0 54,733.3 77,807.0
1 to 3 years 2,128,346.6 309,172.9 943,199.5 382,981.3 84,860.6 205,856.5
3 to 5 years 1,343,088.9 444,417.0 2,873,145.6 222,109.0 46,764.3 115,081.9
Above 5 years 1,473,657.7 584,465.8 2,878,881.2 127,252.7 72,127.3 44,573.8
total 7,337,290.9 2,812,865.4 9,325,221.6 916,309.6 1,268,994.9 639,188.0
1. Includes foreign currency balances. 2. Excludes off-balance sheet assets and liabilities.
The following table sets forth, the maturity pattern of assets and liabilities of the Bank at March 31, 2020.
` in million
maturity buckets loans & advances1
investment securities1 deposits1 Borrowings1
total foreign currency
assets2
total foreign currency
liabilities2
Day 1 11,545.6 424,201.1 104,112.9 23.3 148,734.4 2,869.5
2 to 7 days 62,304.8 364,822.8 495,047.4 293,297.2 71,886.0 11,566.8
8 to 14 days 55,447.1 68,372.1 171,058.4 6,109.9 27,543.7 14,014.4
15 to 30 days 164,151.7 119,448.9 181,814.1 23,223.8 62,847.9 30,543.9
31 days to 2 months 256,526.1 40,812.4 222,943.8 56,570.3 78,131.6 50,437.0
2 to 3 months 279,769.8 44,824.0 208,082.0 52,598.0 70,967.2 53,050.5
3 to 6 months 541,868.9 100,318.4 443,819.8 174,114.4 120,048.4 155,079.8
6 months to 1 year 759,712.7 206,105.1 650,135.3 183,247.6 108,463.0 160,314.7
1 to 3 years 1,774,409.2 309,197.7 852,551.4 400,043.9 160,364.5 251,961.6
3 to 5 years 1,065,080.9 330,213.0 2,192,221.7 237,212.0 64,548.6 68,037.8
Above 5 years 1,482,082.9 486,999.3 2,187,903.1 202,527.2 122,635.5 124,329.8
total 6,452,899.7 2,495,314.8 7,709,689.9 1,628,967.6 1,036,170.8 922,205.8
1. Includes foreign currency balances. 2. Excludes off-balance sheet assets and liabilities.
The estimates and assumptions used by the Bank for classification of assets and liabilities under the different maturity buckets are based on the returns submitted to RBI for the relevant periods.
Integrated Report Statutory Reports Financial Statements
177

FINANCIAL STATEMENTS OF ICICI BANK LIMITED
SChEDuLESforming part of the Accounts (Contd.)
7. employee Stock Option Scheme (eSOS) In terms of the ESOS, as amended, the maximum number of options granted to any eligible employee in a financial
year shall not exceed 0.05% of the issued equity shares of the Bank at the time of grant of the options and aggregate of all such options granted to the eligible employees shall not exceed 10% of the aggregate number of the issued equity shares of the Bank on the date(s) of the grant of options in line with SEBI Regulations. Under the stock option scheme, eligible employees are entitled to apply for equity shares. In April 2016, exercise period was modified from 10 years from the date of grant or five years from the date of vesting, whichever is later, to 10 years from the date of vesting of options. In June 2017, exercise period was further modified to not exceed 10 years from the date of vesting of options as may be determined by the Board Governance, Remuneration & Nomination Committee to be applicable for future grants. In May 2018, exercise period was further modified to not exceed 5 years from the date of vesting of options as may be determined by the Board Governance, Remuneration & Nomination Committee to be applicable for future grants.
Options granted after March 2014 vest in a graded manner over a three-year period with 30%, 30% and 40% of the grant vesting in each year, commencing from the end of 12 months from the date of grant other than certain options granted in April 2014 which vested to the extent of 50% on April 30, 2017 and the balance on April 30, 2018 and option granted in September 2015 which vested to the extent of 50% on April 30, 2018 and balance 50% vested on April 30, 2019. Options granted in January 2018 would vest at the end of four years from the date of grant. Certain options granted in May 2018, would vest to the extent of 50% on May 2021 and balance 50% would vest on May 2022.
Options granted prior to March 2014 except mentioned below, vested in a graded manner over a four-year period, with 20%, 20%, 30% and 30% of the grants vesting in each year, commencing from the end of 12 months from the date of grant. Options granted in April 2009 vested in a graded manner over a five-year period with 20%, 20%, 30% and 30% of grant vesting each year, commencing from the end of 24 months from the date of grant. Options granted in September 2011 vested in a graded manner over a five-year period with 15%, 20%, 20% and 45% of grant vesting each year, commencing from the end of 24 months from the date of the grant.
The exercise price of the Bank’s options, except mentioned below, is the last closing price on the stock exchange, which recorded highest trading volume preceding the date of grant of options. In February 2011, the Bank granted 16,692,500 options to eligible employees and whole-time Directors of the Bank and certain of its subsidiaries at an exercise price of ` 175.82. This exercise price was the average closing price on the stock exchange during the six months ended October 28, 2010. Of these options granted, 50% vested on April 30, 2014 and the balance 50% vested on April 30, 2015.
Based on intrinsic value of options, no compensation cost was recognised during the year ended March 31, 2021 (year ended March 31, 2020: Nil). If the Bank had used the fair value of options based on binomial tree model, compensation cost in the year ended March 31, 2021 would have been higher by ` 3,949.7 million (year ended March 31, 2020: ` 3,826.2 million) and proforma profit after tax would have been ` 157,977.1 million (year ended March 31, 2020: ̀ 75,481.9 million). On a proforma basis, the Bank’s basic and diluted earnings per share would have been ` 23.43 (year ended March 31, 2020: ` 11.68) and ` 23.09 (year ended March 31, 2020: ` 11.49) respectively for the year ended March 31, 2021. The weighted average fair value of options granted during the year ended March 31, 2021 was ` 125.44 (year ended March 31, 2020: ` 149.62).
The following table sets forth, for the periods indicated, the key assumptions used to estimate the fair value of options granted.
particularsYear ended
march 31, 2021Year ended
march 31, 2020Risk-free interest rate 4.83% to 5.74% 6.18% to 7.62%
Expected Term 3.45 to 5.45 years 3.46 to 5.46 years
Expected volatility 35.19% to 37.31% 29.06% to 31.17%
Expected dividend yield 0.26% to 0.30% 0.19% to 0.37%
178
Annual Report 2020-21

FINANCIAL STATEMENTS OF ICICI BANK LIMITED
SChEDuLESforming part of the Accounts (Contd.)
Risk free interest rates over the expected term of the option are based on the government securities yield in effect at the time of the grant. The expected term of an option is estimated based on the vesting term as well as expected exercise behavior of the employees who receive the option. Expected exercise behavior is estimated based on the historical stock option exercise pattern of the Bank. Expected volatility during the estimated expected term of the option is based on historical volatility determined based on observed market prices of the Bank’s publicly traded equity shares. Expected dividends during the estimated expected term of the option are based on recent dividend activity.
The following table sets forth, for the periods indicated, the summary of the status of the Bank’s stock option plan.
` except number of options
particulars
Stock options outstanding
Year ended march 31, 2021 Year ended march 31, 2020
number of options
Weighted average
exercise price
number of options
Weighted average
exercise priceOutstanding at the beginning of the year 238,286,5731 261.89 232,427,774 235.40Add: Granted during the year 33,417,700 337.73 34,288,4001 402.16Less: Lapsed during the year, net of re-issuance 880,530 336.57 1,904,0512 316.72Less: Exercised during the year 24,232,771 218.81 26,525,550 207.09Outstanding at the end of the year 246,590,9721 276.14 238,286,5731 261.89Options exercisable 177,136,942 247.45 169,975,899 231.93
1. Includes options pertaining to Whole-time Directors of ICICI Bank and its subsidiaries, which are pending for regulatory approval.
2. Includes options pertaining to Whole-time Directors adjusted after the subsequent RBI approval for a revised number of options.
The following table sets forth, the summary of stock options outstanding at March 31, 2021.
Range of exercise price (` per share)
number of shares arising out of options
Weighted average exercise price
(` per share)
Weighted average remaining contractual life
(number of years)60-99 976,475 78.93 2.16100-199 16,411,432 166.35 3.18200-299 162,464,016 250.16 6.21300-399 33,977,600 337.53 6.23400-499 32,705,449 401.96 5.22500-599 56,000 527.70 5.92
The following table sets forth, the summary of stock options outstanding at March 31, 2020.
Range of exercise price (` per share)
number of shares arising out of options
Weighted average exercise price
(` per share)
Weighted average remaining contractual life
(number of years)60-99 1,173,325 79.11 2.86100-199 24,177,234 166.55 3.58200-299 178,395,914 249.22 7.15300-399 901,900 329.89 7.90400-499 33,582,200 401.96 6.20500-599 56,000 527.70 6.92
The options were exercised regularly throughout the period and weighted average share price as per National Stock Exchange price volume data during the year ended March 31, 2021 was ` 437.92 (year ended March 31, 2020: ` 451.25).
Integrated Report Statutory Reports Financial Statements
179

FINANCIAL STATEMENTS OF ICICI BANK LIMITED
SChEDuLESforming part of the Accounts (Contd.)
8. Subordinated debt During the year ended March 31, 2021 and March 31, 2020, the Bank did not raise subordinated debt bonds qualifying
for Additional Tier-1 capital.
During the year ended March 31, 2021, the Bank did not raise subordinated debt bonds qualifying for Tier-2 capital.
The following table sets forth, the details of subordinated debt bonds qualifying for Tier-2 capital raised during the year ended March 31, 2020.
` in million
particulars date of issue coupon Rate (%) tenure amount
Subordinated Tier-2 February 17, 2020 7.70% (annually) 10 years1 9,450.0
1. Call option exercisable on February 17, 2025 and on every interest payment date thereafter (exercisable with RBI approval).
9. Repurchase transactions The following tables set forth for the periods indicated, the details of securities sold and purchased under repo and
reverse repo transactions respectively including transactions under Liquidity Adjustment Facility (LAF) and Marginal Standing Facility (MSF).
` in million
Sr. no.
particulars
minimum outstanding
balance during the
maximum outstanding
balance during the
daily average outstanding
balance during the
Outstanding balance at march 31,
2021Year ended march 31, 2021
Securities sold under Repo, LAF and MSF
i) Government Securities - 535,934.0 336,865.4 4,831.6
ii) Corporate Debt Securities - 1,756.2 380.2 -
iii) Any other securities - - - -
Securities purchased under Reverse Repo and LAF
i) Government Securities 41,890.0 750,500.0 457,958.6 352,340.0
ii) Corporate Debt Securities - 2,000.0 52.1 -
iii) Any other securities - - - -
1. Amounts reported are based on face value of securities under Repo and Reverse repo. 2. Amounts reported are based on lending/borrowing amount under LAF and MSF. 3. Includes tri-party repo transactions.
180
Annual Report 2020-21

FINANCIAL STATEMENTS OF ICICI BANK LIMITED
SChEDuLESforming part of the Accounts (Contd.)
` in million
Sr. no.
particulars
minimum outstanding
balance during the
maximum outstanding
balance during the
daily average outstanding
balance during the
Outstanding balance at march 31,
2020Year ended march 31, 2020
Securities sold under Repo, LAF and MSF
i) Government Securities - 390,007.7 93,978.5 340,756.8
ii) Corporate Debt Securities - - - -
iii) Any other securities - - - -
Securities purchased under Reverse Repo and LAF
i) Government Securities - 797,051.8 71,637.8 638,951.8
ii) Corporate Debt Securities - 1,000.0 27.3 -
iii) Any other securities - - - -
1. Amounts reported are based on face value of securities under Repo and Reverse repo. 2. Amounts reported are based on lending/borrowing amount under LAF and MSF. 3. Includes tri-party repo transactions.
10. investments The following table sets forth, for the periods indicated, the details of investments and the movement of provision
held towards depreciation on investments of the Bank. ` in million
Sr. no.
particularsat
march 31, 2021at
march 31, 20201. Value of investments
i) Gross value of investments
a) In India 2,655,692.4 2,472,213.9
b) Outside India 206,964.2 81,130.3
ii) Provision for depreciation
c) In India (48,684.8) (56,623.2)
d) Outside India (1,106.4) (1,406.2)
iii) Net value of investments
e) In India 2,607,007.6 2,415,590.7
f) Outside India 205,857.8 79,724.1
2. movement of provisions held towards depreciation on investments
i) Opening balance 58,029.4 49,936.6
ii) Add: Provisions made during the year 5,630.4 13,244.4
iii) Less: Write-off/write-back of excess provisions during the year (13,868.6) (5,151.6)
iv) Closing balance 49,791.2 58,029.4
During the year ended March 31, 2021 the Bank sold approximately 1.50% equity shares in ICICI Prudential Life Insurance Company Limited, 3.96% equity shares in ICICI Lombard General Insurance Company Limited and 4.21% equity shares in ICICI Securities Limited and made aggregate net gain of ` 36,699.4 million on these sales (year ended March 31, 2020: Nil).
Integrated Report Statutory Reports Financial Statements
181

FINANCIAL STATEMENTS OF ICICI BANK LIMITED
SChEDuLESforming part of the Accounts (Contd.)
The following table sets forth, for the periods indicated, break-up of other investments in Schedule 8.
` in million
investmentsat
march 31, 2021at
march 31, 2020i. in india
Pass through certificates 90,726.1 130,774.8
Commercial paper 52,592.4 139,563.6
Certificate of deposits 2,980.3 23,431.1
Security receipts 17,294.1 19,253.3
Venture funds 3,419.6 3,229.7
Others 382.7 10,342.8
total 167,395.2 326,595.3
ii. Outside india
Certificate of deposits 4,751.9 4,918.2
Shares 1,595.3 1,616.3
Bonds 8,916.6 5,311.0
Venture funds 2,144.8 2,142.1
total 17,408.6 13,987.6
Grand total 184,803.8 340,582.9
Details of category-wise investments at March 31, 2021
category Htm aFS HFt totalGovernment Securities 1,705,635.9 419,831.4 162,362.9 2,287,830.3
Other Approved Securities - - - -
Shares - 29,467.3 319.2 29,786.4
Debentures and Bonds 14,262.0 208,376.3 5,475.6 228,113.9
Subsidiaries and Joint Ventures 85,764.5 11,801.2 - 97,565.7
Others 4,320.4 155,985.3 9,263.5 169,569.2
total 1,809,982.8 825,461.5 177,421.2 2,812,865.4
Details of category-wise investments at March 31, 2020
category Htm aFS HFt totalGovernment Securities 1,399,164.6 432,280.3 80,783.5 1,912,228.4
Other Approved Securities - - - -
Shares - 25,850.4 330.9 26,181.3
Debentures and Bonds 1,010.0 117,726.0 11,345.8 130,081.8
Subsidiaries and Joint Ventures 85,764.5 12,264.0 - 98,028.5
Others 4,462.2 190,967.2 133,365.4 328,794.8
total 1,490,401.3 779,087.9 225,825.6 2,495,314.8
182
Annual Report 2020-21

FINANCIAL STATEMENTS OF ICICI BANK LIMITED
SChEDuLESforming part of the Accounts (Contd.)
11. investment in securities, other than government and other approved securities (non-SlR investments) i) Issuer composition of investments in securities, other than government and other approved securities The following table sets forth, the issuer composition of investments of the Bank in securities, other than government
and other approved securities at March 31, 2021. ` in million
Sr. no.
issuer amountextent of
private placement
extent of ‘below investment
grade’ securities
extent of ‘unrated’
securities2,3
extent of ‘unlisted’
securities2,3
(a) (b) (c) (d)
1. PSUs 20,866.4 19,277.5 - - 16,710.0
2. FIs 130,279.4 75,684.4 817.9 181.8 -
3. Banks 35,261.4 14,752.2 4,744.8 - 2,171.4
4. Private corporates 170,179.6 74,283.9 4,361.0 1,644.8 10,475.8
5. Subsidiaries/Joint ventures 97,565.8 . . . -
6. Others3,4 120,623.0 120,474.1 30,551.35 - 6,642.3
7. Provision held towards depreciation (49,740.5) n.a. n.a. n.a n.a.
total 525,035.1 304,472.1 40,475.0 1,826.6 35,999.5
1. Amounts reported under columns (a), (b), (c) and (d) above are not mutually exclusive. 2. Excludes equity shares, units of equity-oriented mutual fund, units of venture capital fund, pass through certificates, security
receipts, commercial papers, certificates of deposit, non-convertible debentures (NCDs) with original or initial maturity up to one year issued by corporate (including NBFC), unlisted convertible debentures and securities acquired by way of conversion of debt.
3. Excludes investments in non-Indian government securities by overseas branches amounting to ` 151,622.3 million. 4. Excludes investments in non-SLR government of India securities amounting to ` 108.0 million. 5. Includes security receipts of ` 23,902.0 million and PTCs of ` 6,642.3 million.
The following table sets forth, the issuer composition of investments of the Bank in securities, other than government and other approved securities at March 31, 2020.
` in million
Sr. no.
issuer amountextent of
private placement
extent of ‘below investment grade’
securities
extent of ‘unrated’
securities2,3
extent of ‘unlisted’
securities2,3
(a) (b) (c) (d)
1. PSUs 114,845.8 93,987.6 - - 36,150.0
2. FIs 93,478.8 36,287.0 797.0 187.2 -
3. Banks 34,411.7 29,214.6 - - -
4. Private corporates 128,894.2 117,726.5 350.0 4,060.6 8,024.9
5. Subsidiaries/Joint ventures 98,028.5 - - - -
6. Others3,4 171,377.4 171,288.4 26,128.35 20.0 2,001.4
7. Provision held towards depreciation (57,950.0) N.A. N.A. N.A. N.A.
total 583,086.4 448,504.1 27,275.3 4,267.8 46,176.3
1. Amounts reported under columns (a), (b), (c) and (d) above are not mutually exclusive. 2. Excludes equity shares, units of equity-oriented mutual fund, units of venture capital fund, pass through certificates, security
receipts, commercial papers, certificates of deposit, non-convertible debentures (NCDs) with original or initial maturity up to one year issued by corporate (including NBFC), unlisted convertible debentures and securities acquired by way of conversion of debt.
3. Excludes investments in non-Indian government securities by overseas branches amounting to ` 28,909.6 million. 4. Excludes investments in non-SLR government of India securities amounting to ` 121.5 million. 5. Includes security receipts of ` 24,146.9 million and PTCs of ` 1,981.4 million.
Integrated Report Statutory Reports Financial Statements
183

FINANCIAL STATEMENTS OF ICICI BANK LIMITED
SChEDuLESforming part of the Accounts (Contd.)
ii) Non-performing investments in securities, other than government and other approved securities The following table sets forth, for the periods indicated, the movement in gross non-performing investments in
securities, other than government and other approved securities.` in million
particularsYear ended
march 31, 2021Year ended
march 31, 2020Opening balance 51,069.4 44,287.2
Additions during the year 7,393.6 15,838.1
Reduction during the year (14,226.1) (9,055.9)
Closing balance 44,236.9 51,069.4
total provision held 40,399.0 46,722.8
12. Sales and transfers of securities to/from Held to maturity (Htm) category During the year ended March 31, 2021 and year ended March 31, 2020, the value of sales/transfers of securities
to/from HTM category (excluding one-time transfer of securities, sales to RBI under pre-announced open market operation auctions, repurchase of government securities by Government of India and repurchase of the state development loans by concerned state government, as permitted by RBI guidelines) did not exceed 5.0% of the book value of investments held in HTM category at the beginning of the year.
13. derivatives The Bank is a major participant in the financial derivatives market. The Bank deals in derivatives for balance sheet
management, proprietary trading and market making purposes whereby the Bank offers derivative products to its customers, enabling them to hedge their risks.
Dealing in derivatives is carried out by identified groups in the treasury of the Bank based on the purpose of the transaction. Derivative transactions are entered into by the treasury front office. Treasury Control and Services Group (TCSG) carries out an independent check of the transactions entered into by the front office and also undertakes activities such as confirmation, settlement, accounting, reporting and ensures compliance with various internal and regulatory guidelines.
The overall market risk limits are approved by the Board as a part of the Enterprise Risk Management – Risk Appetite Framework (ERM-RAF). The market making and the proprietary trading activities in derivatives are governed by the Investment Policy (which includes the Derivative Policy) of the Bank, which sets out the Value at Risk/stop loss, Net Overnight Open position limits as well as other risk limits. The Risk Management Group (RMG) is involved in formulation of the policies and methodology for computation and monitoring of risk. The Risk Committee of the Board (RCB) reviews the Bank’s risk management policies in relation to various risks including credit and recovery policy, investment policy, derivative policy, asset liability management (ALM) policy and operational risk management policy. A review of treasury positions and the risk dashboard is presented periodically to the ALCO and RCB respectively.
The use of derivatives for hedging purposes is governed by the hedge policy approved by ALCO. Subject to prevailing RBI guidelines, the Bank deals in derivatives for hedging fixed rate, floating rate or foreign currency assets/liabilities. Transactions for hedging and market making purposes are recorded separately. For hedge transactions, the Bank identifies the hedged item (asset or liability) at the inception of the hedge itself. The effectiveness is assessed at the time of inception of the hedge and periodically thereafter. Hedge derivative transactions are accounted for pursuant to the principles of hedge accounting based on guidelines issued by RBI. At March 31, 2021, the Bank was primarily exposed to USD LIBOR and JPY LIBOR benchmarks in its hedging transactions. Derivatives for market making purpose are marked to market and the resulting gain/loss is recorded in the profit and loss account. The premium on option contracts is accounted for as per Foreign Exchange Dealers Association of India (FEDAI) guidelines.
184
Annual Report 2020-21

FINANCIAL STATEMENTS OF ICICI BANK LIMITED
SChEDuLESforming part of the Accounts (Contd.)
The Financial Stability Board recommended the reform of specified major interest rate benchmarks such as interbank offered rates (IBORs). Since then National Supervisors in many jurisdictions have taken steps to implement interest rate benchmark reform and have increasingly encouraged market participants to ensure timely progress towards the reform of interest rate benchmarks, including the replacement of interest rate benchmarks with alternative benchmark rates. The progress towards interest rate benchmark reform follows the expectation that some major interest rate benchmarks will cease to be published by the end of 2021. The Board of Directors has authorised the ALCO to review and approve matters, as applicable, pertaining to the LIBOR transition to alternate risk free rates. The Bank has constituted an internal working group which reviews the Bank’s efforts towards this transition and also monitors the developments internationally, as well as work carried out in domestic market, including through Indian Banking Association (IBA). Further, The Bank had adhered to the ISDA 2020 IBOR Fallbacks Protocol on January 15, 2021 and has been encouraging its counterparties to adhere as well. Alternatively, for the existing derivative transactions with non-adhering counterparties, the Bank has been entering into bilateral agreements to ensure suitable fallbacks are agreed mutually in accordance with ISDA’s recommendations. The Bank has been actively participating in the Working Group constituted by Indian Banks Association on formulating the alternate rate to the INR MIFOR rate.
Over the counter (OTC) derivative transactions are generally covered under International Swaps and Derivatives Association (ISDA) master agreements with the respective counter parties. The exposure on account of derivative transactions is computed as per RBI guidelines.
The following tables set forth, for the periods indicated, the details of derivative positions.
` in million
Sr. no.
particularsat march 31, 2021 at march 31, 2020
currency derivative1
interest rate derivative2
currency derivative1
interest rate derivative2
1. Derivatives (Notional principal amount)
a) For hedging - 163,798.0 - 286,628.5
b) For trading 1,102,082.5 15,643,967.7 1,153,447.5 14,768,017.0
2. Marked to market positions3
a) Asset (+) 21,967.6 47,823.8 35,072.2 77,348.6
b) Liability (-) (14,965.3) (58,021.6) (29,087.5) (88,278.3)
3. Credit exposure4 83,923.2 187,715.7 99,270.5 219,115.7
4. Likely impact of one percentage change in interest rate (100*PV01)5
a) On hedging derivatives6 - 6,268.8 - 8,875.3
b) On trading derivatives 2,790.7 3,187.5 3,305.3 3,262.6
5. Maximum and minimum of 100*PV01 observed during the period
a) On hedging6
Maximum - 9,025.6 - 10,255.4
Minimum - 6,227.2 - 8,238.1
b) On trading
Maximum 3,372.1 5,284.2 3,333.3 6,018.0
Minimum 2,194.1 1,531.9 1.7 7.3
1. Exchange traded and OTC options, cross currency interest rate swaps and currency futures are included in currency derivatives. 2. OTC Interest rate options, Interest rate swaps, forward rate agreements, swaptions and exchange traded interest rate derivatives
are included in interest rate derivatives. 3. For trading portfolio including accrued interest. 4. Includes accrued interest and has been computed based on current exposure method. 5. Amounts given are absolute values on a net basis, excluding options. 6. The swap contracts entered into for hedging purpose would have an opposite and off-setting impact with the underlying
on-balance sheet items.
Integrated Report Statutory Reports Financial Statements
185

FINANCIAL STATEMENTS OF ICICI BANK LIMITED
SChEDuLESforming part of the Accounts (Contd.)
The following tables set forth, for the periods indicated, the details of forex contracts.
` in million
Sr. no.
particularsat march 31, 2021 at march 31, 2020trading non-trading trading non-trading
1. Forex contracts (Notional principal amount) 7,080,505.5 1,072,284.3 7,017,268.9 424,190.6
2. Marked to market positions
a) Asset (+) 26,752.1 7,854.7 30,575.3 1,776.5
b) Liability (-) (22,730.1) (805.7) (18,728.9) (9,695.9)
3. Credit exposure1 205,195.1 35,598.4 202,270.7 11,408.5
4. Likely impact of one percentage change in interest rate (100*PV01)2 66.1 94.1 243.9 43.2
1. Computed based on current exposure method. 2. Amounts given are absolute values on a net basis.
As per the Master circular on Basel III Capital Regulations issued by RBI on July 1, 2015 on capital adequacy computation, ‘banks in India are required to adopt a comprehensive approach, which allows fuller offset of collateral against exposures, by effectively reducing the exposure amount by the value ascribed to the collateral’. Therefore, counterparty exposure has been fully off-set against the collateral received from the counterparty and the excess collateral posted over the net MTM payable is reckoned as exposure. Since, the collateral received is counterparty-wise and not product-wise, the derivative exposure reported above has not been adjusted for the collateral received/posted. At March 31, 2021, collateral utilised against the exposure was ` 7,385.2 million (March 31, 2020: ` 15,185.9 million), excess collateral posted over the exposure was ` 743.7 million (March 31, 2020: ` 348.6 million) and the net credit exposure on forex and derivatives, subsequent to collateral netting, was ` 505,790.8 million (March 31, 2020: ` 517,228.1 million).
The net overnight open position (NOOP) at March 31, 2021 (as per last NOOP value reported to RBI for the year ended March 31, 2021) was ` 4,200.2 million (March 31, 2020: ` 4,620.9 million).
The Bank has no exposure in credit derivative instruments (funded and non-funded) including credit default swaps (CDS) and principal protected structures at March 31, 2021 (March 31, 2020: Nil).
14. exchange traded interest rate derivatives and currency derivatives Exchange traded interest rate derivatives The following table sets forth, for the periods indicated, the details of exchange traded interest rate derivatives.
` in million
Sr. no.
particularsat
march 31, 2021at
march 31, 20201. Notional principal amount of exchange traded interest rate
derivatives undertaken during the year- 10 year Government Security Notional Bond 64,748.8 244,208.8
2. Notional principal amount of exchange traded interest rate derivatives outstanding- 10 year Government Security Notional Bond 20.0 1,080.0
3. Notional principal amount of exchange traded interest rate derivatives outstanding and not ‘highly effective’ n.a. N.A.
4. Mark-to-market value of exchange traded interest rate derivatives outstanding and not ‘highly effective’ n.a. N.A.
186
Annual Report 2020-21

FINANCIAL STATEMENTS OF ICICI BANK LIMITED
SChEDuLESforming part of the Accounts (Contd.)
Exchange traded currency derivatives The following table sets forth, for the periods indicated, the details of exchange traded currency derivatives.
` in million
Sr. no.
particularsat
march 31, 2021at
march 31, 20201. Notional principal amount of exchange traded currency derivatives
undertaken during the year 3,515,146.1 2,448,869.32. Notional principal amount of exchange traded currency derivatives
outstanding 60,651.2 88,225.03. Notional principal amount of exchange traded currency derivatives
outstanding and not ‘highly effective’ n.a. N.A.4. Mark-to-market value of exchange traded currency derivatives
outstanding and not ‘highly effective’ n.a. N.A.
15. Forward rate agreement (FRa)/interest rate swaps (iRS)/cross currency swaps (ccS) The Bank enters into FRA, IRS and CCS contracts for balance sheet management and market making purposes
whereby the Bank offers derivative products to its customers to enable them to hedge their interest rate risk and currency risk within the prevalent regulatory guidelines.
A FRA is a financial contract between two parties to exchange interest payments for ‘notional principal’ amount on settlement date, for a specified period from start date to maturity date. Accordingly, on the settlement date cash payments based on contract rate and the settlement rate, which is the agreed bench-mark/reference rate prevailing on the settlement date, are made by the parties to one another. The benchmark used in the FRA contracts of the Bank is London Inter-Bank Offered Rate (LIBOR) of various currencies.
An IRS is a financial contract between two parties exchanging or swapping a stream of interest payments for a ‘notional principal’ amount on multiple occasions during a specified period. The Bank deals in interest rate benchmarks like Mumbai Inter-Bank Offered Rate (MIBOR), Indian Government Securities Benchmark Rate (INBMK), Mumbai Inter-Bank Forward Offer Rate (MIFOR) and LIBOR of various currencies.
A CCS is a financial contract between two parties exchanging interest payments and principal, wherein interest payments and principal in one currency would be exchanged for interest payments and principal in another currency.
These contracts are subject to the risks of changes in market interest rates and currency rates as well as the settlement risk with the counterparties.
The following table sets forth, for the periods indicated, the details of the FRA/IRS.
` in million
Sr. no.
particularsat
march 31, 2021at
march 31, 20201. Notional principal of FRA/IRS 15,749,369.2 14,991,626.2
2. Losses which would be incurred if all counter parties failed to fulfil their obligations under the agreement1 48,230.0 78,846.5
3. Collateral required by the Bank upon entering into FRA/IRS - -
4. Concentration of credit risk2 2,066.6 6,197.7
5. Fair value of FRA/IRS3 (2,917.5) 4,321.4
1. For trading portfolio both mark-to-market and accrued interest have been considered and for hedging portfolio only accrued interest has been considered.
2. Credit risk concentration is measured as the highest net receivable under these contracts from a particular counter party. 3. Fair value represents mark-to-market including accrued interest.
Integrated Report Statutory Reports Financial Statements
187

FINANCIAL STATEMENTS OF ICICI BANK LIMITED
SChEDuLESforming part of the Accounts (Contd.)
The following table sets forth, for the periods indicated, the details of the CCS. ` in million
Sr. no.
particularsat
march 31, 2021at
march 31, 20201. Notional principal of CCS1 481,715.7 510,277.6
2. Losses which would be incurred if all counter parties failed to fulfil their obligations under the agreement2 19,157.0 31,241.5
3. Collateral required by the Bank upon entering into CCS - -
4. Concentration of credit risk3 8,033.9 12,003.5
5. Fair value of CCS4 9,126.1 11,127.6
1. CCS includes cross currency interest rate swaps and currency swaps. 2. For trading portfolio both mark-to-market and accrued interest have been considered and for hedging portfolio only accrued
interest has been considered. 3. Credit risk concentration is measured as the highest net receivable under these contracts from a particular counter party. 4. Fair value represents mark-to-market including accrued interest.
The following tables set forth, for the periods indicated, the nature and terms of FRA and IRS.
Hedging` in million
Benchmark typeat march 31, 2021 at march 31, 2020notional principal
no. of deals
notional principal
no. of deals
JPY LIBOR Fixed receivable v/s floating payable 6,611.5 1 10,451.2 2
USD LIBOR Fixed receivable v/s floating payable 157,186.5 19 276,177.3 40
total 163,798.0 20 286,628.5 42
Trading ` in million
Benchmark typeat march 31, 2021 at march 31, 2020notional principal
no. of deals
notional principal
no. of deals
AUD LIBOR Floating receivable v/s fixed payable 501.3 1 414.7 1
AUD LIBOR Fixed receivable v/s floating payable 532.5 17 440.5 17
CAD CDOR Fixed receivable v/s floating payable 874.4 1 903.1 1
CAD CDOR Floating receivable v/s fixed payable 887.8 2 927.0 3
EURIBOR Fixed receivable v/s floating payable 14,570.4 39 17,175.4 48
EURIBOR Floating receivable v/s fixed payable 15,034.6 24 17,156.8 30
EURIBOR Floating receivable v/s floating payable 429.4 1 415.2 1
GBP LIBOR Fixed receivable v/s floating payable 8,422.9 17 12,974.3 23
GBP LIBOR Floating receivable v/s fixed payable 9,208.8 20 13,161.8 28
INBMK Floating receivable v/s fixed payable 1,000.0 1 12,310.3 17
INBMK Fixed receivable v/s floating payable 1,000.0 1 4,000.0 7
JPY LIBOR Fixed receivable v/s floating payable 6,046.4 9 6,432.3 9
JPY LIBOR Floating receivable v/s fixed payable 5,990.0 7 6,671.9 8
MIBOR Floating receivable v/s fixed payable 5,967,573.3 7,629 5,425,960.0 6,862
MIBOR Fixed receivable v/s floating payable 6,036,070.1 9,441 5,287,644.4 7,891
188
Annual Report 2020-21

FINANCIAL STATEMENTS OF ICICI BANK LIMITED
SChEDuLESforming part of the Accounts (Contd.)
` in million
Benchmark typeat march 31, 2021 at march 31, 2020notional principal
no. of deals
notional principal
no. of deals
MIFOR Floating receivable v/s fixed payable 860,800.0 1,061 788,350.0 1,113
MIFOR Fixed receivable v/s floating payable 917,855.0 1,506 854,735.0 1,435
USD LIBOR Fixed receivable v/s floating payable 704,400.4 672 990,125.4 876
USD LIBOR Floating receivable v/s fixed payable 852,030.1 753 1,152,420.8 854
USD LIBOR Floating receivable v/s floating payable 174,735.5 52 108,722.9 61
USD SOFR Fixed receivable v/s floating payable 3,655.5 1 - -
USD SOFR Floating receivable v/s fixed payable 731.1 1 - -
Other Fixed receivable v/s fixed payable 3,221.6 4 4,055.9 48
total 15,585,571.1 21,260 14,704,997.7 19,333
The following tables set forth, for the periods indicated, the nature and terms of CCS.
Trading ` in million
Benchmark typeat march 31, 2021 at march 31, 2020notional principal
no. of deals
notional principal
no. of deals
CAD CDOR Floating receivable v/s fixed payable - - 5,319.6 1EURIBOR Fixed receivable v/s floating payable 5,025.7 23 2,235.1 16EURIBOR V/s USD LIBOR
Floating receivable v/s floating payable 6,998.7 6 8,308.1 10
EURIBOR V/s USD LIBOR
Floating payable v/s floating receivable 11,712.1 12 12,945.1 13
GBP LIBOR V/s USD LIBOR
Floating receivable v/s floating payable 2,952.3 5 4,376.6 7
GBP LIBOR V/s USD LIBOR
Floating payable v/s floating receivable 3,321.3 6 3,907.3 8
JPY LIBOR Floating receivable v/s fixed payable 343.0 1 331.1 1JPY LIBOR Fixed receivable v/s floating payable 134.9 1 361.9 4JPY LIBOR V/s USD LIBOR
Floating receivable v/s floating payable 7,976.6 8 11,205.1 8
JPY LIBOR V/s USD LIBOR
Floating payable v/s floating receivable 317.8 2 1,293.6 3
MIFOR v/s USD LIBOR
Floating receivable v/s floating payable 4,626.3 3 4,626.3 3
SGD SOR V/s USD LIBOR
Floating receivable v/s floating payable 438.7 1 454.0 1
SGD SOR V/s USD LIBOR
Floating payable v/s floating receivable 365.6 2 378.3 2
USD LIBOR Fixed receivable v/s floating payable 159,880.7 195 162,255.6 174USD LIBOR Floating receivable v/s fixed payable 95,861.9 86 91,440.3 99Others Fixed receivable v/s fixed payable 181,760.1 189 200,839.7 205total 481,715.7 540 510,277.7 555
1. Benchmark indicates floating leg of the fixed v/s floating CCS.
Integrated Report Statutory Reports Financial Statements
189

FINANCIAL STATEMENTS OF ICICI BANK LIMITED
SChEDuLESforming part of the Accounts (Contd.)
16. non-performing assets1
The following table sets forth, for the periods indicated, the details of movement of gross non-performing assets (NPAs), net NPAs and provisions.
` in million
Sr. no.
particularsYear ended
march 31, 2021Year ended
march 31, 20201. Net NPAs (funded) to net advances (%) 1.24% 1.54%2. Movement of NPAs (Gross)
a) Opening balance2 408,290.9 456,760.4b) Additions: Fresh NPAs during the year3 160,482.2 138,020.0Sub-total (1) 568,773.1 594,780.4c) Reductions during the year 1. Upgradations (17,546.2) (11,542.1) 2. Recoveries (excluding recoveries made from upgraded
accounts) (47,746.4) (65,428.8) 3. Technical/prudential write-offs (91,414.9) (102,697.1) 4. Write-offs other than technical/prudential write-offs (3,651.4) (6,821.5)Sub-total (2) (160,358.9) (186,489.5)d) Closing balance2 (1)-(2) 408,414.2 408,290.9
3. Movement of net NPAsa) Opening balance2 99,232.4 134,497.2b) Additions during the year3 80,171.9 67,049.0c) Reductions during the year (88,227.7) (102,313.8)d) Closing balance2 91,176.6 99,232.4
4. Movement of provision for NPAs (excluding provision on standard assets)a) Opening balance2 309,058.5 322,263.2b) Addition during the year3 133,515.3 141,862.4Sub-total (1) 442,573.8 464,125.6c) Write-off/(write-back) of excess provisions 1. Write-back of excess provision on account of
upgradations (3,940.9) (2,500.0) 2. Write-back of excess provision on account of reduction
in NPAs (26,922.0) (43,393.5) 3. Provision utilised for write-offs (94,473.3) (109,173.6)Sub-total (2) (125,336.2) (155,067.1)d) Closing balance2 (1)-(2) 317,237.6 309,058.5
1. Represents loans and advances. 2. Net of write-off. 3. Includes effect of exchange rate fluctuation on loans in foreign currency.
190
Annual Report 2020-21

FINANCIAL STATEMENTS OF ICICI BANK LIMITED
SChEDuLESforming part of the Accounts (Contd.)
The following table sets forth, for the periods indicated, the details of movement in technical/prudential write-off.
` in million
particularsYear ended
march 31, 2021Year ended
march 31, 2020Opening balance 341,378.5 238,659.6
Add: Technical/prudential write-offs during the year1 82,688.5 115,925.6
Sub-total (1) 424,067.0 354,585.2
Less: Recoveries made from previously technical/ prudential written-off accounts during the year (1,682.3) (3,395.6)
Less: Sacrifice made from previously technical/ prudential written-off accounts during the year (5,962.2) (9,811.1)
Sub-total (2) (7,644.5) (13,206.7)
Closing balance (1)-(2) 416,422.5 341,378.5
1. Includes effect of exchange rate fluctuation on loans in foreign currency.
Further, in accordance with RBI guidelines, the loans and advances held at the overseas branches that are identified as impaired as per host country regulations for reasons other than record of recovery, but which are standard as per the extant RBI guidelines, are classified as NPAs to the extent of amount outstanding in the host country. At March 31, 2021, there was no loan and advance held at overseas branches that was identified as impaired as per host country regulations for reasons other than record of recovery, but which was standard as per the extant RBI guidelines (at March 31, 2020: ` 19,795.3 million with a provision of ` 10,305.8 million).
Divergence in asset classification and provisioning for NPAs In terms of the RBI circular no. //DBR.BP.BC.No.32/21.04.018/2018-19 dated April 1, 2019, banks are required to
disclose the divergences in asset classification and provisioning consequent to RBI’s annual supervisory process in their notes to accounts to the financial statements, wherever either (a) the additional provisioning requirements assessed by RBI exceed 10% of the reported net profits before provisions and contingencies or (b) the additional gross NPAs identified by RBI exceed 15% of the published incremental gross NPAs for the reference period, or both. Based on the condition mentioned in RBI circular, no disclosure on divergence in asset classification and provisioning for NPAs is required with respect to RBI’s supervisory process for the year ended March 31, 2020 and for the year ended March 31, 2019.
17. Floating provision During the year ended March 31, 2021, the Bank did not make any floating provision (March 31, 2020: Nil).
The following table sets forth, for the periods indicated, the movement in floating provision held by the Bank.
` in million
particularsat
march 31, 2021at
march 31, 2020Opening balance1 1.9 1.9
Add: Provision made during the year - -
Less: Provision utilised during the year - -
Closing balance1 1.9 1.9
1. Represents amount taken over from erstwhile Bank of Rajasthan upon amalgamation.
Integrated Report Statutory Reports Financial Statements
191

FINANCIAL STATEMENTS OF ICICI BANK LIMITED
SChEDuLESforming part of the Accounts (Contd.)
18. General provision on standard assets The general provision on standard assets (excluding Covid-19 related provision) held by the Bank at March 31, 2021
was ` 35,842.8 million (March 31, 2020: ` 33,745.2 million). The Bank made general provision on standard assets (excluding Covid-19 related provision) amounting to ` 2,288.3 million during the year ended March 31, 2021 (year ended March 31, 2020: ` 4,621.1 million) as per applicable RBI guidelines.
RBI, through its circular dated January 15, 2014 had advised banks to create incremental provision on standard loans and advances to entities with unhedged foreign currency exposure (UFCE). The Bank assesses the UFCEs of the borrowers through its credit appraisal and internal ratings process. The Bank also undertakes reviews of such exposures through thematic reviews evaluating the impact of exchange rate fluctuations on the Bank’s portfolio on an yearly basis.
The Bank held provision amounting to ` 2,620.0 million (March 31, 2020: ` 2,500.0 million) on advances to entities with UFCE at March 31, 2021. During the year ended March 31, 2021, the Bank made provision amounting to ` 120.0 million on advances to entities with UFCE (year ended March 31, 2020 provision of ` 250.0 million). The Bank held incremental capital of ` 8,860.0 million at March 31, 2021 on advances to borrowers with UFCE (March 31, 2020: ` 7,752.5 million).
The Bank makes additional general provision on stressed sectors of the economy, as per RBI guidelines and as per the Board approved policy. During the year ended March 31, 2021, there was a write-back of provision amounting to ` 756.7 million (year ended March 31, 2020: provision of ` 911.9 million). At March 31, 2021, the Bank held provision amounting to ` 1,583.3 million (March 31, 2020: ` 2,340.0 million).
During the year ended March 31, 2021, the Bank made provision amounting to ̀ 205.9 million (year ended March 31, 2020: write-back of ` 20.8 million) towards advances to overseas step-down subsidiaries of Indian corporates. The Bank held provision amounting to ` 762.2 million at March 31, 2021 (March 31, 2020: ` 556.3 million).
RBI, through its circular dated August 25, 2016, required banks to make additional provision from the year ended March 31, 2019 on incremental exposure of the banking system in excess of normally permitted lending limit (NPLL) on borrowers classified as specified borrower. During the year ended March 31, 2021 the Bank made provision amounting to ` 248.5 million (year ended March 31, 2020: write-back of ` 42.7 million) on these specified borrowers. The Bank held provision amounting to ` 330.0 million at March 31, 2021 (March 31, 2020: ` 81.5 million).
19. provision coverage Ratio The provision coverage ratio of the Bank at March 31, 2021 computed as per the extant RBI guidelines was 77.7%
(March 31, 2020: 75.7%).
20. priority Sector lending certificates (pSlcs) The following table sets forth, for the periods indicated, details of PSLCs purchased and sold by the Bank.
` in million
categoryYear ended march 31, 2021 Year ended march 31, 2020
Bought Sold Bought SoldGeneral - 311,055.0 48,500.0 167,980.0
Agriculture 357,740.0 - 333,480.0 -
Micro enterprise - 106,840.0 - 223,462.5
total 357,740.0 417,895.0 381,980.0 391,442.5
192
Annual Report 2020-21

FINANCIAL STATEMENTS OF ICICI BANK LIMITED
SChEDuLESforming part of the Accounts (Contd.)
21. Securitisation A. The Bank sells loans through securitisation and direct assignment. The following tables set forth, for
the periods indicated, the information on securitisation and direct assignment activity of the Bank as an originator till May 7, 2012.
` in million, except number of loans securitised
particularsYear ended
march 31, 2021Year ended
march 31, 2020Total number of loan assets securitised - -
Total book value of loan assets securitised - -
Sale consideration received for the securitised assets - -
Net gain/(loss) on account of securitisation1 (56.1) 8.3
1. Includes gain/(loss) on deal closures, gain amortised during the year and expenses relating to utilisation of credit enhancement.
` in million
particularsat
march 31, 2021at
march 31, 2020Outstanding credit enhancement (funded) 1,425.8 3,464.6
Outstanding liquidity facility 0.1 2.6
Net outstanding servicing asset/(liability) (7.6) (9.3)
Outstanding subordinate contributions - 1,459.1
Outstanding liquidity facility in the form of guarantees amounted to ̀ 209.6 million at March 31, 2021 (March 31, 2020: ` 263.2 million).
The outstanding credit enhancement in the form of guarantees for third party originated securitisation transactions amounted to ` 3,524.2 million at March 31, 2021 (March 31, 2020: ` 5,065.1 million).
The following table sets forth, for the periods indicated, the details of provision for securitisation and direct assignment transactions.
` in million
particularsYear ended
march 31, 2021Year ended
march 31, 2020Opening balance 845.6 831.9
Additions during the year 6.8 16.7
Deductions during the year (831.9) (3.0)
Closing balance 20.5 845.6
Integrated Report Statutory Reports Financial Statements
193

FINANCIAL STATEMENTS OF ICICI BANK LIMITED
SChEDuLESforming part of the Accounts (Contd.)
B. The information on securitisation and direct assignment activity of the Bank as an originator as per RBI guidelines ‘Revisions to the Guidelines on Securitisation Transactions’ dated May 7, 2012 is given below.
a. The Bank, as an originator, has not sold any loan through securitisation during the year ended March 31, 2021 (March 31, 2020: Nil).
b. The following table sets forth, for the periods indicated, the information on the loans sold through direct assignment.
` in million
Sr. no.
particularsat
march 31, 2021at
march 31, 20201. Number of SPVs sponsored by the bank for securitisation
transactions - -2. Total amount of assets sold through direct assignment
during the year - -3. Total amount of exposures retained by the Bank to
comply with Minimum Retention Requirement (MRR) a) Off-balance sheet exposures • First loss - - • Others - -b) On-balance sheet exposures • First loss - - • Others 19.8 19.8
4. Amount of exposure to securitisation transactions other than MRRa) Off-balance sheet exposures i) Exposure to own securitisation • First loss - - • Others - - ii) Exposure to third party securitisation • First loss - - • Others - -b) On-balance sheet exposures i) Exposure to own securitisation • First loss - - • Others - - ii) Exposure to third party securitisation • First loss - - • Others - -
The overseas branches of the Bank, as originators, sold eight loans through direct assignment amounting to ` 12,745.2 million during the year ended March 31, 2021 (year ended March 31, 2020: six loans amounting to ` 6,886.3 million).
194
Annual Report 2020-21

FINANCIAL STATEMENTS OF ICICI BANK LIMITED
SChEDuLESforming part of the Accounts (Contd.)
22. Financial assets transferred during the year to securitisation company (Sc)/reconstruction company (Rc) The Bank has transferred certain assets to Asset Reconstruction Companies (ARCs) in terms of the guidelines issued
by RBI circular no. DBR.No.BP.BC.2/21.04.048/2015-16 dated July 1, 2015 during the year ended March 31, 2021. For the purpose of the valuation of the underlying security receipts issued by the underlying trusts managed by ARCs, the SRs are valued at their respective net asset values as advised by the ARCs.
The following table sets forth, for the periods indicated, the details of the assets transferred.
` in million, except number of accounts
particularsYear ended
march 31, 2021Year ended
march 31, 2020Number of accounts 2 5Aggregate value (net of provisions) of accounts sold to SC/RC 11.3 7.8Aggregate consideration 81.0 310.9Additional consideration realised in respect of accounts transferred in earlier years - -Aggregate gain/(loss) over net book value1,2 69.7 303.1Excess provision reversed to profit and loss account on account of sale of NPAs 69.7 303.1
1. During the year ended March 31, 2021, the Bank made a gain of ` 69.7 million on sale of financial assets to ARCs (year ended March 31, 2020: gain of ` 303.1 million).
The following tables set forth, for the periods indicated, the details of investments in security receipts (SRs).
` in million
particularsat
march 31, 2021at
march 31, 2020Net book value of investments in SRs which are -- Backed by NPAs sold by the Bank as underlying1 10,447.9 10,547.6- Backed by NPAs sold by other banks/financial institutions(FIs)/
non–banking financial companies (NBFCs) as underlying 2.4 10.5total 10,450.3 10,558.1
1. During the year ended March 31, 2021, security receipts were partly redeemed by ARCs (year ended March 31, 2020: two trusts were fully redeemed amounting to ` 1,138.7 million) and there was no gain/loss to the Bank (year ended March 31, 2020: Nil).
` in million
Sr. no.
particulars
at march 31, 2021
SRs issued within past
five years
SRs issued more than five years ago but
within past eight years
SRs issued more than
eight years ago
total
1. Book value of SRs backed by NPAs sold by the Bank as underlying 12,371.0 560.2 - 12,931.2Provision held against above 2,385.8 97.5 - 2,483.3
2. Book value of SRs backed by NPAs sold by other banks/financial institutions/non-banking financial companies as underlying - 2.4 - 2.4Provision held against above - - - -
Gross book value 12,371.0 562.6 - 12,933.6Total provision held against above 2,385.8 97.5 - 2,483.3net book value 9,985.2 465.1 - 10,450.3
Integrated Report Statutory Reports Financial Statements
195

FINANCIAL STATEMENTS OF ICICI BANK LIMITED
SChEDuLESforming part of the Accounts (Contd.)
` in million
Sr. no.
particulars
at march 31, 2020
SRs issued within past
five years
SRs issued more than five years ago but
within past eight years
SRs issued more than
eight years ago
total
1. Book value of SRs backed by NPAs sold by the Bank as underlying 12,819.1 211.7 - 13,030.8Provision held against above 2,483.2 - - 2,483.2
2. Book value of SRs backed by NPAs sold by other banks/financial institutions/non-banking financial companies as underlying - 10.5 - 10.5Provision held against above - - - -
Gross book value 12,819.1 222.2 - 13,041.3Total provision held against above 2,483.2 - - 2,483.2net book value 10,335.9 222.2 - 10,558.1
23. details of non-performing assets purchased/sold, excluding those sold to Sc/Rc The Bank did not purchase any non-performing assets in terms of the guidelines issued by RBI circular no. DBR.
No.BP.BC.2/21.04.048/2015-16 dated July 1, 2015 during the year ended March 31, 2021 (year ended March 31, 2020: Nil).
The following table sets forth, for the periods indicated, details of non-performing assets sold to banks, NBFCs and other financial institutions.
` in million, except number of accounts
particularsYear ended
march 31, 2021Year ended
march 31, 2020Number of accounts 1 2Aggregate value (net of provisions) of accounts sold, excluding those sold to SC/RC 473.7 649.0Aggregate consideration 445.7 995.9Aggregate gain/(loss) over net book value (28.0) 346.9
The following table sets forth, for the periods indicated, details of non-performing assets sold to entities other than banks, NBFCs and other financial institutions.
` in million, except number of accounts
particularsYear ended
march 31, 2021Year ended
march 31, 2020Number of accounts 1 -Aggregate value (net of provisions) of accounts sold, excluding those sold to SC/RC - -Aggregate consideration 75.3 -Aggregate gain/(loss) over net book value 75.3 -
196
Annual Report 2020-21

FINANCIAL STATEMENTS OF ICICI BANK LIMITED
SChEDuLESforming part of the Accounts (Contd.)
24.
info
rmat
ion
in r
esp
ect
of
rest
ruct
ured
ass
ets
The
follo
win
g ta
ble
sets
fort
h, fo
r th
e ye
ar e
nded
Mar
ch 3
1, 2
021,
det
ails
of r
estr
uctu
red
loan
ass
ets
unde
r C
DR
AN
D S
ME
Deb
t Res
truc
turin
g m
echa
nism
.
` in
mill
ion,
exc
ept n
umb
er o
f acc
oun
ts
Sr.
no.
type
of R
estr
uctu
ring
Und
er c
dR
mec
hani
smU
nder
Sm
e d
ebt R
estr
uctu
ring
mec
hani
sma
sset
cla
ssifi
catio
nSt
anda
rd (a)
Sub-
St
anda
rd (b)
dou
btfu
l
(c)
loss (d
)
tota
l
(e)
Stan
dard (a
)
Sub-
St
anda
rd (b)
dou
btfu
l
(c)
loss (d
)
tota
l
(e)
det
ails
1.Re
stru
ctur
ed a
ccou
nts
at A
pril
1, 2
020
No.
of b
orro
wer
s4
-10
1832
--
--
-A
mou
nt o
utst
andi
ng55
6.6
-6,
642.
7 15
,138
.7
22,3
38.0
-
--
--
Prov
isio
n th
ereo
n54
.1
-6,
642.
7 15
,138
.7
21,8
35.5
-
--
--
2.Fr
esh
rest
ruct
urin
g du
ring
the
year
end
ed M
arch
31,
20
21N
o. o
f bor
row
ers
--
--
-74
5-
--
745
Am
ount
out
stan
ding
--
--
-10
,306
.8-
--
10,3
06.8
Prov
isio
n th
ereo
n-
--
--
129.
9-
--
129.
93.
Upg
rada
tions
to re
stru
ctur
ed s
tand
ard
cate
gory
dur
ing
the
year
end
ed M
arch
31,
202
1N
o. o
f bor
row
ers
--
--
--
--
--
Am
ount
out
stan
ding
--
--
--
--
--
Prov
isio
n th
ereo
n-
--
--
--
--
-4.
Incr
ease
/(dec
reas
e)
in
borr
ower
le
vel
outs
tand
ing
of e
xist
ing
rest
ruct
ured
cas
es d
urin
g th
e ye
ar e
nded
M
arch
31,
202
11
No.
of b
orro
wer
s-
--
--
--
--
-A
mou
nt o
utst
andi
ng (2
43.8
)-
(0.1
)55
.6
(188
.3)
--
--
-Pr
ovis
ion
ther
eon
212.
3 -
(0.1
)55
.6
267.
8 -
--
--
5.Re
stru
ctur
ed
stan
dard
ad
vanc
es
at
Apr
il 1,
20
20,
whi
ch
ceas
e to
at
trac
t hi
gher
pr
ovis
ioni
ng
and/
or
addi
tiona
l ris
k w
eigh
t at
Mar
ch 3
1, 2
021
and
henc
e ne
ed n
ot b
e sh
own
as re
stru
ctur
ed s
tand
ard
adva
nces
at
Apr
il 1,
202
1N
o. o
f bor
row
ers
-n
.a.
n.a
.(1
)(1
)-
n.a
.n
.a.
n.a
.-
Am
ount
out
stan
ding
-n
.a.
n.a
.(1
31.0
)(1
31.0
)-
n.a
.n
.a.
n.a
.-
Prov
isio
n th
ereo
n-
n.a
.n
.a.
(131
.0)
(131
.0)
-n
.a.
n.a
.n
.a.
-6.
Dow
ngra
datio
ns o
f re
stru
ctur
ed a
ccou
nts
durin
g th
e ye
ar e
nded
Mar
ch 3
1, 2
021
No.
of b
orro
wer
s (1
)-
(9)
10
--
--
--
Am
ount
out
stan
ding
(231
.1)
-(6
,410
.2)
5,61
3.5
(1,0
27.8
)-
--
--
Prov
isio
n th
ereo
n (2
31.1
)-
(6,4
10.2
)5,
613.
5 (1
,027
.8)
--
--
-7.
Writ
e-of
fs/r
ecov
ery/
sale
of
re
stru
ctur
ed
acco
unts
du
ring
the
year
end
ed M
arch
31,
202
1N
o. o
f bor
row
ers
--
-(5
.0)
(5)
--
--
-A
mou
nt o
utst
andi
ng-
--
(1,7
44.6
) (1
,744
.6)
--
--
-Pr
ovis
ion
ther
eon
--
- (1
,744
.6)
(1,7
44.6
)-
--
--
8.Re
stru
ctur
ed a
ccou
nts
at M
arch
31,
202
1N
o. o
f bor
row
ers
3-
122
2674
5-
--
745
Am
ount
out
stan
ding
81.7
-
232.
4 18
,932
.2
19,2
46.3
10
,306
.8-
--
10,3
06.8
Prov
isio
n th
ereo
n35
.3
-23
2.4
18,9
32.2
19
,199
.9
129.
9-
--
129.
9
1. I
ncre
ase/
(dec
reas
e) i
n bo
rrow
er l
evel
out
stan
ding
of
rest
ruct
ured
acc
ount
s is
due
to
repa
ymen
ts,
utili
satio
n of
cas
h cr
edit
faci
lity,
exc
hang
e ra
te f
luct
uatio
n,
accr
ued
inte
rest
, fr
esh
disb
urse
men
t, n
on-f
und
base
d de
volv
emen
t, c
onve
rsio
n of
loa
ns i
nto
equi
ty (
incl
udin
g ap
plic
atio
n m
oney
pen
ding
allo
tmen
t) a
s pa
rt o
f re
stru
ctur
ing
sche
me,
etc
.
Integrated Report Statutory Reports Financial Statements
197

FINANCIAL STATEMENTS OF ICICI BANK LIMITED
SChEDuLESforming part of the Accounts (Contd.)
The
follo
win
g ta
ble
set
s fo
rth,
for
the
year
end
ed M
arch
31,
202
1, d
etai
ls o
f oth
er a
nd to
tal r
estr
uctu
red
loan
ass
ets.
` in
mill
ion,
exc
ept n
umb
er o
f acc
oun
ts
Sr.
n
o.
type
of R
estr
uctu
ring
Oth
ers
tota
la
sset
cla
ssifi
cati
onS
tand
ard (a)
Sub
- S
tand
ard
(b)
dou
btfu
l
(c)
loss (d
)
tota
l
(e)
Sta
ndar
d (a)
Sub
- S
tand
ard
(b)
dou
btfu
l
(c)
loss (d
)
tota
l
(e)
det
ails
1.R
estr
uctu
red
acco
unts
at A
pril
1, 2
020
No.
of b
orro
wer
s5,
296
1,39
02,
043
103
8,83
25,
300
1,39
02,
053
121
8,86
4A
mou
nt o
utst
andi
ng2,
537.
3 26
4.7
58,9
00.6
30
5.0
62,0
07.6
3,
093.
9 26
4.7
65,5
43.3
15
,443
.784
,345
.6
Prov
isio
n th
ereo
n17
7.5
150.
0 51
,088
.5
305.
0 51
,721
.0
231.
6 15
0.0
57,
731.
2 15
,443
.7
73,5
56.5
2.
Fres
h re
stru
ctur
ing
durin
g th
e ye
ar e
nded
Mar
ch 3
1,
2021
No.
of b
orro
wer
s2,
408
3,65
5 61
6 36
6,
715
3,15
3 3,
655
616
36
7,
460
Am
ount
out
stan
ding
20,0
71.3
61
1.6
10,9
50.6
39
.1
31,6
72.6
30
,378
.1
611.
6 1
0,95
0.6
39.1
41
,979
.4
Prov
isio
n th
ereo
n57
3.4
441.
3 10
,880
.3
39.1
11
,934
.1
703.
3 44
1.3
10,
880.
3 39
.1
12,0
64.0
3.
Upg
rada
tions
to
re
stru
ctur
ed
stan
dard
ca
tego
ry
durin
g th
e ye
ar e
nded
Mar
ch 3
1, 2
021
No.
of b
orro
wer
s 6
9 (5
)-
(64)
-69
(5
)-
(64)
-A
mou
nt o
utst
andi
ng76
.6
(7.2
)8.
4 (7
8.6)
(0.8
)76
.6
(7.2
) 8
.4
(78.
6) (0
.8)
Prov
isio
n th
ereo
n2.
3 (1
.0)
5.5
(78.
6) (7
1.8)
2(1
.0)
5.5
(7
8.6)
(71.
8)4.
Incr
ease
/(dec
reas
e) i
n bo
rrow
er l
evel
out
stan
ding
of
exi
stin
g re
stru
ctur
ed c
ases
dur
ing
the
year
end
ed
Mar
ch 3
1, 2
0211
No.
of b
orro
wer
s-
--
--
--
--
-A
mou
nt o
utst
andi
ng (1
9.7)
- (1
,578
.7)
(0.2
) (1
,598
.6)
(263
.5)
- (1
,578
.8)
55.4
(1
,786
.9)
Prov
isio
n th
ereo
n52
.4
0.2
6,03
5.4
(0.2
)6,
087.
8 26
4.7
0.2
6,0
35.3
55
.4
6,35
5.6
5.R
estr
uctu
red
stan
dard
adv
ance
s at
Apr
il 1,
202
0,
whi
ch c
ease
to
attr
act
high
er p
rovi
sion
ing
and/
or a
dditi
onal
ris
k w
eigh
t at
Mar
ch 3
1, 2
021
and
henc
e ne
ed n
ot b
e sh
own
as r
estr
uctu
red
stan
dard
ad
vanc
es a
t Apr
il 1,
202
1N
o. o
f bor
row
ers
-n
.a.
n.a
.n
.a.
--
n.a
.n
.a.
(1)
(1)
Am
ount
out
stan
ding
-n
.a.
n.a
.n
.a.
--
n.a
.n
.a.
(131
.0)
(131
.0)
Prov
isio
n th
ereo
n-
n.a
.n
.a.
n.a
.-
-n
.a.
n.a
.(1
31.0
)(1
31.0
)6.
Dow
ngra
datio
ns o
f re
stru
ctur
ed a
ccou
nts
durin
g th
e ye
ar e
nded
Mar
ch 3
1, 2
021
No.
of b
orro
wer
s (4
1) (1
08)
(223
)37
2 -
(42)
(108
) (2
32)
382
-A
mou
nt o
utst
andi
ng (9
1.1)
(16.
5) (3
,125
.6)
3,17
4.0
(59.
2) (3
22.2
) (1
6.5)
(9,5
35.8
)8,
787.
5 (1
,087
.0)
Prov
isio
n th
ereo
n (6
7.7)
(3.2
) (3
,129
.1)
3,17
4.0
(26.
0) (2
98.8
) (3
.2)
(9,5
39.3
)8,
787.
5 (1
,053
.8)
7.W
rite-
offs
/rec
over
y/sa
le
of
rest
ruct
ured
ac
coun
ts
durin
g th
e ye
ar e
nded
Mar
ch 3
1, 2
021
No.
of b
orro
wer
s(1
58)
(1,2
70)
(1,5
59)
(23)
(3,0
10)
(158
)(1
,270
)(1
,559
)(2
8)(3
,015
)A
mou
nt o
utst
andi
ng (2
74.6
) (2
10.2
) (2
,559
.3)
(191
.2)
(3,2
35.3
) (2
74.6
) (2
10.2
) (2
,559
.3)
(1,9
35.8
) (4
,979
.9)
Prov
isio
n th
ereo
n (6
.6)
(136
.0)
(2,4
23.9
) (1
91.2
) (2
,757
.7)
(6.6
) (1
36.0
) (2
,423
.9)
(1,9
35.8
) (4
,502
.3)
8.R
estr
uctu
red
Acc
ount
s at
Mar
ch 3
1, 2
021
No.
of b
orro
wer
s7,
574
3,66
287
742
412
,537
8,32
23,
662
878
446
13,3
08A
mou
nt o
utst
andi
ng22
,299
.8
642.
4 62
,596
.0
3,24
8.1
88,7
86.3
32
,688
.3
642.
4 6
2,82
8.4
22,1
80.3
11
8,33
9.4
Prov
isio
n th
ereo
n73
1.3
451.
3 62
,456
.7
3,24
8.1
66,8
87.4
89
6.53
451.
33 6
2,68
9.13
22,1
80.3
386
,217
.23
1. I
ncre
ase/
(dec
reas
e) in
bor
row
er le
vel o
utst
andi
ng o
f res
truc
ture
d ac
coun
ts is
due
to re
paym
ents
, util
isat
ion
of c
ash
cred
it fa
cilit
y, e
xcha
nge
rate
fluc
tuat
ion,
acc
rued
in
tere
st,
fres
h di
sbur
sem
ent,
non
-fun
d ba
sed
devo
lvem
ent,
con
vers
ion
of l
oans
int
o eq
uity
(in
clud
ing
appl
icat
ion
pend
ing
allo
tmen
t) a
s pa
rt o
f re
stru
ctur
ing
sche
me,
etc
.2.
‘O
ther
s’ m
echa
nism
als
o in
clud
e ca
ses
rest
ruct
ured
und
er J
oint
Len
der
Foru
m (J
LF) m
echa
nism
. 3.
The
Ban
k ad
ditio
nally
hol
ds p
rovi
sion
am
ount
ing
to `
3,9
24.2
mill
ion
on t
hese
acc
ount
s.
198
Annual Report 2020-21

FINANCIAL STATEMENTS OF ICICI BANK LIMITED
SChEDuLESforming part of the Accounts (Contd.)
The
follo
win
g ta
ble
sets
fort
h, fo
r the
yea
r end
ed M
arch
31,
202
0, d
etai
ls o
f res
truc
ture
d lo
an a
sset
s un
der C
DR
and
SM
E D
ebt R
estr
uctu
ring
mec
hani
sm.
` in
mill
ion,
exc
ept n
umb
er o
f acc
oun
ts
Sr.
n
o.
type
of R
estr
uctu
ring
U
nder
cd
R m
echa
nism
Und
er S
me
deb
t R
estr
uctu
ring
mec
hani
sma
sset
cla
ssifi
cati
onS
tand
ard (a)
Sub
- S
tand
ard
(b)
dou
btfu
l
(c)
loss (d
)
tota
l
(e)
Sta
ndar
d (a)
Sub
- S
tand
ard
(b)
dou
btfu
l
(c)
loss (d
)
tota
l
(e)
det
ails
1.R
estr
uctu
red
acco
unts
at A
pril
1, 2
019
No.
of b
orro
wer
s5
-23
836
1-
--
1A
mou
nt o
utst
andi
ng2,
245.
9 -
27,
153.
5 3,
647.
7 33
,047
.1
279
.6
--
-27
9.6
Prov
isio
n th
ereo
n 2
25.5
-
26,5
62.6
3,
647.
7 30
,435
.8
--
--
-2.
Fres
h re
stru
ctur
ing
durin
g th
e ye
ar e
nded
Mar
ch 3
1,
2020
No.
of b
orro
wer
s-
--
--
--
--
-A
mou
nt o
utst
andi
ng-
--
--
--
--
-Pr
ovis
ion
ther
eon
--
--
--
--
--
3.U
pgra
datio
ns
to
rest
ruct
ured
st
anda
rd
cate
gory
du
ring
the
year
end
ed M
arch
31,
202
0N
o. o
f bor
row
ers
--
--
--
--
--
Am
ount
out
stan
ding
--
--
--
--
--
Prov
isio
n th
ereo
n-
--
--
--
--
-4.
Incr
ease
/(dec
reas
e) i
n bo
rrow
er l
evel
out
stan
ding
of
exi
stin
g re
stru
ctur
ed c
ases
dur
ing
the
year
end
ed
Mar
ch 3
1, 2
0201
No.
of b
orro
wer
s-
--
--
--
--
-A
mou
nt o
utst
andi
ng1,
163.
9 -
(550
.0)
(263
.0)
350.
9 -
--
--
Prov
isio
n th
ereo
n2,
681.
8 -
40.
9 (2
63.0
) 2
,459
.7
--
--
-5.
Res
truc
ture
d st
anda
rd a
dvan
ces
at A
pril
1, 2
019,
w
hich
cea
se t
o at
trac
t hi
gher
pro
visi
onin
g an
d/or
add
ition
al r
isk
wei
ght
at M
arch
31,
202
0 an
d he
nce
need
not
be
show
n as
res
truc
ture
d st
anda
rd
adva
nces
at A
pril
1, 2
020
No.
of b
orro
wer
s-
N.A
.N
.A.
N.A
.-
-N
.A.
N.A
.N
.A.
-A
mou
nt o
utst
andi
ng-
N.A
.N
.A.
N.A
.-
-N
.A.
N.A
.N
.A.
-Pr
ovis
ion
ther
eon
-N
.A.
N.A
.N
.A.
--
N.A
.N
.A.
N.A
.-
6.D
owng
rada
tions
of
rest
ruct
ured
acc
ount
s du
ring
the
year
end
ed M
arch
31,
202
0N
o. o
f bor
row
ers
(1)
- (9
) 1
0 -
--
--
-A
mou
nt o
utst
andi
ng(2
,853
.2)
-(1
5,43
9.8)
17,8
46.1
(4
46.9
)-
--
--
Prov
isio
n th
ereo
n(2
,853
.2)
-(1
5,43
9.8)
17,8
46.1
(4
46.9
)-
--
--
7.W
rite-
offs
/rec
over
y/sa
le
of
rest
ruct
ured
ac
coun
ts
durin
g th
e ye
ar e
nded
Mar
ch 3
1, 2
020
No.
of b
orro
wer
s-
- (4
)-
(4)
(1)
--
-(1
)A
mou
nt o
utst
andi
ng-
-(4
,521
.0)
(6,0
92.1
)(1
0,61
3.1)
(279
.6)
--
-(2
79.6
)Pr
ovis
ion
ther
eon
--
(4,5
21.0
)(6
,092
.1)
(10,
613.
1)-
--
--
8.R
estr
uctu
red
acco
unts
at M
arch
31,
202
0N
o. o
f bor
row
ers
4-
1018
32-
--
--
Am
ount
out
stan
ding
556
.6
-6,
642.
7 15
,138
.7
22,3
38.0
-
--
--
Prov
isio
n th
ereo
n 5
4.1
-6,
642.
7 15
,138
.7
21,8
35.5
-
--
--
1. I
ncre
ase/
(dec
reas
e) i
n bo
rrow
er l
evel
out
stan
ding
of
rest
ruct
ured
acc
ount
s is
due
to
repa
ymen
ts,
utili
satio
n of
cas
h cr
edit
faci
lity,
exc
hang
e ra
te f
luct
uatio
n,
accr
ued
inte
rest
, fr
esh
disb
urse
men
t, n
on-f
und
base
d de
volv
emen
t, c
onve
rsio
n of
loa
ns i
nto
equi
ty (
incl
udin
g ap
plic
atio
n m
oney
pen
ding
allo
tmen
t) a
s pa
rt o
f re
stru
ctur
ing
sche
me,
etc
.
The
follo
win
g ta
ble
set
s fo
rth,
for
the
year
end
ed M
arch
31,
202
1, d
etai
ls o
f oth
er a
nd to
tal r
estr
uctu
red
loan
ass
ets.
` in
mill
ion,
exc
ept n
umb
er o
f acc
oun
ts
Sr.
n
o.
type
of R
estr
uctu
ring
Oth
ers
tota
la
sset
cla
ssifi
cati
onS
tand
ard (a)
Sub
- S
tand
ard
(b)
dou
btfu
l
(c)
loss (d
)
tota
l
(e)
Sta
ndar
d (a)
Sub
- S
tand
ard
(b)
dou
btfu
l
(c)
loss (d
)
tota
l
(e)
det
ails
1.R
estr
uctu
red
acco
unts
at A
pril
1, 2
020
No.
of b
orro
wer
s5,
296
1,39
02,
043
103
8,83
25,
300
1,39
02,
053
121
8,86
4A
mou
nt o
utst
andi
ng2,
537.
3 26
4.7
58,9
00.6
30
5.0
62,0
07.6
3,
093.
9 26
4.7
65,5
43.3
15
,443
.784
,345
.6
Prov
isio
n th
ereo
n17
7.5
150.
0 51
,088
.5
305.
0 51
,721
.0
231.
6 15
0.0
57,
731.
2 15
,443
.7
73,5
56.5
2.
Fres
h re
stru
ctur
ing
durin
g th
e ye
ar e
nded
Mar
ch 3
1,
2021
No.
of b
orro
wer
s2,
408
3,65
5 61
6 36
6,
715
3,15
3 3,
655
616
36
7,
460
Am
ount
out
stan
ding
20,0
71.3
61
1.6
10,9
50.6
39
.1
31,6
72.6
30
,378
.1
611.
6 1
0,95
0.6
39.1
41
,979
.4
Prov
isio
n th
ereo
n57
3.4
441.
3 10
,880
.3
39.1
11
,934
.1
703.
3 44
1.3
10,
880.
3 39
.1
12,0
64.0
3.
Upg
rada
tions
to
re
stru
ctur
ed
stan
dard
ca
tego
ry
durin
g th
e ye
ar e
nded
Mar
ch 3
1, 2
021
No.
of b
orro
wer
s 6
9 (5
)-
(64)
-69
(5
)-
(64)
-A
mou
nt o
utst
andi
ng76
.6
(7.2
)8.
4 (7
8.6)
(0.8
)76
.6
(7.2
) 8
.4
(78.
6) (0
.8)
Prov
isio
n th
ereo
n2.
3 (1
.0)
5.5
(78.
6) (7
1.8)
2(1
.0)
5.5
(7
8.6)
(71.
8)4.
Incr
ease
/(dec
reas
e) i
n bo
rrow
er l
evel
out
stan
ding
of
exi
stin
g re
stru
ctur
ed c
ases
dur
ing
the
year
end
ed
Mar
ch 3
1, 2
0211
No.
of b
orro
wer
s-
--
--
--
--
-A
mou
nt o
utst
andi
ng (1
9.7)
- (1
,578
.7)
(0.2
) (1
,598
.6)
(263
.5)
- (1
,578
.8)
55.4
(1
,786
.9)
Prov
isio
n th
ereo
n52
.4
0.2
6,03
5.4
(0.2
)6,
087.
8 26
4.7
0.2
6,0
35.3
55
.4
6,35
5.6
5.R
estr
uctu
red
stan
dard
adv
ance
s at
Apr
il 1,
202
0,
whi
ch c
ease
to
attr
act
high
er p
rovi
sion
ing
and/
or a
dditi
onal
ris
k w
eigh
t at
Mar
ch 3
1, 2
021
and
henc
e ne
ed n
ot b
e sh
own
as r
estr
uctu
red
stan
dard
ad
vanc
es a
t Apr
il 1,
202
1N
o. o
f bor
row
ers
-n
.a.
n.a
.n
.a.
--
n.a
.n
.a.
(1)
(1)
Am
ount
out
stan
ding
-n
.a.
n.a
.n
.a.
--
n.a
.n
.a.
(131
.0)
(131
.0)
Prov
isio
n th
ereo
n-
n.a
.n
.a.
n.a
.-
-n
.a.
n.a
.(1
31.0
)(1
31.0
)6.
Dow
ngra
datio
ns o
f re
stru
ctur
ed a
ccou
nts
durin
g th
e ye
ar e
nded
Mar
ch 3
1, 2
021
No.
of b
orro
wer
s (4
1) (1
08)
(223
)37
2 -
(42)
(108
) (2
32)
382
-A
mou
nt o
utst
andi
ng (9
1.1)
(16.
5) (3
,125
.6)
3,17
4.0
(59.
2) (3
22.2
) (1
6.5)
(9,5
35.8
)8,
787.
5 (1
,087
.0)
Prov
isio
n th
ereo
n (6
7.7)
(3.2
) (3
,129
.1)
3,17
4.0
(26.
0) (2
98.8
) (3
.2)
(9,5
39.3
)8,
787.
5 (1
,053
.8)
7.W
rite-
offs
/rec
over
y/sa
le
of
rest
ruct
ured
ac
coun
ts
durin
g th
e ye
ar e
nded
Mar
ch 3
1, 2
021
No.
of b
orro
wer
s(1
58)
(1,2
70)
(1,5
59)
(23)
(3,0
10)
(158
)(1
,270
)(1
,559
)(2
8)(3
,015
)A
mou
nt o
utst
andi
ng (2
74.6
) (2
10.2
) (2
,559
.3)
(191
.2)
(3,2
35.3
) (2
74.6
) (2
10.2
) (2
,559
.3)
(1,9
35.8
) (4
,979
.9)
Prov
isio
n th
ereo
n (6
.6)
(136
.0)
(2,4
23.9
) (1
91.2
) (2
,757
.7)
(6.6
) (1
36.0
) (2
,423
.9)
(1,9
35.8
) (4
,502
.3)
8.R
estr
uctu
red
Acc
ount
s at
Mar
ch 3
1, 2
021
No.
of b
orro
wer
s7,
574
3,66
287
742
412
,537
8,32
23,
662
878
446
13,3
08A
mou
nt o
utst
andi
ng22
,299
.8
642.
4 62
,596
.0
3,24
8.1
88,7
86.3
32
,688
.3
642.
4 6
2,82
8.4
22,1
80.3
11
8,33
9.4
Prov
isio
n th
ereo
n73
1.3
451.
3 62
,456
.7
3,24
8.1
66,8
87.4
89
6.53
451.
33 6
2,68
9.13
22,1
80.3
386
,217
.23
1. I
ncre
ase/
(dec
reas
e) in
bor
row
er le
vel o
utst
andi
ng o
f res
truc
ture
d ac
coun
ts is
due
to re
paym
ents
, util
isat
ion
of c
ash
cred
it fa
cilit
y, e
xcha
nge
rate
fluc
tuat
ion,
acc
rued
in
tere
st,
fres
h di
sbur
sem
ent,
non
-fun
d ba
sed
devo
lvem
ent,
con
vers
ion
of l
oans
int
o eq
uity
(in
clud
ing
appl
icat
ion
pend
ing
allo
tmen
t) a
s pa
rt o
f re
stru
ctur
ing
sche
me,
etc
.2.
‘O
ther
s’ m
echa
nism
als
o in
clud
e ca
ses
rest
ruct
ured
und
er J
oint
Len
der
Foru
m (J
LF) m
echa
nism
. 3.
The
Ban
k ad
ditio
nally
hol
ds p
rovi
sion
am
ount
ing
to `
3,9
24.2
mill
ion
on t
hese
acc
ount
s.
Integrated Report Statutory Reports Financial Statements
199

FINANCIAL STATEMENTS OF ICICI BANK LIMITED
SChEDuLESforming part of the Accounts (Contd.)
The
follo
win
g ta
ble
set
s fo
rth,
for
the
year
end
ed M
arch
31,
202
0, d
etai
ls o
f oth
er a
nd to
tal r
estr
uctu
red
loan
ass
ets.
` in
mill
ion,
exc
ept n
umb
er o
f acc
oun
ts
Sr.
n
o.
type
of R
estr
uctu
ring
Oth
ers
tota
la
sset
cla
ssifi
cati
onS
tand
ard (a)
Sub
- S
tand
ard
(b)
dou
btfu
l
(c)
loss (d
)
tota
l
(e)
Sta
ndar
d (a)
Sub
- S
tand
ard
(b)
dou
btfu
l
(c)
loss (d
)
tota
l
(e)
det
ails
1.R
estr
uctu
red
acco
unts
at A
pril
1, 2
019
No.
of b
orro
wer
s23
51,
005
2,02
392
3,35
524
11,
005
2,04
610
03,
392
Am
ount
out
stan
ding
965
.4
2,85
2.7
57,
611.
6 3
44.9
6
1,77
4.6
3,49
0.9
2,8
52.7
8
4,76
5.1
3,99
2.6
95,1
01.3
Pr
ovis
ion
ther
eon
53.4
5
62.5
46
,739
.9
344
.9
47,
700.
7 2
78.9
5
62.5
7
3,30
2.5
3,99
2.6
78,1
36.5
2.
Fres
h re
stru
ctur
ing
durin
g th
e ye
ar e
nded
Mar
ch 3
1,
2020
No.
of b
orro
wer
s5,
259
1,38
1 8
59
14
7,5
13
5,2
59
1,3
81
859
1
4 7
,513
A
mou
nt o
utst
andi
ng2,
040.
5 2
50.8
2
0,30
5.2
39.
3 2
2,63
5.8
2,04
0.5
250
.8
20,
305.
2 3
9.3
22,6
35.8
Pr
ovis
ion
ther
eon
159.
6 1
42.7
12
,810
.5
39.3
13
,152
.1
159
.6
142
.7
12,
810.
5 3
9.3
13,1
52.1
3.
Upg
rada
tions
to
re
stru
ctur
ed
stan
dard
ca
tego
ry
durin
g th
e ye
ar e
nded
Mar
ch 3
1, 2
020
No.
of b
orro
wer
s1
4 (4
) (1
)-
1
4
(4)
(1)
-A
mou
nt o
utst
andi
ng 0
.3
0.1
(0
.1)
(0.4
) (0
.1)
0.3
0
.1
(0.1
) (0
.4)
(0.1
)Pr
ovis
ion
ther
eon
- 0
.1
(0.1
) (0
.4)
(0.4
)-
0.1
(0
.1)
(0.4
) (0
.4)
4.In
crea
se/(D
ecre
ase)
in
borr
ower
lev
el o
utst
andi
ng
of e
xist
ing
rest
ruct
ured
cas
es d
urin
g th
e ye
ar e
nded
M
arch
31,
202
01
No.
of b
orro
wer
s-
--
--
--
--
-A
mou
nt o
utst
andi
ng (4
12.3
) (1
47.7
) 1
,955
.8
(58.
9)1,
336.
9 7
51.6
(1
47.7
) 1
,405
.8
(321
.9)
1,68
7.8
Prov
isio
n th
ereo
n (3
2.4)
84.
5 11
,913
.5
(58.
9) 1
1,90
6.7
2,6
49.4
8
4.5
11,
954.
4 (3
21.9
)14
,366
.4
5.R
estr
uctu
red
stan
dard
adv
ance
s at
Apr
il 1,
201
9,
whi
ch c
ease
to
attr
act
high
er p
rovi
sion
ing
and/
or a
dditi
onal
ris
k w
eigh
t at
Mar
ch 3
1, 2
020
and
henc
e ne
ed n
ot b
e sh
own
as r
estr
uctu
red
stan
dard
ad
vanc
es a
t Apr
il 1,
202
0N
o. o
f bor
row
ers
-N
.A.
N.A
.N
.A.
--
N.A
.N
.A.
N.A
.-
Am
ount
out
stan
ding
-N
.A.
N.A
.N
.A.
--
N.A
.N
.A.
N.A
.-
Prov
isio
n th
ereo
n-
N.A
.N
.A.
N.A
.-
-N
.A.
N.A
.N
.A.
-6.
Dow
ngra
datio
ns o
f re
stru
ctur
ed a
ccou
nts
durin
g th
e ye
ar e
nded
Mar
ch 3
1, 2
020
No.
of b
orro
wer
s (1
4) (4
82)
481
1
5 -
(15)
(482
) 4
72
25
-A
mou
nt o
utst
andi
ng (1
1.8)
(126
.1)
(145
.5)
97.
4 (1
86.0
)(2
,865
.0)
(126
.1)
(15,
585.
3)17
,943
.5
(632
.9)
Prov
isio
n th
ereo
n (1
.1)
(68.
7) (1
66.6
) 9
7.4
(139
.0)
(2,8
54.3
) (6
8.7)
(15,
606.
4)17
,943
.5
(585
.9)
7.W
rite-
offs
/rec
over
y/sa
le
of
rest
ruct
ured
ac
coun
ts
durin
g th
e ye
ar e
nded
Mar
ch 3
1, 2
020
No.
of b
orro
wer
s(1
85)
(518
)(1
,316
)(1
7)(2
,036
)(1
86)
(518
)(1
,320
)(1
7)(2
,041
)A
mou
nt o
utst
andi
ng(4
4.8)
(2,5
65.1
)(2
0,82
6.4)
(117
.3)
(23,
553.
6) (3
24.4
)(2
,565
.1)
(25,
347.
4)(6
,209
.4)
(34,
446.
3)Pr
ovis
ion
ther
eon
(2.0
) (5
71.1
)(2
0,20
8.7)
(117
.3)
(20,
899.
1) (2
.0)
(571
.1)
(24,
729.
7)(6
,209
.4)
(31,
512.
2)8.
Res
truc
ture
d A
ccou
nts
at M
arch
31,
202
0N
o. o
f bor
row
ers
5,29
61,
390
2,04
310
38,
832
5,30
01,
390
2,05
312
18,
864
Am
ount
out
stan
ding
2,53
7.3
264
.7
58,9
00.6
3
05.0
6
2,00
7.6
3,0
93.9
2
64.7
6
5,54
3.3
15,
443.
7 8
4,34
5.6
Prov
isio
n th
ereo
n17
7.5
150
.0
51,
088.
5 3
05.0
5
1,72
1.0
231
.63
150
.03
57,7
31.2
315
,443
.73
73,5
56.5
3
1. I
ncre
ase/
(dec
reas
e) in
bor
row
er le
vel o
utst
andi
ng o
f res
truc
ture
d ac
coun
ts is
due
to re
paym
ents
, util
isat
ion
of c
ash
cred
it fa
cilit
y, e
xcha
nge
rate
fluc
tuat
ion,
acc
rued
in
tere
st,
fres
h di
sbur
sem
ent,
non
-fun
d ba
sed
devo
lvem
ent,
con
vers
ion
of l
oans
int
o eq
uity
(in
clud
ing
appl
icat
ion
pend
ing
allo
tmen
t) a
s pa
rt o
f re
stru
ctur
ing
sche
me,
etc
.2.
Oth
ers’
mec
hani
sm a
lso
incl
ude
case
s re
stru
ctur
ed u
nder
Joi
nt L
ende
r Fo
rum
(JLF
) mec
hani
sm.
3. T
he B
ank
addi
tiona
lly h
olds
pro
visi
on a
mou
ntin
g to
` 1
87.2
mill
ion
on t
hese
acc
ount
s.
200
Annual Report 2020-21

FINANCIAL STATEMENTS OF ICICI BANK LIMITED
SChEDuLESforming part of the Accounts (Contd.)
The following table sets forth, for the periods indicated, details of cases where scheme for Sustainable Structuring of Stressed Assets (S4A) is implemented.
` in million, except number of borrowers
particularsat
march 31, 2021at
march 31, 2020Number of borrowers where S4A has been applied 6 6
Total gross amount outstanding1
- Standard - 1,977.12
- NPA 7,881.7 5,992.2
Gross amount outstanding in Part A
- Standard - 1,225.32
- NPA 4,521.8 3,384.1
Gross amount outstanding in Part B
- Standard - 751.82
- NPA 3,359.8 2,608.1
Provision held
- Standard - 455.6
- NPA 6,531.3 4,267.9
1. Represents loans, credit substitutes and shares under S4A scheme. 2. Includes outstanding amounting to ` 1,225.3 million which was upgraded to standard from NPA on implementation of S4A and
` 751.8 million which was upgraded to standard from NPA on satisfactory performance during specified period.
The Bank does not recognise any amount towards interest on the cases under S4A.
25. accounts restructured under micro, Small and medium enterprises (mSme) sector The following table sets forth, for the periods indicated, the details of accounts restructured under MSME sector
under RBI guidelines issued in January 2019. ` in million, except number of accounts
at march 31, 2021 at march 31, 2020number of accounts
restructuredamount
outstandingnumber of accounts
restructuredamount
outstanding
746 10,325.1 - -
26. Resolution of stressed assets During the year ended March 31, 2021, the Bank has implemented resolution plan for three borrower amounting to
` 6,553.2 million (March 31, 2020: ` 24,631.9 million) under the prudential framework for stressed assets issued by RBI on June 7, 2019.
27. classification and provisioning under RBi covid-19 Regulatory package RBI through its circulars dated March 27, 2020, April 17, 2020 and May 23, 2020 on Covid-19 regulatory package
permitted banks to grant a moratorium to their customers on the payment of instalments and/or interest, falling due between March 1, 2020 and August 31, 2020. The Bank had accordingly extended the moratorium option to its borrowers in accordance with its Board approved policies.
Integrated Report Statutory Reports Financial Statements
201
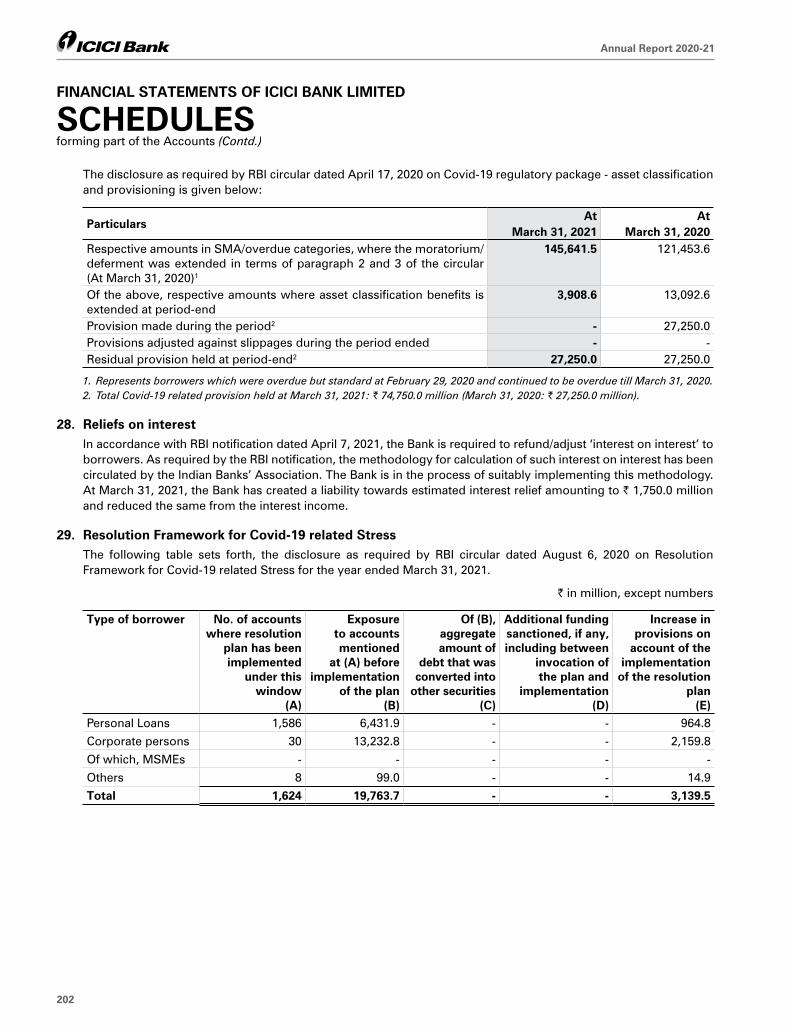
FINANCIAL STATEMENTS OF ICICI BANK LIMITED
SChEDuLESforming part of the Accounts (Contd.)
The disclosure as required by RBI circular dated April 17, 2020 on Covid-19 regulatory package - asset classification and provisioning is given below:
particularsat
march 31, 2021at
march 31, 2020Respective amounts in SMA/overdue categories, where the moratorium/deferment was extended in terms of paragraph 2 and 3 of the circular (At March 31, 2020)1
145,641.5 121,453.6
Of the above, respective amounts where asset classification benefits is extended at period-end
3,908.6 13,092.6
Provision made during the period2 - 27,250.0Provisions adjusted against slippages during the period ended - -Residual provision held at period-end2 27,250.0 27,250.0
1. Represents borrowers which were overdue but standard at February 29, 2020 and continued to be overdue till March 31, 2020. 2. Total Covid-19 related provision held at March 31, 2021: ` 74,750.0 million (March 31, 2020: ` 27,250.0 million).
28. Reliefs on interest In accordance with RBI notification dated April 7, 2021, the Bank is required to refund/adjust ‘interest on interest’ to
borrowers. As required by the RBI notification, the methodology for calculation of such interest on interest has been circulated by the Indian Banks’ Association. The Bank is in the process of suitably implementing this methodology. At March 31, 2021, the Bank has created a liability towards estimated interest relief amounting to ` 1,750.0 million and reduced the same from the interest income.
29. Resolution Framework for covid-19 related Stress The following table sets forth, the disclosure as required by RBI circular dated August 6, 2020 on Resolution
Framework for Covid-19 related Stress for the year ended March 31, 2021.
` in million, except numbers
type of borrower no. of accounts where resolution
plan has been implemented
under this window
(a)
exposure to accounts mentioned
at (a) before implementation
of the plan(B)
Of (B), aggregate amount of
debt that was converted into
other securities(c)
additional funding sanctioned, if any, including between
invocation of the plan and
implementation(d)
increase in provisions on
account of the implementation
of the resolution plan
(e)Personal Loans 1,586 6,431.9 - - 964.8
Corporate persons 30 13,232.8 - - 2,159.8
Of which, MSMEs - - - - -
Others 8 99.0 - - 14.9
total 1,624 19,763.7 - - 3,139.5
202
Annual Report 2020-21

FINANCIAL STATEMENTS OF ICICI BANK LIMITED
SChEDuLESforming part of the Accounts (Contd.)
30. concentration of deposits, advances, exposures and npas (I) Concentration of deposits, advances, exposures and NPAs
` in million
concentration of depositsat
march 31, 2021at
march 31, 2020Total deposits of 20 largest depositors 501,242.3 376,510.0Deposits of 20 largest depositors as a percentage of total deposits of the Bank 5.38% 4.88%
` in million
concentration of advances1 atmarch 31, 2021
atmarch 31, 2020
Total advances to 20 largest borrowers (including banks) 1,870,624.9 1,300,672.3 Advances to 20 largest borrowers as a percentage of total advances of the Bank 13.77% 10.96%
1. Represents credit exposure (funded and non-funded) including derivatives exposures as per RBI guidelines on exposure norms.
` in million
concentration of exposures1 atmarch 31, 2021
atmarch 31, 2020
Total exposure to 20 largest borrowers/customers (including banks) 2,058,661.7 1,435,623.3 Exposures to 20 largest borrowers/customers as a percentage of total exposure of the Bank 14.47% 11.53%
1. Represents credit and investment exposures as per RBI guidelines on exposure norms.
` in million
concentration of npasat
march 31, 2021at
march 31, 2020Total exposure1 to top four NPA accounts 91,770.3 96,544.6
1. Represents gross exposure (funded and non-funded).
Integrated Report Statutory Reports Financial Statements
203

FINANCIAL STATEMENTS OF ICICI BANK LIMITED
SChEDuLESforming part of the Accounts (Contd.)
(II) Sector-wise advances
` in million, except percentages
Sr. no. particulars
at march 31, 2021
Outstanding advances Gross npas1
% of gross npas1 to total advances
in that sectora. priority sector 1. Agriculture and allied activities 480,800.5 20,583.1 4.28%
2. Advances to industries sector eligible as priority sector lending 546,536.4 8,801.7 1.61%
3. Services of which: Transport operators Wholesale trade
305,603.6
159,482.295,369.8
16,078.3
12,229.62,214.3
5.26%
7.67%2.32%
4. Personal loans of which: Housing Vehicle loans
740,504.6
614,468.294,732.5
25,449.8
16,297.96,856.8
3.44%
2.65%7.24%
Sub-total (a) 2,073,445.1 70,912.9 3.42%B. non-priority sector
1. Agriculture and allied activities - - -
2. Advances to industries sectorof which: Infrastructure Basic metal and metal products Construction Chemicals and chemical products
1,593,220.4
491,261.9173,798.4153,547.8151,653.0
211,424.1
60,460.97,827.9
54,262.314,478.2
13.27%
12.31%4.50%
35.34%9.55%
3. Services of which: Commercial real estate Wholesale trade Non-banking financial companies
1,400,763.5
389,985.6209,439.8383,460.3
59,334.5
19,479.17,840.2
269.4
4.24%
4.99%3.74%0.07%
4. Personal loans2
of which: Housing
2,588,001.2
1,500,326.8
66,742.7
31,546.8
2.58%
2.10%
Sub-total (B) 5,581,985.1 337,501.3 6.05%
total (a)+(B) 7,655,430.2 408,414.2 5.33%
1. Represents loans and advances.2. Excludes commercial business loans and dealer funding.3. Sub-sectors have been disclosed where advances exceed 10% of total advances in that sector at reporting date.
204
Annual Report 2020-21

FINANCIAL STATEMENTS OF ICICI BANK LIMITED
SChEDuLESforming part of the Accounts (Contd.)
` in million, except percentages
Sr. no.
particulars
at march 31, 2020
Outstanding advances
Gross npas1
% of gross npas1 to total advances
in that sectora. priority sector
1. Agriculture and allied activities 466,163.8 19,693.9 4.22%
2. Advances to industries sector eligible as priority sector lending 507,974.3 5,782.1 1.14%
3. Services of which: Transport operators Wholesale trade
260,812.8
139,813.2 85,465.9
8,145.0
6,075.0 1,525.5
3.12%
4.35%1.78%
4. Personal loans of which: Housing Vehicle loans
697,468.4
523,662.8 129,484.9
10,371.5
5,652.4 3,935.5
1.49%
1.08%3.04%
Sub-total (a) 1,932,419.3 43,992.5 2.28%B. non-priority sector1. Agriculture and allied activities - - -2. Advances to industries sector
of which: Infrastructure Basic metal and metal products Chemicals and chemical products
1,586,254.5
495,101.2 207,853.8 180,007.4
250,849.3
81,811.5 14,039.3 14,637.3
15.81%
16.52%6.75%8.13%
3. Services of which: Commercial real estate Wholesale trade Non-banking financial companies
1,212,242.9
373,138.0 149,574.5 179,949.4
82,495.3
20,254.3 17,834.3 2,500.1
6.81%
5.43%11.92%1.39%
4. Personal loans2 of which: Housing
2,031,986.6
1,222,436.9
30,953.8
13,163.2
1.52%
1.08%Sub-total (B) 4,830,484.0 364,298.4 7.54%total (a)+(B) 6,762,903.3 408,290.9 6.04%
1. Represents loans and advances.2. Excludes commercial business loans and dealer funding. 3. Sub-sectors have been disclosed where advances exceed 10% of total advances in that sector at reporting date.
Integrated Report Statutory Reports Financial Statements
205

FINANCIAL STATEMENTS OF ICICI BANK LIMITED
SChEDuLESforming part of the Accounts (Contd.)
(III) Overseas assets, NPAs1 and revenue ` in million
particularsYear ended
march 31, 2021Year ended
march 31, 2020Total assets2 858,033.1 759,926.1Total NPAs (net) 10,972.5 21,666.5Total revenue2 17,385.6 33,259.2
1. Represents loans and advances.2. Represents the total assets and total revenue of foreign operations as reported in Schedule 18 of the financial statements, note
no. 5 on information about business and geographical segments.
(IV) Off-balance sheet special purpose vehicles (SPVs) sponsored (which are required to be consolidated as per accounting norms) for the year ended March 31, 2021
1. The following table sets forth, the names of SPVs/trusts sponsored by the Bank/subsidiaries which are consolidated.
Sr. no. name of the SpV sponsored1
a. domestic1. ICICI Strategic Investments Fund2
2. India Advantage Fund-III2
3. India Advantage Fund-IV2
B. OverseasNone
1. SPVs/Trusts which are consolidated and set-up/sponsored by the Bank/subsidiaries of the Bank. 2. The nature of business of the above entities is venture capital fund.
2. The following table sets forth, the names of SPVs/trusts which are not sponsored by the Bank/subsidiaries and are consolidated.
Sr. no. name of the SpV
a. domesticNone
B. OverseasNone
31. intra-group exposure The following table sets forth, for the periods indicated, the details of intra-group exposure. ` in million
Sr. no.
particularsat
march 31, 2021at
march 31, 20201. Total amount of intra-group exposures 143,907.8 114,962.02. Total amount of top 20 intra-group exposures 143,907.6 114,961.83. Percentage of intra-group exposure to total exposures of the Bank
on borrowers/customers 1.01% 0.92%4. Details of breach of limits on intra-group exposures and regulatory
action thereon, if any nil Nil
206
Annual Report 2020-21

FINANCIAL STATEMENTS OF ICICI BANK LIMITED
SChEDuLESforming part of the Accounts (Contd.)
32. exposure to sensitive sectors The Bank has exposure to sectors, which are sensitive to asset price fluctuations. The sensitive sectors include
capital markets and real estate.
The following table sets forth, for the periods indicated, the position of exposure to capital market sector.
` in million
Sr. no.
particularsat
march 31, 2021at
march 31, 20201. Direct investment in equity shares, convertible bonds, convertible
debentures and units of equity-oriented mutual funds, the corpus of which is not exclusively invested in corporate debt 50,255.7 71,562.0
2. Advances against shares/bonds/ debentures or other securities or on clean basis to individuals for investment in shares (including IPOs/ESOPs), convertible bonds, convertible debentures and units of equity-oriented mutual funds 1,823.5 2,087.8
3. Advances for any other purposes where shares or convertible bonds or convertible debentures or units of equity oriented mutual funds are taken as primary security 22,338.1 36,919.0
4. Advances for any other purposes to the extent secured by the collateral security of shares or convertible bonds or convertible debentures or units of equity oriented mutual funds i.e. where the primary security other than shares/convertible bonds/ convertible debentures/units of equity oriented mutual funds does not fully cover the advances 1,133.0 -
5. Secured and unsecured advances to stockbrokers and guarantees issued on behalf of stock brokers and market makers 109,546.4 109,641.9
6. Loans sanctioned to corporate against the security of shares/bonds/debentures or other securities or on clean basis for meeting promoter’s contribution to the equity of new companies in anticipation of raising resources - -
7. Bridge loans to companies against expected equity flows/issues - -
8. Underwriting commitments taken up by the Bank in respect of primary issue of shares or convertible bonds or convertible debentures or units of equity oriented mutual funds - -
9. Financing to stockbrokers for margin trading - -10. All exposures to venture capital funds (both registered and
unregistered) 9,413.0 10,479.311. Others - 15,000.0
total exposure to capital market1 194,509.7 245,690.0
1. At March 31, 2021, excludes investment in equity shares of ` 22,619.2 million (March 31, 2020: ` 24,310.4 million) exempted from the regulatory ceiling, out of which investments of ` 21,016.0 million (March 31, 2020: ` 22,707.1 million) were acquired under resolution schemes of RBI.
Integrated Report Statutory Reports Financial Statements
207

FINANCIAL STATEMENTS OF ICICI BANK LIMITED
SChEDuLESforming part of the Accounts (Contd.)
The following table sets forth, for the periods indicated, the summary of exposure to real estate sector. ` in million
Sr. no.
particularsat
march 31, 2021at
march 31, 2020i. direct exposure 2,976,380.4 2,502,742.5
1. Residential mortgages 2,355,904.4 1,922,051.9 of which: individual housing loans eligible for priority sector
advances 350,236.7 292,905.82. Commercial real estate1 587,702.3 541,521.03. Investments in Mortgage Backed Securities (MBS) and other
securitised exposure 32,773.7 39,169.6 a. Residential 28,270.4 34,195.7 b. Commercial real estate 4,503.3 4,973.9
ii. indirect exposure 246,635.7 207,157.4Fund based and non-fund based exposures on National Housing Bank (NHB) and Housing Finance Companies (HFCs) 246,635.7 207,157.4total exposure to real estate sector 3,223,016.1 2,709,899.9
1. Commercial real estate exposure includes loans to individuals against non-residential premises, loans given to land and building developers for construction, corporate loans for development of special economic zone, loans to borrowers where servicing of loans is from a real estate activity and exposures to mutual funds/venture capital funds/private equity funds investing primarily in the real estate companies.
33. Factoring business At March 31, 2021, the outstanding receivables acquired by the Bank under factoring business were ` 31,268.6
million (March 31, 2020: ` 6,475.8 million).
34. Risk category-wise country exposure As per the extant RBI guidelines, the country exposure of the Bank is categorised into various risk categories listed in
the following table. The funded country exposure (net) of the Bank as a percentage of total funded assets for United States of America was 4.07% (March 31, 2020: 1.86%), for Singapore was 0.46% (March 31, 2020: 1.03%) and for United Kingdom was 1.28% (March 31, 2020: 0.78%). As the net funded exposure to United States of America and United Kingdom at March 31, 2021, exceeded 1.00% of total funded assets (March 31, 2020: United States of America and Singapore), the Bank held a provision of ` 565.0 million on country exposure at March 31, 2021 (March 31, 2020: ` 465.0 million) based on RBI guidelines.
The following table sets forth, for the periods indicated, the details of exposure (net) and provision held by the bank.
` in million
Risk categoryexposure (net) at
march 31, 2021provision held at
march 31, 2021exposure (net) at
march 31, 2020provision held at
march 31, 2020Insignificant 1,066,722.8 565.0 902,891.2 465.0 Low 300,160.1 - 300,756.5 -Moderately Low 15,470.6 - 954.6 -Moderate 16,142.0 - 26,775.7 -Moderately High 1.6 - 38.8 -High - - - -Very High - - - -
total 1,398,497.1 565.0 1,231,416.8 465.0
208
Annual Report 2020-21

FINANCIAL STATEMENTS OF ICICI BANK LIMITED
SChEDuLESforming part of the Accounts (Contd.)
35. details of Single counterparty limit and Group of connected counterparties limit exceeded by the Bank During the year ended March 31, 2021 and March 31, 2020, the Bank has complied with the relevant RBI guidelines
on exposure limits to single counterparty and group of connected counterparties.
36. Unsecured advances against intangible assets The Bank has not made advances against intangible collaterals of the borrowers, which are classified as ‘Unsecured’
in the financial statements at March 31, 2021 (March 31, 2020: Nil).
37. Revaluation of fixed assets The Bank follows the revaluation model for its premises (land and buildings) other than improvements to leasehold
property as per AS 10 – ‘Property, Plant and Equipment’. As per the Bank’s policy, annual revaluation is carried out through external valuers, using methodologies such as direct sales comparison method and income capitalisation method and the incremental amount has been taken to revaluation reserve. The revalued amount at March 31, 2021 was ` 56,451.6 million (March 31, 2020: ` 57,072.8 million) as compared to the historical cost less accumulated depreciation of ` 25,515.7 million (March 31, 2020: ` 25,924.1 million).
The revaluation reserve is not available for distribution of dividend.
38. Fixed assets The following table sets forth, for the periods indicated, the movement in software acquired by the Bank, as included
in fixed assets. ` in million
particularsat
march 31, 2021at
march 31, 2020At cost at March 31 of preceding year 19,879.4 17,403.4 Additions during the year 6,014.7 2,682.7 Deductions during the year (351.2) (206.7)Depreciation to date (18,447.1) (15,592.6)Net block 7,095.8 4,286.8
39. debt assets swap transactions During the year ended March 31, 2021, the Bank did not acquire any non-banking assets under debt-asset swap
transactions (year ended March 31, 2020: Nil).
During the year ended March 31, 2021, the Bank sold non-banking assets with book value of ` 942.4 million (year ended March 31, 2020: ` 1,317.4 million), which were fully provided, at a sale consideration of ` 1,263.0 million (year ended March 31, 2020: ` 1,632.0 million).
The net book value of non-banking assets acquired in satisfaction of claims by the Bank outstanding at March 31, 2021 was Nil (March 31, 2020: Nil), net of provision held of ` 29,575.4 million (March 31, 2020: ` 30,517.8 million).
Integrated Report Statutory Reports Financial Statements
209

FINANCIAL STATEMENTS OF ICICI BANK LIMITED
SChEDuLESforming part of the Accounts (Contd.)
40. lease I. Assets taken under operating lease Operating leases primarily comprise office premises which are renewable at the option of the Bank.
(i) The following table sets forth, for the periods indicated, the details of liability for premises taken on non-cancellable operating leases.
` in million
particularsat
march 31, 2021at
march 31, 2020Not later than one year 141.6 244.2Later than one year and not later than five years 52.1 126.4 Later than five years 9.9 -total 203.6 370.6
(ii) Total of non-cancellable lease payments recognised in the profit and loss account for the year ended March 31, 2021 is ` 301.9 million (Year ended March 31, 2020 ` 428.2 million).
II. Assets taken under finance lease The following table sets forth, for the periods indicated, the details of assets taken on finance leases.
` in million
particularsat
march 31, 2021at
march 31, 2020a. total minimum lease payments outstandingNot later than one year 241.2 112.6Later than one year and not later than five years 806.1 369.0Later than five years 138.7 -total 1,186.0 481.6B. interest cost payableNot later than one year 97.4 52.2Later than one year and not later than five years 186.2 101.8Later than five years 9.2 -total 292.8 154.0c. present value of minimum lease payments payable(a-B)Not later than one year 143.7 60.4Later than one year and not later than five years 619.9 267.2Later than five years 129.6 -total 893.2 327.6
210
Annual Report 2020-21

FINANCIAL STATEMENTS OF ICICI BANK LIMITED
SChEDuLESforming part of the Accounts (Contd.)
41. description of contingent liabilities The following table describes the nature of contingent liabilities of the Bank.
Sr. no.
contingent liability Brief description
1. Claims against the Bank, not acknowledged as debts
This item represents demands made in certain tax and legal matters against the Bank in the normal course of business and customer claims arising in fraud cases. In accordance with the Bank’s accounting policy and AS 29, the Bank has reviewed and classified these items as possible obligations based on legal opinion/judicial precedents/assessment by the Bank.
2. Liability for partly paid investments
This item represents amounts remaining unpaid towards liability for partly paid investments. These payment obligations of the Bank do not have any profit/loss impact.
3. Liability on account of outstanding forward exchange contracts
The Bank enters into foreign exchange contracts in the normal course of its business, to exchange currencies at a pre-fixed price at a future date. This item represents the notional principal amount of such contracts, which are derivative instruments. With respect to the transactions entered into with its customers, the Bank generally enters into off-setting transactions in the inter-bank market. This results in generation of a higher number of outstanding transactions, and hence a large value of gross notional principal of the portfolio, while the net market risk is lower.
4. Guarantees given on behalf of constituents, acceptances, endorsements and other obligations
This item represents the guarantees and documentary credits issued by the Bank in favour of third parties on behalf of its customers, as part of its trade finance banking activities with a view to augment the customers’ credit standing. Through these instruments, the Bank undertakes to make payments for its customers’ obligations, either directly or in case the customers fail to fulfill their financial or performance obligations.
5. Currency swaps, interest rate swaps, currency options and interest rate futures
This item represents the notional principal amount of various derivative instruments which the Bank undertakes in its normal course of business. The Bank offers these products to its customers to enable them to transfer, modify or reduce their foreign exchange and interest rate risks. The Bank also undertakes these contracts to manage its own interest rate and foreign exchange positions. With respect to the transactions entered into with its customers, the Bank generally enters into off-setting transactions in the inter-bank market. This results in generation of a higher number of outstanding transactions, and hence a large value of gross notional principal of the portfolio, while the net market risk is lower.
6. Other items for which the Bank is contingently liable
Other items for which the Bank is contingently liable primarily include the amount of government securities bought/sold and remaining to be settled on the date of financial statements. This also includes amount transferred to RBI under the Depositor Education and Awareness Fund (DEAF), commitment towards contribution to venture fund, the amount that the Bank is obligated to pay under capital contracts and letter of undertaking and indemnity letters. Capital contracts are job orders of a capital nature which have been committed.
42. insurance business The following table sets forth, for the periods indicated, the break-up of income derived from insurance business.
` in million
Sr. no.
particularsYear ended
march 31, 2021Year ended
march 31, 20201. Income from selling life insurance policies 6,363.9 8,499.92. Income from selling non-life insurance policies 1,152.3 1,772.53. Income from selling mutual fund/collective investment scheme
products 1,997.6 1,548.8
Integrated Report Statutory Reports Financial Statements
211

FINANCIAL STATEMENTS OF ICICI BANK LIMITED
SChEDuLESforming part of the Accounts (Contd.)
43. employee benefits
Pension The following tables set forth, for the periods indicated, movement of the present value of the defined benefit
obligation, fair value of plan assets and other details for pension benefits.` in million
particularsYear ended
march 31, 2021Year ended
march 31, 2020Opening obligations 19,914.3 16,540.3Service cost 237.2 226.1Interest cost 1,173.9 1,147.4Actuarial (gain)/loss 1,256.2 4,633.7Liabilities extinguished on settlement (2,198.1) (2,518.0)Benefits paid (117.9) (115.2)Obligations at the end of year 20,265.6 19,914.3Opening plan assets, at fair value 16,972.1 15,438.8Expected return on plan assets 1,350.8 1,235.8Actuarial gain/(loss) 521.9 741.1Assets distributed on settlement (2,442.3) (2,797.7)Contributions 4,877.6 2,469.3Benefits paid (117.9) (115.2)closing plan assets, at fair value 21,162.2 16,972.1Fair value of plan assets at the end of the year 21,162.2 16,972.1Present value of the defined benefit obligations at the end of the year (20,265.6) (19,914.3)Amount not recognised as an asset (limit in Para 59(b) of AS 15 on ‘employee benefits’) (304.8) -asset/(liability) 591.8 (2,942.2)cost1
Service cost 237.2 226.1Interest cost 1,173.9 1,147.4Expected return on plan assets (1,350.8) (1,235.8)Actuarial (gain)/loss 734.3 3,892.6Curtailments & settlements (gain)/loss 244.2 279.7Effect of the limit in para 59(b) of AS 15 on ‘employee benefits’ 304.8 -net cost 1,343.6 4,310.0Actual return on plan assets 1,872.7 1,976.9Expected employer’s contribution next year 2,000.0 1,000.0investment details of plan assetsInsurer managed funds - 1.01%Government of India securities 50.15% 50.33%Corporate bonds 44.81% 44.85%Equity securities in listed companies 5.04% 2.59%Others - 1.22%assumptionsDiscount rate 5.75% 6.00%Salary escalation rate: On Basic pay 1.50% 1.50% On Dearness relief 7.00% 7.00%Estimated rate of return on plan assets 7.50% 8.00%
1. Included in line item ‘Payments to and provision for employees’ of Schedule-16 Operating expenses.
Estimated rate of return on plan assets is based on the expected average long-term rate of return on investments of the Fund during the estimated term of the obligations.
212
Annual Report 2020-21

FINANCIAL STATEMENTS OF ICICI BANK LIMITED
SChEDuLESforming part of the Accounts (Contd.)
Experience adjustment
` in million
particularsYear ended
march 31, 2021Year ended
march 31, 2020Year ended
march 31, 2019Year ended
march 31, 2018Year ended
march 31, 2017
Plan assets 21,162.2 16,972.1 15,438.8 16,303.7 16,888.1
Defined benefit obligations (20,265.6) (19,914.3) (16,540.3) (15,391.1) (16,686.9)
Amount not recognised as an asset (limit in para 59(b) of AS 15 on ‘employee benefits’) (304.8) - - (310.1) (68.4)
Surplus/(deficit) 591.8 (2,942.2) (1,101.5) 602.5 132.8
Experience adjustment on plan assets 521.9 741.1 (125.9) (449.6) 589.5
Experience adjustment on plan liabilities 613.4 2,186.1 1,038.6 290.1 (80.0)
Gratuity The following tables set forth, for the periods indicated, movement of the present value of the defined benefit
obligation, fair value of plan assets and other details for gratuity benefits.
` in million
particularsYear ended
march 31, 2021Year ended
march 31, 2020
Opening obligations 11,938.7 10,114.4
Add: Adjustment for exchange fluctuation on opening obligations (6.5) 14.3
adjusted opening obligations 11,932.2 10,128.7
Service cost 1,265.4 1,051.4
Interest cost 818.3 772.8
Actuarial (gain)/loss (414.4) 865.6
Past service cost (6.8) -
Liability transferred from/to other companies 4.9 (9.4)
Benefits paid (756.8) (870.4)
Obligations at the end of the year 12,842.8 11,938.7
Opening plan assets, at fair value 10,877.1 9,821.2
Expected return on plan assets 842.4 762.2
Actuarial gain/(loss) 720.2 (125.0)
Contributions 1,247.0 1,298.5
Asset transferred from/to other companies 4.9 (9.4)
Benefits paid (756.8) (870.4)
closing plan assets, at fair value 12,934.8 10,877.1
Fair value of plan assets at the end of the year 12,934.8 10,877.1
Present value of the defined benefit obligations at the end of the year (12,842.8) (11,938.7)
Amount not recognised as an asset (limit in Para 59(b) of AS 15 on ‘employee benefits’) - -
asset/(liability) 92.0 (1,061.6)
Integrated Report Statutory Reports Financial Statements
213

FINANCIAL STATEMENTS OF ICICI BANK LIMITED
SChEDuLESforming part of the Accounts (Contd.)
` in million
particularsYear ended
march 31, 2021Year ended
march 31, 2020
cost1
Service cost 1,265.4 1,051.4
Interest cost 818.3 772.8
Expected return on plan assets (842.4) (762.2)
Actuarial (gain)/loss (1,134.6) 990.6
Past service cost (6.8) -
Exchange fluctuation loss/(gain) (6.5) 14.3
Effect of the limit in para 59(b) of AS 15 on ‘employee benefits’ - -
net cost 93.4 2,066.9
Actual return on plan assets 1,562.6 637.2
Expected employer’s contribution next year 800.0 800.0
investment details of plan assets
Government of India securities 36.52% 27.64%
Corporate bonds 45.49% 54.49%
Special deposit schemes 2.24% 2.67%
Equity 14.22% 14.30%
Others 1.54% 0.89%
assumptions
Discount rate 6.55% 6.60%
Salary escalation rate 7.00% 7.00%
Estimated rate of return on plan assets 7.50% 8.00%
1. Included in line item ‘Payments to and provision for employees’ of Schedule-16 Operating expenses.
Estimated rate of return on plan assets is based on the expected average long-term rate of return on investments of the Fund during the estimated term of the obligations.
Experience adjustment
` in million
particularsYear ended
march 31, 2021Year ended
march 31, 2020Year ended
march 31, 2019Year ended
march 31, 2018Year ended
march 31, 2017
Plan assets 12,934.8 10,877.1 9,821.2 8,979.9 8,559.0
Defined benefit obligations (12,842.8) (11,938.7) (10,114.4) (9,087.7) (8,701.8)
Amount not recognised as an asset (limit in para 59(b) of AS 15 on ‘employee benefits’) - - - - -
Surplus/(deficit) 92.0 (1,061.6) (293.2) (107.8) (142.8)
Experience adjustment on plan assets 720.2 (125.0) (60.3) (115.9) 454.5
Experience adjustment on plan liabilities (484.5) 181.3 118.4 162.0 125.2
The estimates of future salary increases, considered in actuarial valuation, take into consideration inflation, seniority, promotion and other relevant factors.
214
Annual Report 2020-21

FINANCIAL STATEMENTS OF ICICI BANK LIMITED
SChEDuLESforming part of the Accounts (Contd.)
Provident Fund (PF) As there is no liability towards interest rate guarantee on exempt provident fund on the basis of actuarial valuation,
the Bank has not made any provision for the year ended March 31, 2021 (year ended March 31, 2020: Nil).
The following tables set forth, for the periods indicated, movement of the present value of the defined benefit obligation, fair value of plan assets and other details for provident fund.
` in million
particularsYear ended
march 31, 2021Year ended
march 31, 2020Opening obligations 33,424.3 28,757.5Service cost 1,656.3 1,780.6Interest cost 2,210.2 2,152.1Actuarial (gain)/loss 1,467.8 (171.5)Employees contribution 3,379.4 3,325.7Liability transferred from/to other companies 397.9 490.7Benefits paid (3,186.7) (2,910.8)Obligations at end of the year 39,349.2 33,424.3Opening plan assets 33,424.3 28,757.5Expected return on plan assets 3,147.4 2,607.4Actuarial gain/(loss) 530.5 (626.7)Employer contributions 1,656.4 1,780.5Employees contributions 3,379.4 3,325.7Asset transferred from/to other companies 397.9 490.7Benefits paid (3,186.7) (2,910.8)closing plan assets 39,349.2 33,424.3Plan assets at the end of the year 39,349.2 33,424.3Present value of the defined benefit obligations at the end of the year (39,349.2) (33,424.3)asset/(liability) - -cost1
Service cost 1,656.3 1,780.6Interest cost 2,210.2 2,152.1Expected return on plan assets (3,147.4) (2,607.4)Actuarial (gain)/loss 937.3 455.2net cost 1,656.4 1,780.5 Actual return on plan assets 3,677.9 1,980.7Expected employer’s contribution next year 1,772.3 1,905.3investment details of plan assetsGovernment of India securities 49.41% 48.48%Corporate bonds 41.98% 45.22%Special deposit scheme 1.37% 1.62%Others 7.23% 4.68%assumptionDiscount rate 6.55% 6.60%Expected rate of return on assets 8.59% 9.16%Discount rate for the remaining term to maturity of investments 6.50% 6.11%Average historic yield on the investment 8.54% 8.68%Guaranteed rate of return 8.50% 8.50%
1. Included in line item ‘Payments to and provision for employees’ of Schedule-16 Operating expenses.
Integrated Report Statutory Reports Financial Statements
215
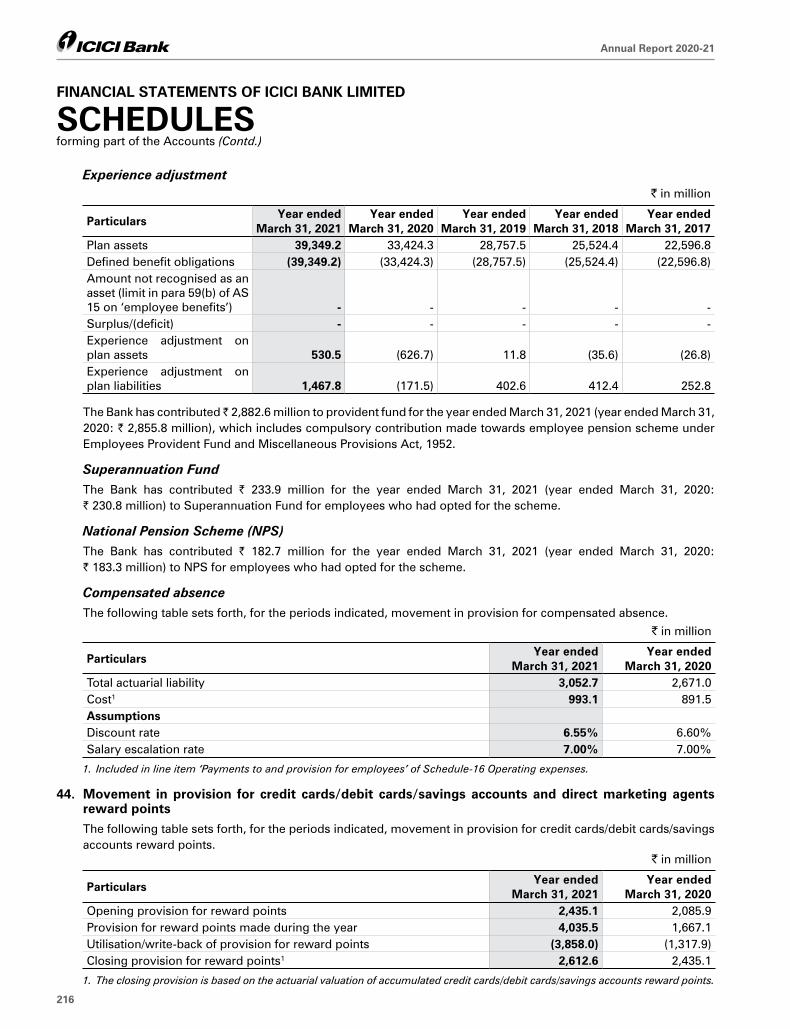
FINANCIAL STATEMENTS OF ICICI BANK LIMITED
SChEDuLESforming part of the Accounts (Contd.)
Experience adjustment ` in million
particularsYear ended
march 31, 2021Year ended
march 31, 2020Year ended
march 31, 2019Year ended
march 31, 2018Year ended
march 31, 2017Plan assets 39,349.2 33,424.3 28,757.5 25,524.4 22,596.8Defined benefit obligations (39,349.2) (33,424.3) (28,757.5) (25,524.4) (22,596.8)Amount not recognised as an asset (limit in para 59(b) of AS 15 on ‘employee benefits’) - - - - -Surplus/(deficit) - - - - -Experience adjustment on plan assets 530.5 (626.7) 11.8 (35.6) (26.8)Experience adjustment on plan liabilities 1,467.8 (171.5) 402.6 412.4 252.8
The Bank has contributed ̀ 2,882.6 million to provident fund for the year ended March 31, 2021 (year ended March 31, 2020: ` 2,855.8 million), which includes compulsory contribution made towards employee pension scheme under Employees Provident Fund and Miscellaneous Provisions Act, 1952.
Superannuation Fund The Bank has contributed ` 233.9 million for the year ended March 31, 2021 (year ended March 31, 2020:
` 230.8 million) to Superannuation Fund for employees who had opted for the scheme.
National Pension Scheme (NPS) The Bank has contributed ` 182.7 million for the year ended March 31, 2021 (year ended March 31, 2020:
` 183.3 million) to NPS for employees who had opted for the scheme.
Compensated absence The following table sets forth, for the periods indicated, movement in provision for compensated absence.
` in million
particularsYear ended
march 31, 2021Year ended
march 31, 2020Total actuarial liability 3,052.7 2,671.0Cost1 993.1 891.5assumptionsDiscount rate 6.55% 6.60%Salary escalation rate 7.00% 7.00%
1. Included in line item ‘Payments to and provision for employees’ of Schedule-16 Operating expenses.
44. movement in provision for credit cards/debit cards/savings accounts and direct marketing agents reward points
The following table sets forth, for the periods indicated, movement in provision for credit cards/debit cards/savings accounts reward points.
` in million
particularsYear ended
march 31, 2021Year ended
march 31, 2020Opening provision for reward points 2,435.1 2,085.9Provision for reward points made during the year 4,035.5 1,667.1Utilisation/write-back of provision for reward points (3,858.0) (1,317.9)Closing provision for reward points1 2,612.6 2,435.1
1. The closing provision is based on the actuarial valuation of accumulated credit cards/debit cards/savings accounts reward points.
216
Annual Report 2020-21

FINANCIAL STATEMENTS OF ICICI BANK LIMITED
SChEDuLESforming part of the Accounts (Contd.)
The following table sets forth, for the periods indicated, movement in provision for reward points to direct marketing agents.
` in million
particularsYear ended
march 31, 2021Year ended
march 31, 2020Opening provision for reward points 134.5 196.9
Provision for reward points made during the year 152.4 142.0
Utilisation/write-back of provision for reward points (114.7) (204.4)
Closing provision for reward points 172.2 134.5
45. provisions and contingencies The following table sets forth, for the periods indicated, the break-up of provisions and contingencies included in
profit and loss account.
` in million
particularsYear ended
march 31, 2021Year ended
march 31, 2020Provisions for depreciation of investments (1,578.2) 13,114.7
Provision towards non-performing and other assets1 107,991.3 88,144.1
Provision towards income tax
1. Current 46,656.6 37,460.3
2. Deferred (6,756.2) 23,712.0
Covid-19 related provision2 47,500.0 27,250.0
Other provisions and contingencies3 8,230.9 12,023.5
total provisions and contingencies 202,044.4 201,704.6
1. Includes provision towards NPA amounting to ` 103,640.6 million (March 31, 2020: ` 88,726.2 million). 2. Net of utilisation of provision amounting to ` 18,000.0 million. 3. Includes general provision made towards standard assets, provision on fixed assets acquired under debt-asset swap and non-
fund based facilities
The Bank has assessed its obligations arising in the normal course of business, including pending litigations, proceedings pending with tax authorities and other contracts including derivative and long term contracts. In accordance with the provisions of AS 29 on ‘Provisions, Contingent Liabilities and Contingent Assets’, the Bank recognises a provision for material foreseeable losses when it has a present obligation as a result of a past event and it is probable that an outflow of resources will be required to settle the obligation, in respect of which a reliable estimate can be made. In cases where the available information indicates that the loss on the contingency is reasonably possible or the amount of loss cannot be reasonably estimated, a disclosure to this effect is made as contingent liabilities in the financial statements. The Bank does not expect the outcome of these proceedings to have a materially adverse effect on its financial results.
The following table sets forth, for the periods indicated, the movement in provision for legal and fraud cases, operational risk and other contingencies.
` in million
particularsYear ended
march 31, 2021Year ended
march 31, 2020Opening provision 19,350.4 20,618.7
Movement during the year (net) 8,177.5 (1,268.3)
Closing provision 27,527.9 19,350.4
1. Excludes provision towards sundry expenses.
Integrated Report Statutory Reports Financial Statements
217

FINANCIAL STATEMENTS OF ICICI BANK LIMITED
SChEDuLESforming part of the Accounts (Contd.)
46. provision for income tax The provision for income tax (including deferred tax) for the year ended March 31, 2021 amounted to
` 39,900.3 million (March 31, 2020: ` 61,172.3 million).
The Bank has a comprehensive system of maintenance of information and documents required by transfer pricing legislation under section 92-92F of the Income Tax Act, 1961. The Bank is of the opinion that all transactions with international related parties and specified transactions with domestic related parties are primarily at arm’s length so that the above legislation does not have material impact on the financial statements.
47. deferred tax At March 31, 2021, the Bank has recorded net deferred tax assets of ` 87,444.7 million (March 31, 2020:
` 80,681.2 million), which have been included in other assets.
The following table sets forth, for the periods indicated, the break-up of deferred tax assets and liabilities into major items.
` in million
particularsat
march 31, 2021at
march 31, 2020
deferred tax assets
Provision for bad and doubtful debts 110,355.7 97,674.9
Foreign currency translation reserve2 (1,048.3) 611.4
Others 8,567.6 10,240.4
total deferred tax assets 117,875.0 108,526.7
deferred tax liabilities
Special reserve deduction 26,674.0 23,930.8
Depreciation on fixed assets 3,641.0 3,402.3
Interest on refund of taxes2 115.3 386.6
Others - 125.8
total deferred tax liabilities 30,430.3 27,845.5
total net deferred tax assets/(liabilities) 87,444.7 80,681.2
1. Tax rate of 25.168% is adopted based on Finance Act, 2020. 2. These items are considered in accordance with the requirements of Income Computation and Disclosure Standards (ICDS).
48. details of provisioning pertaining to fraud accounts The following table sets forth, for the periods indicated, the details of provisioning pertaining to fraud accounts.
` in million, except number of frauds
particularsYear ended
march 31, 2021Year ended
march 31, 2020Number of frauds reported 1,549 2,817Amount involved in frauds 118,386.4 94,728.7Provision made1 26,693.4 10,832.5Unamortised provision debited from balance in profit and loss account under ‘Reserves and Surplus’ - -
1. Excludes amount written off and interest reversal.
218
Annual Report 2020-21

FINANCIAL STATEMENTS OF ICICI BANK LIMITED
SChEDuLESforming part of the Accounts (Contd.)
49. proposed dividend on equity shares The Board of Directors at its meeting held on April 24, 2021 has recommended a dividend of ` 2 per equity share for
the year ended March 31, 2021 (year ended March 31, 2020: Nil). The declaration and payment of dividend is subject to requisite approvals.
50. Related party transactions The Bank has transactions with its related parties comprising subsidiaries, associates/joint ventures/other related
entities, key management personnel and relatives of key management personnel.
I. Related parties Subsidiaries, associates/joint ventures/other related entities
Sr. no. name of the entity nature of relationship
1. ICICI Bank Canada Subsidiary
2. ICICI Bank UK PLC Subsidiary
3. ICICI Home Finance Company Limited Subsidiary
4. ICICI International Limited Subsidiary
5. ICICI Investment Management Company Limited Subsidiary
6. ICICI Lombard General Insurance Company Limited Subsidiary
7. ICICI Prudential Asset Management Company Limited Subsidiary
8. ICICI Prudential Life Insurance Company Limited Subsidiary
9. ICICI Prudential Pension Funds Management Company Limited Subsidiary
10. ICICI Prudential Trust Limited Subsidiary
11. ICICI Securities Holdings Inc. Subsidiary
12. ICICI Securities Inc. Subsidiary
13. ICICI Securities Limited Subsidiary
14. ICICI Securities Primary Dealership Limited Subsidiary
15. ICICI Trusteeship Services Limited Subsidiary
16. ICICI Venture Funds Management Company Limited Subsidiary
17. Arteria Technologies Private Limited Associate
18. India Advantage Fund-III Associate
19. India Advantage Fund-IV Associate
20. India Infradebt Limited Associate
21. ICICI Merchant Services Private Limited Associate
22. I-Process Services (India) Private Limited Associate
23. NIIT Institute of Finance, Banking and Insurance Training Limited Associate
24. ICICI Strategic Investments Fund Consolidated as per Accounting Standard (‘AS’) 21
25. Comm Trade Services Limited Other related entity
26. ICICI Foundation for Inclusive Growth Other related entity
27. Cheryl Advisory Private Limited (w.e.f. Q3-2021) Other related entity
Integrated Report Statutory Reports Financial Statements
219

FINANCIAL STATEMENTS OF ICICI BANK LIMITED
SChEDuLESforming part of the Accounts (Contd.)
Key management personnel
Sr. no. name of the Key management personnel Relatives of the Key management personnel
1. Mr. Sandeep Bakhshi • Ms.MonaBakhshi• Mr.ShivamBakhshi• Ms.EshaBakhshi• Ms.MinalBakhshi• Mr.SameerBakhshi
2. Ms. Vishakha Mulye • Mr.VivekMulye• Ms.VriddhiMulye• Mr.VighneshMulye• Dr.GaureshPalekar• Ms.ShalakaGadekar• LateMs.ManishaPalekar
3. Mr. Anup Bagchi • Ms.MitulBagchi• Mr.AdityaBagchi• Mr.ShishirBagchi• LateMr.AnimeshBagchi
4. Mr. Sandeep Batra(w.e.f. December 23, 2020)
• Mr.PranavBatra• Ms.ArushiBatra• Mr.VivekBatra• Ms.VeenaBatra(w.e.f. December 23, 2020)
5. Mr. Vijay Chandok(upto May 6, 2019)
• Ms.PoonamChandok• Ms.SaluniChandok• Ms.SimranChandok• Mr.C.V.Kumar• Ms.ShadKumar• Ms.SanjanaGulati(upto May 6, 2019)
II. Transactions with related parties The following table sets forth, for the periods indicated, the significant transactions between the Bank and its
related parties.
` in million
items Year ended march 31, 2021
Year ended march 31, 2020
interest income 964.8 650.5
Subsidiaries 401.9 459.2
Associates/joint ventures/others 553.7 181.3
Key management personnel 9.2 10.0
Fee, commission and other income 9,208.5 10,966.0
Subsidiaries 9,089.6 10,929.6
Associates/joint ventures/others 118.9 36.4
Key management personnel 0.01 0.01
Relatives of key management personnel 0.01 0.01
commission income on guarantees issued 29.1 27.4
Subsidiaries 28.9 27.3
Associates/joint ventures/others 0.2 0.1
220
Annual Report 2020-21

FINANCIAL STATEMENTS OF ICICI BANK LIMITED
SChEDuLESforming part of the Accounts (Contd.)
` in million
items Year ended march 31, 2021
Year ended march 31, 2020
income from custodial services 18.3 41.4
Subsidiaries 17.2 36.4
Associates/joint ventures/others 1.1 5.0
Gain/(loss) on forex and derivative transactions (net)2 1,472.1 1,164.3
Subsidiaries 1,472.1 1,164.3
dividend income 12,446.4 12,844.4
Subsidiaries 12,339.9 12,730.3
Associates/joint ventures/others 106.5 114.1
insurance claims received 315.8 197.7
Subsidiaries 315.8 197.7
Recovery of lease of premises, common corporate and facilities expenses 1,683.3 1,815.4
Subsidiaries 1,631.8 1,764.6
Associates/joint ventures/others 51.5 50.8
payment of lease of premises, common corporate and facilities expenses 156.4 148.5
Subsidiaries 156.4 148.5
Recovery for secondment of employees (net) 17.8 30.5
Subsidiaries 7.1 19.1
Associates/joint ventures/others 10.7 11.4
Reimbursement of expenses from related parties 1.7 1.0
Subsidiaries 1.7 1.0
interest expense 143.5 176.0
Subsidiaries 99.0 123.1
Associates/joint ventures/others 38.4 50.8
Key management personnel 5.6 1.7
Relatives of key management personnel 0.5 0.4
Remuneration to wholetime directors3 126.0 203.0
Key management personnel 126.0 203.0
Reimbursement of expenses to related parties 989.7 280.6
Subsidiaries 191.4 67.0
Associates/joint ventures/others 798.3 213.6
insurance premium paid 8,899.9 9,038.6
Subsidiaries 8,899.9 9,038.6
Brokerage, fee and other expenses 11,503.3 13,165.4
Subsidiaries 906.2 302.7
Associates/joint ventures/others 10,597.1 12,862.7
donation given - 50.0
Associates/joint ventures/others - 50.0
dividend paid - 1.4
Key management personnel - 1.4
Relatives of key management personnel - 0.01
Integrated Report Statutory Reports Financial Statements
221

FINANCIAL STATEMENTS OF ICICI BANK LIMITED
SChEDuLESforming part of the Accounts (Contd.)
` in million
items Year ended march 31, 2021
Year ended march 31, 2020
purchase of investments 32,742.4 16,013.8
Subsidiaries 32,742.4 16,013.8
Sale of investments 16,692.8 53,007.6
Subsidiaries 16,692.8 53,007.6
Redemption/buyback of investments 213.2 200.7
Associates/joint ventures/others 213.2 200.7
Sale of loans - 968.0
Associates/joint ventures/others - 968.0
purchase of loans 8,071.2 21,455.9
Subsidiaries 8,071.2 21,455.9
purchase of fixed assets 6.9 2.5
Subsidiaries 0.3 2.5
Associates/joint ventures/others 6.6 -
Sale of fixed assets 0.4 4.6
Subsidiaries 0.4 4.6
purchase of consumer finance business4 - 1,190.2
Subsidiaries - 1,190.2
1. Insignificant amount. 2. The Bank undertakes derivative transactions with its subsidiaries, associates, joint ventures and other related entities. The
Bank manages its foreign exchange and interest rate risks arising from these transactions by covering them in the market. While the Bank, within its overall position limits covers these transactions in the market, the above amounts represent only the transactions with its subsidiaries, associates, joint ventures and other related entities and not the offsetting/covering transactions.
3. Excludes the perquisite value on employee stock options exercised, contribution to gratuity fund and includes performance bonus paid during the period.
4. During the year ended March 31, 2020, the Bank purchased consumer finance business from ICICI Home Finance, including loan portfolio and IT assets, at a purchases consideration of ` 1,190.2 million.
III. Material transactions with related parties The following table sets forth, for the periods indicated, the material transactions between the Bank and its
related parties. A specific related party transaction is disclosed as a material related party transaction wherever it exceeds 10% of all related party transactions in that category.
` in million
particularsYear ended
march 31, 2021Year ended
march 31, 2020interest income1 India Infradebt Limited 549.4 177.62 ICICI Home Finance Company Limited 335.8 394.8Fee, commission and other income1. ICICI Prudential Life Insurance Company Limited 6,458.0 8,492.82. ICICI Lombard General Insurance Company Limited 1,269.7 1,842.3commission income on guarantees issued1. ICICI Bank UK PLC 28.1 25.7income from custodial services1. ICICI Prudential Asset Management Company Limited 14.9 31.9
222
Annual Report 2020-21

FINANCIAL STATEMENTS OF ICICI BANK LIMITED
SChEDuLESforming part of the Accounts (Contd.)
` in million
particularsYear ended
march 31, 2021Year ended
march 31, 2020Gain/(loss) on forex and derivative transactions (net)2
1. ICICI Home Finance Company Limited 1,059.4 (245.0)2. ICICI Securities Primary Dealership Limited 377.0 1,456.03. ICICI Bank UK PLC (16.6) (155.6)dividend income1. ICICI Prudential Asset Management Company Limited 4,240.2 3,758.62. ICICI Securities Limited 3,712.9 2,539.43. ICICI Securities Primary Dealership Limited 3,189.0 1,200.54. ICICI Lombard General Insurance Company Limited 943.4 1,776.95. ICICI Bank Canada 224.1 1,626.36. ICICI Prudential Life Insurance Company Limited - 1,783.9insurance claims received1. ICICI Prudential Life Insurance Company Limited 264.5 102.12. ICICI Lombard General Insurance Company Limited 51.3 95.6Recovery of lease of premises, common corporate and facilities expenses1. ICICI Prudential Life Insurance Company Limited 351.4 320.52. ICICI Bank UK PLC 315.7 287.03. ICICI Securities Limited 299.6 294.24. ICICI Lombard General Insurance Company Limited 265.4 278.15. ICICI Bank Canada 217.3 190.06. ICICI Home Finance Company Limited 91.1 305.3payment of lease of premises, common corporate and facilities expenses1. ICICI Venture Funds Management Company Limited 76.9 78.22. ICICI Home Finance Company Limited 53.9 66.73. ICICI Investment Management Company Limited 17.8 -Recovery for secondment of employees (net)1. I-Process Services (India) Private Limited 10.6 11.42. ICICI Securities Limited 6.7 10.73. ICICI Prudential Life Insurance Company Limited (0.3) 6.5Reimbursement of expenses from related parties1. ICICI Prudential Life Insurance Company Limited 1.7 -2. ICICI Investment Management Company Limited 0.1 1.0interest expense1. ICICI Securities Limited 84.9 95.02. ICICI Merchant Services Private Limited 14.5 40.43. ICICI Bank UK PLC 0.01 21.2Remuneration to wholetime directors3
1. Mr. Sandeep Bakhshi 3.8 60.82. Ms. Vishakha Mulye 54.6 70.33. Mr. Anup Bagchi 52.9 63.94. Mr. Sandeep Batra 14.7 -
Integrated Report Statutory Reports Financial Statements
223

FINANCIAL STATEMENTS OF ICICI BANK LIMITED
SChEDuLESforming part of the Accounts (Contd.)
` in million
particularsYear ended
march 31, 2021Year ended
march 31, 2020Reimbursement of expenses to related parties1. ICICI Foundation for Inclusive Growth 798.3 213.22. ICICI Home Finance Company Limited 145.6 -3. ICICI Bank UK PLC 29.1 33.04. ICICI Bank Canada 13.0 34.1insurance premium paid1. ICICI Prudential Life Insurance Company Limited 6,476.2 6,925.22. ICICI Lombard General Insurance Company Limited 2,423.7 2,113.4Brokerage, fee and other expenses1. I-Process Services (India) Private Limited 6,402.6 6,844.02. ICICI Merchant Services Private Limited 4,169.1 5,978.7donation given1. ICICI Foundation for Inclusive Growth - 50.0dividend paid1. Mr. Sandeep Bakhshi - 0.42. Ms. Vishakha Mulye - 1.0purchase of investments1. ICICI Securities Primary Dealership Limited 28,230.9 14,750.5Sale of investments1. ICICI Prudential Life Insurance Company Limited 10,988.6 19,324.62. ICICI Securities Primary Dealership Limited 3,803.6 26,407.13. ICICI Lombard General Insurance Company Limited 1,547.0 6,595.8Redemption/buyback of investments1. ICICI Strategic Investments Fund 133.0 100.02. India Advantage Fund - III 48.1 57.13. India Advantage Fund - IV 32.1 43.5Sale of loans1. India Infradebt Limited - 968.0purchase of loans1. ICICI Home Finance Company Limited 8,071.2 21,455.9purchase of fixed assets1. Arteria Technologies Private Limited 6.6 -2. ICICI Securities Limited 0.3 0.73. ICICI Prudential Life Insurance Company Limited - 1.8Sale of fixed assets1. ICICI Home Finance Company Limited 0.4 -2. ICICI Securities Limited - 4.6purchase of consumer finance business4
1. ICICI Home Finance Company Limited - 1,190.2
1. Insignificant amount. 2. The Bank undertakes derivative transactions with its subsidiaries, associates, joint ventures and other related entities. The
Bank manages its foreign exchange and interest rate risks arising from these transactions by covering them in the market. While the Bank, within its overall position limits covers these transactions in the market, the above amounts represent only the transactions with its subsidiaries, associates, joint ventures and other related entities and not the offsetting/covering transactions.
3. Excludes the perquisite value on employee stock options exercised, contribution to gratuity fund and includes performance bonus paid during the period.
4. During the year ended March 31, 2020, the Bank purchased consumer finance business from ICICI Home Finance, including loan portfolio and IT assets, at a purchases consideration of ` 1,190.2 million.
224
Annual Report 2020-21

FINANCIAL STATEMENTS OF ICICI BANK LIMITED
SChEDuLESforming part of the Accounts (Contd.)
IV. Related party outstanding balances The following table sets forth, for the periods indicated, the balances payable to/receivable from related parties.
` in million
itemsat
march 31, 2021at
march 31, 2020deposits with the Bank 28,611.7 19,775.7Subsidiaries 25,833.3 13,470.8Associates/joint ventures/others 2,552.7 6,236.1Key management personnel 156.4 59.1Relatives of key management personnel 69.3 9.7investments of related parties in the Bank 3.4 2.6Key management personnel 3.4 2.6Relatives of key management personnel 0.01 0.01
payables2 2,763.1 3,287.3Subsidiaries 26.8 0.7Associates/joint ventures/others 2,736.2 3,286.6Key management personnel 0.1 0.01
Relatives of key management personnel 0.01 0.01
deposits by the Bank 682.7 2,327.7Subsidiaries 682.7 2,327.7investments of the Bank 108,296.0 109,262.6Subsidiaries 97,565.7 98,028.5Associates/joint ventures/others 10,730.3 11,234.1advances by the Bank 2,689.4 5,270.3Subsidiaries 2,400.2 5,024.8Associates/joint ventures/others 42.8 48.7Key management personnel 246.2 196.7Relatives of key management personnel 0.2 0.1Receivables2 2,947.9 1,736.7Subsidiaries 2,631.8 1,660.1Associates/joint ventures/others 316.1 76.6Guarantees/letters of credit/indemnity given by the Bank 11,892.7 7,353.6Subsidiaries 11,842.0 7,341.8Associates/joint ventures/others 50.7 11.8Guarantees/letters of credit/indemnity issued by related parties 9,416.6 6,260.3Subsidiaries 9,416.6 6,260.3Swaps/forward contracts (notional amount) 199,881.6 447,819.6Subsidiaries 199,881.6 447,819.6Unfunded risk participation 842.2 460.7Subsidiaries 842.2 460.7
1. Insignificant amount. 2. Excludes mark-to-market on outstanding derivative transactions. 3. At March 31, 2021, 20,047,800 (March 31, 2020: 16,184,250) employee stock options for key management personnel were
outstanding. Excludes stock options granted to key management personnel, which are pending regulatory approvals. 4. During the year ended March 31, 2021, 1,188,000 (year ended March 31, 2020: 1,173,000) employee stock options with
total exercise price of ` 228.8 million (year ended March 31, 2020: ` 240.1 million) were exercised by the key management personnel.
Integrated Report Statutory Reports Financial Statements
225

FINANCIAL STATEMENTS OF ICICI BANK LIMITED
SChEDuLESforming part of the Accounts (Contd.)
V. Related party maximum balances The following table sets forth, for the periods indicated, the maximum balances payable to/receivable from
related parties.` in million
itemsYear ended
march 31, 2021Year ended
march 31, 2020deposits with the Bank 47,441.4 35,005.0Subsidiaries 36,178.8 27,633.1Associates/joint ventures/others 10,918.7 7,138.3Key management personnel 238.1 167.6Relatives of key management personnel 105.8 66.0investments of related parties in the Bank2 3.7 1,588.2Subsidiaries - 1,585.3Key management personnel 3.7 2.9Relatives of key management personnel 0.01 0.01
Repurchase transactions - 163.8Subsidiaries - 163.8payables2,3 2,910.9 3,393.7Subsidiaries 26.8 107.0Associates/joint ventures/others 2,884.0 3,286.6Key management personnel 0.1 0.1Relatives of key management personnel 0.01 0.01
deposits made by the Bank 6,472.8 6,113.3Subsidiaries 6,472.8 6,113.3call/term money lent by the Bank 10,000.0 10,500.0Subsidiaries 10,000.0 10,500.0investments of the Bank 113,132.2 109,338.2Subsidiaries 98,028.5 98,028.5Associates/joint ventures/others 15,103.7 11,309.7advances by the Bank 24,733.7 22,418.3Subsidiaries 24,426.1 22,112.4Associates/joint ventures/others 59.4 50.8Key management personnel 246.9 254.2Relatives of key management personnel 1.3 0.9Receivables3 3,568.9 3,034.5Subsidiaries 3,052.7 2,805.0Associates/joint ventures/others 516.2 229.5Guarantees/letters of credit/indemnity given by the Bank 12,776.1 12,038.6Subsidiaries 12,724.3 12,026.8Associates/joint ventures/others 51.8 11.8Guarantees/letters of credit/indemnity issued by related parties2 9,416.6 6,260.3Subsidiaries 9,416.6 6,260.3Swaps/forward contracts (notional amount) 545,163.5 455,450.3Subsidiaries 545,163.5 455,450.3Unfunded risk participation2 2,244.7 835.5Subsidiaries 2,244.7 835.5
1. Insignificant amount. 2. Maximum balance is determined based on comparison of the total outstanding balances at each quarter end during the
financial year. 3. Excludes mark-to-market on outstanding derivative transactions.
226
Annual Report 2020-21

FINANCIAL STATEMENTS OF ICICI BANK LIMITED
SChEDuLESforming part of the Accounts (Contd.)
VI. Letters of comfort The Bank has issued letters of comfort on behalf of its banking subsidiary ICICI Bank UK PLC to Financial
Services Authority, UK (now split into two separate regulatory authorities, the Prudential Regulation Authority and the Financial Conduct Authority) to confirm that the Bank intends to financially support ICICI Bank UK PLC in ensuring that it meets all of its financial obligations as they fall due.
The Bank has issued an undertaking on behalf of ICICI Securities Inc. for Singapore dollar 10.0 million (March 31, 2020: Singapore dollar 10.0 million) equivalent to ̀ 543.5 million at March 31, 2021 (equivalent to ̀ 530.3 million at March 31, 2020) to the Monetary Authority of Singapore (MAS) and has executed indemnity agreements, on behalf of ICICI Bank Canada to its independent directors for a sum not exceeding Canadian dollar 2.5 million each (equivalent to ` 145.1 million), aggregating to Canadian dollar 12.5 million which is equivalent to ` 725.3 million at March 31, 2021 (March 31, 2020: Canadian dollar 12.5 million which was equivalent to ̀ 663.5 million). The aggregate amount of ` 1,268.8 million at March 31, 2021 (March 31, 2020: ` 1,193.8 million) is included in the contingent liabilities.
The letters of comfort in the nature of letters of awareness that were outstanding at March 31, 2021 issued by the Bank on behalf of its subsidiaries in respect of their borrowings made or proposed to be made, aggregated to ` 22,215.5 million (March 31, 2020: Nil).
In addition to the above, the Bank has also issued letters of comfort in the nature of letters of awareness on behalf of its subsidiaries for other incidental business purposes. These letters of awareness are in the nature of factual statements or confirmation of facts and do not create any financial impact on the Bank.
51. details of amount transferred to the depositor education and awareness Fund (the Fund) of RBi The following table sets forth, for the periods indicated, the movement in amount transferred to the Fund.
` in million
particulars Year ended march 31, 2021
Year ended march 31, 2020
Opening balance 10,352.8 8,330.7
Add: Amounts transferred during the year 1,940.5 2,169.0
Less: Amounts reimbursed by the Fund towards claims during the year (109.3) (146.9)
Closing balance 12,184.0 10,352.8
52. Small and micro enterprises The following table sets forth, for the periods indicated, details relating to enterprises covered under the Micro,
Small and Medium Enterprises Development (MSMED) Act, 2006.` in million
Sr. no.
particularsat march 31, 2021 at march 31, 2020principal interest principal interest
1. The Principal amount and the interest due thereon remaining unpaid to any supplier - - - -
2. The amount of interest paid by the buyer in terms of Section 16, along with the amount of the payment made to the supplier beyond the due date - - - -
3. The amount of interest due and payable for the period of delay in making payment (which have been paid but beyond the due date during the year) but without adding the interest specified under MSMED Act, 2006 n.a. 0.4 N.A. 1.4
4. The amount of interest accrued and remaining unpaid n.a. 0.4 N.A. 1.45. The amount of further interest remaining due and
payable even in the succeeding years, until such date when the interest dues as above are actually paid to the small enterprise, for the purpose of disallowed as a deductible expenditure under Section 23 n.a. - N.A. -
Integrated Report Statutory Reports Financial Statements
227

FINANCIAL STATEMENTS OF ICICI BANK LIMITED
SChEDuLESforming part of the Accounts (Contd.)
53. penalties/fines imposed by RBi and other banking regulatory bodies There was no penalty imposed by RBI and other banking regulatory bodies during the year ended March 31, 2021
(year ended March 31, 2020: Nil).
54. disclosure on Remuneration Compensation Policy and practices (A) Qualitative Disclosures
a) information relating to the bodies that oversee remuneration.
• Name,compositionandmandateofthemainbodyoverseeingremuneration
The Board Governance, Remuneration and Nomination Committee (BGRNC/ Committee) is the body which oversees the remuneration aspects. The functions of the Committee include recommending appointments of Directors to the Board, identifying persons who are qualified to become Directors and who may be appointed in senior management in accordance with the criteria laid down and recommending to the Board their appointment and removal, formulate a criteria for the evaluation of the performance of the whole time/ independent Directors and the Board and to extend or continue the term of appointment of independent Director on the basis of the report of performance evaluation of independent Directors, recommending to the Board a policy relating to the remuneration for the Directors, Key Managerial Personnel, Material Risk takers (MRTs) and other employees, recommending to the Board the remuneration (including performance bonus, share-linked instruments and perquisites) to wholetime Directors (WTDs) and senior management, commission and fee payable to non- executive Directors subject to applicable regulations, approving the policy for and quantum of variable pay payable to members of the staff including senior management , key managerial personnel, material risk takers formulating the criteria for determining qualifications, positive attributes and independence of a Director, framing policy on Board diversity, framing guidelines for the Employee Stock Option Scheme (ESOS) and decide on the grant of the Bank’s stock options to employees and WTDs of the Bank and its subsidiary companies.
• Externalconsultantswhoseadvicehasbeensought,thebodybywhichtheywerecommissioned,and in what areas of the remuneration process
During the year ended March 31, 2021, the Bank employed the services of a reputed consulting firm for market benchmarking in the area of compensation, including executive compensation.
• ScopeoftheBank’sremunerationpolicy(eg.byregions,businesslines),includingtheextenttowhich it is applicable to foreign subsidiaries and branches
The Compensation Policy of the Bank, as last amended by the BGRNC and the Board at their meetings held on April 10, 2020 and May 9, 2020 respectively, covers all employees of the Bank, including those in overseas branches of the Bank. In addition to the Bank’s Compensation Policy guidelines, the overseas branches also adhere to relevant local regulations.
• Typeofemployeescoveredandnumberofsuchemployees
All employees of the Bank are governed by the Compensation Policy. The total number of permanent employees of the Bank at March 31, 2021 was 97,488.
b) information relating to the design and structure of remuneration processes
• Keyfeaturesandobjectivesofremunerationpolicy
The Bank has under the guidance of the Board and the BGRNC, followed compensation practices intended to drive meritocracy within the framework of prudent risk management. This approach has been incorporated in the Compensation Policy, the key elements of which are given below.
228
Annual Report 2020-21

FINANCIAL STATEMENTS OF ICICI BANK LIMITED
SChEDuLESforming part of the Accounts (Contd.)
o effective governance of compensation: The BGRNC has oversight over compensation. The Committee defines Key Performance Indicators (KPIs) for WTDs and equivalent positions and the organisational performance norms for variable pay based on the financial and strategic plan approved by the Board. The KPIs include both quantitative and qualitative aspects defined with sub parameters. The BGRNC assesses organisational performance and based on its assessment, it makes recommendations to the Board regarding compensation for WTDs, senior management and equivalent positions and variable pay for employees, including senior management, key management personnel.
o alignment of compensation philosophy with prudent risk taking: The Bank seeks to achieve a prudent mix of fixed and variable pay, with a higher proportion of variable pay at senior levels and no guaranteed bonuses. Compensation is sought to be aligned to both financial and non- financial indicators of performance including aspects like risk management and customer service. The Bank’s employee stock option scheme aims at aligning compensation to long term performance through stock option grants that vest over a period of time. Compensation of staff in audit, compliance and risk control functions is independent of the business areas they oversee and depends on their performance assessment.
• Whether the remuneration committee reviewed the firm’s remuneration policy during the pastyear, and if so, an overview of any changes that were made
During the year ended March 31, 2021, the Bank’s Compensation Policy was amended by the BGRNC and the Board at their meetings held on April 10, 2020 and May 9, 2020 respectively with the objective to align the policy to the RBI circular on ‘Guidelines on Compensation of Whole Time Directors/ Chief Executive Officers/ Material Risk Takers and Control Function staff’ dated November 4, 2019.
• Discussion of how the Bank ensures that risk and compliance employees are remuneratedindependently of the businesses they oversee
The compensation of staff engaged in control functions like Audit, Risk and Compliance depends on their performance, which is based on achievement of the key goals of their respective functions. Their goal sheets do not include any business targets.
c) description of the ways in which current and future risks are taken into account in the remuneration processes.
• Overview of the key risks that the Bank takes into accountwhen implementing remunerationmeasures
The Board approves the Enterprise Risk Management framework for the Bank. The business activities of the Bank are undertaken within this framework to achieve the financial plan. The risk framework includes the Bank’s risk appetite, thresholds/limits framework and policies and procedures governing various types of risk. KPIs of WTDs & equivalent positions, as well as employees, incorporate relevant risk management related aspects. For example, in addition to performance indicator in areas such as risk calibrated core operating profit (profit before provisions and tax excluding treasury income), performance indicators include aspects such as asset quality. The BGRNC takes into consideration all the above aspects while assessing organisational and individual performance and making compensation-related recommendations to the Board.
• Overviewofthenatureandtypeofkeymeasuresusedtotakeaccountoftheserisks,includingriskdifficult to measure
The annual performance targets and performance evaluation incorporate both qualitative and quantitative aspects including asset quality and provisioning, risk management framework, stakeholder relationships and leadership development.
Integrated Report Statutory Reports Financial Statements
229

FINANCIAL STATEMENTS OF ICICI BANK LIMITED
SChEDuLESforming part of the Accounts (Contd.)
• Discussionofthewaysinwhichthesemeasuresaffectremuneration
Every year, the financial plan/targets are formulated in conjunction with a risk framework with limit structures for various areas of risk/lines of business, within which the Bank operates. To ensure effective alignment of compensation with prudent risk taking, the BGRNC takes into account adherence to the risk framework in conjunction with which the financial plan/targets have been formulated. KPIs of WTDs and equivalent positions, as well as employees, incorporate relevant risk management related aspects. For example, in addition to performance targets in areas such as risk calibrated core operating profit, performance indicators include aspects such as asset quality. The BGRNC takes into consideration all the above aspects while assessing organisational and individual performance and making compensation-related recommendations to the Board.
• Discussionofhowthenatureandtypeofthesemeasureshavechangedoverthepastyearandreasons for the changes, as well as the impact of changes on remuneration.
The nature and type of these measures have not changed over the past year and hence, there is no impact on remuneration.
d) description of the ways in which the Bank seeks to link performance during a performance measurement period with levels of remuneration
• OverviewofmainperformancemetricsforBank,toplevelbusinesslinesandindividuals
The main performance metrics includes risk calibrated core operating profit (profit before provisions and tax, excluding treasury income) asset quality metrics (such as additions to non-performing loans and recoveries and upgrades), regulatory compliance, risk management processes and stakeholder relationships. The specific metrics and weightages for various metrics vary with the role and level of the individual.
• discussion of how amounts of individual remuneration are linked to the Bank-wide and individual performance
The BGRNC takes into consideration above mentioned aspects while assessing performance and making compensation-related recommendations to the Board regarding the performance assessment of WTDs and equivalent positions. The performance assessment of individual employees is undertaken based on their achievements, which incorporates various aspects described earlier.
• discussion of the measures the Bank will in general implement to adjust remuneration in the event that performance metrics are weak, including the Bank’s criteria for determining ‘weak’ performance metrics
The Bank’s Compensation Policy outlines the measures the Bank will implement in the event of a reasonable evidence of deterioration in financial performance. Should such an event occur in the manner outlined in the policy, the BGRNC may decide to apply malus/clawback on none, part or all of the relevant variable compensation
230
Annual Report 2020-21

FINANCIAL STATEMENTS OF ICICI BANK LIMITED
SChEDuLESforming part of the Accounts (Contd.)
e) description of the ways in which the Bank seeks to adjust remuneration to take account of the longer term performance
• discussion of the Bank’s policy on deferral and vesting of variable remuneration and, if the fraction of variable remuneration that is deferred differs across employees or groups of employees, a description of the factors that determine the fraction and their relative importance
The variable compensation is in the form of share-linked instruments (including stock options) or cash or a mix of cash and share-linked instruments (including stock options). The quantum of variable pay for an employee does not exceed a certain percentage (as stipulated in the compensation policy) of the total fixed pay in a year. The proportion of variable pay to total compensation is higher at senior levels and lower at junior levels. Atleast 50% of the compensation is variable for WTDs, CEO and MRTs as a design. However, they can earn lesser variable pay based on various performance criteria. For WTDs, CEO and MRTs, a minimum of 60% of the total variable pay is under deferral arrangement (deferment). Additionally, atleast 50% of the cash component of the variable pay is under deferment. If the cash component is under ` 2.5 million, the deferment is not applicable.
• discussion of the Bank’s policy and criteria for adjusting deferred remuneration before vesting and (if permitted by national law) after vesting through claw back arrangements
The deferred portion of variable pay pertaining to the assessment year or previous year/s (as defined in the policy) is subject to malus, under which the Bank prevents vesting of all or part or none of the unvested variable pay in the event of the assessed divergence in the Bank’s provisioning for NPAs or in the event of a reasonable evidence of deterioration in financial performance or in the event of gross misconduct and/or other acts as mentioned in the policy. In such cases (other than assessed divergence), variable pay already paid out may also be subjected to clawback arrangements, as applicable.
f) description of the different forms of variable remuneration that the Bank utilises and the rationale for using these different forms
• Overview of the forms of variable remuneration offered. a discussion of the use of different forms of variable remuneration and, if the mix of different forms of variable remuneration differs across employees or group of employees, a description of the factors that determine the mix and their relative importance
The variable compensation is in the form of employee stock options or cash or a mix of cash and stock options. The Bank pays performance linked retention pay (PLRP) to its front-line staff and junior management. PLRP aims to reward front line and junior managers, mainly on the basis of skill maturity attained through experience and continuity in role which is a key differentiator for customer service. The Bank pays performance bonus and stock options to relevant employees in its middle and senior management. The variable pay payout schedules is sensitive to the time horizon of risks as defined in the policy.
The Bank ensures higher proportion of variable pay at senior levels and lower variable pay for front-line staff and junior management levels.
Integrated Report Statutory Reports Financial Statements
231

FINANCIAL STATEMENTS OF ICICI BANK LIMITED
SChEDuLESforming part of the Accounts (Contd.)
(B) Quantitative disclosures
The following table sets forth, for the period indicated, the details of quantitative disclosure for remuneration of WTDs (including MD & CEO) and other Material Risk Takers.
` in million, except numbers
particularsYear ended
march 31, 2021
1. Number of meetings held by the BGRNC during the financial year 6
Remuneration paid to its members during the financial year (sitting fees) 1.2
2. Number of employees having received a variable remuneration award during the financial year1 49
3. Number and total amount of sign-on/joining bonus made during the financial year -
4. Details of severance pay, in addition to accrued benefits, if any -
5. Breakdown of amount of remuneration awards for the financial year Fixed2
Variable3
- Deferred - Non-deferred Share-linked instruments3 (nos.) - Deferred (nos.) - Non-deferred (nos.)
1,041.0165.3
-165.3
9,127,500.09,127,500.0
-
6. Total amount of deferred remuneration paid out during the year - Bonus - Share-linked instruments4 (nos.)
-9,370,230
7. Total amount of outstanding deferred remuneration Cash Shares (nos) Shares-linked instruments5 (nos.) Other
n.a.-
19,889,730 -
8. Total amount of outstanding deferred remuneration and retained remuneration exposed to ex-post explicit and/or implicit adjustments
- Bonus - Share-linked instruments (nos.)
-9,127,500
9. Total amount of reductions during the year due to ex-post explicit adjustments6 n.a.
10. Total amount of reductions during the year due to ex-post implicit adjustments n.a.
11. Number of MRTs identified 47
12. Number of cases where malus has been exercised -
Number of cases where clawback has been exercised6 -
Number of cases where malus and clawback have been exercised -
232
Annual Report 2020-21

FINANCIAL STATEMENTS OF ICICI BANK LIMITED
SChEDuLESforming part of the Accounts (Contd.)
` in million, except numbers
particularsYear ended
march 31, 2021
13. The mean pay for the bank as a whole (excluding sub-staff) and the deviation of the pay of each of its WTDs from the mean pay
Mean pay of the bank7
Deviation - MD&CEO Deviation - WTD1 Deviation - WTD2 Deviation - WTD3
704,0353,455,855
50,085,76847,547,65046,536,300
1. For the year ended March 31, 2021 includes MDCEO/WTDs/and other MRTs based on the revised criteria given by RBI in its guideline dated November 4, 2019. Also includes WTDs transferred to group companies. For the year ended on March 31, 2021 variable remuneration includes cash bonus and stock options based on the revised criteria given by RBI in its guideline dated November 4, 2019 that are paid/ granted/ vested during the year.
2. Fixed pay includes basic salary, supplementary allowances, superannuation, contribution to provident fund, gratuity fund and value of perquisites. The value of perquisite is calculated as cost to the Bank.
3. Variable and share-linked instruments represent amounts/ options awarded for the year ended March 31, 2020 as per RBI approvals wherever applicable.
4. Includes options vested during the year including for WTDs who were transferred to group companies. 5. Includes outstanding options unvested including for WTDs who were transferred to group companies . 6. Excludes ̀ 74.1 million variable pay to the former MD & CEO for past years which has been directed for claw-back in respect
of which the Bank has filed a recovery suit against the former MD & CEO. 7. Mean pay is computed on annualised fixed pay that includes basic salary, supplementary allowances, superannuation,
contribution to provident fund, gratuity fund and value of perquisites. The value of perquisite is calculated as cost to the Bank.
The following table sets forth, for the period indicated, the details of quantitative disclosure for remuneration of WTDs (including MD & CEO) and equivalent positions.
` in million, except numbers
particularsYear ended
march 31, 2020
Number of meetings held by the BGRNC 5
Remuneration paid to its members during the financial year (sitting fees) 1
Number of employees who received a variable remuneration award1 5
Number and total amount of sign-on awards made -
Number and total amount of guaranteed bonuses awarded -
Details of severance pay, in addition to accrued benefits -
Breakdown of amount of remuneration awards for the financial yearFixed2
Variable1,3
- Deferred - Non-deferredShare-linked instruments3
214.857.3
-57.3
5,475,500
Total amount of deferred remuneration paid out during the year -
Total amount of outstanding deferred remunerationCash Shares (nos.)Shares-linked instrumentsOther forms
N.A.-
4,690,430 -
Integrated Report Statutory Reports Financial Statements
233

FINANCIAL STATEMENTS OF ICICI BANK LIMITED
SChEDuLESforming part of the Accounts (Contd.)
` in million, except numbers
particularsYear ended
march 31, 2020
Total amount of outstanding deferred remuneration and retained remuneration exposed to ex-post explicit and/or implicit adjustments -
Total amount of reductions during the year due to ex-post explicit adjustments4 -
Total amount of reductions during the year due to ex-post implicit adjustments -
1. Includes WTDs transferred to group companies and who were paid bonus during the year. 2. Fixed pay includes basic salary, supplementary allowances, superannuation, contribution to provident fund and gratuity
fund by the Bank. The amounts mentioned in the above table correspond to the period of employment of WTDs in the Bank during the year ended March 31, 2020.
3. The variable (performance bonus) and share-linked instruments represent amounts paid/options awarded during the year, as per RBI approvals. Out of total options, 2,584,000 options pertain to fiscal 2018 and 2,891,500 options pertain to fiscal 2019.
4. Excludes ` 74.1 million variable pay to the former MD & CEO for past years which has been directed for claw-back in
respect of which the Bank has filed a recovery suit against the former MD & CEO.
payment of compensation in the form of profit related commission to the non-executive directors
The Board at its meeting held on September 16, 2015 and the shareholders at their meeting held on July 11, 2016 approved the payment of profit related commission of ̀ 1.0 million per annum to be paid to each non-executive Director of the Bank (excluding government nominee and part-time Chairman) subject to the availability of net profits at the end of each financial year.
The Bank accordingly recognised an amount of ` 7.0 million as profit related commission payable to the non-executive Directors during the year ended March 31, 2021, subject to requisite approvals. During the year ended March 31, 2021, the Bank paid ` 7.0 million as profit related commission payable to the non-executive Directors for the year ended March 31, 2020.
55. corporate Social Responsibility The gross amount required to be spent by the Bank on Corporate Social Responsibility (CSR) related activities during
the year ended March 31, 2021 was ` 1,845.3 million (March 31, 2020: ` 1,273.0 million).
The following table sets forth, for the periods indicated, the amount spent by the Bank on CSR related activities.
` in million
Sr. no.
particularsYear ended march 31, 2021 Year ended march 31, 2020
in cash Yet to be paid in cash total in cash Yet to be
paid in cash total
1. Construction/acquisition of any asset - - - - - -
2. On purposes other than (1) above 1,885.8 119.2 2,005.0 1,048.9 294.6 1,343.5
As required under the Companies (Corporate Social Responsibility Policy) Amendment Rules, 2021, surplus of ` 138.6 million, arising out of CSR activities during the year ended March 31, 2021 has been transferred to unspent CSR Account.
The following table sets forth, for the periods indicated, the details of related party transactions pertaining to CSR related activities.
` in million
Sr. no.
Related partyYear ended
march 31, 2021Year ended
march 31, 20201. ICICI Foundation 798.3 263.2
total 798.3 263.2
234
Annual Report 2020-21

FINANCIAL STATEMENTS OF ICICI BANK LIMITED
SChEDuLESforming part of the Accounts (Contd.)
56. disclosure of customer complaints The following table sets forth, for the periods indicated, the movement of complaints received by the Bank from its
customers.
particularsYear ended
march 31, 2021Year ended
march 31, 2020No. of complaints pending at the beginning of the year 28,549 20,753No. of complaints received during the year 482,213 508,434No. of complaints disposed during the year 480,666 500,638 Of which, number of complaints rejected by the Bank 135,531 119,707No. of complaints pending at the end of the year 30,096 28,549
1. Complaints do not include complaints redressed by the Bank within one working day. 2. Based on regulatory guidance issued to banking industry, the Bank has revised the manner of disclosure. The complaint
numbers have been re-stated for the year ended March 31, 2020.
The following table sets forth, for the periods indicated, the details of maintainable complaints received.
particularsYear ended
march 31, 2021Year ended
march 31, 2020(i) Number of maintainable complaints received by the bank from
Office of Banking Ombudsmans (OBOs)1 15,579 11,339
Of (i), number of complaints resolved in favour of the bank by Banking Ombudsmans (BOs) 5,139 4,239
Of (i), number of complaints resolved through conciliation/mediation/advisories issued by BOs2 10,440 7,100
Of (i), number of complaints resolved after passing of Awards by BOs against the bank - -
(ii) Number of Awards unimplemented within the stipulated time (other than those appealed) - -
1. Maintainable complaints are as per data received from RBI. 2. Of these, BO has agreed to the representation given by the Bank in 10,036 complaints for the year ended March 31, 2021 (year
ended March 31, 2020: 6,794).
The following table sets forth top five grounds of complaints received by the Bank from customers for the year ended March 31, 2021.
Grounds of complaints no. of complaints
pending at the beginning of
the year
no. of complaints
received during the
year
% increase/ decrease in the
no. of complaints received over previous year
no. of complaints
pending at the end of the
year
no. of complaints
pending beyond 30
daysATM/Debit Cards 12,266 244,097 (20.0%) 11,760 4,173
Credit Cards 9,026 122,519 7.0% 10,107 2,612
Internet/Mobile/ Electronic Banking 5,165 42,104 33.3% 6,877 3,863
Loans and advances 290 14,664 56.8% 268 6
Account opening/ difficulty in operation of accounts 215 10,978 30.6% 257 0
Others 1,587 47,851 21.2% 827 74
total 28,549 482,213 (5.2%) 30,096 10,728
Integrated Report Statutory Reports Financial Statements
235

FINANCIAL STATEMENTS OF ICICI BANK LIMITED
SChEDuLESforming part of the Accounts (Contd.)
The following table sets forth top five grounds of complaints received by the Bank from customers for the year ended March 31, 2020
Grounds of complaints no. of complaints
pending at the beginning of
the year
no. of complaints
received during the
year
% increase/ decrease in the
no. of complaints received over previous year
no. of complaints
pending at the end of the
year
no. of complaints
pending beyond 30
daysATM/Debit Cards 15,031 305,131 3.8% 12,266 1,534
Credit Cards 3,328 114,468 51.7% 9,026 2,676
Internet/Mobile/ Electronic Banking
1,244 31,589 141.5% 5,165 3,000
Loans and advances 200 9,352 (2.8%) 290 93
Account opening/ difficulty in operation of accounts
131 8,405 (15.1%) 215 65
Others 819 39,489 5.2% 1,587 446
total 20,753 508,434 15.6% 28,549 7,814
57. drawdown from reserves As per the section 52 (2) (c) of the Companies Act 2013, securities premium account may be utilised for writing
off the expenses/commission paid/discount allowed on, any issue of shares or debentures by a company. Further, as per RBI DBOD mailbox clarification dated October 9, 2007 on ‘Prudential Norms - Utilisation of Share Premium Account’, banks can utilise share premium account for meeting the direct expenses relating to the issue of shares.
Accordingly, during the year ended March 31, 2021, the Bank has utilised an amount of ` 701.7 million (year ended March 31, 2020: Nil) from securities premium for meeting the direct expenses relating to the issuance of equity shares through Qualified Institutions Placement.
As per the circular on ‘Prudential Norms for Classification, Valuation and Operation of Investments Portfolio by Banks – Spreading of MTM losses and creation of Investment Fluctuation Reserve (IFR)’ issued by RBI, the Bank can draw down balance available in IFR in excess of 2% of its HFT and AFS portfolio. Accordingly, during the year ended March 31, 2021, the Bank has transferred an amount of ̀ 2,495.8 million from IFR to Balance in Profit & Loss Account.
During the year ended March 31, 2021, the accumulated balance in Reserve Fund maintained under Sri Lankan Banking Act No. 30 of 1988 by Sri Lanka branch amounting to ` 77.6 million was transferred to Balance in Profit & Loss Account due to closure of the Branch.
58. investor education and protection Fund The unclaimed dividend amount, due for transfer to the Investor Education and Protection Fund (IEPF) during the
year ended March 31, 2021 and March 31, 2020, has been transferred without any delay.
59. impact of covid-19 on the performance of the Bank The Covid-19 pandemic has impacted most economies and banking systems globally, including India. The
nation-wide lockdown in April-May 2020 substantially impacted economic activity. The easing of lockdown measures subsequently led to gradual improvement in economic activity and progress towards normalcy. For the banking sector, these developments resulted in lower demand for loans and fee-based services and regulatory measures like moratorium on payment of dues and standstill in asset classification to mitigate the economic consequences on borrowers. It also resulted in increase in provisioning reflecting higher actual and expected additions to non-performing loans following the cessation of moratorium and asset classification standstill. The current second wave of Covid-19 pandemic, where the number of new cases has increased significantly in India, has resulted in re-imposition of localised/regional lock-down measures in various parts of the country.
236
Annual Report 2020-21

FINANCIAL STATEMENTS OF ICICI BANK LIMITED
SChEDuLESforming part of the Accounts (Contd.)
The impact, including credit quality and provision, of the Covid-19 pandemic, on the Bank, is uncertain and will depend on the spread of Covid-19, the effectiveness of current and future steps taken by the governments and central bank to mitigate the economic impact, steps taken by the Bank and the time it takes for economic activities to return to pre-pandemic levels. The Bank’s capital and liquidity position is strong and would continue to be a focus area for the Bank during this period.
In addition to Covid-19 related provision of ` 27,250.0 million made during the year ended March 31, 2020, during the year ended March 31, 2021, the Bank made additional Covid-19 related provision of ` 65,500.0 million (excluding contingency provision on borrower accounts not classified as non-performing pursuant to the Supreme Court interim order) and utilised ` 18,000.0 million of Covid-19 related provisions. Accordingly, at March 31, 2021, the Bank held aggregate Covid-19 related provision of ` 74,750.0 million.
60. comparative figures Figures of the previous year have been re-grouped to conform to the current year presentation.
Signatures to Schedules 1 to 18
As per our Report of even date. For and on behalf of the Board of Directors
For Walker chandiok & co llp Chartered AccountantsICAI Firm Registration no.: 001076N/N500013
Girish chandra chaturvediChairman DIN-00110996
Uday m. chitaleDirector DIN-00043268
Sandeep BakhshiManaging Director & CEO DIN-00109206
Sudhir n. pillaiPartnerMembership no.: 105782
Vishakha mulyeExecutive Director DIN-00203578
anup BagchiExecutive Director DIN-00105962
Sandeep BatraExecutive DirectorDIN-03620913
Rakesh JhaGroup Chief Financial Officer
Ranganath athreya Company Secretary
Rajendra KhandelwalChief Accountant
MumbaiApril 24, 2021
Integrated Report Statutory Reports Financial Statements
237