FINANCIAL STATEMENTS - Hunter's Hill Council STATEMENTS 2015/2016 for the year ended 30 June 2016 A...
100
Hunter’s Hill Council FINANCIAL STATEMENTS 2015/2016 for the year ended 30 June 2016 A sense of history, A sense of community, A place to belong, A sustainable future
-
Upload
nguyenhanh -
Category
Documents
-
view
214 -
download
1
Transcript of FINANCIAL STATEMENTS - Hunter's Hill Council STATEMENTS 2015/2016 for the year ended 30 June 2016 A...

Hunter’s Hill Council
FINANCIAL STATEMENTS
2015/2016
for the year ended 30 June 2016
A sense of history, A sense of community, A place to belong, A sustainable future


Hunter's Hill Council GENERAL PURPOSE FINANCIAL STATEMENTS for the year ended 30 June 2016
“A sense of history, A sense of community,
A place to belong, A sustainable future”

Financial Statements 2016
Hunter's Hill Council
General Purpose Financial Statements for the year ended 30 June 2016
Contents
1. Statement by Councillors and Management
2. Primary Financial Statements:
– Income Statement
– Statement of Comprehensive Income
– Statement of Financial Position
– Statement of Changes in Equity
– Statement of Cash Flows
3. Notes to the Financial Statements
4. Independent Auditor’s Reports:
– On the Financial Statements (Sect 417 [2])
– On the Conduct of the Audit (Sect 417 [3])
Overview
(i) These financial statements are General Purpose Financial Statements and cover the operations for
Hunter's Hill Council.
(ii) Hunter's Hill Council is a body politic of NSW, Australia – being constituted as a local government area
by proclamation and is duly empowered by the Local Government Act 1993 (LGA).
Council’s Statutory Charter is detailed in Paragraph 8 of the LGA and includes giving Council;
the ability to provide goods, services and facilities, and to carry out activities appropriate to the current and future
needs of the local community and of the wider public,
the responsibility for administering regulatory requirements under the LGA and
a role in the management, improvement and development of the resources in the area.
A description of the nature of Council’s operations and its principal activities are provided in Note 2(b).
(iii) All figures presented in these financial statements are presented in Australian currency.
(iv) These financial statements were authorised for issue by the Council on 06 October 2016.
Council has the power to amend and reissue these financial statements.
i
i
i
8
9
Page
4
6
7
5
2
page 1

Financial Statements 2016
Hunter's Hill Council
General Purpose Financial Statementsfor the year ended 30 June 2016
Statement by Councillors and Managementmade pursuant to Section 413(2)(c) of the Local Government Act 1993 (NSW) (as amended)
The attached General Purpose Financial Statements have been prepared in accordance with:
° the Local Government Act 1993 (NSW) (as amended) and the regulations made thereunder,
° the Australian Accounting Standards and professional pronouncements, and
° the Local Government Code of Accounting Practice and Financial Reporting.
To the best of our knowledge and belief, these financial statements:
° present fairly the Council’s operating result and financial position for the year, and
0 accord with Council’s accounting and other records.
We are not aware of any matter that would render these statements false or misleading in any way.
Signed in accordance with a resolution of Council made on 19 September 2016.
Richard QuinnMayor
page 2

Financial Statements 2016
Hunter's Hill Council
Income Statement for the year ended 30 June 2016
$ ’000
Income from continuing operations
Revenue:
Rates and annual charges
User charges and fees
Interest and investment revenue
Other revenues
Grants and contributions provided for operating purposes
Grants and contributions provided for capital purposes
Other income:
Net gains from the disposal of assets
Net share of interests in joint ventures and
associates using the equity method
Total income from continuing operations
Expenses from continuing operations
Employee benefits and on-costs
Borrowing costs
Materials and contracts
Depreciation and amortisation
Impairment
Other expenses
Interest and investment losses
Net losses from the disposal of assets
Net share of interests in joint ventures and
associates using the equity method
Total expenses from continuing operations
Operating result from continuing operations
Discontinued operations
Net profit/(loss) from discontinued operations
Net operating result for the year
Net operating result attributable to Council
Net operating result attributable to non-controlling interests
Net operating result for the year before grants and
contributions provided for capital purposes
Original budget as approved by Council – refer Note 16
19
14
1
1,345
799
3b 1,111
354
935
1,365 3e,f
28
10
4,523
751
321
Budget 1
3e,f
4d
5
4b
1,035
10,858 10,834
Notes
3a
3d
3c
2016
339
2016
4,000
–
3,665 23
23
24
14,394
23
3,220
3c
5
4a 5,359
8
2,118
15,105
3,665
4d
19
2,160
–
5,265
–
–
2,282
–
5,336
4e
–
–
4c
10
18,770
5,164
2,019
–
3,665
14,965 14,417
5,578
1,919
2,364
(298)
Actual
2015
Actual
10,483
327
807
335
14,630
32 16
1,234
445 733
–
–
–
335
335
(398)
–
This statement should be read in conjunction with the accompanying notes. page 3

Financial Statements 2016
Hunter's Hill Council
Statement of Comprehensive Income for the year ended 30 June 2016
$ ’000
Net operating result for the year (as per Income Statement)
Other comprehensive income:
Amounts which will not be reclassified subsequently to the operating result
Gain (loss) on revaluation of I,PP&E
Adjustment to correct prior period errors
Impairment (loss) reversal relating to I,PP&E
Other comprehensive income – joint ventures and associates
Total items which will not be reclassified subsequently
to the operating result
Amounts which will be reclassified subsequently to the operating result
when specific conditions are met
Nil
Realised (gain) loss on available-for-sale investments recognised in P&L
Gain (loss) on revaluation of available-for-sale investments
Realised (gain) loss from other reserves recognised in P&L
Gain (loss) on revaluation of other reserves
Other movements
Total items which will be reclassified subsequently
to the operating result when specific conditions are met
Total other comprehensive income for the year
Total comprehensive income for the year
Total comprehensive income attributable to Council
Total comprehensive income attributable to non-controlling interests
–
2016
10,389
2,958
–
6,724
10,389
20b (ii)
– 20b (ii)
–
–
20b (ii) 6,724
Notes
Actual
3,665
20b (ii)
20b (ii)
19b
20b (ii)
–
6,724 2,958
–
–
– –
–
– –
335
– –
–
2,958
–
3,293
3,293
Actual
2015
This statement should be read in conjunction with the accompanying notes. page 4

Financial Statements 2016
Hunter's Hill Council
Statement of Financial Position as at 30 June 2016
$ ’000
ASSETS
Current assets
Cash and cash equivalents
Receivables
Inventories
Other
Total current assets
Non-current assets
Receivables
Infrastructure, property, plant and equipment
Investments accounted for using the equity method
Total non-current assets
TOTAL ASSETS
LIABILITIES
Current liabilities
Payables
Borrowings
Provisions
Total current liabilities
Non-current liabilities
Borrowings
Provisions
Total non-current liabilities
TOTAL LIABILITIES
Net assets
EQUITY
Retained earnings
Revaluation reserves
Council equity interest
Non-controlling equity interests
Total equity
20 106,007
196,352
196,352
5,849
128
109,202
–
79,956 87,150
6,080
185,963
–
185,963 196,352
20
51
10
185,963
7
8
8
20,327
939
155
10
465 19
65
1,893
10 17
34
5,952
24
104
192,043
4,096
1,799
57
5,798
10
9
32
180,080
11,498
32
Actual
10,333
2016
19,220
Actual
2015Notes
6a
1,039
117 96
10 3,840
202,201
180,545 181,874
7
433
181,377
13
9
417
Actual
2014
9,969
176,537
11,183
1,101
17
32
3,537
57
1,723
5,317
21
188,169
176,986
161
5,499
182,670
182,670
105,672
76,998
182,670
–
182
This Statement should be read in conjunction with the accompanying Notes. page 5

Financial Statements 2016
Hunter's Hill Council
Statement of Changes in Equity for the year ended 30 June 2016
$ ’000
Opening balance (as per last year’s audited accounts)
a. Correction of prior period errors
b. Changes in accounting policies (prior year effects)
Revised opening balance (as at 1/7/15)
c. Net operating result for the year
d. Other comprehensive income
– Revaluations: IPP&E asset revaluation rsve
– Revaluations: other reserves
– Transfers to Income Statement
– Impairment (loss) reversal relating to I,PP&E
– Joint ventures and associates
Other comprehensive income
Total comprehensive income (c&d)
e. Distributions to/(contributions from) non-controlling Interests
f. Transfers between equity
Equity – balance at end of the reporting period
$ ’000
Opening balance (as per last year’s audited accounts)
a. Correction of prior period errors
b. Changes in accounting policies (prior year effects)
Revised opening balance (as at 1/7/14)
c. Net operating result for the year
d. Other comprehensive income
– Revaluations: IPP&E asset revaluation rsve
– Revaluations: other reserves
– Transfers to Income Statement
– Impairment (loss) reversal relating to I,PP&E
– Joint ventures and associates
Other comprehensive income
Total comprehensive income (c&d)
e. Distributions to/(contributions from) non-controlling Interests
f. Transfers between equity
Equity – balance at end of the reporting period
2,958
– 2,958 2,958
Total
Interest
–
2,958
– – –
–
–
– – –
–
–
–
2,958
–
–
–
196,352
10,389
–
–
–
–
3,665
185,963
185,963
–
Non-
10,389
–
– –
79,956
–
controlling
185,963
185,963
–
Council
interest
–
equity
Non-
6,724
–
– 6,724
–
6,724
–
– –
3,665
20 (c)
20 (d)
–
3,665
–
106,007
19b –
20b (ii)
Retained
earningsNotes
–
–
20b (ii)
20b (ii)
106,007
6,724
20b (ii)
– 6,724
–
(Refer 20b)
–
Reserves
Reserves
6,724
86,210
(470)
–
79,956
(Refer 20b)
2016
–
– –
–
185,963
–
79,956
20b (ii)
19b
2015
– 335
269,659
(202,022)
76,998
279,020
–
20b (ii)
20b (ii)
–
–
20 (d)
106,007
–
–
335
(163,987)
2,958 3,293
182,670
(366,009)
20b (ii) 2,958
–
–
–
–
–
185,963
3,293
–
–
–
– – – – –
Council
196,352
–
–
105,672
–
–
Earnings
335
–
(366,009)
182,670
548,679
335
–
Retained
Notes
3,665
110,142
470
Total
Interest
controlling
–
EquityInterest
6,724
20 (c) –
–
–
548,679
–
This statement should be read in conjunction with the accompanying notes. page 6

Financial Statements 2016
Hunter's Hill Council
Statement of Cash Flows for the year ended 30 June 2016
$ ’000
Cash flows from operating activities
Receipts:
Rates and annual charges
User charges and fees
Investment and interest revenue received
Grants and contributions
Bonds, deposits and retention amounts received
Other
Payments:
Employee benefits and on-costs
Materials and contracts
Borrowing costs
Bonds, deposits and retention amounts refunded
Other
Net cash from boundary adjustments
Net cash provided (or used in) operating activities
Cash flows from investing activities
Receipts:
Sale of infrastructure, property, plant and equipment
Payments:
Purchase of infrastructure, property, plant and equipment
Net cash provided (or used in) investing activities
Cash flows from financing activities
Receipts:
Nil
Payments:
Repayment of borrowings and advances
Net cash flow provided (used in) financing activities
Net increase/(decrease) in cash and cash equivalents
Plus: cash and cash equivalents – beginning of year
Cash and cash equivalents – end of the year
Additional Information:
plus: Investments on hand – end of year
Total cash, cash equivalents and investments
Please refer to Note 11 for information on the following:
– Non-cash financing and investing activities
– Financing arrangements
– Net cash flow disclosures relating to any discontinued operations
6b
Notes
338
(5,186)
2,028
2,126
256 355
1,257
1,647
20152016
80
80
(61)
(1,818)
11a
(61)
(1,963)
145
1,959
(2,364)
1,236
–
1,072
339
10,834
Budget
(5,530)
(10)
(4,554)
2016
936
(62)
19,220
–
19,220
10,333
10,333
–
11a
2,053
(2,616)
305
10,814
–
1,785
908
Actual
10,442
2,653
(12)
(5,954)
(5,272)
(2,555)
(218)
(14)
(5,039)
(2,232) 6,896
(2,337)
(57)
9,969
(57)
364
10,333
8,887
(62)
Actual
(3,076)
11b
9,512 105
(229)
–
This statement should be read in conjunction with the accompanying notes. page 7

Financial Statements 2016
Hunter's Hill Council
Notes to the Financial Statements for the year ended 30 June 2016
Contents of the notes accompanying the financial statements
Details
Summary of significant accounting policies
Council functions/activities – financial information
Council functions/activities – component descriptions
Income from continuing operations
Expenses from continuing operations
Gains or losses from the disposal of assets
Cash and cash equivalent assets
Investments
Restricted cash, cash equivalents and investments – details
Receivables
Inventories and other assets
Infrastructure, property, plant and equipment
Externally restricted infrastructure, property, plant and equipment
Infrastructure, property, plant and equipment – current year impairments
Payables, borrowings and provisions
Description of (and movements in) provisions
Statement of cash flows – additional information
Commitments for expenditure
Statement of performance measures:
13a (i) Local government industry indicators (consolidated)
Investment properties
Financial risk management
Material budget variations
Statement of developer contributions
Contingencies and other liabilities/assets not recognised
Interests in other entities
Financial result and financial position by fund
‘Held for sale’ non-current assets and disposal groups
Events occurring after the reporting date
Discontinued operations
Intangible assets
Reinstatement, rehabilitation and restoration liabilities
Fair value measurement
32
28
29
30-31
38
35
37-38
33
2(a)
3
2(b)
6(b)
5
23
26
Note
22
14
10(a)
10(b)
17
6(a)
4
6(c)
9(c)
11
24
Page
1
25
19
15
16
20
21
43
41-42
34
36
18
12
13
9-15
16
17
18-23
7
8
9(a)
9(b)
24-27
29
39-40
54-55
45-48
66
65
62
Retained earnings, revaluation reserves, changes in accounting
policies, changes in accounting estimates and errors
27 67-76
64
44
56-57
49-51
63
52-53
61
58-60
page 8

Financial Statements 2016_
Hunter's Hill Council
Notes to the Financial Statements for the year ended 30 June 2016
Note 1. Summary of significant accounting policies
page 9
The principal accounting policies adopted by Council in the preparation of these consolidated financial statements are set out below. Under Australian Accounting Standards (AASBs), accounting policies are defined as those specific principles, bases, conventions, rules and practices applied by a reporting entity (in this case Council) in preparing and presenting its financial statements.
(a) Basis of preparation These financial statements are general purpose financial statements, which have been prepared in accordance with Australian Accounting Standards and Australian Accounting Interpretations issued by the Australian Accounting Standards Board, the Local Government Act (1993) and Regulation, and the Local Government Code of Accounting Practice and Financial Reporting. New and amended standards adopted by Council There have been no new accounting standards adopted in this year’s financial statements which have had any material impact on reported financial position, performance or cash flows. Early adoption of accounting standards Council has not elected to apply any pronouncements before their operative date in the annual reporting period beginning 1 July 2015, except for AASB2015-7 Amendments to Australian Accounting Standards – Fair Value Disclosures of Not-for-Profit Public Sector Entities, which has reduced the fair value disclosures for Level 3 assets. For summary information relating to the effects of standards with future operative dates refer further to paragraph (ab). Basis of accounting These financial statements have been prepared under the historical cost convention except for certain financial assets and liabilities at fair value through profit or loss and available-for-sale financial assets, which are all valued at fair value, the write down of any asset on the basis of impairment (if warranted), and certain classes of non-current assets (eg. infrastructure, property, plant and equipment and investment property) that are accounted for at fair valuation.
The accrual basis of accounting has also been applied in their preparation. Changes in accounting policies Council’s accounting policies have been consistently applied to all the years presented, unless otherwise stated. There have also been no changes in accounting policies when compared with previous financial statements unless otherwise stated [refer
Note 20 (d)]. Critical accounting estimates The preparation of financial statements requires the use of certain critical accounting estimates (in conformity with AASBs). Accordingly this requires management to exercise its judgement in the process of applying the Council's accounting policies. Estimates and judgements are continually evaluated and are based on historical experience and other factors, including expectations of future events that may have a financial impact on Council and that are believed to be reasonable under the circumstances. Critical accounting estimates and assumptions Council makes estimates and assumptions concerning the future. The resulting accounting estimates will, by definition, seldom equal the related actual results. The estimates and assumptions that have a significant risk of causing a material adjustment to the carrying amounts of assets and liabilities within the next financial year are set out below: (i) Estimated fair values of investment properties
(ii) Estimated fair values of infrastructure, property,
plant and equipment,
(b) Revenue recognition Council recognises revenue when the amount of revenue can be reliably measured, it is probable that future economic benefits will flow to it, and specific criteria have been met for each of the Council’s activities as described below. Council bases any estimates on historical results, taking into consideration the type of customer, the

Financial Statements 2016_
Hunter's Hill Council
Notes to the Financial Statements for the year ended 30 June 2016
Note 1. Summary of significant accounting policies (continued)
page 10
type of transaction and the specifics of each arrangement. Revenue is measured at the fair value of the consideration received or receivable. Revenue is measured on major income categories as follows: Rates, Annual Charges, Grants and Contributions Rates, annual charges, grants and contributions (including developer contributions) are recognised as revenues when the Council obtains control over the assets comprising these receipts. Control over assets acquired from rates and annual charges is obtained at the commencement of the rating year as it is an enforceable debt linked to the rateable property or, where earlier, upon receipt of the rates. Control over granted assets is normally obtained upon their receipt (or acquittal) or upon earlier notification that a grant has been secured, and is valued at their fair value at the date of transfer. Revenue from contributions is recognised when the Council either obtains control of the contribution or the right to receive it, (i) it is probable that the economic benefits comprising the contribution will flow to the Council and (ii) the amount of the contribution can be measured reliably. Where grants or contributions recognised as revenues during the financial year were obtained on condition that they be expended in a particular manner or used over a particular period and those conditions were undischarged at balance date, the unused grant or contribution is disclosed in Note 3 (g). User charges, fees and other Income User charges, fees and other income (including parking fees and fines) are recognised as revenue when the service has been provided, the payment is received, or when the penalty has been applied, whichever first occurs. A provision for the impairment of these receivables is recognised when collection in full is no longer probable.
A liability is recognised in respect of revenue that is reciprocal in nature to the extent that the requisite service has not been provided as at balance date. Sale of infrastructure, property, plant and equipment The profit or loss on sale of an asset is determined when control of the asset has irrevocably passed to the buyer. Interest and rents Rental income is accounted for on a straight-line basis over the lease term. Interest income from cash and investments is accounted for using the effective interest rate at the date that interest is earned. Other Income Other income is recorded when the payment is due, the value of the payment is notified or the payment is received, whichever occurs first.
(c) Principles of consolidation These consolidated financial statements include the financial position and performance of controlled entities from the date on which control is obtained until the date that control is lost. The Consolidated Fund In accordance with the provisions of section 409(1) of the LGA 1993, all money and property received by Council is held in the Council’s consolidated fund unless it is required to be held in the Council’s trust fund. The consolidated fund and other entities through which the Council controls resources to carry on its functions have been included in the financial statements forming part of this report. The following entities have been included as part of the consolidated fund: General purpose operations
The trust fund In accordance with the provisions of section 411 of the Local Government Act 1993 (as amended), a separate and distinct trust fund is maintained to account for all money and property received by the Council in trust that must be applied only for the

Financial Statements 2016_
Hunter's Hill Council
Notes to the Financial Statements for the year ended 30 June 2016
Note 1. Summary of significant accounting policies (continued)
page 11
purposes of or in accordance with the trusts relating to those monies. Trust monies and property subject to Council’s control have been included in these statements. Trust monies and property held by Council but not subject to the control of Council have been excluded from these statements. A separate statement of monies held in the trust fund is available for inspection at the Council office by any person free of charge. Joint arrangements Council has no interest in any joint arrangements. Associates Council has no interest in any associates. County councils Council is not a member of any county councils.
(d) Leases All leases entered into by Council are reviewed and classified on inception date as either a finance lease or an operating lease. Leases of property, plant and equipment where the Council has substantially all the risks and rewards of ownership are classified as finance leases. Property, plant and equipment acquired under finance leases is depreciated over the shorter of each leased asset’s useful life and the lease term. Leases in which a significant portion of the risks and rewards of ownership are retained by the lessor are classified as operating leases. Payments made under operating leases (net of any incentives received from the lessor) are charged to the income statement on a straight-line basis over the period of the lease. Lease income from operating leases is recognised in income on a straight-line basis over the lease term. (e) Cash and Cash Equivalents For Statement of Cash Flows (and Statement of Financial Position) presentation purposes, cash and
cash equivalents includes cash on hand, deposits held at call with financial institutions, other short-term, highly liquid investments with original maturities of three months or less that are readily convertible to known amounts of cash and that are subject to an insignificant risk of changes in value, and bank overdrafts. Bank overdrafts are shown within borrowings in current liabilities on the balance sheet but are incorporated into cash and cash equivalents for presentation of the Cash Flow Statement.
(f) Receivables Receivables are initially recognised at fair value and subsequently measured at amortised cost, less any provision for impairment. Receivables (excluding rates and annual charges) are generally due for settlement no more than 30 days from the date of recognition. The collectibility of receivables is reviewed on an ongoing basis. Debts that are known to be uncollectible are written off in accordance with Council’s policy. A provision for impairment (i.e. an allowance account) relating to receivables is established when objective evidence shows that Council will not be able to collect all amounts due according to the original terms of each receivable.
(g) Inventories (i) Raw materials and stores, work in progress and finished goods Raw materials and stores, work in progress and finished goods in respect of business undertakings are all stated at the lower of cost and net realisable value. (ii) Inventory held for distribution Inventory held for distribution is held at cost, adjusted where applicable for any loss of service potential.
(h) Infrastructure, property, plant and equipment (I,PP&E) Acquisition of assets

Financial Statements 2016_
Hunter's Hill Council
Notes to the Financial Statements for the year ended 30 June 2016
Note 1. Summary of significant accounting policies (continued)
page 12
Council’s non-current assets are continually revalued (over a 5-year period) in accordance with the fair valuation policy as mandated by the Office of Local Government. At balance date, the following classes of I,PP&E were stated at their fair value: - Plant and equipment
(as approximated by depreciated historical cost)
- Operational land (external valuation) - Community land (Valuer General) - Other Structure
(external valuation )
- Buildings – specialised/non-specialised
(external valuation)
- Roads assets incl. roads, bridges & footpaths
(external valuation)
- Stormwater drainage (external valuation) Asset revaluations Increases in the combined carrying amounts of asset classes arising on revaluation are credited to the asset revaluation reserve. To the extent that a net asset class increase reverses a decrease previously recognised via the profit or loss, then increase is first recognised in profit or loss. Net decreases that reverse previous increases of the same asset class are first charged against revaluation reserves directly in equity to the extent of the remaining reserve attributable to the asset, with all other decreases charged to the Income Statement.
Depreciation Depreciation on Council's infrastructure, property, plant and equipment assets is calculated using the straight-line method in order to allocate an asset’s cost (net of residual values) over its estimated useful life. Land is not depreciated. Estimated useful lives for Council's I,PP&E include: - Office Equipment 5 to 10 years - Office furniture 10 to 20 years - Other plant and equipment 5 to 15 years - Playground equipment 5 to 15 years - Benches, seats etc 10 to 20 years - Buildings 40 to 200 years
- Drains 80 to 100 years - Sealed Roads: Surface 60 - 200 years - Sealed Roads: Structure 100 - 200 years - Unsealed roads 100 - 200 years - Road Pavements 60 - 200 years - Kerb, Gutter & Paths 70 - 200 years
All asset residual values and useful lives are reviewed and adjusted (if appropriate) at each reporting date. An asset’s carrying amount is written down immediately to its recoverable amount if the asset’s carrying amount is greater than its estimated recoverable amount – refer Note 1 (s) on asset impairment. Any gain or loss arising on derecognition of the asset (calculated as the difference between the net disposal proceeds and the carrying amount of the asset) is included in Council’s Income Statement in the year the asset is derecognised. (i) Impairment of assets Goodwill & other Intangible Assets that have an indefinite useful life and are not subject to amortisation are tested annually for impairment, or more frequently if events or changes in circumstances indicate that the carrying amount may not be recoverable. An impairment loss is recognised for the amount by which the asset’s carrying amount exceeds its recoverable amount. The recoverable amount is the higher of an asset’s fair value less costs to sell and value in use. Non-financial assets (other than goodwill) that suffered a prior period impairment are reviewed for possible reversal of the impairment at each reporting date.
(j) Payables These amounts represent liabilities and include goods and services provided to the Council prior to the end of financial year that are unpaid.
(k) Borrowings Loans are carried at their principal amount which represents the present value of further cash flows associated with servicing the debt. Interest is accrued over the period to which it relates, and is recorded as part of ‘Payables’.
Financial Statements 2016_
Hunter's Hill Council
Notes to the Financial Statements for the year ended 30 June 2016
Note 1. Summary of significant accounting policies (continued)
page 13
(l) Borrowing costs Borrowing costs incurred for the construction of any qualifying asset are capitalised during the period of time that is required to complete and prepare the asset for its intended use or sale. (m) Employee benefits (i) Short Term Obligations Short term employee benefit obligations include liabilities for wages and salaries (including non-monetary benefits), annual leave and vesting sick leave expected to be wholly settled within the 12 months after the reporting period. Leave liabilities are recognised in the provision for employee benefits in respect of employees’ services up to the reporting date with other short term employee benefit obligations disclosed under payables. These provisions are measured at the amounts expected to be paid when the liabilities are settled. All other short-term employee benefit obligations are presented as payables. Liabilities for non vesting sick leave are recognised at the time when the leave is taken and measured at the rates paid or payable, and accordingly no Liability has been recognised in these reports. Wages & salaries, annual leave and vesting sick leave are all classified as Current Liabilities. (ii) Other Long Term Obligations The liability for all long service and annual leave in respect of services provided by employees up to the reporting date (which is not expected to be wholly settled within the 12 months after the reporting period) are recognised in the provision for employee benefits. These liabilities are measured at the present value of the expected future payments to be made using the projected unit credit method. Consideration is given to expected future wage and salary levels, experience of employee departures and periods of service. Expected future payments are then discounted using market yields at the reporting date based on national
government bonds with terms to maturity and currency that match as closely as possible the estimated future cash outflows. Due to the nature of when and how Long Service Leave can be taken, all Long Service Leave for employees with 4 or more years of service has been classified as Current, as it has been deemed that Council does not have the unconditional right to defer settlement beyond 12 months – even though it is not anticipated that all employees with more than 4 years service (as at reporting date) will apply for and take their leave entitlements in the next 12 months. (iii) Retirement benefit obligations All employees of the Council are entitled to benefits on retirement, disability or death. Council contributes to various defined benefit plans and defined contribution plans on behalf of its employees. Defined Benefit Plans A liability or asset in respect of defined benefit superannuation plans would ordinarily be recognised in the balance sheet, and measured as the present value of the defined benefit obligation at the reporting date plus unrecognised actuarial gains (less unrecognised actuarial losses) less the fair value of the superannuation fund’s assets at that date and any unrecognised past service cost. The present value of the defined benefit obligation is based on expected future payments which arise from membership of the fund to the reporting date, calculated annually by independent actuaries using the projected unit credit method. Consideration is given to expected future wage and salary levels, experience of employee departures and periods of service. However, when this information is not reliably available, Council can account for its obligations to defined benefit plans on the same basis as its obligations to defined contribution plans – i.e. as an expense when they become payable. Council is party to an Industry Defined Benefit Plan under the Local Government Superannuation Scheme, named the ‘Local Government Superannuation Scheme – Pool B’. This scheme has been deemed to be a ‘multi-employer fund’ for the purposes of AASB 119.

Financial Statements 2016_
Hunter's Hill Council
Notes to the Financial Statements for the year ended 30 June 2016
Note 1. Summary of significant accounting policies (continued)
page 14
Sufficient information is not available to account for the Scheme as a defined benefit plan (in accordance with AASB 119) because the assets to the scheme are pooled together for all Councils. However the position is monitored annually and the actuary has estimated that as at 30 June 2016 the prior period deficit still exists. Effective from 1 July 2009, employers are required to contribute additional contributions to assist in extinguishing this deficit. The amount of employer contributions to the defined benefit section of the Local Government Superannuation Scheme and recognised as an expense and disclosed as part of superannuation expenses at Note 4 (a) for the year ending 30 June 2016 was $565,340.19. The amount of additional contributions included in the total employer contribution advised above is $60,000 The share of this deficit that can be broadly attributed to Council is estimated to be in the order of $112,578.81 as at 30 June 2016. Council’s share of that deficiency cannot be accurately calculated as the scheme is a mutual arrangement where assets and liabilities are pooled together for all member councils. For this reason, no liability for the deficiency has been recognised in these financial statements. Council has, however, disclosed a contingent liability in Note 18 to reflect the possible obligation that may arise should the scheme require immediate payment to correct the deficiency.
(n) Insurance Pools Council is a member of Metropool, a mutual pool scheme providing liability insurance to Local Government. Membership includes the potential to share in either the net assets or liabilities of the fund dependant on its past performance. Council’s share of the net assets or liabilities reflects our contributions to the pool and insurance claims within each of the funds years.
Council’s accounting policy regarding the measurement and disclosure of the potential liability or benefit is to book Council’s share of net asset or liability value, as advised by Metropool taking into account their audited figures for the year ended 30 June 2016.
(o) Allocation between current and non-current assets & liabilities In the determination of whether an asset or liability is classified as current or non-current, consideration is given to the time when each asset or liability is expected to be settled. The asset or liability is classified as current if it is expected to be settled within the next 12 months, being the Council’s operational cycle. Exceptions In the case of liabilities where Council does not have the unconditional right to defer settlement beyond 12 months (such as vested long service leave), the liability is classified as current even if not expected to be settled within the next 12 months. In the case of inventories that are “held for trading”, these are also classified as current even if not expected to be realised in the next 12 months.
(ab) New accounting standards and Interpretations issued (not yet effective) Certain new (or amended) accounting standards and interpretations have been published that are not mandatory for reporting periods ending 30 June 2016. Council has not adopted any of these standards early. These include the following standards that are anticipated will impact on local government: AASB 9 – Financial Instruments AASB 15 – Revenue from Contracts with Customers and associated amending standards AASB ED 260 – Income of Not-for-Profit Entities AASB16 – Leases
Financial Statements 2016_
Hunter's Hill Council
Notes to the Financial Statements for the year ended 30 June 2016
Note 1. Summary of significant accounting policies (continued)
page 15
AASB2015-6 – Amendments to Australian Accounting Standards – Extending Related Party Disclosures to Not-for-Profit Public Sector Entities AASB 2014 – 10 Sale or Contribution of Assets Between an Investor and its Associate or Joint Venture AASB 2014 – 3 Amendments to Australian Accounting Standards – Accounting for Acquisitions of Interests in Joint Operations [AASB 1 and AASB 11] The full impact of the above standards has yet to be ascertained or quantified but will range from additional and/or revised disclosures to changes in how certain transactions and balances are accounted for.
(ac) Rounding of amounts Unless otherwise indicated, amounts in the financial statements have been rounded off to the nearest thousand dollars.
(ad) Disclaimer Nothing contained within these statements may be taken to be an admission of any liability to any person under any circumstance.

Financial Statements 2016
Hunter's Hill Council
Notes to the Financial Statements for the year ended 30 June 2016
Note 2(a). Council functions/activities – financial information
1. Includes: rates and annual charges (incl. ex-gratia), untied general purpose grants and unrestricted interest and investment income.
General purpose income 1
continuing operations
8,112
and joint ventures (using the equity method)
Operating result from
Economic affairs
5,201 Total functions and activities
1
9,216
18,782 14,417 15,117 14,394 14,965
16
4 –
32 –
2 1
7,090 14,394 15,117
7,859
10,638
192,043
465
–
202,201 1,644
433
474
1,010
–
479
1,165 191,610
225
–
201,736
– – –
87,910
14,630
–
–
14,630
–
16
–
536 (7,540)
335
(74)
752 285
– (3)
(9,193)
23
32
3,665
1
7,859 9,216 8,112
(1,357) (1,823) (1,654)
2
–
(839)
31
(4,479)
18,268
47
1
79 (119) (77)
676
(253) (335)
18
– –
29,358 20,552
4
2
14,435
19,650 34 36
(641)
– (43) 17
76
(838)
89 175
81
Actual
2016
–
2015
– – 28
20,894
(42)
(646)
–
– (1,500)
(3,011)
(1,489)
Actual
84 82
82,638
51,613 47 91 47,701
171 –
2,023
(140)
2,197 2,402 Transport and communication 1,184
Mining, manufacturing and construction 31 31
4,309 2,112
(796) 1,265
96
1,345
2,615
22
2,177
945 2,213 2,302
2,021 427
2,877
1,262 Housing and community amenities 466
Recreation and culture 390 961
135 Community services and education 218
(67) 2,744
554 219
2,829 2,906 2,996
(358)
65 102
576
116
388
(51) 108
–
167 4,461
Health
Environment 2,677
21 685
65 60
13 708 Public order and safety
Governance
Administration
(287)
(2,900) (4,313)
39
2016
Actual
Original
budget
2016
Actualbudget
(687) 654
148 203
– –
3,067
1,500
3,214
1,489 287
Operating result from
continuing operations
Original
budget
Original
Actual
2016 20152016 2016
Actual
2015
Actual
2015 2016
$ ’000 Income, expenses and assets have been directly attributed to the following functions/activities.
Details of these functions/activities are provided in Note 2(b).
Income from continuing
operations
Expenses from continuing
operations
Total assets held
(current &
non-current) Functions/activities
20162015
Actual Actual Actual
Grants included in
income from
continuing
operations
page 16

Financial Statements 2016
Hunter's Hill Council
Notes to the Financial Statements for the year ended 30 June 2016
Note 2(b). Council functions/activities – component descriptions
Details relating to the Council’s functions/activities as reported in Note 2(a) are as follows:
GOVERNANCE
ADMINISTRATION
PUBLIC ORDER AND SAFETY
HEALTH
ENVIRONMENT
COMMUNITY SERVICES AND EDUCATION
HOUSING AND COMMUNITY AMENITIES
RECREATION AND CULTURE
MINING, MANUFACTURING AND CONSTRUCTION
TRANSPORT AND COMMUNICATION
ECONOMIC AFFAIRS
Includes noxious plants and insect/vermin control; other environmental protection; solid waste management,
including domestic waste; other waste management; other sanitation; and garbage, street cleaning, drainage
and stormwater management.
Includes costs relating to Council’s role as a component of democratic government, including elections,
members’ fees and expenses, subscriptions to local authority associations, meetings of Council and policy-
making committees, public disclosure (e.g. GIPA), and legislative compliance.
Includes corporate support and other support services, engineering works, and any Council policy compliance.
Fire protection, animal control, beach control, enforcement of local government regulations, emergency
services, other.
Includes immunisation, food control, health centres etc.
Includes camping areas and caravan parks; tourism and area promotion; industrial development promotion; sale
yards and markets; real estate development; commercial nurseries; and other business undertakings.
Includes administration and education; social protection (welfare); migrant, Aboriginal and other community
services and administration (excluding accommodation – as it is covered under ‘housing and community
amenities’); youth services; aged and disabled persons services; children’s’ services, including family day care;
child care; and other family and children services.
Includes public cemeteries; public conveniences; street lighting; town planning; other community amenities,
including housing development and accommodation for families and children, aged persons, disabled persons,
migrants and Indigenous persons.
Includes public libraries; museums; art galleries; community centres and halls, including public halls and
performing arts venues; sporting grounds and venues; swimming pools; parks; gardens; lakes; and other
sporting, recreational and cultural services.
Includes building control, quarries and pits, mineral resources, and abattoirs.
Urban local, urban regional, includes sealed and unsealed roads, bridges, footpaths, parking areas, and
aerodromes.
page 17

Financial Statements 2016
Hunter's Hill Council
Notes to the Financial Statements for the year ended 30 June 2016
Note 3. Income from continuing operations
$ ’000
(a) Rates and annual charges
Ordinary rates
Residential
Business
Total ordinary rates
Special rates
Environmental
Infrastructure
Community facilities
Other
Total special rates
Annual charges (pursuant to s.496, s.496A, s.496B, s.501 & s.611)
Domestic waste management services
Section 611 charges
Total annual charges
TOTAL RATES AND ANNUAL CHARGES
Council has used 2014 year valuations provided by the NSW Valuer General in calculating its rates.
2015
1,049
166
6,881
219
161
Notes
2,334
10,483
1,085
2016
57
2,277
Actual
7,093
224
Actual
341
7,100
238
7,317
317 328
230
353
2,397
59
2,456
10,858
page 18

Financial Statements 2016
Hunter's Hill Council
Notes to the Financial Statements for the year ended 30 June 2016
Note 3. Income from continuing operations (continued)
$ ’000
(b) User charges and fees
Specific user charges (per s.502 – specific ‘actual use’ charges)
Domestic waste management services
Waste management services (non-domestic)
Total user charges
Other user charges and fees
(i) Fees and charges – statutory and regulatory functions (per s.608)
Inspection services
Planning and building regulation
Section 149 certificates (EPA Act)
Section 603 certificates
Total fees and charges – statutory/regulatory
(ii) Fees and charges – other (incl. general user charges (per s.608))
Community centres
Lease rentals
Leaseback fees – Council vehicles
Park rents
Parking fees
Restoration charges
Total fees and charges – other
TOTAL USER CHARGES AND FEES
32
1,111
574 728
342 97
180
90 182
11
52
22
382
50
143
149
6
2016
6
Actual
285
2015
24
Actual
259
26
155
149
21
357
73 76
1,234
Notes
13
172
34
page 19
Financial Statements 2016
Hunter's Hill Council
Notes to the Financial Statements for the year ended 30 June 2016
Note 3. Income from continuing operations (continued)
$ ’000
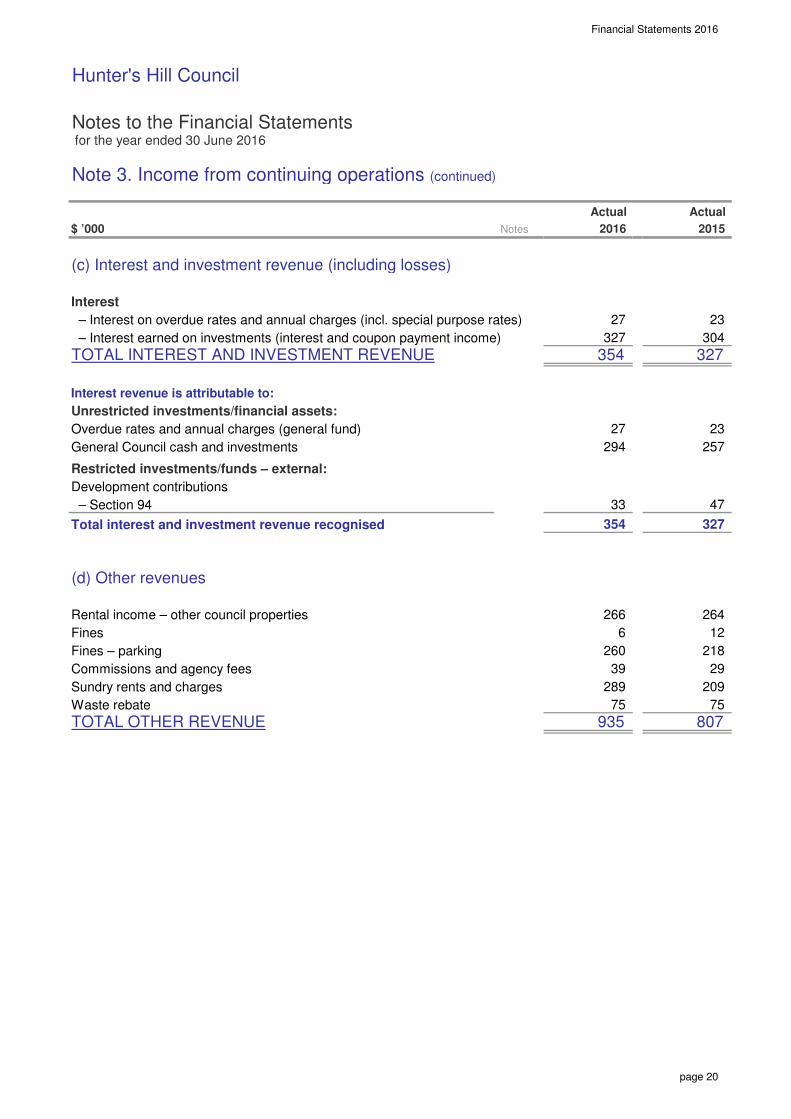
(c) Interest and investment revenue (including losses)
Interest
– Interest on overdue rates and annual charges (incl. special purpose rates)
– Interest earned on investments (interest and coupon payment income)
TOTAL INTEREST AND INVESTMENT REVENUE
Interest revenue is attributable to:
Unrestricted investments/financial assets:
Overdue rates and annual charges (general fund)
General Council cash and investments
Restricted investments/funds – external:
Development contributions
– Section 94
Total interest and investment revenue recognised
(d) Other revenues
Rental income – other council properties
Fines
Fines – parking
Commissions and agency fees
Sundry rents and charges
Waste rebate
TOTAL OTHER REVENUE
2016
807
23
327
2015
Actual Actual
75
23
304
27
264
209
6
218
12
29
266
935 75
Notes
354
27
260
47
327
327
294 257
33
354
289
39
page 20

Financial Statements 2016
Hunter's Hill Council
Notes to the Financial Statements for the year ended 30 June 2016
Note 3. Income from continuing operations (continued)
$ ’000
(e) Grants
General purpose (untied)
Financial assistance – general component
Financial assistance – local roads component
Pensioners’ rates subsidies – general component
Total general purpose
Specific purpose
Pensioners’ rates subsidies:
– Domestic waste management
Community care
Environmental protection
Library
Recreation and culture
Street lighting
Traffic route subsidy
Transport (roads to recovery)
Transport (other roads and bridges funding)
Stormwater drainage
Other
Total specific purpose
Total grants
Grant revenue is attributable to:
– Commonwealth funding
– State funding
380
380
380
–
337
70
–
–
337
–
43
–
70
–
–
70
–
193
6
34
91
–
43
–
–
–
–
70
–
1,264
415
849
406
34
–
–
–
– –
36
76
144
299
–
–
–
Capital
298
–
34
142
2015
–
–
Operating
2016
–
Capital Operating
–
79
474
16
–
–
6
47
305
–
940
–
940
635
1,264
466
2
172
6
47
785
16
20162015
479 –
20
70
page 21

Financial Statements 2016
Hunter's Hill Council
Notes to the Financial Statements for the year ended 30 June 2016
Note 3. Income from continuing operations (continued)
$ ’000
(f) Contributions
Developer contributions:
(s93 & s94 – EP&A Act, s64 of the LGA):
S 94 – contributions towards amenities/services
Total developer contributions
Other contributions:
Kerb and gutter
RMS contributions (regional roads, block grant)
Other
Total other contributions
Total contributions
TOTAL GRANTS AND CONTRIBUTIONS
2016 2015
360
15
–
Capital Capital
445
338
353
–
338
15
–
17
Operating Operating
–
72 70
5
–
2015
–
2016
–
1,035
95
375
1,365
18 19
101 95
101 15
15
360
733
12
–
page 22
Financial Statements 2016
Hunter's Hill Council
Notes to the Financial Statements for the year ended 30 June 2016
Note 3. Income from continuing operations (continued)
$ ’000
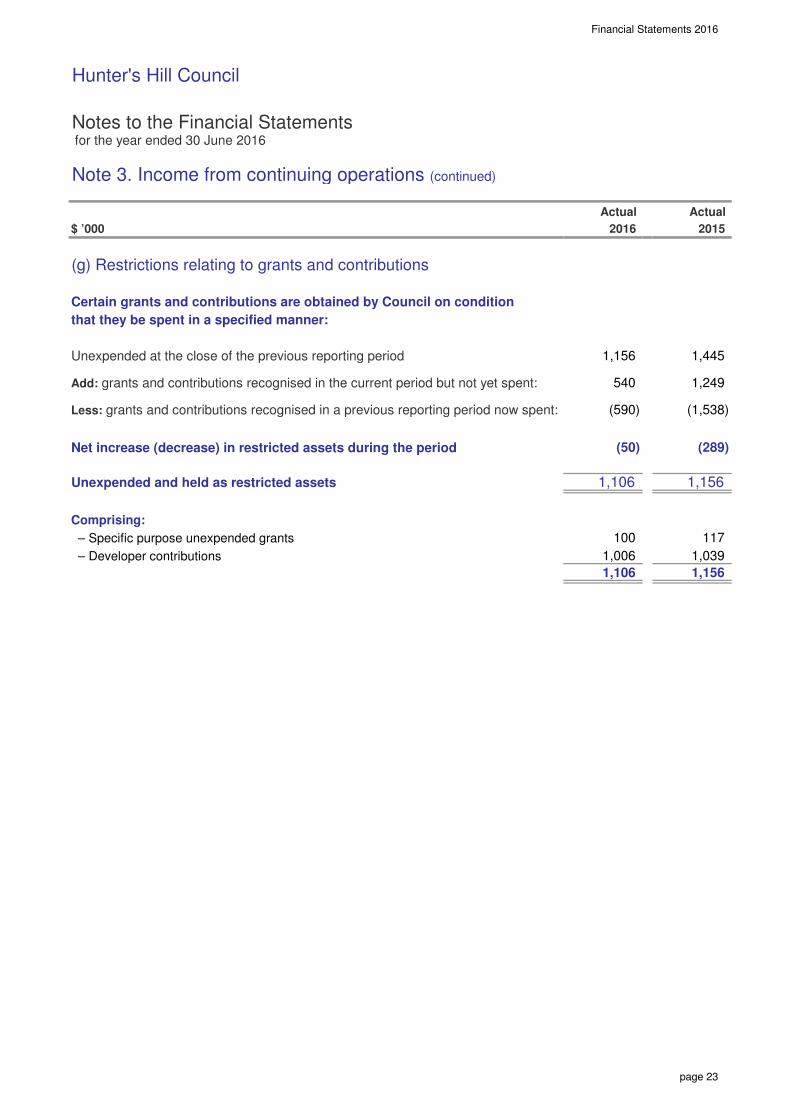
(g) Restrictions relating to grants and contributions
Certain grants and contributions are obtained by Council on condition
that they be spent in a specified manner:
Unexpended at the close of the previous reporting period
Add: grants and contributions recognised in the current period but not yet spent:
Less: grants and contributions recognised in a previous reporting period now spent:
Net increase (decrease) in restricted assets during the period
Unexpended and held as restricted assets
Comprising:
– Specific purpose unexpended grants
– Developer contributions
117
1,156
Actual
2015
1,039
540
1,156
(289)
1,249
(50)
(590)
Actual
1,156 1,445
(1,538)
2016
100
1,106
1,106
1,006
page 23

Financial Statements 2016
Hunter's Hill Council
Notes to the Financial Statements for the year ended 30 June 2016
Note 4. Expenses from continuing operations
$ ’000
(a) Employee benefits and on-costs
Salaries and wages
Travel expenses
Employee leave entitlements (ELE)
Superannuation
Workers’ compensation insurance
Fringe benefit tax (FBT)
Training costs (other than salaries and wages)
Total employee costs
Less: capitalised costs
TOTAL EMPLOYEE COSTS EXPENSED
Number of ‘full-time equivalent’ employees (FTE) at year end
(b) Borrowing costs
(i) Interest bearing liability costs
Interest on loans
Total interest bearing liability costs
Total interest bearing liability costs expensed
TOTAL BORROWING COSTS EXPENSED
5,265
50
56
536
3,997
5,276
484
2015
14
14
10
96
Actual
(11)
Actual
10
14
14
57
Notes
85
10
84
10
2016
88
3,921
5,375
54
5,359 (16)
59
565
57
578
page 24

Financial Statements 2016
Hunter's Hill Council
Notes to the Financial Statements for the year ended 30 June 2016
Note 4. Expenses from continuing operations (continued)
$ ’000
(c) Materials and contracts
Raw materials and consumables
Contractor and consultancy costs
Auditors remuneration (1)
Infringement notice contract costs (SEINS)
Legal expenses:
– Legal expenses: planning and development
– Legal expenses: debt recovery
– Legal expenses: other
Operating leases:
– Operating lease rentals: minimum lease payments(2)
Total materials and contracts
Less: capitalised costs
TOTAL MATERIALS AND CONTRACTS
1. Auditor remuneration
During the year, the following fees were incurred for services provided by
the Council’s Auditor:
(i) Audit and other assurance services
– Audit and review of financial statements: Council’s auditor
– Audit and review of financial statements: internal auditors
Remuneration for audit and other assurance services
Total Auditor remuneration
2. Operating lease payments are attributable to:
Other
18
23
(5)
5,164
807
18
2015
–
73
4,011 3,782
–
–
46
232
47
76
29
76
459
27
17
801
–
73
73
5,341
17
17
–
206
Actual
76
2016Notes
5,336
18
5,164
Actual
page 25

Financial Statements 2016
Hunter's Hill Council
Notes to the Financial Statements for the year ended 30 June 2016
Note 4. Expenses from continuing operations (continued)
$ ’000
(d) Depreciation, amortisation and impairment
Plant and equipment
Office equipment
Furniture and fittings
Infrastructure:
– Buildings – non-specialised
– Buildings – specialised
– Other structures
– Roads
– Footpaths
– Kerb and guttering
– Other road assets
– Stormwater drainage
Total depreciation and impairment costs
TOTAL DEPRECIATION ANDIMPAIRMENT COSTS EXPENSED
Actual
2016
2,019
161 167
948 775
15
2015
212
79
2,019
268 315
2,282
184
88
2,282
121
203
Depreciation/amortisation
– –
33
17
Notes
–
–
–
–
–
–
–
–
113
107
–
–
212
116
–
–
2015
–
–
Actual
–
111
Actual
2016
–
–
–
–
–
–
Impairment costs
Actual
– – 31 25
–
page 26

Financial Statements 2016
Hunter's Hill Council
Notes to the Financial Statements for the year ended 30 June 2016
Note 4. Expenses from continuing operations (continued)
$ ’000
(e) Other expenses
Other expenses for the year include the following:
Advertising
Bad and doubtful debts
Bank charges
– Department of planning levy
– NSW fire brigade levy
– Regional library
– Other contributions/levies
Councillor expenses – mayoral fee
Councillor expenses – councillors’ fees
Councillors’ expenses (incl. mayor) – other (excluding fees above)
Donations, contributions and assistance to other organisations (Section 356)
Electricity and heating
Insurance
Printing and stationery
Street lighting
Subscriptions and publications
Telephone and communications
Total other expenses
Less: capitalised costs
TOTAL OTHER EXPENSES
70
591
39
2,160
52
2
72
2,160
31
240
2016
39 38
–
144 161
38
9
54
129
152
Actual
2015
41
192
404
21
650
10
419
2,118
Actual
36
67
Notes
55
2,118
10
126
38
222
36
40
50
–
page 27

Financial Statements 2016
Hunter's Hill Council
Notes to the Financial Statements for the year ended 30 June 2016
Note 5. Gains or losses from the disposal of assets
$ ’000
Property (excl. investment property)
Proceeds from disposal – property
Less: carrying amount of property assets sold/written off
Net gain/(loss) on disposal
Plant and equipmentProceeds from disposal – plant and equipment
Less: carrying amount of plant and equipment assets sold/written off
Net gain/(loss) on disposal
Bus shelter and structureProceeds from disposal – Bus shelter and structure
Less: carrying amount of Bus shelter and structure assets sold/written off
Net gain/(loss) on disposal
NET GAIN/(LOSS) ON DISPOSAL OF ASSETS
(53)
79
–
26
– (5,447)
(12)
–
105
12
Actual
2015
(8) 4,000
(93)
–
2016
(20)
(20) (12)
–
Notes
Actual
9,433
3,986
page 28
Financial Statements 2016
Hunter's Hill Council
Notes to the Financial Statements for the year ended 30 June 2016
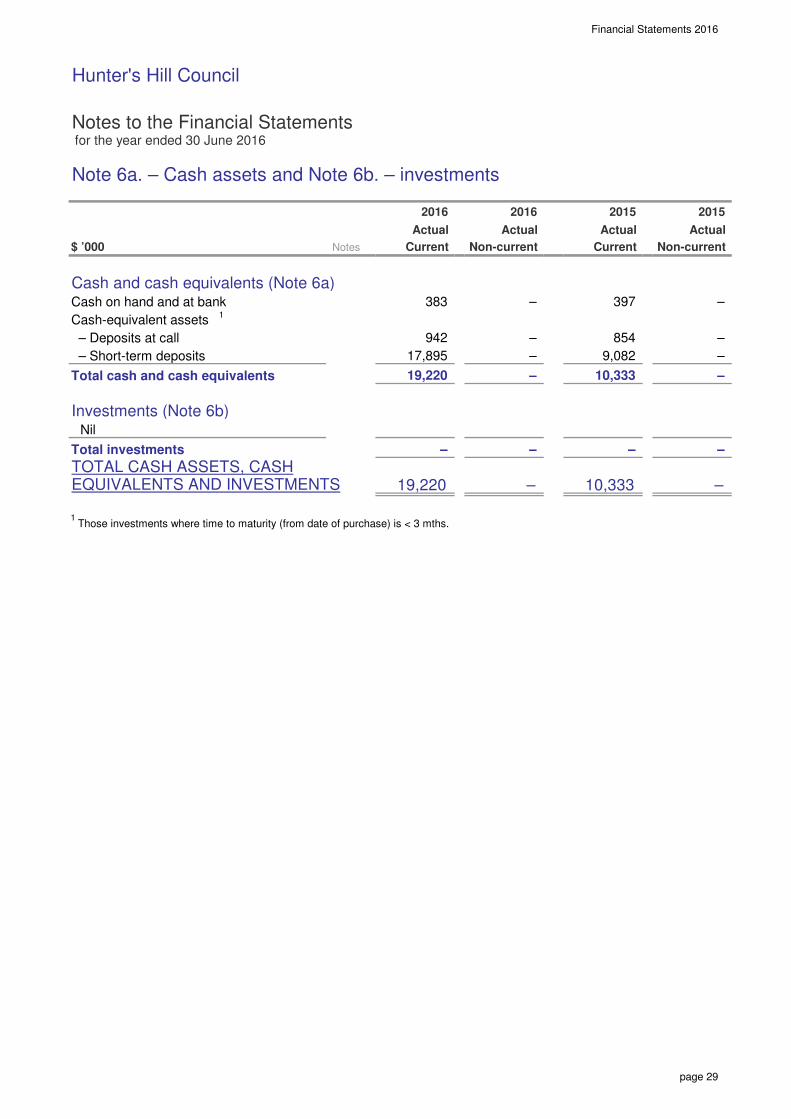
Note 6a. – Cash assets and Note 6b. – investments
$ ’000
Cash and cash equivalents (Note 6a)Cash on hand and at bank
Cash-equivalent assets1
– Deposits at call
– Short-term deposits
Total cash and cash equivalents
Investments (Note 6b)Nil
Total investments
TOTAL CASH ASSETS, CASHEQUIVALENTS AND INVESTMENTS
1 Those investments where time to maturity (from date of purchase) is < 3 mths.
–
–
–
–
Non-current
397
–
2015
–
–
–
10,333 –
–
– –
19,220
19,220
2016
17,895 –
–
9,082
854 942
383
Non-current
Actual
10,333
Current
Actual
2015
Notes
2016
Actual
Current
Actual
page 29

Financial Statements 2016
Hunter's Hill Council
Notes to the Financial Statements for the year ended 30 June 2016
Note 6c. Restricted cash, cash equivalents and investments – details
$ ’000
Total cash, cash equivalentsand investments
attributable to:
External restrictions (refer below)
Internal restrictions (refer below)
Unrestricted
$ ’000
Details of restrictions
External restrictions – included in liabilities
Specific purpose unexpended loans – general (A)
External restrictions – included in liabilities
External restrictions – other
Developer contributions – general (D)
Specific purpose unexpended grants (F)
Domestic waste management (G)
Other special levies (G)
External restrictions – other
Total external restrictions
19,220
2,991
–
11,917
Non-current
24
4,604
2016 Closing Transfers from
– 4,436
10,333
–
2,738
Opening
Actual
2015
–
Actual
10,333
(1,087)
(426)
1,491
2016
–
2,867
246
–
–
–
2016
Current
–
Actual
2,867
Current
1,488
1,039
24
1,483
117 –
2,991
2,967
323
– 19,220
balance restrictions
24
393
Non-current
Transfers to
–
restrictions
24 –
– –
2015
Actual
100
(1,607)
(77)
(1,607)
(17)
2,843
1,483
balance
–
1,006
1,090
page 30

Financial Statements 2016
Hunter's Hill Council
Notes to the Financial Statements for the year ended 30 June 2016
Note 6c. Restricted cash, cash equivalents and investments – details (continued)
$ ’000
Internal restrictions
Plant and vehicle replacement
Employees leave entitlement
Deposits, retentions and bonds
Construction of buildings
Office equipment
Road reconstruction
Elections
Public places and urban design
Insurance reserve
Other
Total internal restrictions
TOTAL RESTRICTIONS
A Loan moneys which must be applied for the purposes for which the loans were raised.
B Advances by roads and maritime services for (RMS) works on the State’s classified roads.
C Self insurance liability resulting from reported claims or incurred claims not yet reported.
D Development contributions which are not yet expended for the provision of services and amenities in accordance
with contributions plans (refer Note 17).
E RMS contributions which are not yet expended for the provision of services and amenities in accordance with
those contributions.
F Grants which are not yet expended for the purposes for which the grants were obtained. (refer Note 1 (b))
G Water, sewerage, domestic waste management (DWM) and other special rates/levies/charges are externally
restricted assets and must be applied for the purposes for which they were raised.
2016
524
938
59
4,604
213
2,589
(24)
(2,713) 2,421 7,595
6
–
–
15
–
675 519
45
491
balance
59
249
–
81
256
249
59
Opening
restrictions
Transfers to
182
20
Closing
–
(1,106)
balance
7,303
4,436
676
50
restrictions
–
2,627
45
105
(6)
–
(182)
(218)
–
(50)
101
Transfers from
(518)
83
(108)
page 31
Financial Statements 2016
Hunter's Hill Council
Notes to the Financial Statements for the year ended 30 June 2016
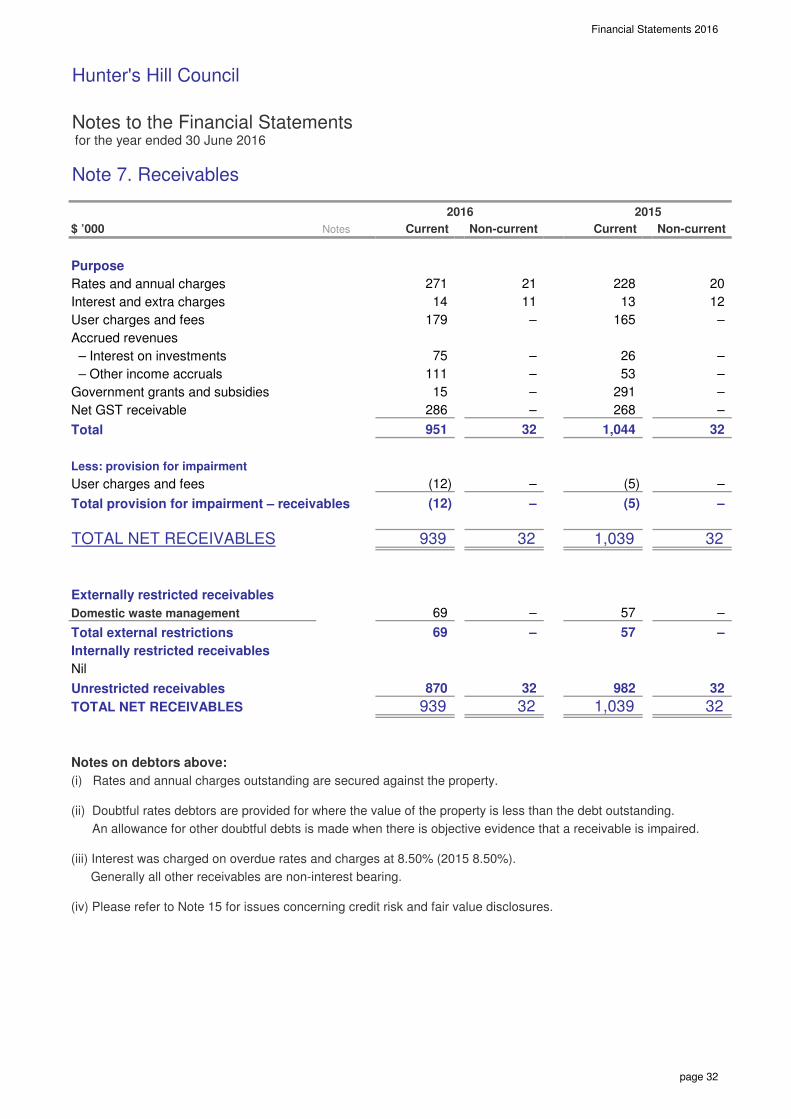
Note 7. Receivables
$ ’000
Purpose
Rates and annual charges
Interest and extra charges
User charges and fees
Accrued revenues
– Interest on investments
– Other income accruals
Government grants and subsidies
Net GST receivable
Total
Less: provision for impairment
User charges and fees
Total provision for impairment – receivables
TOTAL NET RECEIVABLES
Externally restricted receivables
Domestic waste management
Total external restrictions
Internally restricted receivables
Nil
Unrestricted receivables
TOTAL NET RECEIVABLES
Notes on debtors above:
(i) Rates and annual charges outstanding are secured against the property.
(ii) Doubtful rates debtors are provided for where the value of the property is less than the debt outstanding.
An allowance for other doubtful debts is made when there is objective evidence that a receivable is impaired.
(iii) Interest was charged on overdue rates and charges at 8.50% (2015 8.50%).
Generally all other receivables are non-interest bearing.
(iv) Please refer to Note 15 for issues concerning credit risk and fair value disclosures.
271
Current
179
(12)
870
14
2016
Notes
21
15
32
–
1,039
(5) –
69
(5)
32
32
– –
1,039
57
268
32
69
–
951
939
939
–
57
982
–
–
32
–
53
–
11
75
111
286
(12)
–
–
32
–
32
32
2015
–
1,044
–
–
–
12
Non-current
–
20
26
13
165
Current
228
291
Non-current
page 32

Financial Statements 2016
Hunter's Hill Council
Notes to the Financial Statements for the year ended 30 June 2016
Note 8. Inventories and other assets
$ ’000
(a) Inventories
(i) Inventories at cost
Stores and materials
Total inventories at cost
TOTAL INVENTORIES
(b) Other assets
Prepayments
TOTAL OTHER ASSETS
Externally restricted assets
There are no restrictions applicable to the above assets.
Total unrestricted assets
TOTAL INVENTORIES AND OTHER ASSETS
–
– 117
–
–
9
9
2015
9
Current Non-current Non-current
117
13
155
–
–
Notes Current
– 155 –
–
126 –
168
168
–
–
126
2016
13
13
–
–
page 33

Financial Statements 2016
Hunter's Hill Council
Notes to the Financial Statements for the year ended 30 June 2016
Note 9a. Infrastructure, property, plant and equipment
At At Carrying At At Carrying
$ ’000 cost fair value depreciation impairment value cost fair value depreciation impairment value
Capital work in progress 273 – – – 273 53 42 (224) 144 – – – 144
Plant and equipment – 1,349 827 – 522 198 (53) (167) – 1,302 802 – 500
Office equipment – 1,546 1,411 – 135 53 – (88) – – 1,598 1,498 – 100
Furniture and fittings – 246 124 – 122 20 – – (17) 3 – 268 140 – 128
Land:
– Operational land – 23,993 – – 23,993 (5,144) – 18,849 – – 18,849
– Community land – 55,204 – – 55,204 6,690 – 61,894 – – 61,894
Infrastructure:
– Buildings – non-specialised – 7,034 1,650 – 5,384 38 17 – (116) – – 7,090 1,767 – 5,323
– Buildings – specialised – 15,668 3,614 – 12,054 26 – (303) (212) 4 – 15,333 3,764 – 11,569
– Other structures – 7,970 1,743 – 6,227 132 54 (12) (203) 33 34 – 8,451 2,186 – 6,265
– Roads – 51,993 5,942 – 46,051 1,030 – (948) 179 – 53,202 6,890 – 46,312
– Footpaths – 9,960 2,360 – 7,600 170 – (268) 3 – 10,133 2,628 – 7,505
– Kerb and guttering – 14,325 904 – 13,421 362 – (121) – 14,687 1,025 – 13,662
– Other road assets – 1,304 113 – 1,191 (31) – 1,304 144 – 1,160
– Stormwater drainage – 9,185 1,282 – 7,903 172 – (111) 2 – 9,360 1,394 – 7,966
TOTAL INFRASTRUCTURE,PROPERTY, PLANT AND EQUIP.
Renewals are defined as the replacement of existing assets (as opposed to the acquisition of new assets).
Refer to Note 27. Fair value measurement for information regarding the fair value of other infrastructure, property, plant and equipment.
273 199,777 19,970 – 180,080
as at 30/6/2015Asset movements during the reporting period
AccumulatedWIP
transfers
Additions
new assets
Additions
renewals
Carrying
value
of disposals
Depreciation
expense
Revaluation
increments
to equity
(ARR)
2,003 (5,512) (2,282) 364 181,377 6,724 144 203,471 22,238 – –
as at 30/6/2016
Accumulated
page 34

Financial Statements 2016
Hunter's Hill Council
Notes to the Financial Statements for the year ended 30 June 2016
Note 9b. Externally restricted infrastructure, property, plant and equipment
$ ’000
Council has no externally restricted infrastructure, property, plant and equipment.
page 35

Financial Statements 2016
Hunter's Hill Council
Notes to the Financial Statements for the year ended 30 June 2016
Note 9c. Infrastructure, property, plant and equipment – current year impairments
$ ’000
Council has recognised no impairment losses during the reporting period nor reversed any prior period losses.
2016Notes
Actual Actual
2015
page 36

Financial Statements 2016
Hunter's Hill Council
Notes to the Financial Statements for the year ended 30 June 2016
Note 10a. Payables, borrowings and provisions
$ ’000
PayablesGoods and services – operating expenditure
Goods and services – capital expenditure
Payments received In advance
Accrued expenses:
– Borrowings
– Other expenditure accruals
Security bonds, deposits and retentions
Total payables
BorrowingsLoans – secured
1
Total borrowings
ProvisionsEmployee benefits:
Annual leave
Sick leave
Long service leave
Other leave
Sub-total – aggregate employee benefits
Total provisions
(i) Liabilities relating to restricted assets
Externally restricted assets
Domestic waste management
Liabilities relating to externally restricted assets
Total liabilities relating to restricted assets
Total liabilities relating to unrestricted assets
TOTAL PAYABLES, BORROWINGS AND PROVISIONS
1. Loans are secured over the general rating income of Council
Disclosures on liability interest rate risk exposures, fair value disclosures and security can be found in Note 15.
200
–
591
104
Non-current Current Non-current
Non-current
5,798
–
17
1,799
Current
5
– 564
–
51 5,952 51
5,798
–
–
65
–
57 34
–
128
128 5,631
167
1,799 17
– 16 19
19
2016
51
1,893 17
TOTAL PAYABLES, BORROWINGS
AND PROVISIONS
24
167
200 167 –
57
3,840
1,264
4,096
34
Notes
2,589
5,752
–
Current
–
104
24
Non-current
2015
128
24
5,952
292
225
265
–
474
–
231
240
1,893
–
Current
2 4
2,627
–
–
–
– 200
2015
–
–
2016
429 558
65
1,214
–
–
–
–
page 37
Financial Statements 2016
Hunter's Hill Council
Notes to the Financial Statements for the year ended 30 June 2016
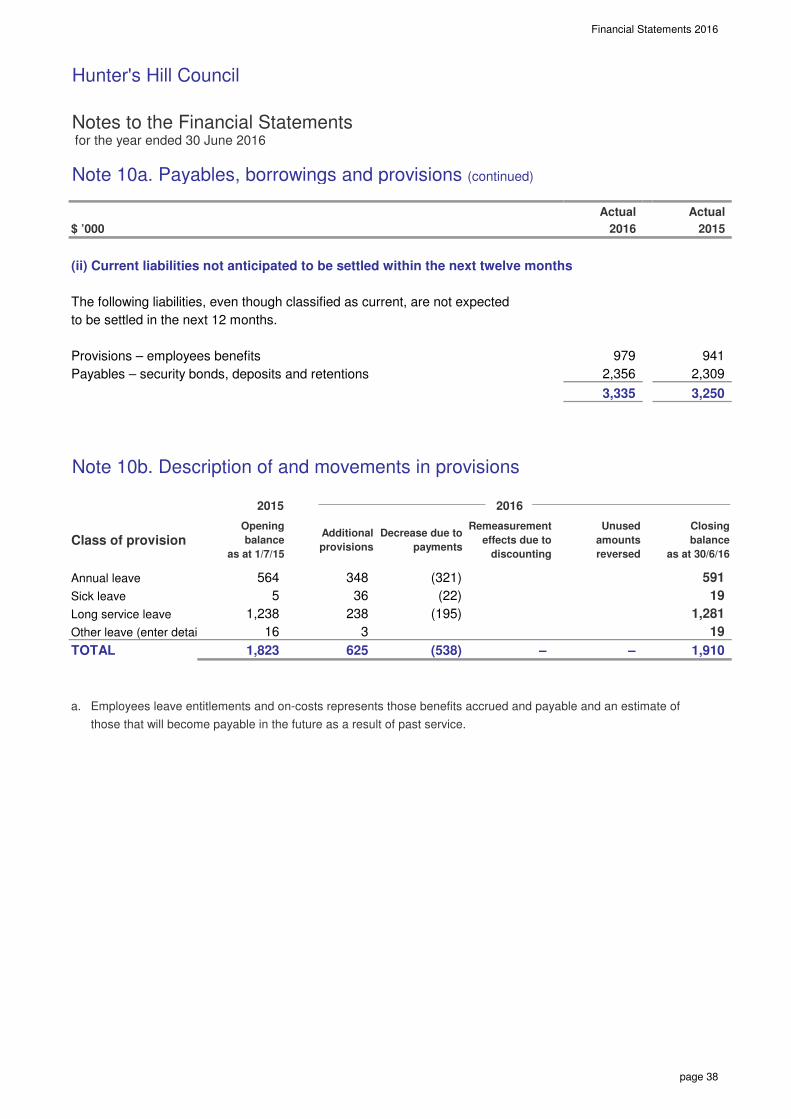
Note 10a. Payables, borrowings and provisions (continued)
$ ’000
(ii) Current liabilities not anticipated to be settled within the next twelve months
The following liabilities, even though classified as current, are not expected
to be settled in the next 12 months.
Provisions – employees benefits
Payables – security bonds, deposits and retentions
Note 10b. Description of and movements in provisions
a. Employees leave entitlements and on-costs represents those benefits accrued and payable and an estimate of
those that will become payable in the future as a result of past service.
Unused
amounts
reversed
2,356
2016
979
Actual
Remeasurement
effects due to
discounting
Decrease due to
payments
941
1,823 625
Sick leave
Opening
balance
as at 1/7/15
Long service leave
564
TOTAL
2016
–
3
2015
Additional
provisions
(22)
16
Annual leave (321)
238
19
591
Actual
2015
36
Other leave (enter details...)
5
348
1,238
Class of provision
(195)
Closing
balance
as at 30/6/16
2,309
3,335 3,250
– 1,910
1,281
(538)
19
page 38

Financial Statements 2016
Hunter's Hill Council
Notes to the Financial Statements for the year ended 30 June 2016
Note 11. Statement of cash flows – additional information
$ ’000
(a) Reconciliation of cash assets
Total cash and cash equivalent assets
Less bank overdraft
Balance as per the Statement of Cash Flows
(b) Reconciliation of net operating result to cash provided from operating activities
Net operating result from Income Statement
Adjust for non-cash items:
Depreciation and amortisation
Net losses/(gains) on disposal of assets
Impairment losses recognition – I,PP&E
Share of net (profits) or losses of associates/joint ventures
+/- Movement in operating assets and liabilities and other cash items:
Decrease/(increase) in receivables
Increase/(decrease) in provision for doubtful debts
Decrease/(increase) in inventories
Decrease/(increase) in other assets
Increase/(decrease) in payables
Increase/(decrease) in accrued interest payable
Increase/(decrease) in other accrued expenses payable
Increase/(decrease) in other liabilities
Increase/(decrease) in employee leave entitlements
Net cash provided from/(used in)
operating activities from the Statement of Cash Flows
–
Actual Actual
10
6a
–
2,019
34
10,333
2,282
335
– –
8
2,053
–
(129)
(38)
43
19
79
–
90
2,653
117
19,220
(2)
10,333 19,220
8
7
62
(16)
87
Notes
3,665
93
(4,000)
(4)
(32)
2015
(21)
2016
page 39

Financial Statements 2016
Hunter's Hill Council
Notes to the Financial Statements for the year ended 30 June 2016
Note 11. Statement of cash flows – additional information (continued)
$ ’000
(c) Non-cash investing and financing activities
Nil
(d) Financing arrangements
(i) Unrestricted access was available at balance date to the
following lines of credit:
Credit cards/purchase cards
Total financing arrangements
Amounts utilised as at balance date:
– Credit cards/purchase cards
Total financing arrangements utilised
1. The bank overdraft facility may be drawn at any time and may be terminated by the bank without notice.
Interest rates on overdrafts are interest rates on loans and other payables are disclosed in Note 15.
(ii) Secured loan liabilities
Loans are secured by a mortgage over future years rate revenue only.
1
2015
10
10
10
1 1
Actual Actual
Notes
10
2016
1
page 40

Financial Statements 2016
Hunter's Hill Council
Notes to the Financial Statements for the year ended 30 June 2016
Note 12. Commitments for expenditure (continued)
$ ’000
(b) Finance lease commitments
Nil
(c) Operating lease commitments (non-cancellable)
a. Commitments under non-cancellable operating leases at the
Reporting date, but not recognised as Liabilities are payable:reporting date, but not recognised as liabilities are payable:
Within the next year
Later than one year and not later than 5 years
Later than 5 years
Total non-cancellable operating lease commitments
b. Non-cancellable operating leases include the following assets:
Council has entered into non-cancellable operating leases for office photocopier equipment contingent rental
payments have been determined & have been publicly notified in Council's Annual Management Plan.
The term of the lease is five years. No lease imposes any additional restrictions on Council in relation to Additional
debt of further leasing.
2016
39
Actual
–
55 39
16 16
2015
–
23
Actual
Notes
page 41

Financial Statements 2016
Hunter's Hill Council
Notes to the Financial Statements for the year ended 30 June 2016
Note 12. Commitments for expenditure (continued)
$ ’000
Conditions relating to operating leases:
– All operating lease agreements are secured only against the leased asset.
– No lease agreements impose any financial restrictions on Council regarding future debt etc.
(d) Investment property commitments
Nil
2015
Actual Actual
2016Notes
page 42

Financial Statements 2016
Hunter's Hill Council
Notes to the Financial Statements for the year ended 30 June 2016
Note 13a(i). Statement of performance measurement – indicators (consolidated)
$ ’000
Local government industry indicators – consolidated
1. Operating performance ratio
Total continuing operating revenue (1)
excluding capital
grants and contributions less operating expenses
Total continuing operating revenue (1)
excluding capital
grants and contributions
2. Own source operating revenue ratio
Total continuing operating revenue (1)
excluding all grants and contributions
Total continuing operating revenue (1)
3. Unrestricted current ratio
Current assets less all external restrictions (2)
Current liabilities less specific purpose liabilities (3, 4)
4. Debt service cover ratio
Operating result (1)
before capital excluding interest
and depreciation/impairment/amortisation
Principal repayments (Statement of Cash Flows)
plus borrowing costs (Income Statement)
5. Rates, annual charges, interest and
extra charges outstanding percentage
Rates, annual and extra charges outstanding
Rates, annual and extra charges collectible
6. Cash expense cover ratio
Current year’s cash and cash equivalents
plus all term deposits
Payments from cash flow of operating and
financing activities
Notes
(1) Excludes fair value adjustments and reversal of revaluation decrements,
net gain/(loss) on sale of assets and the net share of interests in joint ventures and associates.
(2) Refer Notes 6-8 inclusive.
Also excludes any real estate and land for resale not expected to be sold in the next 12 months.
(3) Refer to Note 10(a).
(4) Refer to Note 10(a)(ii) – excludes all payables and provisions not expected to be paid in the next 12 months (incl. ELE).
2.84%
89.96%
2.26%
20.56x
1,173
19,220 9.3 mths
1,480
317
2016
11,158
13,258
-4.18%-2.86%
3.38x
20.51x
85.97%
72
2.54%
x12
2,296
17,391
88.99%
Amounts
14,738
2016
Prior periods
22.92x
9.1 mths
(812) -5.68%
2015 2014
Indicator
3.88x7.57x
16.39
mths
14,293
page 43

Financial Statements 2016
Hunter's Hill Council
Notes to the Financial Statements for the year ended 30 June 2016
Note 14. Investment properties
$ ’000
Council has not classified any land or buildings as ‘investment properties’.
2016
Actual
2015
Actual
Notes
page 44
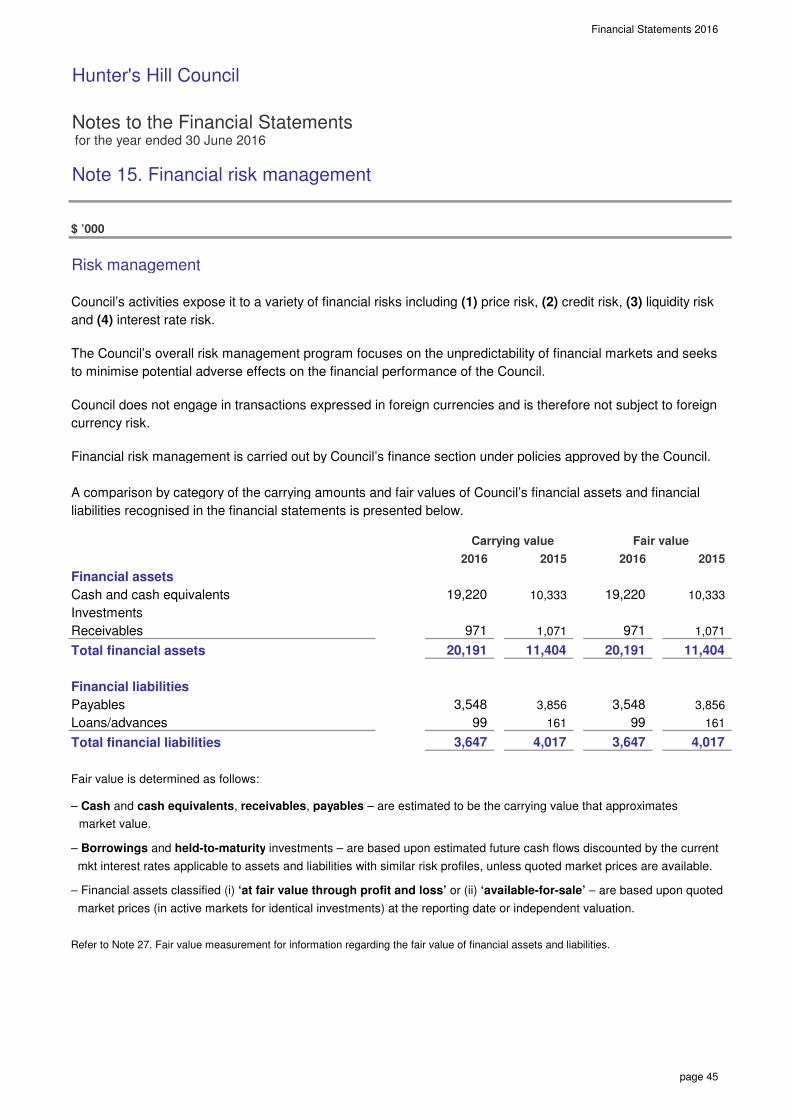
Financial Statements 2016
Hunter's Hill Council
Notes to the Financial Statements for the year ended 30 June 2016
Note 15. Financial risk management
$ ’000
Risk management
Council’s activities expose it to a variety of financial risks including (1) price risk, (2) credit risk, (3) liquidity risk
and (4) interest rate risk.
The Council’s overall risk management program focuses on the unpredictability of financial markets and seeks
to minimise potential adverse effects on the financial performance of the Council.
Council does not engage in transactions expressed in foreign currencies and is therefore not subject to foreign
currency risk.
Financial risk management is carried out by Council’s finance section under policies approved by the Council.
A comparison by category of the carrying amounts and fair values of Council’s financial assets and financial
liabilities recognised in the financial statements is presented below.
Financial assets
Cash and cash equivalents
Investments
Receivables
Total financial assets
Financial liabilities
Payables
Loans/advances
Total financial liabilities
Fair value is determined as follows:
– Cash and cash equivalents, receivables, payables – are estimated to be the carrying value that approximates
market value.
– Borrowings and held-to-maturity investments – are based upon estimated future cash flows discounted by the current
mkt interest rates applicable to assets and liabilities with similar risk profiles, unless quoted market prices are available.
– Financial assets classified (i) ‘at fair value through profit and loss’ or (ii) ‘available-for-sale’ – are based upon quoted
market prices (in active markets for identical investments) at the reporting date or independent valuation.
Refer to Note 27. Fair value measurement for information regarding the fair value of financial assets and liabilities.
2016
4,017
161
3,548
11,404
3,856
3,647 3,647
161
4,017
10,333
3,548
99
20,191 20,191
19,220
Carrying value
2015
19,220 10,333
2016
971 1,071
3,856
99
11,404
Fair value
2015
971 1,071
page 45

Financial Statements 2016
Hunter's Hill Council
Notes to the Financial Statements for the year ended 30 June 2016
Note 15. Financial risk management (continued)
$ ’000
Council’s objective is to maximise its return on cash and investments whilst maintaining an adequate level of
liquidity and preserving capital.
Council has an investment policy which complies with the Local Government Act 1993 and Minister’s investment
order. This policy is regularly reviewed by Council and it’s staff and an investment report is tabled before Council on
a monthly basis setting out the portfolio breakup and its performance.
The risks associated with the investments held are:
– Price risk – the risk that the capital value of Investments may fluctuate due to changes in market prices,
whether there changes are caused by factors specific to individual financial instruments or their issuers
or are caused by factors affecting similar instruments traded in a market.
– Interest rate risk – the risk that movements in interest rates could affect returns and income.
– Credit risk – the risk that the investment counterparty will not complete their obligations particular to a
financial instrument, resulting in a financial loss to Council – be it of a capital or income nature.
Council manages these risks (amongst other measures) by diversifying its portfolio and only purchasing
investments with high credit ratings or capital guarantees.
(a) Market risk – price risk and interest rate risk
The following represents a summary of the sensitivity of Council’s Income Statement and accumulated surplus
(for the reporting period) due to a change in either the price of a financial asset or the interest rates applicable.
It is assumed that the change in interest rates would have been constant throughout the reporting period.
2016
Possible impact of a 10% movement in market values
Possible impact of a 1% movement in interest rates
2015
Possible impact of a 10% movement in market values
Possible impact of a 1% movement in interest rates
Decrease of values/rates
(103)
Profit
192
(103)
(192)
Increase of values/rates
Profit
103
192
Equity
(192)
103
Equity
page 46

Financial Statements 2016
Hunter's Hill Council
Notes to the Financial Statements for the year ended 30 June 2016
Note 15. Financial risk management (continued)
$ ’000
(b) Credit risk
Council’s major receivables comprise (i) rates and annual charges and (ii) user charges and fees.
The major risk associated with these receivables is credit risk – the risk that debts due and payable to Council
may not be repaid in full.
Council manages this risk by monitoring outstanding debt and employing stringent debt recovery procedures.
It also encourages ratepayers to pay their rates by the due date through incentives.
Credit risk on rates and annual charges is minimised by the ability of Council to secure a charge over the land
relating to the debts – that is, the land can be sold to recover the debt. Council is also able to charge interest
on overdue rates and annual charges at higher than market rates which further encourages the payment of debt.
There are no material receivables that have been subjected to a re-negotiation of repayment terms.
A profile of Council’s receivables credit risk at balance date follows:
(i) Ageing of receivables – %
Current (not yet overdue)
Overdue
(ii) Ageing of receivables – value
Rates and annual charges Other receivables
Current Current
< 1 year overdue 0 – 30 days overdue
1 – 2 years overdue 30 – 60 days overdue
2 – 5 years overdue 60 – 90 days overdue
> 5 years overdue > 90 days overdue
(iii) Movement in provision for impairment
of receivables
Balance at the beginning of the year
+ new provisions recognised during the year
Balance at the end of the year
223 101
5
–
–
100%
annual Other
100%
92
receivables
8%
annual Other
92%
receivables
(2)
201520162016
40%
6
265
376
Rates and
charges receivables charges
228
70
Rates and
9%
691
2016
69
75
2015
Rates and
annual Other
–
7
2015
charges charges
12
5
828
–
336
5
60%
20
292
179
21
248
91%
annual Other
Rates and
receivables
100% 100%
79%
21%
page 47
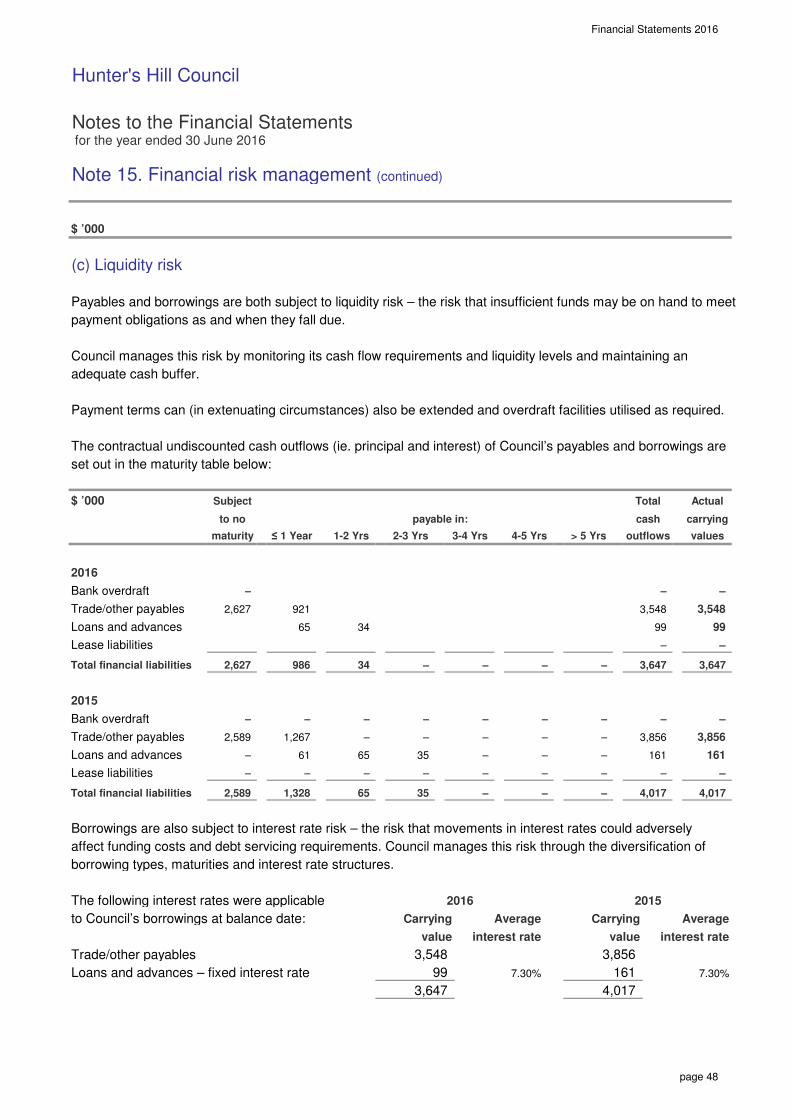
Financial Statements 2016
Hunter's Hill Council
Notes to the Financial Statements for the year ended 30 June 2016
Note 15. Financial risk management (continued)
$ ’000
(c) Liquidity risk
Payables and borrowings are both subject to liquidity risk – the risk that insufficient funds may be on hand to meet
payment obligations as and when they fall due.
Council manages this risk by monitoring its cash flow requirements and liquidity levels and maintaining an
adequate cash buffer.
Payment terms can (in extenuating circumstances) also be extended and overdraft facilities utilised as required.
The contractual undiscounted cash outflows (ie. principal and interest) of Council’s payables and borrowings are
set out in the maturity table below:
$ ’000
Bank overdraft
Trade/other payables
Loans and advances
Lease liabilities
Total financial liabilities
Bank overdraft
Trade/other payables
Loans and advances
Lease liabilities
Total financial liabilities
Borrowings are also subject to interest rate risk – the risk that movements in interest rates could adversely
affect funding costs and debt servicing requirements. Council manages this risk through the diversification of
borrowing types, maturities and interest rate structures.
The following interest rates were applicable
to Council’s borrowings at balance date:
Trade/other payables
Loans and advances – fixed interest rate
1,328
–
interest rate
– –
3,548
2016
–
161
99
–
35
interest rate
3,548
65
–
34
Average
–
–
–
7.30%
value
2015
4,017
99
–
34
–
–
2015
2016
–
–
3,647
–
7.30% 161
– 35
Carrying
–
4,017
3,856
–
value
–
–
3,647 3,647
–
4,017
Average
–
–
–
3,856
–
–
–
–
–
161
3,856
–
Carrying
–
–
–
–
65
to no
3-4 Yrs
Subject
65
1-2 Yrs
–
2,589
– 61
986
1,267
–
maturity 4-5 Yrs
921 2,627
2,627 –
payable in: carrying
outflows
–
2,589
≤ 1 Year values
cash
3,548
99
> 5 Yrs2-3 Yrs
ActualTotal
page 48

Financial Statements 2016
Hunter's Hill Council
Notes to the Financial Statements for the year ended 30 June 2016
Note 16. Material budget variations
$ ’000
Council’s original financial budget for 15/16 was adopted by the Council on 27 July 2015.
While the Income Statement included in this General Purpose Financial Report must disclose the original
budget adopted by Council, the Local Government Act 1993 requires Council to review its financial budget on a
quarterly basis, so that it is able to manage the various variations between actuals versus budget that
invariably occur throughout the year.
This note sets out the details of material variations between Council’s original budget and its actual
results for the year as per the Income Statement – even though such variations may have been adjusted for
during each quarterly budget review.
Note that for variations* of budget to actual :
Material variations represent those variances that amount to 10% or more of the original budgeted figure.
F = Favourable budget variation, U = Unfavourable budget variation
$ ’000
REVENUES
User charges and fees
Almost the entire variance is due to restoration fees being less than budget $253U
Other revenues
Received increase in other revenues from art show $33F, sale of SES vehicle $34, planning proposal $50F
and commission from art show & plan first $26F.
Operating grants and contributions
New funding received for control of weeds to protect Coastal Saltmarsh at Gladesville Reserve $10F,
Restoration of threatened wetlands at Riverglade Reserve $25F and previous grants for Restoring EECs along
Lane Cove River Estuary $39F and Stormwater Improvement along Tarban Creek $15F. Received a total of
4 years allocation for Roads to Recovery funding $193F not included in budget and Child Restraint $2F
Capital grants and contributions
Received previous year grant for Huntleys Point Car Park $70F
Net gains from disposal of assets
Sale of land and building for $9.5M not included in budget.
Joint ventures and associates - net profits
A requirement under Local Government Code of Accounting Practice and Financial Reporting for interest in other
entities Metropool and United Independent Pools $32F
F
32
F
3,972 14186%
–
284
32 F0%
321
28
751
2016
136
(234)
38%
F
U(17%)
445
1,035
17%799 935
124
4,000
39%
F
2016
1,345
---------- Variance* ----------
1,111
Actual
2016
Budget
page 49

Financial Statements 2016
Hunter's Hill Council
Notes to the Financial Statements for the year ended 30 June 2016
Note 16. Material budget variations (continued)
$ ’000
EXPENSES
Materials and contracts
Planning legal costs $279U of which approximately $200 maybe recovered, FFTF merger proposal $183U not
in original budget. Increase in contractors & consultants $225U offset by reduction in labour costs $218F.
Other variances were increases in materials used for Art Exhibition $50U and other events $19U, depot and supplies
expenses $7U, Stormwater maintenance $3U, Parking supplies $29U, Bin replacement and repair $15U
Depreciation and amortisation
Revaluation of assets has led to increase in depreciation which was not avaliable at time of budgeting
Other expenses
The component of the variances were the decrease in water rates $20F, electricity $23F, Street lighting $78F,
Mayor & Councillor expenses $40F, Subscriptions $20F, Printing & Stationary $39F and Advertising $18F
246 10%
1,919 U2,282
U
2,364 F2,118
2016
(18%)
(19%)(363)
---------- Variance* ----------
2016
(813)
Actual
4,523
Budget
2016
5,336
page 50

Financial Statements 2016
Hunter's Hill Council
Notes to the Financial Statements for the year ended 30 June 2016
Note 16. Material budget variations (continued)
$ ’000
Budget variations relating to Council’s Cash Flow Statement include:
Cash flows from investing activities
This favourable variance is entirely due to the sale of land and building
2016
(479.3%)(1,818) 8,714
---------- Variance* ----------Budget Actual
2016
F6,896
2016
page 51
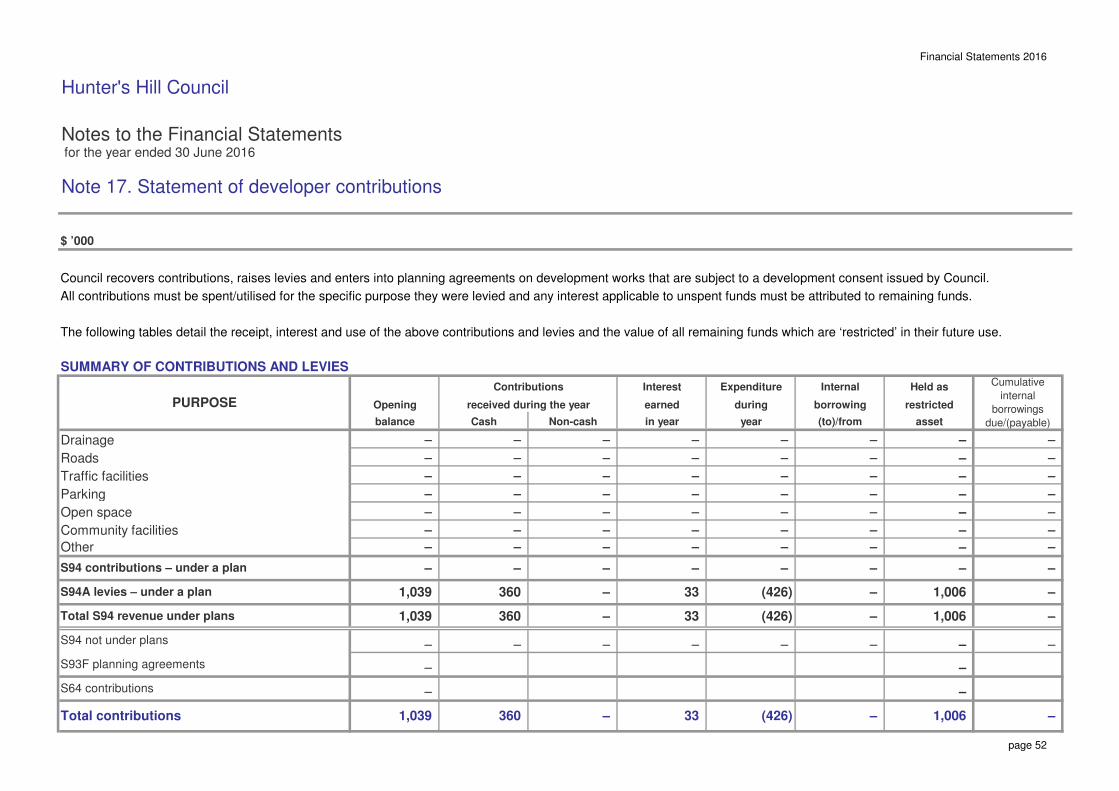
Financial Statements 2016
Hunter's Hill Council
Notes to the Financial Statements for the year ended 30 June 2016
Note 17. Statement of developer contributions
$ ’000
Council recovers contributions, raises levies and enters into planning agreements on development works that are subject to a development consent issued by Council.
All contributions must be spent/utilised for the specific purpose they were levied and any interest applicable to unspent funds must be attributed to remaining funds.
The following tables detail the receipt, interest and use of the above contributions and levies and the value of all remaining funds which are ‘restricted’ in their future use.
SUMMARY OF CONTRIBUTIONS AND LEVIES
Drainage
Roads
Traffic facilities
Parking
Open space
Community facilities
Other
Cumulative
internal
borrowings
due/(payable)
–
–
–
–
–
–
–
–
–
–
–
–
–
360
–
– –
–
–
–
–
–
–
–
–
360 S94A levies – under a plan
Non-cash
–
–
33
– –
Total contributions
S94 contributions – under a plan
PURPOSE Opening
balance
–
–
–
– –
earned
–
Contributions
received during the year
Interest
–
–
year
–
Cash
–
1,039
–
–
– –
–
–
1,039
(426)
–
–
– –
asset
–
–
in year
–
–
–
–
–
–
(426) 33
–
33
–
1,006
–
–
1,006
–
–
–
–
Held as
–
–
–
–
–
(426)
Internal
–
– –
–
Expenditure
borrowing
–
restricted
(to)/from
during
– –
–
S94 not under plans
–
S64 contributions
Total S94 revenue under plans
1,039
–
S93F planning agreements
– 360
–
–
1,006 –
–
–
page 52
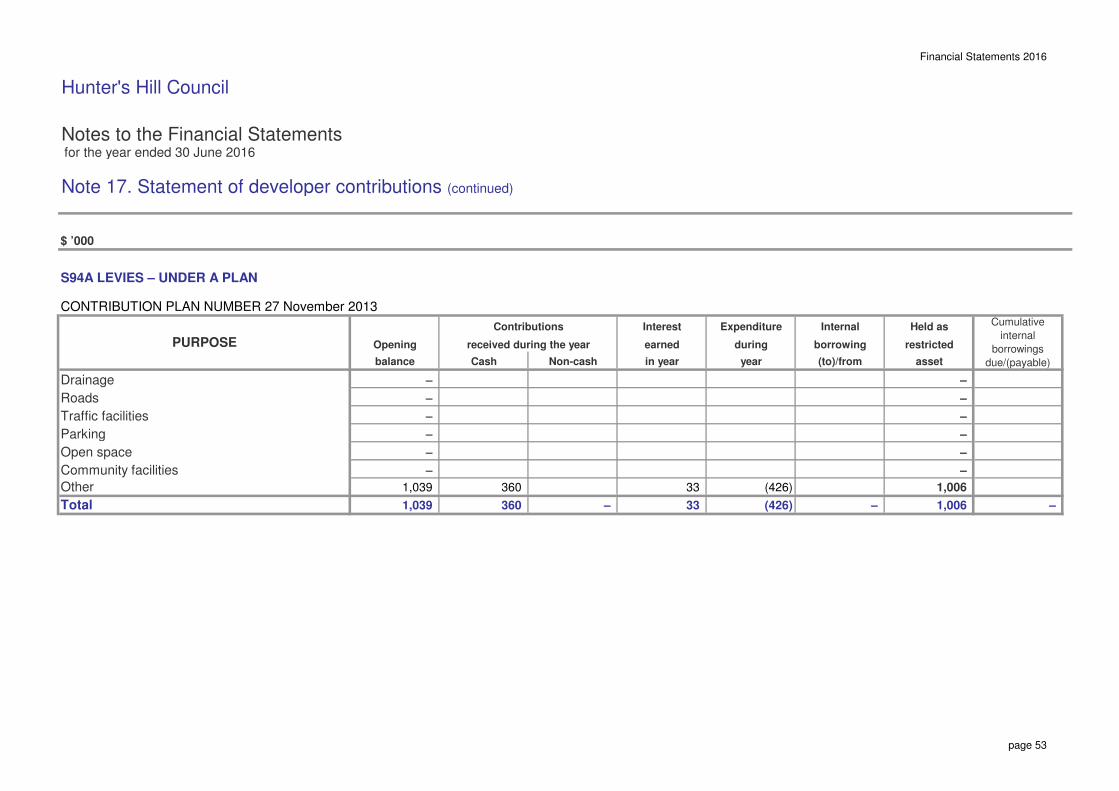
Financial Statements 2016
Hunter's Hill Council
Notes to the Financial Statements for the year ended 30 June 2016
Note 17. Statement of developer contributions (continued)
$ ’000
S94A LEVIES – UNDER A PLAN
CONTRIBUTION PLAN NUMBER 27 November 2013
Drainage
Roads
Traffic facilities
Parking
Open space
Community facilities
Other
–
Cumulative
internal
borrowings
due/(payable)
– – 1,039
33
33
360
–
(426)
(426)
–
1,039
–
yearin year
Contributions
Cash
Interest
–
Total
balance
PURPOSE
Non-cash
–
–
360
Opening received during the year
–
Expenditure
duringearned
Internal
–
restricted
Held as
asset
–
1,006
–
–
–
1,006
(to)/from
borrowing
page 53

Financial Statements 2016
Hunter's Hill Council
Notes to the Financial Statements for the year ended 30 June 2016
Note 18. Contingencies and other assets/liabilities not recognised
$ ’000
The following assets and liabilities do not qualify for (ii) MetroPool
recognition in the Statement of Financial Position, but
their knowledge and disclosure is considered relevant Council is a member of an insurance group named
to the users of Council’s financial report. MetroPool which provides public liability and
professional indemnity coverage for the local
government area.
LIABILITIES NOT RECOGNISED:
(iii) StateCover Limited
1. Guarantees
Council is a member of StateCover Mutual Limited
(i) Defined benefit superannuation and holds a partly paid share in the entity.
contribution plans
StateCover is a company providing workers
Council participates in an employer-sponsored compensation insurance cover to the NSW local
defined benefit superannuation scheme, and makes government industry and specifically Council.
contributions as determined by the superannuation
scheme’s trustees. Council has a contingent liability to contribute further
equity in the event of the erosion of the company’s
Member councils bear responsibility of ensuring there capital base as a result of the company’s past
are sufficient funds available to pay out the required performance and/or claims experience or as a result
benefits as they fall due. of any increased prudential requirements from APRA.
The schemes most recent full actuarial review These future equity contributions would be required
indicated that the net assets of the scheme were to maintain the company’s minimum level of net
not sufficient to meet the accrued benefits of the assets in accordance with its licence requirements.
schemes defined benefit member category with
member councils required to make significantly (iv) Other guarantees
higher contributions in future years.
Council has provided no other guarantees other than
The Local Government Superannuation Scheme those listed above.
however is unable to provide Council with an accurate
estimate of its share of the net deficit and accordingly 2. Other liabilities
Council has not recorded any net liability from it’s
defined benefit scheme obligations in accordance (i) Third party claims
with AASB 119.
The Council is involved from time to time in various
Future contributions made to the defined benefit claims incidental to the ordinary course of business
scheme to rectify the net deficit position will be including claims for damages relating to its services.
recognised as an expense when they become
payable – similar to the accounting for defined Council believes that it is appropriately covered
contributions plans. for all claims through its insurance coverage and
does not expect any material liabilities to eventuate.
page 54

Financial Statements 2016
Hunter's Hill Council
Notes to the Financial Statements for the year ended 30 June 2016
Note 18. Contingencies and other assets/liabilities not recognised (continued)
$ ’000
LIABILITIES NOT RECOGNISED (continued): ASSETS NOT RECOGNISED:
(ii) S94 plans (i) Land under roads
Council levies section 94/94A contributions upon As permitted under AASB 1051, Council has elected
various development across the Council area through not to bring to account land under roads that it
the required contributions plans. owned or controlled up to and including 30/6/08.
As part of these plans, Council has received funds (ii) Infringement notices/fines
for which it will be required to expend the monies in
accordance with those plans. Fines and penalty income, the result of Council
issuing infringement notices is followed up and
As well, these plans indicate proposed future collected by the Infringement Processing Bureau.
expenditure to be undertaken by Council, which will
be funded by making levies and receipting funds in Council’s revenue recognition policy for such
future years or where a shortfall exists by the use of income is to account for it as revenue on receipt.
Council’s general funds.
Accordingly, at year end, there is a potential asset
These future expenses do not yet qualify as liabilities due to Council representing issued but unpaid
as of the reporting date, but represent Council’s infringement notices.
intention to spend funds in the manner and timing
set out in those plans. Due to the limited information available on the status,
value and duration of outstanding notices, Council is
(iii) Potential land acquisitions due to planning unable to determine the value of outstanding income.
restrictions imposed by Council
Council has classified a number of privately owned
land parcels as local open space or bushland.
As a result, where notified in writing by the various
owners, Council will be required to purchase these
land parcels.
At reporting date, reliable estimates as to the value
of any potential liability (and subsequent land asset)
from such potential acquisitions has not been
possible.
page 55

Financial Statements 2016
Hunter's Hill Council
Notes to the Financial Statements for the year ended 30 June 2016
Note 19. Interests in other entities
$ ’000
Council’s objectives can and in some cases are best met through the use of separate entities and operations.
These operations and entities range from 100% ownership and control through to lower levels of ownership
and control via co-operative arrangements with other councils, bodies and other outside organisations.
The accounting and reporting for these various entities, operations and arrangements varies in accordance
with accounting standards, depending on the level of council’s (i) interest and (ii) control and the type (form) of
entity/operation, as follows;
Controlled entities (subsidiaries) Note 19(a)
Operational arrangements where Council’s control (but not necessarily interest) exceeds 50%.
Joint ventures and associates Note 19(b)
Joint ventures are operational arrangements where the parties that have joint control have
rights to the net assets of the arrangement.
Associates are separate entities where Council has significant influence over the operations
(but neither controls nor jointly controls them).
Joint operations Note 19(c)
Operational arrangements where the parties that have joint control have rights to specific
assets and obligations for specific liabilities relating to the arrangement rather than a right
to the net assets of the arrangement.
Unconsolidated structured entities Note 19(d)
Unconsolidated structured entities represent “special vehicles” that Council has an interest
in but which are not controlled by Council and therefore not consolidated as a subsidiary,
joint arrangement or associate. Attributes of structured entities include restricted activities,
a narrow and well-defined objective and insufficient equity to finance its activities without
financial support.
Subsidiaries, joint arrangements and associates not recognised Note 19(e)
Accounting recognition:
(i) Subsidiaries disclosed under Note 19(a) and joint operations disclosed at Note 19(c) are accounted for on a
‘line by line’ consolidation basis within the Income Statement and Statement of Financial Position.
(ii) Joint ventures and associates as per Note 19(b) are accounted for using the equity accounting method
and are disclosed as a 1 line entry in both the Income Statement and Statement of Financial Position.
Joint ventures
AssociatesTotal
465 16
–
Council’s share of net assets
– 433
Actual Actual
16
2015
433
Actual
32
ActualCouncil’s share of net income
465
2015 2016
32
2016
– –
page 56

Financial Statements 2016
Hunter's Hill Council
Notes to the Financial Statements for the year ended 30 June 2016
Note 19. Interests in other entities (continued)
$ ’000
(e) Summarised financial information for individually immaterial joint ventures and associates
In addition to the joint ventures and associates disclosed individually above, Council has interests in a number of
individually immaterial joint ventures and associates that have still been accounted for using the equity method.
(i) Individually immaterial joint ventures
Aggregate carrying amount of individually immaterial joint ventures
Aggregate amounts of Council’s share of individually immaterial:
Profit/(loss) from continuing operations
Profit/(loss) from discontinued operations
Other comprehensive income
Total comprehensive income – individually immaterial joint ventures
16
–
–
32 16
465 433
2016 2015
32
page 57
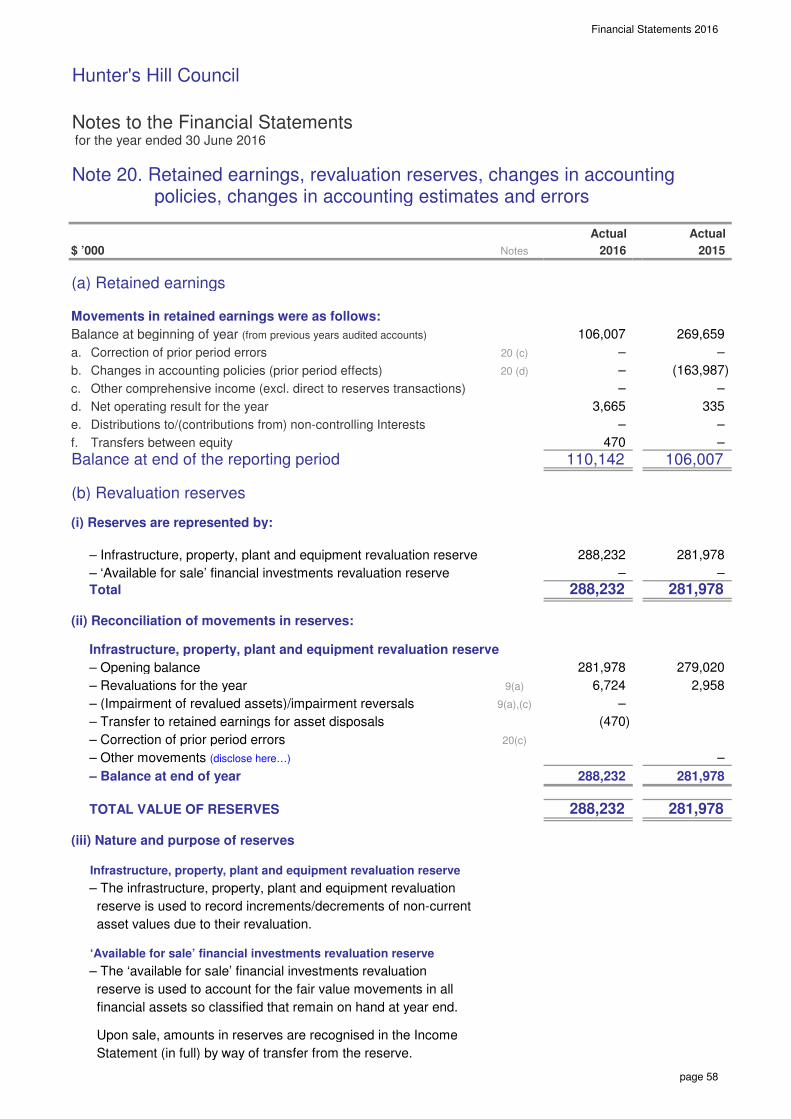
Financial Statements 2016
Hunter's Hill Council
Notes to the Financial Statements for the year ended 30 June 2016
Note 20. Retained earnings, revaluation reserves, changes in accounting policies, changes in accounting estimates and errors
$ ’000
(a) Retained earnings
Movements in retained earnings were as follows:
Balance at beginning of year (from previous years audited accounts)
a. Correction of prior period errors
b. Changes in accounting policies (prior period effects)
c. Other comprehensive income (excl. direct to reserves transactions)
d. Net operating result for the year
e. Distributions to/(contributions from) non-controlling Interests
f. Transfers between equity
Balance at end of the reporting period
(b) Revaluation reserves
(i) Reserves are represented by:
– Infrastructure, property, plant and equipment revaluation reserve
– ‘Available for sale’ financial investments revaluation reserve
Total
(ii) Reconciliation of movements in reserves:
Infrastructure, property, plant and equipment revaluation reserve
– Opening balance
– Revaluations for the year
– (Impairment of revalued assets)/impairment reversals
– Transfer to retained earnings for asset disposals
– Correction of prior period errors
– Other movements (disclose here…)
– Balance at end of year
TOTAL VALUE OF RESERVES
(iii) Nature and purpose of reserves
Infrastructure, property, plant and equipment revaluation reserve
– The infrastructure, property, plant and equipment revaluation
reserve is used to record increments/decrements of non-current
asset values due to their revaluation.
‘Available for sale’ financial investments revaluation reserve
– The ‘available for sale’ financial investments revaluation
reserve is used to account for the fair value movements in all
financial assets so classified that remain on hand at year end.
Upon sale, amounts in reserves are recognised in the Income
Statement (in full) by way of transfer from the reserve.
288,232 281,978
281,978
281,978
–
288,232
106,007
–
–
–
–
335
20 (d)
2015
(470)
279,020
6,724
110,142
9(a) 2,958
Actual
–
269,659
20(c)
470
–
3,665
9(a),(c)
Notes
–
2016
20 (c)
(163,987)
–
–
281,978
–
288,232
281,978
106,007
–
Actual
288,232
page 58
Financial Statements 2016
Hunter's Hill Council
Notes to the Financial Statements for the year ended 30 June 2016
Note 20. Retained earnings, revaluation reserves, changes in accounting policies, changes in accounting estimates and errors (continued)
$ ’000
(c) Correction of error/s relating to a previous reporting period
Council made no correction of errors during the current reporting period.
2016Notes
Actual Actual
2015
page 59

Financial Statements 2016
Hunter's Hill Council
Notes to the Financial Statements for the year ended 30 June 2016
Note 20. Retained earnings, revaluation reserves, changes in accounting policies, changes in accounting estimates and errors (continued)
$ ’000
(d) Voluntary changes in accounting policiesProvide details of the accounting policy change are to be listed here:
– change in Community Land valuation methodology from a market value
approach to the use of values provided by the Valuer General per the Local
Government Code of Accounting Practice and Financial Reporting
In accordance with AASB 108 – Accounting Policies, Changes in
Accounting Estimates and Errors, the above changes in
accounting policy have been recognised retrospectively.
These amounted to the following equity adjustments:
– Adjustments to opening equity – 1/7/14
(relating to adjustments for the 30/6/14 reporting year end and prior periods)
– Adjustments to closing equity – 30/6/15
(relating to adjustments for the 30/6/15 year end)
Total prior period adjustments – accounting policy changes
Notes
Actual Actual
–
(366,009)
(366,009)
20152016
(366,009)
page 60

Financial Statements 2016
Hunter's Hill Council
Notes to the Financial Statements for the year ended 30 June 2016
Note 21. Financial result and financial position by fund
$ ’000
Council utilises only a general fund for its operations.
page 61

Financial Statements 2016
Hunter's Hill Council
Notes to the Financial Statements for the year ended 30 June 2016
Note 22. ‘Held for sale’ non-current assets and disposal groups
$ ’000
Council did not classify any non-current assets or disposal groups as ‘held for sale’.
page 62

Financial Statements 2016
Hunter's Hill Council
Notes to the Financial Statements for the year ended 30 June 2016
Note 23. Events occurring after the reporting date
$ ’000
Events that occur between the end of the reporting period (30 June 2016) and the date when the financial
statements are ‘authorised for issue’ have been taken into account in preparing these statements.
Council has adopted the date of receipt of the Auditors’ Report as the applicable ‘authorised for issue’ date
relating to these General Purpose Financial Statements.
Accordingly, the ‘authorised for issue’ date is 06/10/16.
Events that occur after the reporting period represent one of two types:
(i) Events that provide evidence of conditions that existed at the reporting period
These financial statements (and the figures therein) incorporate all ‘adjusting events’ that provided evidence of
conditions that existed at 30 June 2016.
(ii) Events that provide evidence of conditions that arose after the reporting period
These financial statements (and figures therein) do not incorporate any ‘non-adjusting events’ that have occurred
after 30 June 2016 and which are only indicative of conditions that arose after 30 June 2016.
Council is aware of the following ‘non-adjusting events’ that merit disclosure:
Regarding Hunters Hill Council's appeal against the State Government's merger proposal, a judgement was handed
down in the Land & Environment Court against Council on Tuesday 20 September 2016. Council then held an
Extraordinary Meeting No. 4409 on Friday 23 September 2016 to consider this matter. Council resolved to Lodgea Notice of Intention to Appeal against this decision. This was done on 27 September 2016.
page 63

Financial Statements 2016
Hunter's Hill Council
Notes to the Financial Statements for the year ended 30 June 2016
Note 24. Discontinued operations
$ ’000
Council has not classified any of its operations as ‘discontinued’.
page 64

Financial Statements 2016
Notes to the Financial Statements for the year ended 30 June 2016
Note 25. Intangible assets
$ ’000
Intangible assets represent identifiable non-monetary assets without physical substance.
Actual Actual
2016 2015
page 65

Financial Statements 2016
Hunter's Hill Council
Notes to the Financial Statements for the year ended 30 June 2016
Note 26. Reinstatement, rehabilitation and restoration liabilities
$ ’000
Council has no outstanding obligations to make, restore, rehabilitate or reinstate any of its assets/operations.
page 66

Financial Statements 2016
Hunter's Hill Council
Notes to the Financial Statements for the year ended 30 June 2016
Note 27. Fair value measurement
$ ’000
The Council measures the following asset and liability classes at fair value on a recurring basis:
– Infrastructure, property, plant and equipment
The fair value of assets and liabilities must be estimated in accordance with various accounting standards foreither recognition and measurement requirements or for disclosure purposes.
AASB 13 Fair Value Measurement requires all assets and liabilities measured at fair value to be assigned to a‘level’ in the fair value hierarchy as follows:
Level 1: Unadjusted quoted prices in active markets for identical assets or liabilities that the entity can access at the measurement date.
Level 2: Inputs other than quoted prices included within level 1 that are observable for the asset or liability, either directly or indirectly.
Level 3: Inputs for the asset or liability that are not based on observable market data (unobservable inputs).
(1) The following table presents all assets and liabilities that have been measured and recognised at fair values:
2016
Recurring fair value measurements
Infrastructure, property, plant and equipmentPlant & EquipmentOffice EquipmentFurniture & FittingsOperation LandCommunity LandBuildings - Non SpecialisedBuildings - SpecialisedOther StructuresRoadsFootpathsKerb & GutteringStormwater DrainageOther InfrastructureTotal infrastructure, property, plant and equipment
500 500
100
active mkts
unobservable
Significant
Level 3 Total
Quoted Significant
Fair value measurement hierarchyLevel 1 Level 2
inputs
100
6,265
inputs
prices in observable
6,265
128 128
18,849 18,849
61,894 61,894
5,323 5,323
11,569 11,569
7,505 7,505
13,662 13,662
1,160
7,966 7,966
1,160 – – 181,233 181,233
46,312 46,312
page 67

Financial Statements 2016
2015
Recurring fair value measurements
Infrastructure, property, plant and equipmentPlant & EquipmentOffice EquipmentFurniture & FittingsOperation LandCommunity LandBuildings - Non SpecialisedBuildings - SpecialisedOther StructuresRoadsFootpathsKerb & GutteringStormwater DrainageOther InfrastructureTotal infrastructure, property, plant and equipment
– – 1,191 1,191
– 179,807
– – 46,051 46,051
– – 7,600 7,600
– – 13,421 13,421
– – 7,903 7,903
– – 55,204 55,204
– – 5,384 5,384
– – 12,054 12,054
– – 6,227 6,227
– – 522 522
– – 135 135
– – 122 122
– – 23,993 23,993
inputs
unobservable
inputs
179,807
Fair value measurement hierarchyLevel 3 Total
–
Quoted
active mkts
Level 1 Level 2
Significant Significant
prices in observable
page 68

Financial Statements 2016
Hunter's Hill Council
Notes to the Financial Statements for the year ended 30 June 2016
Note 27. Fair value measurement (continued)
$ ’000
(2) Transfers between level 1 and level 2 fair value hierarchies
During the year, there were no transfers between level 1 and level 2 fair value hierarchies for recurring fairvalue measurements.
page 69

Financial Statements 2016_
Hunter's Hill Council
Notes to the Financial Statements
for the year ended 30 June 2016
Note 27. Fair value measurement (continued)
page 70
(3) Valuation techniques used to derive level 2 and level 3 fair values Where Council is unable to derive fair valuations using quoted market prices of identical assets (i.e. level 1 inputs), Council instead utilises a spread of both observable inputs (level 2 inputs) and unobservable inputs (level 3 inputs). The fair valuation techniques Council has employed while utilising level 2 and level 3 inputs are as follows: Land This asset class comprises all of Councils land classified as Operational Land and Community Land under the NSW Local Government Act 1993. The key unobservable inputs to the valuation are the price per square metre and market price. The Operational Land and Community Land valuation were undertaken at 1 July 2014 and were performed by APV Valuers and Asset Management and Valuer General. Where there is directly comparable market evidence, Level 2 valuation inputs were used to value land held in freehold title as well as land used for special purposes which is restricted in use under current zoning rules. Sales prices of comparable land sites in close proximity are adjusted for differences in key attributes such as property size. Land assets that have no comparable observable market evidence were subsequently valued at the Level 3 valuation input hierarchy using the professional judgement of a Registered Valuer adjusted for price per square metre of sales sites not in close proximity which provided only a low level of comparability. Plant, Office Equipment, Furniture & Fittings Council’s Plant, Office Equipment and Furniture & Fittings include:
• Plant: Truck, tractors, mowers
• Fleet: Cars, Utes
• Office Equipment: Computer hardware/software, document management
• Furniture & Fittings: Desks, chairs, window coverings Plant, Office Equipment, Furniture & Fittings are valued at cost but are disclosed at fair value in the notes. Level 3 unobservable inputs include consumption pattern, useful life, residual value and asset condition. Buildings and Other Structures Buildings were valued by APV Valuers and Asset Management in July 2015. Residential properties were valued on Level 2 valuation inputs using comparable properties after adjusting for differences in attributes such as property size. Specialised buildings were valued using the cost approach by estimating the replacement cost for each building by componentising the buildings and subsequent useful lives. Level 3 valuation inputs required Professional Judgement to estimate unobservable inputs such as residual value, useful life, consumption patterns, asset condition and remaining service potential. Road Network Infrastructure This asset class comprises of Road, Kerb and Channel, Structure, Car Park, Bridge, Footpath, Traffic Signs, Stormwater Drain, Stormwater Pit and were valued using Level 3 valuation inputs using the cost approach.

Financial Statements 2016_
Hunter's Hill Council
Notes to the Financial Statements
for the year ended 30 June 2016
Note 27. Fair value measurement (continued)
page 71
This approach estimates the replacement cost for each asset into component level with differing useful lives. While the unit rates based on square metres or similar capacity could be supported from market evidence (Level 2), other inputs such as estimated residual life, useful life, consumption patterns and asset condition required professional judgement and impacted significantly on the determination of fair value. These assets were valued using Level 3 valuation inputs.

Financial Statements 2016
Hunter's Hill Council
Notes to the Financial Statements for the year ended 30 June 2016
Note 27. Fair value measurement (continued)
$ ’000
(4). Fair value measurements using significant unobservable inputs (level 3)
a. The following tables present the changes in level 3 fair value asset classes.
Opening balance – 1/7/14
Purchases (GBV)Disposals (WDV)Depreciation and impairment
Closing balance – 30/6/15
Purchases (GBV)Disposals (WDV)Depreciation and impairmentFV gains – other comprehensive income
Closing balance – 30/6/16 97,635
–
– – (113)
(5,563)
– – 55
(212) (325)
–
5,384
Buildings
Land Land Specialised Specialised
– 283 283
Operational Community Non- Buildings
11,569
– 6,690
– –
Total
23,993 55,204 5,497 12,002 96,696
– – (19) (19)
– –
– (116) (303)
12,054
30 85
(5,144)
23,993 96,635
(212) (212)
– 6,690
55,204
18,849 61,894 5,323
page 72

Financial Statements 2016
Hunter's Hill Council
Notes to the Financial Statements for the year ended 30 June 2016
Note 27. Fair value measurement (continued)
$ ’000
(4). Fair value measurements using significant unobservable inputs (level 3) (continued)
a. The following tables present the changes in level 3 fair value asset classes. (continued)
Opening balance – 1/7/14
Purchases (GBV)Disposals (WDV)Depreciation and impairmentFV gains – other comprehensive income
Closing balance – 30/6/15
Purchases (GBV)Disposals (WDV)Depreciation and impairmentFV gains – other comprehensive income
Closing balance – 30/6/16
2,795 (1,031) 788 (33)
–
(121)
1,963
12,629
Guttering
8,408
FootpathsRoadsStructures
Other Kerb &
69,999 5,725 43,237
(184) (775)
Total
34
687
6,227 46,051
219 1,209 173 362
46,312
(1) – – – (1)
–
6,265
(215) (948) (1,552) (268) – – – 34
– –
73,299
37 2,056
(315)
7,505 13,662 73,744
7,600 13,421
–
2,552
794
(1,307)
538
–
page 73
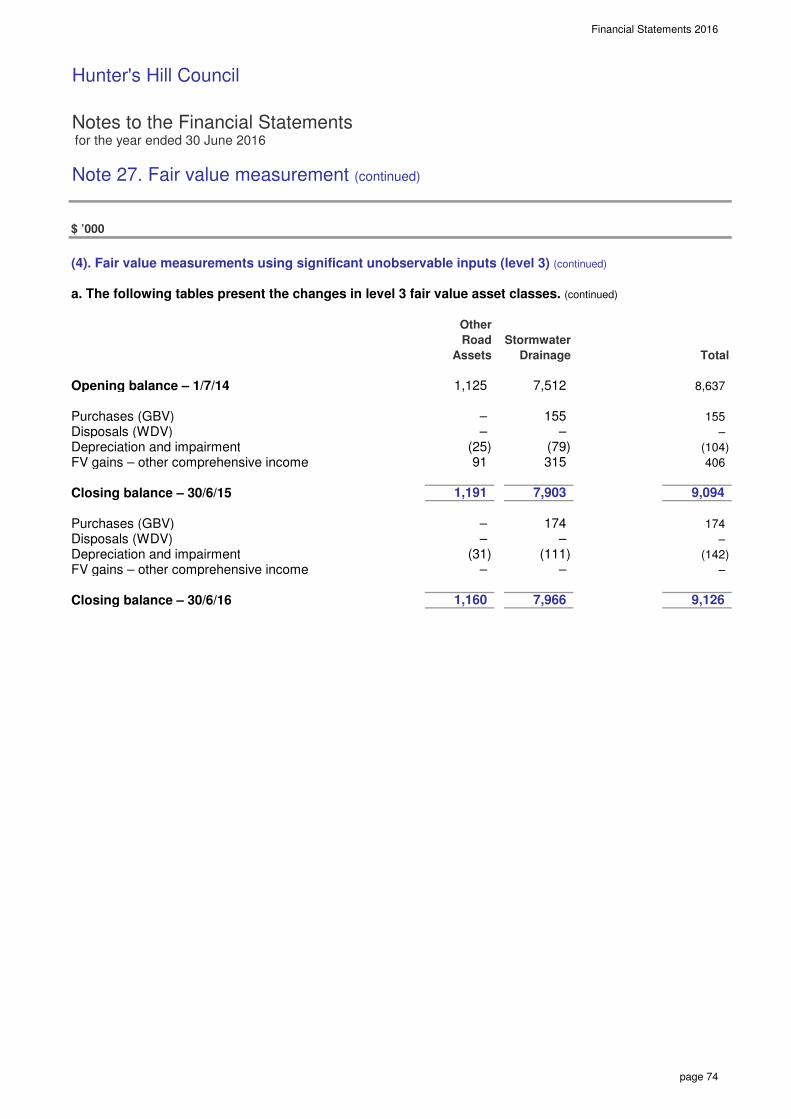
Financial Statements 2016
Hunter's Hill Council
Notes to the Financial Statements for the year ended 30 June 2016
Note 27. Fair value measurement (continued)
$ ’000
(4). Fair value measurements using significant unobservable inputs (level 3) (continued)
a. The following tables present the changes in level 3 fair value asset classes. (continued)
Opening balance – 1/7/14
Purchases (GBV)Disposals (WDV)Depreciation and impairmentFV gains – other comprehensive income
Closing balance – 30/6/15
Purchases (GBV)Disposals (WDV)Depreciation and impairmentFV gains – other comprehensive income
Closing balance – 30/6/16
(79) (104) (25)
Road Stormwater
– –
–
– –
–
Drainage
174
Assets
1,125 7,512
91 315 406
9,094
Total
–
8,637
Other
9,126
–
7,966
– 174
1,191 7,903
(142)
– (31) (111)
1,160
–
155 155
page 74
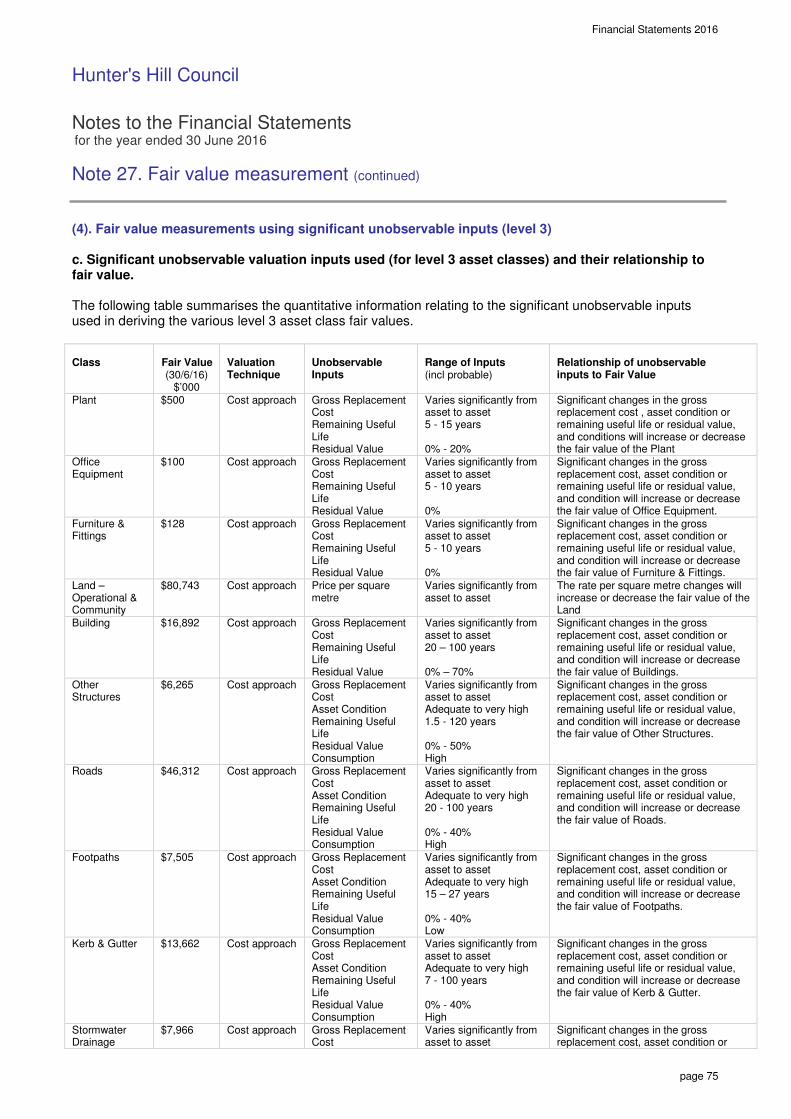
Financial Statements 2016_
Hunter's Hill Council
Notes to the Financial Statements for the year ended 30 June 2016
Note 27. Fair value measurement (continued)
page 75
(4). Fair value measurements using significant unobservable inputs (level 3) c. Significant unobservable valuation inputs used (for level 3 asset classes) and their relationship to fair value. The following table summarises the quantitative information relating to the significant unobservable inputs used in deriving the various level 3 asset class fair values. Class
Fair Value (30/6/16)
$’000
Valuation Technique
Unobservable Inputs
Range of Inputs (incl probable)
Relationship of unobservable inputs to Fair Value
Plant $500 Cost approach Gross Replacement Cost Remaining Useful Life Residual Value
Varies significantly from asset to asset 5 - 15 years 0% - 20%
Significant changes in the gross replacement cost , asset condition or remaining useful life or residual value, and conditions will increase or decrease the fair value of the Plant
Office Equipment
$100 Cost approach Gross Replacement Cost Remaining Useful Life Residual Value
Varies significantly from asset to asset 5 - 10 years 0%
Significant changes in the gross replacement cost, asset condition or remaining useful life or residual value, and condition will increase or decrease the fair value of Office Equipment.
Furniture & Fittings
$128 Cost approach Gross Replacement Cost Remaining Useful Life Residual Value
Varies significantly from asset to asset 5 - 10 years 0%
Significant changes in the gross replacement cost, asset condition or remaining useful life or residual value, and condition will increase or decrease the fair value of Furniture & Fittings.
Land – Operational & Community
$80,743 Cost approach Price per square metre
Varies significantly from asset to asset
The rate per square metre changes will increase or decrease the fair value of the Land
Building $16,892 Cost approach Gross Replacement Cost Remaining Useful Life Residual Value
Varies significantly from asset to asset 20 – 100 years 0% – 70%
Significant changes in the gross replacement cost, asset condition or remaining useful life or residual value, and condition will increase or decrease the fair value of Buildings.
Other Structures
$6,265 Cost approach Gross Replacement Cost Asset Condition Remaining Useful Life Residual Value Consumption
Varies significantly from asset to asset Adequate to very high 1.5 - 120 years 0% - 50% High
Significant changes in the gross replacement cost, asset condition or remaining useful life or residual value, and condition will increase or decrease the fair value of Other Structures.
Roads $46,312 Cost approach Gross Replacement Cost Asset Condition Remaining Useful Life Residual Value Consumption
Varies significantly from asset to asset Adequate to very high 20 - 100 years 0% - 40% High
Significant changes in the gross replacement cost, asset condition or remaining useful life or residual value, and condition will increase or decrease the fair value of Roads.
Footpaths $7,505 Cost approach Gross Replacement Cost Asset Condition Remaining Useful Life Residual Value Consumption
Varies significantly from asset to asset Adequate to very high 15 – 27 years 0% - 40% Low
Significant changes in the gross replacement cost, asset condition or remaining useful life or residual value, and condition will increase or decrease the fair value of Footpaths.
Kerb & Gutter $13,662 Cost approach Gross Replacement Cost Asset Condition Remaining Useful Life Residual Value Consumption
Varies significantly from asset to asset Adequate to very high 7 - 100 years 0% - 40% High
Significant changes in the gross replacement cost, asset condition or remaining useful life or residual value, and condition will increase or decrease the fair value of Kerb & Gutter.
Stormwater Drainage
$7,966 Cost approach Gross Replacement Cost
Varies significantly from asset to asset
Significant changes in the gross replacement cost, asset condition or

Financial Statements 2016_
Hunter's Hill Council
Notes to the Financial Statements for the year ended 30 June 2016
Note 27. Fair value measurement (continued)
page 76
Asset Condition Remaining Useful Life Residual Value Consumption
Adequate to high 40.5 years 0% - 40% Moderate
remaining useful life or residual value, and condition will increase or decrease the fair value of Stormwater Drain.
Other Infrastructure
$1,160 Cost approach Gross Replacement Cost Asset Condition Remaining Useful Life Residual Value Consumption
Varies significantly from asset to asset Adequate to very high 26 - 70 years 0% - 40% High
Significant changes in the gross replacement cost, asset condition or remaining useful life or residual value, and condition will increase or decrease the fair value of Other Infrastructure.
d. The valuation process for level 3 fair value measurements The council engaged external, independent and qualified valuers to determine the fair value of the infrastructure assets on a regular basis. An annual assessment is undertaken to determine whether the carrying amount of the assets is materially different from the fair value. If any variation is considered material a revaluation is undertaken either by comprehensive revaluation or by applying an interim revaluation using appropriate indices. Changes in level 3 fair values are analysed at the end of each reporting period and discussed between the valuation team and Council. As at 1 July 2015 a desktop revaluation was undertaken for land, building and other structures subject to revaluation by APV Valuers and Asset Management. The main level 3 inputs used are derived and evaluated as follows – Asset Condition Due a large road network infrastructure, it is not physically possible to inspect every asset for the purposes of completing a valuation. Therefore, reliance is placed on the accuracy of data held in the asset management system and its associated internal controls. To provide assurance over the accuracy of this information, the valuation relies upon a sampling approach of 14% of the data held in the asset management system by the valuer. Cost for land restricted in use (non-saleable) estimates the cost to replace existing land if Council had to acquire it on the open market in competition with other market participants. Due to the restricted nature and unique characteristics of this land there was insufficient market evidence of directly comparable sales. Reference was made to sales of land with a limited level of comparability at distant locations and adjusted by the valuer using professional judgement to take account of the differing characteristics. Relationship between asset consumption rating scale and the level of consumed service potential Under the cost approach the estimated cost to replace the asset is calculated and then adjusted to take account of an accumulated depreciation. An asset consumption rating scale is determined for each asset type based on the inter-relationship between a range of factors such as asset condition, obsolescence, residual value, useful life and consumption patterns. The consumption rating scales are based on past experience of the valuers, industry guides and Council engineers and finance staff. (5). Highest and best use All of Council’s non-financial assets are considered to being utilised for their highest and best use.

HUNTER’S HILL COUNCIL
GENERAL PURPOSE FINANCIAL STATEMENTS
INDEPENDENT AUDITORS' REPORT
REPORT ON THE FINANCIAL STATEMENTS We have audited the accompanying general purpose financial statements of Hunter’s Hill Council, which comprises the Statement of Financial Position as at 30 June 2016, Income Statement, Statement of Comprehensive Income, Statement of Changes in Equity and Statement of Cash Flows for the year ended on that date, a summary of significant accounting policies and other explanatory notes and the Statement by Councillors and Management. The financial statements include the consolidated financial statements of the economic entity and the entities it controlled at year end or from time to time during the year. Responsibility of Council for the Financial Statements The Council is responsible for the preparation and fair presentation of the financial statements in accordance with Australian Accounting Standards (including the Australian Accounting Interpretations) and the Local Government Act 1993. This responsibility includes the maintenance of adequate accounting records and internal controls designed to prevent and detect fraud and error; designing, implementing and maintaining internal controls relevant to the preparation and fair presentation of the financial statements that are free from material misstatement, whether due to fraud or error; selecting and applying appropriate accounting policies; and making accounting estimates that are reasonable in the circumstances. Auditors’ Responsibility Our responsibility is to express an opinion on the financial statements based on our audit. We conducted our audit in accordance with Australian Auditing Standards. These Auditing Standards require that we comply with relevant ethical requirements relating to audit engagements and plan and perform the audit to obtain reasonable assurance whether the financial statements are free from material misstatement. Our audit responsibility does not extend to the original budget information disclosed in the Income Statement, Statement of Cash Flows, and Note 2(a) or the budget variation explanations disclosed in Note 16. Accordingly, no opinion is expressed on these matters. An audit involves performing procedures to obtain audit evidence about the amounts and disclosures in the financial statements. The procedures selected depend on the auditor's judgement, including the assessment of the risks of material misstatement of the financial statements, whether due to fraud or error. In making those risk assessments, the auditor considers internal control relevant to the entity's preparation and fair presentation of the financial statements in order to design audit procedures that are appropriate in the circumstances, but not for the purpose of expressing an opinion on the effectiveness of the Council's internal control. An audit also includes evaluating the appropriateness of accounting policies used and the reasonableness of accounting estimates made by the Council, as well as evaluating the overall presentation of the financial statements. Our audit did not involve an analysis of the prudence of business decisions made by Council or management.
2 of 2
We believe that the audit evidence we have obtained is sufficient and appropriate to provide a basis for our audit opinion. Independence In conducting our audit, we followed applicable independence requirements of Australian professional ethical pronouncements. Auditor’s Opinion In our opinion, (a) the Council's accounting records have been kept in accordance with the requirements of the Local Government
Act 1993, Chapter 13 part 3 Division 2; and (b) the financial statements:
(i) have been presented in accordance with the requirements of this Division; (ii) are consistent with the Council's accounting records; (iii) present fairly the Council's financial position, the results of its operations and its cash flows; and (iv) are in accordance with applicable Accounting Standards and other mandatory professional reporting
requirements in Australia.
(c) all information relevant to the conduct of the audit has been obtained; and (d) there are no material deficiencies in the accounting records or financial statements that we have become aware
of during the course of the audit. HILL ROGERS
BRETT HANGER Partner Dated at Sydney this 6th day of October 2016

6 October 2016 The Mayor Hunter’s Hill Council PO Box 21 HUNTER’S HILL NSW 2110 Mayor,
Audit Report - Year Ended 30 June 2016
We are pleased to advise completion of the audit of Council’s books and records for the year ended 30 June 2016 and that all information required by us was readily available. We have signed our reports as required under Section 417(1) of the Local Government Act, 1993 and the Local Government Code of Accounting Practice and Financial Reporting to the General Purpose Financial Statements. Our audit has been conducted in accordance with Australian Auditing Standards so as to express an opinion on both the General and Special Purpose Financial Statements of the Council. We have ensured that the financial statements have been prepared in accordance with Australian Accounting Standards, Australian Accounting Interpretations and the Local Government Code of Accounting Practice and Financial Reporting. This report on the conduct of the audit is also issued under Section 417(1) and we now offer the following comments on the financial statements and the audit; 1. RESULTS FOR THE YEAR 1.1 Operating Result The operating result for the year was a surplus of $3.665 million as compared with $335,000 in the previous year.
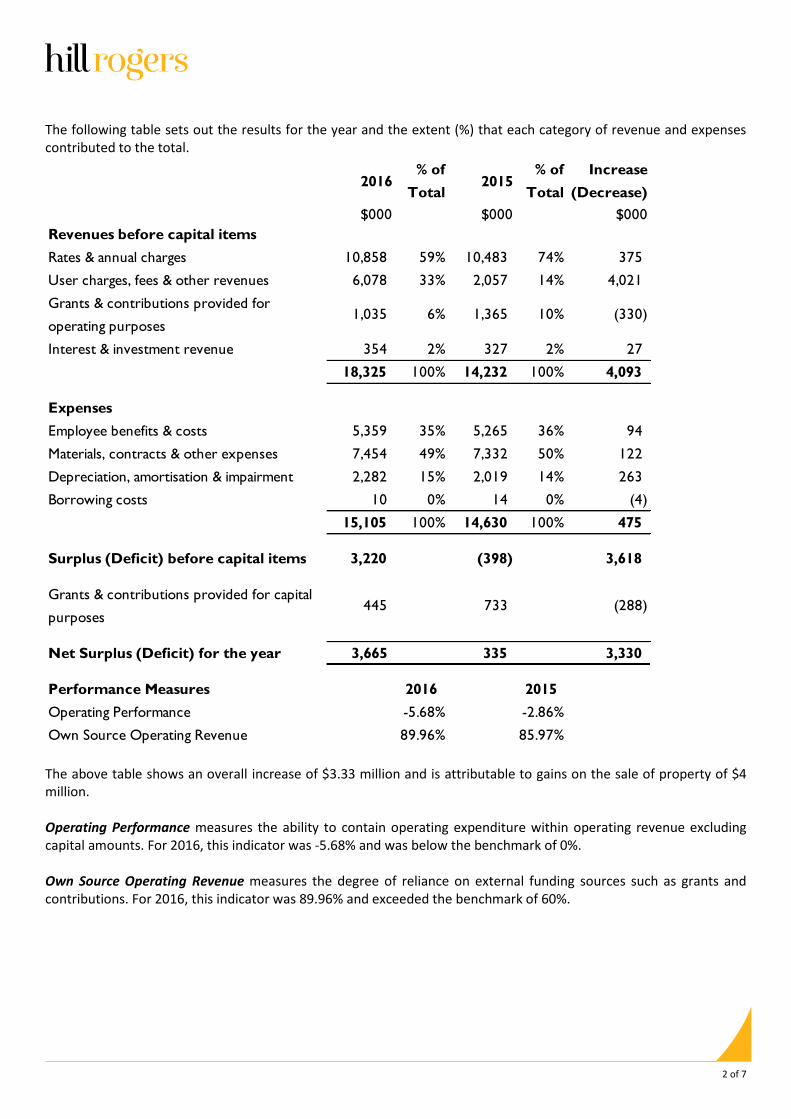
2 of 7
The following table sets out the results for the year and the extent (%) that each category of revenue and expenses contributed to the total.
2016% of
Total2015
% of
Total
Increase
(Decrease)
$000 $000 $000
Revenues before capital items
Rates & annual charges 10,858 59% 10,483 74% 375
User charges, fees & other revenues 6,078 33% 2,057 14% 4,021
Grants & contributions provided for
operating purposes1,035 6% 1,365 10% (330)
Interest & investment revenue 354 2% 327 2% 27
18,325 100% 14,232 100% 4,093
Expenses
Employee benefits & costs 5,359 35% 5,265 36% 94
Materials, contracts & other expenses 7,454 49% 7,332 50% 122
Depreciation, amortisation & impairment 2,282 15% 2,019 14% 263
Borrowing costs 10 0% 14 0% (4)
15,105 100% 14,630 100% 475
Surplus (Deficit) before capital items 3,220 (398) 3,618
Grants & contributions provided for capital
purposes445 733 (288)
Net Surplus (Deficit) for the year 3,665 335 3,330
Performance Measures 2016 2015
Operating Performance -5.68% -2.86%
Own Source Operating Revenue 89.96% 85.97% The above table shows an overall increase of $3.33 million and is attributable to gains on the sale of property of $4 million. Operating Performance measures the ability to contain operating expenditure within operating revenue excluding capital amounts. For 2016, this indicator was -5.68% and was below the benchmark of 0%. Own Source Operating Revenue measures the degree of reliance on external funding sources such as grants and contributions. For 2016, this indicator was 89.96% and exceeded the benchmark of 60%.

3 of 7
1.2 Funding Result As the operating result only accounts for operating income and expenditure, in reviewing the overall financial performance of Council, it is useful to consider the total source of revenues and how they were applied during the year which is illustrated in the table below.
2016 2015
Funds were provided by:- $000 $000
Operating Result (as above) 3,665 335
Add back non funding items:-
- Depreciation, amortisation & impairment 2,282 2,019
- Book value of non-current assets sold 5,512 113
- (Surplus)/Deficit in joint ventures (32) (16)
11,427 2,451
Transfers from externally restricted assets (net) 79 468
Transfers from internal reserves (net) 168 0
Net Changes in current/non-current assets & liabilities 125 205
11,799 3,124
Funds were applied to:-
Purchase and construction of assets (2,367) (2,717)
Principal repaid on loans (62) (57)
Transfers to externally restricted assets (net) 0 0
Transfers to internal reserves (net) 0 (436)
(2,429) (3,210)
Increase/(Decrease) in Available Working Capital 9,370 (86)
2. FINANCIAL POSITION 2.1 Unrestricted Current Ratio The Unrestricted Current Ratio is a financial indicator specific to local government and represents Council’s ability to meet its debts and obligations as they fall due. After eliminating externally restricted assets and current liabilities not expected to be paid within the next 12 months net current assets amounted to $15.095 million representing a factor of 7.57 to 1.
2014 2015 2016
Ratio 3.88 3.38 7.57
0
2
4
6
8
Unrestricted Current Ratio

4 of 7
2.2 Available Working Capital – (Working Funds) At the close of the year the Available Working Capital of Council stood at $11.909 million as detailed below;
2016 2015 Change
$000 $000 $000
Net Current Assets (Working Capital) as
per Accounts 14,529 5,546 8,983
Add: Payables & provisions not expected to
be realised in the next 12 months included
above 3,335 3,250 85
Adjusted Net Current Assets 17,864 8,796 9,068
Add: Budgeted & expected to pay in the next
12 months
- Borrowings 65 57 8
- Employees leave entitlements 914 858 56
- Deposits & retention moneys 271 280 (9)
Less: Externally restricted assets (2,769) (2,848) 79
Less: Internally restricted assets (4,436) (4,604) 168
Available Working Capital as at 30 June 11,909 2,539 9,370
The balance of Available Working Capital should be at a level to manage Council’s day to day operations including the
financing of hard core debtors, stores and to provide a buffer against unforeseen and unbudgeted expenditures.
Taking into consideration the nature and level of the internally restricted assets (Reserves) set aside to fund future
works and services and liabilities, Council’s Available Working Capital at year end was sound. 2.3 Debt
After repaying principal and interest of $72,000, total
debt as at 30 June 2016 stood at $99,000 (2015 -
$161,000). The debt service cover ratio measures the availability of operating cash to service debt repayments. For 2016, the ratio indicated that operating results before capital, interest and depreciation covered payments required to service debt by a factor of 20.56 to 1.
2014 2015 2016
Ratio 20.51 22.92 20.56
0
10
20
30
Debt Service Cover Ratio
2.4 Summary Council’s overall financial position, when taking into account the above financial indicators was, in our opinion, sound.

5 of 7
3. CASH ASSETS 3.1 Cash Expense Cover Ratio This liquidity ratio indicates the number of months of expenditure requirements that can be meet with available cash and term deposit balances without the need for additional cash inflow. For 2016, this ratio stood at 16.39 months compared to the benchmark of 3.
2014 2015 2016
Ratio 9.33 9.12 16.39
0
5
10
15
20
Cash Expense Cover Ratio
3.2 Cash & Investment Securities
Cash and investments amounted $19.220 million at 30 June 2016 as compared with $10.333 million in 2015 and
$9.969 million in 2014. The chart alongside summarises the purposes for which cash and investments securities were held.
ExternalRestrictions
InternalRestrictions
UncommittedFunds
2014 3.439 4.168 2.362
2015 2.991 4.604 2.738
2016 2.867 4.436 11.917
0
3
6
9
12$m
Cash & Investments
Externally restricted cash and investments are restricted in their use by externally imposed requirements and
consisted of unexpended loans ($24,000), unexpended development contributions under Section 94 ($1.006 million),
unexpended grants and contributions ($100,000), domestic waste management charges ($246,000) and special rate
levies ($1.491 million). Internally restricted cash and investments have been restricted in their use by resolution or policy of Council to reflect forward plans, identified programs of works, and are, in fact, Council’s “Reserves”. These Reserves totalled $4.436 million and their purposes are more fully disclosed in Note 6 of the financial statements. Unrestricted cash and investments amounted to $11.917 million, which is available to provide liquidity for day to day operations.

6 of 7
3.3 Cash Flows
The Statement of Cash Flows illustrates the flow of cash (highly liquid cash and investments) moving in and out of
Council during the year and reveals that cash increased by $8.887 million to $19.220 million at the close of the year.
In addition to operating activities which contributed net cash of $2.053 million were the proceeds from the sale of assets ($9.512 million). Cash outflows other than operating activities were used to repay loans ($62,000) and to purchase and construct assets ($2.616 million). 4. RECEIVABLES 4.1 Rates & Annual Charges (excluding interest & extra charges)
Net rates and annual charges levied during the year totalled $10.858 million and represented 58% of Council’s total
revenues.
Including arrears, the total rates and annual charges collectible was $11.106 million of which $10.814 million (97%)
was collected. 4.2 Rates, Annual & Extra Charges
Arrears of rates, annual and extra charges stood at
$317,000 at the end of the year and represented 2.84%
of those receivables.
2014 2015 2016
Ratio 2.26% 2.54% 2.84%
0%
1%
2%
3%
Rates, Annual & Extra Charges Outstanding
4.3 Other Receivables
Receivables (other than rates & annual charges) totalled $666,000 and mainly consisted of user charges and fees
($179,000) and amounts due from other levels of government ($301,000). 5. PAYABLES 5.1 Employees Leave Entitlements
Council’s provision for its liability toward employees leave entitlements and associated on costs amounted to $1.910
million. A cash reserve of $676,000 was held at year end representing 35% of this liability and was, in our opinion,
sufficient to meet unbudgeted and unanticipated retirements.

7 of 7
5.2 Deposits, Retentions & Bonds Deposits, retentions and bonds held at year end amounted to $2.627 million and was fully funded by cash and investments. 6. INFRASTRUCTURE RENEWALS The Infrastructure Renewals Ratio measures the rate at which these assets are renewed against the rate at which they are depreciating. Special Schedule No. 7 discloses that asset renewals for 2016 represented 105% of the depreciation charges for these assets. An industry benchmark is considered to be 100%, measured annually over the long term. 2014 2015 2016
Ratio 68.97% 118.85% 104.98%
0%
25%
50%
75%
100%
125%
Infrastructure Renewals Ratio
7. REVALUATION OF ASSETS
Council’s infrastructure, property, plant and equipment are required to be carried at fair value with revaluations of
each asset class to be performed at least every five years.
During the year, community land and other structures were revalued. After accounting for an opening balance equity adjustment in respect to the valuation methodology for community land, a revaluation increment of $6.724 million that was credited directly to the Asset Revaluation Reserve in Equity. Notes 1(j), 9 and 20 of the financial statements provide further details. 8. MANAGEMENT LETTER An audit management letter addressing the findings from our interim audit was issued on 8 August 2016 and this included our suggestions on possible ways to strengthen and/or improve procedures. 9. CONCLUSION We wish to record our appreciation to the General Manager and his staff for their ready co-operation and the courtesies extended to us during the conduct of the audit. Yours faithfully, HILL ROGERS
BRETT HANGER Partner

Hunter's Hill Council SPECIAL SCHEDULES for the year ended 30 June 2016
“A sense of history, A sense of community,
A place to belong, A sustainable future”

Special Schedules 2016
Hunter's Hill Council
Special Schedules for the year ended 30 June 2016
Contents
Special Schedules1
Net Cost of Services
Statement of Long Term Debt (all purposes)
Report on Infrastructure Assets
Permissible Income Calculation
1 Special Schedules are not audited (with the exception of Special Schedule 8).
Background
These Special Schedules have been designed to meet the requirements of special purpose users such as;
the NSW Grants Commission
the Australian Bureau of Statistics (ABS),
the NSW Office of Water (NOW), and
the Office of Local Government (OLG).
The financial data is collected for various uses including;
the allocation of Financial Assistance Grants,
the incorporation of Local Government financial figures in national statistics,
the monitoring of loan approvals,
the allocation of borrowing rights, and
the monitoring of the financial activities of specific services.
Page
2-3
4
Special Schedule 1
Special Schedule 2(a)
5-8Special Schedule 7
(ii)
i
i
(i)
i
i
Special Schedule 8 9
i
i
i
i
i
page 1

Special Schedules 2016
Hunter's Hill Council
Special Schedule 1 – Net Cost of Services for the year ended 30 June 2016
$’000
Governance
Administration
Public order and safety
Animal control
Total public order and safety
Health
Environment
Noxious plants and insect/vermin control
Other environmental protection
Solid waste management
Street cleaning
Drainage
Total environment
Community services and education
Administration and education
Social protection (welfare)
Aged persons and disabled
Children’s services
Total community services and education
Housing and community amenities
Street lighting
Town planning
Other community amenities
Total housing and community amenities
35
35
Expenses from.
continuing.
operations. Non-capital.
1
175
Capital.
Income from
continuing operations
60
–
–
2,666
39
2,842
2
–
–
10
1,628 19
348
135
46
35
–
1,609
(756)
(177)
(6)
–
–
2,011
3,214
428
203
(646)
– (42)
–
102
257
685
–
34
Function or activity
Fire service levy, fire protection,
emergency services
52
222
1,104
Net cost.
of services.
(394)
(74)
(119)
1,489 – – (1,489)
(252) –
(3,011)
5
11
58
388
60
–
10
–
1,345
402
284
2,297
2,996
–
(1)
–
2
29
676
(253)
1
277 (248)
(11)
369
–
–
–
(2)
(401)
–
page 2

Special Schedules 2016
Hunter's Hill Council
Special Schedule 1 – Net Cost of Services (continued)
for the year ended 30 June 2016
$’000
Recreation and culture
Public libraries
Art galleries
Community centres and halls
Other cultural services
Sporting grounds and venues
Swimming pools
Parks and gardens (lakes)
Other sport and recreation
Total recreation and culture
Mining, manufacturing and construction
Building control
Other mining, manufacturing and construction
Total mining, manufacturing and const.
Transport and communication
Urban roads (UR) – local
Parking areas
Footpaths
Other transport and communication
Total transport and communication
Economic affairs
Other economic affairs
Total economic affairs
Totals – functions
General purpose revenues(1)
NET OPERATING RESULT (2)
(1) Includes: rates and annual charges (including ex gratia, excluding water and sewer), non-capital general purpose (2) As reported in the Income Statement
grants, interest on investments (excluding externally restricted assets) and interest on overdue rates and annual charges
Income from
continuing operations
–
–
47
100
15,117
–
2,112 3,987
–
–
18,337
2
8,112
15,117
2
32
10,193
–
445
1,784
17
244
140
64
96
207 59
322
Function or activity
31 –
176
3 –
–
–
–
–
78 2,615
59 –
883
171
171
108
Non-capital.
Expenses from.
continuing.
operations.
1,097
107
30
156
470
84
1,745 1,819
28
44
96
(30)
(72)
(1,654)
78 138
–
Capital.
–
–
–
445 3,665
32
(4,479)
2
2,197
61
2
1,790
–
70
8,112
650 (603)
408
(8)
(140)
(63)
62
Net cost.
of services.
(143)
3
250
(59)
(881)
Share of interests – joint ventures and
associates using the equity method
page 3

Special Schedules 2016
Hunter's Hill Council
Special Schedule 2(a) – Statement of Long Term Debt (all purpose) for the year ended 30 June 2016
$’000
Specia
l Schedule
s 2
015
page 4
Notes: excludes (i) internal loans and (ii) principal inflows/outflows relating to loan re-financing.
This schedule is prepared using the face value of debt obligations, rather than fair value (which are reported in the GPFS).
–
–
Deferred payments
–
–
57
–
104
–
Total long term debt – –
Total debt
–
161
–
– 62
–
65
–
99
– – –
34
–
10 –
–
Other long term debt
Ratepayers advances – – –
–
Government advances –
Finance leases –
–
–
–
Financial institutions 57 104 161
– – – 62
62
57 104 Total loans
–
161
Other
Other state government – – –
–
Treasury corporation
Public subscription – –
– – –
Debt redemption
during the year
From
revenue
Sinking
funds
65
–
10
10
34
65 34
–
–
–
CurrentNon-
currentTotal
– –
– –
–
–
– –
99
–
99
–
– –
Loans (by source)
Commonwealth government
Current
– – –
Transfers
to sinking
funds
Principal outstandingInterest
applicable
for year TotalNon-
current
at the end of the year
– –
Principal outstanding New
loans
raised
during
the year
at beginning of the year
Classification of debt
page 4

Special Schedules 2016
Hunter's Hill Council
Special Schedule 7 – Report on Infrastructure Assets as at 30 June 2016 as at 30 June 2016
$’000
35
558
1.9%76,669
0%
1,008 475
20%
0.0%
805
66
6
12.6%
6,410 20.0%
630 Sub-total
134
22,223 16.3%
61%10%
20.0%154
616
33
Kerb and guttering
Other road assets
96
–
Footpaths
651
154 35
69
9%51,007 375 0%
5
Council Public Halls
3
Council Works Depot
24.9%
0%
43 46
74 82
0%
80%
20%
0%
80%
4
20%
20%
0%
11,389 60%
5,718 0%
140
20%
80%
4,076
194 0%225
20%1,040
0.0%
0%
20%
0%
Roads
Other structures
Sub-total
0%
0%
0%
263
Asset categoryRequired Actual replacement
cost (GRC)maintenancea
to satisfactory
Estimated cost
agreed level of
service set by
Council
511
21
0.0%
8%
6%
14,327
Sealed roads
Other structures
Sub-total
Asset class
Council
Offices/Administration
to bring assets
Estimated cost
2015/16to bring to the 2015/16 Gross
standard maintenance
Other Buildings
Buildings
0% 20% 60%6,410
242
58.7%
30%
20%
10%
16,892
6,265
30%
– 6,265
46,312
7,505
13,662
1,160
45%
35%
53.9% 8.4%
4
23.2%68,639
33
– 553 0.0%
16%
10%
3%9,960
10%
7%
1,375
60.0%
20% 50%
Assets in condition as a percentage of gross
replacement costCarrying
value
3,524
682
4,889
7,797
page 5

Special Schedules 2016
Hunter's Hill Council
Special Schedule 7 – Report on Infrastructure Assets as at 30 June 2016 (continued)
as at 30 June 2016
$’000
5
replacement
22%
33
Stormwater drainage
maintenancea
56%
Gross
33 9,187
maintenance
ActualRequiredto satisfactory
standard
7,966
Other
–
Carrying
value
9,187 Sub-total 9.0%
Asset category
to bring to the
Council
Estimated cost
agreed level of
service set by 3cost (GRC)
12%7,966
–
196 166
2015/16
1%
2015/16
9%
21
22.0% 12.0%56.0%166 1.0%196
4
to bring assets
Asset class
Stormwater drainage
Estimated costAssets in condition as a percentage of gross
replacement cost
page 6

Special Schedules 2016
Hunter's Hill Council
Special Schedule 7 – Report on Infrastructure Assets as at 30 June 2016 (continued)
as at 30 June 2016
$’000
Notes:
a Required maintenance is the amount identified in Council’s asset management plans.
Infrastructure asset condition assessment ‘key’
Excellent No work required (normal maintenance)
Good Only minor maintenance work required
Average Maintenance work required
Poor Renewal required
Very poor Urgent renewal/upgrading required5
Estimated cost
to bring assets 2015/16 2015/16 Grossto bring to the
Estimated cost
to satisfactory Required Actual replacementCarrying
Asset class Asset category standard maintenancea
maintenance cost (GRC) 1 2 3 4 5value
1,475 1,229 114,489 9.2% 23.2% 55.3% 10.9% 1.3%–
Assets in condition as a percentage of gross
replacement costagreed level of
service set by
Council
4
3
2
1
99,762 TOTAL – ALL ASSETS 1,846
page 7
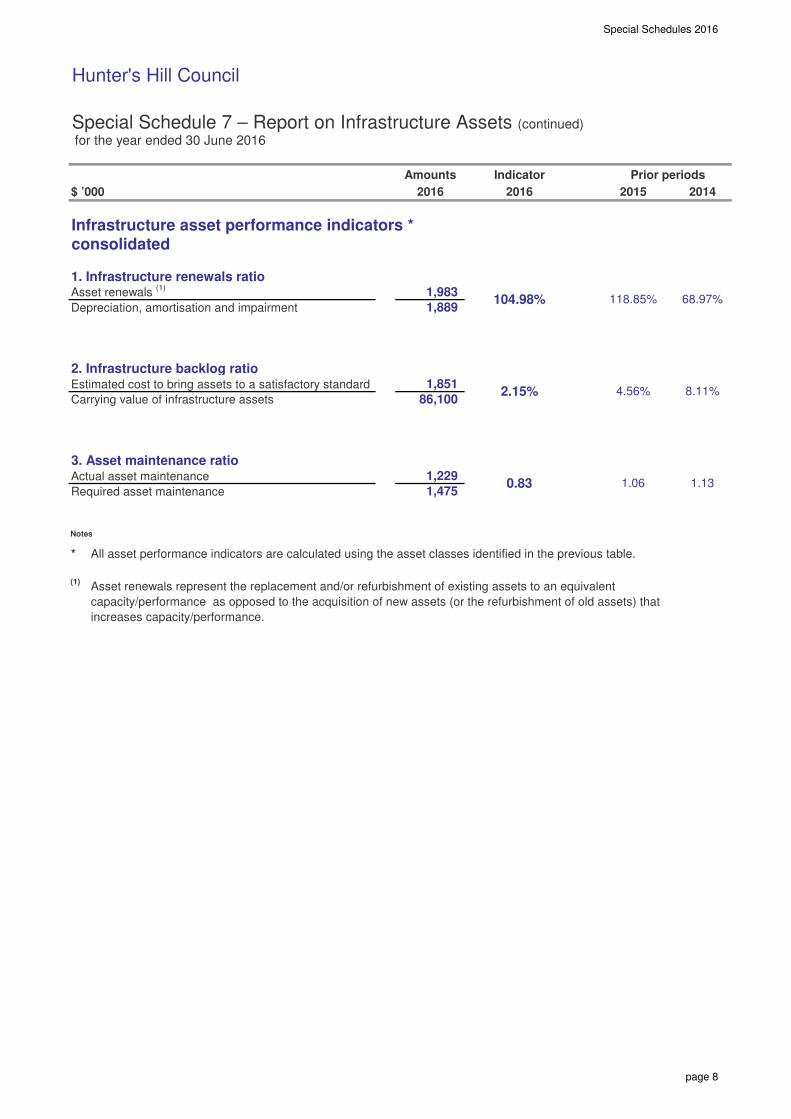
Special Schedules 2016
Hunter's Hill Council
Special Schedule 7 – Report on Infrastructure Assets (continued)
for the year ended 30 June 2016
$ ’000
Infrastructure asset performance indicators * consolidated
1. Infrastructure renewals ratioAsset renewals
(1)
Depreciation, amortisation and impairment
2. Infrastructure backlog ratioEstimated cost to bring assets to a satisfactory standard
Carrying value of infrastructure assets
3. Asset maintenance ratioActual asset maintenance
Required asset maintenance
Notes
* All asset performance indicators are calculated using the asset classes identified in the previous table.
(1)Asset renewals represent the replacement and/or refurbishment of existing assets to an equivalent
capacity/performance capacity/performance as opposed to the acquisition of new assets (or the refurbishment of old assets) that
increases capacity/performance.increases capacity/performance.
1,229
Indicator Prior periods
1,851 2.15% 4.56% 8.11%
86,100
2016 2016 2015 2014
1,983 104.98% 118.85% 68.97%
1,889
Amounts
0.83 1.06 1.131,475
page 8
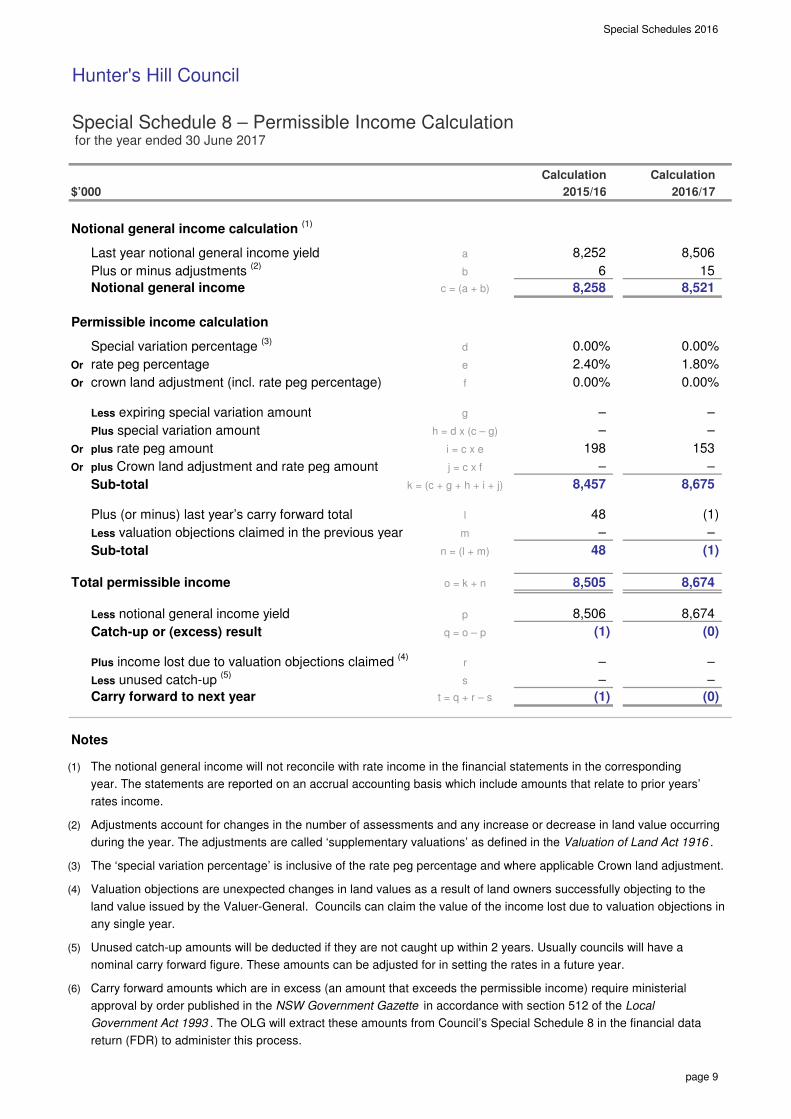
Special Schedules 2016
Hunter's Hill Council
Special Schedule 8 – Permissible Income Calculation for the year ended 30 June 2017
$’000
Notional general income calculation (1)
Last year notional general income yield
Plus or minus adjustments (2)
Notional general income
Permissible income calculation
Special variation percentage (3)
Or rate peg percentage
Or crown land adjustment (incl. rate peg percentage)
Less expiring special variation amount
Plus special variation amount
Or plus rate peg amount
Or plus Crown land adjustment and rate peg amount
Sub-total
Plus (or minus) last year’s carry forward total
Less valuation objections claimed in the previous year
Sub-total
Total permissible income
Less notional general income yield
Catch-up or (excess) result
Plus income lost due to valuation objections claimed (4)
Less unused catch-up (5)
Carry forward to next year
Notes
(1) The notional general income will not reconcile with rate income in the financial statements in the corresponding
year. The statements are reported on an accrual accounting basis which include amounts that relate to prior years’
rates income.
(2) Adjustments account for changes in the number of assessments and any increase or decrease in land value occurring
during the year. The adjustments are called ‘supplementary valuations’ as defined in the Valuation of Land Act 1916 .
(3) The ‘special variation percentage’ is inclusive of the rate peg percentage and where applicable Crown land adjustment.
(4) Valuation objections are unexpected changes in land values as a result of land owners successfully objecting to the
land value issued by the Valuer-General. Councils can claim the value of the income lost due to valuation objections in
any single year.
(5) Unused catch-up amounts will be deducted if they are not caught up within 2 years. Usually councils will have a
nominal carry forward figure. These amounts can be adjusted for in setting the rates in a future year.
(6) Carry forward amounts which are in excess (an amount that exceeds the permissible income) require ministerial
approval by order published in the NSW Government Gazette in accordance with section 512 of the Local
Government Act 1993 . The OLG will extract these amounts from Council’s Special Schedule 8 in the financial data
return (FDR) to administer this process.
p
q = o – p
r
s
t = q + r – s
b
d
e
f
j = c x f
i = c x e
h = d x (c – g)
c = (a + b)
l
m
n = (l + m)
o = k + n
g
k = (c + g + h + i + j)
a
(1) (0)
Calculation Calculation
2015/16 2016/17
– –
(1) (0)
– –
8,505 8,674
8,506 8,674
– –
48 (1)
– –
48 (1)
198 153
– –
8,457 8,675
0.00% 0.00%
– –
0.00% 0.00%
2.40% 1.80%
8,252 8,506
6 15
8,258 8,521
page 9
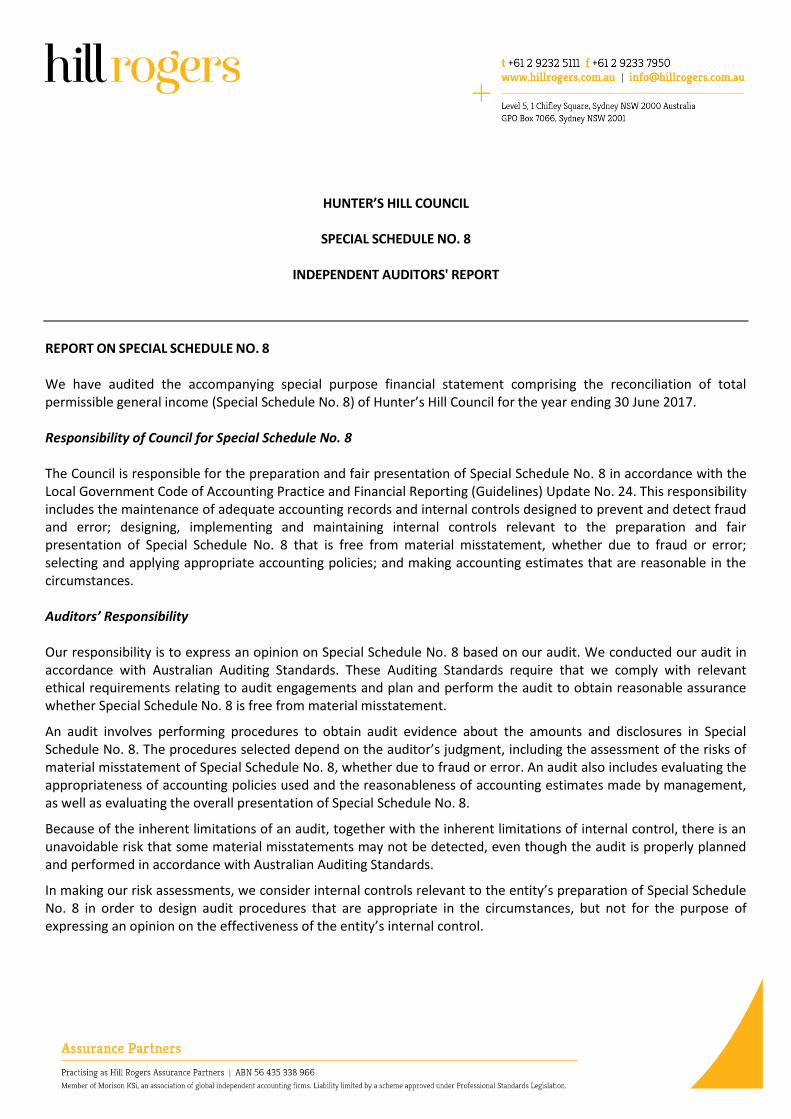
HUNTER’S HILL COUNCIL
SPECIAL SCHEDULE NO. 8
INDEPENDENT AUDITORS' REPORT
REPORT ON SPECIAL SCHEDULE NO. 8 We have audited the accompanying special purpose financial statement comprising the reconciliation of total permissible general income (Special Schedule No. 8) of Hunter’s Hill Council for the year ending 30 June 2017. Responsibility of Council for Special Schedule No. 8 The Council is responsible for the preparation and fair presentation of Special Schedule No. 8 in accordance with the Local Government Code of Accounting Practice and Financial Reporting (Guidelines) Update No. 24. This responsibility includes the maintenance of adequate accounting records and internal controls designed to prevent and detect fraud and error; designing, implementing and maintaining internal controls relevant to the preparation and fair presentation of Special Schedule No. 8 that is free from material misstatement, whether due to fraud or error; selecting and applying appropriate accounting policies; and making accounting estimates that are reasonable in the circumstances. Auditors’ Responsibility Our responsibility is to express an opinion on Special Schedule No. 8 based on our audit. We conducted our audit in accordance with Australian Auditing Standards. These Auditing Standards require that we comply with relevant ethical requirements relating to audit engagements and plan and perform the audit to obtain reasonable assurance whether Special Schedule No. 8 is free from material misstatement.
An audit involves performing procedures to obtain audit evidence about the amounts and disclosures in Special Schedule No. 8. The procedures selected depend on the auditor’s judgment, including the assessment of the risks of material misstatement of Special Schedule No. 8, whether due to fraud or error. An audit also includes evaluating the appropriateness of accounting policies used and the reasonableness of accounting estimates made by management, as well as evaluating the overall presentation of Special Schedule No. 8.
Because of the inherent limitations of an audit, together with the inherent limitations of internal control, there is an unavoidable risk that some material misstatements may not be detected, even though the audit is properly planned and performed in accordance with Australian Auditing Standards.
In making our risk assessments, we consider internal controls relevant to the entity’s preparation of Special Schedule No. 8 in order to design audit procedures that are appropriate in the circumstances, but not for the purpose of expressing an opinion on the effectiveness of the entity’s internal control.

2 of 2
We believe that the audit evidence we have obtained is sufficient and appropriate to provide a basis for our audit opinion. Independence In conducting our audit, we followed applicable independence requirements of Australian professional ethical pronouncements. Audit Opinion In our opinion, Special Schedule No. 8 of Hunter’s Hill Council for 2016/17 is properly drawn up in accordance with the requirements of the Office of Local Government and in accordance with the books and records of the Council. Basis of Accounting Without modifying our opinion, we advise that this schedule has been prepared for distribution to the Office of Local Government for the purposes of confirming that Council’s reconciliation of Council’s total permissible general income is presented fairly. As a result, the schedule may not be suitable for another purpose. HILL ROGERS
BRETT HANGER Partner Dated at Sydney this 6th day of October 2016