FINANCIAL STATEMENTS...Bob Tan Beng Hai Neil McGregor William Tan Seng Koon Patrick Daniel...
186
STATEMENTS FINANCIAL 174 Directors’ Statement 189 Independent Auditors’ Report 198 Balance Sheets 199 Consolidated Income Statement 200 Consolidated Statement of Comprehensive Income 201 Consolidated Statement of Changes in Equity 203 Consolidated Statement of Cash Flows 205 Notes to the Financial Statements 332 Supplementary Information 342 Major Properties 344 Notice of Annual General Meeting Proxy From
Transcript of FINANCIAL STATEMENTS...Bob Tan Beng Hai Neil McGregor William Tan Seng Koon Patrick Daniel...

STATEMENTSFINANCIAL
174 Directors’ Statement
189 Independent Auditors’ Report
198 Balance Sheets
199 Consolidated Income Statement
200 Consolidated Statement of Comprehensive Income
201 Consolidated Statement of Changes in Equity
203 Consolidated Statement of Cash Flows
205 Notes to the Financial Statements
332 Supplementary Information
342 Major Properties
344 Notice of Annual General Meeting
Proxy From

We are pleased to submit this annual report to the members of the Company together with the audited financial statements
for the financial year ended 31 December 2018.
In our opinion:
(a) the financial statements set out on pages 198 to 331 are drawn up so as to give a true and fair view of the financial
position of the Group and of the Company as at 31 December 2018, and the financial performance, changes in equity
and cash flows of the Group for the year ended on that date in accordance with the provisions of the Singapore
Companies Act, Chapter 50, Singapore Financial Reporting Standards (International) and International Financial
Reporting Standards; and
(b) at the date of this statement, there are reasonable grounds to believe that the Company will be able to pay its debts as
and when they fall due.
The Board of Directors has, on the date of this statement, authorised these financial statements for issue.
DIRECTORS
The directors in office at the date of this statement are as follows:
Tan Sri Mohd Hassan Marican Chairman
Wong Weng Sun President and CEO
Ron Foo Siang Guan
Koh Chiap Khiong
Eric Ang Teik Lim
Gina Lee-Wan
Bob Tan Beng Hai
Neil McGregor
William Tan Seng Koon
Patrick Daniel (Appointed on 20 April 2018)
Tan Wah Yeow (Appointed on 10 December 2018)
DIRECTORS’ INTERESTS
According to the register kept by the Company for the purposes of Section 164 of the Companies Act, Chapter 50 (the “Act”),
particulars of interests of directors who held office at the end of the financial year (including those held by their spouses and
children) in shares, debentures, warrants and share options in the Company and in related corporations are as follows:
Name of director and
corporation in which
interests (are) held
Description
of interests
Shareholdings registered
in the name of director,
spouse, children or nominees
Other shareholdings in
which the director is deemed
to have an interest
At beginning
of the year
At end
of the year
At
21/01/2019
At beginning
of the year
At end
of the year
At
21/01/2019
Tan Sri Mohd Hassan Marican
Sembcorp Marine Ltd Ordinary
shares
(Note 1)
296,300 371,500 371,500 – – –
Sembcorp Industries Ltd Ordinary
shares
(Note 1)
79,400 94,300 94,300 – – –
DIRECTORS’ STATEMENTYear ended 31 December 2018
A N N U A L R E P O R T 2 0 1 8 175S E M B C O R P M A R I N E174

DIRECTORS’ INTERESTS (CONT’D)
Name of director and
corporation in which
interests (are) held
Description
of interests
Shareholdings registered
in the name of director,
spouse, children or nominees
Other shareholdings in
which the director is deemed
to have an interest
At beginning
of the year
At end
of the year
At
21/01/2019
At beginning
of the year
At end
of the year
At
21/01/2019
Wong Weng Sun
Sembcorp Marine Ltd Ordinary
shares
3,609,259 3,637,934 3,637,934 – – –
Conditional
award of
375,000
performance
shares to be
delivered
after 2017
(Note 2a)
Up to
562,500
– – – – –
Conditional
award of
638,000
performance
shares to be
delivered
after 2018
(Note 2b)
Up to
957,000
Up to
957,000
Up to
957,000
– – –
Conditional
award of
550,000
performance
shares to be
delivered
after 2019
(Note 2c)
Up to
825,000
Up to
825,000
Up to
825,000
– – –
Conditional
award of
481,000
performance
shares to be
delivered
after 2020
(Note 2d)
– Up to
721,500
Up to
721,500
– – –
DIRECTORS’ STATEMENTYear ended 31 December 2018
A N N U A L R E P O R T 2 0 1 8 175S E M B C O R P M A R I N E174

DIRECTORS’ INTERESTS (CONT’D)
Name of director and
corporation in which
interests (are) held
Description
of interests
Shareholdings registered
in the name of director,
spouse, children or nominees
Other shareholdings in
which the director is deemed
to have an interest
At beginning
of the year
At end
of the year
At
21/01/2019
At beginning
of the year
At end
of the year
At
21/01/2019
Wong Weng Sun (cont’d)
Sembcorp Marine Ltd
(cont’d)
Conditional
award of
85,000
restricted
shares to be
delivered
after 2015
(Note 3a)
12,750 – – – – –
Conditional
award of
127,500
restricted
shares to be
delivered
after 2016
(Note 3b)
12,750 6,375 6,375 – – –
Conditional
award of
191,000
restricted
shares to be
delivered
after 2017
(Note 3c)
Up to
286,500
19,100 19,100 – – –
Conditional
award of
181,000
restricted
shares to be
delivered
after 2018
(Note 3d)
Up to
271,500
Up to
271,500
Up to
271,500
– – –
Conditional
award of
233,000
restricted
shares to be
delivered
after 2018
(Note 4)
– Up to
349,500
Up to
349,500
– – –
DIRECTORS’ STATEMENTYear ended 31 December 2018
A N N U A L R E P O R T 2 0 1 8 177S E M B C O R P M A R I N E176
DIRECTORS’ INTERESTS (CONT’D)
Name of director and
corporation in which
interests (are) held
Description
of interests
Shareholdings registered
in the name of director,
spouse, children or nominees
Other shareholdings in
which the director is deemed
to have an interest
At beginning
of the year
At end
of the year
At
21/01/2019
At beginning
of the year
At end
of the year
At
21/01/2019
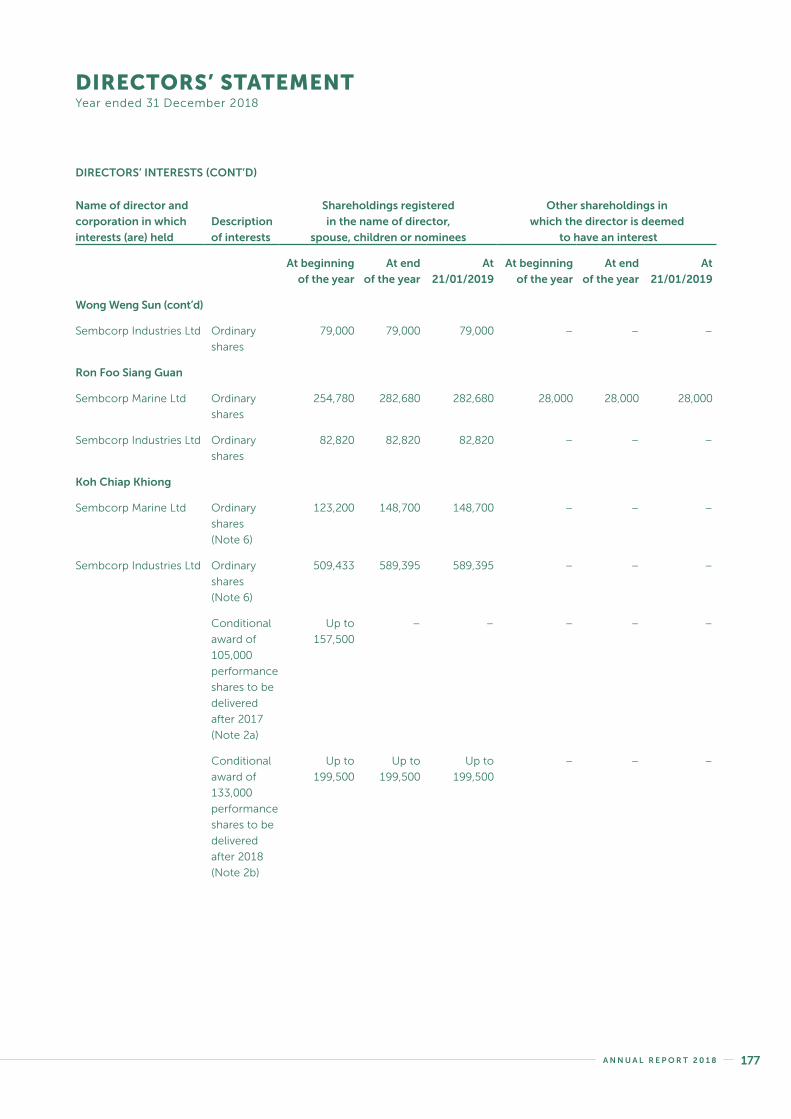
Wong Weng Sun (cont’d)
Sembcorp Industries Ltd Ordinary
shares
79,000 79,000 79,000 – – –
Ron Foo Siang Guan
Sembcorp Marine Ltd Ordinary
shares
254,780 282,680 282,680 28,000 28,000 28,000
Sembcorp Industries Ltd Ordinary
shares
82,820 82,820 82,820 – – –
Koh Chiap Khiong
Sembcorp Marine Ltd Ordinary
shares
(Note 6)
123,200 148,700 148,700 – – –
Sembcorp Industries Ltd Ordinary
shares
(Note 6)
509,433 589,395 589,395 – – –
Conditional
award of
105,000
performance
shares to be
delivered
after 2017
(Note 2a)
Up to
157,500
– – – – –
Conditional
award of
133,000
performance
shares to be
delivered
after 2018
(Note 2b)
Up to
199,500
Up to
199,500
Up to
199,500
– – –
DIRECTORS’ STATEMENTYear ended 31 December 2018
A N N U A L R E P O R T 2 0 1 8 177S E M B C O R P M A R I N E176
DIRECTORS’ INTERESTS (CONT’D)
Name of director and
corporation in which
interests (are) held
Description
of interests
Shareholdings registered
in the name of director,
spouse, children or nominees
Other shareholdings in
which the director is deemed
to have an interest
At beginning
of the year
At end
of the year
At
21/01/2019
At beginning
of the year
At end
of the year
At
21/01/2019
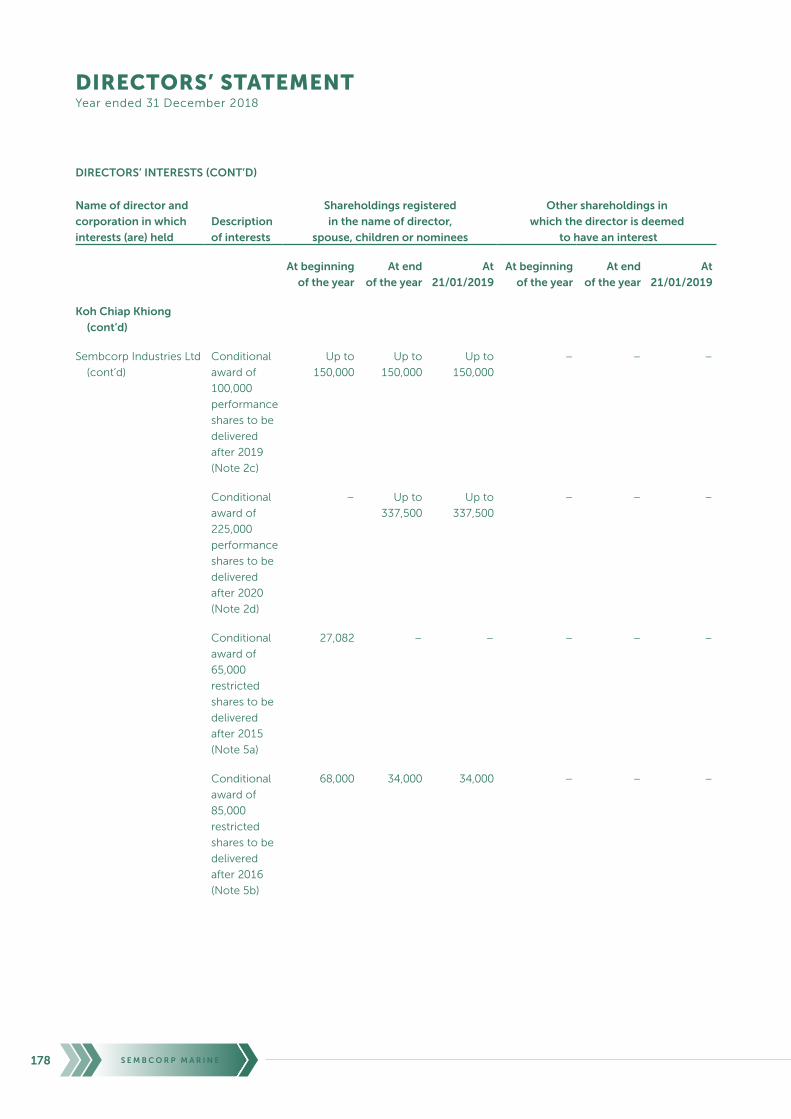
Koh Chiap Khiong
(cont’d)
Sembcorp Industries Ltd
(cont’d)
Conditional
award of
100,000
performance
shares to be
delivered
after 2019
(Note 2c)
Up to
150,000
Up to
150,000
Up to
150,000
– – –
Conditional
award of
225,000
performance
shares to be
delivered
after 2020
(Note 2d)
– Up to
337,500
Up to
337,500
– – –
Conditional
award of
65,000
restricted
shares to be
delivered
after 2015
(Note 5a)
27,082 – – – – –
Conditional
award of
85,000
restricted
shares to be
delivered
after 2016
(Note 5b)
68,000 34,000 34,000 – – –
DIRECTORS’ STATEMENTYear ended 31 December 2018
A N N U A L R E P O R T 2 0 1 8 179S E M B C O R P M A R I N E178

DIRECTORS’ INTERESTS (CONT’D)
Name of director and
corporation in which
interests (are) held
Description
of interests
Shareholdings registered
in the name of director,
spouse, children or nominees
Other shareholdings in
which the director is deemed
to have an interest
At beginning
of the year
At end
of the year
At
21/01/2019
At beginning
of the year
At end
of the year
At
21/01/2019
Koh Chiap Khiong
(cont’d)
Sembcorp Industries Ltd
(cont’d)
Conditional
award of
96,000
restricted
shares to be
delivered
after 2017
(Note 5c)
Up to
144,000
37,760 37,760 – – –
Conditional
award of
100,000
restricted
shares to be
delivered
after 2018
(Note 5d)
Up to
150,000
Up to
150,000
Up to
150,000
– – –
Subordinated
Perpetual
Security
issued on
21 Aug 2013
under the
$2.5 Billion
Multicurrency
Debt
Issuance
Programme
(Note 7)
Principal
Amount:
$250,000
– – – – –
Gina Lee-Wan
Sembcorp Marine Ltd Ordinary
shares
49,500 69,800 69,800 – – –
Bob Tan Beng Hai
Sembcorp Marine Ltd Ordinary
shares
61,500 91,400 91,400 – – –
DIRECTORS’ STATEMENTYear ended 31 December 2018
A N N U A L R E P O R T 2 0 1 8 179S E M B C O R P M A R I N E178

DIRECTORS’ INTERESTS (CONT’D)
Name of director and
corporation in which
interests (are) held
Description
of interests
Shareholdings registered
in the name of director,
spouse, children or nominees
Other shareholdings in
which the director is deemed
to have an interest
At beginning
of the year
At end
of the year
At
21/01/2019
At beginning
of the year
At end
of the year
At
21/01/2019
Neil McGregor
Sembcorp Marine Ltd Ordinary
shares
– 15,700 15,700 – – –
Sembcorp Industries Ltd Ordinary
shares
33,900 159,400 159,400 – – –
Conditional
award of
429,553
performance
shares to be
delivered
after 2019
(Note 2c)
Up to
644,330
Up to
644,330
Up to
644,330
– – –
Conditional
award of
638,000
performance
shares to be
delivered
after 2020
(Note 2d)
– Up to
957,000
Up to
957,000
– – –
Conditional
award of
416,667
restricted
shares to be
delivered
after 2018
(Note 5d)
Up to
625,001
Up to
625,001
Up to
625,001
– – –
William Tan Seng Koon
Sembcorp Marine Ltd Ordinary
shares
– 16,900 16,900 – – –
DIRECTORS’ STATEMENTYear ended 31 December 2018
A N N U A L R E P O R T 2 0 1 8 181S E M B C O R P M A R I N E180
DIRECTORS’ INTERESTS (CONT’D)
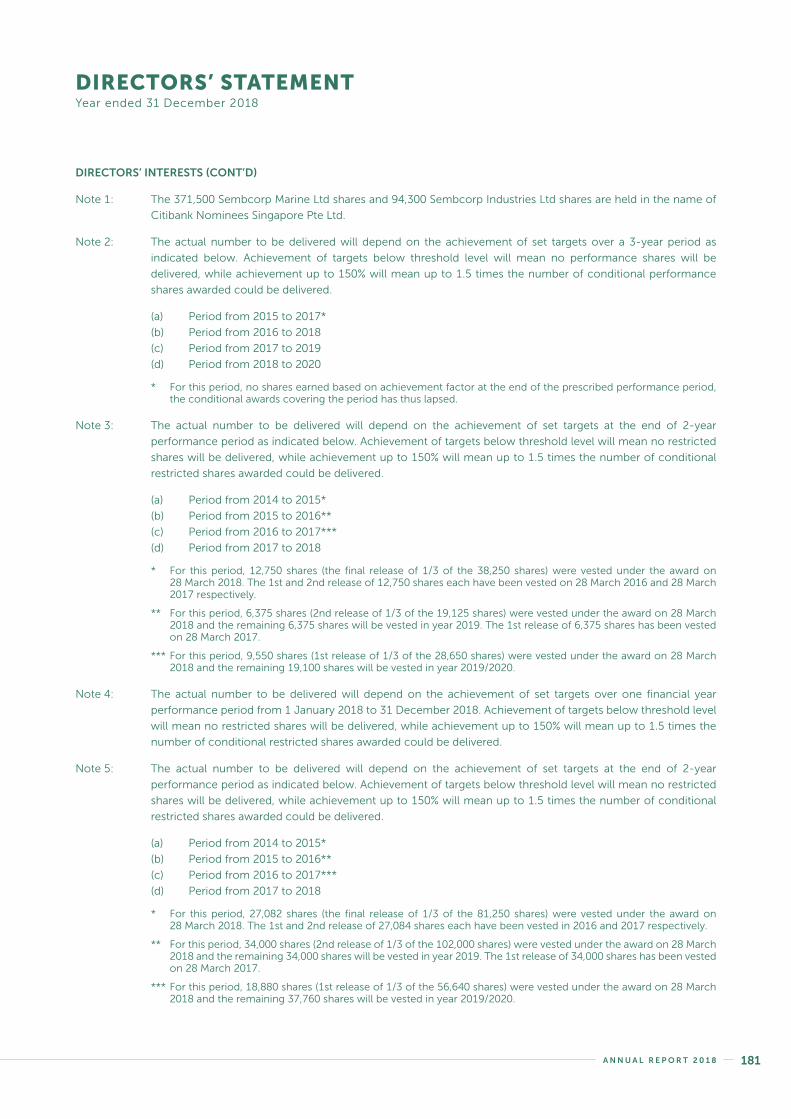
Note 1: The 371,500 Sembcorp Marine Ltd shares and 94,300 Sembcorp Industries Ltd shares are held in the name of
Citibank Nominees Singapore Pte Ltd.
Note 2: The actual number to be delivered will depend on the achievement of set targets over a 3-year period as
indicated below. Achievement of targets below threshold level will mean no performance shares will be
delivered, while achievement up to 150% will mean up to 1.5 times the number of conditional performance
shares awarded could be delivered.
(a) Period from 2015 to 2017*
(b) Period from 2016 to 2018
(c) Period from 2017 to 2019
(d) Period from 2018 to 2020
* For this period, no shares earned based on achievement factor at the end of the prescribed performance period, the conditional awards covering the period has thus lapsed.
Note 3: The actual number to be delivered will depend on the achievement of set targets at the end of 2-year
performance period as indicated below. Achievement of targets below threshold level will mean no restricted
shares will be delivered, while achievement up to 150% will mean up to 1.5 times the number of conditional
restricted shares awarded could be delivered.
(a) Period from 2014 to 2015*
(b) Period from 2015 to 2016**
(c) Period from 2016 to 2017***
(d) Period from 2017 to 2018
* For this period, 12,750 shares (the final release of 1/3 of the 38,250 shares) were vested under the award on 28 March 2018. The 1st and 2nd release of 12,750 shares each have been vested on 28 March 2016 and 28 March 2017 respectively.
** For this period, 6,375 shares (2nd release of 1/3 of the 19,125 shares) were vested under the award on 28 March 2018 and the remaining 6,375 shares will be vested in year 2019. The 1st release of 6,375 shares has been vested on 28 March 2017.
*** For this period, 9,550 shares (1st release of 1/3 of the 28,650 shares) were vested under the award on 28 March 2018 and the remaining 19,100 shares will be vested in year 2019/2020.
Note 4: The actual number to be delivered will depend on the achievement of set targets over one financial year
performance period from 1 January 2018 to 31 December 2018. Achievement of targets below threshold level
will mean no restricted shares will be delivered, while achievement up to 150% will mean up to 1.5 times the
number of conditional restricted shares awarded could be delivered.
Note 5: The actual number to be delivered will depend on the achievement of set targets at the end of 2-year
performance period as indicated below. Achievement of targets below threshold level will mean no restricted
shares will be delivered, while achievement up to 150% will mean up to 1.5 times the number of conditional
restricted shares awarded could be delivered.
(a) Period from 2014 to 2015*
(b) Period from 2015 to 2016**
(c) Period from 2016 to 2017***
(d) Period from 2017 to 2018
* For this period, 27,082 shares (the final release of 1/3 of the 81,250 shares) were vested under the award on 28 March 2018. The 1st and 2nd release of 27,084 shares each have been vested in 2016 and 2017 respectively.
** For this period, 34,000 shares (2nd release of 1/3 of the 102,000 shares) were vested under the award on 28 March 2018 and the remaining 34,000 shares will be vested in year 2019. The 1st release of 34,000 shares has been vested on 28 March 2017.
*** For this period, 18,880 shares (1st release of 1/3 of the 56,640 shares) were vested under the award on 28 March 2018 and the remaining 37,760 shares will be vested in year 2019/2020.
DIRECTORS’ STATEMENTYear ended 31 December 2018
A N N U A L R E P O R T 2 0 1 8 181S E M B C O R P M A R I N E180

DIRECTORS’ INTERESTS (CONT’D)
Note 6: The 148,700 Sembcorp Marine Ltd shares and 589,395 Sembcorp Industries Ltd shares are held in the name of
DBS Nominees Pte Ltd.
Note 7: Subordinated Perpetual Securities and Fixed Rate Notes issued under the $2.5 Billion Multicurrency Debt
Issuance Programme (“MDIP”) of Sembcorp Industries Ltd and Sembcorp Financial Services Pte. Ltd., a related
company of Sembcorp Industries Group. The Subordinated Perpetual Securities issued on 21 August 2013
under the MDIP of Sembcorp Industries Ltd has been redeemed on 21 August 2018.
Except as disclosed in this statement, no director who held office at the end of the financial year had interests in shares,
debentures, warrants or share options of the Company, or of related corporations, either at the beginning of the financial year,
or date of appointment if later, or at the end of the financial year.
There were no changes in any of the above mentioned interests in the Company between the end of the financial year and
21 January 2019.
Except as disclosed under the “Share-based Incentive Plans” section of this statement, neither at the end of, nor at any
time during the financial year, was the Company a party to any arrangement whose objects are, or one of whose objects
is, to enable the directors of the Company to acquire benefits by means of the acquisition of shares in or debentures of the
Company or any other body corporate.
Except as disclosed in Notes 27(a) and 39(b) to the financial statements, since the end of the last financial year, no director
has received or become entitled to receive, a benefit by reason of a contract made by the Company or a related corporation
with the director, or with a firm of which he is a member, or with a company in which he has a substantial financial interest.
SHARE-BASED INCENTIVE PLANS
The Company’s Performance Share Plan (“SCM PSP 2010”) and Restricted Share Plan (“SCM RSP 2010”) (collectively, the “2010
Share Plans”) were approved and adopted by the shareholders at an Extraordinary General Meeting of the Company held on
20 April 2010.
The Executive Resource and Compensation Committee (the “Committee”) of the Company has been designated as the
Committee responsible for the administration of the Share Plans. The Committee comprises the following members, all of
whom are directors:
Tan Sri Mohd Hassan Marican Chairman
Eric Ang Teik Lim
William Tan Seng Koon
Patrick Daniel (Appointed on 20 April 2018)
The SCM RSP 2010 is the incentive scheme for directors and employees of the Company and its subsidiaries (the “Group”)
whereas the SCM PSP 2010 is aimed primarily at key executives of the Group.
The 2010 Share Plans are intended to increase the Company’s flexibility and effectiveness in its continuing efforts to attract,
retain and incentivise participants to higher standards of performance and encourage greater dedication and loyalty by
enabling the Company to give recognition to past contributions and services; as well as motivating participants to contribute
to the long-term prosperity of the Group. The 2010 Share Plans will strengthen the Company’s competitiveness in attracting
and retaining talented key senior management and senior executives.
DIRECTORS’ STATEMENTYear ended 31 December 2018
A N N U A L R E P O R T 2 0 1 8 183S E M B C O R P M A R I N E182
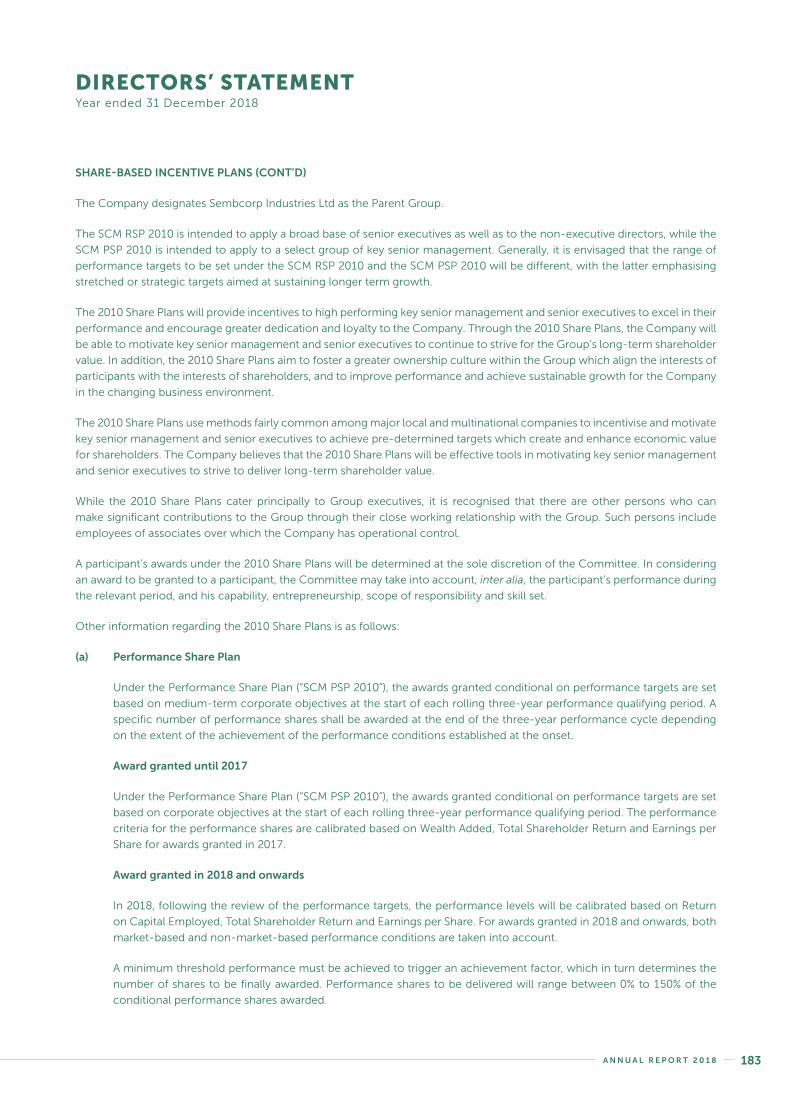
SHARE-BASED INCENTIVE PLANS (CONT’D)
The Company designates Sembcorp Industries Ltd as the Parent Group.
The SCM RSP 2010 is intended to apply a broad base of senior executives as well as to the non-executive directors, while the
SCM PSP 2010 is intended to apply to a select group of key senior management. Generally, it is envisaged that the range of
performance targets to be set under the SCM RSP 2010 and the SCM PSP 2010 will be different, with the latter emphasising
stretched or strategic targets aimed at sustaining longer term growth.
The 2010 Share Plans will provide incentives to high performing key senior management and senior executives to excel in their
performance and encourage greater dedication and loyalty to the Company. Through the 2010 Share Plans, the Company will
be able to motivate key senior management and senior executives to continue to strive for the Group’s long-term shareholder
value. In addition, the 2010 Share Plans aim to foster a greater ownership culture within the Group which align the interests of
participants with the interests of shareholders, and to improve performance and achieve sustainable growth for the Company
in the changing business environment.
The 2010 Share Plans use methods fairly common among major local and multinational companies to incentivise and motivate
key senior management and senior executives to achieve pre-determined targets which create and enhance economic value
for shareholders. The Company believes that the 2010 Share Plans will be effective tools in motivating key senior management
and senior executives to strive to deliver long-term shareholder value.
While the 2010 Share Plans cater principally to Group executives, it is recognised that there are other persons who can
make significant contributions to the Group through their close working relationship with the Group. Such persons include
employees of associates over which the Company has operational control.
A participant’s awards under the 2010 Share Plans will be determined at the sole discretion of the Committee. In considering
an award to be granted to a participant, the Committee may take into account, inter alia, the participant’s performance during
the relevant period, and his capability, entrepreneurship, scope of responsibility and skill set.
Other information regarding the 2010 Share Plans is as follows:
(a) Performance Share Plan
Under the Performance Share Plan (“SCM PSP 2010”), the awards granted conditional on performance targets are set
based on medium-term corporate objectives at the start of each rolling three-year performance qualifying period. A
specific number of performance shares shall be awarded at the end of the three-year performance cycle depending
on the extent of the achievement of the performance conditions established at the onset.
Award granted until 2017
Under the Performance Share Plan (“SCM PSP 2010”), the awards granted conditional on performance targets are set
based on corporate objectives at the start of each rolling three-year performance qualifying period. The performance
criteria for the performance shares are calibrated based on Wealth Added, Total Shareholder Return and Earnings per
Share for awards granted in 2017.
Award granted in 2018 and onwards
In 2018, following the review of the performance targets, the performance levels will be calibrated based on Return
on Capital Employed, Total Shareholder Return and Earnings per Share. For awards granted in 2018 and onwards, both
market-based and non-market-based performance conditions are taken into account.
A minimum threshold performance must be achieved to trigger an achievement factor, which in turn determines the
number of shares to be finally awarded. Performance shares to be delivered will range between 0% to 150% of the
conditional performance shares awarded.
DIRECTORS’ STATEMENTYear ended 31 December 2018
A N N U A L R E P O R T 2 0 1 8 183S E M B C O R P M A R I N E182

SHARE-BASED INCENTIVE PLANS (CONT’D)
(a) Performance Share Plan (cont’d)
Award granted in 2018 and onwards (cont’d)
To create alignment between senior management and other employees at the time of vesting, SCM PSP 2010 has in
place a plan trigger. Under this trigger mechanism, the performance shares for the performance period 2018 to 2020
will be vested to the senior management participants only if the restricted shares for the performance period 2020 are
vested, subject to the achievement of the performance conditions for the respective performance periods.
Senior management participants are required to hold a minimum percentage of the shares released to them under the
Performance Share Plan to maintain a beneficial ownership stake in the Group, for the duration of their employment
or tenure with the Group. A maximum cap is set based on a multiple of the individual participant’s annual base salary.
Any excess can be sold off, but in the event of a shortfall, they have a two calendar year period to meet the minimum
percentage requirement.
The details of the movement of the performance shares of the Company awarded during the year are as follows:
Movements during the year
Performance Shares participants
At 1
January
Conditional
performance
shares
awarded
Conditional
performance
shares
lapsed
Performance
shares lapsed
arising from
targets
not met
At 31
December
2018Director of the CompanyWong Weng Sun 1,563,000 481,000 – (375,000) 1,669,000Key executives of the Group 3,170,000 687,000 (598,000) (840,000) 2,419,000
4,733,000 1,168,000 (598,000) (1,215,000) 4,088,000
2017Director of the CompanyWong Weng Sun 1,513,000 550,000 – (500,000) 1,563,000Key executives of the Group 3,000,000 1,050,000 – (880,000) 3,170,000
4,513,000 1,600,000 – (1,380,000) 4,733,000
With the Committee’s approval on the achievement factor for the achievement of the performance targets for the
performance period 2015 to 2017 (2017: performance period 2014 to 2016), there were no (2017: nil) performance
shares released via the issuance of treasury shares.
In 2018, there were 1,215,000 (2017: 1,380,000) performance shares that lapsed for under-achievement of the
performance targets for the performance period 2015 to 2017 (2017: 2014 to 2016).
The total number of performance shares in awards granted conditionally and representing 100% of targets to be achieved,
but not released as at 31 December 2018, was 4,088,000 (2017: 4,733,000). Based on the multiplying factor, the actual
release of the awards could range from zero to a maximum of 6,132,000 (2017: 7,099,500) performance shares.
DIRECTORS’ STATEMENTYear ended 31 December 2018
A N N U A L R E P O R T 2 0 1 8 185S E M B C O R P M A R I N E184

SHARE-BASED INCENTIVE PLANS (CONT’D)
(b) Restricted Share Plan
Award granted until 2017
Under the Restricted Share Plan (“SCM RSP 2010”), the awards granted conditional on performance targets are set
based on corporate objectives at the start of each rolling two-year performance qualifying period. The performance
criteria for the restricted shares are calibrated based on Return on Capital Employed and Earnings before Interest and
Taxes for awards granted in 2016 and 2017.
Award granted in 2018 and onwards
In 2018, under the Restricted Share Plan (“SCM RSP 2010”), the awards granted conditional on performance targets
will be set based on corporate objectives at the start of the one-year performance qualifying period. The performance
criteria for the restricted shares will be calibrated based on Earnings before Interest and Taxes only for awards granted
in 2018 and onwards.
A minimum threshold performance must be achieved to trigger an achievement factor, which in turn determines the
number of shares to be finally awarded. Based on the criteria, restricted shares to be delivered will range from 0% to
150% of the conditional restricted shares awarded.
The managerial participants of the Group will be awarded restricted shares under the SCM RSP 2010, while the non-
managerial participants of the Group will receive their awards in an equivalent cash value. This cash-settled notional
restricted shares award for non-managerial participants is known as the Sembcorp Marine Challenge Bonus.
A specific number of restricted shares shall be awarded at the end of the respective performance cycle depending on
the extent of the achievement of the performance conditions established at the onset. There is a further vesting period
of three years after the performance period, during which one-third of the awarded shares are released each year to
managerial participants. Non-managerial participants will receive the equivalent in cash at the end of the respective
performance cycle, with no further vesting conditions.
Senior management participants are required to hold a minimum percentage of the shares released to them under
the Restricted Share Plan to maintain a beneficial ownership stake in the Group, for the duration of their employment
or tenure with the Group. A maximum cap is set based on a multiple of the individual participant’s annual base salary.
Any excess can be sold off, but in the event of a shortfall, they have a two calendar year period to meet the minimum
percentage requirement.
To align the interests of the non-executive directors with the interests of shareholders, up to 30% of the aggregate
directors’ fees approved by shareholders for a particular financial year may be paid out in the form of restricted share
awards under the SCM RSP 2010.
From 2011, non-executive directors were not awarded any shares except as part of their directors’ fees (except for Mr
Wong Weng Sun, who is the President & CEO, and who does not receive any directors’ fees). In 2018, 2017 and 2016,
the awards granted consisted of the grant of fully paid shares outright with no performance and vesting conditions
attached, but with a selling moratorium. Non-executive directors are required to hold shares (including shares obtained
by other means) worth at least one-time the annual base retainer; any excess may be sold as desired. A non-executive
director can dispose of all of his shares one year after leaving the Board.
The actual number of shares awarded to each non-executive director will be determined by reference to the volume-
weighted average price of a share on the SGX-ST over the 14 trading days from (and including) the day on which the
shares are first quoted ex-dividend after the Annual General Meeting (“AGM”) (or, if the resolution to approve the final
dividend is not approved, over the 14 trading days immediately following the date of the AGM). The number of shares
to be awarded will be rounded down to the nearest hundred and any residual balance will be settled in cash.
DIRECTORS’ STATEMENTYear ended 31 December 2018
A N N U A L R E P O R T 2 0 1 8 185S E M B C O R P M A R I N E184

SHARE-BASED INCENTIVE PLANS (CONT’D)
(b) Restricted Share Plan (cont’d)
The details of the movement of the restricted shares of the Company awarded during the year are as follows:
Movements during the year
Restricted Shares
participants
At 1
January
Conditional
restricted
shares
awarded
Restricted
shares lapsed
arising from
targets
not met
Conditional
restricted
shares
released
Conditional
restricted
shares
lapsed
At 31
December
2018Directors of the CompanyTan Sri Mohd
Hassan Marican – 75,200 – (75,200) – –Wong Weng Sun 397,500 233,000 (162,350) (28,675) – 439,475Ron Foo Siang Guan – 27,900 – (27,900) – –Koh Chiap Khiong – 25,500 – (25,500) – –Gina Lee-Wan – 20,300 – (20,300) – –Bob Tan Beng Hai – 29,900 – (29,900) – –Neil McGregor – 15,700 – (15,700) – –William Tan Seng Koon – 16,900 – (16,900) – –Former director of
the Company – 64,400 – (64,400) – –Other executives 14,985,913 7,615,188 (5,915,800) (883,228) (624,821) 15,177,252
15,383,413 8,123,988 (6,078,150) (1,187,703) (624,821) 15,616,727
2017Directors of the CompanyTan Sri Mohd
Hassan Marican – 104,200 – (104,200) – –Wong Weng Sun 374,600 181,000 (108,375) (49,725) – 397,500Ajaib Haridass – 49,000 – (49,000) – –Ron Foo Siang Guan – 44,300 – (44,300) – –Lim Ah Doo – 53,300 – (53,300) – –Koh Chiap Khiong – 40,800 – (40,800) – –Gina Lee-Wan – 26,900 – (26,900) – –Bob Tan Beng Hai – 37,300 – (37,300) – –Former director of
the Company – 44,300 – (44,300) – –Other executives 13,341,542 7,595,350 (3,814,942) (1,337,117) (798,920) 14,985,913
13,716,142 8,176,450 (3,923,317) (1,786,942) (798,920) 15,383,413
With the Committee’s approval on the achievement factor for the achievement of the performance targets for the
performance period 2016 to 2017, a total of 395,199 (2017: Nil) restricted shares were released. For awards in relation
to the performance period 2015 to 2016, a total of 198,575 (2017: 266,891) restricted shares were released. For awards
in relation to the performance period 2014 to 2015, a total of 318,129 (2017: 386,942) restricted shares were released.
In 2017, 733,009 restricted shares were released for awards in relation to the performance period 2013 to 2014. In
2018, there were 275,800 (2017: 400,100) restricted shares released to non-executive directors. The restricted shares
were released via the issuance of treasury shares.
DIRECTORS’ STATEMENTYear ended 31 December 2018
A N N U A L R E P O R T 2 0 1 8 187S E M B C O R P M A R I N E186

SHARE-BASED INCENTIVE PLANS (CONT’D)
(b) Restricted Share Plan (cont’d)
In 2018, there were 6,078,150 (2017: 3,923,317) restricted shares that lapsed for under-achievement of the performance
targets for the performance period 2016 to 2017 (2017: performance period 2015 to 2016).
The total number of restricted shares outstanding, including awards achieved but not released, as at 31 December
2018, was 15,616,727 (2017: 15,383,413). Of this, the total number of restricted shares in awards granted conditionally
and representing 100% of targets to be achieved, but not released was 14,817,138 (2017: 14,674,000). Based
on the multiplying factor, the actual release of the awards could range from zero to a maximum of 22,225,707
(2017: 22,011,000) restricted shares.
Sembcorp Marine Challenge Bonus
With the Committee’s approval on the achievement factor for the achievement of the performance targets for the
performance period 2016 to 2017 (2017: performance period 2015 to 2016), a total of $789,088 (2017: $454,284),
equivalent to 354,774 (2017: 248,950) notional restricted shares, were paid.
A total of 2,520,117 (2017: 3,074,000) notional restricted shares were awarded on 23 August 2018 (2017: 26 May 2017)
for the Sembcorp Marine Challenge Bonus.
The total number of notional restricted shares in awards for the Sembcorp Marine Challenge Bonus granted
conditionally and representing 100% of targets to be achieved, but not released as at 31 December 2018, was 4,684,737
(2017: 5,230,850). Based on the multiplying factor, the number of notional restricted shares to be converted into the
funding pool could range from zero to a maximum of 7,027,106 (2017: 7,846,275).
(c) Maximum Number of Shares Issuable
The maximum number of performance shares and restricted shares which could be delivered, when aggregated with
the number of new shares issued and issuable in respect of all options granted, is within the 15% limit of the share
capital of the Company on the day preceding the relevant date of the grant.
AUDIT COMMITTEE
The members of the Audit Committee during the year and at the date of this statement are:
Ron Foo Siang Guan Chairman
Koh Chiap Khiong
Eric Ang Teik Lim (Appointed on 21 February 2018)
Patrick Daniel (Appointed on 20 April 2018)
Tan Wah Yeow (Appointed on 10 December 2018)
The Audit Committee held four meetings during the financial year. In performing its functions, the Audit Committee met with
the Company’s external and internal auditors to discuss the scope of their work, the results of their examination and evaluation
of the Company’s internal accounting control system.
The Audit Committee performs the functions specified in Section 201B of the Singapore Companies Act, Chapter 50, the
Listing Manual of the Singapore Exchange, and the Code of Corporate Governance.
DIRECTORS’ STATEMENTYear ended 31 December 2018
A N N U A L R E P O R T 2 0 1 8 187S E M B C O R P M A R I N E186

AUDIT COMMITTEE (CONT’D)
The Audit Committee also reviewed the following:
• assistance provided by the Company’s officers to the external and internal auditors;
• quarterly financial information and annual financial statements of the Group and the Company prior to their submission
to the directors of the Company for adoption;
• interested person transactions (as defined in Chapter 9 of the Listing Manual of the Singapore Exchange);
• internal audit plans and internal audit reports; and
• whistle-blowers’ disclosures.
The Audit Committee has full access to the management and is given the resources required for it to discharge its functions.
It has full authority and the discretion to invite any director or executive officer to attend its meetings. The Audit Committee
also recommends the appointment of the external auditors and reviews the level of audit and non-audit fees.
The Audit Committee is satisfied with the independence and objectivity of the external auditors and has recommended to
the Board of Directors that the auditors, KPMG LLP, be nominated for re-appointment as auditors at the forthcoming Annual
General Meeting of the Company.
In appointing our auditors for the Company, subsidiaries and significant associates, we have complied with Rules 712 and 715
of the Listing Manual of the Singapore Exchange.
AUDITORS
The auditors, KPMG LLP, have indicated their willingness to accept re-appointment.
On behalf of the Board of Directors
Tan Sri Mohd Hassan Marican
Chairman
Wong Weng Sun
Director
Singapore
4 March 2019
DIRECTORS’ STATEMENTYear ended 31 December 2018
A N N U A L R E P O R T 2 0 1 8 189S E M B C O R P M A R I N E188

REPORT ON THE AUDIT OF THE FINANCIAL STATEMENTS
Opinion
We have audited the accompanying financial statements of Sembcorp Marine Ltd (the “Company”) and its subsidiaries (the
“Group”), which comprise the balance sheets of the Group and the Company as at 31 December 2018, the consolidated
income statement, consolidated statement of comprehensive income, consolidated statement of changes in equity and
consolidated statement of cash flows of the Group for the year then ended, and notes to the financial statements, including a
summary of significant accounting policies as set out on pages 198 to 331.
In our opinion, the accompanying consolidated financial statements of the Group and the balance sheet of the Company
are properly drawn up in accordance with the provisions of the Singapore Companies Act, Chapter 50 (the “Act”), Singapore
Financial Reporting Standards (International) (“SFRS(I)s”) and International Financial Reporting Standards ("IFRSs") so as to give
a true and fair view of the consolidated financial position of the Group and the financial position of the Company as at 31
December 2018 and of the consolidated financial performance, consolidated changes in equity and consolidated cash flows
of the Group for the year ended on that date.
Basis for opinion
We conducted our audit in accordance with Singapore Standards on Auditing (“SSAs”). Our responsibilities under those
standards are further described in the Auditors’ responsibilities for the audit of the financial statements section of our report.
We are independent of the Group in accordance with the Accounting and Corporate Regulatory Authority (“ACRA”) Code
of Professional Conduct and Ethics for Public Accountants and Accounting Entities (“ACRA Code”) together with the ethical
requirements that are relevant to our audit of the financial statements in Singapore, and we have fulfilled our other ethical
responsibilities in accordance with these requirements and the ACRA Code. We believe that the audit evidence we have
obtained is sufficient and appropriate to provide a basis for our opinion.
Key audit matters
Key audit matters are those matters that, in our professional judgement, were of most significance in our audit of the financial
statements of the current period. These matters were addressed in the context of our audit of the financial statements as a
whole, and in forming our opinion thereon, and we do not provide a separate opinion on these matters.
Impairment assessment of property, plant and equipment and intangible assets (the “shipyard assets”)
(Refer to Notes 4, 12 and 44 to the financial statements: Property, plant and equipment of $4,179,257,000 and Intangible assets
of $208,934,000)
Risk:
The Group’s shipyard assets were subject to impairment test assessments, owing to the continued difficult market conditions
impacting the offshore and marine sector.
The Group’s largest yard assets and facilities are (i) the integrated yards, which include the individual yard locations in Singapore,
the sub-contracting yards in Indonesia and the United Kingdom (the Singapore cash generating unit) and (ii) the yard in Brazil
(Brazil cash generating unit). Such shipyard assets are measured at cost less accumulated depreciation and impairment loss.
An impairment loss exists when the net carrying amount of the shipyard assets is in excess of its recoverable amount, which is
defined as the higher of the asset’s fair value less costs of disposal, and value in use. As the fair values of these shipyard assets
are not readily determinable, the Group measures the recoverable amount based on value in use, using the discounted cash
flow technique.
INDEPENDENT AUDITORS’ REPORTMembers of the Company Sembcorp Marine Ltd
A N N U A L R E P O R T 2 0 1 8 189S E M B C O R P M A R I N E188

The determination of the recoverable amounts of these cash generating units involves a high degree of judgement and
is subject to significant estimation uncertainties, principally, the forecast order book. The forecast order book includes a
diversified portfolio of long-term contracts whose contract pricing takes into account prevailing market conditions and the
outlook of the oil and gas industry, which are inherently subject to estimation uncertainties.
As the Brazil cash generating unit is not yet fully operational, and there is limited track record of historical contract awards and
performance, the Group has factored in the long term fundamentals of the oil and gas sector in Brazil to project the future
order book. Accordingly, the future order book considers the projected capital expenditure of state-owned and international
oil majors covering exploration and production projects that would lead to new build orders, regulations governing local
content requirements, as well as forecast movements in oil prices in the foreseeable future projected by industry analysts. The
long-term returns of the Brazil cash generating unit, however, can also be significantly impacted by political risk.
The outcome of the impairment tests on the shipyard assets for the Singapore cash generating unit and Brazil cash generating
unit shows that the recoverable amounts are in excess of the net carrying amounts attributable to these cash generating units.
Our response:
We assessed the Group’s process for identifying and reviewing the cash generating units subject to impairment testing.
We reviewed the key assumptions supporting the value-in-use calculations to arrive at the recoverable amounts of these
cash generating units. We compared the forecast order book to firm commitments secured from customers, management
approved budgets built from the Group’s past and actual experiences, prevailing industry trends, and industry analysts’ reports.
We compared the discount rates to market observable data including market and country risk premiums and any asset-
specific risk premium.
We also reviewed available qualitative information from industry analysts, projected capital expenditure by oil majors
supporting the projection of orders, and regulations on local content requirements. We assessed the related disclosures on
key assumptions applied in determining the recoverable amounts of the cash generating units.
Our findings:
The Group has a process for identifying and reviewing the cash generating units for impairment testing. The impairment
assessments have incorporated the known relevant considerations as at the reporting date. The disclosures describing the
inherent degree of estimation uncertainties and the sensitivity of the assumptions applied are appropriate. If unfavourable
changes to these assumptions occur, this could lead to lower operating cash inflows and material impairment outcomes
which might in turn affect the financial position and performances of the Group.
Recognition of revenue from construction contracts with customers
(Refer to Notes 26, 44 and 46 to the financial statements: Revenue of $4,887,866,000)
Risk:
One of the Group’s significant revenue streams is derived from long-term construction contracts.
In accordance with SFRS(I) 15 Revenue from Contracts with Customers, the analysis of whether these contracts comprise of
one or more performance obligations, and whether the performance obligations are satisfied over time or at a point in time,
are areas requiring critical judgement by the Group. The requirements of SFRS(I) 15 were applied retrospectively when the
standard became effective from 1 January 2018, accordingly similar analysis were required of the ongoing contracts during
the year ended 31 December 2017.
The Group accounts for revenue recognised over time from long-term construction contracts based on percentage of
completion method, which involves estimation uncertainties around the stage of physical activities completed.
INDEPENDENT AUDITORS’ REPORTMembers of the Company Sembcorp Marine Ltd
A N N U A L R E P O R T 2 0 1 8 191S E M B C O R P M A R I N E190

Further, owing to the continued difficult market conditions impacting the offshore and marine sector, significant judgement is
involved in evaluating collectability of the contract consideration and recoverability of trade receivables and contract balances
in relation to contracts with customers.
As at the reporting date, there were also certain contracts subject to deferral in delivery or scope variations (“contract
modifications”). In accordance with SFRS(I) 15, the analysis of whether such contract modifications result in separate
performance obligations involve management judgement and estimates.
Our response:
• We reviewed the Group’s estimation process (including the approval of project budget, monitoring of project costs and
activities, and management’s review of project’s stage of completion and milestones achieved with customers) used in
determining the amounts of revenue recognised in the financial statements.
• We reviewed the terms and conditions of contracts and contract modifications, along with discussions with
management, to assess if management’s identification of performance obligations and timing of revenue recognition
is fair, and to identify the relevant adjustments on revenue recognition arising from the adoption of SFRS(I) 15 and
contract modifications during the year.
• We reviewed the contractual terms and work status of the projects, along with discussions with management and
checked that contract revenue was recognised according to the percentage of completion of each project measured
by the stage of completion of physical activities.
• We reviewed the credit review assessment prepared by management for the customers with significant new contracts,
and we analysed current on-going negotiations and settlements of significant contracts subject to modifications, to
identify if the collectability of contract consideration is probable.
• We assessed the adequacy of disclosures in describing the areas of judgement and estimation uncertainties involving
revenue recognition in relation to long-term construction contracts with customers.
Our findings:
The Group has a process to determine the amounts of revenue recognised in the financial statements.
We found the basis over identification of performance obligations and timing of satisfaction of performance obligations to be fair.
The relevant adjustments on revenue for the adoption of SFRS(I) 15 and contract modifications were appropriately considered.
We found that the measurement of percentage of completion used by the Group for revenue recognition appropriately
reflects the status of and progress of the projects; and revenue was recognised only when collectability of the amounts was
assessed by management to be probable.
We found the disclosures in describing the areas of judgement and inherent degree of estimation uncertainties involved, to
be appropriate.
INDEPENDENT AUDITORS’ REPORTMembers of the Company Sembcorp Marine Ltd
A N N U A L R E P O R T 2 0 1 8 191S E M B C O R P M A R I N E190

Recoverability of trade receivables and contract balances in relation to contracts with customers
(Refer to Notes 9, 11, 15 and 44 to the financial statements: Trade receivables of $1,350,993,000, Contract assets of
$998,666,000 and Contract costs of $328,690,000)
Risk:
The Group has significant trade receivables, contract assets and contract costs in relation to contracts with customers. These
include trade receivables balances with certain customers on deferred payment schemes, which provide the customers with
credit terms of more than twelve months from the year end date, and interest is charged on these outstanding balances.
In accordance with SFRS(I) 9 Financial Instruments, the Group is required to recognise loss allowances on expected credit
losses on financial assets and contract assets. The determination of the loss allowances requires significant judgement and
estimates to determine whether the financial asset is credit impaired, and the best estimate of the ultimate realisation of the
amounts receivable from customers and contract assets from customer contracts.
Under SFRS(I) 15 Revenue from Contracts with Customers, contract costs are recognised up to amounts the Group expects
to recover. Accordingly, judgement is required in assessing whether the customers will be able to fulfil their contractual
obligations in regards to their purchase of the assets.
In relation to certain contracts with a customer that had filed for bankruptcy protection, revenues from these contracts
continue to be suspended, with no additional adjustments on receivables and contract balances recorded for the current
year, following contract provisions recorded in the previous years. As at the date of this report, the outcome arising from the
bankruptcy protection filing and consequential restructuring remains a highly judgemental matter. Accordingly, there is a risk
of a material adjustment to the carrying amounts of these contracts depending on events and circumstances that may occur
in future periods.
Our response:
• We reviewed the Group’s estimation process used in determining the amounts of loss allowance recognised on
expected credit losses on financial assets and contract assets.
• We reviewed the significant inputs to management’s assessment of the amounts of loss allowance recognised on
expected credit losses, and considered the reasonableness of the inputs by reference to the recent credit review
assessments prepared by management.
• We reviewed the re-forecast of each significant contract and enquired with management on any current on-going
negotiations that may impair the recoverability of significant receivables and contract balances.
• We assessed the adequacy of disclosures in describing the areas of judgement and estimation uncertainties involving
recoverability of receivables and contract balances in relation to contracts with customers.
Our findings:
The Group has a process to assess credit risk and to determine the amounts of loss allowance to recognise on expected credit
losses on trade receivables and contract assets.
The judgements applied by management around the recovery of receivables and contract balances, as well as those contracts
belonging to customers undergoing financial restructuring, were relevant under the facts and circumstances currently made
available to the Group.
We found the disclosures in describing the areas of judgement and inherent degree of estimation uncertainties involved, to
be appropriate.
INDEPENDENT AUDITORS’ REPORTMembers of the Company Sembcorp Marine Ltd
A N N U A L R E P O R T 2 0 1 8 193S E M B C O R P M A R I N E192

Acquisition of subsidiary and intellectual property rights
(Refer to Note 38 to the financial statements)
Risk:
During the year, the Group completed an acquisition of a subsidiary and intangible assets from Sevan Marine ASA (“Sevan
Marine”). With the acquisition completed, the litigation between the Group and Sevan Marine relating to an infringement of
intellectual property rights of the Group was terminated.
Judgement is required in determining the classification of the acquisition as one of assets or a business combination. In
accounting for a business combination, estimates are also required in performing the purchase price allocation of the fair
value of identifiable assets acquired and liabilities assumed, and settlement of the litigation.
The Group has used provisional amounts of purchase price allocation for the accounting of acquisition of subsidiary and
intellectual property rights, and has a one year measurement period from acquisition date to complete the acquisition
accounting. Fair value adjustments may arise on the completion of final purchase price allocation due to the estimation
uncertainty involved.
Our response:
• We examined the terms and conditions of the sales and purchase agreement and other related documents in relation
to the transaction to determine if the classification of the acquisition is appropriate.
• We reviewed management’s assessment of the provisional purchase price allocation and performed a re-computation
of the residual goodwill derived by management.
• We assessed the adequacy of disclosures in describing the areas of judgement in determining the classification of
the acquisition of subsidiary and intellectual property rights and estimation uncertainty on the provisional amounts
recognised pending the completion of the final purchase price allocation.
Our findings:
The judgement applied by management in the classification of the acquisition was fair, and the estimates by management
used in the provisional purchase price allocation to the respective assets acquired and liabilities assumed were appropriately
supported under the information currently available to the Group.
We found the disclosures in describing the areas of judgement and inherent degree of estimation uncertainties involved, to
be appropriate.
Litigation, claims and other contingencies
Risk:
The Group is subject to operational, business and political risks in certain countries in which it operates. These risks could give
rise to litigation, claims and other contingencies (collectively, the “contingencies”) which could have a significant financial
impact if the potential exposures were to materialise. Ad-hoc Committees, if formed for any specific purpose, may conduct
independent investigations on allegations that have potential impact on the business and the Group’s financial statements,
and recommend decisions as considered appropriate in connection with the independent investigations.
The determination by management of whether, and how much, to provide and/or disclose for such contingencies is highly
judgemental.
INDEPENDENT AUDITORS’ REPORTMembers of the Company Sembcorp Marine Ltd
A N N U A L R E P O R T 2 0 1 8 193S E M B C O R P M A R I N E192

Our response:
We assessed the Group’s process for identifying and monitoring significant adverse developments arising from contingencies
and where appropriate, legal, regulatory and political developments. We have reviewed the terms of reference of Ad-hoc
Committees formed.
We evaluated management’s assessment of the likely outcome and potential exposures arising from all significant contingencies
and allegations subject to on-going investigations; and considered the requirements for any provision and related disclosures.
Our work included:
• Assessment of the progress of all significant contingencies, including reviewing the Group’s public announcements
and the underlying basis for the announcements made;
• Consideration of any evidence of legal disputes which we were made aware;
• Holding discussions with management, the Group’s in-house legal counsel and Ad-hoc Committee, and reviewing
pertinent correspondence between the parties involved and relevant reports issued by third parties;
• Obtaining independent legal confirmation letters from and discussing with the Group’s external lawyers handling these
issues to confirm the fact patterns which we have been advised; and
• Involvement of specialists to look into any on-going investigation work commissioned by the Ad-hoc Committee to
support management’s conclusions.
Our findings:
We found that the Group has a process for identifying and monitoring potential exposures arising from legal, regulatory and
political developments as well as determination of the appropriate measurement and/or disclosures of such contingencies in
the Group’s financial statements. From our audit procedures performed, we found the liabilities recognised and disclosures
on contingencies to be appropriate.
Other Information
Management is responsible for the other information contained in the annual report. Other information is defined as all
information in the annual report other than the financial statements and our auditors’ report thereon.
We have obtained the following sections prior to the date of this auditors’ report:
• Chairman and CEO’s Report
• Group Financial Review
• Operations Review
• Directors’ Statement
INDEPENDENT AUDITORS’ REPORTMembers of the Company Sembcorp Marine Ltd
A N N U A L R E P O R T 2 0 1 8 195S E M B C O R P M A R I N E194

The other sections in the annual report, as listed below, are expected to be made available to us after that date:
• 2018 Highlights • Corporate Governance
• Our Integrated Global Platform • Risk Management
• Significant Events • Sustaining Competitiveness
• Awards and Accolades • Environmental Sustainability
• Board of Directors • Human Capital
• Senior Management • Total Workplace Safety and Health
• Corporate Structure • Community Engagement
• Corporate Directory • SGX Sustainability Reporting Index
• Shareholders’ Information • GRI Standards: Core option content index
• Investor Relations • Independent Practitioner’s Limited Assurance Report on
Sustainability Information of Sembcorp Marine Ltd
• Approach to Sustainability • Supplementary Information
• Board Statement on Sustainability Report • Major Properties
Our opinion on the financial statements does not cover the other information and we do not and will not express any form of
assurance conclusion thereon.
In connection with our audit of the financial statements, our responsibility is to read the other information identified above
when it becomes available and, in doing so, consider whether the other information is materially inconsistent with the financial
statements or our knowledge obtained in the audit, or otherwise appears to be materially misstated.
If, based on the work we have performed on the other information that we obtained prior to the date of this auditors’ report,
we conclude that there is a material misstatement of this other information, we are required to report that fact. We have
nothing to report in this regard.
When we read the other information, if we conclude that there is a material misstatement therein, we are required to
communicate the matter to those charged with governance and take appropriate actions in accordance with SSAs.
INDEPENDENT AUDITORS’ REPORTMembers of the Company Sembcorp Marine Ltd
A N N U A L R E P O R T 2 0 1 8 195S E M B C O R P M A R I N E194

Responsibilities of management and directors for the financial statements
Management is responsible for the preparation of financial statements that give a true and fair view in accordance with the
provisions of the Act, SFRS(I)s and IFRSs, and for devising and maintaining a system of internal accounting controls sufficient to
provide a reasonable assurance that assets are safeguarded against loss from unauthorised use or disposition; and transactions
are properly authorised and that they are recorded as necessary to permit the preparation of true and fair financial statements
and to maintain accountability of assets.
In preparing the financial statements, management is responsible for assessing the Group’s ability to continue as a going
concern, disclosing, as applicable, matters related to going concern and using the going concern basis of accounting unless
management either intends to liquidate the Group or to cease operations, or has no realistic alternative but to do so.
The directors’ responsibilities include overseeing the Group’s financial reporting process.
Auditors’ responsibilities for the audit of the financial statements
Our objectives are to obtain reasonable assurance about whether the financial statements as a whole are free from material
misstatement, whether due to fraud or error, and to issue an auditors’ report that includes our opinion. Reasonable assurance
is a high level of assurance, but is not a guarantee that an audit conducted in accordance with SSAs will always detect a
material misstatement when it exists. Misstatements can arise from fraud or error and are considered material if, individually
or in the aggregate, they could reasonably be expected to influence the economic decisions of users taken on the basis of
these financial statements.
As part of an audit in accordance with SSAs, we exercise professional judgement and maintain professional scepticism
throughout the audit. We also:
• Identify and assess the risks of material misstatement of the financial statements, whether due to fraud or error, design
and perform audit procedures responsive to those risks, and obtain audit evidence that is sufficient and appropriate to
provide a basis for our opinion. The risk of not detecting a material misstatement resulting from fraud is higher than
for one resulting from error, as fraud may involve collusion, forgery, intentional omissions, misrepresentations, or the
override of internal control.
• Obtain an understanding of internal control relevant to the audit in order to design audit procedures that are
appropriate in the circumstances, but not for the purpose of expressing an opinion on the effectiveness of the Group’s
internal control.
• Evaluate the appropriateness of accounting policies used and the reasonableness of accounting estimates and related
disclosures made by management.
• Conclude on the appropriateness of management’s use of the going concern basis of accounting and, based on the
audit evidence obtained, whether a material uncertainty exists related to events or conditions that may cast significant
doubt on the Group’s ability to continue as a going concern. If we conclude that a material uncertainty exists, we
are required to draw attention in our auditors’ report to the related disclosures in the financial statements or, if such
disclosures are inadequate, to modify our opinion. Our conclusions are based on the audit evidence obtained up to
the date of our auditors’ report. However, future events or conditions may cause the Group to cease to continue as a
going concern.
INDEPENDENT AUDITORS’ REPORTMembers of the Company Sembcorp Marine Ltd
A N N U A L R E P O R T 2 0 1 8 197S E M B C O R P M A R I N E196

• Evaluate the overall presentation, structure and content of the financial statements, including the disclosures, and
whether the financial statements represent the underlying transactions and events in a manner that achieves fair
presentation.
• Obtain sufficient appropriate audit evidence regarding the financial information of the entities or business activities
within the Group to express an opinion on the consolidated financial statements. We are responsible for the direction,
supervision and performance of the group audit. We remain solely responsible for our audit opinion.
We communicate with the directors regarding, among other matters, the planned scope and timing of the audit and significant
audit findings, including any significant deficiencies in internal control that we identify during our audit.
We also provide the directors with a statement that we have complied with relevant ethical requirements regarding independence,
and to communicate with them all relationships and other matters that may reasonably be thought to bear on our independence,
and where applicable, related safeguards.
From the matters communicated with the directors, we determine those matters that were of most significance in the audit
of the financial statements of the current period and are therefore the key audit matters. We describe these matters in our
auditors’ report unless law or regulation precludes public disclosure about the matter or when, in extremely rare circumstances,
we determine that a matter should not be communicated in our report because the adverse consequences of doing so would
reasonably be expected to outweigh the public interest benefits of such communication.
REPORT ON OTHER LEGAL AND REGULATORY REQUIREMENTS
In our opinion, the accounting and other records required by the Act to be kept by the Company and by those subsidiary
corporations incorporated in Singapore of which we are the auditors have been properly kept in accordance with the provisions
of the Act.
The engagement partner on the audit resulting in this independent auditors’ report is Ang Fung Fung.
KPMG LLP
Public Accountants and
Chartered Accountants
Singapore
4 March 2019
INDEPENDENT AUDITORS’ REPORTMembers of the Company Sembcorp Marine Ltd
A N N U A L R E P O R T 2 0 1 8 197S E M B C O R P M A R I N E196

Group Company
Note
31 December
2018
31 December
2017
1 January
2017
31 December
2018
31 December
2017
1 January
2017$’000 $’000 $’000 $’000 $’000 $’000
Non-current assetsProperty, plant and equipment 4 4,179,257 3,995,019 3,986,667 57,988 79,418 90,497Investment properties 5 – – – 13,870 17,190 19,006Investments in subsidiaries 6 – – – 1,786,386 1,483,520 964,886Interests in associates
and joint ventures 7 66,533 67,965 74,816 – – –Other financial assets 8 2,881 46,150 67,783 – 18,894 40,612Trade and other receivables 9 1,136,124 168,740 53,095 31,719 31,725 36,605Contract costs 15 – 128,399 – – – –Intangible assets 12 208,934 179,201 202,125 122 184 184Deferred tax assets 13 23,223 13,919 72,763 – – –
5,616,952 4,599,393 4,457,249 1,890,085 1,630,931 1,151,790
Current assetsInventories 14 80,171 95,773 73,947 – – –Trade and other receivables 9 690,550 640,481 547,677 107,163 117,283 61,099Contract costs 15 328,690 2,358,054 2,607,564 – – –Contract assets 11 998,666 652,361 440,832 – – –Tax recoverable 10,568 11,192 8,530 – 846 5,536Assets held for sale 16 1,657 – 182,215 – – 107,369Other financial assets 8 12,283 33,571 51,737 – – –Cash and cash equivalents 17 837,724 1,301,000 1,216,971 79,584 55,126 24,482
2,960,309 5,092,432 5,129,473 186,747 173,255 198,486Total assets 8,577,261 9,691,825 9,586,722 2,076,832 1,804,186 1,350,276
Current liabilitiesTrade and other payables 18 1,532,746 1,604,218 1,873,839 24,706 26,433 23,890Contract liabilities 20 139,731 1,135,661 667,665 – – –Provisions 21 16,875 27,755 15,337 – 6,771 6,771Other financial liabilities 22 9,809 1,449 18,317 – – –Current tax payable 7,591 24,868 36,817 5,304 – –Interest-bearing borrowings 23 1,055,979 852,737 1,363,961 50,483 474 –
2,762,731 3,646,688 3,975,936 80,493 33,678 30,661Net current assets 197,578 1,445,744 1,153,537 106,254 139,577 167,825
Non-current liabilitiesDeferred tax liabilities 13 52,808 61,545 85,673 4,975 11,070 12,963Provisions 21 120,861 70,014 65,279 26,094 18,036 18,036Contract liabilities 20 – 75,497 240,700 – – –Other financial liabilities 22 10,162 5,713 26,397 – – –Interest-bearing borrowings 23 3,173,451 3,247,386 2,791,014 951 1,394 –Other long-term payables 18 108,813 104,807 90,567 5,574 6,779 6,324
3,466,095 3,564,962 3,299,630 37,594 37,279 37,323Total liabilities 6,228,826 7,211,650 7,275,566 118,087 70,957 67,984Net assets 2,348,435 2,480,175 2,311,156 1,958,745 1,733,229 1,282,292
Equity attributable to owners
of the CompanyShare capital 24 484,288 484,288 484,288 484,288 484,288 484,288Other reserves 25 (51,027) (30,704) 38,764 (23,770) (27,831) (21,459)Revenue reserve 1,878,423 1,985,392 1,742,472 1,498,227 1,276,772 819,463
2,311,684 2,438,976 2,265,524 1,958,745 1,733,229 1,282,292Non-controlling interests 33 36,751 41,199 45,632 – – –Total equity 2,348,435 2,480,175 2,311,156 1,958,745 1,733,229 1,282,292
BALANCE SHEETSAs at 31 December 2018
The accompanying notes form an integral part of these financial statements.
A N N U A L R E P O R T 2 0 1 8 199S E M B C O R P M A R I N E198

GroupNote 2018 2017
$’000 $’000
Turnover 26 4,887,866 3,034,767Cost of sales (4,884,772) (2,689,004)Gross profit 3,094 345,763Other operating income 49,608 63,705Other operating expenses (2,811) (5,021)General and administrative expenses (102,214) (98,737)Operating (loss)/profit 27 (52,323) 305,710Finance income 28 55,026 22,807Finance costs 28 (101,356) (95,522)Non-operating income 29 141 64,803Non-operating expenses 29 – (13,309)Share of results of associates and joint ventures, net of tax 30 (2,385) (3,617)(Loss)/profit before tax (100,897) 280,872Tax credit/(expense) 31 22,531 (24,817)(Loss)/profit for the year (78,366) 256,055
(Loss)/profit attributable to:Owners of the Company (74,131) 260,183Non-controlling interests 33 (4,235) (4,128)(Loss)/profit for the year (78,366) 256,055
Earnings per share (cents) 34Basic (3.55) 12.45Diluted (3.55) 12.45
CONSOLIDATED INCOME STATEMENTYear ended 31 December 2018
The accompanying notes form an integral part of these financial statements.
A N N U A L R E P O R T 2 0 1 8 199S E M B C O R P M A R I N E198
GroupNote 2018 2017
$’000 $’000
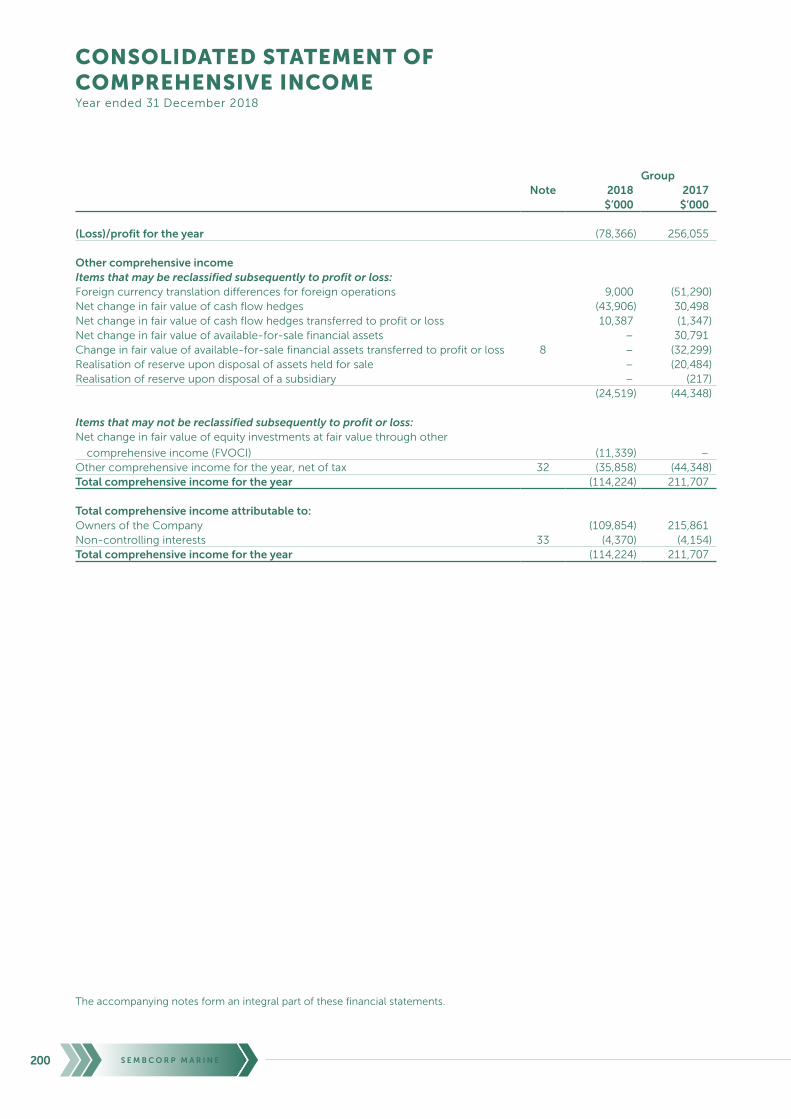
(Loss)/profit for the year (78,366) 256,055
Other comprehensive incomeItems that may be reclassified subsequently to profit or loss:Foreign currency translation differences for foreign operations 9,000 (51,290)Net change in fair value of cash flow hedges (43,906) 30,498Net change in fair value of cash flow hedges transferred to profit or loss 10,387 (1,347)Net change in fair value of available-for-sale financial assets – 30,791Change in fair value of available-for-sale financial assets transferred to profit or loss 8 – (32,299)Realisation of reserve upon disposal of assets held for sale – (20,484)Realisation of reserve upon disposal of a subsidiary – (217)
(24,519) (44,348)
Items that may not be reclassified subsequently to profit or loss:Net change in fair value of equity investments at fair value through other
comprehensive income (FVOCI) (11,339) –Other comprehensive income for the year, net of tax 32 (35,858) (44,348)Total comprehensive income for the year (114,224) 211,707
Total comprehensive income attributable to:Owners of the Company (109,854) 215,861Non-controlling interests 33 (4,370) (4,154)Total comprehensive income for the year (114,224) 211,707
CONSOLIDATED STATEMENT OFCOMPREHENSIVE INCOMEYear ended 31 December 2018
The accompanying notes form an integral part of these financial statements.
A N N U A L R E P O R T 2 0 1 8 201S E M B C O R P M A R I N E200

Att
rib
uta
ble
to
ow
ner
s o
f th
e C
om
pan
y
Shar
eca
pit
al
Res
erve
for
ow
nsh
ares
Cap
ital
rese
rves
Cu
rren
cytr
ansl
atio
nre
serv
e
Shar
e-b
ased
pay
men
tsre
serv
eH
edg
ing
rese
rve
Fair
valu
ere
serv
eR
even
ue
rese
rve
Tota
l
No
n-
con
tro
llin
gin
tere
sts
Tota
leq
uit
y$
’00
0$
’00
0$
’00
0$
’00
0$
’00
0$
’00
0$
’00
0$
’00
0$
’00
0$
’00
0$
’00
0
Gro
up
At
31
De
ce
mb
er
20
17
As
pre
vio
usl
y st
ate
d4
84
,28
8(3
,45
1)
(13
,01
1)
(17
,73
2)
(27
,89
4)
35
,91
74
47
2,0
19
,60
92
,47
8,1
73
41
,19
92
,51
9,3
72
Ad
just
me
nt
on
init
ial a
pp
licat
ion
of
SF
RS(
I) 1
5, n
et
of
tax
(No
te 4
6)
––
–(4
,98
0)
––
–(3
4,2
17
)(3
9,1
97
)–
(39
,19
7)
Ad
just
ed
bal
anc
e a
t 3
1 D
ec
em
be
r 2
01
74
84
,28
8(3
,45
1)
(13
,01
1)
(22
,71
2)
(27
,89
4)
35
,91
74
47
1,9
85
,39
22
,43
8,9
76
41
,19
92
,48
0,1
75
Ad
just
me
nt
on
init
ial a
pp
licat
ion
of
SF
RS(
I) 9
, ne
t o
f ta
x (N
ote
46
)–
––
––
–(4
47
)(6
41
)(1
,08
8)
–(1
,08
8)
Ad
just
ed
bal
anc
e a
t 1
Jan
uar
y 2
01
84
84
,28
8(3
,45
1)
(13
,01
1)
(22
,71
2)
(27
,89
4)
35
,91
7–
1,9
84
,75
12
,43
7,8
88
41
,19
92
,47
9,0
87
Tota
l co
mp
reh
ensi
ve in
com
e fo
r th
e ye
arLo
ss f
or
the
ye
ar–
––
––
––
(74
,13
1)
(74
,13
1)
(4,2
35
)(7
8,3
66
)
Oth
er c
om
pre
hen
sive
inco
me
Fore
ign
cu
rre
nc
y tr
ansl
atio
n d
iffe
ren
ce
s
for
fore
ign
op
era
tio
ns
––
–9
,13
5–
––
–9
,13
5(1
35
)9
,00
0N
et
ch
ang
e in
fai
r va
lue
of
cas
h f
low
he
dg
es
––
––
–(4
3,9
06
)–
–(4
3,9
06
)–
(43
,90
6)
Ne
t c
han
ge
in f
air
valu
e o
f c
ash
flo
w h
ed
ge
s tr
ansf
err
ed
to
pro
fit
or
loss
––
––
–1
0,3
87
––
10
,38
7–
10
,38
7N
et
ch
ang
e in
fai
r va
lue
of
eq
uit
y
inve
stm
en
ts a
t FV
OC
I–
––
––
–(1
1,3
39
)–
(11
,33
9)
–(1
1,3
39
)R
ecla
ssifi
cati
on
of
rese
rve
on
dis
po
sal o
f eq
uit
y in
vest
me
nts
at
FVO
CI
––
––
––
11
,33
9(1
1,3
39
)–
––
Tota
l oth
er
co
mp
reh
en
sive
inc
om
e f
or
the
ye
ar–
––
9,1
35
–(3
3,5
19
)–
(11
,33
9)
(35
,72
3)
(13
5)
(35
,85
8)
Tota
l co
mp
reh
en
sive
inc
om
e f
or
the
ye
ar–
––
9,1
35
–(3
3,5
19
)–
(85
,47
0)
(10
9,8
54
)(4
,37
0)
(11
4,2
24
)
Tran
sact
ion
s w
ith
ow
ner
s o
f th
e C
om
pan
y,
reco
gn
ised
dir
ectl
y in
eq
uit
yC
on
trib
uti
on
s b
y an
d d
istr
ibu
tio
ns
to
ow
ner
s o
f th
e C
om
pan
yP
urc
has
e o
f tr
eas
ury
sh
are
s–
(91
6)
––
––
––
(91
6)
–(9
16
)Is
sue
of
tre
asu
ry s
har
es
–2
,21
6–
–(1
,70
2)
––
–5
14
–5
14
Div
ide
nd
s p
aid
to
–
ow
ne
rs o
f th
e C
om
pan
y (N
ote
35
)–
––
––
––
(20
,88
8)
(20
,88
8)
–(2
0,8
88
)–
no
n-c
on
tro
llin
g in
tere
sts
––
––
––
––
–(7
8)
(78
)U
nc
laim
ed
div
ide
nd
s–
––
––
––
30
30
–3
0Sh
are
-bas
ed
pay
me
nts
–
––
–4
,91
0–
––
4,9
10
–4
,91
0To
tal c
on
trib
uti
on
s b
y an
d d
istr
ibu
tio
ns
to
ow
ne
rs o
f th
e C
om
pan
y–
1,3
00
––
3,2
08
––
(20
,85
8)
(16
,35
0)
(78
)(1
6,4
28
)A
t 3
1 D
ecem
ber
20
18
48
4,2
88
(2,1
51
)(1
3,0
11
)(1
3,5
77
)(2
4,6
86
)2
,39
8–
1,8
78
,42
32
,31
1,6
84
36
,75
12
,34
8,4
35
CONSOLIDATED STATEMENT OFCHANGES IN EQUITYYear ended 31 December 2018
Th
e a
cc
om
pan
yin
g n
ote
s fo
rm a
n in
teg
ral p
art
of
the
se f
inan
cia
l sta
tem
en
ts.
A N N U A L R E P O R T 2 0 1 8 201S E M B C O R P M A R I N E200

Att
rib
uta
ble
to
ow
ner
s o
f th
e C
om
pan
y
Shar
eca
pit
al
Res
erve
for
ow
nsh
ares
Cap
ital
rese
rves
Cu
rren
cytr
ansl
atio
nre
serv
e
Shar
e-b
ased
pay
men
tsre
serv
eH
edg
ing
rese
rve
Fair
valu
ere
serv
eR
even
ue
rese
rve
Tota
l
No
n-
con
tro
llin
gin
tere
sts
Tota
leq
uit
y$
’00
0$
’00
0$
’00
0$
’00
0$
’00
0$
’00
0$
’00
0$
’00
0$
’00
0$
’00
0$
’00
0
Gro
up
At
1 J
anu
ary
20
17
As
pre
vio
usl
y st
ate
d4
84
,28
8(5
66
)1
1,5
14
65
,39
4(3
0,1
58
)6
,76
61
,95
52
,02
2,7
96
2,5
61
,98
94
5,6
32
2,6
07
,62
1A
dju
stm
en
t o
n in
itia
l ap
plic
atio
n o
f SF
RS(
I) 1
5,
ne
t o
f ta
x (N
ote
46
)–
––
(16
,14
1)
––
–(2
80
,32
4)
(29
6,4
65
)–
(29
6,4
65
)A
dju
ste
d b
alan
ce
at
1 J
anu
ary
20
17
48
4,2
88
(56
6)
11
,51
44
9,2
53
(30
,15
8)
6,7
66
1,9
55
1,7
42
,47
22
,26
5,5
24
45
,63
22
,31
1,1
56
Tota
l co
mp
reh
ensi
ve in
com
e fo
r th
e ye
arP
rofi
t fo
r th
e y
ear
––
––
––
–2
60
,18
32
60
,18
3(4
,12
8)
25
6,0
55
Oth
er c
om
pre
hen
sive
inco
me
Fore
ign
cu
rre
nc
y tr
ansl
atio
n d
iffe
ren
ce
s fo
r fo
reig
n o
pe
rati
on
s –
––
(51
,41
8)
––
––
(51
,41
8)
12
8(5
1,2
90
)N
et
ch
ang
e in
fai
r va
lue
of
cas
h f
low
he
dg
es
––
––
–3
0,4
98
––
30
,49
8–
30
,49
8N
et
ch
ang
e in
fai
r va
lue
of
cas
h f
low
he
dg
es
tran
sfe
rre
d t
o p
rofi
t o
r lo
ss–
––
––
(1,3
47
)–
–(1
,34
7)
–(1
,34
7)
Ne
t c
han
ge
in f
air
valu
e o
f av
aila
ble
-fo
r-sa
le
fin
anc
ial a
sse
ts–
––
––
–3
0,7
91
–3
0,7
91
–3
0,7
91
Ch
ang
e in
fai
r va
lue
of
avai
lab
le-f
or-
sale
fi
nan
cia
l ass
ets
tra
nsf
err
ed
to
pro
fit
or
loss
–
––
––
–(3
2,2
99
)–
(32
,29
9)
–(3
2,2
99
)R
eal
isat
ion
of
rese
rve
up
on
dis
po
sal o
f as
sets
h
eld
fo
r sa
le–
––
(20
,48
4)
––
––
(20
,48
4)
–(2
0,4
84
)R
eal
isat
ion
of
rese
rve
up
on
dis
po
sal o
f a
sub
sid
iary
(N
ote
37
)–
––
(63
)–
––
–(6
3)
(15
4)
(21
7)
Tota
l oth
er
co
mp
reh
en
sive
inc
om
e f
or
the
ye
ar–
––
(71
,96
5)
–2
9,1
51
(1,5
08
)–
(44
,32
2)
(26
)(4
4,3
48
)To
tal c
om
pre
he
nsi
ve in
co
me
fo
r th
e y
ear
––
–(7
1,9
65
)–
29
,15
1(1
,50
8)
26
0,1
83
21
5,8
61
(4,1
54
)2
11
,70
7
Tran
sact
ion
s w
ith
ow
ner
s o
f th
e C
om
pan
y,
reco
gn
ised
dir
ectl
y in
eq
uit
yC
on
trib
uti
on
s b
y an
d d
istr
ibu
tio
ns
to o
wn
ers
of
the
Co
mp
any
Pu
rch
ase
of
tre
asu
ry s
har
es
–(5
,94
2)
––
––
––
(5,9
42
)–
(5,9
42
)Is
sue
of
tre
asu
ry s
har
es
–3
,05
7–
–(2
,37
0)
––
–6
87
–6
87
Div
ide
nd
s p
aid
to
–
ow
ne
rs o
f th
e C
om
pan
y (N
ote
35
)–
––
––
––
(41
,79
4)
(41
,79
4)
–(4
1,7
94
)–
no
n-c
on
tro
llin
g in
tere
sts
––
––
––
––
–(2
79
)(2
79
)U
nc
laim
ed
div
ide
nd
s–
––
––
––
66
–6
Shar
e-b
ase
d p
aym
en
ts
––
––
4,6
34
––
–4
,63
4–
4,6
34
Tran
sfe
r o
f re
serv
es
––
(24
,52
5)
––
––
24
,52
5–
––
Tota
l co
ntr
ibu
tio
ns
by
and
dis
trib
uti
on
s to
o
wn
ers
of
the
Co
mp
any
–(2
,88
5)
(24
,52
5)
–2
,26
4–
–(1
7,2
63
)(4
2,4
09
)(2
79
)(4
2,6
88
)A
t 3
1 D
ecem
ber
20
17
48
4,2
88
(3,4
51
)(1
3,0
11
)(2
2,7
12
)(2
7,8
94
)3
5,9
17
44
71
,98
5,3
92
2,4
38
,97
64
1,1
99
2,4
80
,17
5
Th
e a
cc
om
pan
yin
g n
ote
s fo
rm a
n in
teg
ral p
art
of
the
se f
inan
cia
l sta
tem
en
ts.
CONSOLIDATED STATEMENT OFCHANGES IN EQUITYYear ended 31 December 2018
A N N U A L R E P O R T 2 0 1 8 203S E M B C O R P M A R I N E202
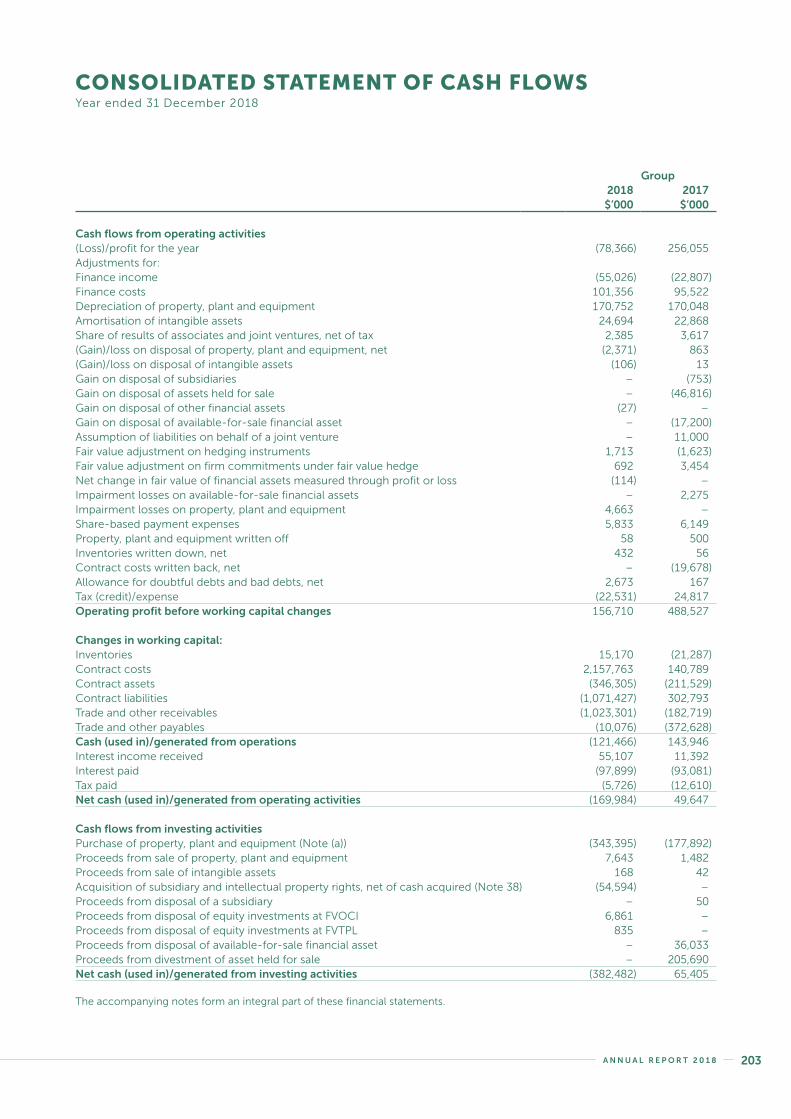
Group2018 2017$’000 $’000
Cash flows from operating activities(Loss)/profit for the year (78,366) 256,055Adjustments for:Finance income (55,026) (22,807)Finance costs 101,356 95,522Depreciation of property, plant and equipment 170,752 170,048Amortisation of intangible assets 24,694 22,868Share of results of associates and joint ventures, net of tax 2,385 3,617(Gain)/loss on disposal of property, plant and equipment, net (2,371) 863(Gain)/loss on disposal of intangible assets (106) 13Gain on disposal of subsidiaries – (753)Gain on disposal of assets held for sale – (46,816)Gain on disposal of other financial assets (27) –Gain on disposal of available-for-sale financial asset – (17,200)Assumption of liabilities on behalf of a joint venture – 11,000Fair value adjustment on hedging instruments 1,713 (1,623)Fair value adjustment on firm commitments under fair value hedge 692 3,454Net change in fair value of financial assets measured through profit or loss (114) –Impairment losses on available-for-sale financial assets – 2,275Impairment losses on property, plant and equipment 4,663 –Share-based payment expenses 5,833 6,149Property, plant and equipment written off 58 500Inventories written down, net 432 56 Contract costs written back, net – (19,678)Allowance for doubtful debts and bad debts, net 2,673 167Tax (credit)/expense (22,531) 24,817Operating profit before working capital changes 156,710 488,527
Changes in working capital:Inventories 15,170 (21,287)Contract costs 2,157,763 140,789Contract assets (346,305) (211,529)Contract liabilities (1,071,427) 302,793Trade and other receivables (1,023,301) (182,719)Trade and other payables (10,076) (372,628)Cash (used in)/generated from operations (121,466) 143,946Interest income received 55,107 11,392Interest paid (97,899) (93,081)Tax paid (5,726) (12,610)Net cash (used in)/generated from operating activities (169,984) 49,647
Cash flows from investing activitiesPurchase of property, plant and equipment (Note (a)) (343,395) (177,892)Proceeds from sale of property, plant and equipment 7,643 1,482Proceeds from sale of intangible assets 168 42Acquisition of subsidiary and intellectual property rights, net of cash acquired (Note 38) (54,594) –Proceeds from disposal of a subsidiary – 50Proceeds from disposal of equity investments at FVOCI 6,861 –Proceeds from disposal of equity investments at FVTPL 835 –Proceeds from disposal of available-for-sale financial asset – 36,033Proceeds from divestment of asset held for sale – 205,690Net cash (used in)/generated from investing activities (382,482) 65,405
CONSOLIDATED STATEMENT OF CASH FLOWSYear ended 31 December 2018
The accompanying notes form an integral part of these financial statements.
A N N U A L R E P O R T 2 0 1 8 203S E M B C O R P M A R I N E202
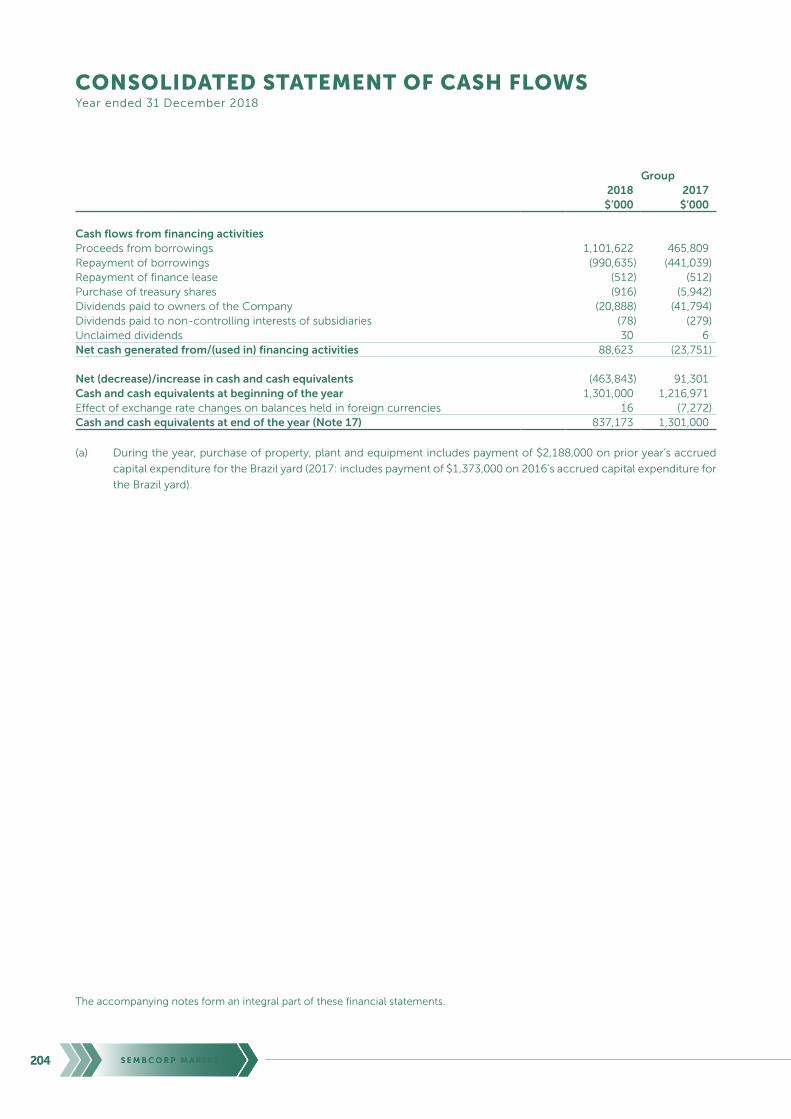
Group2018 2017$’000 $’000
Cash flows from financing activitiesProceeds from borrowings 1,101,622 465,809Repayment of borrowings (990,635) (441,039)Repayment of finance lease (512) (512)Purchase of treasury shares (916) (5,942)Dividends paid to owners of the Company (20,888) (41,794)Dividends paid to non-controlling interests of subsidiaries (78) (279)Unclaimed dividends 30 6Net cash generated from/(used in) financing activities 88,623 (23,751)
Net (decrease)/increase in cash and cash equivalents (463,843) 91,301Cash and cash equivalents at beginning of the year 1,301,000 1,216,971Effect of exchange rate changes on balances held in foreign currencies 16 (7,272)Cash and cash equivalents at end of the year (Note 17) 837,173 1,301,000
(a) During the year, purchase of property, plant and equipment includes payment of $2,188,000 on prior year’s accrued
capital expenditure for the Brazil yard (2017: includes payment of $1,373,000 on 2016’s accrued capital expenditure for
the Brazil yard).
CONSOLIDATED STATEMENT OF CASH FLOWSYear ended 31 December 2018
The accompanying notes form an integral part of these financial statements.
A N N U A L R E P O R T 2 0 1 8 205S E M B C O R P M A R I N E204 A N N U A L R E P O R T 2 0 1 8 205S E M B C O R P M A R I N E204

NOTES TO THE FINANCIAL STATEMENTSYear ended 31 December 2018
These notes form an integral part of the financial statements.
The financial statements were authorised for issue by the Board of Directors on 4 March 2019.
1. DOMICILE AND ACTIVITIES
Sembcorp Marine Ltd (the “Company”) is a company incorporated in the Republic of Singapore and has its registered
office at 29 Tanjong Kling Road, Singapore 628054.
The Company’s immediate holding company is Sembcorp Industries Ltd and the ultimate holding company is Temasek
Holdings (Private) Limited.
The financial statements comprise the Company and its subsidiaries (together referred to as the “Group” and individually
as “Group entities”) and the Group’s interests in associates and joint ventures.
The principal activities of the Company are the provision of management services and investment holding. The principal
activities of the subsidiaries, associates and joint ventures are stated in Note 45.
2. BASIS OF PREPARATION
2.1 Statement of compliance
The financial statements are prepared in accordance with the Singapore Financial Reporting Standards (International)
(SFRS(I)) and International Financial Reporting Standards (IFRSs). SFRS(I) are issued by the Accounting Standards Council,
which comprise standards and interpretations that are equivalent to IFRSs issued by the International Accounting
Standards Board. All references to SFRS(I)s and IFRSs are subsequently referred to as SFRS(I)s in these financial
statements unless otherwise specified. These are the Group’s first financial statements prepared in accordance with
SFRS(I), and SFRS(I) 1 First-time Adoption of Singapore Financial Reporting Standards (International) has been applied.
In previous financial years, the financial statements were prepared in accordance with Financial Reporting Standards
in Singapore (FRS). An explanation of how the transition to SFRS(I) and application of SFRS(I) 9 and SFRS(I) 15 have
affected the reported financial position, financial performance and cash flows of the Group is provided in Note 46.
2.2 Basis of measurement
The financial statements have been prepared on the historical cost basis except as otherwise described in the
accounting policies below.
2.3 Functional and presentation currency
The financial statements are presented in Singapore dollars, which is the Company’s functional currency. All financial
information presented in Singapore dollars has been rounded to the nearest thousand ($’000), unless otherwise stated.
2.4 Use of estimates and judgements
The preparation of the financial statements in conformity with SFRS(I) requires management to make judgements,
estimates and assumptions that affect the application of accounting policies and the reported amounts of assets,
liabilities, income and expenses. Actual results may differ from these estimates.
Estimates and underlying assumptions are reviewed on an ongoing basis. Revisions to accounting estimates are
recognised in the period in which the estimates are revised and in any future periods affected.
Information about significant areas of estimation uncertainty and critical judgements in applying accounting policies
that have the most significant effect on the amounts recognised in the financial statements is discussed in Note 44.
A N N U A L R E P O R T 2 0 1 8 205S E M B C O R P M A R I N E204 A N N U A L R E P O R T 2 0 1 8 205S E M B C O R P M A R I N E204

NOTES TO THE FINANCIAL STATEMENTSYear ended 31 December 2018
3. SIGNIFICANT ACCOUNTING POLICIES
The accounting policies set out below have been applied consistently to all periods presented in these financial
statements and in preparing the opening SFRS(I) balance sheets at 1 January 2017 for the purposes of the transition
to SFRS(I), unless otherwise indicated.
The accounting policies have been applied consistently by Group entities.
3.1 Basis of consolidation
(i) Business combinations
Acquisitions from 1 January 2017
Business combinations are accounted for using the acquisition method as at the acquisition date, which is the
date on which control is transferred to the Group. Control is the power to govern the financial and operating
policies of an entity so as to obtain benefits from its activities. In assessing control, the Group takes into
consideration potential voting rights that are currently exercisable.
Deferred consideration comprises obligations to pay specific amounts at future dates. Deferred consideration
is recognised and measured at fair value at the acquisition date and included in the consideration transferred.
The unwinding of any interest element of deferred consideration is recognised in profit or loss.
The consideration transferred does not include amounts related to the settlement of pre-existing relationships.
Such amounts are generally recognised in profit or loss.
Costs related to the acquisition, other than those associated with the issue of debt or equity securities, that the
Group incurs in connection with a business combination are expensed as incurred.
Any contingent consideration payable is recognised at fair value at the acquisition date and included in the
consideration transferred. If the contingent consideration is classified as equity, it is not re-measured and
settlement is accounted for within equity. Otherwise, subsequent changes to the fair value of the contingent
consideration are recognised in profit or loss.
Acquisitions before 1 January 2017
As part of transition to SFRS(I), the Group elected not to restate those business combinations that occurred
before the date of transition to SFRS(I), i.e. 1 January 2017. Goodwill arising from acquisitions before
1 January 2017 has been carried forward from the previous FRS framework as at the date of transition.
Acquisitions prior to 1 January 2010
All business combinations are accounted for using the purchase method. Under the purchase method, the
cost of an acquisition is measured at the fair value of the assets given, equity instruments issued and liabilities
incurred or assumed at the date of exchange, plus costs directly attributable to the acquisition. The excess of
the Group’s interest in the net fair value of the identifiable assets, liabilities and contingent liabilities over the
cost of acquisition is credited to profit or loss in the period of the acquisition.
A N N U A L R E P O R T 2 0 1 8 207S E M B C O R P M A R I N E206

NOTES TO THE FINANCIAL STATEMENTSYear ended 31 December 2018
3. SIGNIFICANT ACCOUNTING POLICIES (CONT’D)
3.1 Basis of consolidation (cont’d)
(ii) Non-controlling interests
For non-controlling interests that are present ownership interests and entitle their holders to a proportionate
share of the acquiree’s net assets in the event of liquidation, the Group elects on a transaction-by-transaction
basis whether to measure them at fair value, or at the non-controlling interests’ proportionate share of the
recognised amounts of the acquiree’s identifiable net assets, at the acquisition date. All other non-controlling
interests are measured at acquisition-date fair value, unless another measurement basis is required by SFRS(I).
Changes in the Group’s interest in a subsidiary that do not result in a loss of control are accounted for as
transactions with owners in their own capacity as owners and therefore no adjustments are made to goodwill
and no gain or loss is recognised in profit or loss.
Adjustments to non-controlling interests arising from transactions that do not involve the loss of control are
based on a proportionate amount of net assets of the subsidiary.
Prior to 1 January 2010, goodwill was recognised on the acquisition of non-controlling interests in a subsidiary,
which represented the excess of the cost of the additional investment over the carrying amount of the interest
in the net assets acquired at the date of the transaction.
(iii) Subsidiaries
Subsidiaries are those entities that are controlled by the Group. The Group controls an entity when it is exposed
to, or has rights to, variable returns from its involvement with the entity and has the ability to affect those
returns through its power over the entity.
The financial statements of subsidiaries are included in the consolidated financial statements from the date that
control commences until the date control ceases. The accounting policies of subsidiaries have been changed
when necessary to align them with the policies adopted by the Group.
Non-controlling interests are that part of the net results of operations and of net assets of a subsidiary attributable
to the interests which are not owned directly or indirectly by the equity holders of the Company. They are
shown separately in the consolidated statement of comprehensive income, statement of changes in equity
and balance sheet. Total comprehensive income is attributed to the non-controlling interests based on their
respective interests in a subsidiary even if this results in the non-controlling interests having a deficit balance.
(iv) Loss of control
Upon the loss of control, the Group derecognises the assets and liabilities of the subsidiary, any non-controlling
interests and the other components of equity related to the subsidiary. Any surplus or deficit arising on the loss
of control is recognised in profit or loss. If the Group retains any interest in the previous subsidiary, then such
interest is measured at fair value at the date that control is lost. Subsequently, it is accounted for as an equity-
accounted investee or as financial asset at fair value through other comprehensive income depending on the
level of influence retained.
A N N U A L R E P O R T 2 0 1 8 207S E M B C O R P M A R I N E206

NOTES TO THE FINANCIAL STATEMENTSYear ended 31 December 2018
3. SIGNIFICANT ACCOUNTING POLICIES (CONT’D)
3.1 Basis of consolidation (cont’d)
(v) Associates
Associates are those entities in which the Group has significant influence, but not control or joint control, over
the financial and operating policies of these entities.
The existence and effect of potential voting rights that are presently exercisable or presently convertible
are considered when assessing whether the Group has significant influence over another entity. Significant
influence is presumed to exist when the Group holds 20% or more of the voting power of another entity.
Associates are accounted for using the equity method of accounting from the date that significant influence
commences until the date that significant influence ceases and are recognised initially at cost. The cost of
investments includes transaction costs. When the Group’s share of losses exceeds its interest in an equity-
accounted investee, the carrying amount of the investment (including any other unsecured receivables, that in
substance, form part of the Group’s net investment in the associate) is reduced to zero, and the recognition of
further losses is discontinued except to the extent that the Group has an obligation or made payments on its
behalf to satisfy obligations of the associate that the Group has guaranteed or otherwise committed on behalf of.
The excess of the Group’s interest in the net fair value of the identifiable assets, liabilities and contingent
liabilities over the cost of acquisition is credited to profit or loss in the period of the acquisition. Where the
audited financial statements are not available, the share of results is arrived at from unaudited management
financial statements made up mainly to the end of the accounting year to 31 December.
(vi) Joint ventures
A joint venture is an arrangement in which the Group has joint control, whereby the Group has rights to the net
assets of the arrangement.
The existence and effect of potential voting rights that are presently exercisable or presently convertible are
considered when assessing whether the Group has joint control over the entity.
Joint ventures are accounted for using the equity method of accounting from the date that joint control
commences until the date that joint control ceases.
The excess of the Group’s interest in the net fair value of the identifiable assets, liabilities and contingent
liabilities over the cost of acquisition is credited to profit or loss in the period of the acquisition. Where the
audited financial statements are not available, the share of results is arrived at from unaudited management
financial statements made up mainly to the end of the accounting year to 31 December.
(vii) Transactions eliminated on consolidation
All intra-group balances, transactions, and unrealised income and expenses arising from intra-group
transactions, are eliminated in preparing the consolidated financial statements. Unrealised gains arising from
transactions with associates and joint ventures are eliminated against the investment to the extent of the
Group’s interest in the investee. Unrealised losses are eliminated in the same way as unrealised gains, but only
to the extent that there is no evidence of impairment.
(viii) Accounting for subsidiaries, associates and joint ventures
Investments in subsidiaries, associates and joint ventures are measured in the Company’s balance sheet at cost
less accumulated impairment losses.
A N N U A L R E P O R T 2 0 1 8 209S E M B C O R P M A R I N E208

NOTES TO THE FINANCIAL STATEMENTSYear ended 31 December 2018
3. SIGNIFICANT ACCOUNTING POLICIES (CONT’D)
3.2 Foreign currencies
(i) Foreign currency transactions and balances
Transactions in foreign currencies are translated into the respective functional currencies of Group entities at
exchange rates at the dates of the transactions. At each reporting date:
• Foreign currency monetary assets and liabilities are retranslated to the functional currency using
exchange rates at that date;
• Non-monetary assets and liabilities in a foreign currency that are measured in terms of historical cost
are translated using exchange rate at the date of the transaction; and
• Non-monetary assets and liabilities denominated in foreign currencies that are measured at fair value
are retranslated to the functional currency at exchange rates at the date the fair value was determined.
Foreign currency differences arising from the settlement or from translation of monetary items are recognised
in profit or loss.
Foreign currency differences arising on retranslation are recognised directly in profit or loss, except for the
following differences which are recognised in other comprehensive income arising on the retranslation of:
• Equity instruments designated at fair value through other comprehensive income (FVOCI)
(2017: Available-for-sale equity instruments (except on impairment in which case foreign currency
differences that have been recognised in other comprehensive income are reclassified to profit or loss));
• A financial liability designated as a hedge of net investment in a foreign operation to the extent that the
hedge is effective; or
• Qualifying cash flow hedges to the extent the hedge is effective.
(ii) Foreign operations
The results and financial positions of foreign operations (none of which has the currency of a hyperinflationary
economy) that have a functional currency different from the presentation currency are translated into the
presentation currency as follows:
• Assets and liabilities are translated at exchange rates ruling at the date of the balance sheet;
• Revenues and expenses are translated at average exchange rates; and
• All resulting foreign currency differences are taken to the foreign currency translation reserve in other
comprehensive income.
Goodwill (except those relating to acquisitions of foreign operations prior to 1 January 2004) and fair value
adjustments arising from the acquisition of foreign operations are translated to the presentation currency for
consolidation at the rates of exchange ruling at the balance sheet date. Goodwill arising from the acquisition
of foreign operations prior to 1 January 2004 are translated at foreign exchange rates ruling at the dates of
the transactions.
A N N U A L R E P O R T 2 0 1 8 209S E M B C O R P M A R I N E208

NOTES TO THE FINANCIAL STATEMENTSYear ended 31 December 2018
3. SIGNIFICANT ACCOUNTING POLICIES (CONT’D)
3.2 Foreign currencies (cont’d)
(ii) Foreign operations (cont’d)
Foreign currency differences are recognised in other comprehensive income, and presented in the foreign
currency translation reserve (translation reserve) in equity. However, if the foreign operation is a non-wholly-
owned subsidiary, then the relevant proportionate share of the translation difference is allocated to the non-
controlling interests. When a foreign operation is disposed of such that control, significant influence or joint
control is lost, the cumulative amount in the translation reserve related to that foreign operation is reclassified
to profit or loss as part of the gain or loss on disposal. When the Group disposes of only part of its interest in a
subsidiary that includes a foreign operation while retaining control, the relevant proportion of the cumulative
amount is reattributed to non-controlling interests. When the Group disposes of only part of its investment
in an associate or joint venture that includes a foreign operation while retaining significant influence or joint
control, the relevant proportion of the cumulative amount is reclassified to profit or loss.
When the settlement of a monetary item receivable from or payable to a foreign operation is neither planned
nor likely to occur in the foreseeable future, foreign exchange gains and losses arising from such a monetary
item that are considered to form part of a net investment in a foreign operation are recognised in other
comprehensive income, and are presented in the translation reserve in equity.
(iii) Net investment in a foreign operation
Foreign currency differences arising from monetary items that in substance form part of the Company’s
net investment in a foreign operation are recognised in the Company’s profit or loss. Such differences are
reclassified to the foreign currency translation reserve in the consolidated statement of comprehensive income
and are released to the consolidated income statement upon disposal of the investment as part of the gain or
loss on disposal.
3.3 Property, plant and equipment
(i) Owned assets
Property, plant and equipment are measured at cost less accumulated depreciation and accumulated
impairment losses. Cost includes expenditure that is directly attributable to the acquisition of the asset.
The cost of self-constructed assets includes the cost of materials, direct labour and any other costs directly
attributable to bringing the assets to a working condition for their intended use, the cost of dismantling and
removing the items and restoring the site on which they are located and capitalised borrowing costs.
Cost may include transfers from equity of any gain or loss on qualifying cash flow hedges of foreign currency
purchases of property, plant and equipment. Purchased software that is integral to the functionality of the
related equipment is capitalised as part of that equipment.
Where an item of property, plant and equipment comprises major components having different useful lives,
they are accounted for as separate items of property, plant and equipment.
A N N U A L R E P O R T 2 0 1 8 211S E M B C O R P M A R I N E210

NOTES TO THE FINANCIAL STATEMENTSYear ended 31 December 2018
3. SIGNIFICANT ACCOUNTING POLICIES (CONT’D)
3.3 Property, plant and equipment (cont’d)
(ii) Subsequent expenditure
Subsequent expenditure relating to property, plant and equipment is recognised in the carrying amount of
the asset when it is probable that future economic benefits, in excess of the originally assessed standard of
performance of the existing asset, will flow to the Group and its costs can be measured reliably. The costs of
day-to-day servicing of property, plant and equipment are recognised as an expense when incurred.
Certain items of property, plant and equipment are subject to overhauls at regular intervals. The inherent
components of the initial overhaul are determined based on the costs of the next overhaul and are separately
depreciated in order to reflect the estimated intervals between two overhauls. The costs of the overhauls
subsequently incurred are capitalised as additions and the carrying amounts of the replaced components are
written off to profit or loss.
(iii) Disposals
Gains or losses arising from the retirement or disposal of property, plant and equipment are determined as the
difference between the net disposal proceeds and the carrying amount of the asset and are recognised in profit
or loss on the date of retirement or disposal.
(iv) Leasehold land
Operating leasehold land has been capitalised as part of property, plant and equipment and is depreciated over
the lease period in which the future economic benefits embodied in the assets are expected to be consumed.
(v) Finance lease assets
Finance leases are those leasing agreements with terms of which the Group assumes substantially all the risks
and rewards of ownership. Property, plant and equipment acquired by way of such leases is capitalised at the
lower of its fair value and the present value of the minimum lease payments at the inception of the lease, less
accumulated depreciation and impairment losses. Subsequent to initial recognition, the asset is accounted for
in accordance with the accounting policy applicable to that asset.
Lease payments are apportioned between the finance charges and reduction of the lease liability so as to
achieve a constant rate of interest on the remaining balance of the liability.
Finance charges are charged directly to profit or loss.
Capitalised leased assets are depreciated over the shorter of the economic useful life of the asset and the
lease term.
(vi) Provision for restoration costs
A provision is recognised for the costs expected to be incurred to dismantle, remove and restore the asset upon
expiry of the lease agreement. The estimated costs form part of the cost of the property, plant and equipment
and are depreciated over the useful life of the asset.
A N N U A L R E P O R T 2 0 1 8 211S E M B C O R P M A R I N E210

NOTES TO THE FINANCIAL STATEMENTSYear ended 31 December 2018
3. SIGNIFICANT ACCOUNTING POLICIES (CONT’D)
3.3 Property, plant and equipment (cont’d)
(vii) Depreciation
Depreciation is based on the cost of an asset less its residual value. Significant components of individual
assets are assessed and if a component has a useful life that is different from the remainder of that asset, that
component is depreciated separately. Depreciation is recognised as an expense in profit or loss on a straight-
line basis over their estimated useful lives of each component of an item of property, plant and equipment,
unless it is included in the carrying amount of another asset. Depreciation is recognised from the date that the
property, plant and equipment are installed and are ready for use, or in respect of internally constructed assets,
from the date that the asset is completed and ready for use. Leased assets are depreciated over the shorter of
the lease term and their useful lives unless it is reasonably certain that the Group will obtain ownership by the
end of the lease term.
The estimated useful lives for the current and comparative years are as follows:
Leasehold land Lease period of 3 to 60 years
Buildings 3 to 50 years
Quays and dry docks 6 to 60 years
Marine vessels 7 to 25 years
Cranes and floating docks 3 to 30 years
Plant, machinery and tools 3 to 30 years
Motor vehicles 3 to 10 years
Furniture and office equipment 3 to 10 years
Utilities and fittings 10 to 30 years
Computer equipment 1 to 5 years
The assets’ depreciation methods, useful lives and residual values, if not insignificant, are reviewed annually and
adjusted if appropriate.
No depreciation is provided on freehold land or construction-in-progress.
Fully depreciated assets are retained in the financial statements until they are no longer in use.
3.4 Investment properties
Investment properties are properties held for long-term rental yields or for capital appreciation, or both but not for sale
in the ordinary course of business, use in the production or supply of goods or services or for administrative purposes.
Investment properties are initially recognised at cost and subsequently carried at cost less accumulated depreciation
and accumulated impairment losses. Depreciation is recognised in profit or loss on a straight-line basis over the
estimated useful lives ranging from 45 to 60 years or the lease period of 15 to 16 years. The assets’ depreciation
methods, useful lives and residual values are reviewed, if not insignificant, annually, and adjusted if appropriate. No
depreciation is provided on the freehold land.
Cost includes expenditure that is directly attributable to the acquisition of the investment property.
A N N U A L R E P O R T 2 0 1 8 213S E M B C O R P M A R I N E212

NOTES TO THE FINANCIAL STATEMENTSYear ended 31 December 2018
3. SIGNIFICANT ACCOUNTING POLICIES (CONT’D)
3.4 Investment properties (cont’d)
Investment properties are subject to renovations or improvements at regular intervals. The cost of major renovations
and improvements is capitalised as additions when it increases the future economic benefits, embodied in the specific
asset to which it relates, and its costs can be measured reliably. The carrying amounts of the replaced components
are written off to profit or loss. The cost of maintenance, repairs and minor improvements is recognised as an expense
when incurred.
On disposal of an investment property, the difference between the net disposal proceeds and the carrying amount of
the asset is recognised in profit or loss.
3.5 Intangible assets
(i) Goodwill
Goodwill represents the excess of:
• the fair value of the consideration transferred; plus
• the recognised amount of any non-controlling interests in the acquiree; plus
• if the business combination is achieved in stages, the fair value of the pre-existing equity interest in the
acquiree, less the net amount recognised (generally fair value) of the identifiable assets acquired and
liabilities assumed.
When the excess is negative, a bargain purchase gain is recognised immediately in profit or loss.
Goodwill is measured at cost less accumulated impairment losses.
Goodwill that arises upon the acquisition of subsidiaries is included in intangible assets.
Goodwill on acquisition of associates and joint ventures is included in investments in associates and joint
ventures, respectively. An impairment loss on such investments is not allocated to any asset, including goodwill,
that forms part of the carrying amount of the investments.
Goodwill is tested for impairment on an annual basis in accordance with Note 3.12.
(ii) Intellectual property rights
Intellectual property rights are measured at cost less accumulated amortisation and accumulated impairment
losses. Amortisation is recognised in profit or loss on a straight-line basis over the estimated useful life of 10 years.
(iii) Subsequent expenditure
Subsequent expenditure on capitalised intangible assets is capitalised only when it increases the future economic
benefits embodied in the specific asset to which it relates. All other expenditure is expensed as incurred.
(iv) Amortisation
Amortisation methods, useful lives and residual values are reviewed at the end of each reporting period and
adjusted if appropriate.
A N N U A L R E P O R T 2 0 1 8 213S E M B C O R P M A R I N E212

NOTES TO THE FINANCIAL STATEMENTSYear ended 31 December 2018
3. SIGNIFICANT ACCOUNTING POLICIES (CONT’D)
3.6 Financial assets
(i) Recognition and initial measurement
Trade receivables are initially recognised when they are originated. All other financial assets are initially
recognised when the Group becomes a party to the contractual provisions of the instruments.
A financial asset (unless it is a trade receivable without a significant financing component) is initially measured at
fair value plus, in the case of financial asset not carried at fair value through profit or loss, transaction costs that
are directly attributable to its acquisition or issue. A trade receivable without a significant financing component
is initially measured at the transaction price.
(ii) Classification and subsequent measurement
Policies applicable from 1 January 2018:
Financial assets
On initial recognition, a financial asset is classified as measured at: amortised cost, fair value through other
comprehensive income (FVOCI) or fair value through profit or loss (FVTPL).
Financial assets are not reclassified subsequent to their initial recognition unless the Group changes its business
model for managing financial assets, in which case all affected financial assets are reclassified on the first day
of the first reporting period following the change in the business model.
Financial assets at amortised cost
A financial asset is measured at amortised cost if it meets both of the following conditions and is not designated
as at FVTPL:
• it is held within a business model whose objective is to hold assets to collect contractual cash flows; and
• its contractual terms of the asset give rise on specified dates to cash flows that are solely payments of
principal and interest on the principal amount outstanding.
Equity investments at FVOCI
On initial recognition of an equity investment that is not held for trading, the Group may irrevocably elect on
initial recognition to present subsequent changes in fair value in other comprehensive income. This election is
made on an investment-by-investment basis. The Group’s equity investments are classified as FVOCI.
Financial assets at FVTPL
All other financial assets not classified as at amortised cost or FVOCI as described above are measured at FVTPL.
This includes derivative financial assets. On initial recognition, the Group may irrevocably designate a financial
asset that otherwise meets the requirements to be measured at amortised cost or at FVOCI, as at FVTPL, if
doing so eliminates or significantly reduces an accounting mismatch that would otherwise arise.
A N N U A L R E P O R T 2 0 1 8 215S E M B C O R P M A R I N E214

NOTES TO THE FINANCIAL STATEMENTSYear ended 31 December 2018
3. SIGNIFICANT ACCOUNTING POLICIES (CONT’D)
3.6 Financial assets (cont’d)
(ii) Classification and subsequent measurement (cont’d)
Business model assessment
The Group makes an assessment of the objective of a business model in which an asset is held because this
best reflects the way the business is managed and information is provided to Management. The information
considered includes:
• the stated policies and objectives for the respective financial assets and the operation of those policies
in practice;
• how the performance of the respective financial assets is evaluated and reported to the Group’s
Management;
• the risks that affect the performance of the business model and how those risks are managed; and
• the frequency, volume and timing of disposals of investments in prior periods, the reasons for such
disposals and its expectations about future activity.
Transfers of financial assets to third parties in transactions that do not qualify for derecognition are not
considered sales for this purpose, consistent with the Group’s continuing recognition of the assets.
Financial assets that are held for trading or are managed and whose performance is evaluated on a fair value
basis are measured at FVTPL.
Assessment of whether contractual cash flows are solely payments of principal and interest
For the purpose of this assessment, ‘principal’ is defined as the fair value of the financial asset on initial
recognition. ‘Interest’ is defined as consideration for the time value of money and for the credit risk associated
with the principal amount outstanding during a particular period of time and for other basic lending risks and
costs (e.g. liquidity risk and administrative costs), as well as profit margin.
In assessing whether the contractual cash flows are solely payments of principal and interest, the Group
considers the contractual terms of the instrument. This includes assessing whether the financial asset contains
a contractual term that could change the timing and amount of contractual cash flows such that it would not
meet this condition. In making this assessment, the Group considers:
• contingent events that would change the amount or timing of cash flows;
• prepayment features; and
• terms that limit the Group’s claim to cash flows from specified assets (e.g. non-recourse features).
A prepayment feature is consistent with the solely payments of principal and interest criterion if the prepayment
amount substantially represents unpaid amounts of principal and interest on the principal amount outstanding,
which may include reasonable additional compensation for early termination of the contract. Additionally, for a
financial asset acquired at a discount or premium to its contractual par amount, a feature that permits or requires
prepayment at an amount that substantially represents the contractual par amount plus accrued (but unpaid)
contractual interest (which may also include reasonable additional compensation for early termination) is treated
as consistent with this criterion if the fair value of the prepayment feature is insignificant at initial recognition.
A N N U A L R E P O R T 2 0 1 8 215S E M B C O R P M A R I N E214

NOTES TO THE FINANCIAL STATEMENTSYear ended 31 December 2018
3. SIGNIFICANT ACCOUNTING POLICIES (CONT’D)
3.6 Financial assets (cont’d)
(ii) Classification and subsequent measurement (cont’d)
Subsequent measurement and gains and losses
Financial assets at FVTPL
These assets are subsequently measured at fair value. Net gains and losses, including any interest or dividend
income, are recognised in profit or loss. For derivatives designated as hedging instruments, see Note 8.
Financial assets at amortised cost
The assets are subsequently measured at amortised cost using the effective interest method. The amortised
cost is reduced by impairment losses. Interest income, foreign exchange gains and losses and impairment
losses are recognised in profit or loss. Any gain or loss on derecognition is recognised in profit or loss.
Policies applicable from 1 January 2018:
Equity investments at FVOCI
These assets are subsequently measured at fair value. Dividends are recognised as income in profit or loss
unless the dividend clearly represents a recovery of part of the cost of investment. Other net gains and losses
are recognised in OCI and are never reclassified to profit or loss.
Policies applicable before 1 January 2018:
The Group classifies non-derivative financial assets into the following categories: financial assets at fair value
through profit or loss; loans and receivables and available-for-sale financial assets. The classification depends
on the purpose for which the financial assets are acquired or held. Management determines the classification of
its financial assets at initial recognition and re-evaluates this designation at every reporting date. The designation
of financial assets at fair value through profit or loss is irrevocable.
(a) Financial assets at fair value through profit or loss
A financial asset is classified at fair value through profit or loss if it is classified as held for trading or is
designated as such upon initial recognition. Financial assets are designated at fair value through profit
or loss if the Group manages such investments and makes purchase and sale decisions based on their
fair value in accordance with the Group’s documented risk management or investment strategy. Upon
initial recognition, attributable transaction costs are recognised in profit or loss as incurred. Financial
assets at fair value through profit or loss are measured at fair value, and changes therein are recognised
in profit or loss.
Financial assets designated at fair value through profit or loss comprise unquoted securities that
otherwise would have been classified as available-for-sale.
A N N U A L R E P O R T 2 0 1 8 217S E M B C O R P M A R I N E216

NOTES TO THE FINANCIAL STATEMENTSYear ended 31 December 2018
3. SIGNIFICANT ACCOUNTING POLICIES (CONT’D)
3.6 Financial assets (cont’d)
(ii) Classification and subsequent measurement (cont’d)
Subsequent measurement and gains and losses (cont’d)
(b) Loans and receivables
Loans and receivables are financial assets with fixed or determinable payments that are not quoted
in an active market. They are included in current assets, except for maturities greater than 12 months
after the balance sheet date for which they are classified as non-current assets. Loans and receivables
are recognised initially at fair value plus any directly attributable transaction costs and subsequently
measured at amortised cost using the effective interest method. Receivables with a short duration are
not discounted. Loans and receivables are included in trade and other receivables in the balance sheet.
Loans and receivables comprise cash and cash equivalents, trade and other receivables excluding
prepayments and advances to suppliers.
(c) Available-for-sale financial assets
Other financial assets held by the Group that are either designated in this category or not classified in
any other category, are classified as being available-for-sale. They are included in non-current assets
unless management intends to dispose of the investment within 12 months of the balance sheet date.
They are recognised initially at fair value plus any directly attributable transaction costs. Subsequent to
initial recognition, they are measured at fair value and changes therein, other than impairment losses
and foreign currency differences, are recognised directly in other comprehensive income. When these
investments are derecognised, the cumulative gain or loss previously recognised directly in other
comprehensive income, or part thereof, is recognised in profit or loss. Where these investments are
interest-bearing, interest calculated using the effective interest method is recognised in profit or loss.
Available-for-sale financial assets comprise equity shares and unit trusts.
(d) Derecognition
The Group derecognises a financial asset when the contractual rights to the cash flows from the financial
asset expire, or when it transfers the rights to receive the contractual cash flows in a transaction in
which substantially all of the risks and rewards of ownership of the financial asset are transferred or in
which the Group neither transfers nor retains substantially all of the risks and rewards of ownership and
it does not retain control of the financial asset.
The Group enters into transactions whereby it transfers assets recognised in its balance sheet, but
retains either all or substantially all of its risks and rewards of the transferred assets. In these cases, the
transferred assets are not derecognised.
A N N U A L R E P O R T 2 0 1 8 217S E M B C O R P M A R I N E216

NOTES TO THE FINANCIAL STATEMENTSYear ended 31 December 2018
3. SIGNIFICANT ACCOUNTING POLICIES (CONT’D)
3.6 Financial assets (cont’d)
(ii) Classification and subsequent measurement (cont’d)
Subsequent measurement and gains and losses (cont’d)
(e) Offsetting
Financial assets and financial liabilities are offset and the net amount is presented in the balance sheets,
when and only when, there is a currently enforceable legal right to set off the recognised amounts and
there is an intention to settle on a net basis, or to realise the assets and settle the liabilities simultaneously.
(f) Cash and cash equivalents
Cash and cash equivalents comprise cash balances and bank deposits. For the purpose of the statement
of cash flows, cash and cash equivalents are presented net of bank overdrafts which are repayable
on demand. Bank overdrafts are shown within interest-bearing borrowings in current liabilities on the
balance sheet.
3.7 Impairment of financial assets and contract assets
Policies applicable from 1 January 2018:
The Group recognises loss allowances for expected credit losses (“ECLs”) on:
• financial assets measured at amortised cost; and
• contract assets (as defined in SFRS(I) 15).
Loss allowance of the Group are measured on either of the following bases:
• 12-month ECLs: these are ECLs that result from default events that are possible within the 12 months after the
reporting date (or for a shorter period if the expected credit life of the instrument is less than 12 months); or
• Lifetime ECLs: these are ECLs that result from all possible default events over the expected life of a financial
instrument or contract asset.
Simplified Approach
The Group applies the simplified approach to provide for ECLs for all trade receivables and contract assets. The
simplified approach requires the loss allowance to be measured at an amount equal to lifetime ECLs.
General Approach
The Group applies the general approach to provide for ECLs on all other financial instruments. Under the general
approach, the loss allowance is measured at an amount equal to 12-month ECLs at initial recognition.
At each reporting date, the Group assesses whether the credit risk of a financial instrument has increased significantly
since initial recognition. When credit risk has increased significantly since initial recognition, loss allowance is measured
at an amount equal to lifetime ECLs.
A N N U A L R E P O R T 2 0 1 8 219S E M B C O R P M A R I N E218

NOTES TO THE FINANCIAL STATEMENTSYear ended 31 December 2018
3. SIGNIFICANT ACCOUNTING POLICIES (CONT’D)
3.7 Impairment of financial assets and contract assets (cont’d)
General Approach (cont’d)
When determining whether the credit risk of a financial asset has increased significantly since initial recognition and
when estimating ECLs, the Group considers reasonable and supportable information that is relevant and available
without due costs or effort. This includes both quantitative and qualitative information and analysis, based on the
Group’s historical experience and informed credit assessment and forward-looking information.
If the credit risk has not increased significantly since initial recognition or if the credit quality of the financial instruments
improves such that there is no longer a significant increase in credit risk since initial recognition, loss allowance is
measured at an amount equal to 12-month ECLs.
The Group considers a financial asset to be in default when:
• the borrower is unlikely to pay its credit obligations to the Group in full, without recourse by the Group to
actions such as realising security (if any is held); or
• the financial asset remains outstanding for more than the reasonable range of past due days, taking into
consideration historical payment track records, current macroeconomics situation as well as the general
industry trend.
The Group considers a contract asset to be in default when the customer is unlikely to pay its contractual obligations
to the Group in full, without recourse by the Group to actions such as realising security (if any is held).
The maximum period considered when estimating ECLs is the maximum contractual period over which the Group is
exposed to credit risk.
Measurement of ECL
ECLs are a probability-weighted estimate of credit losses. Credit losses are measured at the present value of all cash
shortfalls (i.e. the difference between the cash flows due to the entity in accordance with the contract and the cash
flows that the Group expects to receive). ECLs are discounted at the effective interest rate of financial asset.
Credit-impaired financial assets
At each reporting date, the Group assesses whether financial assets carried at amortised cost are credit-impaired. A
financial asset is “credit-impaired” when one or more events that have a detrimental impact on the estimated future
cash flows of the financial asset have occurred.
Evidence that a financial asset is credit-impaired includes the following observable data:
• breach of contract such as a default or past due outstanding for more than the reasonable range of past due
days, taking into consideration historical payment track records, current macroeconomics situation as well as
the general industry trend;
• the restructuring of a loan or advanced by the Group on terms that the Group would not consider otherwise;
• it is probable that the debtor will enter bankruptcy or other financial reorganisation or is having significant
financial difficulty; or
• the disappearance of an active market for a security because of financial difficulties.
A N N U A L R E P O R T 2 0 1 8 219S E M B C O R P M A R I N E218

NOTES TO THE FINANCIAL STATEMENTSYear ended 31 December 2018
3. SIGNIFICANT ACCOUNTING POLICIES (CONT’D)
3.7 Impairment of financial assets and contract assets (cont’d)
Presentation of loss allowance for ECLs in the balance sheet
Loss allowances for financial assets measured at amortised cost are deducted from the gross carrying amount of
these assets.
Write-off
The gross carrying amount of a financial asset is written off (either partially or in full) to the extent that there is no
realistic prospect of recovery. This is generally the case when the Group determines that the debtor does not have
assets or sources of income that could generate sufficient cash flows to repay the amounts subject to the write-off.
However, financial assets that are written off could still be subject to enforcement activities in order to comply with the
Group’s procedures for recovery of amounts due.
Policies applicable before 1 January 2018:
The Group assesses at each balance sheet date whether there is objective evidence that a financial asset or a group of
financial assets is impaired. A financial asset is impaired if objective evidence indicates that a loss event has occurred
after the initial recognition of the asset, and that the loss event has a negative effect on the estimated future cash flows
of that asset that can be estimated reliably.
The Group considers evidence of impairment for loans and receivables at both a specific asset and collective level. All
individually significant loans and receivables are assessed for specific impairment. All individually significant receivables
found not to be specifically impaired are then collectively assessed for any impairment that has been incurred but not
yet identified. Loans and receivables that are not individually significant are collectively assessed for impairment by
grouping together loans and receivables with similar risk characteristics.
In assessing collective impairment, the Group uses historical trends of the probability of default, the timing of recoveries
and the amount of loss incurred, adjusted for management’s judgement as to whether current economic and credit
conditions are such that the actual losses are likely to be greater or less than suggested by historical trends.
Objective evidence that financial assets (including equity securities) are impaired can include default or delinquency
by a debtor, restructuring of an amount due to the Group on terms that the Group would not consider otherwise,
indications that a debtor or issuer will enter bankruptcy, adverse changes in the payment status of borrowers or issuers
in the Group, economic conditions that correlate with defaults or the disappearance of an active market for a security.
In addition, for an investment in an equity security, a significant or prolonged decline in its fair value below its cost is
objective evidence of impairment.
When a decline in the fair value of an available-for-sale financial asset has been recognised directly in other comprehensive
income and there is objective evidence that the value of the asset is impaired, the cumulative loss that had been
recognised directly in other comprehensive income is recognised in profit or loss even though the financial asset has not
been derecognised. The amount of the cumulative loss that is recognised in profit or loss is the excess of acquisition cost
less any impairment loss on that financial asset previously recognised in profit or loss, over its current fair value.
A N N U A L R E P O R T 2 0 1 8 221S E M B C O R P M A R I N E220

NOTES TO THE FINANCIAL STATEMENTSYear ended 31 December 2018
3. SIGNIFICANT ACCOUNTING POLICIES (CONT’D)
3.7 Impairment of financial assets and contract assets (cont’d)
Policies applicable before 1 January 2018: (cont’d)
An impairment loss in respect of a financial asset measured at amortised cost is calculated as the difference between
its carrying amount and the present value of the estimated future cash flows, discounted at the asset’s original
effective interest rate. Losses are recognised in profit or loss and reflected in an allowance account against loans and
receivables. Interest on the impaired asset continues to be recognised. When the Group considers that there are no
realistic prospects of recovery of the asset, the relevant amounts are written off. If the amount of impairment loss
subsequently decreases and the decrease can be related objectively to an event occurring after the impairment was
recognised, then the previously recognised impairment loss is reversed through profit or loss.
Reversals of impairment
An impairment loss in respect of a receivable carried at amortised cost is reversed if the subsequent increase in
recoverable amount can be related objectively to an event occurring after the impairment loss was recognised. The
decrease in impairment loss is reversed through profit or loss.
An impairment loss once recognised in profit or loss in respect of an investment in an equity instrument classified
as available-for-sale is not reversed through profit or loss. Any subsequent increase in fair value of such assets is
recognised directly in other comprehensive income. If the fair value of a debt instrument classified as available-for-sale
increases and the increase can be objectively related to an event occurring after the impairment loss was recognised
in profit or loss, the impairment loss shall be reversed, with the amount of the reversal recognised in profit or loss.
3.8 Derivatives
Derivatives are used to manage exposures to foreign exchange and interest rate risks arising from operational, financing
and investment activities. Derivatives are not used for trading purposes. However, derivatives that do not qualify for
hedge accounting are accounted for at fair value through profit or loss.
Derivatives are recognised initially at fair value; attributable transaction costs are recognised in profit or loss as
incurred. Subsequent to initial recognition, derivatives are re-measured at fair value and any changes in its fair value
are recognised immediately in profit or loss. However, where derivatives qualify for hedge accounting, recognition of
any resultant changes in the fair value depends on the nature of the item being hedged as described in Note 3.9.
3.9 Hedging activities
Policies applicable from 1 January 2018:
At inception or upon reassessment of the arrangement, the Group documents, at the inception of the transaction,
the relationship between the hedging instruments and hedged items, together with the methods that will be used
to assess the effectiveness of the hedge relationship as well as its risk management objective and strategies for
undertaking various hedge transactions. The Group also documents its assessment, both at hedge inception and on
an ongoing basis, the economic relationship between the hedged item and the hedging instrument, including whether
the derivatives designated as hedging instruments are highly effective in offsetting changes in fair value or cash flows
of the hedged items. Hedging relationships designated under FRS 39 that were still existing as at 31 December 2017 are
treated as continuing hedges and hedge documentations were aligned accordingly to the requirements of SFRS(I) 9.
A N N U A L R E P O R T 2 0 1 8 221S E M B C O R P M A R I N E220

NOTES TO THE FINANCIAL STATEMENTSYear ended 31 December 2018
3. SIGNIFICANT ACCOUNTING POLICIES (CONT’D)
3.9 Hedging activities (cont’d)
(i) Fair value hedges
Where a derivative hedges the changes in fair value of a recognised asset or liability or an unrecognised firm
commitment (or an identified portion of such asset, liability or firm commitment), any gain or loss on the
hedging instrument is recognised in profit or loss. The hedged item is also measured at fair value in respect of
the risk being hedged, with any changes recognised in profit or loss.
(ii) Cash flow hedges
Where a derivative is designated as a hedge of the variability in cash flows attributable to a particular risk
associated with a recognised asset or liability, or a highly probable forecast transaction that could affect
profit or loss, the effective portion of changes in the fair value of the derivative is recognised directly in other
comprehensive income and presented in the hedging reserve in equity. The ineffective portion of changes in
the fair value of the derivative is recognised immediately in profit or loss.
When the forecast transaction subsequently results in the recognition of a non-financial asset or non-financial
liability, the associated cumulative gain or loss is reclassified from equity and included in the initial cost or
other carrying amount of the non-financial asset or liability. If a hedge of a forecast transaction subsequently
results in the recognition of a financial asset or financial liability, the associated changes in fair value that were
recognised directly in other comprehensive income are reclassified into profit or loss in the same period or
periods during which the asset acquired or liability assumed affects profit or loss.
When the hedged item is a non-financial asset, the amount accumulated in equity is retained in other
comprehensive income and reclassified to profit or loss in the same period or periods during which the non-
financial item affects profit or loss. In other cases as well, the amount accumulated in equity is reclassified to
profit or loss in the same period that the hedged item affects profit or loss.
If the hedging instrument no longer meets the criteria for hedge accounting, expires or is sold, terminated or
exercised, or the designation is revoked, then hedge accounting is discontinued prospectively. When hedge
accounting for cash flow hedges is discontinued, the amount that has been accumulated in the hedging reserve
and the cost of hedging reserve remains in equity until, for a hedge of a transaction resulting in recognition of
a non-financial item, it is included in the non-financial item’s cost on its initial recognition or, for other cash
flow hedges, it is reclassified to profit or loss in the same period or periods as the hedged expected future cash
flows affect profit or loss. If the forecast transaction is no longer expected to occur, then the balance in equity
is reclassified to profit or loss.
Policies applicable before 1 January 2018:
The policy applied in the comparative information presented for 2017 is similar to that applied for 2018. For all cash flow
hedges, including hedges of transactions resulting in the recognition of non-financial items, the amounts accumulated
in the cash flow hedge reserve were reclassified to profit or loss in the same period or periods during which the hedged
expected future cash flows affected profit or loss. Furthermore, for cash flow hedges that were terminated before
2017, forward points were recognised immediately in profit or loss.
A N N U A L R E P O R T 2 0 1 8 223S E M B C O R P M A R I N E222

NOTES TO THE FINANCIAL STATEMENTSYear ended 31 December 2018
3. SIGNIFICANT ACCOUNTING POLICIES (CONT’D)
3.10 Inventories
Inventories consist mainly of steel and other materials used for ship and rig repair, building and conversion and are
measured at the lower of cost and net realisable value.
Cost is calculated using the weighted average cost formula and comprises all costs of purchase, costs of conversion
and other costs incurred in bringing the inventories to their present location and condition.
Net realisable value is the estimated selling price in the ordinary course of business less the estimated costs of
completion and the estimated costs necessary to make the sale.
When inventories are sold, the carrying amount of those inventories is recognised as an expense in the period in which
the related revenue is recognised.
The amount of any allowance for write-down of inventories to net realisable value and all losses of inventories are
recognised as an expense in the period the write-down or loss occurs. The amount of any reversal of any allowance for
write-down of inventories, arising from an increase in net realisable value, is recognised as a reduction in the amount
of inventories recognised as an expense in the period in which the reversal occurs.
3.11 Government grants
Asset related grants are credited to a deferred asset grant account at fair value when there is reasonable assurance
that they will be received and the Group will comply with the conditions associated with the grant. These grants
are then recognised in profit or loss as other income on the straight-line basis over the estimated useful lives of the
relevant assets.
Grants that compensate the Group for expenses incurred are recognised in profit or loss as other income on a
systematic basis in the same periods in which the expenses are recognised.
3.12 Impairment of non-financial assets
The carrying amounts of the Group’s non-financial assets, other than inventories and deferred tax assets, are reviewed
at each reporting date to determine whether there is any indication of impairment. If any such indication exists, the
assets’ recoverable amounts are estimated. For goodwill and intangible assets that have indefinite useful lives or that
are not yet available for use, the recoverable amount is estimated each year at the same time. An impairment loss is
recognised whenever the carrying amount of an asset or its cash generating unit exceeds its recoverable amount. A
cash generating unit is the smallest identifiable asset group that generates cash flows that largely are independent from
other assets and groups. Impairment losses are recognised in profit or loss unless it reverses a previous revaluation
that was credited to equity, in which case it is charged to equity. Impairment losses recognised in respect of cash
generating units are allocated first to reduce the carrying amount of any goodwill allocated to the cash generating unit
(group of cash generating units) and then, to reduce the carrying amount of the other assets in the cash generating
unit (group of cash generating units) on a pro rata basis.
Goodwill, intangible assets with indefinite useful lives and intangible assets not yet available for use are tested for
impairment annually and as and when indicators of impairment occur.
A N N U A L R E P O R T 2 0 1 8 223S E M B C O R P M A R I N E222

NOTES TO THE FINANCIAL STATEMENTSYear ended 31 December 2018
3. SIGNIFICANT ACCOUNTING POLICIES (CONT’D)
3.12 Impairment of non-financial assets (cont’d)
(i) Calculation of recoverable amount
The recoverable amount of an asset or cash generating unit is the greater of its value in use and its fair value
less costs to sell. In assessing value in use, the estimated future cash flows are discounted to their present value
using a pre-tax discount rate that reflects current market assessments of the time value of money and the risks
specific to the asset or cash generating unit. For the purpose of impairment testing, assets that cannot be tested
individually are grouped together into the smallest group of assets that generate cash inflows from continuing
use that are largely independent of the cash inflows of other assets or cash generating units.
Subject to an operating segment ceiling test, for the purposes of goodwill impairment testing, cash generating
units to which goodwill has been allocated are aggregated so that the level at which impairment testing is
performed reflects the lowest level at which goodwill is monitored for internal reporting purposes. Goodwill
acquired in a business combination is allocated to groups of cash generating units that are expected to benefit
from the synergies of the combination.
(ii) Reversals of impairment
An impairment loss in respect of goodwill is not reversed, even if it relates to an impairment loss recognised in
an interim period that would have been reduced or avoided had the impairment assessment been made at a
subsequent reporting or balance sheet date. In respect of other assets, impairment losses recognised in prior
periods are assessed at each reporting date for any indications that the loss has decreased or no longer exists.
An impairment loss is reversed if there has been a change in the estimates used to determine the recoverable
amount. An impairment loss is reversed only to the extent that the assets’ carrying amount does not exceed the
carrying amount that would have been determined, net of depreciation or amortisation, if no impairment loss
had been recognised.
Goodwill that forms part of the carrying amount of an investment in an associate or joint venture is not
recognised separately, and therefore is not tested for impairment separately. Instead, the entire amount of the
investment in an associate or joint venture is tested for impairment as a single asset when there is objective
evidence that the investment in an associate or joint venture may be impaired.
3.13 Non-derivative financial liabilities
Financial liabilities (including liabilities designated at fair value through profit or loss) are recognised initially on the trade
date, which is the date that the Group becomes a party to the contractual provisions of the instrument.
The Group classifies financial liabilities as measured at amortised cost or FVTPL. A financial liability is classified as at
FVTPL if it is classified as held-for-trading, it is a derivative or it is designated as such on initial recognition. Financial
liabilities at FVTPL are measured at fair value and net gains and losses, including any interest expense, are recognised
in profit or loss. Directly attributable transaction costs are recognised in profit or loss as incurred.
The Group derecognises a financial liability when its contractual obligations are discharged, cancelled or expired. The
Group also derecognises a financial liability when its terms are modified and the cash flows of the modified liability are
substantively different, in which case a new financial liability based on the modified terms is recognised at fair value.
Financial assets and liabilities are offset and the net amount presented in the balance sheets when, and only when, the
Group has a legal right to offset the amounts and intends either to settle on a net basis or to realise the asset and settle
the liability simultaneously.
A N N U A L R E P O R T 2 0 1 8 225S E M B C O R P M A R I N E224

NOTES TO THE FINANCIAL STATEMENTSYear ended 31 December 2018
3. SIGNIFICANT ACCOUNTING POLICIES (CONT’D)
3.13 Non-derivative financial liabilities (cont’d)
The Group classifies non-derivative financial liabilities into the other financial liabilities category. Such financial liabilities
are recognised initially at fair value plus any directly attributable transaction costs. Subsequent to initial recognition,
these financial liabilities are measured at amortised cost using the effective interest method. Interest expense and
foreign exchange gains and losses are recognised in profit or loss. Other financial liabilities comprise loans and
borrowings, bank overdrafts, and trade and other payables.
Bank overdrafts that are repayable on demand and form an integral part of the Group’s cash management are included
as a component of cash and cash equivalents for the purpose of the statement of cash flows.
3.14 Employee benefits
(i) Defined contribution plans
A defined contribution plan is a post-employment benefit plan under which an entity pays fixed contributions
into a separate entity and will have no legal or constructive obligation to pay further amounts. Obligations
for contributions to defined contribution plans are recognised as an expense in profit or loss as incurred.
If the contribution payable to the scheme for service received before the balance sheet date exceeds the
contribution already paid, the deficit payable to the scheme is recognised as a liability after deducting the
contribution already paid. If the contribution already paid exceeds the contribution due for services received
before the balance sheet date, then excess is recognised as an asset to the extent that the prepayment will lead
to, for example, a reduction in future payment or a cash refund.
(ii) Long-term employee benefits
The Group’s net obligation in respect of long-term employee benefits is the amount of future benefit that
employees have earned in return for their service in the current and prior periods. That benefit is discounted to
determine its present value. Long-term employee benefits are reported in “other long-term payables”.
(iii) Short-term employee benefits
Short-term employee benefit obligations are measured on an undiscounted basis and are expensed as the
related employment service is provided.
The amount expected to be paid is accrued when the Group has a present legal or constructive obligation to pay
this amount as a result of past service provided by the employee and the obligation can be estimated reliably.
(iv) Staff retirement benefits
Retirement benefits payable to certain categories of employees upon their retirement are provided for in the
financial statements based on their entitlement under the staff retirement benefit plan or, in respect of unionised
employees of a subsidiary who joined on or before 31 December 1988, based on an agreement with the union.
The Group’s net obligation in respect of retirement benefits is the amount of future benefit that employees
have earned in return for their service in the current and prior periods. The obligation is calculated using the
projected future salary increase and is discounted to its present value and the fair value of any related assets
is deducted.
A N N U A L R E P O R T 2 0 1 8 225S E M B C O R P M A R I N E224

NOTES TO THE FINANCIAL STATEMENTSYear ended 31 December 2018
3. SIGNIFICANT ACCOUNTING POLICIES (CONT’D)
3.14 Employee benefits (cont’d)
(v) Equity and equity-related compensation benefits
Share Option Plan
The share option programme allows the Group’s employees to acquire shares of the Group companies.
The fair value is measured at grant date and spread over the period during which the employees become
unconditionally entitled to the options. The fair value of options granted is recognised as an employee expense
with a corresponding increase in equity. At each balance sheet date, the Company revises its estimates of the
number of options that are expected to become exercisable. It recognises the impact of the revision of original
estimates in employee expense and in a corresponding adjustment to equity over the remaining vesting period.
The proceeds received net of any directly attributable transaction costs are credited to share capital when new
shares are issued. The amount in the share-based payments reserve is retained when the option is exercised
or expires.
Where treasury shares are issued, the difference between the cost of treasury shares and the proceeds received
net of any directly attributable costs are transferred to share-based payments reserve.
Performance Share Plan
The fair value of equity-related compensation is measured using the Monte Carlo simulation method as at the
date of the grant. The method involves projecting future outcomes using statistical distributions of key random
variables including the share prices and volatility of returns. This model takes into account the probability of
achieving the performance conditions in the future.
The fair value of the compensation cost is measured at grant date and amortised over the service period to which
the performance criteria relates and the period during which the employees become unconditionally entitled
to the shares. In estimating the fair value of the compensation cost, market-based performance conditions
are taken into account. From 2014 onwards, awards granted have both market-based and non-market-based
performance conditions. The compensation cost is charged to profit or loss with a corresponding increase in
equity on a basis that fairly reflects the manner in which the benefits will accrue to the employee under the
plan over the service period to which the performance period relates, irrespective of whether this performance
condition is satisfied.
The share-based payments reserve relating to the performance shares released is transferred to share capital
when new shares are issued. When treasury shares are issued, the cost of treasury shares is transferred to share-
based payments reserve.
A N N U A L R E P O R T 2 0 1 8 227S E M B C O R P M A R I N E226

NOTES TO THE FINANCIAL STATEMENTSYear ended 31 December 2018
3. SIGNIFICANT ACCOUNTING POLICIES (CONT’D)
3.14 Employee benefits (cont’d)
(v) Equity and equity-related compensation benefits (cont’d)
Restricted Share Plan
Similar to the Performance Share Plan, the fair value of equity-related compensation is measured using the
Monte Carlo simulation method as at the date of the grant. The method involves projecting future outcomes
using statistical distributions of key random variables including the share prices and volatility of returns. This
model takes into account the probability of achieving the performance conditions in the future.
The fair value of the compensation cost is measured at grant date and are then amortised over the service
period to which the performance criteria relates and the period during which the employees become
unconditionally entitled to the shares. Awards granted have non-market based performance conditions. The
compensation cost is charged to profit or loss with a corresponding increase in equity on a basis that fairly
reflects the manner in which the benefits will accrue to the employee under the plan over the service period to
which the performance period relates.
At the balance sheet date, the Company revises its estimates of the number of performance-based restricted
shares that the employees are expected to receive based on the achievement of non-market performance
conditions and the number of shares ultimately given. It recognises the impact of the revision of the original
estimates in employee expense and in a corresponding adjustment to equity over the remaining vesting period.
The share-based payments reserve relating to the restricted shares released is transferred to share capital when
new shares are issued. When treasury shares are issued, the cost of treasury shares is transferred to share-based
payments reserve.
In the Company’s separate financial statements, the fair value of options, performance shares and restricted
shares granted to employees of its subsidiaries is recognised as an increase in the cost of the Company’s
investment in subsidiaries, with a corresponding increase in equity over the vesting period.
(vi) Cash-related compensation benefits
Sembcorp Marine Challenge Bonus
The Group recognises a liability and an expense for bonuses and profit-sharing, based on a formula that takes
into consideration the share price of the Company. The Group recognises a provision when contractually
obliged to pay or where there is a past practice that has created a constructive obligation to pay.
The compensation cost is measured at the fair value of the liability at each balance sheet date and spread
over the service period to which the performance criteria relates and the period during which the employees
become unconditionally entitled to the bonus. The liability takes into account the probability of achieving the
performance conditions in the future.
Until the liability is settled, the Group will re-measure the fair value of the liability at each balance sheet date and
at the date of settlement, with any changes in fair value recognised in profit or loss for the period.
A N N U A L R E P O R T 2 0 1 8 227S E M B C O R P M A R I N E226

NOTES TO THE FINANCIAL STATEMENTSYear ended 31 December 2018
3. SIGNIFICANT ACCOUNTING POLICIES (CONT’D)
3.15 Provisions
A provision is recognised if, as a result of a past event, the Group has a present legal or constructive obligation that can
be reliably estimated and it is probable that an outflow of economic benefits will be required to settle the obligation.
If the effect is material, provisions are determined by discounting the expected future cash flows at a pre-tax rate
that reflects current market assessments of the time value of money and, where appropriate, the risks specific to the
liability. The unwinding of the discount is recognised as finance cost.
3.16 Tax expense
Tax expense comprises current and deferred tax. Tax expense is recognised in profit or loss except to the extent that
it relates to business combinations, or to items recognised directly in equity, in which case it is recognised in equity or
in other comprehensive income.
Current tax is the expected tax payable or receivable on the taxable income or loss for the year, using tax rates enacted
or substantively enacted at the reporting date, and any adjustment to tax payable in respect of previous years. The
amount of current tax payable or receivable is the best estimate of the tax amount expected to be paid or received that
reflects uncertainty related to income taxes, if any.
Deferred tax is recognised in respect of temporary differences between the carrying amounts of assets and liabilities
for financial reporting purposes and the amounts used for taxation purposes. Deferred tax is not recognised for the
following temporary differences: the initial recognition of goodwill, the initial recognition of assets or liabilities in
a transaction that is not a business combination and that affects neither accounting nor taxable profit or loss, and
differences relating to investments in subsidiaries and joint ventures to the extent that the Group is able to control the
timing of the reversal of the temporary difference and it is probable that they will not reverse in the foreseeable future.
The measurement of deferred tax reflects the consequences that would follow the manner in which the Group expects,
at the end of the reporting period, to recover or settle the carrying amount of its assets and liabilities. Deferred tax is
measured at the tax rates that are expected to be applied to the temporary differences when they reverse, based on
the laws that have been enacted or substantively enacted by the reporting date. Deferred tax assets and liabilities are
offset if there is a legally enforceable right to offset current tax liabilities and assets and they relate to taxes levied by the
same tax authority on the same taxable entity, or on different tax entities, but they intend to settle current tax liabilities
and assets on a net basis or their tax assets and liabilities will be realised simultaneously.
A deferred tax asset is recognised for unused tax losses, tax credits and deductible temporary differences, to the extent
that it is probable that future taxable profits will be available against which they can be utilised. Deferred tax assets are
reviewed at each reporting date and are reduced to the extent that it is no longer probable that the related tax benefit
will be realised.
A N N U A L R E P O R T 2 0 1 8 229S E M B C O R P M A R I N E228

NOTES TO THE FINANCIAL STATEMENTSYear ended 31 December 2018
3. SIGNIFICANT ACCOUNTING POLICIES (CONT’D)
3.17 Share capital
Ordinary shares are classified as equity.
Incremental costs directly attributable to the issuance of new ordinary shares and share options are deducted against
the share capital account, net of any tax effects.
Where the Company’s ordinary shares are repurchased (treasury shares), the consideration paid, excluding any directly
attributable incremental costs, is deducted from equity attributable to the Company’s equity holders and presented as
reserve for own shares within equity, until they are cancelled, sold or reissued.
When treasury shares are cancelled, the cost of treasury shares is deducted against the share capital account, if the
shares are purchased out of capital of the Company, or against the accumulated profits of the Company, if the shares
are purchased out of profits of the Company.
When treasury shares are subsequently sold or reissued pursuant to the Share-based Incentive Plans, the cost of the
treasury shares is reversed from the reserve for own shares account and the realised gain or loss on sale or reissue,
net of any directly attributable incremental transaction costs and related tax, is recognised as a change in equity of the
Company. No gain or loss is recognised in profit or loss.
3.18 Dividends
Dividends on ordinary shares are recognised when they are approved for payments. Dividends on ordinary shares
classified as equity are accounted for as movements in revenue reserve.
3.19 Revenue
(i) Contract revenue
The Group builds specialised assets for customers through fixed price contracts. Contracts relating to services
for ship and rig repair, building, conversion and overhaul represents a single performance obligation ("PO"), due
to the inter-dependence of services provided in these contracts.
Revenue is recognised when the control over the specialised asset has been transferred to the customer and
performance obligations are fulfilled. At contract inception, the Group assesses whether the Group transfers
control of the asset over time or at a point in time by determining if its performance creates an asset with an
alternative use to the Group and the Group has an enforceable right to payment for performance completed
to date for ship and rig building and conversion, or where the Group’s performance creates or enhances an
asset that the customer controls as the asset is being created or enhanced for ship and rig repairs and overhaul.
The specialised asset has no alternative use for the Group due to contractual restriction, and the Group has
enforceable rights to payment arising from the contractual terms. For these contracts, revenue is recognised
over time by reference to the Group’s progress towards completing the construction of the specialised asset.
The stage of completion is typically assessed by reference to surveys of work performed (output method),
which is commensurate with the pattern of transfer of control to the customer.
A N N U A L R E P O R T 2 0 1 8 229S E M B C O R P M A R I N E228

NOTES TO THE FINANCIAL STATEMENTSYear ended 31 December 2018
3. SIGNIFICANT ACCOUNTING POLICIES (CONT’D)
3.19 Revenue (cont’d)
(i) Contract revenue (cont’d)
For certain contracts where the Group does not have enforceable right to payment, revenue is recognised only
when the completed specialised asset is delivered to the customers and the customers have accepted it in
accordance with the contract. On signing of the contract, customers are usually required to make an advance
payment that is non-refundable if the contract is cancelled. The advance payment is presented as contract
liability. No financing component has been recognised on these advance payments as the payment terms are
for reasons other than financing. Where extended payment terms are granted to customers, interest is charged
and recognised as finance income.
The period between the transfer of the promised goods and payment by the customer may exceed one year.
For such contracts, the Group recognises a financing component using a discount rate that reflects this as a
separate financing transaction with the customer at contract inception. If the period between transfer and
payment is one year or less, the Group elects the practical expedient not to adjust for significant financing
component.
Transaction price is the amount of consideration in the contract to which the Group expects to be entitled to
in exchange for transferring the promised goods or services. The transaction price may be fixed or variable,
and is adjusted for time value of money if the contract includes a significant financing component. When
consideration is variable, the estimated amount is included in the transaction price to the extent that it is highly
probable that a significant reversal of the cumulative revenue will not occur when the uncertainty associated
with the variable consideration is resolved.
Estimates of revenues, costs or extent of progress toward completion are revised if circumstances change. Any
resulting increases or decreases in estimated revenues or costs are reflected in profit or loss in the period in
which the circumstances that give rise to the revision become known by management.
Certain contracts include standard warranty terms as guarantee on the performance of the asset. The warranty
is recognised as a provision, based on estimated claims made from historical data, from known and expected
warranty work and contractual obligation for further work to be performed after completion. The warranty
expense incurred could be higher or lower than the provision made.
The Group accounts for modifications to the scope and price of a contract as separate contracts if the
modification adds distinct goods or services at their stand-alone selling prices. For contract modifications
that add distinct goods or services but not at their stand-alone selling prices, the Group combines the
remaining consideration in the original contract with the consideration promised in the modification to create
a new transaction price that is then allocated to all remaining performance obligations to be satisfied. For
contract modifications that do not add distinct goods or services, the Group accounts for the modifications
as continuation of the original contract and recognises as a cumulative adjustment to revenue at the date
of modification.
The customer is invoiced on a milestone payment schedule. If the value of the goods transferred by the Group
exceeds the payments received, a contract asset is recognised. The contract asset is transferred to receivables
when the entitlement to payment becomes unconditional. If the payments received exceed the value of the
goods transferred, a contract liability is recognised.
A N N U A L R E P O R T 2 0 1 8 231S E M B C O R P M A R I N E230

NOTES TO THE FINANCIAL STATEMENTSYear ended 31 December 2018
3. SIGNIFICANT ACCOUNTING POLICIES (CONT’D)
3.19 Revenue (cont’d)
(i) Contract revenue (cont’d)
For costs incurred in fulfilling the contract which are within the scope of another SFRS(I) (e.g. Inventories), these
have been accounted for in accordance with those other SFRS(I). If these are not within the scope of another
SFRS(I), the Group will capitalise these as contract costs only if (a) these cost relate directly to a contract or an
anticipated contract which the Group can specifically identify; (b) these costs generate or enhance resources of
the Group that will be used in satisfying (or in continuing to satisfy) performance obligations in the future; and
(c) these costs are expected to be recovered. Otherwise, such costs are recognised as an expense immediately.
Capitalised contract costs are subsequently amortised on a systematic basis as the Group recognises the
related revenue over time. An impairment loss is recognised in the profit or loss to the extent that the carrying
amount of capitalised contract costs exceeds the expected remaining consideration less any directly related
costs not yet recognised as expenses.
(ii) Income on goods sold and services rendered
Revenue from goods sold and services rendered in the ordinary course of business is recognised when the
Group satisfies a performance obligation ("PO") by transferring control of a promised good or service to the
customer. Revenue recognised is the amount of the transaction price allocated to the satisfied PO.
The transaction price is allocated to each PO on the basis of the relative stand-alone selling prices of the
promised goods or services and excludes goods and services or other sales taxes. Trade discounts or variable
considerations are allocated to one or more, but not all, of the POs if they relate specifically to those POs.
Transaction price is the amount of consideration in the contract to which the Group expects to be entitled to
in exchange for transferring the promised goods or services. The transaction price may be fixed or variable,
and is adjusted for time value of money if the contract includes a significant financing component. When
consideration is variable, the estimated amount is included in the transaction price to the extent that it is highly
probable that a significant reversal of the cumulative revenue will not occur when the uncertainty associated
with the variable consideration is resolved.
No revenue is recognised if there are significant uncertainties regarding recovery of the consideration due,
associated costs or the possible return of goods.
Revenue may be recognised at a point in time or over time following the satisfaction of the PO. If a PO is
satisfied over time, revenue is recognised based on the percentage of completion reflecting the progress
towards complete satisfaction of the PO.
(iii) Charter hire and rental income
Charter hire and rental income receivable under operating leases is recognised in profit or loss on a straight-
line basis over the term of the lease. Lease incentives granted are recognised as an integral part of the total
rental income, over the term of the lease. Contingent rentals are recognised as income in the accounting
period in which they are earned.
3.20 Dividend and finance income
Dividend income is recognised in profit or loss on the date that the Group’s right to receive payment is established.
Finance income is recognised in profit or loss as it accrues, using the effective interest rate method.
A N N U A L R E P O R T 2 0 1 8 231S E M B C O R P M A R I N E230

NOTES TO THE FINANCIAL STATEMENTSYear ended 31 December 2018
3. SIGNIFICANT ACCOUNTING POLICIES (CONT’D)
3.21 Leases
The Group determines whether an arrangement is or contains a lease at inception.
At the inception or upon reassessment of the arrangement, the Group separates payments and other consideration
required by such an arrangement into those for the lease and those for other elements on the basis of their relative
fair values.
(i) Operating lease
When entities within the Group are lessees of an operating lease
Where the Group has the use of assets under operating leases, payments made under the leases are recognised
in profit or loss on a straight-line basis over the term of the lease. Lease incentives received are recognised in
profit or loss as an integral part of the total lease payments made.
When entities within the Group are lessors of an operating lease
Assets subject to operating leases are included in investment properties and are measured at cost less
accumulated depreciation and impairment losses. Rental income (net of any incentives given to lessees) is
recognised on a straight-line basis over the lease term.
(ii) Finance lease
When entities within the Group are lessors of a finance lease
Amounts due from lessees under finance leases are recorded as receivables at the amount of the Group’s net
investment in the leases. Finance lease income is allocated to accounting periods so as to reflect a constant
periodic rate of return on the Group’s net investment outstanding in respect of the leases.
3.22 Finance costs
Finance costs comprise of interest expense on borrowings, amortisation of capitalised transaction costs and
transaction costs written off. Interest expense and similar charges are expensed in profit or loss in the period using the
effective interest method, except to the extent that they are capitalised as being directly attributable to the acquisition,
construction or production of a qualifying asset. The interest component of finance lease payments is recognised in
profit or loss using the effective interest method. Termination of interest rate swaps are recognised in profit or loss.
In calculating the interest income and expense, the effective interest rate is applied to the gross carrying amount of the
asset (when the asset is not credit-impaired) or to the amortised cost of the liability. However, for financial assets that
have become credit-impaired subsequent to initial recognition, interest income is calculated by applying the effective
interest rate to the amortised financial asset. If the asset is no longer credit-impaired, then the calculation of interest
income reverts to gross basis.
3.23 Earnings per share
The Group presents basic and diluted earnings per share (“EPS”) data for its ordinary shares. Basic EPS is calculated by
dividing the profit or loss attributable to owners of the Company by the weighted average number of ordinary shares
outstanding during the year, adjusted for own shares held. Diluted EPS is determined by adjusting the profit or loss
attributable to owners of the Company and the weighted average number of ordinary shares outstanding, adjusted
for own shares held, for the effects of all dilutive potential ordinary shares, which comprise awards of share options
granted to employees.
A N N U A L R E P O R T 2 0 1 8 233S E M B C O R P M A R I N E232

NOTES TO THE FINANCIAL STATEMENTSYear ended 31 December 2018
3. SIGNIFICANT ACCOUNTING POLICIES (CONT’D)
3.24 Segment reporting
An operating segment is a component of the Group that engages in business activities from which it may earn
revenues and incur expenses, including revenues and expenses that relate to transactions with any of the Group’s
other components. All operating segments’ operating results are reviewed regularly by the Group’s President & CEO
to make decisions about resources to be allocated to the segment and assess its performance, and for which discrete
financial information is available.
Segment capital expenditure is the total cost incurred during the year to acquire property, plant and equipment, and
intangible assets other than goodwill.
3.25 Financial guarantee contracts
Financial guarantee contracts are accounted for as insurance contracts and treated as contingent liabilities until such
time as they become probable that the Company will be required to make a payment under the guarantee. A provision
is recognised based on the Group’s estimate of the ultimate cost of settling all claims incurred but unpaid at the
balance sheet date. The provision is assessed by reviewing individual claims and tested for adequacy by comparing the
amount recognised and the amount that would be required to settle the guarantee contract.
3.26 Fair value measurement
Fair value is the price that would be received to sell an asset or paid to transfer a liability in an orderly transaction
between market participants at the measurement date in the principal or in its absence, the most advantageous market
to which the Group has access at that date.
The best evidence of the fair value of a financial instrument at initial recognition is normally the transaction price,
that is, the fair value of the consideration given or received. When available, the Group measures the fair value of an
instrument using the quoted price in an active market for that instrument.
If there is no quoted price in an active market, then the Group uses valuation techniques that maximise the use of
relevant observable inputs and minimise the use of unobservable inputs. The chosen valuation technique incorporates
all of the factors that market participants would take into account in pricing a transaction.
The Group recognises transfers between levels of the fair value hierarchy as of the end of the reporting period during
which the change has occurred.
3.27 Assets held for sale
Non-current assets are classified as assets held for sale and measured at the lower of carrying amount and fair value
less costs to sell if they are expected to be recovered principally through a sale transaction rather than through
continuing use.
Any impairment losses on initial classification and subsequent gains or losses on re-measurement are recognised in
profit or loss. Subsequent increases in fair value less costs to sell are recognised in profit or loss (not exceeding the
accumulated impairment loss that has been previously recognised).
A N N U A L R E P O R T 2 0 1 8 233S E M B C O R P M A R I N E232
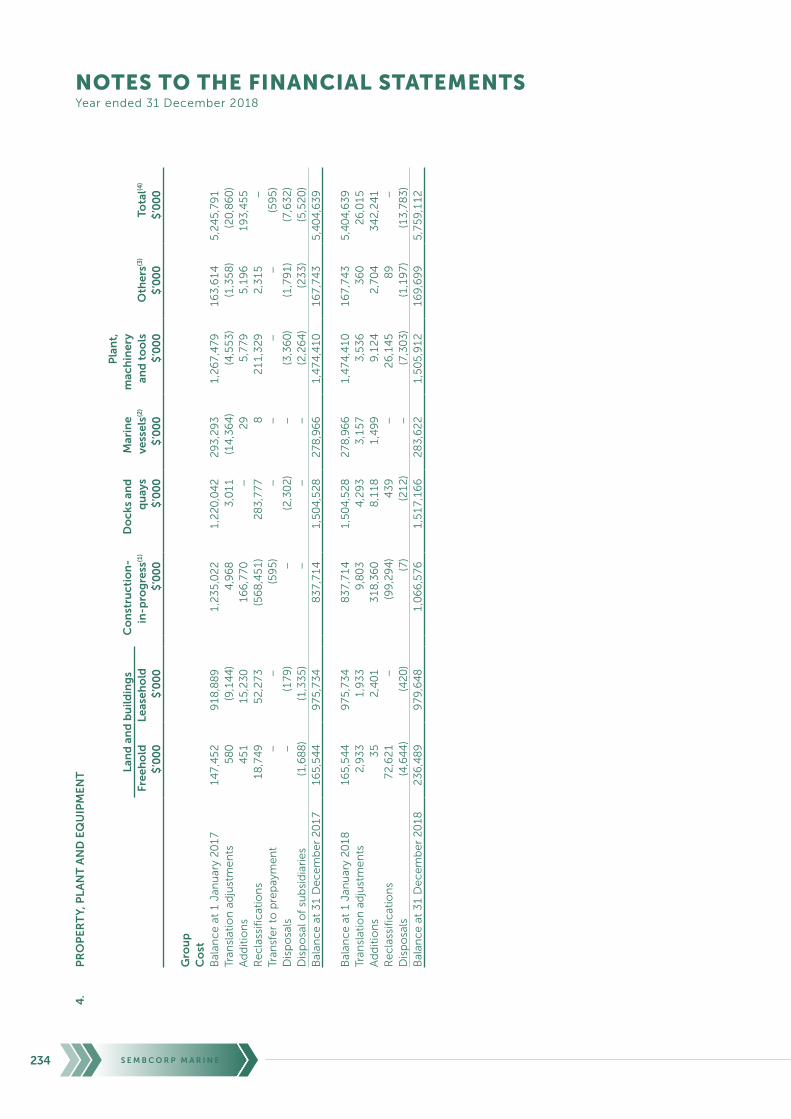
NOTES TO THE FINANCIAL STATEMENTSYear ended 31 December 2018
4.
PR
OP
ER
TY,
PL
AN
T A
ND
EQ
UIP
ME
NT
Pla
nt,
Lan
d a
nd
bu
ildin
gs
Co
nst
ruct
ion
-D
ock
s an
dM
arin
e m
ach
iner
y Fr
eeh
old
Leas
eho
ldin
-pro
gre
ss(1
)q
uay
sve
ssel
s(2)
and
to
ols
Oth
ers(3
)To
tal(4
)
$’0
00
$’0
00
$’0
00
$’0
00
$’0
00
$’0
00
$’0
00
$’0
00
Gro
up
Co
stB
alan
ce
at
1 J
anu
ary
20
17
14
7,4
52
91
8,8
89
1,2
35
,02
21
,22
0,0
42
29
3,2
93
1,2
67
,47
91
63
,61
45
,24
5,7
91
Tran
slat
ion
ad
just
me
nts
58
0(9
,14
4)
4,9
68
3,0
11
(14
,36
4)
(4,5
53
)(1
,35
8)
(20
,86
0)
Ad
dit
ion
s4
51
15
,23
01
66
,77
0–
29
5,7
79
5,1
96
19
3,4
55
Re
cla
ssif
icat
ion
s1
8,7
49
52
,27
3(5
68
,45
1)
28
3,7
77
82
11
,32
92
,31
5–
Tran
sfe
r to
pre
pay
me
nt
––
(59
5)
––
––
(59
5)
Dis
po
sals
–(1
79
)–
(2,3
02
)–
(3,3
60
)(1
,79
1)
(7,6
32
)D
isp
osa
l of
sub
sid
iari
es
(1,6
88
)(1
,33
5)
––
–(2
,26
4)
(23
3)
(5,5
20
)B
alan
ce
at
31
De
ce
mb
er
20
17
16
5,5
44
97
5,7
34
83
7,7
14
1,5
04
,52
82
78
,96
61
,47
4,4
10
16
7,7
43
5,4
04
,63
9
Bal
anc
e a
t 1
Jan
uar
y 2
01
81
65
,54
49
75
,73
48
37
,71
41
,50
4,5
28
27
8,9
66
1,4
74
,41
01
67
,74
35
,40
4,6
39
Tran
slat
ion
ad
just
me
nts
2,9
33
1,9
33
9,8
03
4,2
93
3,1
57
3,5
36
36
02
6,0
15
Ad
dit
ion
s3
52
,40
13
18
,36
08
,11
81
,49
99
,12
42
,70
43
42
,24
1R
ec
lass
ific
atio
ns
72
,62
1–
(99
,29
4)
43
9–
26
,14
58
9–
Dis
po
sals
(4,6
44
)(4
20
)(7
)(2
12
)–
(7,3
03
)(1
,19
7)
(13
,78
3)
Bal
anc
e a
t 3
1 D
ec
em
be
r 2
01
82
36
,48
99
79
,64
81
,06
6,5
76
1,5
17
,16
62
83
,62
21
,50
5,9
12
16
9,6
99
5,7
59
,11
2
A N N U A L R E P O R T 2 0 1 8 235S E M B C O R P M A R I N E234

NOTES TO THE FINANCIAL STATEMENTSYear ended 31 December 2018
4.
PR
OP
ER
TY,
PL
AN
T A
ND
EQ
UIP
ME
NT
(C
ON
T’D
)
Pla
nt,
Lan
d a
nd
bu
ildin
gs
Co
nst
ruct
ion
-D
ock
s an
dM
arin
e m
ach
iner
y Fr
eeh
old
Leas
eho
ldin
-pro
gre
ss(1
)q
uay
sve
ssel
s(2)
and
to
ols
Oth
ers(3
)To
tal(4
)
$’0
00
$’0
00
$’0
00
$’0
00
$’0
00
$’0
00
$’0
00
$’0
00
Gro
up
Acc
um
ula
ted
dep
reci
atio
n a
nd
imp
airm
ent
loss
esB
alan
ce
at
1 J
anu
ary
20
17
9,6
31
25
9,1
12
–2
28
,98
95
0,8
92
61
4,5
51
95
,94
91
,25
9,1
24
Tran
slat
ion
ad
just
me
nts
(66
)(3
,55
4)
–(7
1)
(1,9
96
)(3
,96
5)
(1,1
30
)(1
0,7
82
)D
ep
rec
iati
on
fo
r th
e y
ear
5,4
04
38
,24
5–
38
,48
21
1,3
88
59
,06
81
7,4
61
17
0,0
48
Re
cla
ssif
icat
ion
s1
60
(16
0)
––
(20
5)
22
1(1
6)
–D
isp
osa
ls–
(87
)–
(47
6)
–(2
,50
4)
(1,7
20
)(4
,78
7)
Dis
po
sal o
f su
bsi
dia
rie
s(6
11
)(1
,23
7)
––
–(1
,94
8)
(18
7)
(3,9
83
)B
alan
ce
at
31
De
ce
mb
er
20
17
14
,51
82
92
,31
9–
26
6,9
24
60
,07
96
65
,42
31
10
,35
71
,40
9,6
20
Bal
anc
e a
t 1
Jan
uar
y 2
01
81
4,5
18
29
2,3
19
–2
66
,92
46
0,0
79
66
5,4
23
11
0,3
57
1,4
09
,62
0Tr
ansl
atio
n a
dju
stm
en
ts1
93
86
0–
33
06
58
95
12
81
3,2
73
De
pre
cia
tio
n f
or
the
ye
ar3
,35
03
7,1
66
–4
5,6
48
11
,14
55
7,9
91
15
,45
21
70
,75
2D
isp
osa
ls(8
62
)(2
71
)–
(21
2)
–(5
,91
9)
(1,1
89
)(8
,45
3)
Imp
airm
en
t lo
sse
s–
––
–4
,66
3–
–4
,66
3B
alan
ce
at
31
De
ce
mb
er
20
18
17
,19
93
30
,07
4–
31
2,6
90
76
,54
57
18
,44
61
24
,90
11
,57
9,8
55
Car
ryin
g a
mo
un
tsA
t 1
Jan
uar
y 2
01
71
37
,82
16
59
,77
71
,23
5,0
22
99
1,0
53
24
2,4
01
65
2,9
28
67
,66
53
,98
6,6
67
At
31
De
ce
mb
er
20
17
15
1,0
26
68
3,4
15
83
7,7
14
1,2
37
,60
42
18
,88
78
08
,98
75
7,3
86
3,9
95
,01
9A
t 3
1 D
ec
em
be
r 2
01
82
19
,29
06
49
,57
41
,06
6,5
76
1,2
04
,47
62
07
,07
77
87
,46
64
4,7
98
4,1
79
,25
7
A N N U A L R E P O R T 2 0 1 8 235S E M B C O R P M A R I N E234

NOTES TO THE FINANCIAL STATEMENTSYear ended 31 December 2018
4. PROPERTY, PLANT AND EQUIPMENT (CONT’D)
Docks
Plant,
machinery
and tools Others(3) Total$’000 $’000 $’000 $’000
CompanyCostBalance at 1 January 2017 160,505 2,240 36,596 199,341Additions – – 2,540 2,540Balance at 31 December 2017 160,505 2,240 39,136 201,881
Balance at 1 January 2018 160,505 2,240 39,136 201,881Additions – – 22 22Balance at 31 December 2018 160,505 2,240 39,158 201,903
Accumulated depreciationBalance at 1 January 2017 98,731 1,703 8,410 108,844Depreciation for the year 6,927 67 6,625 13,619Balance at 31 December 2017 105,658 1,770 15,035 122,463
Balance at 1 January 2018 105,658 1,770 15,035 122,463Depreciation for the year 15,127 134 6,191 21,452Balance at 31 December 2018 120,785 1,904 21,226 143,915
Carrying amountsAt 1 January 2017 61,774 537 28,186 90,497At 31 December 2017 54,847 470 24,101 79,418At 31 December 2018 39,720 336 17,932 57,988
The property, plant and equipment comprise mainly shipyards assets attributable to the “rigs & floaters, repairs &
upgrades, offshore platforms and specialised shipbuilding” operating segment. Within this operating segment, there
are two key cash generating units in Singapore and Brazil. These property, plant and equipment, together with certain
intangible assets were tested for impairment and described in Note 44.
(1) During the year, interest charge of $12,186,000 (2017: $53,288,000; 1 January 2017: $117,250,000) was capitalised as construction-in-progress.
(2) The existing 5-year time charter contract of the Group’s marine accommodation vessel ended during the year. As the Group expects to recover the value of the accommodation vessel through continuing use on a charter basis, the Group used the discounted cash flow projections to determine the recoverable amount. The cash flows projection took into account the expected renewal rates based on prevailing market conditions. The renewal rates have been adjusted assuming a certain level of discount from the contractual rates under the last charter contract but factored another 2% inflationary adjustment till the end of the economic useful life of the vessel. The assumed operating cost is based on approved budget and adjusted for inflation at 2% per annum throughout the cash flow periods. The utilisation rate is assumed to be at 95% throughout the cash flow periods; and the terminal value is based on expected scrap value at the end of the economic useful life of the vessel. These cash flows are then discounted using the weighted average cost of capital determined to be at 12.66% (2017: 9.55%; 1 January 2017: 9.55%). Based on the Group’s assessment of the recoverable amount of the marine accommodation vessel of $196,463,000, impairment loss of $4,663,000 (2017: Nil) was recognised in the current year’s profit or loss. The above assumptions are inherently judgemental. Any unfavourable changes to the above assumptions would lead to additional impairment.
(3) Others comprise motor vehicles, furniture and office equipment, utilities and fittings, and computer equipment.
(4) During the year, property, plant and equipment included additional provision for restoration costs amounting to $1,083,000 (2017: $14,608,000) (Note 21).
A N N U A L R E P O R T 2 0 1 8 237S E M B C O R P M A R I N E236

NOTES TO THE FINANCIAL STATEMENTSYear ended 31 December 2018
4. PROPERTY, PLANT AND EQUIPMENT (CONT’D)
Change in estimates
As part of the Group’s transformation and yard consolidation strategy, the Group is scheduled to move out completely
from its yard at Tanjong Kling Road (“Tanjong Kling Yard”) by end 2019 and return the yard to the Government ahead
of its original schedule. Accordingly, the Group has revised its estimates for the useful lives of certain assets at Tanjong
Kling Yard in 2018. The effect of these changes on depreciation expense in current and future periods on assets
currently held is as follows:
2018 2019 2020 2021 2022 Later$’000 $’000 $’000 $’000 $’000 $’000
GroupIncrease/(decrease) in
depreciation expense and
decrease/(increase) in
profit before tax 10,978 43,902 (9,554) (9,382) (9,194) (26,750)
CompanyIncrease/(decrease) in
depreciation expense and
decrease/(increase) in
profit before tax 9,769 39,079 (8,542) (8,370) (8,182) (23,754)
5. INVESTMENT PROPERTIES
Company2018 2017$’000 $’000
CostBalance at 1 January and 31 December 62,664 62,664
Accumulated depreciationBalance at 1 January 45,474 43,658Depreciation for the year 3,320 1,816Balance at 31 December 48,794 45,474
Carrying amountsAt 1 January 17,190 19,006At 31 December 13,870 17,190
The investment properties of the Company are used by the Group in carrying out its principal activities and are
reclassified as property, plant and equipment at the Group. In 2018, the Company revised its estimates for the useful
lives of these assets and the effects are included in the Group’s balances in Note 4.
The following amounts are recognised in profit or loss:
Company2018 2017$’000 $’000
Rental income (35,573) (27,299)Operating expenses arising from rental of investment properties 30,824 21,939
A N N U A L R E P O R T 2 0 1 8 237S E M B C O R P M A R I N E236

NOTES TO THE FINANCIAL STATEMENTSYear ended 31 December 2018
6. INVESTMENTS IN SUBSIDIARIES
Company31 December
2018
31 December
2017
1 January
2017$’000 $’000 $’000
Unquoted shares, at cost 1,786,386 1,498,771 980,137Allowance for impairment loss – (15,251) (15,251)
1,786,386 1,483,520 964,886
Details of the Company’s subsidiaries are set out in Note 45.
7. INTERESTS IN ASSOCIATES AND JOINT VENTURES
Group Company31 December
2018
31 December
2017
1 January
2017
31 December
2018
31 December
2017
1 January
2017$’000 $’000 $’000 $’000 $’000 $’000
Interests in associates 822 4,922 5,425 – – –Less: allowance for
impairment loss (342) (2,120) (2,120) – – –480 2,802 3,305 – – –
Interests in joint ventures 66,053 65,163 71,511 – – –66,533 67,965 74,816 – – –
The impairment loss on investment in associates relates mainly to one of the Group’s associates whereby the Group
independently and separately from the associate, performed an impairment analysis in accordance with SFRS(I) 1-28
Investments in Associates and Joint Ventures and SFRS(I) 1- 36 Impairment of Assets. The Group continues to record
an allowance of impairment loss of $1,778,000 (2017: $1,778,000; 1 January 2017: $1,778,000) on this associate. The
recoverable amount was estimated based on its value in use calculation. The Group applied the relief from royalty
method to value the existing intellectual properties owned by the associate, and discounted the related cash flows at
pre-tax discount rates of 6% to 25% (2017: 20% to 22%; 1 January 2017: 20% to 21%), depending on the life cycle of
each intellectual property. These cash flows cover the projection periods ranging from 12 to 16 years, based on the
remaining estimated useful life of the intellectual properties. As at the reporting date, the Group had reclassified this
investment to asset held for sale (see Note 16).
In 2018 and 2017, the Group did not receive dividends from its associates and joint ventures.
Associates
Subsequent to the disposal of Cosco Shipyard Group Co., Ltd (which was completed in January 2017), no individual
associates are considered to be material to the Group as at 31 December 2018. All are equity accounted. Summarised
financial information of associates presented in aggregate, representing the Group’s share, is as follows:
31 December
2018
31 December
2017
1 January
2017$’000 $’000 $’000
Carrying amount 480 2,802 3,305
Loss for the year (665) (503)Other comprehensive income – –Total comprehensive income (665) (503)
A N N U A L R E P O R T 2 0 1 8 239S E M B C O R P M A R I N E238

NOTES TO THE FINANCIAL STATEMENTSYear ended 31 December 2018
7. INTERESTS IN ASSOCIATES AND JOINT VENTURES (CONT’D)
Joint ventures
The Group has a number of joint ventures that are individually immaterial to the Group. All are equity accounted.
Summarised financial information of joint ventures presented in aggregate, representing the Group’s share, is as follows:
31 December
2018
31 December
2017
1 January
2017$’000 $’000 $’000
Carrying amount 66,053 65,163 71,511
Loss for the year (1,720) (3,114)Other comprehensive income 599 (3,234)Total comprehensive income (1,121) (6,348)
8. OTHER FINANCIAL ASSETS
Group Company31 December
2018
31 December
2017
1 January
2017
31 December
2018
31 December
2017
1 January
2017$’000 $’000 $’000 $’000 $’000 $’000
(a) Non-current assets
Available-for-sale
financial assets:– Quoted equity
shares, at
fair value – 18,200 51,667 – 18,200 40,075– Unit trusts, at
fair value – 694 537 – 694 537– Unquoted equity
shares, at cost – 2,642 2,642 – – –– 21,536 54,846 – 18,894 40,612
Financial assets
at fair value
through other
comprehensive
income:– Unquoted equity
shares 2,642 – – – – –
Cash flow hedges:– Forward foreign
currency
contracts 239 24,614 12,514 – – –– Interest rate
swaps – – 423 – – –2,881 46,150 67,783 – 18,894 40,612
A N N U A L R E P O R T 2 0 1 8 239S E M B C O R P M A R I N E238

NOTES TO THE FINANCIAL STATEMENTSYear ended 31 December 2018
8. OTHER FINANCIAL ASSETS (CONT’D)
Group Company31 December
2018
31 December
2017
1 January
2017
31 December
2018
31 December
2017
1 January
2017$’000 $’000 $’000 $’000 $’000 $’000
(b) Current assets
Fair value hedges:– Firm
commitments – 692 4,146 – – –
Financial assets at
fair value through
profit or loss
(mandatorily
measured
(2017: on initial
recognition)):– Forward foreign
currency
contracts – – 18,829 – – –
Cash flow hedges:– Forward foreign
currency
contracts 11,949 32,423 27,160 – – –– Interest rate
swaps 334 456 1,602 – – –12,283 33,571 51,737 – – –
At 1 January 2018, the Group designated the investments in equity shares as at fair value through other
comprehensive income, as these investments represent investments that the Group intends to hold for
long-term strategic purposes. In 2017, these investments were classified as available-for-sale.
In 2017, the cumulative fair value loss of available-for-sale financial assets of $2,275,000 (1 January 2017:
$8,978,000) previously resided in equity was reclassified to profit or loss, when the available-for-sale financial assets
were impaired.
During the year, the Group disposed of its quoted equity shares to maximise returns after assessing the market
outlook for the investment. The investment had been disposed in parts between March 2018 to May 2018, at
total proceeds of $6,861,000. The Group recorded an accumulated loss on disposal of $3,502,000 in fair value
reserve during the year, which had been transferred to revenue reserve as at 31 December 2018.
A N N U A L R E P O R T 2 0 1 8 241S E M B C O R P M A R I N E240

NOTES TO THE FINANCIAL STATEMENTSYear ended 31 December 2018
9.
TR
AD
E A
ND
OT
HE
R R
EC
EIV
AB
LES
31
Dec
emb
er 2
01
83
1 D
ecem
ber
20
17
1 J
anu
ary
20
17
No
te
No
n-
curr
ent
Cu
rren
tTo
tal
No
n-
curr
ent
Cu
rren
tTo
tal
No
n-
curr
ent
Cu
rren
tTo
tal
$’0
00
$’0
00
$’0
00
$’0
00
$’0
00
$’0
00
$’0
00
$’0
00
$’0
00
Gro
up
Trad
e r
ec
eiv
able
s9
52
,98
95
54
,14
31
,50
7,1
32
11
7,6
43
62
9,1
49
74
6,7
92
–5
50
,19
35
50
,19
3A
mo
un
ts d
ue
fro
m r
ela
ted
par
tie
s1
03
1,5
10
6,6
06
38
,11
63
5,1
27
8,2
76
43
,40
33
6,5
60
11
,36
94
7,9
29
Staf
f lo
ans
(a)
–6
46
4–
83
83
–1
97
19
7G
ST r
efu
nd
able
–1
7,8
43
17
,84
3–
19
,42
01
9,4
20
–2
3,3
80
23
,38
0In
tere
st r
ec
eiv
able
–2
93
29
3–
37
43
74
–2
18
21
8D
ep
osi
ts–
3,1
89
3,1
89
–1
,11
61
,11
6–
2,5
53
2,5
53
Sun
dry
re
ce
ivab
les
–1
4,9
46
14
,94
6–
27
,33
12
7,3
31
–8
,39
88
,39
8U
nb
ille
d r
ec
eiv
able
s–
11
,23
51
1,2
35
–2
2,3
44
22
,34
4–
16
,20
61
6,2
06
Loan
re
ce
ivab
les
(b)
13
7,0
00
20
5,5
00
34
2,5
00
––
––
––
Re
co
vera
ble
–6
,42
86
,42
8–
8,8
73
8,8
73
–1
3,2
62
13
,26
21
,12
1,4
99
82
0,2
47
1,9
41
,74
61
52
,77
07
16
,96
68
69
,73
63
6,5
60
62
5,7
76
66
2,3
36
Loss
allo
wan
ce
–(1
61
,48
8)
(16
1,4
88
)–
(16
5,5
81
)(1
65
,58
1)
–(1
72
,68
9)
(17
2,6
89
)Fi
nan
cia
l ass
ets
at
amo
rtis
ed
co
st (
20
17
:
Loan
s an
d r
ec
eiv
able
s)1
,12
1,4
99
65
8,7
59
1,7
80
,25
81
52
,77
05
51
,38
57
04
,15
53
6,5
60
45
3,0
87
48
9,6
47
Pre
pay
me
nts
an
d a
dva
nc
es
14
,62
53
1,7
91
46
,41
61
5,9
70
89
,09
61
05
,06
61
6,5
35
94
,59
01
11
,12
51
,13
6,1
24
69
0,5
50
1,8
26
,67
41
68
,74
06
40
,48
18
09
,22
15
3,0
95
54
7,6
77
60
0,7
72
(a)
Staf
f lo
ans
Staf
f lo
ans
are
un
sec
ure
d a
nd
be
ar in
tere
st a
t 3
.0%
(2
01
7:
3.0
%;
1 J
anu
ary
20
17
: 3
.0%
) p
er
ann
um
.
(b)
Loan
rec
eiva
ble
s
Th
e n
on
-cu
rre
nt
loan
re
ce
ivab
les
rela
tes
to lo
an e
xte
nd
ed
to
a c
ust
om
er.
Th
e lo
an b
ear
s in
tere
st a
t Li
bo
r p
lus
4%
mar
gin
pe
r an
nu
m u
po
n p
hys
ical
de
live
ry o
f a
vess
el t
o t
he
cu
sto
me
r, is
un
sec
ure
d a
nd
re
pay
able
aft
er
20
19
.
A N N U A L R E P O R T 2 0 1 8 241S E M B C O R P M A R I N E240
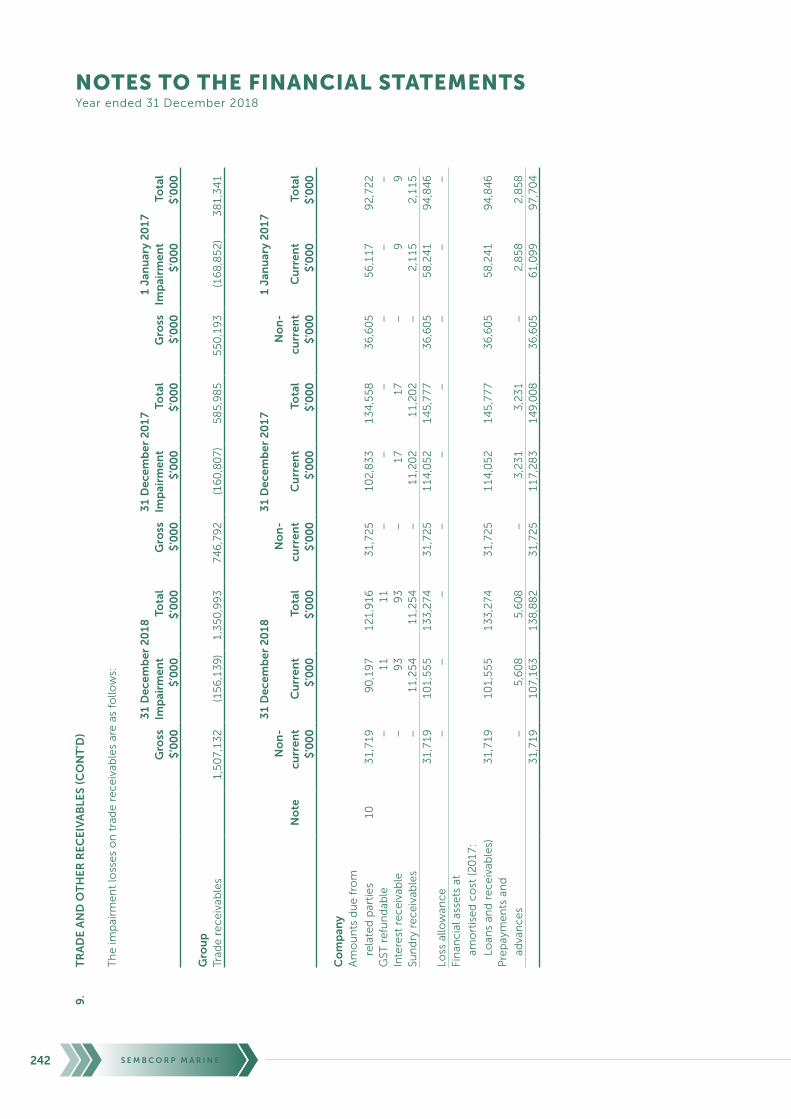
NOTES TO THE FINANCIAL STATEMENTSYear ended 31 December 2018
9.
TR
AD
E A
ND
OT
HE
R R
EC
EIV
AB
LES
(CO
NT
’D)
Th
e im
pai
rme
nt
loss
es
on
tra
de
re
ce
ivab
les
are
as
follo
ws:
31
Dec
emb
er 2
01
83
1 D
ecem
ber
20
17
1 J
anu
ary
20
17
Gro
ssIm
pai
rmen
tTo
tal
Gro
ssIm
pai
rmen
tTo
tal
Gro
ssIm
pai
rmen
tTo
tal
$’0
00
$’0
00
$’0
00
$’0
00
$’0
00
$’0
00
$’0
00
$’0
00
$’0
00
Gro
up
Trad
e r
ec
eiv
able
s1
,50
7,1
32
(15
6,1
39
)1
,35
0,9
93
74
6,7
92
(16
0,8
07
)5
85
,98
55
50
,19
3(1
68
,85
2)
38
1,3
41
31
Dec
emb
er 2
01
83
1 D
ecem
ber
20
17
1 J
anu
ary
20
17
No
te
No
n-
curr
ent
Cu
rren
tTo
tal
No
n-
curr
ent
Cu
rren
tTo
tal
No
n-
curr
ent
Cu
rren
tTo
tal
$’0
00
$’0
00
$’0
00
$’0
00
$’0
00
$’0
00
$’0
00
$’0
00
$’0
00
Co
mp
any
Am
ou
nts
du
e f
rom
rela
ted
par
tie
s1
03
1,7
19
90
,19
71
21
,91
63
1,7
25
10
2,8
33
13
4,5
58
36
,60
55
6,1
17
92
,72
2G
ST r
efu
nd
able
–1
11
1–
––
––
–In
tere
st r
ec
eiv
able
–9
39
3–
17
17
–9
9Su
nd
ry r
ec
eiv
able
s–
11
,25
41
1,2
54
–1
1,2
02
11
,20
2–
2,1
15
2,1
15
31
,71
91
01
,55
51
33
,27
43
1,7
25
11
4,0
52
14
5,7
77
36
,60
55
8,2
41
94
,84
6Lo
ss a
llow
anc
e–
––
––
––
––
Fin
anc
ial a
sse
ts a
t
amo
rtis
ed
co
st (
20
17
:
Loan
s an
d r
ec
eiv
able
s)3
1,7
19
10
1,5
55
13
3,2
74
31
,72
51
14
,05
21
45
,77
73
6,6
05
58
,24
19
4,8
46
Pre
pay
me
nts
an
d
adva
nc
es
–5
,60
85
,60
8–
3,2
31
3,2
31
–2
,85
82
,85
83
1,7
19
10
7,1
63
13
8,8
82
31
,72
51
17
,28
31
49
,00
83
6,6
05
61
,09
99
7,7
04
A N N U A L R E P O R T 2 0 1 8 243S E M B C O R P M A R I N E242
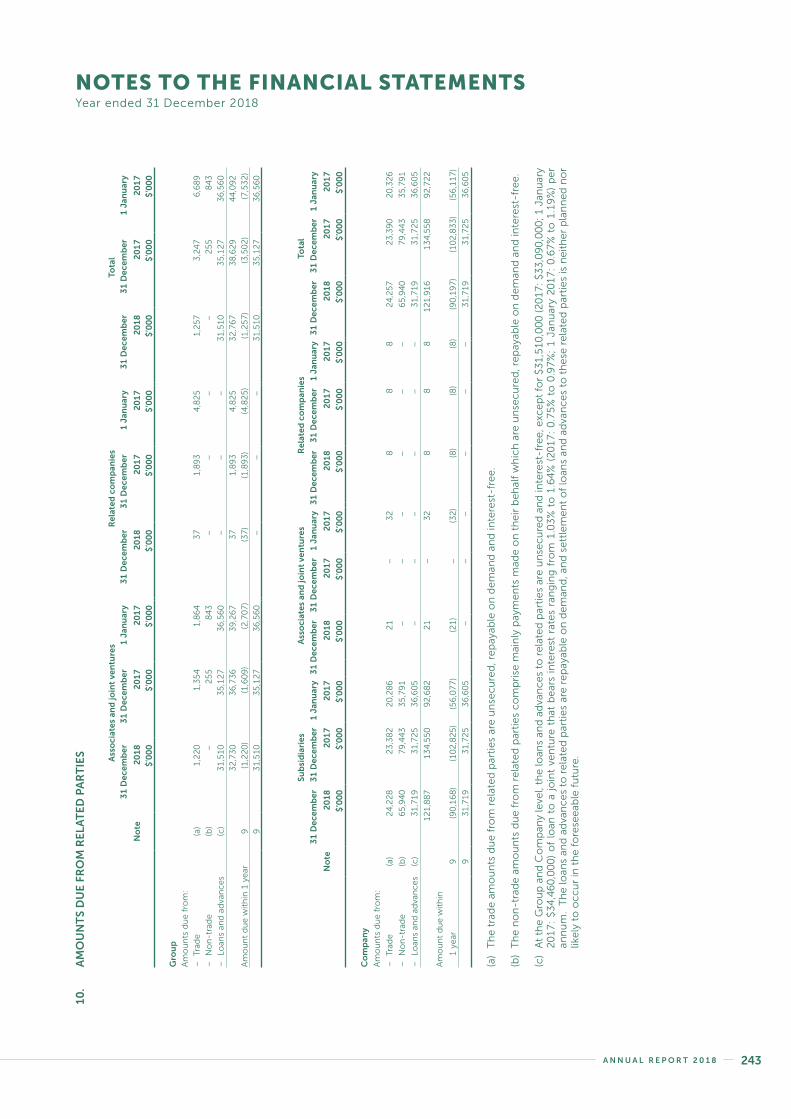
NOTES TO THE FINANCIAL STATEMENTSYear ended 31 December 2018
10
. A
MO
UN
TS
DU
E F
RO
M R
EL
AT
ED
PA
RT
IES Ass
oci
ates
an
d jo
int
ven
ture
sR
elat
ed c
om
pan
ies
Tota
l
No
te
31
Dec
emb
er
20
18
31
Dec
emb
er
20
17
1 J
anu
ary
20
17
31
Dec
emb
er
20
18
31
Dec
emb
er
20
17
1 J
anu
ary
20
17
31
Dec
emb
er
20
18
31
Dec
emb
er
20
17
1 J
anu
ary
20
17
$’0
00
$’0
00
$’0
00
$’0
00
$’0
00
$’0
00
$’0
00
$’0
00
$’0
00
Gro
up
Am
ou
nts
du
e f
rom
:
–
Trad
e(a
)1
,22
01
,35
41
,86
43
71
,89
34
,82
51
,25
73
,24
76
,68
9
–
No
n-t
rad
e(b
)–
25
58
43
––
––
25
58
43
–
Loan
s an
d a
dva
nc
es
(c)
31
,51
03
5,1
27
36
,56
0–
––
31
,51
03
5,1
27
36
,56
0
32
,73
03
6,7
36
39
,26
73
71
,89
34
,82
53
2,7
67
38
,62
94
4,0
92
Am
ou
nt
du
e w
ith
in 1
ye
ar9
(1,2
20
)(1
,60
9)
(2,7
07
)(3
7)
(1,8
93
)(4
,82
5)
(1,2
57
)(3
,50
2)
(7,5
32
)
93
1,5
10
35
,12
73
6,5
60
––
–3
1,5
10
35
,12
73
6,5
60
Sub
sid
iari
esA
sso
ciat
es a
nd
join
t ve
ntu
res
Rel
ated
co
mp
anie
sTo
tal
No
te
31
Dec
emb
er
20
18
31
Dec
emb
er
20
17
1 J
anu
ary
20
17
31
Dec
emb
er
20
18
31
Dec
emb
er
20
17
1 J
anu
ary
20
17
31
Dec
emb
er
20
18
31
Dec
emb
er
20
17
1 J
anu
ary
20
17
31
Dec
emb
er
20
18
31
Dec
emb
er
20
17
1 J
anu
ary
20
17
$’0
00
$’0
00
$’0
00
$’0
00
$’0
00
$’0
00
$’0
00
$’0
00
$’0
00
$’0
00
$’0
00
$’0
00
Co
mp
any
Am
ou
nts
du
e f
rom
:
–
Trad
e(a
)2
4,2
28
23
,38
22
0,2
86
21
–3
28
88
24
,25
72
3,3
90
20
,32
6
–
No
n-t
rad
e(b
)6
5,9
40
79
,44
33
5,7
91
––
––
––
65
,94
07
9,4
43
35
,79
1
–
Loan
s an
d a
dva
nc
es
(c)
31
,71
93
1,7
25
36
,60
5–
––
––
–3
1,7
19
31
,72
53
6,6
05
12
1,8
87
13
4,5
50
92
,68
22
1–
32
88
81
21
,91
61
34
,55
89
2,7
22
Am
ou
nt
du
e w
ith
in
1 y
ear
9(9
0,1
68
)(1
02
,82
5)
(56
,07
7)
(21
)–
(32
)(8
)(8
)(8
)(9
0,1
97
)(1
02
,83
3)
(56
,11
7)
93
1,7
19
31
,72
53
6,6
05
––
––
––
31
,71
93
1,7
25
36
,60
5
(a)
Th
e t
rad
e a
mo
un
ts d
ue
fro
m r
ela
ted
par
tie
s ar
e u
nse
cu
red
, re
pay
able
on
de
man
d a
nd
inte
rest
-fre
e.
(b)
Th
e n
on
-tra
de
am
ou
nts
du
e f
rom
re
late
d p
arti
es
co
mp
rise
mai
nly
pay
me
nts
mad
e o
n t
he
ir b
eh
alf
wh
ich
are
un
sec
ure
d, r
ep
ayab
le o
n d
em
and
an
d in
tere
st-f
ree
.
(c)
At
the
Gro
up
an
d C
om
pan
y le
vel,
the
loan
s an
d a
dva
nc
es
to r
ela
ted
par
tie
s ar
e u
nse
cu
red
an
d in
tere
st-f
ree
, exc
ep
t fo
r $
31
,51
0,0
00
(20
17
: $
33
,09
0,0
00
; 1
Jan
uar
y 2
01
7:
$3
4,4
60
,00
0)
of
loan
to
a j
oin
t ve
ntu
re t
hat
be
ars
inte
rest
rat
es
ran
gin
g f
rom
1.0
3%
to
1.6
4%
(2
01
7:
0.7
5%
to
0.9
7%
; 1
Jan
uar
y 2
01
7:
0.6
7%
to
1.1
9%
) p
er
ann
um
. T
he
loan
s an
d a
dva
nc
es
to r
ela
ted
par
tie
s ar
e r
ep
ayab
le o
n d
em
and
, an
d s
ett
lem
en
t o
f lo
ans
and
ad
van
ce
s to
th
ese
re
late
d p
arti
es
is n
eit
he
r p
lan
ne
d n
or
like
ly t
o o
cc
ur
in t
he
fo
rese
eab
le f
utu
re.
A N N U A L R E P O R T 2 0 1 8 243S E M B C O R P M A R I N E242

NOTES TO THE FINANCIAL STATEMENTSYear ended 31 December 2018
10
. A
MO
UN
TS
DU
E F
RO
M R
EL
AT
ED
PA
RT
IES
(CO
NT
’D)
Th
e im
pai
rme
nt
loss
es
on
am
ou
nts
du
e f
rom
ass
oc
iate
s an
d jo
int
ven
ture
s ar
e a
s fo
llow
s:
31
Dec
emb
er 2
01
83
1 D
ecem
ber
20
17
1 J
anu
ary
20
17
Gro
ssIm
pai
rmen
tTo
tal
Gro
ssIm
pai
rmen
tTo
tal
Gro
ssIm
pai
rmen
tTo
tal
$’0
00
$’0
00
$’0
00
$’0
00
$’0
00
$’0
00
$’0
00
$’0
00
$’0
00
Gro
up
Am
ou
nts
du
e f
rom
asso
cia
tes
and
join
t ve
ntu
res
38
,07
9(5
,34
9)
32
,73
04
1,5
10
(4,7
74
)3
6,7
36
43
,10
4(3
,83
7)
39
,26
7
A N N U A L R E P O R T 2 0 1 8 245S E M B C O R P M A R I N E244

NOTES TO THE FINANCIAL STATEMENTSYear ended 31 December 2018
11. CONTRACT ASSETS
Group31 December
2018
31 December
2017
1 January
2017$’000 $’000 $’000
Contract assets 998,666 652,361 440,832
The contract assets mainly relate to the Group’s rights to consideration for work completed but not yet billed at
reporting date on the long-term contracts for ship and rig building, conversion and repair. The contract assets are
transferred to trade receivables when the rights become unconditional. Significant changes in the contract assets
balances during the year are as follows:
2018 2017$’000 $’000
Transfer from contract assets recognised at the beginning of the year to receivables (452,879) (356,751)Recognition of revenue, net of recognised in receivables 799,306 568,773Impairment loss on contract assets (160) –
12. INTANGIBLE ASSETS
Note Goodwill
Club
memberships
Intellectual
property
rights Total$’000 $’000 $’000 $’000
GroupCostBalance at 1 January 2017 13,738 916 228,725 243,379Translation adjustments (21) – (1) (22)Disposals – (264) – (264)Balance at 31 December 2017 13,717 652 228,724 243,093
Balance at 1 January 2018 13,717 652 228,724 243,093Translation adjustments 5 – (144) (139)Acquisition of subsidiary and
intellectual property rights 38 – – 54,604 54,604Disposals – (62) – (62)Balance at 31 December 2018 13,722 590 283,184 297,496
Accumulated amortisation
and impairment lossesBalance at 1 January 2017 2,579 677 37,998 41,254Translation adjustments (21) – – (21)Amortisation for the year – – 22,868 22,868Disposals – (209) – (209)Balance at 31 December 2017 2,558 468 60,866 63,892
A N N U A L R E P O R T 2 0 1 8 245S E M B C O R P M A R I N E244

NOTES TO THE FINANCIAL STATEMENTSYear ended 31 December 2018
12. INTANGIBLE ASSETS (CONT’D)
Goodwill
Club
memberships
Intellectual
property
rights Total$’000 $’000 $’000 $’000
GroupAccumulated amortisation and
impairment lossesBalance at 1 January 2018 2,558 468 60,866 63,892Translation adjustments 5 – (29) (24)Amortisation for the year – – 24,694 24,694Balance at 31 December 2018 2,563 468 85,531 88,562
Carrying amountsAt 1 January 2017 11,159 239 190,727 202,125At 31 December 2017 11,159 184 167,858 179,201At 31 December 2018 11,159 122 197,653 208,934
Club
memberships2018 2017$’000 $’000
CompanyCostBalance at 1 January 652 652Disposals (62) –Balance at 31 December 590 652
Accumulated impairment lossesBalance at 1 January and 31 December 468 468
Carrying amountsAt 1 January 184 184At 31 December 122 184
A N N U A L R E P O R T 2 0 1 8 247S E M B C O R P M A R I N E246

NOTES TO THE FINANCIAL STATEMENTSYear ended 31 December 2018
12. INTANGIBLE ASSETS (CONT’D)
Amortisation
The amortisation of intangible assets amounting to $24,694,000 (2017: $22,868,000) is included in cost of sales.
Goodwill
Impairment testing for goodwill
For the purpose of impairment testing, goodwill is allocated to the Group’s operating segments. The aggregate carrying
amounts of goodwill allocated to each segment are as follows:
Group31 December
2018
31 December
2017
1 January
2017$’000 $’000 $’000
Rigs and floaters, repairs & upgrades, offshore platforms,
and specialised shipbuilding 10,136 10,136 10,136Others 1,023 1,023 1,023Total 11,159 11,159 11,159
Intellectual property rights
Intellectual property rights relate to acquired patents for the Jurong Espadon Drillship, Satellite Services Platform
offshore designs, re-deployable modularised LNG and LPG solutions, and geostationary cylindrical hull design.
Impairment test assessment
The goodwill and intellectual property rights are attributed to the “rigs and floaters, repairs & upgrades, offshore
platforms and specialised shipbuilding” operating segment. Within this operating segment, there are two key cash
generating units in Singapore and Brazil subject to impairment test described in Note 44. Such goodwill and intellectual
property rights are attributed to the Singapore cash generating unit.
A N N U A L R E P O R T 2 0 1 8 247S E M B C O R P M A R I N E246

NOTES TO THE FINANCIAL STATEMENTSYear ended 31 December 2018
13
. D
EFE
RR
ED
TA
X A
SSE
TS
AN
D L
IAB
ILIT
IES
At
1 J
anu
ary
20
17
Rec
og
nis
ed
in p
rofi
t o
r lo
ss
(No
te 3
1)
Rec
og
nis
edin
oth
erco
mp
reh
en-
sive
inco
me
(No
te 3
2)
Dis
po
sal o
fsu
bsi
dia
ries
Tran
slat
ion
adju
stm
ents
/O
ther
s
At
31
Dec
emb
er2
01
7
Rec
og
nis
ed
in p
rofi
t o
r lo
ss
(No
te 3
1)
Rec
og
nis
edin
oth
erco
mp
reh
en-
sive
inco
me
(No
te 3
2)
Tran
slat
ion
adju
stm
ents
/O
ther
s
At
31
Dec
emb
er2
01
8$
’00
0$
’00
0$
’00
0$
’00
0$
’00
0$
’00
0$
’00
0$
’00
0$
’00
0$
’00
0
Gro
up
Def
erre
d t
ax li
abili
ties
Pro
pe
rty,
pla
nt
and
e
qu
ipm
en
t1
34
,34
2(1
3,8
28
)–
(54
)(4
2)
12
0,4
18
(8,8
11
)–
71
11
,61
4In
tere
sts
in a
sso
cia
tes
42
0(4
20
)–
––
––
––
–O
the
r fi
nan
cia
l ass
ets
6,7
52
–6
77
––
7,4
29
–(5
,78
0)
–1
,64
9In
tan
gib
le a
sse
ts4
4,3
00
(4,3
44
)–
––
39
,95
6(4
,34
9)
––
35
,60
7O
the
r it
em
s3
33
(31
3)
––
–2
0(1
0)
––
10
18
6,1
47
(18
,90
5)
67
7(5
4)
(42
)1
67
,82
3(1
3,1
70
)(5
,78
0)
71
48
,88
0
Def
erre
d t
ax a
sset
sP
rop
ert
y, p
lan
t an
d
eq
uip
me
nt
(1,0
54
)(1
,86
5)
––
(10
1)
(3,0
20
)(8
33
)–
(17
)(3
,87
0)
Trad
e a
nd
oth
er
rec
eiv
able
s(4
27
)(1
,61
4)
––
–(2
,04
1)
1,4
51
–(2
20
)(8
10
)Tr
ade
an
d o
the
r p
ayab
les
(8,6
82
)5
58
––
–(8
,12
4)
(5,2
67
)–
–(1
3,3
91
)U
nu
tilis
ed
tax
loss
es,
c
apit
al a
nd
inve
stm
en
t al
low
anc
es
(92
,38
9)
(1,8
56
)–
–8
9(9
4,1
56
)9
,24
6–
21
9(8
4,6
91
)P
rovi
sio
ns
(4,3
54
)(8
1)
––
–(4
,43
5)
(10
,33
5)
––
(14
,77
0)
Oth
er
fin
anc
ial l
iab
iliti
es
(5,2
92
)–
5,2
92
––
––
(96
0)
–(9
60
)O
the
r it
em
s(6
1,0
39
)5
0,4
01
––
2,2
17
(8,4
21
)7
,59
3–
25
(80
3)
(17
3,2
37
)4
5,5
43
5,2
92
–2
,20
5(1
20
,19
7)
1,8
55
(96
0)
7(1
19
,29
5)
Net
def
erre
d t
ax li
abili
ties
12
,91
02
6,6
38
5,9
69
(54
)2
,16
34
7,6
26
(11
,31
5)
(6,7
40
)1
42
9,5
85
Co
mp
any
Def
erre
d t
ax li
abili
ties
Pro
pe
rty,
pla
nt
and
e
qu
ipm
en
t1
4,6
80
(2,1
48
)–
––
12
,53
2(3
,34
7)
––
9,1
85
Def
erre
d t
ax a
sset
sTr
ade
an
d o
the
r p
ayab
les
––
––
––
(43
4)
––
(43
4)
Un
uti
lise
d t
ax lo
sse
s,
cap
ital
an
d in
vest
me
nt
allo
wan
ce
s(7
08
)2
03
––
–(5
05
)1
65
––
(34
0)
Pro
visi
on
s(1
,00
9)
52
––
–(9
57
)(2
,47
9)
––
(3,4
36
)(1
,71
7)
25
5–
––
(1,4
62
)(2
,74
8)
––
(4,2
10
)N
et d
efer
red
tax
liab
iliti
es1
2,9
63
(1,8
93
)–
––
11
,07
0(6
,09
5)
––
4,9
75
Oth
er
ite
ms
inc
lud
e d
efe
rre
d t
ax a
sse
ts o
f $
nil
(20
17
: $
8,0
30
,00
0,
1 J
anu
ary
20
17
: $
60
,72
1,0
00
) ar
isin
g f
rom
tra
nsi
tio
nal
ad
just
me
nts
fo
r tr
ade
in
co
me
ove
r-re
co
gn
ise
d in
pri
or
year
s d
ue
to
th
e a
do
pti
on
of
SFR
S(I
) 1
5.
A N N U A L R E P O R T 2 0 1 8 249S E M B C O R P M A R I N E248

NOTES TO THE FINANCIAL STATEMENTSYear ended 31 December 2018
13. DEFERRED TAX ASSETS AND LIABILITIES (CONT’D)
Deferred tax liabilities and assets are set off when there is a legally enforceable right to set off current tax assets against
current tax liabilities and when the deferred taxes relate to the same taxation authority. The amounts determined after
appropriate offsetting included in the balance sheets are as follows:
Group Company31 December
2018
31 December
2017
1 January
2017
31 December
2018
31 December
2017
1 January
2017$’000 $’000 $’000 $’000 $’000 $’000
Deferred tax liabilities 52,808 61,545 85,673 4,975 11,070 12,963Deferred tax assets (23,223) (13,919) (72,763) – – –
29,585 47,626 12,910 4,975 11,070 12,963
As at 31 December 2018, a deferred tax liability of $11,061,000 (2017: $12,455,000; 1 January 2017: $13,298,000) for
temporary difference of $109,170,000 (2017: $121,707,000; 1 January 2017: $129,202,000) related to investments
in subsidiaries was not recognised because the Group can control the timing of reversal of the taxable temporary
differences for all subsidiaries and the temporary differences are not expected to reverse in the foreseeable future.
Deferred tax assets have not been recognised in respect of the following items:
Group2018 2017$’000 $’000
Deductible temporary differences 19 495Tax losses 451,542 396,631Capital allowances 307 355
451,868 397,481
The deductible temporary differences, the remaining tax losses and the capital allowances do not expire under current
tax legislation.
Deferred tax assets have not been recognised in respect of the above in accordance with Note 3.16 and under the
following circumstances:
(a) Where they qualify for offset against the tax liabilities of member companies within the Group under the Loss
Transfer System of Group Relief but the terms of the transfer have not been ascertained as at year end; and
(b) Where it is uncertain that future taxable profit will be available against which certain subsidiaries of the Group
can utilise the benefits.
A N N U A L R E P O R T 2 0 1 8 249S E M B C O R P M A R I N E248

NOTES TO THE FINANCIAL STATEMENTSYear ended 31 December 2018
14. INVENTORIES
Group31 December
2018
31 December
2017
1 January
2017$’000 $’000 $’000
Raw materials 79,734 95,218 22,126Finished goods 437 555 51,821
80,171 95,773 73,947
In 2018, raw materials and changes in finished goods included as cost of sales amounted to $669,811,000
(2017: $614,154,000).
15. CONTRACT COSTS
Group31 December
2018
31 December
2017
1 January
2017$’000 $’000 $’000
Non-current assetsContract costs– Fulfilment cost – 128,399 –
Current assetsContract costs– Fulfilment cost 328,690 2,358,054 2,607,564
In adopting SFRS(I) 15, costs incurred relating to ship and rig building that are to be sold upon completion had been
capitalised as fulfilment cost for future performance obligations. These costs are expected to be recoverable and are
amortised to the profit or loss when the related revenue is recognised. In 2018, $2,286,647,000 (2017: $204,477,000)
was amortised and no impairment loss (2017: net write back of $19,678,000) had been recognised.
A N N U A L R E P O R T 2 0 1 8 251S E M B C O R P M A R I N E250
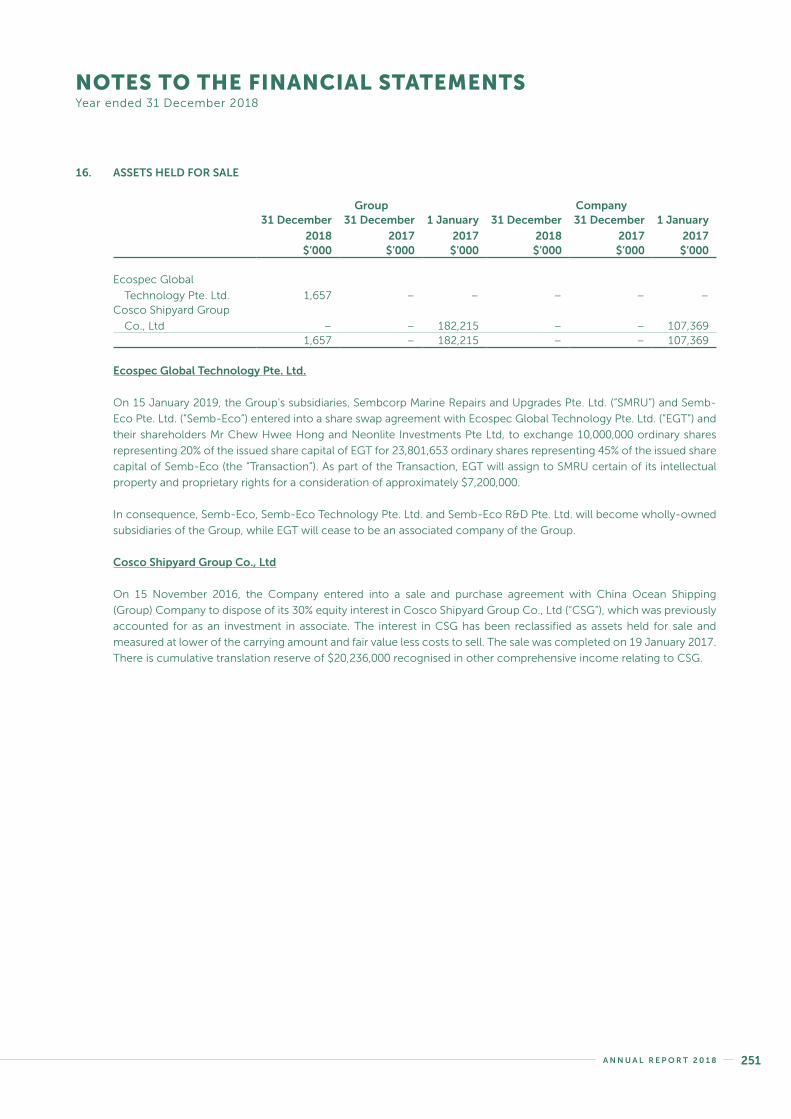
NOTES TO THE FINANCIAL STATEMENTSYear ended 31 December 2018
16. ASSETS HELD FOR SALE
Group Company31 December
2018
31 December
2017
1 January
2017
31 December
2018
31 December
2017
1 January
2017$’000 $’000 $’000 $’000 $’000 $’000
Ecospec Global
Technology Pte. Ltd. 1,657 – – – – –Cosco Shipyard Group
Co., Ltd – – 182,215 – – 107,3691,657 – 182,215 – – 107,369
Ecospec Global Technology Pte. Ltd.
On 15 January 2019, the Group’s subsidiaries, Sembcorp Marine Repairs and Upgrades Pte. Ltd. (“SMRU”) and Semb-
Eco Pte. Ltd. (“Semb-Eco”) entered into a share swap agreement with Ecospec Global Technology Pte. Ltd. (“EGT”) and
their shareholders Mr Chew Hwee Hong and Neonlite Investments Pte Ltd, to exchange 10,000,000 ordinary shares
representing 20% of the issued share capital of EGT for 23,801,653 ordinary shares representing 45% of the issued share
capital of Semb-Eco (the “Transaction”). As part of the Transaction, EGT will assign to SMRU certain of its intellectual
property and proprietary rights for a consideration of approximately $7,200,000.
In consequence, Semb-Eco, Semb-Eco Technology Pte. Ltd. and Semb-Eco R&D Pte. Ltd. will become wholly-owned
subsidiaries of the Group, while EGT will cease to be an associated company of the Group.
Cosco Shipyard Group Co., Ltd
On 15 November 2016, the Company entered into a sale and purchase agreement with China Ocean Shipping
(Group) Company to dispose of its 30% equity interest in Cosco Shipyard Group Co., Ltd (“CSG”), which was previously
accounted for as an investment in associate. The interest in CSG has been reclassified as assets held for sale and
measured at lower of the carrying amount and fair value less costs to sell. The sale was completed on 19 January 2017.
There is cumulative translation reserve of $20,236,000 recognised in other comprehensive income relating to CSG.
A N N U A L R E P O R T 2 0 1 8 251S E M B C O R P M A R I N E250

NOTES TO THE FINANCIAL STATEMENTSYear ended 31 December 2018
17. CASH AND CASH EQUIVALENTS
Group Company
Note
31 December
2018
31 December
2017
1 January
2017
31 December
2018
31 December
2017
1 January
2017$’000 $’000 $’000 $’000 $’000 $’000
Fixed deposits (a) 249 153,081 145,306 – – –Cash and bank
balances (b) 837,475 1,147,919 1,071,665 79,584 55,126 24,482Cash and cash
equivalents in
the balance
sheets 837,724 1,301,000 1,216,971 79,584 55,126 24,482Bank overdrafts (551) – – – – –Cash and cash
equivalents
in the
consolidated
statement of
cash flows 837,173 1,301,000 1,216,971 79,584 55,126 24,482
(a) Fixed deposits of the Group placed with financial institutions have maturity periods of 59 days (2017: 2 to
148 days; 1 January 2017: 3 to 149 days) from the financial year-end and interest rates at 6.26% (2017: 0.01% to
6.95%; 1 January 2017: 0.01% to 14.14%) per annum, which are also the effective interest rates.
(b) Included in the Group’s cash and bank balances at the balance sheet date are amounts of $312,701,278
(2017: $452,212,032; 1 January 2017: $103,997,795) placed with a bank under the Group’s cash pooling
arrangement by the Company. During the year, the cash pooling balances earn interest rates ranging from
0.99% to 1.67% (2017: 0.66% to 1.09%; 1 January 2017: 0.71% to 1.26%) per annum, which are also the effective
interest rates. The remaining bank balances during the year earn interest at floating rates based on daily bank
deposit rates of up to 2.57% (2017: up to 1.25%; 1 January 2017: up to 0.99%) and up to 0.55% (2017: up to
0.50%; 1 January 2017: up to 0.50%) per annum, for the Group and the Company respectively, which are also
the effective interest rates.
Included in the Group’s cash and bank balances are amounts of $294,999,000 (2017: $374,517,000; 1 January 2017:
$542,658,000) placed with a related corporation. The Company’s cash and bank balances of $14,963,000 (2017:
$23,245,000; 1 January 2017: $14,084,000) are also placed with a related corporation.
A N N U A L R E P O R T 2 0 1 8 253S E M B C O R P M A R I N E252

NOTES TO THE FINANCIAL STATEMENTSYear ended 31 December 2018
18. TRADE AND OTHER PAYABLES
Group Company
Note
31 December
2018
31 December
2017
1 January
2017
31 December
2018
31 December
2017
1 January
2017$’000 $’000 $’000 $’000 $’000 $’000
(a) Current liabilitiesTrade and accrued
payables(1) 1,479,997 1,551,352 1,803,167 13,544 14,446 10,644Advance payments
from customers 675 – – – – –Amounts due to
related parties 19 6,550 3,888 4,572 626 666 1,2611,487,222 1,555,240 1,807,739 14,170 15,112 11,905
Deposits received 1,852 1,869 2,163 26 26 26GST payables 733 413 147 – 22 –Interest payable(2) 27,897 28,788 33,949 186 – –Other creditors 12,684 14,874 26,932 474 353 8,092Accrued capital
expenditure 103 894 1,290 – – –Amounts due to
related parties 19 2,255 2,140 1,619 9,850 10,920 3,86745,524 48,978 66,100 10,536 11,321 11,985
Total 1,532,746 1,604,218 1,873,839 24,706 26,433 23,890
(b) Non-current
liabilitiesOther long-term
payables(3) 108,813 104,807 90,567 5,574 6,779 6,324
(1) Included in the Group’s accrued payables are amounts of $11,000,000 (2017: $11,000,000; 1 January 2017: nil) relating to an assumption of liabilities on behalf of a joint venture.
(2) Included in the Group’s interest payable are amounts of $2,829,000 (2017: $1,641,000; 1 January 2017: $3,629,000) payable to a related corporation.
(3) Other long-term payables include deferred grants, accrued land lease and long-term employee benefits.
A N N U A L R E P O R T 2 0 1 8 253S E M B C O R P M A R I N E252
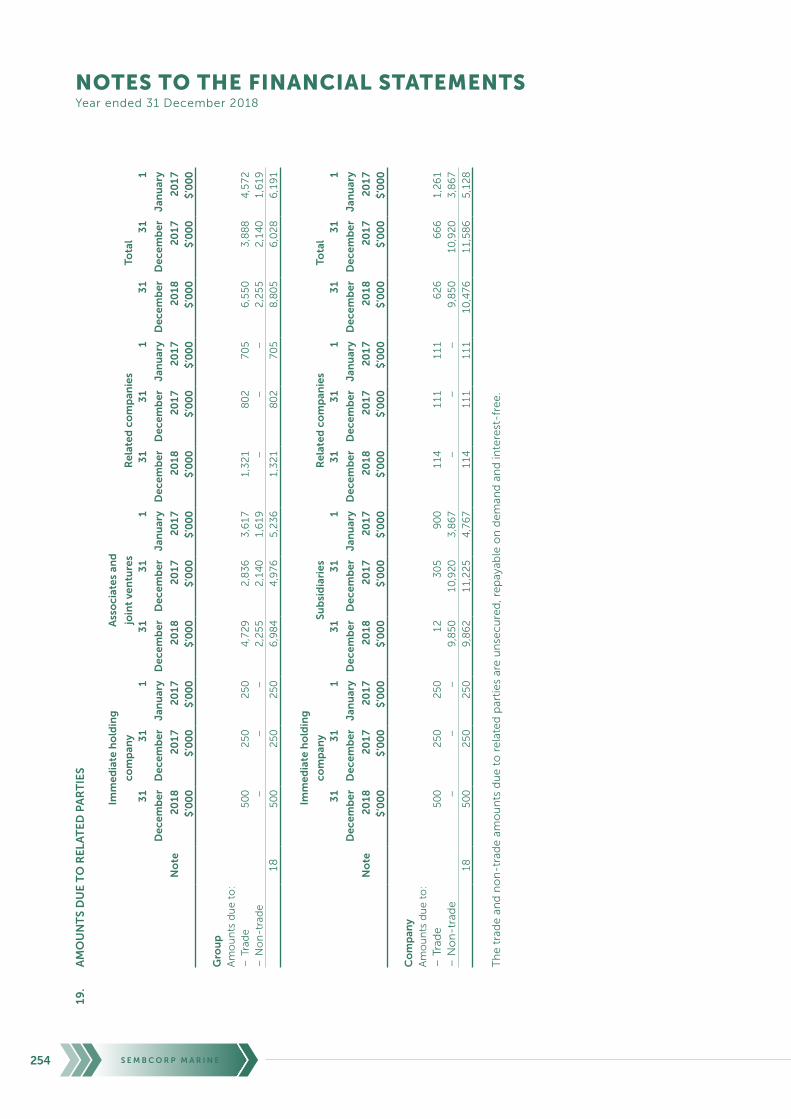
NOTES TO THE FINANCIAL STATEMENTSYear ended 31 December 2018
19
. A
MO
UN
TS
DU
E T
O R
EL
AT
ED
PA
RT
IES
Imm
edia
te h
old
ing
com
pan
y
Ass
oci
ates
an
d
join
t ve
ntu
res
Rel
ated
co
mp
anie
sTo
tal
No
te
31
Dec
emb
er
20
18
31
Dec
emb
er
20
17
1
Jan
uar
y
20
17
31
Dec
emb
er
20
18
31
Dec
emb
er
20
17
1
Jan
uar
y
20
17
31
Dec
emb
er
20
18
31
Dec
emb
er
20
17
1
Jan
uar
y
20
17
31
Dec
emb
er
20
18
31
Dec
emb
er
20
17
1
Jan
uar
y
20
17
$’0
00
$’0
00
$’0
00
$’0
00
$’0
00
$’0
00
$’0
00
$’0
00
$’0
00
$’0
00
$’0
00
$’0
00
Gro
up
Am
ou
nts
du
e t
o:
– T
rad
e5
00
25
02
50
4,7
29
2,8
36
3,6
17
1,3
21
80
27
05
6,5
50
3,8
88
4,5
72
– N
on
-tra
de
––
–2
,25
52
,14
01
,61
9–
––
2,2
55
2,1
40
1,6
19
18
50
02
50
25
06
,98
44
,97
65
,23
61
,32
18
02
70
58
,80
56
,02
86
,19
1
Imm
edia
te h
old
ing
com
pan
ySu
bsi
dia
ries
Rel
ated
co
mp
anie
sTo
tal
No
te
31
Dec
emb
er
20
18
31
Dec
emb
er
20
17
1
Jan
uar
y
20
17
31
Dec
emb
er
20
18
31
Dec
emb
er
20
17
1
Jan
uar
y
20
17
31
Dec
emb
er
20
18
31
Dec
emb
er
20
17
1
Jan
uar
y
20
17
31
Dec
emb
er
20
18
31
Dec
emb
er
20
17
1
Jan
uar
y
20
17
$’0
00
$’0
00
$’0
00
$’0
00
$’0
00
$’0
00
$’0
00
$’0
00
$’0
00
$’0
00
$’0
00
$’0
00
Co
mp
any
Am
ou
nts
du
e t
o:
– T
rad
e5
00
25
02
50
12
30
59
00
11
41
11
11
16
26
66
61
,26
1–
No
n-t
rad
e–
––
9,8
50
10
,92
03
,86
7–
––
9,8
50
10
,92
03
,86
71
85
00
25
02
50
9,8
62
11
,22
54
,76
71
14
11
11
11
10
,47
61
1,5
86
5,1
28
Th
e t
rad
e a
nd
no
n-t
rad
e a
mo
un
ts d
ue
to
re
late
d p
arti
es
are
un
sec
ure
d, r
ep
ayab
le o
n d
em
and
an
d in
tere
st-f
ree
.
A N N U A L R E P O R T 2 0 1 8 255S E M B C O R P M A R I N E254

NOTES TO THE FINANCIAL STATEMENTSYear ended 31 December 2018
20. CONTRACT LIABILITIES
Group31 December
2018
31 December
2017
1 January
2017$’000 $’000 $’000
Non-current liabilitiesContract liabilities – 75,497 240,700
Current liabilitiesContract liabilities 139,731 1,135,661 667,665
The contract liabilities primarily relate to the advance consideration received from customers amounting to $35,740,000
for which revenue is recognised over time, and $89,606,000 for which revenue is recognised at point in time.
Significant changes in the contract liabilities balances during the year are as follows:
2018 2017$’000 $’000
Revenue recognised that was included in the contract liability
balance at the beginning of the year (1,122,093) (438,189)Increases due to cash received, excluding amounts recognised
as revenue during the year 51,985 777,580
21. PROVISIONS
Retirement
gratuities Warranty
Restoration
costs Total$’000 $’000 $’000 $’000
Group2018Balance at 1 January 928 20,853 75,988 97,769Translation adjustments (21) (33) 43 (11)Provision made during the year 142 64,478 1,083 65,703Provision reversed during the year – (27,382) (257) (27,639)Provision utilised during the year (114) – (49) (163)Unwind of discount on restoration costs – – 2,077 2,077Balance at 31 December 935 57,916 78,885 137,736
Provisions due:– within 1 year 179 16,696 – 16,875– after 1 year but within 5 years 316 41,220 22,811 64,347– after 5 years 440 – 56,074 56,514
935 57,916 78,885 137,736
A N N U A L R E P O R T 2 0 1 8 255S E M B C O R P M A R I N E254

NOTES TO THE FINANCIAL STATEMENTSYear ended 31 December 2018
21. PROVISIONS (CONT’D)
Retirement
gratuities Warranty
Restoration
costs Total$’000 $’000 $’000 $’000
Group2017Balance at 1 January 1,183 18,384 61,049 80,616Translation adjustments (23) (24) (158) (205)Provision made during the year 171 10,795 14,608 25,574Provision reversed during the year (18) (8,302) – (8,320)Provision utilised during the year (385) – – (385)Disposal of subsidiaries – – (280) (280)Unwind of discount on restoration costs – – 769 769Balance at 31 December 928 20,853 75,988 97,769
31 December 2017Provisions due:– within 1 year 131 20,853 6,771 27,755– after 1 year but within 5 years 470 – 21,990 22,460– after 5 years 327 – 47,227 47,554
928 20,853 75,988 97,769
1 January 2017Provisions due:– within 1 year 182 8,384 6,771 15,337– after 1 year but within 5 years 975 – 6,815 7,790– after 5 years 26 10,000 47,463 57,489
1,183 18,384 61,049 80,616
Restoration costs31 December
2018
31 December
2017
1 January
2017$’000 $’000 $’000
CompanyBalance at 1 January 24,807 24,807 24,807Unwind of discount 1,287 – –Balance at 31 December 26,094 24,807 24,807
Provisions due:– within 1 year – 6,771 6,771– after 5 years 26,094 18,036 18,036
26,094 24,807 24,807
Warranty
Provision for warranties relate to contracts with contractual warranty terms. The provision for warranty is based on
estimates made from historical warranty data associated with similar projects and adjusted by weighting all possible
outcomes by their associated probabilities.
The non-current portion of the provision for warranty is for contracts with contractual warranty periods that will lapse
within 2 to 3 years from the reporting date.
Restoration costs
Restoration costs relate to cost of dismantling and removing assets and restoring the premises to its original condition
as stipulated in the operating lease agreements. The Group expects to incur the liability upon termination of the leases.
A N N U A L R E P O R T 2 0 1 8 257S E M B C O R P M A R I N E256

NOTES TO THE FINANCIAL STATEMENTSYear ended 31 December 2018
22. OTHER FINANCIAL LIABILITIES
Group31 December
2018
31 December
2017
1 January
2017$’000 $’000 $’000
(a) Current liabilitiesFinancial liabilities at fair value through profit or loss (mandatorily
measured (2017: on initial recognition)):– Forward foreign currency contracts – – 11,595
Cash flow hedges:– Forward foreign currency contracts 9,806 – 6,722– Interest rate swaps 3 1,449 –
9,809 1,449 18,317
(b) Non-current liabilitiesCash flow hedges:– Forward foreign currency contracts 3,748 – 23,305– Interest rate swaps 6,414 5,713 3,092
10,162 5,713 26,397
23. INTEREST-BEARING BORROWINGS
Group Company
Note
31 December
2018
31 December
2017
1 January
2017
31 December
2018
31 December
2017
1 January
2017$’000 $’000 $’000 $’000 $’000 $’000
Current liabilitiesUnsecured term loans 1,054,945 852,263 1,363,961 50,000 – –Finance lease liabilities 483 474 – 483 474 –Bank overdrafts 551 – – – – –
1,055,979 852,737 1,363,961 50,483 474 –
Non-current liabilitiesUnsecured term loans (a) 3,172,500 3,245,992 2,791,014 – – –Finance lease liabilities 951 1,394 – 951 1,394 –
3,173,451 3,247,386 2,791,014 951 1,394 –
4,229,430 4,100,123 4,154,975 51,434 1,868 –
Of the Group’s interest-bearing borrowings, $661,000,000 (2017: $677,060,000; 1 January 2017: $764,472,000) were
borrowed from a related corporation.
A N N U A L R E P O R T 2 0 1 8 257S E M B C O R P M A R I N E256

NOTES TO THE FINANCIAL STATEMENTSYear ended 31 December 2018
23. INTEREST-BEARING BORROWINGS (CONT’D)
Effective interest rates and maturity of liabilities
Group31 December
2018
31 December
2017
1 January
2017% % %
Floating rate loans 2.52 – 7.35 1.70 – 12.40 1.59 – 16.05Fixed rate loans 2.19 – 5.53 1.68 – 5.62 1.55 – 16.09Notes 2.95 – 3.85 2.95 – 3.85 2.95 – 3.85
Group31 December
2018
31 December
2017
1 January
2017$’000 $’000 $’000
Within 1 year 1,055,979 852,737 1,363,961After 1 year but within 5 years 2,848,451 2,922,386 2,466,014After 5 years 325,000 325,000 325,000Total borrowings 4,229,430 4,100,123 4,154,975
(a) Unsecured term loans
Included in the unsecured term loans are the following notes of the Group:
On 18 August 2014, the Company updated its $2,000,000,000 Multicurrency Multi-issuer Debt Issuance
Programme (the “Programme”) to include perpetual securities as one of the debt instruments under the
Programme.
Under the updated Programme, the Company, together with its subsidiaries – Jurong Shipyard Pte Ltd,
Sembcorp Marine Repairs and Upgrades Pte Ltd and Sembcorp Marine Offshore Platforms Pte Ltd (“Issuing
Subsidiaries”), may from time to time issue notes (the “Notes”) and/or perpetual securities (the “Perpetual
Securities”, and together with the Notes, the “Securities”) denominated in Singapore dollars and/or any other
currency as the relevant Issuer and the relevant dealer may agree. The obligations in respect of Securities issued
by the Issuing Subsidiaries will be unconditionally and irrevocably guaranteed by the Company.
In 2014, Jurong Shipyard Pte Ltd issued the following medium term notes under the Programme:
Nominal
interest rate
Year of
issue
Year of
maturity
Principal
amount$’000
S$ medium term notes 2.95% 2014 2021 275,000S$ medium term notes 3.85% 2014 2029 325,000
600,000
As at 31 December 2018, an amount of $167,500,000 (2017: $167,500,000; 1 January 2017: $167,500,000) for
the medium term notes maturing in 2021 was subscribed by a related corporation.
A N N U A L R E P O R T 2 0 1 8 259S E M B C O R P M A R I N E258

NOTES TO THE FINANCIAL STATEMENTSYear ended 31 December 2018
23. INTEREST-BEARING BORROWINGS (CONT’D)
Reconciliation of movements of liabilities to cash flows arising from financing activities
Interest-bearing
borrowings*
Finance lease
liabilities Total$’000 $’000 $’000
GroupBalance at 1 January 2018 4,098,255 1,868 4,100,123Cash flowsCash payments (990,635) (512) (991,147)Cash proceeds 1,101,622 – 1,101,622Non-cash itemsCapitalised borrowing cost – 78 78Foreign exchange movement 18,203 – 18,203Balance at 31 December 2018 4,227,445 1,434 4,228,879
Balance at 1 January 2017 4,154,975 – 4,154,975Cash flowsCash payments (441,039) (512) (441,551)Cash proceeds 465,809 – 465,809Non-cash itemsCapitalised borrowing cost – 52 52New finance lease – 2,328 2,328Foreign exchange movement (81,490) – (81,490)Balance at 31 December 2017 4,098,255 1,868 4,100,123
* Excluding finance lease liabilities and bank overdrafts.
24. SHARE CAPITAL
Group and CompanyNo. of ordinary shares
2018 2017
Issued and fully paid, with no par value:Balance at 1 January and 31 December 2,089,760,107 2,089,760,107
The holders of ordinary shares (excluding treasury shares) are entitled to receive dividends as declared from time to
time and are entitled to one vote per share at meetings of the Company. All shares (excluding treasury shares) rank
equally with regard to the Company’s residual assets.
The Company issued 1,187,703 (2017: 1,786,942) treasury shares during the year pursuant to its share based incentive
plans (Note 36).
A N N U A L R E P O R T 2 0 1 8 259S E M B C O R P M A R I N E258

NOTES TO THE FINANCIAL STATEMENTSYear ended 31 December 2018
25. OTHER RESERVES
Group Company
Note
31 December
2018
31 December
2017
1 January
2017
31 December
2018
31 December
2017
1 January
2017$’000 $’000 $’000 $’000 $’000 $’000
DistributableReserve for own shares (a) (2,151) (3,451) (566) (2,151) (3,451) (566)
Non-distributableCurrency translation
reserve (b) (13,577) (22,712) 49,253 – – –Share-based payments
reserve (c) (24,686) (27,894) (30,158) (22,579) (25,787) (28,051)Fair value reserve (d) – 447 1,955 – 447 6,198Hedging reserve (e) 2,398 35,917 6,766 – – –Capital reserves (f) (13,011) (13,011) 11,514 960 960 960
(51,027) (30,704) 38,764 (23,770) (27,831) (21,459)
(a) Reserve for own shares comprises the cost of the Company’s shares held by the Company. As at
31 December 2018, the Company holds 1,162,484 (2017: 1,850,187; 1 January 2017: 437,029) of its own shares
as treasury shares.
(b) The foreign currency translation reserve comprises foreign exchange differences arising from the translation
of the financial statements of foreign operations whose functional currencies are different from that of the
presentation currency of the Group.
(c) Share-based payments reserve comprises the cumulative value of services received from employees recorded
on grant of equity-settled share options, performance shares and performance based restricted shares. The
expense for service received is recognised over the performance period and/or vesting period.
(d) Fair value reserve includes the cumulative net change in fair value of equity investments at FVOCI
(2017: available-for-sale investments) until the investments are derecognised.
(e) Hedging reserve comprises the effective portion of the cumulative net change in the fair value of cash flow
hedging instruments relating to hedged transactions that have not yet occurred.
(f) Capital reserves comprise mainly reserves arising from acquisition and disposals of non-controlling interests
that do not result in a change of control.
A N N U A L R E P O R T 2 0 1 8 261S E M B C O R P M A R I N E260

NOTES TO THE FINANCIAL STATEMENTSYear ended 31 December 2018
26. TURNOVER
Turnover represents sales from the various activities described in Note 1 and Note 45, including the revenue recognised
on contracts relating to rigs & floaters, repairs & upgrades and offshore platforms.
Group2018 2017$’000 $’000
Contract revenue 4,831,789 2,967,085Charter hire income 47,873 57,437Services rendered 2,915 3,717Sale of goods 5,289 6,528
4,887,866 3,034,767
The amount of revenue recognised during the year from performance obligation satisfied or partially satisfied in
previous periods, mainly due to change in estimate for the transaction price is $nil (2017: $5,934,000).
(a) Disaggregation of revenue from contracts with customers
In the following table, revenue from contracts with customers is disaggregated by primary geographical markets,
major product and service lines and timing of revenue recognition. The table also includes a reconciliation of
the disaggregated revenue with the Group’s reportable segments (see Note 43).
Reportable segmentsRigs & floaters,
Repairs & upgrades,
Offshore platforms
and Specialised
shipbuilding
Ship
chartering Others Total$’000 $’000 $’000 $’000
Primary geographical markets2018Singapore 145,375 – 8,204 153,579Japan 339,829 – – 339,829United Kingdom 195,484 – – 195,484Norway 1,627,871 – – 1,627,871France 488,606 – – 488,606The Netherlands 349,641 47,873 – 397,514Brazil 243,344 – – 243,344U.S.A. 1,183,777 – – 1,183,777Other countries 257,862 – – 257,862Total 4,831,789 47,873 8,204 4,887,866
2017Singapore 262,311 – 10,227 272,538Rest of Asia, Australia & India 202,747 – 9 202,756United Kingdom 744,792 – – 744,792Norway 242,214 – – 242,214France 223,535 – – 223,535The Netherlands 534,076 57,437 – 591,513Brazil 213,192 – – 213,192U.S.A. 177,005 – – 177,005Mexico 175,409 – – 175,409Other countries 191,804 – 9 191,813Total 2,967,085 57,437 10,245 3,034,767
A N N U A L R E P O R T 2 0 1 8 261S E M B C O R P M A R I N E260
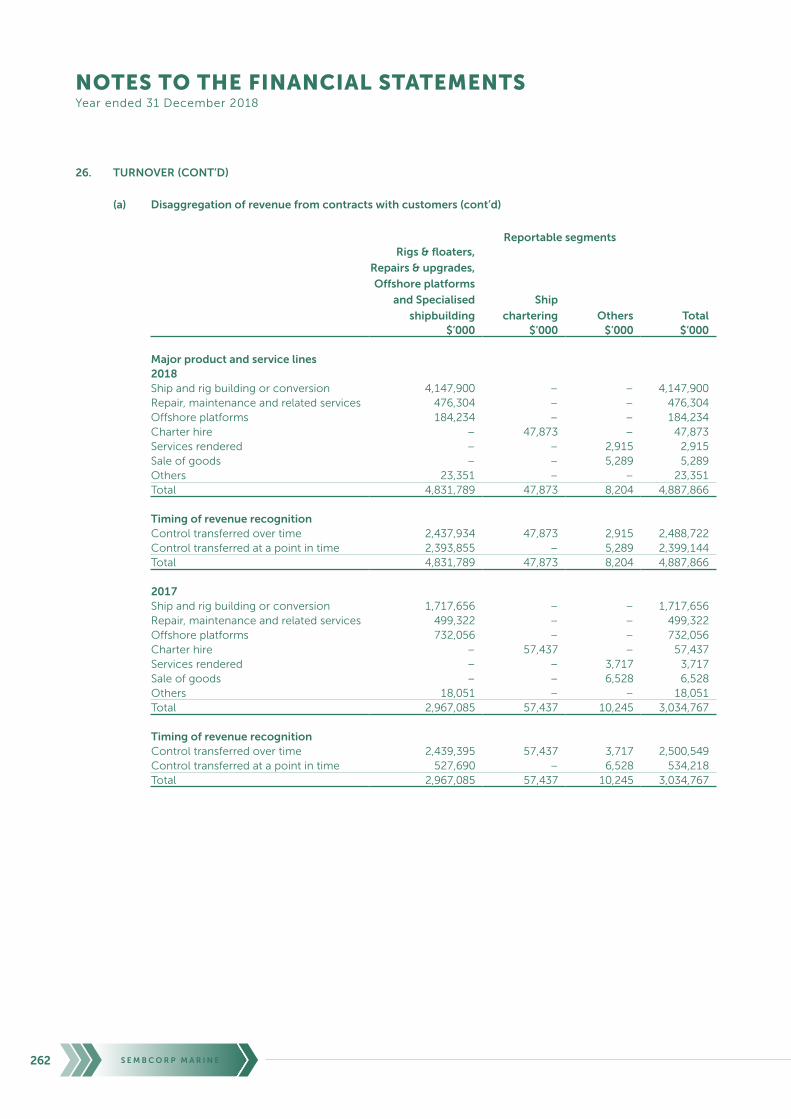
NOTES TO THE FINANCIAL STATEMENTSYear ended 31 December 2018
26. TURNOVER (CONT’D)
(a) Disaggregation of revenue from contracts with customers (cont’d)
Reportable segmentsRigs & floaters,
Repairs & upgrades,
Offshore platforms
and Specialised
shipbuilding
Ship
chartering Others Total$’000 $’000 $’000 $’000
Major product and service lines2018Ship and rig building or conversion 4,147,900 – – 4,147,900Repair, maintenance and related services 476,304 – – 476,304Offshore platforms 184,234 – – 184,234Charter hire – 47,873 – 47,873Services rendered – – 2,915 2,915Sale of goods – – 5,289 5,289Others 23,351 – – 23,351Total 4,831,789 47,873 8,204 4,887,866
Timing of revenue recognitionControl transferred over time 2,437,934 47,873 2,915 2,488,722Control transferred at a point in time 2,393,855 – 5,289 2,399,144Total 4,831,789 47,873 8,204 4,887,866
2017Ship and rig building or conversion 1,717,656 – – 1,717,656Repair, maintenance and related services 499,322 – – 499,322Offshore platforms 732,056 – – 732,056Charter hire – 57,437 – 57,437Services rendered – – 3,717 3,717Sale of goods – – 6,528 6,528Others 18,051 – – 18,051Total 2,967,085 57,437 10,245 3,034,767
Timing of revenue recognitionControl transferred over time 2,439,395 57,437 3,717 2,500,549Control transferred at a point in time 527,690 – 6,528 534,218Total 2,967,085 57,437 10,245 3,034,767
A N N U A L R E P O R T 2 0 1 8 263S E M B C O R P M A R I N E262

NOTES TO THE FINANCIAL STATEMENTSYear ended 31 December 2018
26. TURNOVER (CONT’D)
(b) Transaction price allocated to remaining performance obligation
The following table includes revenue expected to be recognised in the future related to performance obligations
that are unsatisfied or partially unsatisfied at reporting date:
Estimated based on expected project progress
Reportable segments
Within the next
12 months
Between 1 to
5 years
More than
5 years Total$’000 $’000 $’000 $’000
2018Rigs & floaters, Repairs & upgrades,
Offshore platforms and
Specialised shipbuilding 2,175,205 912,654 – 3,087,859
The Group applies the practical expedient in paragraph 121 of SFRS(I) 15 and does not disclose information
about remaining performance obligations at 31 December 2018 that have an original expected duration of one
year or less, as allowed by SFRS(I) 15.
The Group applies the practical expedient in paragraph C5(c) of SFRS(I) 15 as well and does not disclose the
amount of the transaction price allocated to the remaining performance obligations and an explanation of
when the Group expects to recognise that amount as revenue for the year ended 31 December 2017.
A N N U A L R E P O R T 2 0 1 8 263S E M B C O R P M A R I N E262

NOTES TO THE FINANCIAL STATEMENTSYear ended 31 December 2018
27. OPERATING (LOSS)/PROFIT
The following items have been included in arriving at operating (loss)/profit:
GroupNote 2018 2017
$’000 $’000
Amortisation of intangible assets 12 24,694 22,868Audit fees paid/payable– auditors of the Company 501 555– other member firms of KPMG International 334 272– other auditors 12 44Non-audit fees paid/payable– auditors of the Company 44 56– other member firms of KPMG International 24 23– other auditors 864 557Allowance for doubtful debts and bad debts, net 2,673 167Depreciation of property, plant and equipment 4 170,752 170,048Fair value adjustment on hedging instruments 1,713 (1,623)Fair value adjustment on firm commitments under fair value hedge 692 3,454Foreign currency exchange gain, net (8,593) (20,719)(Gain)/loss on disposal of property, plant and equipment, net (2,371) 863(Gain)/loss on disposal of intangible assets (106) 13Impairment losses on property, plant and equipment 4,663 –Inventories written down, net 432 56Contract costs written back – (19,678)Operating lease expenses 38,968 45,111Property, plant and equipment written off 58 500Staff costs (a) 414,689 460,717
(a) Staff costsSalaries and bonus 338,162 372,916Defined contribution plan 22,998 26,709Equity-settled share-based payments 4,910 4,634Cash-settled share-based payments 923 1,515Directors’ fee 2,271 2,260Other employee benefits 45,425 52,683
414,689 460,717
A N N U A L R E P O R T 2 0 1 8 265S E M B C O R P M A R I N E264

NOTES TO THE FINANCIAL STATEMENTSYear ended 31 December 2018
28. FINANCE INCOME AND FINANCE COSTS
Group2018 2017$’000 $’000
Finance incomeInterest income from:– Trade receivables and contracts with customers 46,320 16,782– Fixed deposits and bank balances 8,262 5,732– Joint venture 444 293
55,026 22,807
Finance costsInterest paid and payable to:– Bank and others 95,822 92,312– Commitment and facility fee 3,457 2,441Unwind of discount on restoration costs 2,077 769
101,356 95,522
29. NON-OPERATING INCOME AND NON-OPERATING EXPENSES
Group2018 2017$’000 $’000
Non-operating income:– Gain on disposal of assets held for sale – 46,816– Gain on disposal of a subsidiary – 787– Gain on disposal of other financial asset 27 –– Gain on disposal of available-for-sale financial asset – 17,200– Net change in fair value of financial assets measured through profit or loss 114 –
141 64,803
Non-operating expenses:– Loss on disposal of a subsidiary – 34– Impairment losses on available-for-sale financial assets – 2,275– Assumption of liabilities on behalf of a joint venture – 11,000
– 13,309
30. SHARE OF RESULTS OF ASSOCIATES AND JOINT VENTURES
GroupNote 2018 2017
$’000 $’000
Share of loss before tax for the year (2,170) (3,221)Share of tax for the year (215) (396)
31 (2,385) (3,617)
A N N U A L R E P O R T 2 0 1 8 265S E M B C O R P M A R I N E264

NOTES TO THE FINANCIAL STATEMENTSYear ended 31 December 2018
31. TAX (CREDIT)/EXPENSE
GroupNote 2018 2017
$’000 $’000
Current tax expenseCurrent year 11,257 25,414Over provided in prior years (22,473) (27,235)
(11,216) (1,821)
Deferred tax expenseMovements in temporary differences (28,862) 17,397Under provided in prior years 17,547 9,241
(11,315) 26,638
Tax (credit)/expense (22,531) 24,817
Reconciliation of effective tax rate
(Loss)/profit for the year (78,366) 256,055Tax (credit)/expense (22,531) 24,817Share of results of associates and joint ventures 30 2,385 3,617(Loss)/profit before share of results of associates
and joint ventures, and tax expense (98,512) 284,489
Tax calculated using Singapore tax rate of 17% (2017: 17%) (16,747) 48,364Exempt income, capital gains and tax incentives/concessions (5,794) (40,747)Effect of different tax rates in foreign jurisdictions 795 243Tax adjustment on changes in undistributed profits from foreign entities 222 (56)Effect on utilisation of deferred tax assets not previously recognised (2,674) (1,525)Non-deductible expenses 5,320 10,661Over provision in respect of prior years (4,926) (17,994)Deferred tax assets not recognised 1,250 25,864Others 23 7Tax (credit)/expense (22,531) 24,817
As at 31 December 2018, certain subsidiaries have unutilised tax losses and capital and investment allowances of
$451,849,000 (2017: $396,986,000) and other deductible temporary differences of $19,000 (2017: $495,000) available
for set-off against future taxable income subject to the tax provisions and agreement by the relevant tax authorities of
the various jurisdictions.
A N N U A L R E P O R T 2 0 1 8 267S E M B C O R P M A R I N E266

NOTES TO THE FINANCIAL STATEMENTSYear ended 31 December 2018
32. OTHER COMPREHENSIVE INCOME
Tax effects relating to each component of other comprehensive income are set out below:
2018 2017
Before tax Tax expense Net of tax Before tax Tax expense Net of tax$’000 $’000 $’000 $’000 $’000 $’000
GroupItems that may be reclassified
subsequently to profit or loss:Foreign currency translation
differences for foreign
operations 9,000 – 9,000 (51,290) – (51,290)Net change in fair value of
cash flow hedges (52,774) 8,868 (43,906) 36,743 (6,245) 30,498Net change in fair value of
cash flow hedges transferred
to profit or loss 12,515 (2,128) 10,387 (1,623) 276 (1,347)Net change in fair value of
available-for-sale
financial assets – – – 30,791 – 30,791Change in fair value of
available-for-sale financial assets
transferred to profit or loss – – – (32,299) – (32,299)Realisation of reserve upon
disposal of assets held for sale – – – (20,484) – (20,484)Realisation of reserve upon
disposal of a subsidiary – – – (217) – (217)(31,259) 6,740 (24,519) (38,379) (5,969) (44,348)
Items that may not be
reclassified subsequently to
profit or loss:Net change in fair value of equity
investments at FVOCI (11,339) – (11,339) – – –Other comprehensive income (42,598) 6,740 (35,858) (38,379) (5,969) (44,348)
33. NON-CONTROLLING INTERESTS
The following subsidiaries have material non-controlling interests:
Name of company
Country of
incorporation Operating segment
Ownership interests held
by non-controlling interests31 December
2018
31 December
2017
1 January
2017% % %
Gravifloat AS Norway Engineering and related services 44 44 44
The following summarises the financial information of each of the Group’s subsidiaries with material non-controlling
interest, based on their respective (consolidated) financial statements prepared in accordance with SFRS(I), modified
for fair value adjustments on acquisition and differences in the Group’s accounting policies.
A N N U A L R E P O R T 2 0 1 8 267S E M B C O R P M A R I N E266

NOTES TO THE FINANCIAL STATEMENTSYear ended 31 December 2018
33. NON-CONTROLLING INTERESTS (CONT’D)
Gravifloat AS
Other
individually
immaterial
subsidiaries
Intra-group
elimination Total$’000 $’000 $’000 $’000
31 December 2018Revenue –Loss for the year (10,121)Other comprehensive income (16)Total comprehensive income (10,137)Attributable to non-controlling interests: Loss for the year (4,453) 218 – (4,235)Other comprehensive income (7) (128) – (135)Total comprehensive income (4,460) 90 – (4,370)
Non-current assets 96,398Current assets 11Non-current liabilities (24,104)Current liabilities (20)Net assets 72,285Net assets attributable to non-controlling interests 31,805 4,946 – 36,751
Cash flows from operating activities –*Cash flows from investing activities –*Cash flows from financing activities –*Net decrease in cash and cash equivalents –*
31 December 2017Revenue –Loss for the year (10,090)Other comprehensive income (36)Total comprehensive income (10,126)Attributable to non-controlling interests: Loss for the year (4,440) 312 – (4,128)Other comprehensive income (16) (10) – (26)Total comprehensive income (4,456) 302 – (4,154)
Non-current assets 109,879Current assets 10Non-current liabilities (27,467)Current liabilities –Net assets 82,422Net assets attributable to non-controlling interests 36,265 4,934 – 41,199
Cash flows from operating activities –*Cash flows from investing activities –*Cash flows from financing activities –*Net decrease in cash and cash equivalents –*
* Amount is immaterial to meaningfully disclose it.
A N N U A L R E P O R T 2 0 1 8 269S E M B C O R P M A R I N E268

NOTES TO THE FINANCIAL STATEMENTSYear ended 31 December 2018
33. NON-CONTROLLING INTERESTS (CONT’D)
Gravifloat AS
Other
individually
immaterial
subsidiaries
Intra-group
elimination Total$’000 $’000 $’000 $’000
1 January 2017Non-current assets 123,368Current assets 10Non-current liabilities (30,830)Current liabilities –Net assets 92,548Net assets attributable to non-controlling interests 40,721 4,911 – 45,632
34. EARNINGS PER SHARE
(a) Basic earnings per share
Basic earnings per share is calculated by dividing the loss attributable to owners of the Company of $74,131,000
(2017: profit attributable to owners of the Company of $260,183,000) by the weighted average number of
ordinary shares outstanding of 2,088,437,000 (2017: 2,089,523,000) as follows:
Group2018 2017$’000 $’000
(Loss)/profit attributable to owners of the Company (74,131) 260,183
No. of
shares
No. of
shares’000 ’000
Weighted average number of ordinary shares Issued ordinary shares at 1 January 2,089,760 2,089,760Effect of share options exercised, performance shares
and restricted shares released 617 937Effect of own shares held (1,940) (1,174)Weighted average number of ordinary shares during the year 2,088,437 2,089,523
A N N U A L R E P O R T 2 0 1 8 269S E M B C O R P M A R I N E268
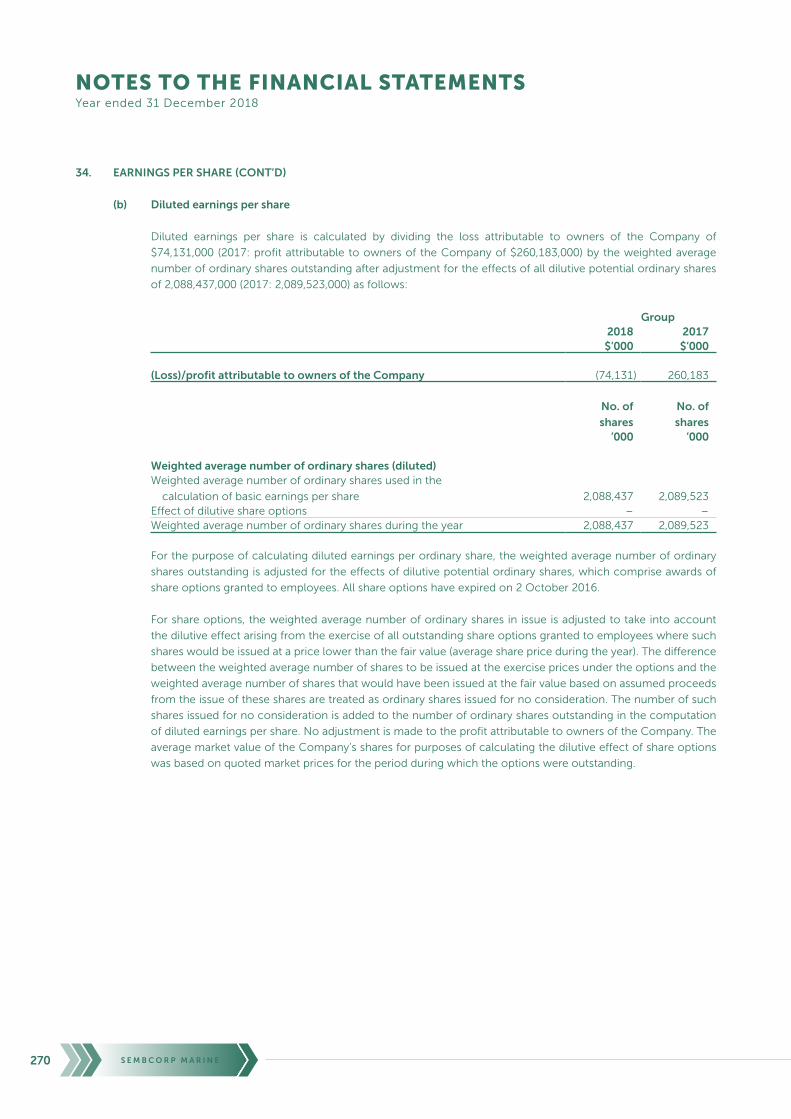
NOTES TO THE FINANCIAL STATEMENTSYear ended 31 December 2018
34. EARNINGS PER SHARE (CONT’D)
(b) Diluted earnings per share
Diluted earnings per share is calculated by dividing the loss attributable to owners of the Company of
$74,131,000 (2017: profit attributable to owners of the Company of $260,183,000) by the weighted average
number of ordinary shares outstanding after adjustment for the effects of all dilutive potential ordinary shares
of 2,088,437,000 (2017: 2,089,523,000) as follows:
Group2018 2017$’000 $’000
(Loss)/profit attributable to owners of the Company (74,131) 260,183
No. of
shares
No. of
shares’000 ’000
Weighted average number of ordinary shares (diluted)Weighted average number of ordinary shares used in the
calculation of basic earnings per share 2,088,437 2,089,523Effect of dilutive share options – –Weighted average number of ordinary shares during the year 2,088,437 2,089,523
For the purpose of calculating diluted earnings per ordinary share, the weighted average number of ordinary
shares outstanding is adjusted for the effects of dilutive potential ordinary shares, which comprise awards of
share options granted to employees. All share options have expired on 2 October 2016.
For share options, the weighted average number of ordinary shares in issue is adjusted to take into account
the dilutive effect arising from the exercise of all outstanding share options granted to employees where such
shares would be issued at a price lower than the fair value (average share price during the year). The difference
between the weighted average number of shares to be issued at the exercise prices under the options and the
weighted average number of shares that would have been issued at the fair value based on assumed proceeds
from the issue of these shares are treated as ordinary shares issued for no consideration. The number of such
shares issued for no consideration is added to the number of ordinary shares outstanding in the computation
of diluted earnings per share. No adjustment is made to the profit attributable to owners of the Company. The
average market value of the Company’s shares for purposes of calculating the dilutive effect of share options
was based on quoted market prices for the period during which the options were outstanding.
A N N U A L R E P O R T 2 0 1 8 271S E M B C O R P M A R I N E270

NOTES TO THE FINANCIAL STATEMENTSYear ended 31 December 2018
35. DIVIDENDS
During the year, the directors had approved a final ordinary one-tier tax exempt dividend of 1.0 cent per share
amounting to a net dividend of $20,888,000 in respect of the year ended 31 December 2017, based on the number of
issued shares as at 31 December 2017.
No dividends had been declared or proposed in respect of the year ended 31 December 2018.
Group and Company2018 2017$’000 $’000
Dividends paidInterim one-tier tax-exempt dividend of 1.0 cent per share in respect of year 2017 – 20,897Final one-tier tax-exempt dividend of 1.0 cent per share in respect of year 2017
(2017: 1.0 cent per share in respect of year 2016) 20,888 20,89720,888 41,794
36. SHARE-BASED INCENTIVE PLANS
The Company’s Performance Share Plan (“SCM PSP 2010”) and Restricted Share Plan (“SCM RSP 2010”) (collectively,
the “2010 Share Plans”) were approved and adopted by the shareholders at an Extraordinary General Meeting of the
Company held on 20 April 2010.
The Executive Resource and Compensation Committee (the “Committee”) of the Company has been designated as the
Committee responsible for the administration of the Share Plans. The Committee comprises the following members,
all of whom are directors:
Tan Sri Mohd Hassan Marican Chairman
Eric Ang Teik Lim
William Tan Seng Koon
Patrick Daniel (Appointed on 20 April 2018)
The SCM RSP 2010 is the incentive scheme for directors and employees of the Company and its subsidiaries (the
“Group”) whereas the SCM PSP 2010 is aimed primarily at key executives of the Group.
The 2010 Share Plans are intended to increase the Company’s flexibility and effectiveness in its continuing efforts
to attract, retain and incentivise participants to higher standards of performance and encourage greater dedication
and loyalty by enabling the Company to give recognition to past contributions and services; as well as motivating
participants to contribute to the long-term prosperity of the Group. The 2010 Share Plans will strengthen the Company’s
competitiveness in attracting and retaining talented key senior management and senior executives.
The Company designates Sembcorp Industries Ltd as the Parent Group.
The SCM RSP 2010 is intended to apply a broad base of senior executives as well as to the non-executive director,
while the SCM PSP 2010 is intended to apply to a select group of key senior management. Generally, it is envisaged
that the range of performance targets to be set under the SCM RSP 2010 and the SCM PSP 2010 will be different, with
the latter emphasising stretched or strategic targets aimed at sustaining longer term growth.
A N N U A L R E P O R T 2 0 1 8 271S E M B C O R P M A R I N E270

NOTES TO THE FINANCIAL STATEMENTSYear ended 31 December 2018
36. SHARE-BASED INCENTIVE PLANS (CONT’D)
The 2010 Share Plans will provide incentives to high performing key senior management and senior executives to excel
in their performance and encourage greater dedication and loyalty to the Company. Through the 2010 Share Plans, the
Company will be able to motivate key senior management and senior executives to continue to strive for the Group’s
long-term shareholder value. In addition, the 2010 Share Plans aim to foster a greater ownership culture within the
Group which align the interests of participants with the interests of shareholders, and to improve performance and
achieve sustainable growth for the Company in the changing business environment.
The 2010 Share Plans use methods fairly common among major local and multinational companies to incentivise and
motivate key senior management and senior executives to achieve pre-determined targets which create and enhance
economic value for shareholders. The Company believes that the 2010 Share Plans will be effective tools in motivating
key senior management and senior executives to strive to deliver long-term shareholder value.
While the 2010 Share Plans cater principally to Group executives, it is recognised that there are other persons who can
make significant contributions to the Group through their close working relationship with the Group. Such persons
include employees of associates over which the Company has operational control.
A participant’s awards under the 2010 Share Plans will be determined at the sole discretion of the Committee. In
considering an award to be granted to a participant, the Committee may take into account, inter alia, the participant’s
performance during the relevant period, and his capability, entrepreneurship, scope of responsibility and skill set.
Other information regarding the 2010 Share Plans is as follows:
(a) Performance Share Plan
Fair value of Performance Shares
The fair values of the performance shares are estimated using a Monte Carlo simulation methodology at the
grant dates.
The fair values of performance shares granted during the year are as follows:
Date of grant 23 August 2018 26 May 2017
Fair value at measurement date $1.94 $1.45
Assumptions under the Monte Carlo modelShare price $1.93 $1.69Expected volatility:Sembcorp Marine Ltd 39.8% 35.1%Morgan Stanley Capital International (“MSCI”) AC Asia Pacific
excluding Japan Industrials Index 12.2% 14.0%Correlation with MSCI 41.5% 44.0%Risk-free interest rate 1.9% 1.3%Expected dividend 1.8% 2.9%
The expected volatility is based on the historical volatility over the most recent period that is close to the
expected life of the performance shares.
During the year, the Group charged $2,072,000 (2017: $1,921,000) to profit or loss based on the fair value of the
performance shares at the grant date being expensed over the vesting period.
A N N U A L R E P O R T 2 0 1 8 273S E M B C O R P M A R I N E272
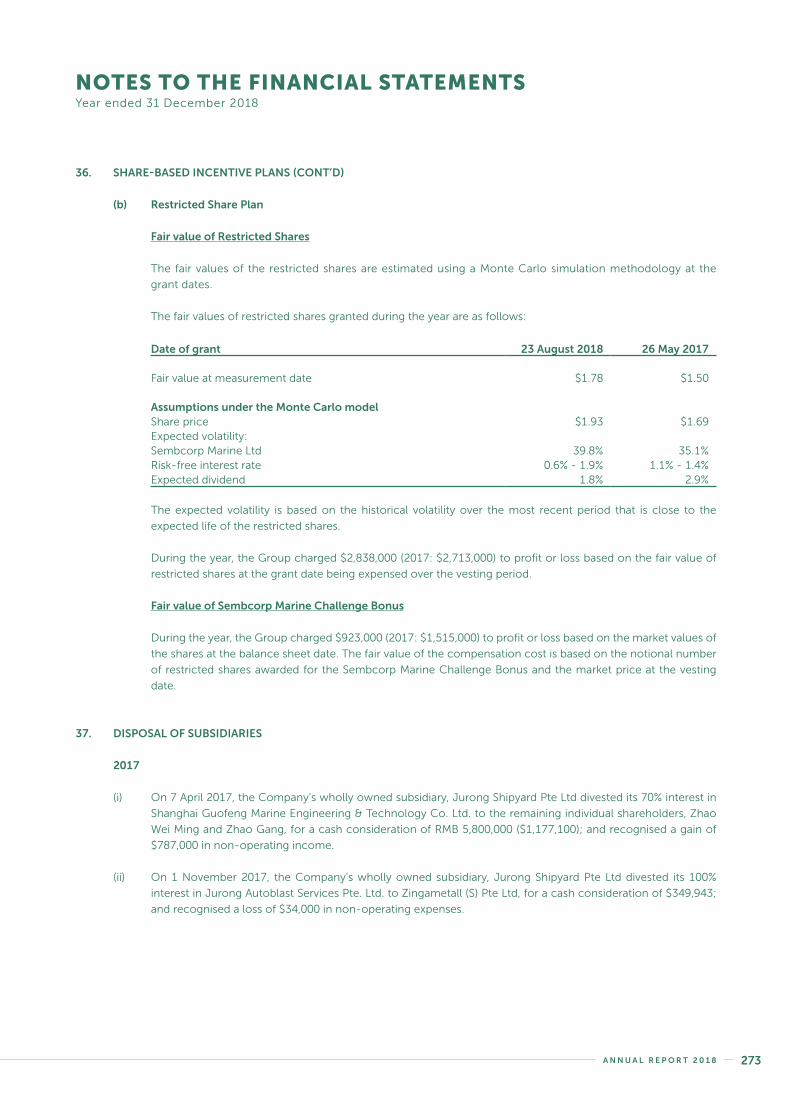
NOTES TO THE FINANCIAL STATEMENTSYear ended 31 December 2018
36. SHARE-BASED INCENTIVE PLANS (CONT’D)
(b) Restricted Share Plan
Fair value of Restricted Shares
The fair values of the restricted shares are estimated using a Monte Carlo simulation methodology at the
grant dates.
The fair values of restricted shares granted during the year are as follows:
Date of grant 23 August 2018 26 May 2017
Fair value at measurement date $1.78 $1.50
Assumptions under the Monte Carlo modelShare price $1.93 $1.69Expected volatility:Sembcorp Marine Ltd 39.8% 35.1%Risk-free interest rate 0.6% - 1.9% 1.1% - 1.4%Expected dividend 1.8% 2.9%
The expected volatility is based on the historical volatility over the most recent period that is close to the
expected life of the restricted shares.
During the year, the Group charged $2,838,000 (2017: $2,713,000) to profit or loss based on the fair value of
restricted shares at the grant date being expensed over the vesting period.
Fair value of Sembcorp Marine Challenge Bonus
During the year, the Group charged $923,000 (2017: $1,515,000) to profit or loss based on the market values of
the shares at the balance sheet date. The fair value of the compensation cost is based on the notional number
of restricted shares awarded for the Sembcorp Marine Challenge Bonus and the market price at the vesting
date.
37. DISPOSAL OF SUBSIDIARIES
2017
(i) On 7 April 2017, the Company’s wholly owned subsidiary, Jurong Shipyard Pte Ltd divested its 70% interest in
Shanghai Guofeng Marine Engineering & Technology Co. Ltd. to the remaining individual shareholders, Zhao
Wei Ming and Zhao Gang, for a cash consideration of RMB 5,800,000 ($1,177,100); and recognised a gain of
$787,000 in non-operating income.
(ii) On 1 November 2017, the Company’s wholly owned subsidiary, Jurong Shipyard Pte Ltd divested its 100%
interest in Jurong Autoblast Services Pte. Ltd. to Zingametall (S) Pte Ltd, for a cash consideration of $349,943;
and recognised a loss of $34,000 in non-operating expenses.
A N N U A L R E P O R T 2 0 1 8 273S E M B C O R P M A R I N E272

NOTES TO THE FINANCIAL STATEMENTSYear ended 31 December 2018
38. ACQUISITION OF SUBSIDIARY AND INTELLECTUAL PROPERTY RIGHTS
During the year, the Company's wholly-owned subsidiary, Sembcorp Marine Integrated Yard ("SMIY"), acquired the
title to all of Sevan Marine ASA ("Sevan Marine")'s intellectual property, and 95% of the shares of HiLoad LNG AS
("HiLoad"), a Sevan Marine subsidiary. The intellectual property acquired relates mainly to patents for the geostationary
cylindrical hull design. In addition, SMIY acquired the balance 5% equity interest in HiLoad from a minority shareholder.
Consequently, the intangible asset and financial statements of HiLoad were consolidated into the Group’s financial
statements.
Effect of acquisition
Revenue and profit contribution
The revenue and profit contribution from this new acquisition were not material.
Had the acquired businesses been consolidated from 1 January 2018, the contribution to the Group’s consolidated
revenue and consolidated profit for the year ended 31 December 2018 would not have been significantly impacted.
Consideration transferred
The final allocation of the purchase price to the identifiable assets acquired and liabilities assumed in the business
combination is currently being determined and has not been completed at the reporting date.
The following table summarises the acquisition date provisional fair value of each major class of consideration transferred:
2018$’000
(a) Effect on cash flows of the GroupCash paid 54,619Less: Cash and cash equivalents in subsidiary acquired (25)Cash outflow on acquisition 54,594
Note
At
fair value$’000
(b) Identifiable assets acquired and liabilities assumedIntangible assets 12 54,604Trade and other receivables 5Cash and cash equivalents 25Total assets 54,634
Trade and other payables 15Total liabilities 15
Net identifiable assets 54,619Consideration transferred for the business 54,619
Acquisition-related costs
The acquisition-related costs incurred in relation to the acquisition were immaterial, but charged to profit or loss.
A N N U A L R E P O R T 2 0 1 8 275S E M B C O R P M A R I N E274

NOTES TO THE FINANCIAL STATEMENTSYear ended 31 December 2018
39. RELATED PARTIES
(a) Related party transactions
The Group had the following outstanding balances and significant transactions with related parties during
the year:
Outstanding balances
Group
Significant transactions
Group2018 2017 2018 2017$’000 $’000 $’000 $’000
Immediate holding companyManagement fee payable (500) (250) (250) (250)Others – – 72 253
Related corporationsSales 37 1,893 201 286Purchases (1,321) (802) (41,814) (36,636)Payment on behalf – – 105 97Rental income – – 7 –Finance income – – 1,185 1,275Finance costs (2,829) (1,641) (22,133) (18,482)Others – – – (7)
Associates and joint venturesSales 1,220 1,354 – 2Purchases (4,729) (2,836) (7,786) (4,428)Finance income – – 444 293Payment on behalf – – – 2Loans and advances 31,510 35,127 – –Others (2,255) (1,885) (72) 30
A N N U A L R E P O R T 2 0 1 8 275S E M B C O R P M A R I N E274
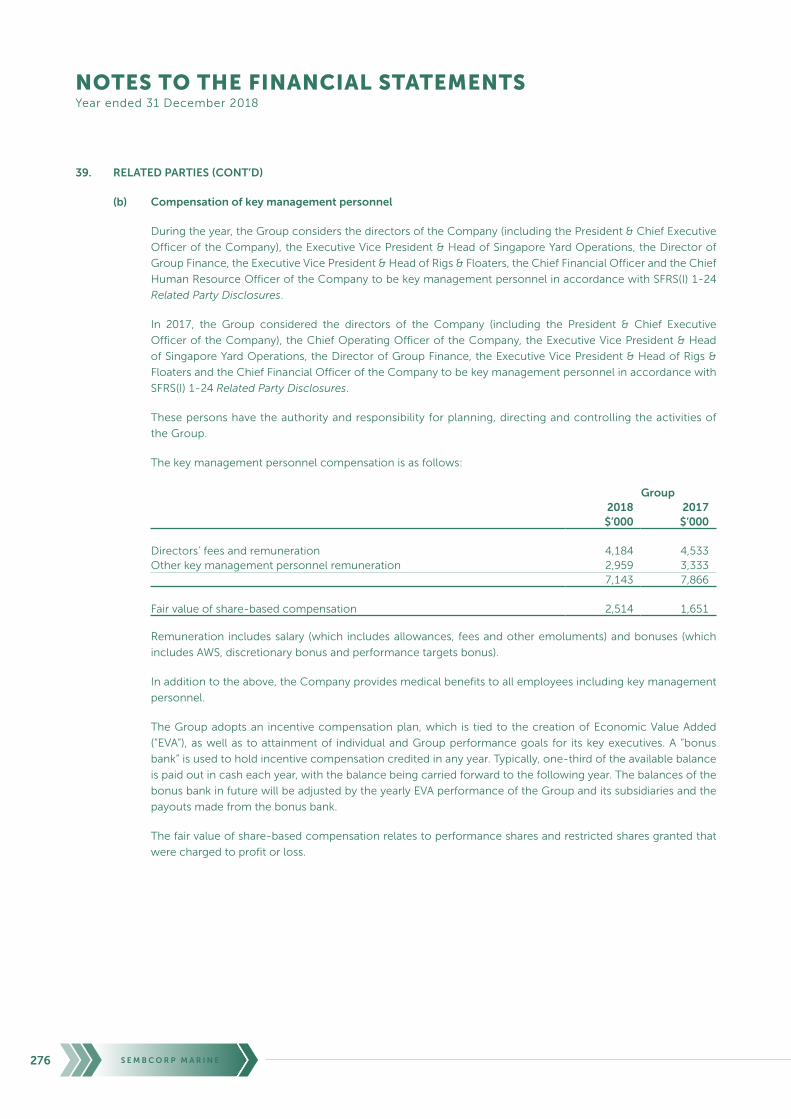
NOTES TO THE FINANCIAL STATEMENTSYear ended 31 December 2018
39. RELATED PARTIES (CONT’D)
(b) Compensation of key management personnel
During the year, the Group considers the directors of the Company (including the President & Chief Executive
Officer of the Company), the Executive Vice President & Head of Singapore Yard Operations, the Director of
Group Finance, the Executive Vice President & Head of Rigs & Floaters, the Chief Financial Officer and the Chief
Human Resource Officer of the Company to be key management personnel in accordance with SFRS(I) 1-24
Related Party Disclosures.
In 2017, the Group considered the directors of the Company (including the President & Chief Executive
Officer of the Company), the Chief Operating Officer of the Company, the Executive Vice President & Head
of Singapore Yard Operations, the Director of Group Finance, the Executive Vice President & Head of Rigs &
Floaters and the Chief Financial Officer of the Company to be key management personnel in accordance with
SFRS(I) 1-24 Related Party Disclosures.
These persons have the authority and responsibility for planning, directing and controlling the activities of
the Group.
The key management personnel compensation is as follows:
Group2018 2017$’000 $’000
Directors’ fees and remuneration 4,184 4,533Other key management personnel remuneration 2,959 3,333
7,143 7,866
Fair value of share-based compensation 2,514 1,651
Remuneration includes salary (which includes allowances, fees and other emoluments) and bonuses (which
includes AWS, discretionary bonus and performance targets bonus).
In addition to the above, the Company provides medical benefits to all employees including key management
personnel.
The Group adopts an incentive compensation plan, which is tied to the creation of Economic Value Added
(“EVA”), as well as to attainment of individual and Group performance goals for its key executives. A “bonus
bank” is used to hold incentive compensation credited in any year. Typically, one-third of the available balance
is paid out in cash each year, with the balance being carried forward to the following year. The balances of the
bonus bank in future will be adjusted by the yearly EVA performance of the Group and its subsidiaries and the
payouts made from the bonus bank.
The fair value of share-based compensation relates to performance shares and restricted shares granted that
were charged to profit or loss.
A N N U A L R E P O R T 2 0 1 8 277S E M B C O R P M A R I N E276

NOTES TO THE FINANCIAL STATEMENTSYear ended 31 December 2018
40. FINANCIAL INSTRUMENTS
Financial risk management objectives and policies
The Group’s activities expose it to market risk (including interest rate risk, foreign currency risk and price risk), credit
risk and liquidity risk.
As part of the Group’s Enterprise Risk Management framework, the Group's treasury policies and financial authority
limits are documented and reviewed periodically. The policies set out the parameters for management of Group
liquidity, counterparty risk, foreign exchange and derivative transactions and financing.
The Group utilises foreign exchange contracts, interest rate swaps and various financial instruments to manage
exposures to interest rate and foreign exchange risks arising from operating, financing and investment activities.
Exposures to foreign currency risks are also hedged naturally by a matching sale or purchase of a matching asset
or liability of the same currency and amount where possible. All such transactions must involve underlying assets or
liabilities and no speculative transactions are allowed.
The financial authority limits seek to limit and mitigate transactional risks by setting out the threshold of approvals
required for the entry into contractual obligations and investments.
(a) Market risk
Market risk is the risk that changes in market prices, such as interest rates, foreign exchange rates and prices
will affect the Group’s income or the value of its holdings of financial instruments. The objective of market risk
management is to manage and reduce market risk exposures within acceptable parameters.
(i) Interest rate risk
The Group’s exposure to market risk for changes in interest rate environment relates mainly to its
debt obligations.
The Group’s policy is to maintain an efficient and optimal interest cost structure using a mix of fixed and
variable rate debts and long-term and short-term borrowings.
The Group’s risk management policy is to ensure that at least 50% of its debt portfolio is at fixed interest
rates. This is achieved partly by entering into fixed-rate instruments and partly by borrowing at a floating
rate and using interest rate swaps to hedge the variability in cash flows attributable to the floating
interest rates.
The Group designates the interest rate swaps in their entirety to hedge its interest rate risk and applies
a hedge ratio of 1:1. The Group determines the existence of an economic relationship between the
hedging instrument and hedged item based on the reference interest rates, tenors, repricing dates and
maturities and the notional or par amounts. The Group assesses whether the derivative designated in
each hedging relationship is expected to be and has been effective in offsetting changes in cash flows
of the hedged item by looking at the critical terms.
In these hedge relationships, the main source of ineffectiveness is the effect of the counterparties’ and
the Group’s own credit risk on the fair value of the swaps, which is not reflected in the change in the fair
value of the hedged cash flows attributable to the change in interest rates.
At 31 December 2018, the Group had interest rate swaps with an aggregate notional amount of
$1,300,020,000 (2017: $678,474,000; 1 January 2017: $1,000,163,000). The Group receives a variable
interest rate and pays a fixed rate interest ranging from 2.19% to 5.53% (2017: 2.19% to 3.10%; 1 January
2017: 0.98% to 3.10%) per annum on the notional amount. Interest rate swaps with notional amounts
of $300,000,000 (2017: $nil; 1 January 2017: $300,000,000) were entered with a related corporation.
A N N U A L R E P O R T 2 0 1 8 277S E M B C O R P M A R I N E276

NOTES TO THE FINANCIAL STATEMENTSYear ended 31 December 2018
40. FINANCIAL INSTRUMENTS (CONT’D)
(a) Market risk (cont’d)
(i) Interest rate risk (cont’d)
Sensitivity analysis
It is estimated that 50 basis points (“bp”) change in interest rate at the reporting date would increase/
(decrease) equity and profit before tax by the following amounts. This analysis assumes that all other
variables, in particular foreign currency rates, remain constant.
Profit before tax Equity50 bp 50 bp 50 bp 50 bp
Increase Decrease Increase Decrease$’000 $’000 $’000 $’000
Group31 December 2018Variable rate financial instruments (4,791) 4,791 6,663 (6,754)
31 December 2017Variable rate financial instruments (6,893) 6,893 4,969 (5,046)
Company31 December 2018Variable rate financial instruments 396 (396) – –
31 December 2017Variable rate financial instruments 274 (274) – –
(ii) Foreign currency risk
The Group operates globally and is exposed to currency risk on sales, purchases and borrowings that
are denominated in a currency other than the respective functional currencies of the Company and
its subsidiaries. The currencies in which these transactions are primarily denominated in are Singapore
dollars (“SGD”), United States dollars (“USD”), Euros (“EUR”), Pounds sterling (“GBP”) and Brazilian Real
(“BRL”). Such risks are hedged either by forward foreign currency contracts in respect of actual or
forecasted currency exposures which are reasonably certain or hedged naturally by a matching sale or
purchase of a matching asset or liability of the same currency and amount. Forward foreign currency
contracts with notional amounts of $154,339,000 (2017: $159,819,000; 1 January 2017: $302,682,000)
were entered with a related corporation.
The Group’s risk management policy is to hedge 50% to 100% of its estimated net foreign currency
exposure in respect of its forecasted project cash inflows and outflows over the lifespans of the projects.
The Group designates the forward foreign currency contracts in their entirety to hedge its foreign
currency risk and applies a hedge ratio of 1:1. The Group determines the existence of an economic
relationship between the hedging instrument and hedged item based on the currency, amount and
timing of their respective cash flows. The Group assesses whether the derivative designated in each
hedging relationship is expected to be and has been effective in offsetting changes in cash flows of the
hedged item by looking at the critical terms.
In these hedge relationships, the main sources of ineffectiveness may be due to:
• the effect of the counterparties’ and the Group’s own credit risk on the fair value of the forward
foreign currency contracts, which is not reflected in the change in the fair value of the hedged
cash flows attributable to the change in exchange rates; and
• changes in the timing of the hedged transactions.
A N N U A L R E P O R T 2 0 1 8 279S E M B C O R P M A R I N E278

NOTES TO THE FINANCIAL STATEMENTSYear ended 31 December 2018
40. FINANCIAL INSTRUMENTS (CONT’D)
(a) Market risk (cont’d)
(ii) Foreign currency risk (cont’d)
The summary of quantitative data about the Group’s exposure to foreign currency risk as provided to
the management of the Group based on its risk management policy is as follows:
SGD USD EUR GBP BRL Others Total$’000 $’000 $’000 $’000 $’000 $’000 $’000
Group31 December 2018Financial assetsCash and cash
equivalents 5,763 183,593 3,471 7,874 1,823 2,865 205,389Trade and other
receivables 16,177 1,358,576 26,347 1,317 7,887 6,696 1,417,00021,940 1,542,169 29,818 9,191 9,710 9,561 1,622,389
Financial liabilitiesTrade and other payables (122,932) (328,140) (56,296) (5,574) (79,886) (16,698) (609,526)Interest-bearing
borrowings (20) (427,440) – – – – (427,460)(122,952) (755,580) (56,296) (5,574) (79,886) (16,698) (1,036,986)
Net financial (liabilities)/assets (101,012) 786,589 (26,478) 3,617 (70,176) (7,137) 585,403
Add: Contract assets – 954,376 764 2,898 – 8,841 966,879Add: Firm commitments
and highly probable forecast transactions in foreign currencies (2,717) 157,100 (221,173) (20,693) 54,609 (101,085) (133,959)
Less: Foreign currency forward contracts – (1,189,368) – – – – (1,189,368)
Net currency exposure (103,729) 708,697 (246,887) (14,178) (15,567) (99,381) 228,955
31 December 2017Financial assetsCash and cash
equivalents 6,349 173,016 14,166 127,059 2,192 5,458 328,240Trade and other
receivables 24,630 636,169 3,916 4,097 9,109 2,192 680,113Other financial assets – – – – – 18,200 18,200
30,979 809,185 18,082 131,156 11,301 25,850 1,026,553Financial liabilitiesTrade and other payables (74,796) (222,330) (55,899) (9,334) (116,940) (11,046) (490,345)Interest-bearing
borrowings – (140,982) – – (95,094) – (236,076)(74,796) (363,312) (55,899) (9,334) (212,034) (11,046) (726,421)
Net financial (liabilities)/assets (43,817) 445,873 (37,817) 121,822 (200,733) 14,804 300,132
Add: Contract assets 4,626 633,872 – – – – 638,498Add: Firm commitments
and highly probable forecast transactions in foreign currencies (135) 515,386 (245,588) 30,931 (28,402) (43,048) 229,144
Less: Foreign currency forward contracts – (814,308) 3,664 (166,887) – – (977,531)
Net currency exposure (39,326) 780,823 (279,741) (14,134) (229,135) (28,244) 190,243
A N N U A L R E P O R T 2 0 1 8 279S E M B C O R P M A R I N E278
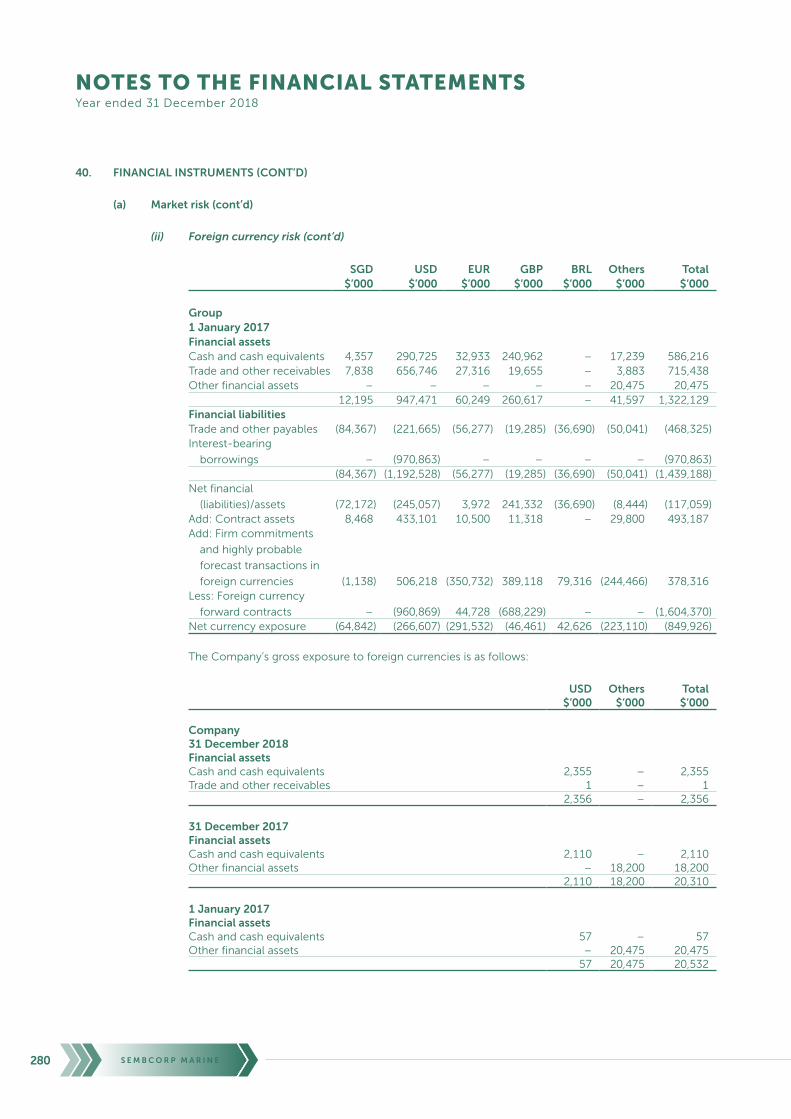
NOTES TO THE FINANCIAL STATEMENTSYear ended 31 December 2018
40. FINANCIAL INSTRUMENTS (CONT’D)
(a) Market risk (cont’d)
(ii) Foreign currency risk (cont’d)
SGD USD EUR GBP BRL Others Total$’000 $’000 $’000 $’000 $’000 $’000 $’000
Group1 January 2017Financial assetsCash and cash equivalents 4,357 290,725 32,933 240,962 – 17,239 586,216Trade and other receivables 7,838 656,746 27,316 19,655 – 3,883 715,438Other financial assets – – – – – 20,475 20,475
12,195 947,471 60,249 260,617 – 41,597 1,322,129Financial liabilitiesTrade and other payables (84,367) (221,665) (56,277) (19,285) (36,690) (50,041) (468,325)Interest-bearing
borrowings – (970,863) – – – – (970,863)(84,367) (1,192,528) (56,277) (19,285) (36,690) (50,041) (1,439,188)
Net financial
(liabilities)/assets (72,172) (245,057) 3,972 241,332 (36,690) (8,444) (117,059)Add: Contract assets 8,468 433,101 10,500 11,318 – 29,800 493,187Add: Firm commitments
and highly probable
forecast transactions in
foreign currencies (1,138) 506,218 (350,732) 389,118 79,316 (244,466) 378,316Less: Foreign currency
forward contracts – (960,869) 44,728 (688,229) – – (1,604,370)Net currency exposure (64,842) (266,607) (291,532) (46,461) 42,626 (223,110) (849,926)
The Company’s gross exposure to foreign currencies is as follows:
USD Others Total$’000 $’000 $’000
Company31 December 2018Financial assetsCash and cash equivalents 2,355 – 2,355Trade and other receivables 1 – 1
2,356 – 2,356
31 December 2017Financial assetsCash and cash equivalents 2,110 – 2,110Other financial assets – 18,200 18,200
2,110 18,200 20,310
1 January 2017Financial assetsCash and cash equivalents 57 – 57Other financial assets – 20,475 20,475
57 20,475 20,532
A N N U A L R E P O R T 2 0 1 8 281S E M B C O R P M A R I N E280

NOTES TO THE FINANCIAL STATEMENTSYear ended 31 December 2018
40. FINANCIAL INSTRUMENTS (CONT’D)
(a) Market risk (cont’d)
(ii) Foreign currency risk (cont’d)
Sensitivity analysis
A 10% strengthening of the following currencies against the functional currencies of the Company and
its subsidiaries at the balance sheet date would have increased/(decreased) equity and profit before tax
by the amounts shown below. The analysis assumes that all other variables, in particular interest rates,
remain constant and ignores any impact of firm commitments (not subject to fair value hedges) and
highly probable forecast transactions in foreign currencies. The analysis is performed on the same basis
for 2017.
Group Company
Equity
Profit
before tax Equity
Profit
before tax$'000 $'000 $'000 $'000
2018SGD – (10,101) – –USD (94,125) 180,623 – 236EUR – (2,571) – –GBP – 651 – –BRL – (7,018) – –Others – 171 – –
2017SGD – (3,919) – –USD (63,855) 107,975 – 211EUR – (3,416) – –GBP (5,382) 3,183 – –BRL – (20,073) – –Others 1,820 (340) 1,820 –
A 10% weakening of the above currencies against the functional currencies of the Company and its
subsidiaries at the balance sheet date would have equal but opposite effects on the above currencies to
the amounts shown above, on the basis that all other variables remain constant, except for amounts of
$1,820,000 in 2017 relating to other currency which would be recognised in profit before tax instead of
equity, on the basis of impairment found on the equity securities.
A N N U A L R E P O R T 2 0 1 8 281S E M B C O R P M A R I N E280

NOTES TO THE FINANCIAL STATEMENTSYear ended 31 December 2018
40. FINANCIAL INSTRUMENTS (CONT’D)
(a) Market risk (cont’d)
(iii) Price risk
In 2017, the Group was exposed to equity securities and unit trusts price risk because of the investments
held by the Group which are classified on the consolidated balance sheet at FVOCI and FVTPL
respectively (2017: available-for-sale).
Sensitivity analysis
If prices for equity securities and unit trusts increase by 10%, assuming all other variables are held
constant, the equity and profit before tax would have increased by the amounts shown below:
Group Company2017 2017$'000 $'000
Equity 1,889 1,889Profit before tax – –
If prices for equity securities and unit trusts decrease by 10%, assuming all other variables are held
constant, the equity and profit before tax would have decreased by the amounts shown below (on the
basis of impairment found on the equity securities):
Group Company2017 2017$'000 $'000
Equity (69) (69)Profit before tax (1,820) (1,820)
As at 31 December 2018, the Group is not exposed to significant price risk as its quoted equity securities
and unit trust was disposed during the year.
A N N U A L R E P O R T 2 0 1 8 283S E M B C O R P M A R I N E282
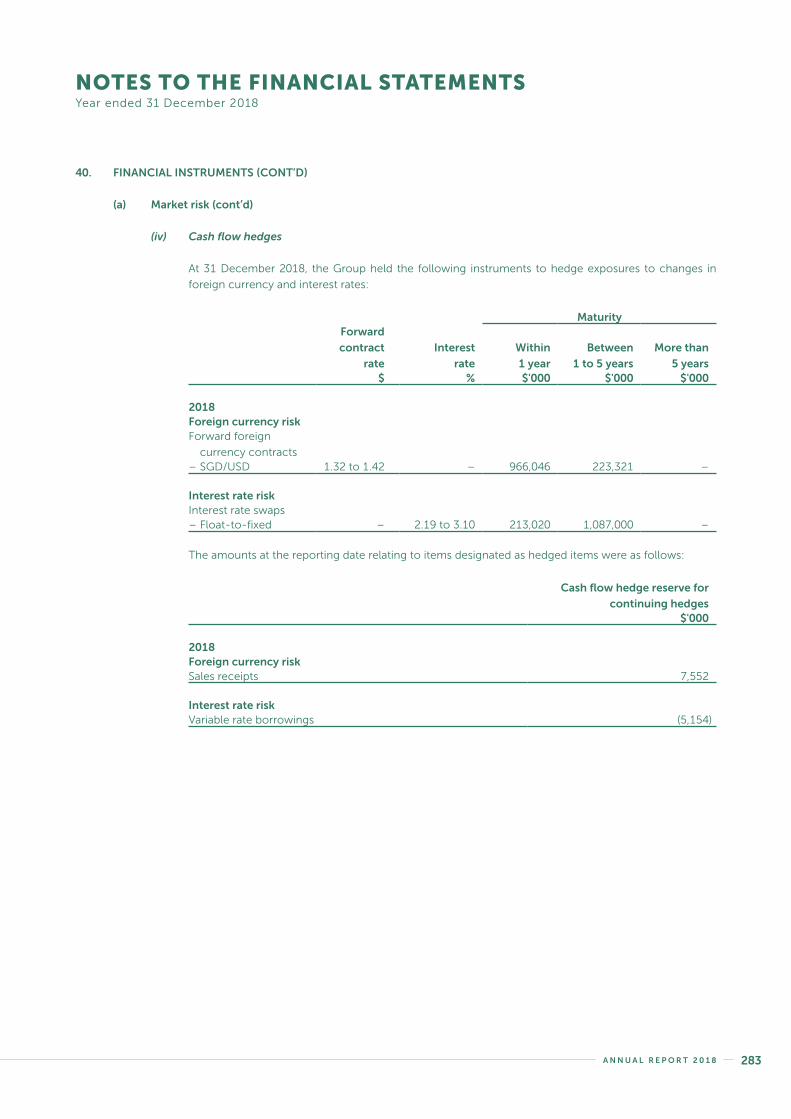
NOTES TO THE FINANCIAL STATEMENTSYear ended 31 December 2018
40. FINANCIAL INSTRUMENTS (CONT’D)
(a) Market risk (cont’d)
(iv) Cash flow hedges
At 31 December 2018, the Group held the following instruments to hedge exposures to changes in
foreign currency and interest rates:
MaturityForward
contract
rate
Interest
rate
Within
1 year
Between
1 to 5 years
More than
5 years$ % $'000 $'000 $'000
2018Foreign currency riskForward foreign
currency contracts– SGD/USD 1.32 to 1.42 – 966,046 223,321 –
Interest rate riskInterest rate swaps– Float-to-fixed – 2.19 to 3.10 213,020 1,087,000 –
The amounts at the reporting date relating to items designated as hedged items were as follows:
Cash flow hedge reserve for
continuing hedges$'000
2018Foreign currency riskSales receipts 7,552
Interest rate riskVariable rate borrowings (5,154)
A N N U A L R E P O R T 2 0 1 8 283S E M B C O R P M A R I N E282

NOTES TO THE FINANCIAL STATEMENTSYear ended 31 December 2018
40
. FI
NA
NC
IAL
INST
RU
ME
NT
S (C
ON
T’D
)
(a)
Mar
ket
risk
(co
nt’
d)
(iv)
C
ash
flo
w h
edg
es (c
on
t’d
)
Th
e a
mo
un
ts r
ela
ted
to
ite
ms
de
sig
nat
ed
as
he
dg
ing
inst
rum
en
ts a
nd
he
dg
e in
eff
ec
tive
ne
ss w
ere
as
follo
ws:
20
18
Du
rin
g t
he
year
20
18
No
min
alA
mo
un
tA
sset
sLi
abili
ties
Lin
e it
em in
th
e b
alan
ce
shee
t w
her
e th
e h
edg
ing
in
stru
men
t is
in
clu
ded
Ch
ang
ein
val
ue
of
hed
gin
gin
stru
men
tre
cog
nis
edin
OC
I
Hed
ge
inef
fect
ive-
nes
sre
cog
nis
edin
pro
fit
or
loss
Lin
e it
em in
pro
fit
or
loss
that
incl
ud
esh
edg
ein
effe
ctiv
enes
s
Am
ou
nt
recl
assi
fied
fro
mh
edg
ing
rese
rve
to p
rofi
to
r lo
ss
Lin
e it
em
affe
cted
in
pro
fit
or
loss
b
ecau
se o
f th
e re
clas
sifi
cati
on
$'0
00
$'0
00
$'0
00
$'0
00
$'0
00
$'0
00
Fore
ign
cu
rren
cy
risk
Fo
rwar
d
fore
ign
c
urr
en
cy
co
ntr
acts
1,1
89
,36
71
2,1
88
13
,55
4
Oth
er
fin
anc
ial
asse
ts, o
the
r fi
nan
cia
l lia
bili
tie
s(4
4,3
18
)1
,42
1
Oth
er
op
era
tin
g
inc
om
e, o
the
r o
pe
rati
ng
e
xpe
nse
s8
,96
6
Oth
er
op
era
tin
g
inc
om
e, o
the
r o
pe
rati
ng
e
xpe
nse
s
Inte
rest
rat
e ri
sk
Inte
rest
rat
e
swap
s1
,30
0,0
20
33
46
,41
7
Oth
er
fin
anc
ial
asse
ts, o
the
r fi
nan
cia
l lia
bili
tie
s4
12
–
Oth
er
op
era
tin
g
inc
om
e, o
the
r o
pe
rati
ng
e
xpe
nse
s–
Oth
er
op
era
tin
g
inc
om
e, o
the
r o
pe
rati
ng
e
xpe
nse
s
A N N U A L R E P O R T 2 0 1 8 285S E M B C O R P M A R I N E284
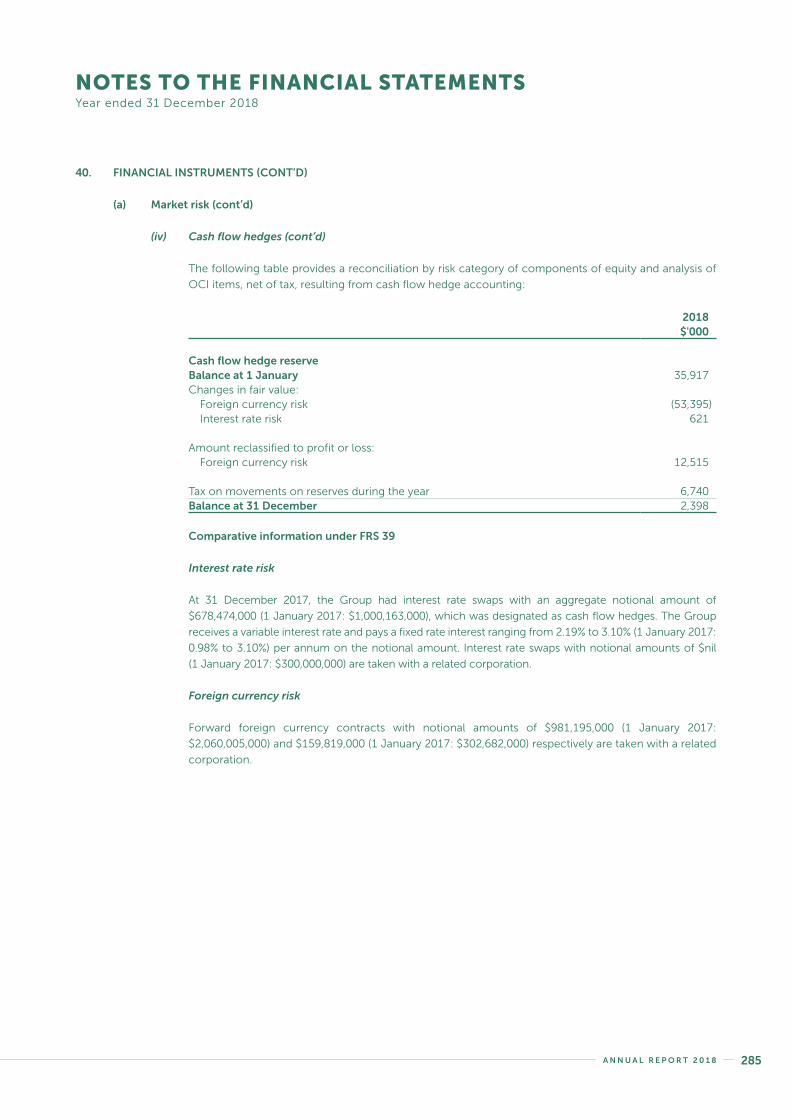
NOTES TO THE FINANCIAL STATEMENTSYear ended 31 December 2018
40. FINANCIAL INSTRUMENTS (CONT’D)
(a) Market risk (cont’d)
(iv) Cash flow hedges (cont’d)
The following table provides a reconciliation by risk category of components of equity and analysis of
OCI items, net of tax, resulting from cash flow hedge accounting:
2018$'000
Cash flow hedge reserveBalance at 1 January 35,917Changes in fair value:
Foreign currency risk (53,395)Interest rate risk 621
Amount reclassified to profit or loss:Foreign currency risk 12,515
Tax on movements on reserves during the year 6,740Balance at 31 December 2,398
Comparative information under FRS 39
Interest rate risk
At 31 December 2017, the Group had interest rate swaps with an aggregate notional amount of
$678,474,000 (1 January 2017: $1,000,163,000), which was designated as cash flow hedges. The Group
receives a variable interest rate and pays a fixed rate interest ranging from 2.19% to 3.10% (1 January 2017:
0.98% to 3.10%) per annum on the notional amount. Interest rate swaps with notional amounts of $nil
(1 January 2017: $300,000,000) are taken with a related corporation.
Foreign currency risk
Forward foreign currency contracts with notional amounts of $981,195,000 (1 January 2017:
$2,060,005,000) and $159,819,000 (1 January 2017: $302,682,000) respectively are taken with a related
corporation.
A N N U A L R E P O R T 2 0 1 8 285S E M B C O R P M A R I N E284

NOTES TO THE FINANCIAL STATEMENTSYear ended 31 December 2018
40. FINANCIAL INSTRUMENTS (CONT’D)
(b) Credit risk
The Group monitors its exposure to credit risks arising from sales to trade customers on an on-going basis, and
credit evaluations are done on customers that require credit. The credit quality of customers is assessed after
taking into account its financial position and past experience with the customers.
The Group only deals with pre-approved customers and financial institutions with good credit rating. To
minimise the Group’s counterparty risk, the Group enters into derivative transactions only with creditworthy
institutions. Cash and fixed deposits are placed in banks and financial institutions with good credit rating.
The Group assumes that credit risk of a financial asset has increased significantly when the financial asset
remains outstanding for more than the reasonable range of past due days, taking into consideration historical
payment track records, current macroeconomics situation as well as the general industry trend.
As the Group and the Company do not hold any collateral, the maximum exposure to credit risk is the carrying
amount of each financial asset, including derivatives, in the balance sheets.
The Group’s and the Company’s maximum exposure to credit risk for financial assets at amortised cost (2017:
loans and receivables) and contract assets at the balance sheet date is as follows:
Group Company
Note
31 December
2018
31 December
2017
1 January
2017
31 December
2018
31 December
2017
1 January
2017$’000 $’000 $’000 $’000 $’000 $’000
By business
activityRigs & floaters,
repairs &
upgrades,
offshore
platforms and
specialised
shipbuilding 2,768,969 1,327,243 912,306 – – –Ship chartering 12 9,171 10,573 – – –Others 9,943 20,102 7,600 133,274 145,777 94,846
2,778,924 1,356,516 930,479 133,274 145,777 94,846
Financial assets
at amortised
cost (2017:
loans and
receivables)
and contract
assetsNon-current* 9 1,121,499 152,770 36,560 31,719 31,725 36,605Current 9,11 1,657,425 1,203,746 893,919 101,555 114,052 58,241
2,778,924 1,356,516 930,479 133,274 145,777 94,846
* Not past due.
A N N U A L R E P O R T 2 0 1 8 287S E M B C O R P M A R I N E286

NOTES TO THE FINANCIAL STATEMENTSYear ended 31 December 2018
40. FINANCIAL INSTRUMENTS (CONT’D)
(b) Credit risk (cont’d)
The age analysis of financial assets at amortised cost (2017: loans and receivables) and contract assets for the
Group is as follows:
Gross Impairment Gross Impairment Gross Impairment31 December
2018
31 December
2018
31 December
2017
31 December
2017
1 January
2017
1 January
2017$’000 $’000 $’000 $’000 $’000 $’000
GroupNot past due 2,692,583 160 1,257,964 – 822,540 –Past due 0 to
3 months 34,462 117 27,769 68 29,659 2,170Past due 3 to
6 months 16,237 167 38,651 53 47,090 364Past due 6 to
12 months 4,060 313 24,849 483 29,652 428More than 1 year 193,230 160,891 172,864 164,977 174,227 169,727
2,940,572 161,648 1,522,097 165,581 1,103,168 172,689
CompanyNot past due 133,274 – 145,777 – 94,846 –
Expected credit loss (ECL) assessment for customers with credit ratings (or equivalent) as at 1 January 2018
and 31 December 2018
The Group allocates exposure from key customers to a credit risk grade based on data that is determined to be
indicative of the risk of loss (including but not limited to external ratings if available, audited financial statements
to calculate the internal risk rating using the Altman Z-score method, and available press information about
customers) and applying experienced credit judgement. Credit risk grades are defined using qualitative and
quantitative factors that are indicative of the risk of default and are aligned to external credit rating definitions
from Standards and Poor’s.
ECL rate is calculated based on probabilities of default and loss given default. Lifetime probabilities of default
for individual customers are based on external ratings from Bloomberg L.P. adjusted for time horizon of the
credit exposure, or historical data supplied by Standards and Poor’s for each credit rating. The Group monitors
changes in credit risk through on-going review of customer credit worthiness and by tracking published
external credit ratings.
Loss rates are adjusted for current conditions and the Group’s view of economic conditions over the expected
lives of the receivables only if these factors have a significant impact to the credit loss.
A N N U A L R E P O R T 2 0 1 8 287S E M B C O R P M A R I N E286

NOTES TO THE FINANCIAL STATEMENTSYear ended 31 December 2018
40. FINANCIAL INSTRUMENTS (CONT’D)
(b) Credit risk (cont’d)
The following table provides information about the exposure to credit risk and ECLs for financial assets at
amortised cost and contract assets for customers with credit ratings (or equivalent):
Credit
impaired
Gross
carrying
amount
Loss
allowance
Net
carrying
amount$’000 $’000 $’000
2018GroupReceivables measured at lifetime ECL– Trade receivables Yes 158,715 158,715 –
Receivables measured at lifetime ECL– Trade receivables and contract assets No 2,532,900 1,904 2,530,996
CompanyReceivables measured at lifetime ECL– Trade receivables No – – –
There were no trade and other receivables and contract assets for which credit risk has increased significantly
since initial recognition but that are not credit-impaired financial assets.
Expected credit loss assessment for customers (allowance matrix) as at 1 January 2018 and 31 December 2018
The Group uses an allowance matrix to measure the ECLs of trade receivables for customers not allocated
specific credit ratings, which comprises large number of small balances.
Loss rates are calculated using a “roll rate” method based on the probability of a receivable progressing through
succession stages of delinquency to write-off.
Loss rates are based on actual credit loss experience over the past 5 years adjusted for current conditions and
the Group’s view of economic conditions over the expected lives of the receivables only if these factors have
a significant impact to the credit loss.
A N N U A L R E P O R T 2 0 1 8 289S E M B C O R P M A R I N E288
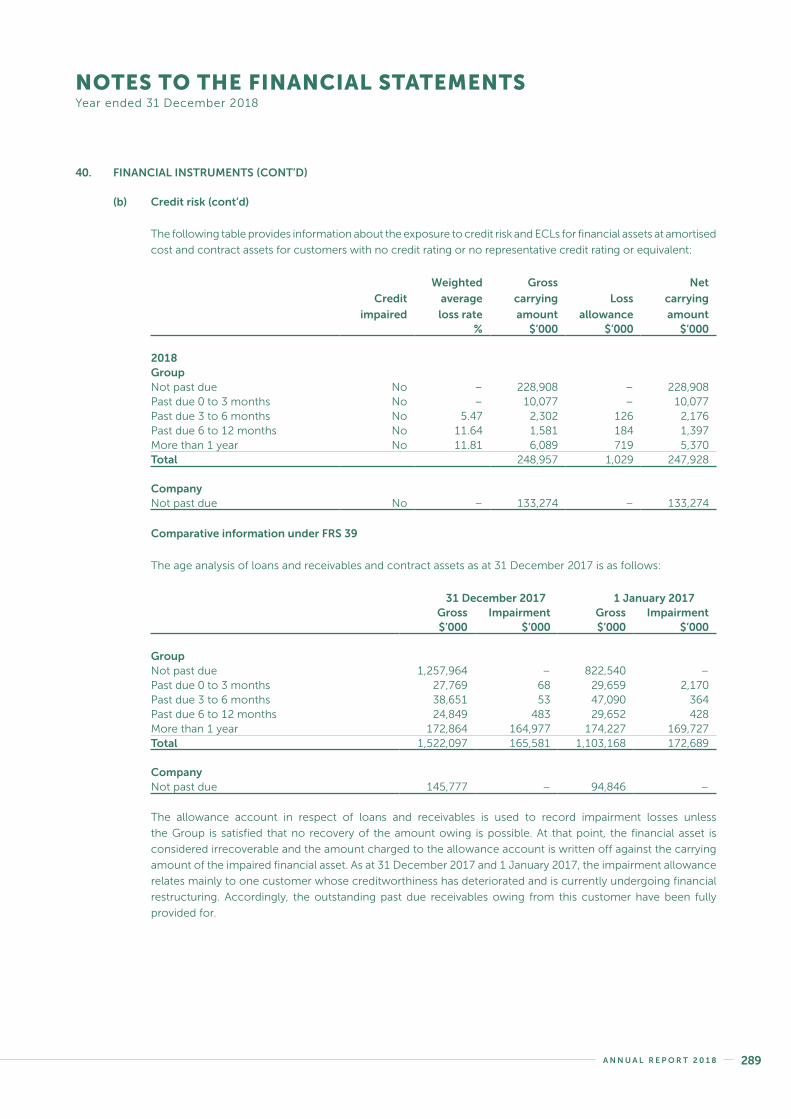
NOTES TO THE FINANCIAL STATEMENTSYear ended 31 December 2018
40. FINANCIAL INSTRUMENTS (CONT’D)
(b) Credit risk (cont’d)
The following table provides information about the exposure to credit risk and ECLs for financial assets at amortised
cost and contract assets for customers with no credit rating or no representative credit rating or equivalent:
Credit
impaired
Weighted
average
loss rate
Gross
carrying
amount
Loss
allowance
Net
carrying
amount% $’000 $’000 $’000
2018GroupNot past due No – 228,908 – 228,908Past due 0 to 3 months No – 10,077 – 10,077Past due 3 to 6 months No 5.47 2,302 126 2,176Past due 6 to 12 months No 11.64 1,581 184 1,397More than 1 year No 11.81 6,089 719 5,370Total 248,957 1,029 247,928
CompanyNot past due No – 133,274 – 133,274
Comparative information under FRS 39
The age analysis of loans and receivables and contract assets as at 31 December 2017 is as follows:
31 December 2017 1 January 2017Gross Impairment Gross Impairment$’000 $’000 $’000 $’000
GroupNot past due 1,257,964 – 822,540 –Past due 0 to 3 months 27,769 68 29,659 2,170Past due 3 to 6 months 38,651 53 47,090 364Past due 6 to 12 months 24,849 483 29,652 428More than 1 year 172,864 164,977 174,227 169,727Total 1,522,097 165,581 1,103,168 172,689
CompanyNot past due 145,777 – 94,846 –
The allowance account in respect of loans and receivables is used to record impairment losses unless
the Group is satisfied that no recovery of the amount owing is possible. At that point, the financial asset is
considered irrecoverable and the amount charged to the allowance account is written off against the carrying
amount of the impaired financial asset. As at 31 December 2017 and 1 January 2017, the impairment allowance
relates mainly to one customer whose creditworthiness has deteriorated and is currently undergoing financial
restructuring. Accordingly, the outstanding past due receivables owing from this customer have been fully
provided for.
A N N U A L R E P O R T 2 0 1 8 289S E M B C O R P M A R I N E288
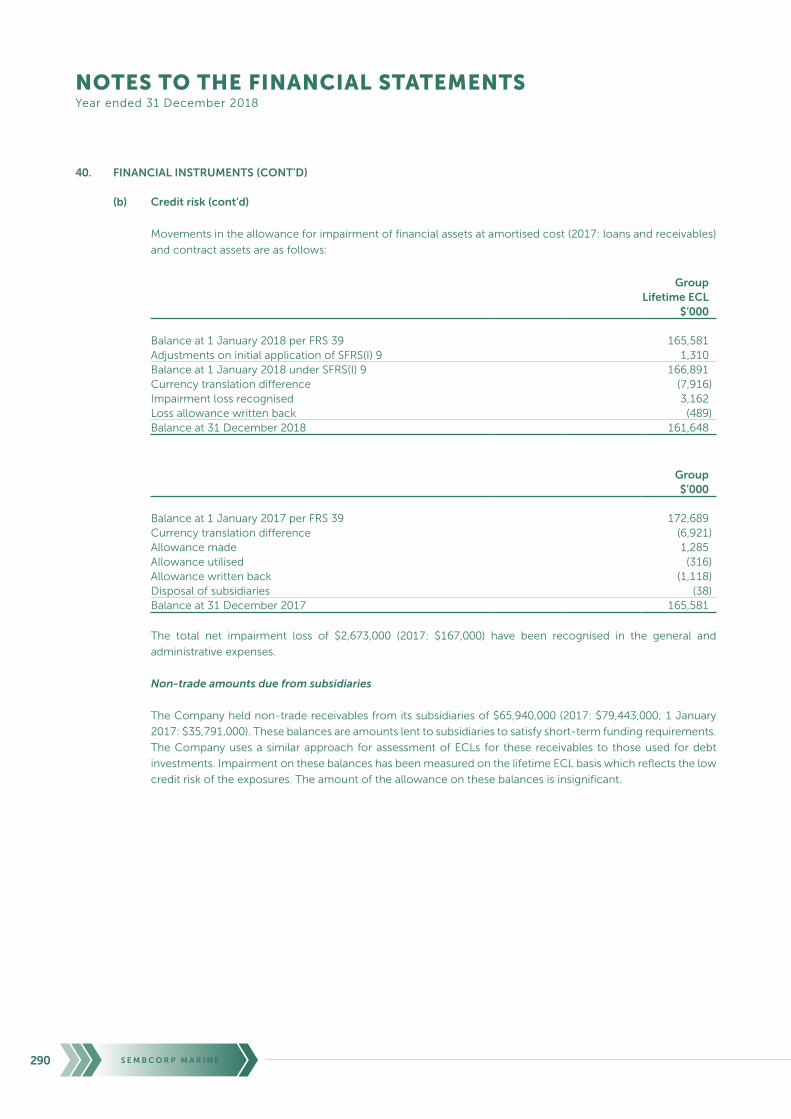
NOTES TO THE FINANCIAL STATEMENTSYear ended 31 December 2018
40. FINANCIAL INSTRUMENTS (CONT’D)
(b) Credit risk (cont’d)
Movements in the allowance for impairment of financial assets at amortised cost (2017: loans and receivables)
and contract assets are as follows:
GroupLifetime ECL
$’000
Balance at 1 January 2018 per FRS 39 165,581Adjustments on initial application of SFRS(I) 9 1,310Balance at 1 January 2018 under SFRS(I) 9 166,891Currency translation difference (7,916)Impairment loss recognised 3,162Loss allowance written back (489)Balance at 31 December 2018 161,648
Group$’000
Balance at 1 January 2017 per FRS 39 172,689Currency translation difference (6,921)Allowance made 1,285Allowance utilised (316)Allowance written back (1,118)Disposal of subsidiaries (38)Balance at 31 December 2017 165,581
The total net impairment loss of $2,673,000 (2017: $167,000) have been recognised in the general and
administrative expenses.
Non-trade amounts due from subsidiaries
The Company held non-trade receivables from its subsidiaries of $65,940,000 (2017: $79,443,000; 1 January
2017: $35,791,000). These balances are amounts lent to subsidiaries to satisfy short-term funding requirements.
The Company uses a similar approach for assessment of ECLs for these receivables to those used for debt
investments. Impairment on these balances has been measured on the lifetime ECL basis which reflects the low
credit risk of the exposures. The amount of the allowance on these balances is insignificant.
A N N U A L R E P O R T 2 0 1 8 291S E M B C O R P M A R I N E290

NOTES TO THE FINANCIAL STATEMENTSYear ended 31 December 2018
40. FINANCIAL INSTRUMENTS (CONT’D)
(c) Liquidity risk
The Group manages its liquidity risk with the view to maintaining a healthy level of cash and cash equivalents
appropriate to the operating environment and expected cash flows of the Group. Liquidity requirements
are maintained within the credit facilities established and are adequate and available to the Group to meet
its obligations. The Group will continue to take steps to manage cost, cash flows and gearing to address its
financial position. While the majority of contracts and new orders are secured on progressive payment terms,
future new orders may result in increased working capital needs.
The table below analyses the maturity profile of the Group’s and Company’s financial instruments (including
derivatives) based on contractual undiscounted cash inflows/(outflows), including estimated interest payments
and excluding the impact of netting agreements:
Cash flowsCarrying
amount
Contractual
cash flows
Less than
1 year
Between
1 and 5 years
Over
5 years$’000 $’000 $’000 $’000 $’000
Group31 December 2018Derivative financial liabilitiesInterest rate swaps (6,417) (5,807) (2,863) (2,944) –Forward foreign currency contracts (13,554)– Inflow 778,332 600,099 178,233 –– Outflow (791,886) (609,905) (181,981) –
Derivative financial assetsInterest rate swaps 334 251 251 – –Forward foreign currency contracts 12,188– Inflow 411,035 365,947 45,088 –– Outflow (398,847) (353,998) (44,849) –
Non-derivative financial liabilitiesTrade and other payables*# (1,501,589) (1,501,589) (1,501,589) – –Interest-bearing borrowings# (4,257,327) (4,566,897) (1,166,026) (3,004,567) (396,304)
(5,766,365) (6,075,408) (2,668,084) (3,011,020) (396,304)
31 December 2017Derivative financial liabilitiesInterest rate swaps (7,162) (6,913) (4,010) (2,903) –
Derivative financial assetsInterest rate swaps 456 715 468 247 –Forward foreign currency contracts 57,037– Inflow 981,195 453,762 527,433 –– Outflow (924,158) (421,339) (502,819) –
Non-derivative financial liabilitiesTrade and other payables*# (1,573,148) (1,619,627) (1,619,627) – –Interest-bearing borrowings# (4,128,911) (4,426,787) (1,137,663) (2,880,273) (408,851)
(5,651,728) (5,995,575) (2,728,409) (2,858,315) (408,851)
A N N U A L R E P O R T 2 0 1 8 291S E M B C O R P M A R I N E290

NOTES TO THE FINANCIAL STATEMENTSYear ended 31 December 2018
40. FINANCIAL INSTRUMENTS (CONT’D)
(c) Liquidity risk (cont’d)
Cash flowsCarrying
amount
Contractual
cash flows
Less than
1 year
Between
1 and 5 years
Over
5 years$’000 $’000 $’000 $’000 $’000
Group1 January 2017Derivative financial liabilitiesInterest rate swaps (3,092) (2,498) (3,237) 739 –Forward foreign currency contracts (41,622)– Inflow 1,132,401 318,093 814,308 –– Outflow (1,174,023) (336,410) (837,613) –
Derivative financial assetsInterest rate swaps 2,025 466 216 250 –Forward foreign currency contracts 58,503– Inflow 688,228 521,530 166,698 –– Outflow (629,725) (475,541) (154,184) –
Non-derivative financial liabilitiesTrade and other payables*# (1,837,580) (2,137,104) (2,137,104) – – Interest-bearing borrowings# (4,188,924) (4,504,950) (1,465,426) (2,618,161) (421,363)
(6,010,690) (6,627,205) (3,577,879) (2,627,963) (421,363)
* Excludes deposits received, advance payment from customers, Goods and Services Tax, deferred grants, accrued land lease and long-term employee benefits.
# The carrying amount of trade and other payables excludes finance costs payable while the interest-bearing borrowings include finance costs payable, for the purposes of presentation of this liquidity table.
Cash flowsCarrying
amount
Contractual
cash flows
Less than
1 year
Between
1 and 5 years
Over
5 years$’000 $’000 $’000 $’000 $’000
Company31 December 2018Non-derivative financial liabilitiesTrade and other payables*# (24,494) (24,494) (24,494) – –Interest-bearing borrowings# (51,620) (52,332) (51,309) (1,023) –
(76,114) (76,826) (75,803) (1,023) –
31 December 2017Non-derivative financial liabilitiesTrade and other payables* (26,385) (26,385) (26,385) – –Interest-bearing borrowings (1,868) (1,868) (474) (1,394) –
(28,253) (28,253) (26,859) (1,394) –
1 January 2017Non-derivative financial liabilitiesTrade and other payables* (23,864) (23,864) (23,864) – –
* Excludes deposits received, Goods and Services Tax and long-term employee benefits.
# The carrying amount of trade and other payables excludes finance costs payable while the interest-bearing borrowings include finance costs payable, for the purposes of presentation of this liquidity table.
A N N U A L R E P O R T 2 0 1 8 293S E M B C O R P M A R I N E292

NOTES TO THE FINANCIAL STATEMENTSYear ended 31 December 2018
40. FINANCIAL INSTRUMENTS (CONT’D)
(c) Liquidity risk (cont’d)
The following table indicates the periods in which the cash flow associated with derivatives that are cash flow
hedges are expected to impact profit or loss and the fair value of the related hedging instruments:
Cash flowsCarrying
amount
Contractual
cash flows
Less than
1 year
Between
1 and 5 years$’000 $’000 $’000 $’000
Group31 December 2018Derivative financial liabilitiesInterest rate swaps (6,417) (5,807) (2,863) (2,944)Forward foreign currency contracts (13,554)– Inflow 778,332 600,099 178,233– Outflow (791,886) (609,905) (181,981)
Derivative financial assetsInterest rate swaps 334 251 251 –Forward foreign currency contracts 12,188– Inflow 411,035 365,947 45,088– Outflow (398,847) (353,998) (44,849)
(7,449) (6,922) (469) (6,453)
31 December 2017Derivative financial liabilitiesInterest rate swaps (7,162) (6,913) (4,010) (2,903)
Derivative financial assetsInterest rate swaps 456 715 468 247Forward foreign currency contracts 57,037– Inflow 981,195 453,762 527,433– Outflow (924,158) (421,339) (502,819)
50,331 50,839 28,881 21,958
1 January 2017Derivative financial liabilitiesInterest rate swaps (3,092) (2,498) (3,237) 739Forward foreign currency contracts (30,027)– Inflow 1,055,509 241,201 814,308– Outflow (1,085,536) (247,923) (837,613)
Derivative financial assetsInterest rate swaps 2,025 466 216 250Forward foreign currency contracts 39,674– Inflow 506,151 339,453 166,698– Outflow (466,477) (312,293) (154,184)
8,580 7,615 17,417 (9,802)
A N N U A L R E P O R T 2 0 1 8 293S E M B C O R P M A R I N E292

NOTES TO THE FINANCIAL STATEMENTSYear ended 31 December 2018
40. FINANCIAL INSTRUMENTS (CONT’D)
(d) Estimation of fair values
SFRS(I) 7 establishes a fair value hierarchy that prioritises the inputs used to measure fair value. The three levels
of the fair value input hierarchy defined by SFRS(I) 7 are as follows:
• Level 1 – Fair values are measured based on quoted prices (unadjusted) from active markets for
identical financial instruments.
• Level 2 – Fair values are measured using inputs, other than those used for Level 1, that are
observable for the financial instruments either directly (prices) or indirectly (derived
from prices).
• Level 3 – Fair values are measured using inputs which are not based on observable market data
(unobservable input).
Securities
The fair value of financial assets at fair value through profit or loss, and fair value through other comprehensive
income, is based on quoted market prices (bid price) in an active market at the balance sheet date without
any deduction for transaction costs. If the market for a quoted financial asset is not active, and for unquoted
financial assets, the Group establishes fair value by using other valuation techniques.
Derivatives
The fair value of forward exchange contracts is accounted for based on the difference between the contractual
price and the current market price.
The fair value of interest rate swaps is the indicative amount that the Group is expected to receive or pay to
terminate the swap with the swap counterparties at the balance sheet date.
Non-derivative non-current financial assets and liabilities
Fair values determined for non-derivative non-current financial assets and liabilities are calculated based on
discounted expected future principal and interest cash flows at the market rate of interest at the reporting date.
This includes determination for fair value disclosure purpose as well.
Other financial assets and liabilities
The carrying amounts of financial assets and liabilities with a maturity of less than one year (including trade
and other receivables, cash and cash equivalents, and trade and other payables) are assumed to approximate
their fair values because of the short period to maturity. All other financial assets and liabilities are discounted
to determine their fair values.
For financial instruments that are not actively traded in the market, the fair value is determined by independent
third party or using valuation techniques where applicable. The Group may use a variety of methods and make
assumptions that are based on existing market conditions at each balance sheet date. Quoted market prices or
dealer quotes for similar instruments are used to estimate the fair value for medium term notes for disclosure
purpose. Other techniques, such as estimated discounted cash flows, are used to determine the fair value for
the remaining financial instruments. Where discounted cash flow techniques are used, the management will
estimate the future cash flows and use relevant market rate as the discount rate at the balance sheet date.
A N N U A L R E P O R T 2 0 1 8 295S E M B C O R P M A R I N E294

NOTES TO THE FINANCIAL STATEMENTSYear ended 31 December 2018
40. FINANCIAL INSTRUMENTS (CONT’D)
(d) Estimation of fair values (cont’d)
Non-current amount due from related parties
Fair values are calculated based on discounted expected future principal and interest cash flows at the market
rate of interest at the reporting date.
Fair value hierarchy
The following table sets forth by level within the fair value hierarchy of the financial assets and liabilities that were
accounted for at fair value on a recurring basis as of 31 December 2018. These financial assets and liabilities are
classified in their entirety based on the lowest level of input that is significant to the fair value measurement. The
assessment of the significance of a particular input to the fair value measurement requires judgement, and may
affect the valuation of assets and liabilities and their placement within the fair value hierarchy levels.
Financial assets and liabilities carried at fair value
Fair value measurement using:Level 1 Level 2 Level 3 Total
$’000 $’000 $’000 $’000
GroupAt 31 December 2018Financial assets at fair value through other
comprehensive income
– Unquoted equity shares – – 2,642 2,642Derivative financial assets – 12,522 – 12,522Derivative financial liabilities – (19,971) – (19,971)Total – (7,449) 2,642 (4,807)
At 31 December 2017Available-for-sale financial assets 18,200 694 – 18,894Derivative financial assets – 58,185 – 58,185
18,200 58,879 – 77,079Derivative financial liabilities – (7,162) – (7,162)Total 18,200 51,717 – 69,917
At 1 January 2017Available-for-sale financial assets 51,667 537 – 52,204Derivative financial assets – 64,674 – 64,674
51,667 65,211 – 116,878Derivative financial liabilities – (44,714) – (44,714)Total 51,667 20,497 – 72,164
Company At 31 December 2017Available-for-sale financial assets 18,200 694 – 18,894
At 1 January 2017Available-for-sale financial assets 40,075 537 – 40,612
In 2018 and 2017, there were no transfers between the different levels of the fair value hierarchy.
A N N U A L R E P O R T 2 0 1 8 295S E M B C O R P M A R I N E294
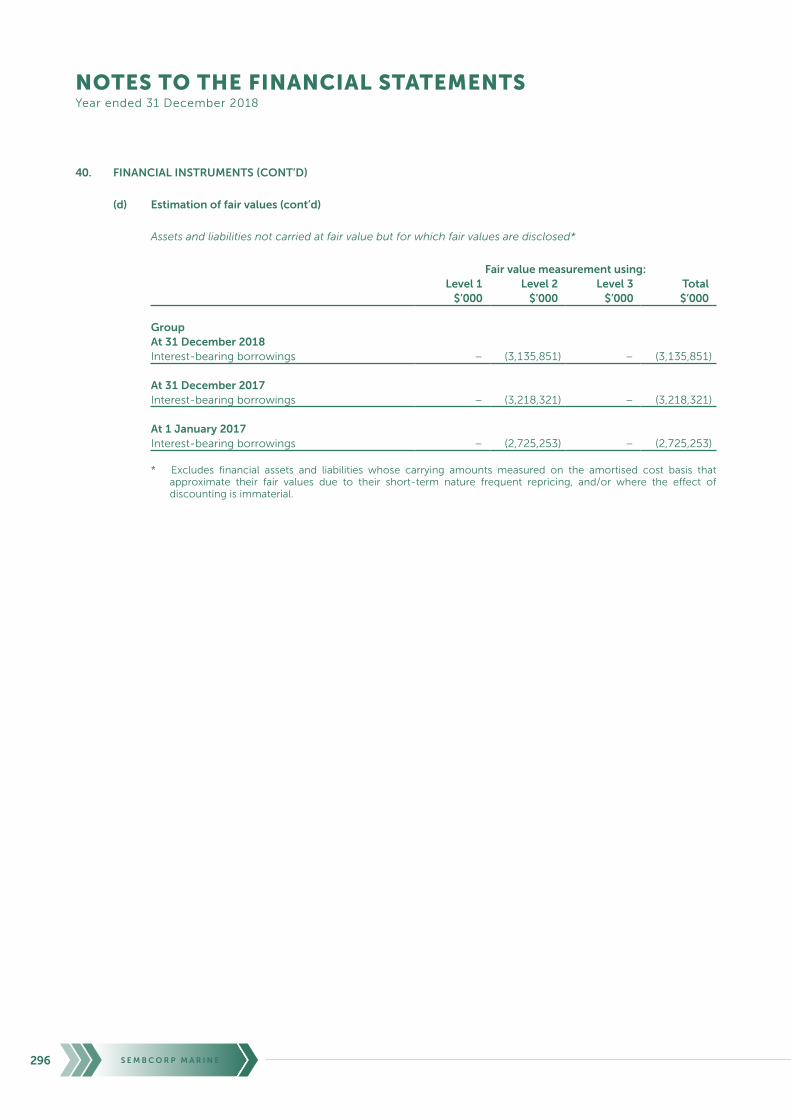
NOTES TO THE FINANCIAL STATEMENTSYear ended 31 December 2018
40. FINANCIAL INSTRUMENTS (CONT’D)
(d) Estimation of fair values (cont’d)
Assets and liabilities not carried at fair value but for which fair values are disclosed*
Fair value measurement using:Level 1 Level 2 Level 3 Total
$’000 $’000 $’000 $’000
GroupAt 31 December 2018Interest-bearing borrowings – (3,135,851) – (3,135,851)
At 31 December 2017Interest-bearing borrowings – (3,218,321) – (3,218,321)
At 1 January 2017Interest-bearing borrowings – (2,725,253) – (2,725,253)
* Excludes financial assets and liabilities whose carrying amounts measured on the amortised cost basis that approximate their fair values due to their short-term nature frequent repricing, and/or where the effect of discounting is immaterial.
A N N U A L R E P O R T 2 0 1 8 297S E M B C O R P M A R I N E296

NOTES TO THE FINANCIAL STATEMENTSYear ended 31 December 2018
40
. FI
NA
NC
IAL
INST
RU
ME
NT
S (C
ON
T’D
)
(e)
Fair
val
ue
vers
us
carr
yin
g a
mo
un
ts
Th
e f
air
valu
es
of
fin
anc
ial a
sse
ts a
nd
liab
iliti
es,
to
ge
the
r w
ith
th
e c
arry
ing
am
ou
nts
sh
ow
n in
th
e b
alan
ce
sh
ee
ts a
re a
s fo
llow
s:
No
te
Man
dat
ori
ly
at F
VT
PL
Fair
val
ue
– h
edg
ing
inst
rum
ents
FVO
CI –
Un
qu
ote
d
equ
ity
shar
es
Fin
anci
al
asse
ts a
t
amo
rtis
ed
cost
Oth
er
fin
anci
al
liab
iliti
es
Tota
l
carr
yin
g
amo
un
tFa
ir v
alu
e$
’00
0$
’00
0$
’00
0$
’00
0$
’00
0$
’00
0$
’00
0
Gro
up
At
31
Dec
emb
er 2
01
8C
ash
an
d c
ash
eq
uiv
ale
nts
17
––
–8
37
,72
4–
83
7,7
24
83
7,7
24
Trad
e a
nd
oth
er
rec
eiv
able
s*9
––
–1
,76
2,4
15
–1
,76
2,4
15
1,7
62
,41
5Fi
nan
cia
l ass
ets
at
fair
val
ue
th
rou
gh
oth
er
co
mp
reh
en
sive
inc
om
e
– U
nq
uo
ted
eq
uit
y sh
are
s8
(a)
––
2,6
42
––
2,6
42
2,6
42
Cas
h f
low
he
dg
es
– F
orw
ard
fo
reig
n
cu
rre
nc
y c
on
trac
ts8
(a)&
(b)
–1
2,1
88
––
–1
2,1
88
12
,18
8–
In
tere
st r
ate
sw
aps
8(b
)–
33
4–
––
33
43
34
–1
2,5
22
2,6
42
2,6
00
,13
9–
2,6
15
,30
32
,61
5,3
03
Trad
e a
nd
oth
er
pay
able
s**
18
––
––
1,5
29
,48
61
,52
9,4
86
1,5
29
,48
6C
ash
flo
w h
ed
ge
s–
Fo
rwar
d f
ore
ign
cu
rre
nc
y c
on
trac
ts2
2(a
)&(b
)–
13
,55
4–
––
13
,55
41
3,5
54
– I
nte
rest
rat
e s
wap
s2
2(a
)&(b
)–
6,4
17
––
–6
,41
76
,41
7In
tere
st-b
ear
ing
bo
rro
win
gs
– S
ho
rt-t
erm
bo
rro
win
gs
23
––
––
1,0
55
,97
91
,05
5,9
79
1,0
55
,97
9–
Lo
ng
-te
rm b
orr
ow
ing
s2
3–
––
–3
,17
3,4
51
3,1
73
,45
13
,13
5,8
51
–1
9,9
71
––
5,7
58
,91
65
,77
8,8
87
5,7
41
,28
7
* E
xclu
des
Go
od
s an
d S
ervi
ces
Tax.
**
Exc
lud
es d
epo
sits
rec
eive
d, a
dva
nce
pay
men
t fr
om
cu
sto
mer
s, G
oo
ds
and
Ser
vice
s Ta
x, d
efer
red
gra
nts
, acc
rued
lan
d le
ase
and
lon
g-t
erm
em
plo
yee
ben
efit
s.
A N N U A L R E P O R T 2 0 1 8 297S E M B C O R P M A R I N E296

NOTES TO THE FINANCIAL STATEMENTSYear ended 31 December 2018
40
. FI
NA
NC
IAL
INST
RU
ME
NT
S (C
ON
T’D
)
(e)
Fair
val
ue
vers
us
carr
yin
g a
mo
un
ts (c
on
t’d
)
No
te
Des
ign
ated
at f
air
valu
e
Fair
val
ue
– h
edg
ing
inst
rum
ents
Ava
ilab
le-
for-
sale
Loan
s an
d
rece
ivab
les
Oth
er
fin
anci
al
liab
iliti
es
wit
hin
th
e
sco
pe
of
FRS
39
Tota
l
carr
yin
g
amo
un
tFa
ir v
alu
e$
’00
0$
’00
0$
’00
0$
’00
0$
’00
0$
’00
0$
’00
0
Gro
up
At
31
Dec
emb
er 2
01
7C
ash
an
d c
ash
eq
uiv
ale
nts
17
––
–1
,30
1,0
00
–1
,30
1,0
00
1,3
01
,00
0Tr
ade
an
d o
the
r re
ce
ivab
les*
9–
––
64
9,6
08
–6
49
,60
86
49
,60
8A
vaila
ble
-fo
r-sa
le f
inan
cia
l ass
ets
– E
qu
ity
shar
es
8(a
)–
–1
8,2
00
––
18
,20
01
8,2
00
– U
nit
tru
sts
8(a
)–
–6
94
––
69
46
94
Fair
val
ue
he
dg
es
– F
irm
co
mm
itm
en
ts8
(b)
––
–6
92
–6
92
69
2C
ash
flo
w h
ed
ge
s–
Fo
rwar
d f
ore
ign
cu
rre
nc
y c
on
trac
ts8
(a)&
(b)
–5
7,0
37
––
–5
7,0
37
57
,03
7–
In
tere
st r
ate
sw
aps
8(b
)–
45
6–
––
45
64
56
–5
7,4
93
18
,89
41
,95
1,3
00
–2
,02
7,6
87
2,0
27
,68
7
Trad
e a
nd
oth
er
pay
able
s**
18
––
––
1,6
01
,93
61
,60
1,9
36
1,6
01
,93
6C
ash
flo
w h
ed
ge
s–
In
tere
st r
ate
sw
aps
22
(a)&
(b)
–7
,16
2–
––
7,1
62
7,1
62
Inte
rest
-be
arin
g b
orr
ow
ing
s–
Sh
ort
-te
rm b
orr
ow
ing
s2
3–
––
–8
52
,73
78
52
,73
78
52
,73
7–
Lo
ng
-te
rm b
orr
ow
ing
s2
3–
––
–3
,24
7,3
86
3,2
47
,38
63
,21
8,3
21
–7
,16
2–
–5
,70
2,0
59
5,7
09
,22
15
,68
0,1
56
* E
xclu
des
Go
od
s an
d S
ervi
ces
Tax.
**
Exc
lud
es d
epo
sits
rec
eive
d, a
dva
nce
pay
men
t fr
om
cu
sto
mer
s, G
oo
ds
and
Ser
vice
s Ta
x, d
efer
red
gra
nts
, acc
rued
lan
d le
ase
and
lon
g-t
erm
em
plo
yee
ben
efit
s.
A N N U A L R E P O R T 2 0 1 8 299S E M B C O R P M A R I N E298
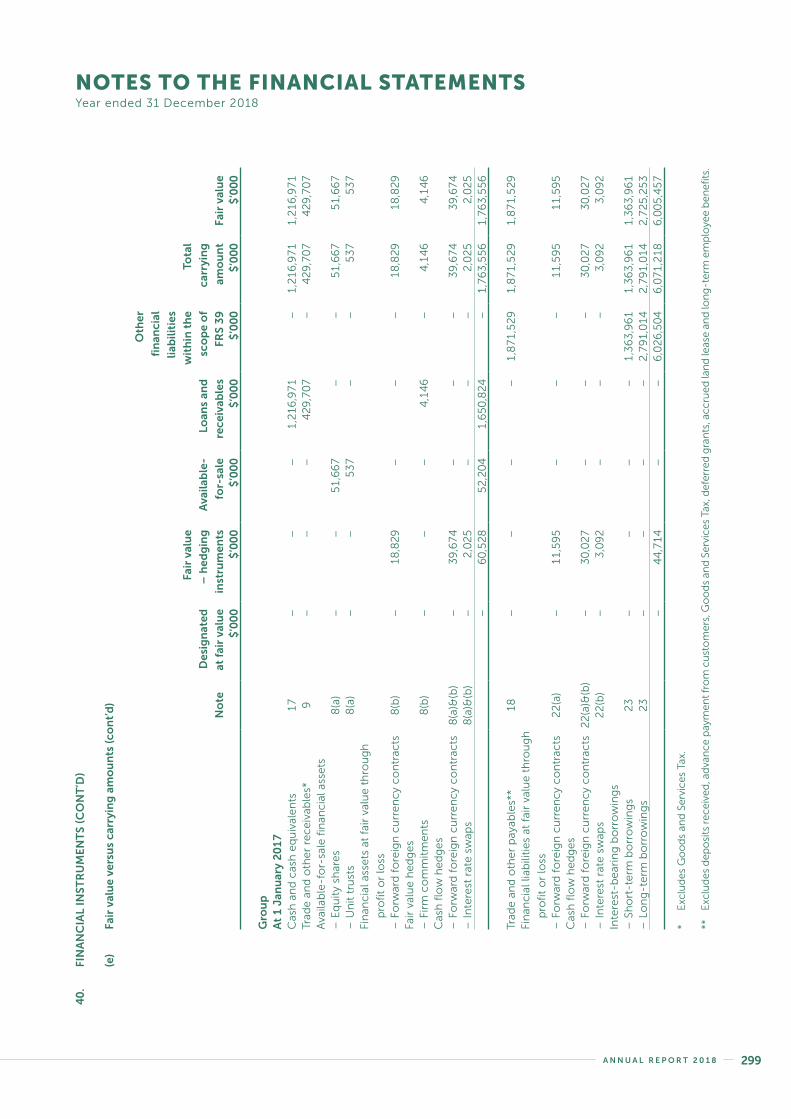
NOTES TO THE FINANCIAL STATEMENTSYear ended 31 December 2018
40
. FI
NA
NC
IAL
INST
RU
ME
NT
S (C
ON
T’D
)
(e)
Fair
val
ue
vers
us
carr
yin
g a
mo
un
ts (c
on
t’d
)
No
te
Des
ign
ated
at f
air
valu
e
Fair
val
ue
– h
edg
ing
inst
rum
ents
Ava
ilab
le-
for-
sale
Loan
s an
d
rece
ivab
les
Oth
er
fin
anci
al
liab
iliti
es
wit
hin
th
e
sco
pe
of
FRS
39
Tota
l
carr
yin
g
amo
un
tFa
ir v
alu
e$
’00
0$
’00
0$
’00
0$
’00
0$
’00
0$
’00
0$
’00
0
Gro
up
At
1 J
anu
ary
20
17
Cas
h a
nd
cas
h e
qu
ival
en
ts1
7–
––
1,2
16
,97
1–
1,2
16
,97
11
,21
6,9
71
Trad
e a
nd
oth
er
rec
eiv
able
s*9
––
–4
29
,70
7–
42
9,7
07
42
9,7
07
Ava
ilab
le-f
or-
sale
fin
anc
ial a
sse
ts–
Eq
uit
y sh
are
s8
(a)
––
51
,66
7–
–5
1,6
67
51
,66
7–
Un
it t
rust
s8
(a)
––
53
7–
–5
37
53
7Fi
nan
cia
l ass
ets
at
fair
val
ue
th
rou
gh
pro
fit
or
loss
–
Fo
rwar
d f
ore
ign
cu
rre
nc
y c
on
trac
ts8
(b)
–1
8,8
29
––
–1
8,8
29
18
,82
9Fa
ir v
alu
e h
ed
ge
s–
Fir
m c
om
mit
me
nts
8(b
)–
––
4,1
46
–4
,14
64
,14
6C
ash
flo
w h
ed
ge
s–
Fo
rwar
d f
ore
ign
cu
rre
nc
y c
on
trac
ts8
(a)&
(b)
–3
9,6
74
––
–3
9,6
74
39
,67
4–
In
tere
st r
ate
sw
aps
8(a
)&(b
)–
2,0
25
––
–2
,02
52
,02
5–
60
,52
85
2,2
04
1,6
50
,82
4–
1,7
63
,55
61
,76
3,5
56
Trad
e a
nd
oth
er
pay
able
s**
18
––
––
1,8
71
,52
91
,87
1,5
29
1,8
71
,52
9Fi
nan
cia
l lia
bili
tie
s at
fai
r va
lue
th
rou
gh
pro
fit
or
loss
–
Fo
rwar
d f
ore
ign
cu
rre
nc
y c
on
trac
ts2
2(a
)–
11
,59
5–
––
11
,59
51
1,5
95
Cas
h f
low
he
dg
es
– F
orw
ard
fo
reig
n c
urr
en
cy
co
ntr
acts
22
(a)&
(b)
–3
0,0
27
––
–3
0,0
27
30
,02
7–
In
tere
st r
ate
sw
aps
22
(b)
–3
,09
2–
––
3,0
92
3,0
92
Inte
rest
-be
arin
g b
orr
ow
ing
s–
Sh
ort
-te
rm b
orr
ow
ing
s2
3–
––
–1
,36
3,9
61
1,3
63
,96
11
,36
3,9
61
– L
on
g-t
erm
bo
rro
win
gs
23
––
––
2,7
91
,01
42
,79
1,0
14
2,7
25
,25
3–
44
,71
4–
–6
,02
6,5
04
6,0
71
,21
86
,00
5,4
57
* E
xclu
des
Go
od
s an
d S
ervi
ces
Tax.
**
Exc
lud
es d
epo
sits
rec
eive
d, a
dva
nce
pay
men
t fr
om
cu
sto
mer
s, G
oo
ds
and
Ser
vice
s Ta
x, d
efer
red
gra
nts
, acc
rued
lan
d le
ase
and
lon
g-t
erm
em
plo
yee
ben
efit
s.
A N N U A L R E P O R T 2 0 1 8 299S E M B C O R P M A R I N E298

NOTES TO THE FINANCIAL STATEMENTSYear ended 31 December 2018
40. FINANCIAL INSTRUMENTS (CONT’D)
(e) Fair value versus carrying amounts (cont’d)
Note
Financial
assets at
amortised
cost
Other
financial
liabilities
Total
carrying
amount
Fair
value$’000 $’000 $’000 $’000
CompanyAt 31 December 2018Cash and cash equivalents 17 79,584 – 79,584 79,584Trade and other receivables* 9 133,263 – 133,263 133,263
212,847 – 212,847 212,847
Trade and other payables** 18 – 24,680 24,680 24,680
Note
Available-
for-sale
Loans and
receivables
Other
financial
liabilities
within the
scope of
FRS 39
Total
carrying
amount
Fair
value$’000 $’000 $’000 $’000 $’000
At 31 December 2017Cash and cash equivalents 17 – 55,126 – 55,126 55,126Trade and other receivables* 9 – 145,777 – 145,777 145,777Available-for-sale financial assets– Equity shares 8(a) 18,200 – – 18,200 18,200– Unit trusts 8(a) 694 – – 694 694
18,894 200,903 – 219,797 219,797
Trade and other payables** 18 – – 26,385 26,385 26,385
At 1 January 2017Cash and cash equivalents 17 – 24,482 – 24,482 24,482Trade and other receivables* 9 – 94,846 – 94,846 94,846Available-for-sale financial assets– Equity shares 8(a) 40,075 – – 40,075 40,075– Unit trusts 8(a) 537 – – 537 537
40,612 119,328 – 159,940 159,940
Trade and other payables** 18 – – 23,864 23,864 23,864
* Excludes Goods and Services Tax.
** Excludes deposits received, Goods and Services Tax and long-term employee benefits.
A N N U A L R E P O R T 2 0 1 8 301S E M B C O R P M A R I N E300

NOTES TO THE FINANCIAL STATEMENTSYear ended 31 December 2018
40. FINANCIAL INSTRUMENTS (CONT’D)
(f) Capital management
The Group aims to maintain a sound capital base so as to maintain investor, creditor and market confidence
and to sustain future development and growth of its businesses, while at the same time maintaining an
appropriate dividend policy to reward shareholders. The Group monitors Economic Value Added attributable
to shareholders, which the Group defines as net operating profit after tax less capital charge excluding non-
controlling interests. Management also monitors the level of dividends paid to ordinary shareholders.
The Group seeks to maintain a balance between the higher returns that might be possible with higher levels
of borrowings and the advantages and security afforded by a sound capital position. Capital is defined as
equity attributable to the equity holders. The Group’s debt to capitalisation ratio as at the balance sheet date
was as follows:
Group31 December
2018
31 December
2017
1 January
2017$’000 $’000 $’000
Debt 4,229,430 4,100,123 4,154,975Total equity 2,348,435 2,480,175 2,311,156Total debt and equity 6,577,865 6,580,298 6,466,131
Debt-to-capitalisation ratio 0.64 0.62 0.64
There were no changes in the Group’s approach to capital management during the year.
The Group is required to maintain consolidated net borrowings to consolidated net assets (less dividends,
goodwill and other intangible assets) ratio of not more than 1.75. This externally imposed capital requirement
has been complied with at each quarter in the financial year ended 31 December 2018.
A N N U A L R E P O R T 2 0 1 8 301S E M B C O R P M A R I N E300

NOTES TO THE FINANCIAL STATEMENTSYear ended 31 December 2018
41. CONTINGENT LIABILITIES
The Group is subject to various litigation, regulatory and arbitration matters in the normal course of business. The Group rigorously defends against the claims and, in the opinion of management, the resolution of these matters will not have a material effect on the financial position of the Group.
Corporate guarantees
Company2018 2017$’000 $’000
Unsecured corporate guarantees granted in respect of:– Performance of subsidiaries 4,996,361 3,692,999– Unsecured term loans by subsidiaries 861,650 650,000– Unsecured short term loans by a subsidiary – 82,533– Unsecured revolving credit facilities by subsidiaries 1,930,176 1,483,755– Unsecured bonds issued by a subsidiary 600,000 600,000
The Company has provided guarantees to banks to secure banking facilities provided to wholly-owned subsidiaries,
Jurong Shipyard Pte Ltd and Estaleiro Jurong Aracruz Ltda. These financial guarantee contracts are accounted for as
insurance contracts.
The principal risk to which the Company is exposed is credit risk in connection with guarantee contracts it has issued.
The credit risk represents the loss that would be recognised upon a default by the parties to which the guarantees were
given on behalf of. To mitigate these risks, management continually monitors the risks and has established processes
including performing credit evaluations of the parties it is providing the guarantee on behalf of.
There are no terms and conditions attached to the guarantee contracts that would have a material effect on the
amount, timing and uncertainty of the Company’s future cash flows.
Estimates of the Company’s obligation arising from financial guarantee contracts may be affected by future events,
which cannot be predicted with any certainty. The assumptions made may well vary from actual experience so that
the actual liability may vary considerably from the best estimates. As of balance sheet date, there is no provision made
in respect of the obligations as the Company believes it is remote that these corporate guarantees will be called upon.
A N N U A L R E P O R T 2 0 1 8 303S E M B C O R P M A R I N E302

NOTES TO THE FINANCIAL STATEMENTSYear ended 31 December 2018
42. COMMITMENTS
Commitments not provided for in the financial statements are as follows:
Group Company2018 2017 2018 2017$’000 $’000 $’000 $’000
(a) Approved capital commitment:– Approved capital expenditure commitment 265,704 53,248 – –
(b) Minimum lease rental payable in respect of land
and buildings: – Within 1 year 18,093 17,994 10,625 10,622– After 1 year but within 5 years 36,270 49,520 24,978 38,326– After 5 years 465,523 340,658 48,587 46,934
519,886 408,172 84,190 95,882
The leases do not provide for contingent rents and lease terms do not contain restrictions on the Group activities
concerning dividends, additional debt or further leasing. Certain leases contain escalation clauses to reflect market rentals.
Certain leases include renewal options for additional lease period of 10 to 30 years and at rental rates based on
prevailing market rates.
The Group leases out its marine vessel. Up till the termination of lease in November 2018, the marine vessel had been
on long term charter hire under an agreement with initial lease term of 5 years, and an option to extend for another 5
years. The future minimum lease receivable under non-cancellable lease is as follows:
Group2018 2017$’000 $’000
Within 1 year – 38,933
43. OPERATING SEGMENTS
(a) Business segments
The Group has two reportable segments, which are the Group’s strategic business units. The strategic business
units are managed separately because of their different business activities. The two reportable segments are:
(i) rigs & floaters, repairs & upgrades, offshore platforms and specialised shipbuilding; and (ii) ship chartering.
The accounting policies are described in Note 3. Inter-segment sales and transfers are carried out on an arm’s
length basis. Segment assets consist primarily of property, plant and equipment, intangible assets, current assets
and exclude inter-segment balances. Segment liabilities comprise mainly operating liabilities and exclude inter-
segment balances. Performance is measured based on segment profit before tax, as included in the internal
management reports that are reviewed by the Group’s President & CEO. Segment profit is used to measure
performance as management believes that such information is the most relevant in evaluating the results of
certain segments relative to other entities that operate within these industries.
Other operations include bulk trading in marine engineering related products; provision of harbour tug services
to port users; collection and treatment of used copper slag, and the processing and distribution of copper slag
for blast cleaning purposes.
A N N U A L R E P O R T 2 0 1 8 303S E M B C O R P M A R I N E302

NOTES TO THE FINANCIAL STATEMENTSYear ended 31 December 2018
43. OPERATING SEGMENTS (CONT’D)
(a) Business segments (cont’d)
Rigs &
floaters,
Repairs &
upgrades,
Offshore
platforms and
Specialised
shipbuilding
Ship
chartering Others Eliminations Total$’000 $’000 $’000 $’000 $’000
31 December 2018TurnoverSales to external parties 4,831,789 47,873 8,204 – 4,887,866Inter-segment sales – – 210,133 (210,133) –Total 4,831,789 47,873 218,337 (210,133) 4,887,866
ResultsSegment results (49,395) (2,673) (255) – (52,323)Finance income 54,838 – 188 – 55,026Finance costs (99,470) (1,836) (50) – (101,356)Non-operating income – – 141 – 141Share of results of associates
and joint ventures, net of tax (927) (2,643) 1,185 – (2,385)(Loss)/profit before tax (94,954) (7,152) 1,209 – (100,897)Tax credit/(expense) 22,837 – (306) – 22,531(Loss)/profit for the year (72,117) (7,152) 903 – (78,366)
AssetsSegment assets 7,844,064 250,736 382,137 – 8,476,937Investments in associates
and joint ventures 4,581 51,068 10,884 – 66,533Deferred tax assets 22,597 – 626 – 23,223Tax recoverable 10,099 – 469 – 10,568Total assets 7,881,341 301,804 394,116 – 8,577,261
LiabilitiesSegment liabilities 5,899,865 70,049 198,513 – 6,168,427Deferred tax liabilities 52,724 – 84 – 52,808Current tax payable 6,329 – 1,262 – 7,591Total liabilities 5,958,918 70,049 199,859 – 6,228,826
Capital expenditure 342,216 – 25 – 342,241
A N N U A L R E P O R T 2 0 1 8 305S E M B C O R P M A R I N E304

NOTES TO THE FINANCIAL STATEMENTSYear ended 31 December 2018
43. OPERATING SEGMENTS (CONT’D)
(a) Business segments (cont’d)
Rigs &
floaters,
Repairs &
upgrades,
Offshore
platforms and
Specialised
shipbuilding
Ship
chartering Others Eliminations Total$’000 $’000 $’000 $’000 $’000
31 December 2018Significant non-cash itemsDepreciation and amortisation 181,218 13,579 649 – 195,446Fair value adjustment on
hedging instruments 1,713 – – – 1,713Fair value adjustment on firm
commitments under fair value hedge 692 – – – 692Impairment losses on property,
plant and equipment – 4,663 – – 4,663Property, plant and equipment written off 58 – – – 58Inventories written
down/(written back), net 447 – (15) – 432Allowance for doubtful debts
and bad debts, net 2,673 – – – 2,673Net change in fair value of financial assets
measured through profit or loss – – (114) – (114)Gain on disposal of other financial assets – – (27) – (27)
31 December 2017TurnoverSales to external parties 2,967,085 57,437 10,245 – 3,034,767Inter-segment sales – – 88,381 (88,381) –Total 2,967,085 57,437 98,626 (88,381) 3,034,767
ResultsSegment results 294,512 13,230 (2,032) – 305,710Finance income 22,657 – 150 – 22,807Finance costs (93,473) (2,049) – – (95,522)Non-operating income – – 64,803 – 64,803Non-operating expenses – – (13,309) – (13,309)Share of results of associates
and joint ventures, net of tax (914) (3,669) 966 – (3,617)Profit before tax 222,782 7,512 50,578 – 280,872Tax (expense)/credit (25,136) – 319 – (24,817)Profit for the year 197,646 7,512 50,897 – 256,055
AssetsSegment assets 9,280,800 246,025 71,924 – 9,598,749Investments in associates
and joint ventures 5,181 53,085 9,699 – 67,965Deferred tax assets 13,293 – 626 – 13,919Tax recoverable 11,192 – – – 11,192Total assets 9,310,466 299,110 82,249 – 9,691,825
A N N U A L R E P O R T 2 0 1 8 305S E M B C O R P M A R I N E304

NOTES TO THE FINANCIAL STATEMENTSYear ended 31 December 2018
43. OPERATING SEGMENTS (CONT’D)
(a) Business segments (cont’d)
Rigs &
floaters,
Repairs &
upgrades,
Offshore
platforms and
Specialised
shipbuilding
Ship
chartering Others Eliminations Total$’000 $’000 $’000 $’000 $’000
31 December 2017LiabilitiesSegment liabilities 7,017,542 81,551 26,144 – 7,125,237Deferred tax liabilities 61,390 – 155 – 61,545Current tax payable 24,335 – 533 – 24,868Total liabilities 7,103,267 81,551 26,832 – 7,211,650
Capital expenditure 193,295 – 160 – 193,455
Significant non-cash itemsDepreciation and amortisation 182,627 9,230 1,059 – 192,916Gain on disposal of assets held for sale – – (46,816) – (46,816)Gain on disposal of subsidiaries, net – – (753) – (753)Gain on disposal of available-for-sale
financial asset – – (17,200) – (17,200)Assumption of liabilities on
behalf of a joint venture – – 11,000 – 11,000Fair value adjustment on
hedging instruments (1,623) – – – (1,623)Fair value adjustment on firm
commitments under fair value hedge 3,454 – – – 3,454Property, plant and equipment written off 470 – 30 – 500Impairment losses on available-for-sale
financial assets – – 2,275 – 2,275Inventories written down, net 56 – – – 56Contract costs written back, net (19,678) – – – (19,678)Allowance for doubtful debts
and bad debts, net 148 – 19 – 167
A N N U A L R E P O R T 2 0 1 8 307S E M B C O R P M A R I N E306

NOTES TO THE FINANCIAL STATEMENTSYear ended 31 December 2018
43. OPERATING SEGMENTS (CONT’D)
(b) Geographical segments
The Group operates in 12 (2017: 12; 1 January 2017: 12) countries and principally in the Republic of Singapore.
Pricing of inter-segment sales and transfers are carried out on an arm’s length basis.
In presenting information on the basis of geographical segments, segment revenue is based on the geographical
location of customers. Segment assets are based on the geographical location of the assets.
Turnover
from external
customers
Non-current
assets(1) Total assets
Capital
expenditure$’000 $’000 $’000 $’000
31 December 2018Singapore 153,579 3,587,067 6,279,436 250,316Japan 339,829 – – –Rest of Asia, Australia & India 84,113 145,318 177,109 3,002Middle East & Africa 10,575 – – –United Kingdom 195,484 4,224 5,351 52Norway 1,627,871 136,607 147,491 30France 488,606 59 2,048 25The Netherlands 397,514 196,465 251,296 –Rest of Europe 73,749 56 742 27Brazil 243,344 1,520,998 1,711,554 88,776U.S.A. 1,183,777 54 2,234 13Other countries 89,425 – – –Total 4,887,866 5,590,848 8,577,261 342,241
31 December 2017Singapore 272,538 2,588,497 7,485,554 94,694Rest of Asia, Australia & India 202,756 153,441 228,378 1,779Middle East & Africa 65,706 – – –United Kingdom 744,792 5,121 8,525 727Norway 242,214 147,865 153,172 –The Netherlands 591,513 207,575 246,058 –Rest of Europe 284,118 89 2,330 38Brazil 213,192 1,432,718 1,562,241 96,213U.S.A. 177,005 4,018 5,567 4Other countries 240,933 – – –Total 3,034,767 4,539,324 9,691,825 193,455
(1) Non-current assets presented consist of property, plant and equipment, investments in associates and joint ventures, trade and other receivables, contract costs and intangible assets.
(c) Major customers
In 2018, turnover from two (2017: three) customers of the Group’s rigs & floaters, repairs & upgrades, offshore
platforms and specialised shipbuilding segment represents approximately 42 per cent (2017: 60 per cent) of the
Group’s total turnover.
A N N U A L R E P O R T 2 0 1 8 307S E M B C O R P M A R I N E306

NOTES TO THE FINANCIAL STATEMENTSYear ended 31 December 2018
44. SIGNIFICANT ACCOUNTING ESTIMATES AND JUDGEMENTS
Estimates, assumptions concerning the future and judgements are made in the preparation of the financial statements.
They affect the application of the Group’s accounting policies, reported amounts of assets, liabilities, income and
expenses, and disclosures made. They are assessed on an on-going basis and are based on experience and relevant
factors, including expectations of future events that are believed to be reasonable under the circumstances.
Key sources of estimation uncertainty
The key assumptions concerning the future and other key sources of estimation uncertainty at the balance sheet date,
that have a significant risk of causing a material adjustment to the carrying amounts of assets and liabilities within the
next financial year are discussed below.
Information on other significant areas of estimation uncertainty and critical judgements in applying accounting policies
that have the most significant effect on the amounts recognised in the financial statements are described in the
following notes:
(a) Impairment of goodwill
The Group determines whether goodwill is impaired at least on an annual basis. This requires an estimation
of the value in use of the cash generating units to which the goodwill is allocated. Estimating the value in use
requires the Group to make an estimate of the expected future cash flows from the cash generating unit and
also to choose a suitable discount rate in order to calculate the present value of those cash flows. Information
about the assumptions and their risk factors relating to goodwill impairment are disclosed in Note 44(d).
(b) Taxes
Current tax
The Group is subject to taxes in numerous jurisdictions. Significant judgement is involved in determining the
group-wide provision for taxes. In determining the amount of current and deferred taxes, the Group takes into
account the impact of uncertain tax positions and whether additional taxes and interest may be due.
There are certain transactions and computation for which the ultimate tax determination is uncertain during
the ordinary course of business. The Group recognises liabilities for expected tax issues based on estimates of
whether additional taxes will be due. The Group believes that its accruals for tax liabilities are adequate for all
open years based on its assessment of many factors, including interpretations of tax law and prior experience.
This assessment relies on estimates and assumptions and may involve a series of judgements about future
events. Where the final tax outcome of these matters is different from the amounts that were initially recorded,
such differences will impact the taxes and deferred tax provisions in the period in which such determination is
made. The tax expense is disclosed in Note 31.
Deferred tax assets
Certain subsidiaries of the Group have tax benefits arising from unutilised tax losses, tax credits and deductible
temporary differences, which are available for set-off against future taxable profits. Of these, the utilisation of
these tax benefits, for which deferred tax asset was recognised, is presumed on the Group’s ability to generate
taxable profits in the foreseeable future. This is, however, highly dependent on macroeconomic conditions
impacting the offshore and marine sector, expected movements and recovery of oil prices, and financial strength
of the Group’s customers, which would then significantly affect the realisability of these deferred tax assets.
A N N U A L R E P O R T 2 0 1 8 309S E M B C O R P M A R I N E308

NOTES TO THE FINANCIAL STATEMENTSYear ended 31 December 2018
44. SIGNIFICANT ACCOUNTING ESTIMATES AND JUDGEMENTS (CONT’D)
Key sources of estimation uncertainty (cont’d)
(c) Depreciation of property, plant and equipment
Property, plant and equipment are depreciated on a straight-line basis over their estimated useful lives.
Management estimates the useful lives of these property, plant and equipment to be within 1 to 60 years. The
carrying amounts of the Group’s property, plant and equipment are set out in Note 4. Changes in the expected
level of usage and technological developments could impact the economic useful lives and the residual values
of these assets; therefore future depreciation charges could be revised.
During the year, the Group revised its estimates of useful lives of certain assets at Tanjong Kling Yard. The effects
of the changes are presented in Note 4.
(d) Impairment assessment of property, plant and equipment, intangible assets and associates
Impairment assessment of the Group’s shipyards
Owing to the continuing difficult market conditions impacting the offshore and marine sector, there were
indications that the Group’s shipyards (the “cash generating units”) might be impaired. Under the Group’s formal
impairment assessment of the individual cash generating units in: (i) Singapore (yards in Singapore, together
with their sub-contracting yards in Indonesia and the United Kingdom); and (ii) Brazil, the recoverable amounts
for the Group’s individual cash generating units were determined using the value in use calculations.
The value in use calculation for the Group’s cash generating units used discounted cash flow projections
which took into account management’s assessment of the forecasted order book over a period of 5 years for
Singapore and Brazil (the “projection periods”), with applicable growth rates for Singapore and Brazil beyond
the projection periods (up to a maximum of 40 years). Key drivers supporting the recoverable amounts include:
forecasted order book, project margins which are projected with reference to historical experience, and
terminal growth rate of less than 5%.
The cash flows are projected based on the Group’s historical experience, market observable data surrounding
the state-owned and international oil majors’ capital commitment and projected capital expenditures in oil and
gas production and exploration activities, regulations relating to local content requirements in Brazil, market
expectations and developments for contract order prices, and other external analysts’ forecast reports in oil
price movements and demands for drilling and production solutions. These cash flows are then discounted
using the applicable discount rates based on their pre-tax weighted average cost of capital of 6.6% (2017: 9.5%)
and 12.46% (2017: 10.0%) for the Singapore cash generating unit and Brazil cash generating unit respectively;
and the Group assessed that no impairment loss is required for these individual cash generating units.
The forecasted order book and the forecasted margins assumed in the value in use calculation is, however,
subject to estimation uncertainties that may have a significant risk of resulting in material adjustments in any
future periods affected.
The estimation uncertainties of the forecasted order book of the Singapore cash generating unit is, however,
reduced by a certain level of order books already secured by the Group. Nevertheless, there are remaining
estimation uncertainties surrounding the remaining unsecured order book, and forecast project margins, that
may result in significant adjustments in the future periods.
A N N U A L R E P O R T 2 0 1 8 309S E M B C O R P M A R I N E308

NOTES TO THE FINANCIAL STATEMENTSYear ended 31 December 2018
44. SIGNIFICANT ACCOUNTING ESTIMATES AND JUDGEMENTS (CONT’D)
Key sources of estimation uncertainty (cont’d)
(d) Impairment assessment of property, plant and equipment, intangible assets and associates (cont’d)
Impairment assessment of the Group’s shipyards (cont’d)
Certain phases of the Brazil cash generating unit are presently undergoing yard construction and the yard
will gradually ramp up to its full operational capacity over the years. The Group has factored in the long-term
fundamentals of the oil and gas industry in Brazil in their forecast. Changes in the recoverable amount are
sensitive to impairment loss if the forecast order book and the forecasted margins beyond the near term were
to deviate significantly from the original forecast. The recoverable amount of the Brazil cash generating unit is
further subject to political risk and will be reviewed at regular intervals.
Changes to the assumptions used in relation to the above key drivers, such as delays and/or decrease in order
book, and reduction in project margins could lead to lower operating cash inflows and material impairment
outcomes, which might in turn affect the financial position and performance of the Group.
Impairment assessment of the Group’s associate
The recoverable amount of the interest in an associate was estimated based on its value in use. In estimating
the recoverable amount, the Group applied the relief from royalty method to value the existing intellectual
properties owned by the associate. As the associate is a start-up owning various intellectual properties at
different stages of their business life cycles, the discount rates applied by the Group range from 20% to 22%, to
reflect the higher risks inherent in the forecasted cash flows. Any significant changes to these forecasted cash
flows, caused by changes in the risk of returns of the intellectual properties may result in material adjustments
on the associate’s recoverable amounts in future periods.
(e) Provisions and contingent liabilities
Estimates of the Group’s obligations arising from contracts that exist as at balance sheet date may be affected
by future events, which cannot be predicted with any certainty. The assumptions and estimates are made based
on the management’s knowledge and experience and may vary from actual experience so that the actual
liability may vary considerably from the best estimates.
Warranty
The provision for warranty is based on estimates from known and expected warranty work and contractual
obligation for further work to be performed after completion. The warranty expense incurred could be higher
or lower than the provision made. Movements in provision for warranty are detailed in Note 21.
Site restoration costs
The provision for site restoration costs arising from operating leases is based on the best estimate of the costs to
be incurred beyond the 12 months period provided by external consultants. Given the complexities involved in
carrying out the restoration work on certain sites in the longer run, the actual costs may vary from the estimate.
Contingent liabilities
Where it is not probable that an outflow of economic benefits will be required, or the amount cannot be
estimated reliably, the obligation is disclosed as a contingent liability, unless the probability of outflow of
economic benefits is remote. Possible obligations, whose existence will only be confirmed by the occurrence
or non-occurrence of one or more future events are also disclosed as contingent liabilities unless the probability
of outflow of economic benefits is remote. Disclosure of contingent liabilities is detailed in Note 41.
A N N U A L R E P O R T 2 0 1 8 311S E M B C O R P M A R I N E310

NOTES TO THE FINANCIAL STATEMENTSYear ended 31 December 2018
44. SIGNIFICANT ACCOUNTING ESTIMATES AND JUDGEMENTS (CONT’D)
Key sources of estimation uncertainty (cont’d)
(f) Determination of net realisable value of inventories
The net realisable value of inventories is estimated by reference to contract prices. However, such net realisable
value may not be the actual realisable value, arising from contract modifications, if any, which may result in
other variable considerations. Such contract modifications may significantly affect the eventual realisable value
of inventories; and there is a significant risk of resulting in a material adjustment to the carrying amounts of
inventories in future periods.
Critical accounting judgements in applying the Group’s accounting policies
In the process of applying the Group’s accounting policies, management has made certain judgements, apart from
those involving estimations, which have significant effect on the amounts recognised in the financial statements.
(a) Revenue recognition and assessment of risk of foreseeable losses on long term construction contracts
The Group has assessed its contracts relating to services for ship and rig repair, building, conversion and overhaul
as a single performance obligation due to the inter-dependence of services provided in these contracts.
Significant judgement is required in determining whether the performance obligations are distinct. Such
considerations include the Group’s assessment of whether the customer can benefit from the good or
service either on its own or together with other resources that are readily available to the customers and
the Group’s promise to transfer the good or service to the customer is separately identifiable from other
promises in the contracts.
For contracts with variable considerations (such as liquidated damages and discounts), the Group has applied
judgement in determining the transaction price for the recognition of revenue. Such judgement includes
assessment of the evaluation of any potential risks and factors which may affect the timely completion of the
project as well as the quality of the output delivered to the customer.
The Group has recognised revenue on construction contracts, rigs & floaters, repairs & upgrades and offshore
platforms based on the percentage of completion method in proportion to the stage of completion. The
percentage of completion is assessed by reference to surveys of work performed. Significant judgement is
required in determining the appropriate stage of completion for revenue recognition; and likewise, judgement is
required in determining the triggering point of suspension of revenue recognition when it is no longer probable
that inflow of economic benefits associated with the contracts will occur. Such considerations include the
Group’s assessment of the credit-worthiness of customers and an evaluation of the contract performance
obligations discharged by the customers.
The Group conducts critical review of all its long term construction contracts regularly. Allowance is made
where necessary to account for onerous contracts. To determine the total costs, the Group monitors and
reviews constantly the progress of all long term construction contracts taking into consideration all inputs from
both internal project managers and external customers. The review includes evaluating any potential risks and
factors which may affect the contract price and timely completion of the construction contracts. The review
also encompasses the cost analysis process whereby both actual costs incurred and future costs to complete
are critically examined.
A N N U A L R E P O R T 2 0 1 8 311S E M B C O R P M A R I N E310

NOTES TO THE FINANCIAL STATEMENTSYear ended 31 December 2018
44. SIGNIFICANT ACCOUNTING ESTIMATES AND JUDGEMENTS (CONT’D)
Critical accounting judgements in applying the Group’s accounting policies (cont’d)
(b) Contract costs – fulfilment costs
For ship and rig building contracts with customers where revenue is recognised at a point in time (i.e. upon
delivery to customer), the costs incurred during the construction phase are recognised as an asset (i.e. contract
costs – fulfilment). Upon fulfilment of the performance obligation and recognition of revenue, these costs will
be recognised in profit or loss. Significant judgement is required to determine if the contract costs recognised
are expected to be recovered. Such judgement includes assessment of the evaluation of any potential risks and
factors which may affect the customer ability to take delivery of the ship and rig. The review also encompasses
the analysis of the industry outlook and the customers’ financial health.
(c) Impairment of financial assets and contract assets
The Group follows the guidance of SFRS(I) 9 Financial Instruments in recognising loss allowances for expected
credit losses on financial assets and contract assets.
The loss allowances for financial assets and contract assets are based on assumptions about risk of default
and expected loss rates to be applied for the respective category of the financial assets and contract assets.
The Group uses judgement in making these assumptions and selecting the input to the impairment calculation
including credit default ratings, evaluation of the Group’s past history of loss rate, existing market conditions
as well as forward looking estimates at the end of each reporting period. The Group also evaluates, among
other factors, financial restructuring (where relevant), credit-worthiness and financial health of and near-term
business outlook of its customers, including factors such as industry and sector performance, changes in
technology and operational and financing cash flow.
In assessing the segmenting of the customers for the loss allowance, judgement is involved in determining
the credit-worthiness and financial health of its customers whose conditions are subject to changes, which
may require changes in the customers’ segmentation, which in turn may affect the level of loss allowance in
future periods.
The carrying amounts of financial assets and contract assets are disclosed in the following notes:
• Note 8 – Other financial assets
• Note 9 – Trade and other receivables
• Note 11 – Contract assets
A N N U A L R E P O R T 2 0 1 8 313S E M B C O R P M A R I N E312
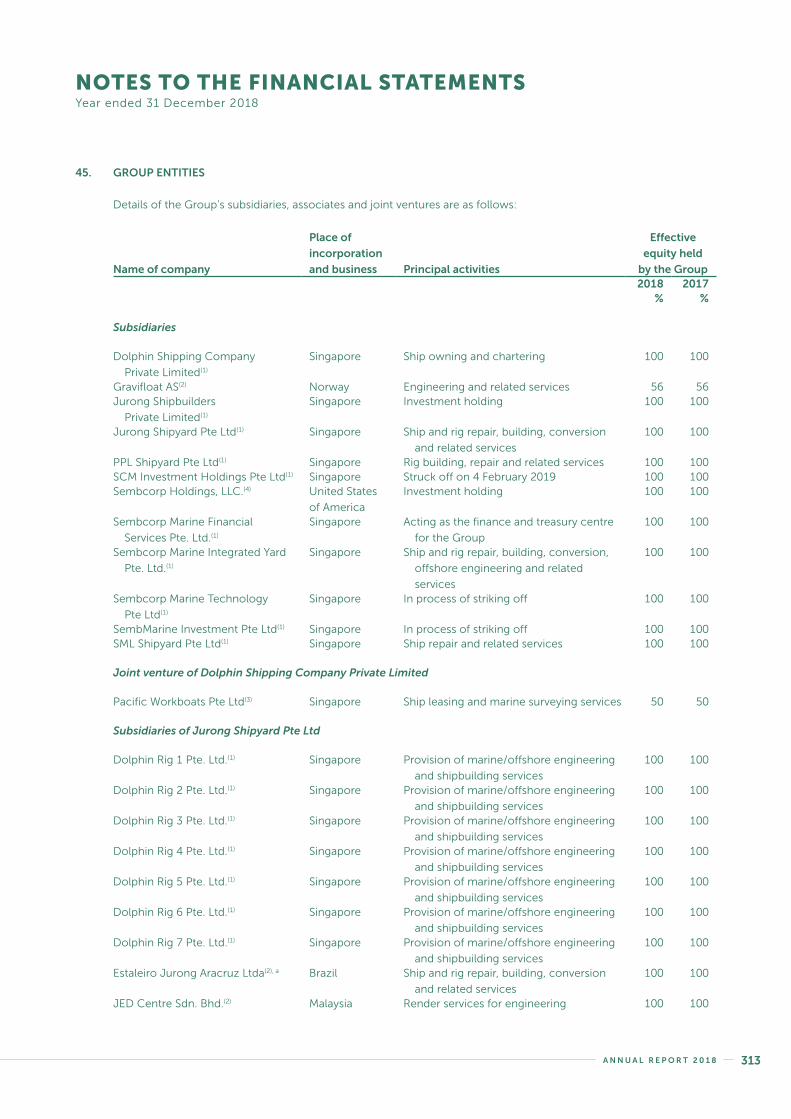
NOTES TO THE FINANCIAL STATEMENTSYear ended 31 December 2018
45. GROUP ENTITIES
Details of the Group’s subsidiaries, associates and joint ventures are as follows:
Name of company
Place of
incorporation
and business Principal activities
Effective
equity held
by the Group2018 2017
% %
Subsidiaries
Dolphin Shipping Company
Private Limited(1)
Singapore Ship owning and chartering 100 100
Gravifloat AS(2) Norway Engineering and related services 56 56Jurong Shipbuilders
Private Limited(1)
Singapore Investment holding 100 100
Jurong Shipyard Pte Ltd(1) Singapore Ship and rig repair, building, conversion
and related services
100 100
PPL Shipyard Pte Ltd(1) Singapore Rig building, repair and related services 100 100SCM Investment Holdings Pte Ltd(1) Singapore Struck off on 4 February 2019 100 100Sembcorp Holdings, LLC.(4) United States
of America
Investment holding 100 100
Sembcorp Marine Financial
Services Pte. Ltd.(1)
Singapore Acting as the finance and treasury centre
for the Group
100 100
Sembcorp Marine Integrated Yard
Pte. Ltd.(1)
Singapore Ship and rig repair, building, conversion,
offshore engineering and related
services
100 100
Sembcorp Marine Technology
Pte Ltd(1)
Singapore In process of striking off 100 100
SembMarine Investment Pte Ltd(1) Singapore In process of striking off 100 100SML Shipyard Pte Ltd(1) Singapore Ship repair and related services 100 100
Joint venture of Dolphin Shipping Company Private Limited
Pacific Workboats Pte Ltd(3) Singapore Ship leasing and marine surveying services 50 50
Subsidiaries of Jurong Shipyard Pte Ltd
Dolphin Rig 1 Pte. Ltd.(1) Singapore Provision of marine/offshore engineering
and shipbuilding services
100 100
Dolphin Rig 2 Pte. Ltd.(1) Singapore Provision of marine/offshore engineering
and shipbuilding services
100 100
Dolphin Rig 3 Pte. Ltd.(1) Singapore Provision of marine/offshore engineering
and shipbuilding services
100 100
Dolphin Rig 4 Pte. Ltd.(1) Singapore Provision of marine/offshore engineering
and shipbuilding services
100 100
Dolphin Rig 5 Pte. Ltd.(1) Singapore Provision of marine/offshore engineering
and shipbuilding services
100 100
Dolphin Rig 6 Pte. Ltd.(1) Singapore Provision of marine/offshore engineering
and shipbuilding services
100 100
Dolphin Rig 7 Pte. Ltd.(1) Singapore Provision of marine/offshore engineering
and shipbuilding services
100 100
Estaleiro Jurong Aracruz Ltda(2), a Brazil Ship and rig repair, building, conversion
and related services
100 100
JED Centre Sdn. Bhd.(2) Malaysia Render services for engineering 100 100
A N N U A L R E P O R T 2 0 1 8 313S E M B C O R P M A R I N E312

NOTES TO THE FINANCIAL STATEMENTSYear ended 31 December 2018
45. GROUP ENTITIES (CONT’D)
Name of company
Place of
incorporation
and business Principal activities
Effective
equity held
by the Group2018 2017
% %
Subsidiaries of Jurong Shipyard Pte Ltd (cont’d)
Jurong do Brasil Prestacao de
Servicos Ltda(2)
Brazil Ship and rig repair, building, conversion
and related services
100 100
Jurong Marine Contractors
Private Limited(1)
Singapore Provision of contract services 100 100
Jurong Netherlands B.V.(4) Netherlands Investment holding 100 100Jurong Offshore Pte. Ltd.(1) Singapore Investment holding 100 100Sembmarine SSP Inc(4) United States
of America
In the business of engineering design,
research and development, marketing
and client services support centre
100 100
Subsidiaries of PPL Shipyard Pte Ltd
Baker Marine Pte Ltd(1) Singapore Rig enhancement and upgrading services,
engineering consultancy and project
management, and supply of rig
equipment and parts
100 100
Baker Marine Services (HK) Limited(2) Hong Kong Provision of rig designs 100 100Baker Marine Technology Inc.(4) United States
of America
Engineering design, research and
development, marketing and client
services support centre
100 100
Subsidiaries of Sembcorp Holdings, LLC.
Sabine Offshore Service, Inc.(4) United States
of America
Inactive 100 100
Sembcorp-Sabine Industries, Inc.(4) United States
of America
Investment holding 100 100
Sembcorp-Sabine Shipyard, Inc.(4) United States
of America
Rig and vessel enhancement and
upgrading services
100 100
Subsidiaries, associates and joint ventures of Sembcorp Marine Integrated Yard Pte. Ltd.
Aquarius Brasil B.V.(3) Netherlands Shipowner 100 100Aragon AS(2) Norway Process design and engineering 50 50Bulk Trade Pte Ltd(1) Singapore Bulk trading 100 100Ecospec Global Technology
Pte. Ltd.(3)
Singapore Provision of environmental
engineering services
20 20
HiLoad LNG AS(2) Norway Design, development and engineering of
LNG related offshore solutions
100 –
Joint Shipyard Management
Services Pte Ltd(1)
Singapore Managing dormitories 32 32
JPL Industries Pte Ltd(1) Singapore Processing and distribution of copper slag 85.8 85.8JPL Concrete Products Pte Ltd(1) Singapore Production of concrete products 85.8 85.8Jurong Marine Services Pte Ltd(1) Singapore Provision of tugging and sea
transportation services
100 100
A N N U A L R E P O R T 2 0 1 8 315S E M B C O R P M A R I N E314

NOTES TO THE FINANCIAL STATEMENTSYear ended 31 December 2018
45. GROUP ENTITIES (CONT’D)
Name of company
Place of
incorporation
and business Principal activities
Effective
equity held
by the Group2018 2017
% %
Subsidiaries, associates and joint ventures of Sembcorp Marine Integrated Yard Pte. Ltd. (cont’d)
Karimun Shiprepair and
Engineering Pte Ltd(1)
Singapore Investment holding 100 100
LMG Marin AS(2) Norway Ship design and engineering 100 100LMG Marin France(2) France Ship design and engineering 60 60LMG Oilcraft AS(2) Norway Ship design and engineering 100 100Marine Housing Services Pte. Ltd.(3) Singapore Provision of dormitory housing services 50 50Midcon Designer Sp. Z.o.o.(2) Poland Ship design and engineering 72.4 72.4Pegasus Marine & Offshore
Pte. Ltd.(1)
Singapore Marine services 100 100
P.T. Karimun Sembawang Shipyard(3) Indonesia Ship repair and related services 100 100PT SMOE Indonesia(2) Indonesia Engineering, construction and fabrication
of offshore structures
90 90
PT SMOE Singgar Mulia
Engineering(2)
Indonesia In liquidation 55 55
Semb-Eco Pte. Ltd.(1) Singapore Investment holding 55 55Semb-Eco R&D Pte. Ltd.(1) Singapore Research and development, holding of
patents
55 55
Semb-Eco Technology Pte. Ltd.(1) Singapore Manufacturing and commercialisation of
patents
55 55
Sembawang Shipyard Project
Services Pte Ltd(1)
Singapore Marine services and rental of premises 100 100
Sembawang Shipyard (S) Pte Ltd(1) Singapore Investment holding 100 100Sembmarine Kakinada Limited(3) India Ship repair, conversion, building and
related activities
40 40
Sembcorp Marine Contractors
Pte. Ltd.(1)
Singapore Provision of contract services 100 100
Sembcorp Marine Offshore
Platforms Pte. Ltd.(1)
Singapore Engineering, construction and fabrication
of offshore structures
100 100
Sembcorp Marine Repairs &
Upgrades Pte. Ltd.(1)
Singapore Ship repair and related services 100 100
Sembcorp Marine Rigs & Floaters
Pte. Ltd.(1)
Singapore Ship and rig building, conversion and
related services
100 100
Sembcorp Marine Solutions
Pte. Ltd.(1)
Singapore Provision of management and technical
services
100 100
Sembcorp Marine Specialised
Shipbuilding Pte. Ltd.(1)
Singapore Shipbuilding, ship repair and related
services
100 100
Sembmarine North Sea Limited(2) United Kingdom In liquidation 100 100Sembmarine SLP Limited(2) United Kingdom Design, engineering, fabrication and
installation of offshore platforms,
modules and structures for the oil, gas
and renewable energy industry
100 100
SES Engineering (M) Sdn Bhd(2) Malaysia Fabrication of metal structures 100 100SES Marine Services (Pte) Ltd(1) Singapore Marine services 100 100
A N N U A L R E P O R T 2 0 1 8 315S E M B C O R P M A R I N E314

NOTES TO THE FINANCIAL STATEMENTSYear ended 31 December 2018
45. GROUP ENTITIES (CONT’D)
Name of company
Place of
incorporation
and business Principal activities
Effective
equity held
by the Group2018 2017
% %
Subsidiaries, associates and joint ventures of Sembcorp Marine Integrated Yard Pte. Ltd. (cont’d)
Sevan SSP AS(2) Norway Design, development, engineering and
consulting related to offshore solutions
100 –
Shenzhen Chiwan Offshore
Petroleum Engineering
Company Ltd(3)
People’s
Republic of
China
Equipment inspection, repair and
maintenance services for oil reconnoiter
and exploitation in South China Sea
35 35
Straits Offshore Pte. Ltd.(1) Singapore Hook-up, commissioning and
maintenance of offshore oil and gas
production facilities
100 100
Straits Overseas Pte. Ltd.(1) Singapore Investment holding and engineering,
construction and fabrication of offshore
marine structures
100 100
(1) Audited by KPMG LLP, Singapore
(2) Audited by member firms of KPMG International in the respective countries
(3) Audited by other firms and not significant
(4) These companies are not required to be audited under the laws of their country of incorporation and not significant
a In 2017, the Company’s wholly-owned subsidiary, Estaleiro Jurong Aracruz Ltda, changed its functional currency from the Brazilian Real to United States Dollar, in order to reflect the primary economic environment that the subsidiary currently operates in.
A N N U A L R E P O R T 2 0 1 8 317S E M B C O R P M A R I N E316

NOTES TO THE FINANCIAL STATEMENTSYear ended 31 December 2018
46. FULL CONVERGENCE WITH SINGAPORE FINANCIAL REPORTING STANDARDS (INTERNATIONAL) (SFRS(I)) AND
ADOPTION OF NEW STANDARDS
In December 2017, the Accounting Standards Council (ASC) issued the Singapore Financial Reporting Standards
(International) (SFRS(I)). SFRS(I) comprises standards and interpretations that are equivalent to International Financial
Reporting Standards (IFRS) as issued by the International Accounting Standards Board (IASB) at 31 December 2017 that
are applicable for annual period beginning on 1 January 2018. Singapore-incorporated companies that have issued, or
are in the process of issuing, equity or debt instruments for trading in a public market in Singapore, will apply SFRS(I)
with effect from annual periods beginning on or after 1 January 2018.
As stated in Note 2.1, these are the first financial statements of the Group and of the Company prepared in accordance
with SFRS(I).
The accounting policies set out in Note 3 have been applied in preparing the financial statements for the year
ended 31 December 2018, the comparative information presented in these financial statements for the year ended
31 December 2017 and in the preparation of the opening SFRS(I) balance sheets at 1 January 2017 (the Group’s date
of transition), subject to the mandatory exceptions and optional exemptions under SFRS(I) 1.
In addition to the adoption of the new framework, the Group also concurrently applied the following SFRS(I)s,
interpretations of SFRS(I)s and requirements of SFRS(I)s which are mandatorily effective from the same date.
• SFRS(I) 15 Revenue from Contracts with Customers which includes clarifications to IFRS 15 Revenue from
Contracts with Customers issued by the IASB in April 2016;
• SFRS(I) 9 Financial Instruments which includes amendments arising from IFRS 4 Insurance Contracts issued by
the IASB in September 2016;
• Requirements in SFRS(I) 2 Share-based Payment arising from the amendments to IFRS 2 – Classification and
measurement of share-based payment transactions issued by the IASB in June 2016;
• Requirements in SFRS(I) 1-40 Investment Property arising from the amendments to IAS 40 – Transfers of
investment property issued by the IASB in December 2016;
• Requirements in SFRS(I) 1 arising from the amendments to IFRS 1 – Deletion of short-term exemptions for first-
time adopters issued by the IASB in December 2016;
• Requirements in SFRS(I) 1-28 Investments in Associates and Joint Ventures arising from the amendments to IAS
28 – Measuring an associate or joint venture at fair value issued by the IASB in December 2016; and
• SFRS(I) INT 22 Foreign Currency Transactions and Advance Consideration.
The Group does not expect the application of the above standards and interpretations to have a significant impact on
the financial statements, except for SFRS(I) 15 and SFRS(I) 9.
Summary of Quantitative Impact
The following table summarises the impact, net of tax, of the transition to SFRS(I) 15 and SFRS(I) 9 on the Group’s and
the Company’s financial position as at 1 January 2017, 31 December 2017 and 1 January 2018 and the Group’s profit
or loss and other comprehensive income for the year ended 31 December 2017.
A N N U A L R E P O R T 2 0 1 8 317S E M B C O R P M A R I N E316

NOTES TO THE FINANCIAL STATEMENTSYear ended 31 December 2018
46. FULL CONVERGENCE WITH SINGAPORE FINANCIAL REPORTING STANDARDS (INTERNATIONAL) (SFRS(I)) AND
ADOPTION OF NEW STANDARDS (CONT’D)
Balance Sheets
As at 31 December 2017 As at 1 January 2018As reported
previously SFRS(I) 15
As reported
presently SFRS(I) 9
As reported
presently$’000 $’000 $’000 $’000 $’000
GroupNon-current assetsContract costs – 128,399 128,399 – 128,399Deferred tax assets 5,889 8,030 13,919 – 13,919Others 4,457,075 – 4,457,075 – 4,457,075
4,462,964 136,429 4,599,393 – 4,599,393
Current assetsInventories and work-in-progress 2,775,847 (2,680,074) 95,773 – 95,773Trade and other receivables 566,874 73,607 640,481 (1,310) 639,171Contract costs – 2,358,054 2,358,054 – 2,358,054Contract assets – 652,361 652,361 – 652,361Others 1,345,763 – 1,345,763 – 1,345,763
4,688,484 403,948 5,092,432 (1,310) 5,091,122Total assets 9,151,448 540,377 9,691,825 (1,310) 9,690,515
Current liabilitiesTrade and other payables 2,061,446 (457,228) 1,604,218 – 1,604,218Excess of progress billings over
work-in-progress 174,356 (174,356) – – –Contract liabilities – 1,135,661 1,135,661 – 1,135,661Others 906,809 – 906,809 – 906,809
3,142,611 504,077 3,646,688 – 3,646,688
Non-current liabilitiesDeferred tax liabilities 61,545 – 61,545 (222) 61,323Contract liabilities – 75,497 75,497 – 75,497Others 3,427,920 – 3,427,920 – 3,427,920
3,489,465 75,497 3,564,962 (222) 3,564,740Total liabilities 6,632,076 579,574 7,211,650 (222) 7,211,428Net assets 2,519,372 (39,197) 2,480,175 (1,088) 2,479,087
Equity attributable to owners of
the CompanyShare capital 484,288 – 484,288 – 484,288Other reserves (25,724) (4,980) (30,704) (447) (31,151)Revenue reserve 2,019,609 (34,217)(1) 1,985,392 (641) 1,984,751
2,478,173 (39,197) 2,438,976 (1,088) 2,437,888Non-controlling interests 41,199 – 41,199 – 41,199Total equity 2,519,372 (39,197) 2,480,175 (1,088) 2,479,087
(1) Amount relates to the reversal of cumulative profits of certain contracts, recognised in prior years according to previous revenue recognition policy under FRS 11, where such revenue and related costs of sales is recognised on delivery to customers on adoption of SFRS(I) 15.
A N N U A L R E P O R T 2 0 1 8 319S E M B C O R P M A R I N E318

NOTES TO THE FINANCIAL STATEMENTSYear ended 31 December 2018
46. FULL CONVERGENCE WITH SINGAPORE FINANCIAL REPORTING STANDARDS (INTERNATIONAL) (SFRS(I)) AND
ADOPTION OF NEW STANDARDS (CONT’D)
Balance Sheets (cont’d)
As at 1 January 2017As reported
previously SFRS(I) 15
As reported
presently$’000 $’000 $’000
GroupNon-current assetsDeferred tax assets 12,042 60,721 72,763Others 4,384,486 – 4,384,486
4,396,528 60,721 4,457,249
Current assetsInventories and work-in-progress 3,066,884 (2,992,937) 73,947Trade and other receivables 491,968 55,709 547,677Contract costs – 2,607,564 2,607,564Contract assets – 440,832 440,832Others 1,459,453 – 1,459,453
5,018,305 111,168 5,129,473Total assets 9,414,833 171,889 9,586,722
Current liabilitiesTrade and other payables 2,120,447 (246,608) 1,873,839Excess of progress billings over work-in-progress 193,403 (193,403) –Contract liabilities – 667,665 667,665Others 1,434,432 – 1,434,432
3,748,282 227,654 3,975,936
Non-current liabilitiesContract liabilities – 240,700 240,700Others 3,058,930 – 3,058,930
3,058,930 240,700 3,299,630Total liabilities 6,807,212 468,354 7,275,566Net assets 2,607,621 (296,465) 2,311,156
Equity attributable to owners of the CompanyShare capital 484,288 – 484,288Other reserves 54,905 (16,141) 38,764Revenue reserve 2,022,796 (280,324)(1) 1,742,472
2,561,989 (296,465) 2,265,524Non-controlling interests 45,632 – 45,632Total equity 2,607,621 (296,465) 2,311,156
(1) Amount relates to the reversal of cumulative profits of certain contracts, recognised in prior years according to previous revenue recognition policy under FRS 11, where such revenue and related costs of sales is recognised on delivery to customers on adoption of SFRS(I) 15.
A N N U A L R E P O R T 2 0 1 8 319S E M B C O R P M A R I N E318

NOTES TO THE FINANCIAL STATEMENTSYear ended 31 December 2018
46. FULL CONVERGENCE WITH SINGAPORE FINANCIAL REPORTING STANDARDS (INTERNATIONAL) (SFRS(I)) AND
ADOPTION OF NEW STANDARDS (CONT’D)
Consolidated Income Statement
Year ended 31 December 2017
As reported
previously SFRS(I) 15
As reported
presently$’000 $’000 $’000
GroupTurnover 2,387,354 647,413(2) 3,034,767Cost of sales (2,326,848) (362,156)(2) (2,689,004)Gross profit 60,506 285,257 345,763Other operating income 63,705 – 63,705Other operating expenses (5,021) – (5,021)General and administrative expenses (98,737) – (98,737)Operating profit 20,453 285,257 305,710Finance income 11,548 11,259 22,807Finance costs (95,522) – (95,522)Non-operating income 64,803 – 64,803Non-operating expenses (13,309) – (13,309)Share of results of associates and joint ventures, net of tax (3,617) – (3,617)(Loss)/profit before tax (15,644) 296,516 280,872Tax credit/(expense) 25,592 (50,409) (24,817)Profit for the year 9,948 246,107 256,055
Attributable to:Owners of the Company 14,076 246,107 260,183Non-controlling interests (4,128) – (4,128)Profit for the year 9,948 246,107 256,055
(2) Amount relates mainly to the reversal of adjustments (in relation to contract terminations) recorded in 2017 set-off partially by reversal of revenue and related costs of sales for other contracts, recognised in 2017 according to previous policy under FRS 11, which is recognised on delivery to customers on adoption of SFRS(I) 15.
Consolidated Statement of Comprehensive Income
Year ended 31 December 2017
As reported
previously SFRS(I) 15
As reported
presently$’000 $’000 $’000
GroupProfit for the year 9,948 246,107 256,055
Items that may be reclassified subsequently to profit or loss:Foreign currency translation differences for foreign operations (62,451) 11,161 (51,290)Others 6,942 – 6,942Other comprehensive income for the year, net of tax (55,509) 11,161 (44,348)Total comprehensive income (45,561) 257,268 211,707
Total comprehensive income attributable to:Owners of the Company (41,407) 257,268 215,861Non-controlling interests (4,154) – (4,154)Total comprehensive income for the year (45,561) 257,268 211,707
A N N U A L R E P O R T 2 0 1 8 321S E M B C O R P M A R I N E320

NOTES TO THE FINANCIAL STATEMENTSYear ended 31 December 2018
46. FULL CONVERGENCE WITH SINGAPORE FINANCIAL REPORTING STANDARDS (INTERNATIONAL) (SFRS(I)) AND
ADOPTION OF NEW STANDARDS (CONT’D)
Balance Sheets
As at 31 December 2017 As at 1 January 2018As reported
previously SFRS(I) 15
As reported
presently SFRS(I) 9
As reported
presently$’000 $’000 $’000 $’000 $’000
CompanyNon-current assetsProperty, plant and equipment 79,418 – 79,418 – 79,418Investment properties 17,190 – 17,190 – 17,190Trade and other receivables 31,725 – 31,725 – 31,725Others 1,502,598 – 1,502,598 – 1,502,598
1,630,931 – 1,630,931 – 1,630,931
Current assetsTrade and other receivables 117,283 – 117,283 – 117,283Others 55,972 – 55,972 – 55,972
173,255 – 173,255 – 173,255Total assets 1,804,186 – 1,804,186 – 1,804,186
Current liabilitiesTrade and other payables 26,433 – 26,433 – 26,433Others 7,245 – 7,245 – 7,245
33,678 – 33,678 – 33,678
Non-current liabilitiesDeferred tax liabilities 11,070 – 11,070 – 11,070Others 26,209 – 26,209 – 26,209
37,279 – 37,279 – 37,279Total liabilities 70,957 – 70,957 – 70,957Net assets 1,733,229 – 1,733,229 – 1,733,229
Equity attributable to
owners of the CompanyShare capital 484,288 – 484,288 – 484,288Other reserves (27,831) – (27,831) (447) (28,278)Revenue reserve 1,276,772 – 1,276,772 447 1,277,219Total equity 1,733,229 – 1,733,229 – 1,733,229
A N N U A L R E P O R T 2 0 1 8 321S E M B C O R P M A R I N E320

NOTES TO THE FINANCIAL STATEMENTSYear ended 31 December 2018
46. FULL CONVERGENCE WITH SINGAPORE FINANCIAL REPORTING STANDARDS (INTERNATIONAL) (SFRS(I)) AND
ADOPTION OF NEW STANDARDS (CONT’D)
Balance Sheets (cont’d)
As at 1 January 2017As reported
previously SFRS(I) 15
As reported
presently$’000 $’000 $’000
CompanyNon-current assetsProperty, plant and equipment 90,497 – 90,497Investment properties 19,006 – 19,006Trade and other receivables 36,605 – 36,605Others 1,005,682 – 1,005,682
1,151,790 – 1,151,790
Current assetsTrade and other receivables 61,099 – 61,099Others 137,387 – 137,387
198,486 – 198,486Total assets 1,350,276 – 1,350,276
Current liabilitiesTrade and other payables 23,890 – 23,890Others 6,771 – 6,771
30,661 – 30,661
Non-current liabilitiesDeferred tax liabilities 12,963 – 12,963Others 24,360 – 24,360
37,323 – 37,323Total liabilities 67,984 – 67,984Net assets 1,282,292 – 1,282,292
Equity attributable to owners of the CompanyShare capital 484,288 – 484,288Other reserves (21,459) – (21,459)Revenue reserve 819,463 – 819,463Total equity 1,282,292 – 1,282,292
A N N U A L R E P O R T 2 0 1 8 323S E M B C O R P M A R I N E322

NOTES TO THE FINANCIAL STATEMENTSYear ended 31 December 2018
46. FULL CONVERGENCE WITH SINGAPORE FINANCIAL REPORTING STANDARDS (INTERNATIONAL) (SFRS(I)) AND
ADOPTION OF NEW STANDARDS (CONT’D)
Notes to the reconciliation
(i) SFRS(I) 1
Upon adoption of SFRS(I) in 2018, the Group applied SFRS(I) 1 on 1 January 2017 as the date of transition for
the Group and the Company. SFRS(I) 1 generally requires that the Group applies SFRS(I) on a retrospective basis,
as if such accounting policy had always been applied. If there are changes to accounting policies arising from
new or amended standards effective in 2018, restatement of comparatives may be required because SFRS(I) 1
requires both the opening balance sheet and comparative information to be prepared using the most current
accounting policies. SFRS(I) 1 provides mandatory exceptions and optional exemptions from retrospective
application, but these are often different from those specific transition provisions in individual FRSs applied
to the FRS financial statements. The application of the mandatory exceptions and the optional exemptions in
SFRS(I) 1 does not have a significant impact on the financial statements.
(ii) SFRS(I) 15
SFRS(I) 15 establishes a comprehensive framework for determining whether, how much and when revenue
is recognised. It also introduces new cost guidance which requires certain costs of obtaining and fulfilling
contracts to be recognised as separate assets when specified criteria are met.
The Group has adopted SFRS(I) 15 in its financial statements for the year ended 31 December 2018, using the
retrospective approach. As a result, the Group applied all of the requirements of SFRS(I) 15 retrospectively, except
as described below, and the comparative period presented in the 2018 financial statements were restated.
The Group has used the practical expedients for completed contracts. This means that completed contracts that
began and ended in the same comparative reporting period, as well as completed contracts at the beginning
of the earliest period presented, are not restated.
The Group has used the practical expedients for variable considerations. This means that for contracts with
variable consideration that were completed on or before the initial application date, the transaction price at the
date of completion is used, rather than estimating the amount of variable consideration.
The Group has used the practical expedients for contract modifications. This means that for contracts that were
modified before the beginning of the earliest period presented, the aggregate effect of all contract modifications
when identifying separate performance obligations and determining and allocating the transaction price on
transition are reflected.
The Group has used the practical expedients for performance obligation disclosures. This means that for periods
presented before the initial application date, the amount of the transaction price allocated to the remaining
performance obligations and an explanation of when that revenue was recognised are not disclosed.
A N N U A L R E P O R T 2 0 1 8 323S E M B C O R P M A R I N E322

NOTES TO THE FINANCIAL STATEMENTSYear ended 31 December 2018
46. FULL CONVERGENCE WITH SINGAPORE FINANCIAL REPORTING STANDARDS (INTERNATIONAL) (SFRS(I)) AND
ADOPTION OF NEW STANDARDS (CONT’D)
(ii) SFRS(I) 15 (cont’d)
The key impacts for the adoption of SFRS(I) 15 are described below.
Long-term contracts
(a) Timing of revenue and cost recognition
The Group previously recognised revenue from long-term contracts using the percentage of completion
method, provided the outcome of the contract can be reliably estimated. Under SFRS(I) 15, the Group
determined its long-term contracts from its rigs & floaters, repairs & upgrades, offshore platforms and
specialised shipbuilding under the Group’s operating segment, to constitute a single performance
obligation, due to the inter-dependence of services provided in these contracts.
The Group does not have an alternative use for the specialised assets which are built to customer order.
When the Group has an enforceable right to payment for performance completed to date or where
the Group‘s performance creates or enhances an asset that the customer controls as the asset is being
created or enhanced, the Group continues to recognise revenue on these long-term contracts over
time. The costs associated to fulfil the performance obligation are expensed as control of goods or
services is transferred to the customer over time.
When the right to payment for performance completed to date cannot be enforced due to non-
enforceability of right to payment for performance completed to date, the revenue and related costs of
sales are recognised only when the constructed assets are delivered to customers.
(b) Contract costs
For long term contracts where the stage of completion is determined by reference to surveys of work
done, contract costs are recognised as an expense in profit or loss using the percentage of completion
method prior to the adoption of SFRS(I) 15.
On adoption of SFRS(I) 15, the costs incurred to fulfil the satisfied performance obligation are recognised
in profit or loss as control of goods or services to the customer is transferred over time. As there is no
direct linkage between the costs being expensed and the output measure used to determine revenue,
this may result in volatile contract margin over the life cycle of the contracts for the long-term contracts.
Where the control of goods and services to the customer is transferred at a future point in time, the
costs incurred to fulfil the future performance obligation are capitalised as they are recoverable, and
presented as “Contract costs” within the balance sheet. The costs capitalised are recognised in profit or
loss when the performance obligation is satisfied.
Consideration payable to customer
The Group previously offset certain payments made to customers for purchase of goods against revenue.
Upon the adoption of SFRS(I) 15, such payments are treated as consideration payable to customer, and
are recognised as an expense instead.
A N N U A L R E P O R T 2 0 1 8 325S E M B C O R P M A R I N E324

NOTES TO THE FINANCIAL STATEMENTSYear ended 31 December 2018
46. FULL CONVERGENCE WITH SINGAPORE FINANCIAL REPORTING STANDARDS (INTERNATIONAL) (SFRS(I)) AND
ADOPTION OF NEW STANDARDS (CONT’D)
(ii) SFRS(I) 15 (cont’d)
Long-term contracts (cont’d)
(b) Contract costs (cont’d)
Significant financing component
The Group has certain contracts where the period between the transfer of the promised goods or
services to the customer and payment by the customer exceeds one year. In such cases, contract
revenue contains a financing component. For contracts where financing components are determined
to be significant, the transaction price is adjusted for the time value of money of the contracts.
(iii) SFRS(I) 9
SFRS(I) 9 Financial Instruments sets out requirements for recognising and measuring financial assets, financial
liabilities and some contracts to buy or sell non-financial items. It also introduces a new ‘expected credit loss’
(ECL) model and a new general hedge accounting model. The Group adopted SFRS(I) 9 from 1 January 2018.
In accordance with the exemption in SFRS(I) 1, the Group elected not to restate information for 2017. Accordingly,
the information presented for 2017 is presented, as previously reported, under FRS 39 Financial Instruments:
Recognition and Measurement. Differences in the carrying amounts of financial assets and financial liabilities
resulting from the adoption of SFRS(I) 9 are recognised in retained earnings and reserves as at 1 January 2018.
Arising from this election, the Group is exempted from providing disclosures required by SFRS(I) 7 Financial
Instruments: Disclosures for the comparative period to the extent that these disclosures relate to items within
the scope of SFRS(I) 9. Instead, disclosures under FRS 107 Financial Instruments: Disclosures relating to items
within the scope of FRS 39 are provided for the comparative period.
Transition
Changes in accounting policies resulting from the adoption of SFRS(I) 9 have been generally applied by the
Group retrospectively, except as described below:
• The following assessments were made on the basis of facts and circumstances that existed at
1 January 2018.
– The determination of the business model within which a financial asset is held.
– The determination of whether the contractual terms of a financial asset give rise to cash flows
that are solely payments of principal and interest on the principal amount outstanding.
– The designation of investment in equity instruments that is not held for trading as at fair value
through other comprehensive income (FVOCI).
– The designation of investments in unit trusts and funds as at fair value through profit or loss.
A N N U A L R E P O R T 2 0 1 8 325S E M B C O R P M A R I N E324

NOTES TO THE FINANCIAL STATEMENTSYear ended 31 December 2018
46. FULL CONVERGENCE WITH SINGAPORE FINANCIAL REPORTING STANDARDS (INTERNATIONAL) (SFRS(I)) AND
ADOPTION OF NEW STANDARDS (CONT’D)
(iii) SFRS(I) 9 (cont’d)
Transition (cont’d)
• New hedge accounting requirements are applied prospectively. All hedging relationships designated
under FRS 39 Financial Instruments: Recognition and Measurement at 31 December 2017 that meet the
criteria for hedge accounting under SFRS(I) 9 at 1 January 2018 were regarded as continuing hedging
relationships.
(a) Classification and measurement of financial assets and financial liabilities
Under SFRS(I) 9, financial assets are classified in the following categories: measured at amortised
cost, FVOCI – equity instrument; or FVTPL. The classification of financial assets under SFRS(I) 9 is
generally based on the business model in which a financial asset is managed and its contractual cash
flow characteristics. SFRS(I) 9 eliminates the previous FRS 39 categories of held-to-maturity, loans and
receivables and available-for-sale. Under SFRS(I) 9, derivatives embedded in contracts where the host is
a financial asset in the scope of the standard are never separated. Instead, the hybrid financial instrument
as a whole is assessed for classification.
The adoption of SFRS(I) 9 has not had a significant effect on the Group’s accounting policies related to
financial liabilities and derivative financial instruments.
For an explanation of how the Group classifies and measures financial instruments and accounts for
related gains and losses under SFRS(I) 9, refer to Notes 3.6 and 3.13.
The following table and accompanying notes below explain the original measurement categories under
FRS 39 and the new measurement categories under SFRS(I) 9 for each class of the Group’s financial
assets as at 1 January 2018.
The effect of adopting SFRS(I) 9 on the carrying amounts of financial assets at 1 January 2018 relates
solely to the new impairment requirements.
A N N U A L R E P O R T 2 0 1 8 327S E M B C O R P M A R I N E326

NOTES TO THE FINANCIAL STATEMENTSYear ended 31 December 2018
46. FULL CONVERGENCE WITH SINGAPORE FINANCIAL REPORTING STANDARDS (INTERNATIONAL) (SFRS(I)) AND
ADOPTION OF NEW STANDARDS (CONT’D)
(iii) SFRS(I) 9 (cont’d)
(a) Classification and measurement of financial assets and financial liabilities (cont’d)
Note
Original
classification
under
FRS 39
New
classification
under
SFRS(I) 9
Original
carrying
amount
under
FRS 39
New
carrying
amount
under
SFRS(I) 9$’000 $’000
GroupAt 1 January 2018Financial assetsCash and cash equivalents Loans and
receivables
Amortised cost 1,301,000 1,301,000
Trade and other receivables (a) Loans and
receivables
Amortised cost 704,155 702,845
Equity shares (b) Available-
for-sale
FVOCI –equity
instruments
20,842 20,842
Unit trusts (c) Available-
for-sale
FVTPL –equity
instruments
694 694
Fair value hedges – Firm
commitments
Loans and
receivables
Amortised cost 692 692
Cash flow hedges– Forward foreign
currency contracts
Fair value
– hedging
instruments
Fair value
– hedging
instruments
57,037 57,037
– Interest rate swaps Fair value
– hedging
instruments
Fair value
– hedging
instruments
456 456
2,084,876 2,083,566
(a) Trade receivables that were classified as loans and receivables under FRS 39 are now classified
at amortised cost. Amount due from customers on construction contracts of $73,607,000 was
reclassified to trade receivables on the adoption of SFRS(I) 15. An increase of S$1,310,000 in the
allowance for impairment over these receivables was recognised in opening retained earnings
at 1 January 2018 on transition to SFRS(I) 9.
(b) The Group elected to present in OCI the changes in fair value of the AFS equity securities that
are held by the Group because these investments are not held for trading.
(c) The Group’s investments in unit trusts and funds, which was previously classified as available-
for-sale financial assets, have been classified as at FVTPL on the adoption of SFRS(I) 9, and the fair
value reserve relating to the fair value changes of the unit trusts and funds have been reclassified
to revenue reserves. The amount reclassified as at 1 January 2018 is approximately $447,000.
A N N U A L R E P O R T 2 0 1 8 327S E M B C O R P M A R I N E326

NOTES TO THE FINANCIAL STATEMENTSYear ended 31 December 2018
46. FULL CONVERGENCE WITH SINGAPORE FINANCIAL REPORTING STANDARDS (INTERNATIONAL) (SFRS(I)) AND
ADOPTION OF NEW STANDARDS (CONT’D)
(iii) SFRS(I) 9 (cont’d)
(b) Impairment
SFRS(I) 9 replaces the previous ‘incurred loss’ model with a forward-looking expected credit loss (ECL)
model. The new impairment model will apply to financial assets measured at amortised cost or FVOCI
(except for investments in equity instruments).
The Group applies the simplified approach and records lifetime ECL on its trade and other receivables
and contract assets arising from the application of SFRS(I) 15.
For assets in the scope of the SFRS(I) 9 impairment model, impairment losses are generally expected
to increase and become more volatile. The Group has determined that the application of SFRS(I) 9’s
impairment requirements at 1 January 2018 results in an additional allowance for impairment as follows.
Group$’000
Loss allowance at 31 December 2017 under FRS 39 165,581Additional impairment recognised at 1 January 2018 1,310Loss allowance at 1 January 2018 under SFRS(I) 9 166,891
Additional information about how the Group and Company measure the allowance for impairment is
described in Note 40 and 44.
A N N U A L R E P O R T 2 0 1 8 329S E M B C O R P M A R I N E328

NOTES TO THE FINANCIAL STATEMENTSYear ended 31 December 2018
46. FULL CONVERGENCE WITH SINGAPORE FINANCIAL REPORTING STANDARDS (INTERNATIONAL) (SFRS(I)) AND
ADOPTION OF NEW STANDARDS (CONT’D)
(iii) SFRS(I) 9 (cont’d)
(c) Hedging
The Group has elected to adopt the new general hedge accounting model in SFRS(I) 9. This requires
the Group to ensure that the hedging relationship are aligned with its risk management objectives and
strategy and to apply a more qualitative and forward-looking approach to assess hedge effectiveness.
Applicable to financial statements for the year 2019 and thereafter
The following new SFRS(I)s, amendments to and interpretations of SFRS(I)s are effective for annual
periods beginning after 1 January 2018:
Applicable to 2019 financial statements
• SFRS(I) 16 Leases
• SFRS(I) INT 23 Uncertainty over Income Tax Treatments
• Long-term Interests in Associates and Joint Ventures (Amendments to SFRS(I) 1-28)
• Prepayment Features with Negative Compensation (Amendments to SFRS(I) 9)
• Previously Held Interest in a Joint Operation (Amendments to SFRS(I) 3 and 11)
• Income Tax Consequences of Payments on Financial Instruments Classified as Equity
(Amendments to SFRS(I) 1-12)
• Borrowing Costs Eligible for Capitalisation (Amendments to SFRS(I) 1-23)
• Plan Amendment, Curtailment or Settlement (Amendments to SFRS(I) 1-19)
Applicable to 2020 financial statements
• SFRS(I) 17 Insurance Contracts
Mandatory effective date deferred
• Sale or Contribution of Assets between an Investor and its Associate or Joint Venture
(Amendments to SFRS(I) 10 and SFRS(I) 1-28).
A N N U A L R E P O R T 2 0 1 8 329S E M B C O R P M A R I N E328

NOTES TO THE FINANCIAL STATEMENTSYear ended 31 December 2018
46. FULL CONVERGENCE WITH SINGAPORE FINANCIAL REPORTING STANDARDS (INTERNATIONAL) (SFRS(I)) AND
ADOPTION OF NEW STANDARDS (CONT’D)
The Group is still in the process of assessing the impact of the new SFRS(I)s, amendments to and interpretations of
SFRS(I)s on the financial statements. The Group’s preliminary assessment of SFRS(I) 16, which is expected to have a
more significant impact on the Group, is as described below.
SFRS(I) 16
SFRS(I) 16 introduces a single, on-balance sheet lease accounting model for lessees. A lessee recognises a right-of-use
(ROU) asset representing its right to use the underlying asset and a lease liability representing its obligation to make lease
payments. There are recognition exemptions for short-term leases and leases of low-value items. Lessor accounting
remains similar to the current standard – i.e. lessors continue to classify leases as finance or operating leases. SFRS(I)
16 replaces existing lease accounting guidance, including SFRS(I) 1-17 Leases, SFRS(I) INT 4 Determining whether an
Arrangement contains a Lease, SFRS(I) INT 1-15 Operating Leases – Incentives and SFRS(I) INT 1-27 Evaluating the
Substance of Transactions Involving the Legal Form of a Lease. The standard is effective for annual periods beginning
on or after 1 January 2019, with early adoption permitted.
(i) The Group as lessee
The Group and Company expect to measure lease liabilities by applying a single discount rate to their portfolio
of warehouse and factory facilities leases. Furthermore, the Group and Company are likely to apply the
practical expedient to recognise amounts of ROU assets equal to their lease liabilities at 1 January 2019. For
lease contracts that contain the option to renew, the Group and Company are expected to use hindsight in
determining the lease term.
The Group and Company expect their existing operating lease arrangements to be recognised as ROU assets
with corresponding lease liabilities under SFRS(I) 16. Lease payments that are increased every five years to reflect
market rentals, and those that are based on changes in local price index, are included in the measurement of
lease liabilities as at date of initial application.
As at 1 January 2019, the Group and Company expect an increase in ROU assets of $280,695,000, a decrease
in property, plant and equipment of $67,375,000, an increase in lease liabilities of $331,626,000, a decrease in
payables of $96,320,000 and a decrease in retained earnings of $21,986,000.
The nature of expenses related to those leases will change as SFRS(I) 16 replaces the straight-line operating
lease expense with depreciation charge for ROU assets and interest expense on lease liabilities.
No significant impact is expected for the Group’s and the Company’s finance leases. The Group and the
Company do not expect the adoption of SFRS(I) 16 to impact their ability to maintain the Group’s capital
management ratio as described in Note 40.
A N N U A L R E P O R T 2 0 1 8 331S E M B C O R P M A R I N E330

NOTES TO THE FINANCIAL STATEMENTSYear ended 31 December 2018
46. FULL CONVERGENCE WITH SINGAPORE FINANCIAL REPORTING STANDARDS (INTERNATIONAL) (SFRS(I)) AND
ADOPTION OF NEW STANDARDS (CONT’D)
SFRS(I) 16 (cont’d)
(ii) The Group as lessor
SFRS(I) 16 substantially carries forward the current existing lessor accounting requirements. Accordingly, the
Group continues to classify its leases as operating leases or finance leases, and to account for these two types
of leases using the existing operating lease and finance lease accounting models respectively.
The Group and Company will reassess the classification of sub-leases in which the Group and Company are
lessors. No significant impact is expected for other leases in which the Group and Company are lessors.
(iii) Transition
The Group and Company plan to apply SFRS(I) 16 initially on 1 January 2019, using the modified retrospective
approach. Therefore, the cumulative effects of adopting SFRS(I) 16 will be recognised as an adjustment to the
opening balance of retained earnings at 1 January 2019, with no restatement of comparative information. The
Group and Company plan to apply the practical expedient to grandfather the definition of a lease on transition.
This means that it will apply SFRS(I) 16 to all contracts entered into before 1 January 2019 and identified as
leases in accordance with SFRS(I) 1-17 and SFRS(I) INT 4.
A N N U A L R E P O R T 2 0 1 8 331S E M B C O R P M A R I N E330

SUPPLEMENTARY INFORMATIONYear ended 31 December 2018
(UNDER SGX-ST LISTING MANUAL REQUIREMENTS)
A. DIRECTORS’ AND KEY EXECUTIVES’ REMUNERATION EARNED FOR THE YEAR
Summary compensation table for the year ended 31 December 2018
Name of Director Salary1
Bonus
Earned
Fair value of
share-based
compensation
granted for
the year2
Brought
Forward
Bonus Bank5
Directors’ FeesCash-
based3
Share-
based4
$’000 $’000 $’000 $’000 $’000 $’000
Payable by the Company:Tan Sri Mohd Hassan Marican – – – 378 162 –Wong Weng Sun 811 508 1,348 – – 2,306Ron Foo Siang Guan – – – 134 57 –Koh Chiap Khiong3 – – – 121 52 –Eric Ang Teik Lim3 – – – 203 – –Gina Lee-Wan – – – 121 52 –Bob Tan Beng Hai – – – 176 75 –Neil McGregor3 – – – 102 43 –William Tan Seng Koon – – – 151 64 –Patrick Daniel – – – 78 33 –Tan Wah Yeow – – – 4 2 –Ajaib Haridass – – – 81 – –Lim Ah Doo – – – 66 – –
Name of Key Executive Salary1
Bonus
Earned
Fair value of
share-based
compensation
granted for
the year2
Brought
Forward
Bonus Bank5
Directors’ Fees
Cash-
based
Share-
based$’000 $’000 $’000 $’000 $’000 $’000
Wang Zijian 434 233 387 – – 73Goh Khor Boon William 413 161 387 – – 252William Gu 348 287 387 – – (85)Tan Cheng Tat 353 94 168 – – 8Chua San Lye 323 173 387 – – 6
Notes:
1. The amount shown is inclusive of basic salary, fixed allowances, AWS and other emoluments.
2. The fair value of the share plans granted for the year is disclosed. The shares granted to key executives are contingent upon meeting performance measures. If these performance measures are not met, the key executive will not be vested with any shares.
3. Cash portion of the Directors’ fees for Mr Koh Chiap Khiong and Mr Neil McGregor, nominee Directors from Sembcorp Industries Ltd (“SCI”), will be paid to SCI. Mr Eric Ang Teik Lim’s Director’s fee will be paid entirely in cash to his employer, DBS Bank Ltd.
A N N U A L R E P O R T 2 0 1 8 333S E M B C O R P M A R I N E332

SUPPLEMENTARY INFORMATIONYear ended 31 December 2018
(UNDER SGX-ST LISTING MANUAL REQUIREMENTS)
A. DIRECTORS’ AND KEY EXECUTIVES’ REMUNERATION EARNED FOR THE YEAR (CONT’D)
4. To align the interests of the non-executive Directors with the interests of shareholders, up to 30% of the aggregate Directors’ fees approved by shareholders for a particular financial year may be paid out in the form of restricted share awards under the Sembcorp Marine Restricted Share Plan 2010.
For year 2018, the awards granted under the Sembcorp Marine Restricted Share Plan 2010 to all Directors as part of their Directors’ fees (except for (i) Mr Wong Weng Sun, who is the President & CEO, and who does not receive any Directors’ fees, and (ii) Mr Eric Ang Teik Lim) will consist of the grant of fully paid shares outright with no performance and vesting conditions attached, but with a selling moratorium. These non-executive Directors are required to hold shares (including shares obtained by other means) worth at least one-time the annual base retainer (currently S$75,000), any excess may be sold as desired. These non-executive Directors can dispose of all of the shares one year after leaving the Board.
The actual number of shares to be awarded to each non-executive Director, (other than Mr Eric Ang Teik Lim) will be determined by reference to the volume-weighted average price of a share on the Singapore Exchange Securities Trading Limited (SGX-ST) over the 14 trading days immediately following the date of the Annual General Meeting. The number of shares to be awarded will be rounded down to the nearest hundred and any residual balance will be settled in cash.
5. The Brought Forward Bonus Bank is the outstanding balance of bonus as at 31 December 2018 (incorporating any adjustment made to the bank balance but excluding the bonus earned during the financial year). Typically, one-third of the accumulated bonus comprising Bonus Earned in the financial year and the Brought Forward Bonus is paid out in cash each year, with the balance being carried forward to the following year. The balances of the bonus bank will be adjusted by the yearly EVA performance of the Group and its subsidiaries and the payouts made from the Bonus Bank.
Details on the share options, performance shares and restricted shares granted to the directors are set out in the Share-based Incentive Plans of the Directors’ Report.
B. INTERESTED PERSON TRANSACTIONS
Aggregate value of all interested
person transactions conducted under
shareholders' mandate pursuant to
Rule 920 of the SGX-ST Listing Manual
(excluding transactions less than $100,000)2018 2017$'000 $'000
Transaction for the Sales of Goods and ServicesPSA International Pte Ltd and its associates – 3,996
Transaction for the Purchase of Goods and ServicesSembcorp Industries Limited and its associates – 106
Management and Support ServicesSembcorp Industries Limited 250 250
Total Interested Person Transactions 250 4,352
A N N U A L R E P O R T 2 0 1 8 333S E M B C O R P M A R I N E332

AD
DIT
ION
AL
INFO
RM
AT
ION
ON
DIR
EC
TO
RS
SEE
KIN
G R
E-E
LEC
TIO
N
Nam
e o
f D
irec
tor
Gin
a Le
e-W
anB
ob
Tan
Ben
g H
aiW
on
g W
eng
Su
nP
atri
ck D
anie
lTa
n W
ah Y
eow
Dat
e o
f A
pp
oin
tme
nt
20
Ap
ril 2
01
52
0 A
pri
l 20
15
1 M
ay 2
00
92
0 A
pri
l 20
18
10
De
ce
mb
er
20
18
Dat
e o
f La
st r
e-e
lec
tio
n
18
Ap
ril 2
01
61
8 A
pri
l 20
16
18
Ap
ril 2
01
6N
.A.
N.A
.
Ag
e6
26
75
76
45
8
Co
un
try
of
pri
nc
ipal
re
sid
en
ce
Sin
gap
ore
Sin
gap
ore
Sin
gap
ore
Sin
gap
ore
Sin
gap
ore
Th
e B
oar
d’s
co
mm
en
ts o
n
this
ap
po
intm
en
t (in
clu
din
g
rati
on
ale
, se
lec
tio
n c
rite
ria,
and
th
e s
ear
ch
an
d n
om
inat
ion
pro
ce
ss)
N.A
.N
.A.
N.A
.N
.A.
N.A
.
Wh
eth
er
app
oin
tme
nt
is
exe
cu
tive
, an
d if
so
, th
e a
rea
of
resp
on
sib
ility
No
n-E
xec
uti
veN
on
-Exe
cu
tive
Exe
cu
tive
(Pre
sid
en
t &
CE
O)
No
n-E
xec
uti
veN
on
-Exe
cu
tive
Job
Tit
le (
e.g
. Le
ad ID
, AC
Ch
airm
an, A
C M
em
be
r e
tc.)
Me
mb
er
of:
• B
oar
d R
isk
Co
mm
itte
e
• Sp
ec
ial C
om
mit
tee
Ch
airm
an o
f:
• B
oar
d R
isk
Co
mm
itte
e
• Sp
ec
ial C
om
mit
tee
Me
mb
er
of:
• E
xec
uti
ve C
om
mit
tee
Me
mb
er
of
Exe
cu
tive
Co
mm
itte
e
Me
mb
er
of:
• A
ud
it C
om
mit
tee
• E
xec
uti
ve R
eso
urc
e
& C
om
pe
nsa
tio
n
Co
mm
itte
e
Me
mb
er
of
Au
dit
Co
mm
itte
e
Pro
fess
ion
al Q
ual
ific
atio
ns
Mrs
Le
e g
rad
uat
ed
fro
m
the
Un
ive
rsit
y o
f K
en
t
at C
ante
rbu
ry w
ith
B.A
.
Law
(H
on
s) in
19
79
.
She
was
th
en
ad
mit
ted
to t
he
Bar
in E
ng
lan
d
and
Wal
es,
Gra
y’s
Inn
in
19
80
an
d t
he
reaf
ter
the
Sin
gap
ore
Bar
in 1
98
1.
20
19
, Se
nio
r A
cc
red
ite
d
Spe
cia
list
in M
arit
ime
and
Sh
ipp
ing
Law
by
the
Sin
gap
ore
Ac
ade
my
of
Law
.
Mr
Tan
is a
Fe
llow
of
the
Inst
itu
te o
f C
har
tere
d
Ac
co
un
tan
ts in
En
gla
nd
and
Wal
es
and
th
e
Sin
gap
ore
Inst
itu
te o
f
Dir
ec
tors
.
Mr
Wo
ng
ho
lds
a
Bac
he
lor
of
Me
ch
anic
al
En
gin
ee
rin
g (
Mar
ine
)
fro
m U
niv
ers
iti
Tekn
olo
gi M
alay
sia
and
a M
aste
r o
f B
usi
ne
ss
Ad
min
istr
atio
n f
rom
Okl
aho
ma
Cit
y
Un
ive
rsit
y, U
SA.
Mr
Dan
iel h
old
s a
BA
(Ho
no
urs
) in
En
gin
ee
rin
g
Scie
nc
e a
nd
Ec
on
om
ics
fro
m U
niv
ers
ity
Co
lleg
e,
Oxf
ord
an
d a
Mas
ter
of
Pu
blic
Ad
min
istr
atio
n
fro
m t
he
Jo
hn
F.
Ke
nn
ed
y Sc
ho
ol o
f
Go
vern
me
nt
at H
arva
rd
Un
ive
rsit
y.
Mr
Tan
ho
lds
a
Bac
he
lor
of
Scie
nc
e
in E
co
no
mic
s fr
om
the
Lo
nd
on
Sc
ho
ol
of
Ec
on
om
ics
and
Po
litic
al S
cie
nc
e. H
e
is a
Fe
llow
of
the
Inst
itu
te o
f C
har
tere
d
Ac
co
un
tan
ts o
f
En
gla
nd
& W
ale
s
and
th
e In
stit
ute
of
Sin
gap
ore
Ch
arte
red
Ac
co
un
tan
ts.
SUPPLEMENTARY INFORMATIONYear ended 31 December 2018
A N N U A L R E P O R T 2 0 1 8 335S E M B C O R P M A R I N E334

AD
DIT
ION
AL
INFO
RM
AT
ION
ON
DIR
EC
TO
RS
SEE
KIN
G R
E-E
LEC
TIO
N (
CO
NT
’D)
Nam
e o
f D
irec
tor
Gin
a Le
e-W
anB
ob
Tan
Ben
g H
aiW
on
g W
eng
Su
nP
atri
ck D
anie
lTa
n W
ah Y
eow
Wo
rkin
g e
xpe
rie
nc
e a
nd
oc
cu
pat
ion
(s)
du
rin
g t
he
pas
t
10
ye
ars
Alle
n &
Gle
dh
ill L
LP
– C
o-H
ead
of
the
Mar
itim
e &
Avi
atio
n
pra
cti
ce
Mr
Tan
re
tire
d in
20
05
.Se
mb
co
rp M
arin
e L
td:
– P
resi
de
nt
& C
hie
f
Exe
cu
tive
Off
ice
r
Sin
gap
ore
Pre
ss
Ho
ldin
gs:
– E
dit
or-
in-C
hie
f,
En
glis
h, M
alay
, Tam
il
Me
dia
Gro
up
– D
ep
uty
Ch
ief
Exe
cu
tive
Off
ice
r
KP
MG
LLP
Sin
gap
ore
– D
ep
uty
Man
agin
g
Par
tne
r
– H
ead
of
KP
MG
Asi
a-
Pac
ific
He
alth
car
e
Pra
cti
ce
Shar
eh
old
ing
inte
rest
in t
he
liste
d is
sue
r an
d it
s su
bsi
dia
rie
s
Mrs
Le
e is
th
e h
old
er
of
69
,80
0 o
rdin
ary
shar
es
in S
em
bc
orp
Mar
ine
Ltd
Mr
Tan
is t
he
ho
lde
r o
f
91
,40
0 o
rdin
ary
shar
es
in S
em
bc
orp
Mar
ine
Ltd
Mr
Wo
ng
is t
he
ho
lde
r
of
3,6
37
,93
4 o
rdin
ary
shar
es
in S
em
bc
orp
Mar
ine
Ltd
No
No
An
y re
lati
on
ship
(in
clu
din
g
imm
ed
iate
fam
ily r
ela
tio
nsh
ips)
wit
h a
ny
exi
stin
g d
ire
cto
r,
exi
stin
g e
xec
uti
ve o
ffic
er,
the
issu
er
and
/or
sub
stan
tial
shar
eh
old
er
of
the
list
ed
issu
er
or
of
any
of
its
pri
nc
ipal
sub
sid
iari
es
No
ne
No
ne
No
ne
No
ne
No
ne
Co
nfl
ict
of
inte
rest
(in
clu
din
g
any
co
mp
eti
ng
bu
sin
ess
)
No
No
No
No
No
Un
de
rtak
ing
(in
th
e f
orm
at s
et
ou
t in
Ap
pe
nd
ix 7
.7)
un
de
r
Ru
le 7
20
(1)
has
be
en
su
bm
itte
d
to t
he
list
ed
issu
er
Yes
Yes
Yes
Yes
Yes
Pas
t (f
or
the
last
5 y
ear
s)–
Ed
ge
Gro
up
Pte
. Ltd
.
– S
EA
Asi
a Si
ng
apo
re
Pte
. Ltd
.
– S
ing
apo
re M
arit
ime
Fou
nd
atio
n
– S
ing
apo
re L
NG
Co
rpo
rati
on
Pte
. Ltd
.
– S
MR
T T
rain
s Lt
d
– S
MR
T C
orp
ora
tio
n
Ltd
––
Sin
gap
ore
Pre
ss
Ho
ldin
gs
sub
sid
iari
es
-Nil-
Pre
sen
tP
leas
e r
efe
r to
Mrs
Le
e’s
pro
file
on
pag
e 5
1
Ple
ase
re
fer
to
Mr
Tan
’s p
rofi
le o
n
pag
e 4
9
Ple
ase
re
fer
to
Mr
Wo
ng
’s p
rofi
le o
n
pag
e 4
8
Ple
ase
re
fer
to
Mr
Dan
iel’s
pro
file
on
pag
e 5
2
Ple
ase
re
fer
to
Mr
Tan
’s p
rofi
le o
n
pag
e 5
2
SUPPLEMENTARY INFORMATIONYear ended 31 December 2018
A N N U A L R E P O R T 2 0 1 8 335S E M B C O R P M A R I N E334
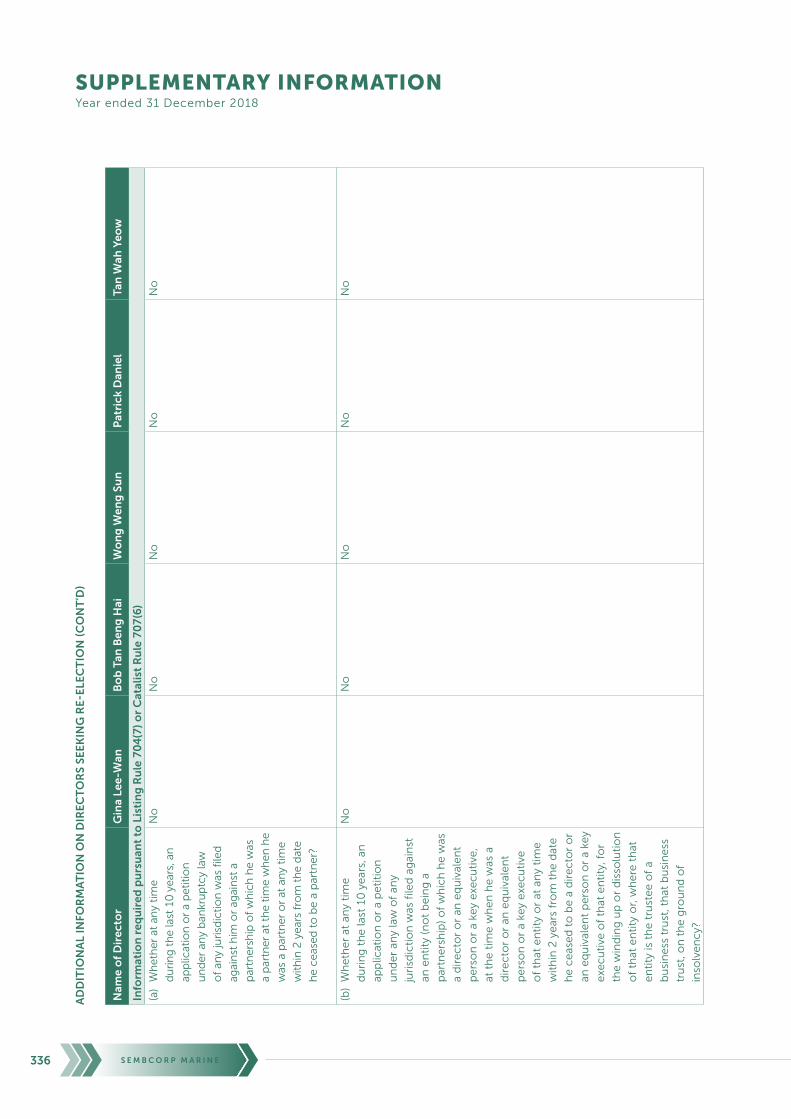
AD
DIT
ION
AL
INFO
RM
AT
ION
ON
DIR
EC
TO
RS
SEE
KIN
G R
E-E
LEC
TIO
N (
CO
NT
’D)
Nam
e o
f D
irec
tor
Gin
a Le
e-W
anB
ob
Tan
Ben
g H
aiW
on
g W
eng
Su
nP
atri
ck D
anie
lTa
n W
ah Y
eow
Info
rmat
ion
req
uir
ed p
urs
uan
t to
Lis
tin
g R
ule
70
4(7
) or
Cat
alis
t R
ule
70
7(6
)
(a)
Wh
eth
er a
t an
y ti
me
du
rin
g t
he
last
10
yea
rs, a
n
app
licat
ion
or
a p
etit
ion
un
der
an
y b
ankr
up
tcy
law
of
any
juri
sdic
tio
n w
as f
iled
agai
nst
him
or
agai
nst
a
par
tner
ship
of
wh
ich
he
was
a p
artn
er a
t th
e ti
me
wh
en h
e
was
a p
artn
er o
r at
an
y ti
me
wit
hin
2 y
ears
fro
m t
he
dat
e
he
ceas
ed t
o b
e a
par
tner
?
No
No
No
No
No
(b)
Wh
eth
er
at a
ny
tim
e
du
rin
g t
he
last
10
ye
ars,
an
app
licat
ion
or
a p
eti
tio
n
un
de
r an
y la
w o
f an
y
juri
sdic
tio
n w
as f
iled
ag
ain
st
an e
nti
ty (
no
t b
ein
g a
par
tne
rsh
ip)
of
wh
ich
he
was
a d
ire
cto
r o
r an
eq
uiv
ale
nt
pe
rso
n o
r a
key
exe
cu
tive
,
at t
he
tim
e w
he
n h
e w
as a
dir
ec
tor
or
an e
qu
ival
en
t
pe
rso
n o
r a
key
exe
cu
tive
of
that
en
tity
or
at a
ny
tim
e
wit
hin
2 y
ear
s fr
om
th
e d
ate
he
ce
ase
d t
o b
e a
dir
ec
tor
or
an e
qu
ival
en
t p
ers
on
or
a ke
y
exe
cu
tive
of
that
en
tity
, fo
r
the
win
din
g u
p o
r d
isso
luti
on
of
that
en
tity
or,
wh
ere
th
at
en
tity
is t
he
tru
ste
e o
f a
bu
sin
ess
tru
st, t
hat
bu
sin
ess
tru
st, o
n t
he
gro
un
d o
f
inso
lve
nc
y?
No
No
No
No
No
SUPPLEMENTARY INFORMATIONYear ended 31 December 2018
A N N U A L R E P O R T 2 0 1 8 337S E M B C O R P M A R I N E336

AD
DIT
ION
AL
INFO
RM
AT
ION
ON
DIR
EC
TO
RS
SEE
KIN
G R
E-E
LEC
TIO
N (
CO
NT
’D)
Nam
e o
f D
irec
tor
Gin
a Le
e-W
anB
ob
Tan
Ben
g H
aiW
on
g W
eng
Su
nP
atri
ck D
anie
lTa
n W
ah Y
eow
Info
rmat
ion
req
uir
ed p
urs
uan
t to
Lis
tin
g R
ule
70
4(7
) or
Cat
alis
t R
ule
70
7(6
) (co
nt’
d)
(c)
Wh
eth
er
the
re is
an
y
un
sati
sfie
d ju
dg
me
nt
agai
nst
him
?
No
No
No
No
No
(d)
Wh
eth
er
he
has
eve
r b
ee
n
co
nvi
cte
d o
f an
y o
ffe
nc
e,
in S
ing
apo
re o
r e
lse
wh
ere
,
invo
lvin
g f
rau
d o
r d
ish
on
est
y
wh
ich
is p
un
ish
able
wit
h
imp
riso
nm
en
t, o
r h
as b
ee
n
the
su
bje
ct
of
any
cri
min
al
pro
ce
ed
ing
s (in
clu
din
g
any
pe
nd
ing
cri
min
al
pro
ce
ed
ing
s o
f w
hic
h h
e is
awar
e)
for
suc
h p
urp
ose
?
No
No
No
No
No
(e)
Wh
eth
er
he
has
eve
r b
ee
n
co
nvi
cte
d o
f an
y o
ffe
nc
e,
in S
ing
apo
re o
r e
lse
wh
ere
,
invo
lvin
g a
bre
ach
of
any
law
or
reg
ula
tory
re
qu
ire
me
nt
that
re
late
s to
th
e s
ec
uri
tie
s
or
futu
res
ind
ust
ry in
Sin
gap
ore
or
els
ew
he
re,
or
has
be
en
th
e s
ub
jec
t o
f
any
cri
min
al p
roc
ee
din
gs
(inc
lud
ing
an
y p
en
din
g
cri
min
al p
roc
ee
din
gs
of
wh
ich
he
is a
war
e)
for
suc
h
bre
ach
?
No
No
No
No
No
SUPPLEMENTARY INFORMATIONYear ended 31 December 2018
A N N U A L R E P O R T 2 0 1 8 337S E M B C O R P M A R I N E336

AD
DIT
ION
AL
INFO
RM
AT
ION
ON
DIR
EC
TO
RS
SEE
KIN
G R
E-E
LEC
TIO
N (
CO
NT
’D)
Nam
e o
f D
irec
tor
Gin
a Le
e-W
anB
ob
Tan
Ben
g H
aiW
on
g W
eng
Su
nP
atri
ck D
anie
lTa
n W
ah Y
eow
Info
rmat
ion
req
uir
ed p
urs
uan
t to
Lis
tin
g R
ule
70
4(7
) or
Cat
alis
t R
ule
70
7(6
) (co
nt’
d)
(f)
Wh
eth
er
at a
ny
tim
e d
uri
ng
the
last
10
ye
ars,
jud
gm
en
t
has
be
en
en
tere
d a
gai
nst
him
in a
ny
civ
il p
roc
ee
din
gs
in S
ing
apo
re o
r e
lse
wh
ere
invo
lvin
g a
bre
ach
of
any
law
or
reg
ula
tory
req
uir
em
en
t th
at r
ela
tes
to t
he
se
cu
riti
es
or
futu
res
ind
ust
ry in
Sin
gap
ore
or
els
ew
he
re, o
r a
fin
din
g o
f
frau
d, m
isre
pre
sen
tati
on
or
dis
ho
ne
sty
on
his
par
t,
or
he
has
be
en
th
e s
ub
jec
t
of
any
civ
il p
roc
ee
din
gs
(inc
lud
ing
an
y p
en
din
g
civ
il p
roc
ee
din
gs
of
wh
ich
he
is a
war
e)
invo
lvin
g
an a
lleg
atio
n o
f fr
aud
,
mis
rep
rese
nta
tio
n o
r
dis
ho
ne
sty
on
his
par
t?
No
No
No
No
No
(g)
Wh
eth
er
he
has
eve
r b
ee
n
co
nvi
cte
d in
Sin
gap
ore
or
els
ew
he
re o
f an
y o
ffe
nc
e
in c
on
ne
cti
on
wit
h t
he
form
atio
n o
r m
anag
em
en
t o
f
any
en
tity
or
bu
sin
ess
tru
st?
No
No
No
No
No
(h)
Wh
eth
er h
e h
as e
ver
bee
n
dis
qu
alifi
ed f
rom
act
ing
as
a d
irec
tor
or
an e
qu
ival
ent
per
son
of
any
enti
ty
(incl
ud
ing
th
e tr
ust
ee o
f a
bu
sin
ess
tru
st),
or
fro
m t
akin
g
par
t d
irec
tly
or
ind
irec
tly
in t
he
man
agem
ent
of
any
enti
ty o
r b
usi
nes
s tr
ust
?
No
No
No
No
No
SUPPLEMENTARY INFORMATIONYear ended 31 December 2018
A N N U A L R E P O R T 2 0 1 8 339S E M B C O R P M A R I N E338

AD
DIT
ION
AL
INFO
RM
AT
ION
ON
DIR
EC
TO
RS
SEE
KIN
G R
E-E
LEC
TIO
N (
CO
NT
’D)
Nam
e o
f D
irec
tor
Gin
a Le
e-W
anB
ob
Tan
Ben
g H
aiW
on
g W
eng
Su
nP
atri
ck D
anie
lTa
n W
ah Y
eow
Info
rmat
ion
req
uir
ed p
urs
uan
t to
Lis
tin
g R
ule
70
4(7
) or
Cat
alis
t R
ule
70
7(6
) (co
nt’
d)
(i)
Wh
eth
er
he
has
eve
r
be
en
th
e s
ub
jec
t o
f an
y
ord
er,
jud
gm
en
t o
r ru
ling
of
any
co
urt
, tri
bu
nal
or
go
vern
me
nta
l bo
dy,
pe
rman
en
tly
or
tem
po
rari
ly
en
join
ing
him
fro
m e
ng
agin
g
in a
ny
typ
e o
f b
usi
ne
ss
pra
cti
ce
or
acti
vity
?
No
No
No
No
No
(j)
Wh
eth
er
he
has
eve
r, t
o h
is k
no
wle
dg
e, b
ee
n c
on
ce
rne
d w
ith
th
e m
anag
em
en
t o
r c
on
du
ct,
in S
ing
apo
re o
r e
lse
wh
ere
, of
the
aff
airs
of
-
(i)
any
co
rpo
rati
on
wh
ich
has
be
en
inve
stig
ate
d f
or
a b
reac
h o
f an
y la
w o
r
reg
ula
tory
re
qu
ire
me
nt
go
vern
ing
co
rpo
rati
on
s
in S
ing
apo
re o
r
els
ew
he
re;
or
No
No
No
No
No
(ii)
an
y e
nti
ty (
no
t b
ein
g a
co
rpo
rati
on
) w
hic
h h
as
be
en
inve
stig
ate
d f
or
a b
reac
h o
f an
y la
w o
r
reg
ula
tory
re
qu
ire
me
nt
go
vern
ing
su
ch
en
titi
es
in S
ing
apo
re o
r
els
ew
he
re;
or
No
No
No
No
No
(iii)
any
bu
sin
ess
tru
st w
hic
h
has
be
en
inve
stig
ate
d f
or
a b
reac
h o
f an
y la
w o
r
reg
ula
tory
re
qu
ire
me
nt
go
vern
ing
bu
sin
ess
tru
sts
in S
ing
apo
re o
r
els
ew
he
re;
or
No
No
No
No
No
SUPPLEMENTARY INFORMATIONYear ended 31 December 2018
A N N U A L R E P O R T 2 0 1 8 339S E M B C O R P M A R I N E338

AD
DIT
ION
AL
INFO
RM
AT
ION
ON
DIR
EC
TO
RS
SEE
KIN
G R
E-E
LEC
TIO
N (
CO
NT
’D)
Nam
e o
f D
irec
tor
Gin
a Le
e-W
anB
ob
Tan
Ben
g H
aiW
on
g W
eng
Su
nP
atri
ck D
anie
lTa
n W
ah Y
eow
Info
rmat
ion
req
uir
ed p
urs
uan
t to
Lis
tin
g R
ule
70
4(7
) or
Cat
alis
t R
ule
70
7(6
) (co
nt’
d)
(j)
Wh
eth
er
he
has
eve
r, t
o h
is k
no
wle
dg
e, b
ee
n c
on
ce
rne
d w
ith
th
e m
anag
em
en
t o
r c
on
du
ct,
in S
ing
apo
re o
r e
lse
wh
ere
, of
the
aff
airs
of
:- (
co
nt’d
)
(iv)
any
en
tity
or
bu
sin
ess
tru
st w
hic
h h
as b
ee
n
inve
stig
ate
d f
or
a b
reac
h
of
any
law
or
reg
ula
tory
req
uir
em
en
t th
at
rela
tes
to t
he
se
cu
riti
es
or
futu
res
ind
ust
ry in
Sin
gap
ore
or
els
ew
he
re,
in c
on
ne
cti
on
wit
h
any
mat
ter
oc
cu
rrin
g
or
aris
ing
du
rin
g t
hat
pe
rio
d w
he
n h
e w
as
so c
on
ce
rne
d w
ith
th
e
en
tity
or
bu
sin
ess
tru
st?
No
No
No
No
No
(k)
Wh
eth
er
he
has
be
en
th
e
sub
jec
t o
f an
y c
urr
en
t o
r p
ast
inve
stig
atio
n o
r d
isc
iplin
ary
pro
ce
ed
ing
s, o
r h
as b
ee
n
rep
rim
and
ed
or
issu
ed
an
y
war
nin
g, b
y th
e M
on
eta
ry
Au
tho
rity
of
Sin
gap
ore
or
any
oth
er
reg
ula
tory
au
tho
rity
,
exc
han
ge
, pro
fess
ion
al b
od
y
or
go
vern
me
nt
age
nc
y,
wh
eth
er
in S
ing
apo
re o
r
els
ew
he
re?
No
No
No
No
No
SUPPLEMENTARY INFORMATIONYear ended 31 December 2018
A N N U A L R E P O R T 2 0 1 8 341S E M B C O R P M A R I N E340

AD
DIT
ION
AL
INFO
RM
AT
ION
ON
DIR
EC
TO
RS
SEE
KIN
G R
E-E
LEC
TIO
N (
CO
NT
’D)
Nam
e o
f D
irec
tor
Gin
a Le
e-W
anB
ob
Tan
Ben
g H
aiW
on
g W
eng
Su
nP
atri
ck D
anie
lTa
n W
ah Y
eow
Dis
clo
sure
ap
plic
able
to
ap
po
intm
ent
of
Dir
ecto
r o
nly
An
y p
rio
r e
xpe
rie
nc
e a
s a
dir
ec
tor
of
a lis
ted
co
mp
any?
If y
es,
ple
ase
pro
vid
e d
eta
ils o
f
pri
or
exp
eri
en
ce
. If
no
, ple
ase
stat
e if
th
e d
ire
cto
r h
as a
tte
nd
ed
or
will
be
att
en
din
g t
rain
ing
on
the
ro
les
and
re
spo
nsi
bili
tie
s
of
a d
ire
cto
r o
f a
liste
d is
sue
r
as p
resc
rib
ed
by
the
Exc
han
ge
.
Ple
ase
pro
vid
e d
eta
ils o
f re
leva
nt
exp
eri
en
ce
an
d t
he
no
min
atin
g
co
mm
itte
e’s
re
aso
ns
for
no
t re
qu
irin
g t
he
dir
ec
tor
to
un
de
rgo
tra
inin
g a
s p
resc
rib
ed
by
the
Exc
han
ge
(if
ap
plic
able
).
N.A
.N
.A.
N.A
.N
.A.
N.A
.
SUPPLEMENTARY INFORMATIONYear ended 31 December 2018
A N N U A L R E P O R T 2 0 1 8 341S E M B C O R P M A R I N E340

Location Description & Approximate Land Area Tenure Usage
Singapore Yards
• Tanjong Kling Road Land area: 491,056 m2
Buildings, workshops, drydocks and
quays
10 years leasehold
10 years renewal
(JTC Land)
Ship repairs, ship
conversion, offshore
engineering, shipbuilding
and rig building including
drydock, berthage and
workshops
• Admiralty Road East/
Admiralty Road West
Land area: 860,716 m2
Buildings, workshops, drydocks and
quays
22 years leasehold Ship repairs, ship
conversion, offshore
engineering and rig building
including docks, berthage
and workshops
• Pandan Road Land area: 141,791 m2 15 years leasehold
(JTC Land)
Rig building, repairs,
upgrading and fabrication
including berthage and
workshops
• Pandan Road Land area: 9,182 m2 30 years leasehold
(JTC Land)
Steel fabrication and
precision machining of
components for offshore
jack-up oil rigs
• Tuas Crescent Land area: 58,226 m2 9.5 years leasehold
(JTC Land)
Fabrication of jack-up oil
rigs and associated sub-
structure modules
• Shipyard Road* Land area: 63,300 m2
Buildings, workshops and drydocks
22 months tenancy
(JTC Land)
Ship repairs and shipbuilding
including drydocks,
berthage and workshops
• Tuas Road* Land area: 59,942 m2
Buildings, workshops, docks and quays
14 years leasehold
(JTC Land)
Shipbuilding and fabrication
including berthage and
workshops
• Tuas South Boulevard
Phase I
Land area: 733,104 m2
Docks, quays, workshops, buildings
and berthage
30 plus 30 years
leasehold (JTC land)
Ship repairs, ship
conversion, offshore
engineering, shipbuilding
and rig building including
drydocks, berthage and
workshops
• Tuas South Boulevard
Phase II
Land area: 345,600 m2 30 plus 30 years
leasehold (JTC land)
Ship repairs, ship
conversion, offshore
engineering, shipbuilding
and rig building including
drydocks, berthage and
workshops
• Tuas South Boulevard
Phase IIIa
Land area: 411,407.7 m2
(Pending final survey
of land by JTC)
30 plus 30 years
leasehold (JTC land)
Marine engineering activities
including repair, conversion,
upgrading and building
of rigs, ships and offshore
structures
* The properties are being prepared to be handed back to JTC following expiry of tenure.
MAJOR PROPERTIES
A N N U A L R E P O R T 2 0 1 8 343S E M B C O R P M A R I N E342

Location Description & Approximate Land Area Tenure Usage
Overseas Yards
P.T. Karimun Sembawang Shipyard
• Karimun Island,
Indonesia
Land area: 307,650 m2
Buildings, workshops and wharves
30 years leasehold
with option for 20
years plus another
option for 30 years
Ship repair and fabrication
including berthage and
workshop
Estaleiro Jurong Aracruz
• Municipality of Aracruz,
State of Espirito Santo,
Brazil
Land area: 825,000 m2
Slipways, berthing quays, drydock,
ancillary steel and piping facilities
Freehold Drillships construction,
building of semi-submersible
rigs, FPSO integration,
fabrication of topside
modules, PSVs construction,
drilling rig repairs and
modification works
P.T. SMOE Indonesia
• Batam Island, Indonesia Land area: 815,036 m2
Workshops, office buildings and 547
metres of jetty for modules load-out
30 years leaseholds Workshops and fabrication
facilities
Miscellaneous
JPL Industries
• Jurong Pier Road Land area: 27,783 m2 20 years leasehold
(JTC Land)
Copper slag recycling
SES Engineering Sdn Bhd
• Perindustrian Taman
Johor, Johor Bahru
Land area: 5,235 m2
Workshop and a 3-storey office
building
Freehold Metal Fabrication workshop
Sembmarine SLP Ltd
• Lowestoft, Suffolk, UK Land area: 55,000 m2
Workshops and office building
Freehold and
leasehold land ranging
from 22 to 99 years
Workshops and fabrication
facilities
Mendon Spring
• Pasir Panjang 9 units of 3-room apartment with
built-in area of 99 m2 per unit
Freehold Residential properties
MAJOR PROPERTIES
A N N U A L R E P O R T 2 0 1 8 343S E M B C O R P M A R I N E342

NOTICE IS HEREBY GIVEN THAT the 56th Annual General Meeting of Sembcorp Marine Ltd (the “Company”) will be held at
Stephen Riady Auditorium@NTUC, NTUC Centre, Level 7, One Marina Boulevard, Singapore 018989 on Tuesday, 16 April 2019
at 11.00 am to transact the following business:
ROUTINE BUSINESS
1. To receive and adopt the Directors’ Statement and Audited Financial Statements for the year
ended 31 December 2018 and the Auditors’ Report thereon.
Resolution 1
2. To re-elect the following directors, each of whom will retire by rotation pursuant to article 94 of
the Company’s Constitution and who, being eligible, has offered herself/himself for re-election:
(a) Mrs Gina Lee-Wan Resolution 2(b) Mr Bob Tan Beng Hai Resolution 3(c) Mr Wong Weng Sun Resolution 4
3. To re-elect the following directors, each of whom will cease to hold office pursuant to article
100 of the Company’s Constitution and who, being eligible, has offered himself for re-election:
(a) Mr Patrick Daniel Resolution 5(b) Mr Tan Wah Yeow Resolution 6
4. To approve directors’ fees of up to S$2,300,000 for the year ending 31 December 2019
(2018: up to S$2,500,000).
Resolution 7
5. To re-appoint KPMG LLP as the auditors of the Company and to authorise the directors to fix
their remuneration.
Resolution 8
SPECIAL BUSINESS
To consider and, if thought fit, to pass, with or without modifications, the following resolutions which will be proposed as
Ordinary Resolutions:
6. Renewal of Share Issue Mandate
That authority be and is hereby given to the directors to:
(a) (i) issue shares of the Company (“shares”) whether by way of rights, bonus or
otherwise; and/or
(ii) make or grant offers, agreements or options (collectively, “Instruments”) that
might or would require shares to be issued, including but not limited to the
creation and issue of (as well as adjustments to) warrants, debentures or other
instruments convertible into shares,
at any time and upon such terms and conditions and for such purposes and to such
persons as the directors may, in their absolute discretion deem fit; and
(b) (notwithstanding the authority conferred by this Resolution may have ceased to be in
force) issue shares in pursuance of any Instrument made or granted by the directors
while this Resolution was in force,
Resolution 9
SEMBCORP MARINE LTDNOTICE OF ANNUAL GENERAL MEETING(Incorporated in Singapore)Company Registration No. 196300098Z
A N N U A L R E P O R T 2 0 1 8 345S E M B C O R P M A R I N E344

provided that:
(1) the aggregate number of shares to be issued pursuant to this Resolution (including shares
to be issued in pursuance of Instruments made or granted pursuant to this Resolution)
does not exceed 50% of the total number of issued shares (excluding treasury shares and
subsidiary holdings) (as calculated in accordance with paragraph (2) below), of which the
aggregate number of shares to be issued other than on a pro rata basis to shareholders
of the Company (including shares to be issued in pursuance of Instruments made or
granted pursuant to this Resolution) shall not exceed 5% of the total number of issued
shares (excluding treasury shares and subsidiary holdings) (as calculated in accordance
with paragraph (2) below);
(2) (subject to such manner of calculation as may be prescribed by the Singapore Exchange
Securities Trading Limited (the “SGX-ST”)) for the purpose of determining the aggregate
number of shares that may be issued under paragraph (1) above, the percentage of issued
shares shall be based on the total number of issued shares (excluding treasury shares and
subsidiary holdings) at the time this Resolution is passed, after adjusting for:
(i) new shares arising from the conversion or exercise of any convertible securities
or share options or vesting of share awards which are outstanding or subsisting at
the time this Resolution is passed; and
(ii) any subsequent bonus issue or consolidation or subdivision of shares;
and, in paragraph (1) above and this paragraph (2), “subsidiary holdings” has the meaning
given to it in the Listing Manual of the SGX-ST;
(3) in exercising the authority conferred by this Resolution, the Company shall comply with
the provisions of the Listing Manual of the SGX-ST for the time being in force (unless such
compliance has been waived by the SGX-ST) and the Constitution for the time being of
the Company; and
(4) (unless revoked or varied by the Company in general meeting) the authority conferred
by this Resolution shall continue in force until the conclusion of the next Annual General
Meeting of the Company or the date by which the next Annual General Meeting of the
Company is required by law to be held, whichever is the earlier.
7. Renewal of Share Plan Mandate
That approval be and is hereby given to the directors to:
Resolution 10
(a) grant awards in accordance with the provisions of the Sembcorp Marine Performance
Share Plan 2010 (the “Performance Share Plan”) and/or the Sembcorp Marine Restricted
Share Plan 2010 (the “Restricted Share Plan”) (the Performance Share Plan and the
Restricted Share Plan, together the “Share Plans”); and
(b) allot and issue from time to time such number of ordinary shares of the Company as may
be required to be delivered pursuant to the vesting of awards under the Share Plans,
SEMBCORP MARINE LTDNOTICE OF ANNUAL GENERAL MEETING(Incorporated in Singapore)Company Registration No. 196300098Z
A N N U A L R E P O R T 2 0 1 8 345S E M B C O R P M A R I N E344

provided that:
(1) the aggregate number of (i) new ordinary shares allotted and issued and/or to be allotted
and issued, (ii) existing ordinary shares (including shares held in treasury) delivered and/
or to be delivered, and (iii) ordinary shares released and/or to be released in the form of
cash in lieu of ordinary shares, pursuant to the Share Plans, shall not exceed 7% of the
total number of issued ordinary shares of the Company (excluding treasury shares and
subsidiary holdings) from time to time; and
(2) the aggregate number of ordinary shares under awards to be granted pursuant to the
Share Plans during the period commencing from this Annual General Meeting and
ending on the date of the next Annual General Meeting of the Company or the date by
which the next Annual General Meeting of the Company is required by law to be held,
whichever is the earlier, shall not exceed 1% of the total number of issued ordinary shares
of the Company (excluding treasury shares and subsidiary holdings) from time to time,
and in this Resolution, “subsidiary holdings” has the meaning given to it in the Listing Manual of
the Singapore Exchange Securities Trading Limited.
8. Modifications to, and Renewal of, IPT Mandate
That:
(a) approval be and is hereby given, for the purposes of Chapter 9 of the Listing Manual
(“Chapter 9”) of the Singapore Exchange Securities Trading Limited, for the Company,
its subsidiaries and associated companies that are entities at risk (as that term is used
in Chapter 9), or any of them, to enter into any of the transactions falling within the
types of interested person transactions described in Appendix 1 to the Company’s Letter
to Shareholders dated 1 April 2019 (the “Letter”) with any party who is of the class of
interested persons described in Appendix 1 to the Letter, provided that such transactions
are made on normal commercial terms and in accordance with the review procedures
for such interested person transactions;
(b) the approval given in paragraph (a) above (the “IPT Mandate”) shall, unless revoked or
varied by the Company in general meeting, continue in force until the conclusion of the
next Annual General Meeting of the Company; and
(c) the directors and/or any of them be and are hereby authorised to complete and do all
such acts and things (including executing all such documents as may be required) as they
and/or he may consider expedient or necessary or in the interests of the Company to
give effect to the IPT Mandate and/or this Resolution.
Resolution 11
SEMBCORP MARINE LTDNOTICE OF ANNUAL GENERAL MEETING(Incorporated in Singapore)Company Registration No. 196300098Z
A N N U A L R E P O R T 2 0 1 8 347S E M B C O R P M A R I N E346

9. Renewal of Share Purchase Mandate
That:
(a) for the purposes of Sections 76C and 76E of the Companies Act, Chapter 50 (the
“Companies Act”), the exercise by the directors of all the powers of the Company to
purchase or otherwise acquire issued ordinary shares of the Company (“Shares”) not
exceeding in aggregate the Maximum Limit (as hereafter defined), at such price or prices
as may be determined by the directors from time to time up to the Maximum Price (as
hereafter defined), whether by way of:
(i) market purchase(s) on the Singapore Exchange Securities Trading Limited (the
“SGX-ST”) and/or any other securities exchange on which the Shares may for the
time being be listed and quoted (“Other Exchange”); and/or
(ii) off-market purchase(s) (if effected otherwise than on the SGX-ST or, as the case
may be, the Other Exchange) in accordance with any equal access scheme(s)
as may be determined or formulated by the directors as they consider fit, which
scheme(s) shall satisfy all the conditions prescribed by the Companies Act,
and otherwise in accordance with all other laws and regulations and rules of the
SGX-ST or, as the case may be, Other Exchange, as may for the time being be applicable,
be and is hereby authorised and approved generally and unconditionally (the “Share
Purchase Mandate”);
(b) unless varied or revoked by the Company in general meeting, the authority conferred on
the directors pursuant to the Share Purchase Mandate may be exercised by the directors
at any time and from time to time during the period commencing from the date of the
passing of this Resolution and expiring on the earliest of:
(i) the date on which the next Annual General Meeting of the Company is held;
(ii) the date by which the next Annual General Meeting of the Company is required
by law to be held; and
(iii) the date on which purchases and acquisitions of Shares pursuant to the Share
Purchase Mandate are carried out to the full extent mandated;
(c) in this Resolution:
“Average Closing Price” means the average of the last dealt prices of a Share for the five
consecutive market days on which the Shares are transacted on the SGX-ST or, as the
case may be, the Other Exchange, immediately preceding the date of market purchase
by the Company or, as the case may be, the date of the making of the offer pursuant to
the off-market purchase, and deemed to be adjusted in accordance with the listing rules
of the SGX-ST for any corporate action which occurs after the relevant five-day period;
“date of the making of the offer” means the date on which the Company makes an
offer for the purchase or acquisition of Shares from holders of Shares, stating therein the
relevant terms of the equal access scheme for effecting the off-market purchase;
Resolution 12
SEMBCORP MARINE LTDNOTICE OF ANNUAL GENERAL MEETING(Incorporated in Singapore)Company Registration No. 196300098Z
A N N U A L R E P O R T 2 0 1 8 347S E M B C O R P M A R I N E346

“Maximum Limit” means that number of issued Shares representing 10% of the total
number of issued Shares as at the date of the passing of this Resolution (excluding
treasury shares and subsidiary holdings (as defined in the Listing Manual of the SGX-ST));
and
“Maximum Price”, in relation to a Share to be purchased or acquired, means the purchase
price (excluding brokerage, commission, applicable goods and services tax and other
related expenses) which shall not exceed, whether pursuant to a market purchase or an
off-market purchase, 105% of the Average Closing Price of the Shares; and
(d) the directors and/or any of them be and are hereby authorised to complete and do all
such acts and things (including executing all such documents as may be required) as they
and/or he may consider expedient or necessary or in the interests of the Company to
give effect to the transactions contemplated and/or authorised by this Resolution.
By Order of the Board
Tan Yah Sze/Chay Suet Yee
Company Secretaries
Sembcorp Marine Limited
1 April 2019
Singapore
SEMBCORP MARINE LTDNOTICE OF ANNUAL GENERAL MEETING(Incorporated in Singapore)Company Registration No. 196300098Z
A N N U A L R E P O R T 2 0 1 8 349S E M B C O R P M A R I N E348

Explanatory Notes:
Resolutions 2 to 6 – Detailed information on these directors can be found under the Board of Directors, Corporate Governance
Report and Supplementary Information sections in the Annual Report 2018.
Resolution 2 – Resolution 2 is to approve the re-election of Mrs Gina Lee-Wan, who will retire under article 94 of the Company’s
Constitution, as a director of the Company. Upon re-election, Mrs Lee will remain as a member of the Board Risk Committee
and a member of the Special Committee. Mrs Lee is considered an independent director.
Resolution 3 – Resolution 3 is to approve the re-election of Mr Bob Tan Beng Hai, who will retire under article 94 of the
Company’s Constitution, as a director of the Company. Upon re-election, Mr Tan will remain as Chairman of the Board
Risk Committee, Chairman of the Special Committee and a member of the Executive Committee. Mr Tan is considered an
independent director.
Resolution 4 – Resolution 4 is to approve the re-election of Mr Wong Weng Sun, who will retire under article 94 of the
Company’s Constitution, as a director of the Company. Upon re-election, Mr Wong will remain as the President & CEO of the
Company and a member of the Executive Committee. Mr Wong is considered a non-independent director.
Resolution 5 – Resolution 5 is to approve the re-election of Mr Patrick Daniel, who will cease to hold office under article 100 of
the Company’s Constitution, as a director of the Company. Upon re-election, Mr Daniel will remain as a member of the Audit
Committee and a member of the Executive Resource & Compensation Committee. Mr Daniel is considered an independent
director.
Resolution 6 – Resolution 6 is to approve the re-election of Mr Tan Wah Yeow, who will cease to hold office under article 100
of the Company’s Constitution, as a director of the Company. Upon re-election, Mr Tan will remain as a member of the Audit
Committee. Mr Tan is considered an independent director.
Resolution 7 – Resolution 7 is to approve the payment of an aggregate amount of S$2,300,000 as directors’ remuneration
for the non-executive directors of the Company for the year ending 31 December 2019. The amount of directors’ fees is
computed based on the anticipated number of board and committee meetings for year 2019, assuming full attendance by
all of the non-executive directors. In the event that the amount proposed is insufficient, approval will be sought at the next
Annual General Meeting in year 2020 (“2020 AGM”) before payments are made to directors for the shortfall. Directors and their
associates will abstain from voting on Resolution 7.
The amount of directors’ remuneration approved at the Annual General Meeting in year 2018 was S$2,500,000. The total
amount of directors’ remuneration paid to the directors in year 2018 was S$2,155,375, full details of which can be found on
page 332 of the Annual Report 2018.
The current intention is that the directors’ fees for the non-executive directors for year 2019 will comprise a cash component
and a share component, with up to 30% being paid out in the form of restricted share awards under the Sembcorp Marine
Restricted Share Plan 2010 (including any extension) or new/replacement plan. Any such award would typically consist of the
grant of fully paid shares outright with no performance or vesting conditions attached, but with a selling moratorium. Under
the directors’ fee framework (which is set out on page 93 of the Annual Report 2018), non-executive directors are required
to hold shares (including shares obtained by other means) worth at least the value of their basic retainer fee of S$75,000; any
excess may be sold as desired. A non-executive director can dispose of all of his shares one year after leaving the Board.
SEMBCORP MARINE LTDNOTICE OF ANNUAL GENERAL MEETING(Incorporated in Singapore)Company Registration No. 196300098Z
A N N U A L R E P O R T 2 0 1 8 349S E M B C O R P M A R I N E348

The cash component of the directors’ fees for year 2019 is intended to be paid half-yearly in arrears. The share component of
the directors’ fees for year 2019 is intended to be paid after the 2020 AGM has been held. The actual number of shares to be
awarded to each non-executive director holding office at the time of the payment is intended to be determined by reference
to the volume-weighted average price of a share on the Singapore Exchange Securities Trading Limited (the “SGX-ST”) over
the 14 trading days from (and including) the day on which the shares are first quoted ex-dividend after the 2020 AGM (or, if no
final dividend is proposed at the 2020 AGM, or the resolution to approve any such final dividend is not approved at the 2020
AGM, over the 14 trading days immediately following the date of the 2020 AGM). The number of shares to be awarded will be
rounded down to the nearest hundred and any residual balance will be settled in cash. A non-executive director who steps
down before the payment of the share component will receive all of his directors’ fees for year 2019 (calculated on a pro-rated
basis, where applicable) in cash.
Resolution 9 – Resolution 9 is to empower the directors to issue shares of the Company and to make or grant Instruments
(such as warrants or debentures) convertible into shares, and to issue shares in pursuance of such Instruments, up to a number
not exceeding 50% of the total number of issued shares of the Company (excluding treasury shares and subsidiary holdings),
of which up to 5% may be issued other than on a pro rata basis to shareholders. The aggregate number of shares which may
be issued shall be based on the total number of issued shares of the Company (excluding treasury shares and subsidiary
holdings) at the time that Resolution 9 is passed, after adjusting for (a) new shares arising from the conversion or exercise of
any convertible securities or share options or vesting of share awards which are outstanding or subsisting at the time that
Resolution 9 is passed, and (b) any subsequent bonus issue or consolidation or subdivision of shares. As at 5 March 2019 (the
“Latest Practicable Date”), the Company had 1,155,848 treasury shares and no subsidiary holdings.
Resolution 10 – Resolution 10 is to empower the directors to offer and grant awards pursuant to the Sembcorp Marine
Performance Share Plan 2010 and the Sembcorp Marine Restricted Share Plan 2010 (collectively, the “Share Plans”) and to
issue ordinary shares of the Company pursuant to the vesting of awards granted pursuant to the Share Plans provided that:
(a) the aggregate number of (i) new ordinary shares allotted and issued and/or to be allotted and issued, (ii) existing ordinary
shares (including shares held in treasury) delivered and/or to be delivered, and (iii) ordinary shares released and/or to be
released in the form of cash in lieu of ordinary shares, pursuant to the Share Plans, shall not exceed 7% of the total number
of issued ordinary shares of the Company (excluding treasury shares and subsidiary holdings) from time to time; and (b) the
aggregate number of ordinary shares under awards to be granted pursuant to the Share Plans during the period commencing
from this Annual General Meeting and ending on the date of the next Annual General Meeting of the Company or the date
by which the next Annual General Meeting of the Company is required by law to be held, whichever is the earlier, shall not
exceed 1% of the total number of issued ordinary shares of the Company (excluding treasury shares and subsidiary holdings)
from time to time. Approval for the adoption of the Share Plans was given by shareholders at an Extraordinary General
Meeting of the Company held on 20 April 2010. The grant of awards under the Share Plans will be made in accordance with
their respective provisions.
Resolution 11 – Resolution 11 is to renew the mandate, as proposed to be modified, to enable the Company, its subsidiaries
and associated companies that are entities at risk (as that term is used in Chapter 9 of the Listing Manual), or any of them,
to enter into certain interested person transactions with specified classes of interested persons, as described in the Letter to
Shareholders dated 1 April 2019 (the “Letter”). The proposed modifications are to expand certain of the general transactions
which the EAR Group (as defined in Appendix 1 to the Letter) may enter into with Interested Persons (as defined in Appendix
1 to the Letter), in order to accommodate the overall expansion and growth of the EAR Group’s activities and product range
and also to align with the EAR Group’s current presentation of its key businesses. Please refer to the Letter for more details.
Resolution 12 – Resolution 12 is to renew the mandate to enable the Company to purchase or otherwise acquire issued
ordinary shares of the Company, on the terms and subject to the conditions set out in the resolution.
The Company intends to use internal and/or external sources of funds to finance the purchase or acquisition of its ordinary
shares. The amount of financing required for the Company to purchase or acquire its ordinary shares, and the impact on
the Company’s financial position, cannot be ascertained as at the date of this Notice as these will depend on the number of
ordinary shares purchased or acquired, the price at which such ordinary shares were purchased or acquired and whether the
ordinary shares purchased or acquired are held in treasury or cancelled.
SEMBCORP MARINE LTDNOTICE OF ANNUAL GENERAL MEETING(Incorporated in Singapore)Company Registration No. 196300098Z
A N N U A L R E P O R T 2 0 1 8 351S E M B C O R P M A R I N E350

Based on the existing issued ordinary shares as at the Latest Practicable Date and excluding any ordinary shares held in
treasury, the purchase by the Company of 10% of its issued ordinary shares (and disregarding the 1,155,848 ordinary shares
held in treasury) will result in the purchase or acquisition of 208,860,425 ordinary shares.
In the case of both market purchases and off-market purchases by the Company and assuming that the Company purchases
or acquires the 208,860,425 ordinary shares at the Maximum Price of S$1.80 for one ordinary share (being the price equivalent
to 105% of the average of the last dealt prices of the ordinary shares for the five consecutive market days on which the
ordinary shares were traded on the SGX-ST immediately preceding the Latest Practicable Date), the maximum amount of
funds required for the purchase or acquisition of the 208,860,425 ordinary shares is S$375,948,765.
The financial effects of the purchase or acquisition of such ordinary shares by the Company pursuant to the proposed
Share Purchase Mandate on the audited financial statements of the Group and the Company for the financial year ended
31 December 2018 based on these assumptions are set out in paragraph 3.7 of the Letter.
Please refer to the Letter for more details.
Notes:
1. (a) A member who is not a relevant intermediary is entitled to appoint not more than two proxies to attend, speak and vote at the Annual General Meeting. Where such member’s form of proxy appoints more than one proxy, the proportion of the shareholding concerned to be represented by each proxy shall be specified in the form of proxy.
(b) A member who is a relevant intermediary is entitled to appoint more than two proxies to attend, speak and vote at the Annual General Meeting, but each proxy must be appointed to exercise the rights attached to a different share or shares held by such member. Where such member’s form of proxy appoints more than two proxies, the number and class of shares in relation to which each proxy has been appointed shall be specified in the form of proxy.
“Relevant intermediary” has the meaning ascribed to it in Section 181 of the Companies Act, Chapter 50.
2. A proxy need not be a member of the Company.
3. The instrument appointing a proxy or proxies must be lodged at the office of the Company’s Share Registrar, KCK Corpserve Pte. Ltd., at 333 North Bridge Road #08-00, KH Kea Building, Singapore 188721 not less than 72 hours before the time appointed for holding the Annual General Meeting.
Personal data privacy:
By submitting an instrument appointing a proxy(ies) and/or representative(s) to attend, speak and vote at the Annual General
Meeting and/or any adjournment thereof, a member of the Company (i) consents to the collection, use and disclosure of the
member’s personal data by the Company (or its agents or service providers) for the purpose of the processing, administration
and analysis by the Company (or its agents or service providers) of proxies and representatives appointed for the Annual General
Meeting (including any adjournment thereof) and the preparation and compilation of the attendance lists, minutes and other
documents relating to the Annual General Meeting (including any adjournment thereof), and in order for the Company (or its
agents or service providers) to comply with any applicable laws, listing rules, take-over rules, regulations and/or guidelines
(collectively, the “Purposes”), (ii) warrants that where the member discloses the personal data of the member’s proxy(ies) and/
or representative(s) to the Company (or its agents or service providers), the member has obtained the prior consent of such
proxy(ies) and/or representative(s) for the collection, use and disclosure by the Company (or its agents or service providers) of
the personal data of such proxy(ies) and/or representative(s) for the Purposes, and (iii) agrees that the member will indemnify
the Company in respect of any penalties, liabilities, claims, demands, losses and damages as a result of the member’s breach
of warranty.
SEMBCORP MARINE LTDNOTICE OF ANNUAL GENERAL MEETING(Incorporated in Singapore)Company Registration No. 196300098Z
A N N U A L R E P O R T 2 0 1 8 351S E M B C O R P M A R I N E350

This page has been intentionally left blank.

This page has been intentionally left blank. This page has been intentionally left blank.

This page has been intentionally left blank.

PROXY FORM
Sembcorp Marine Ltd
(Incorporated in Singapore)
Company Registration No. 196300098Z
IMPORTANT1. Relevant intermediaries as defined in Section 181 of the Companies Act, Chapter
50 may appoint more than two proxies to attend, speak and vote at the Annual General Meeting.
2. For CPF/SRS investors who have used their CPF/SRS monies to buy shares in Sembcorp Marine Ltd, this Proxy Form is not valid for use and shall be ineffective for all intents and purposes if used or purported to be used by them. CPF/SRS investors should contact their respective Agent Banks/SRS Operators if they have any queries regarding their appointment as proxies.
PERSONAL DATA PRIVACYBy submitting an instrument appointing a proxy(ies) and/or representative(s), the member accepts and agrees to the personal data privacy terms set out in the Notice of Annual General Meeting dated 1 April 2019.
I/We (Name) (NRIC/Passport/Co Regn No.)
of (Address)
being a member/members of Sembcorp Marine Ltd (the “Company”) hereby appoint:
Name Address NRIC/Passport No.
Proportion of
Shareholdings (%)
and/or (delete as appropriate)
as my/our proxy/proxies to attend, speak and vote for me/us on my/our behalf at the 56th Annual General Meeting of the Company
to be held at Stephen Riady Auditorium@NTUC, NTUC Centre, Level 7, One Marina Boulevard, Singapore 018989 on Tuesday, 16 April
2019 at 11.00 am and at any adjournment thereof.
(Voting will be conducted by poll. Please indicate with a “√” in the spaces provided whether you wish your vote(s) to be cast for or
against the Resolutions as set out in the Notice of the 56th Annual General Meeting. In the absence of specific directions, the proxy/
proxies will vote or abstain as he/they may think fit, as he/they will on any other matter arising at the 56th Annual General Meeting.)
No. Ordinary Resolutions For AgainstRoutine Business
1 To adopt the Directors’ Statement and Audited Financial Statements2 To re-elect Mrs Gina Lee-Wan3 To re-elect Mr Bob Tan Beng Hai4 To re-elect Mr Wong Weng Sun5 To re-elect Mr Patrick Daniel6 To re-elect Mr Tan Wah Yeow7 To approve directors’ fees for the year ending 31 December 20198 To re-appoint KPMG LLP as Auditors and to authorise the Directors to fix their remuneration
Special Business9 To approve the renewal of the Share Issue Mandate10 To approve the renewal of the Share Plan Mandate 11 To approve the modifications to, and renewal of, the Interested Person Transactions Mandate12 To approve the renewal of the Share Purchase Mandate
Total Number of Shares Held
Signature(s) of Member(s) or Common Seal of Member(s) Date
IMPORTANT: PLEASE READ NOTES OVERLEAFThis page has been intentionally left blank.

Affix
Postage
Stamp
1st fold here
2nd fold here
3rd fold here
Notes:1. If the member has shares entered against his name in the Depository Register (maintained by The Central Depository (Pte) Limited), he should insert that
number of shares. If the member has shares registered in his name in the Register of Members (maintained by or on behalf of the Company), he should insert that number of shares. If the member has shares entered against his name in the Depository Register and shares registered in his name in the Register of Members, he should insert the aggregate number of shares. If no number is inserted, this form of proxy will be deemed to relate to all the shares held by the member.
2. (a) A member who is not a relevant intermediary is entitled to appoint not more than two proxies to attend, speak and vote at the Annual General Meeting. Where such member’s form of proxy appoints more than one proxy, the proportion of the shareholding concerned to be represented by each proxy shall be specified in the form of proxy.
(b) A member who is a relevant intermediary is entitled to appoint more than two proxies to attend, speak and vote at the Annual General Meeting, but each proxy must be appointed to exercise the rights attached to a different share or shares held by such member. Where such member’s form of proxy appoints more than two proxies, the number and class of shares in relation to which each proxy has been appointed shall be specified in the form of proxy.
“Relevant intermediary” has the meaning ascribed to it in Section 181 of the Companies Act, Chapter 50.3. A proxy need not be a member of the Company.4. The instrument appointing a proxy or proxies must be lodged at the office of the Company’s Share Registrar, KCK Corpserve Pte. Ltd., at 333 North Bridge
Road #08-00, KH Kea Building, Singapore 188721 not less than 72 hours before the time appointed for the Annual General Meeting.5. Completion and return of this instrument appointing a proxy or proxies shall not preclude a member from attending and voting in person at the Annual
General Meeting if he finds that he is able to do so. In such event, the relevant instrument appointing a proxy or proxies will be deemed to be revoked.6. The instrument appointing a proxy or proxies must be under the hand of the appointor or of his attorney duly authorised in writing. Where the instrument
appointing a proxy or proxies is executed by a corporation, it must be executed either under its seal or under the hand of an officer or attorney duly authorised. Where an instrument appointing a proxy or proxies is signed on behalf of the appointor by an attorney, the letter or power of attorney or a duly certified copy thereof must (failing previous registration with the Company) be lodged with the instrument of proxy, failing which the instrument may be treated as invalid.
7. A corporation which is a member may authorise by resolution of its directors or other governing body such person as it thinks fit to act as its representative at the Annual General Meeting, in accordance with Section 179 of the Companies Act, Chapter 50.
8. The Company shall be entitled to reject the instrument appointing a proxy or proxies if it is incomplete, improperly completed or illegible or where the true intentions of the appointor are not ascertainable from the instructions of the appointor specified in the instrument appointing a proxy or proxies (including any related attachment). In addition, in the case of members whose shares are entered against their names in the Depository Register, the Company may reject any instrument appointing a proxy or proxies lodged if such members are not shown to have shares entered against their names in the Depository Register 72 hours before the time appointed for holding the Annual General Meeting as certified by The Central Depository (Pte) Limited to the Company.
SEMBCORP MARINE LTDc/o KCK Corpserve Pte. Ltd.
333 North Bridge Road
#08-00 KH Kea Building
Singapore 188721


SEMBCORP MARINE LTD29 Tanjong Kling Road Singapore 628054Tel: +65 6265 1766 Fax: +65 6261 0738www.sembmarine.com
Co. Reg. No. 196300098Z