Financial Statements as of and for the Years Ended … the Years Ended March 31, 2016 and 2015, and...
46
Financial Statements as of and for the Years Ended March 31, 2016 and 2015, and Independent Auditors’ Report
Transcript of Financial Statements as of and for the Years Ended … the Years Ended March 31, 2016 and 2015, and...

Financial Statements as of and
for the Years Ended March 31, 2016 and 2015, and
Independent Auditors’ Report

Mitsui & Co. (U.S.A.), Inc.
Financial Statements as of and
for the Years Ended March 31, 2016 and 2015, and
Independent Auditors’ Report
Table of Contents
Independent Auditors’ Report ................................................................................................................................... 1 Statements of Financial Position ................................................................................................................................ 2
Statements of Comprehensive Income ....................................................................................................................... 3
Statements of Changes in Equity ................................................................................................................................ 4
Statements of Cash Flows ........................................................................................................................................... 5
Notes to Financial Statements:
Note 1 – Reporting Entity ............................................................................................................................................ 6
Note 2 – Basis of Financial Statements and Summary of Significant Accounting Policies......................................... 6
Note 3 – Investments in Subsidiaries and Associates ................................................................................................ 12
Note 4 – Financial Instruments and Related Matters ................................................................................................. 15
Note 5 – Receivables and Related Allowances .......................................................................................................... 21
Note 6 – Leases.......................................................................................................................................................... 22
Note 7 – Property, Plant, and Equipment ................................................................................................................... 24
Note 8 – Financial Liabilities .................................................................................................................................... 25
Note 9 – Employee Benefits ...................................................................................................................................... 27
Note 10 – Accumulated Other Comprehensive Income (Loss) ................................................................................... 30
Note 11 – Selling, General, and Administrative Expenses .......................................................................................... 31
Note 12 – Income Taxes .............................................................................................................................................. 31
Note 13 – Fair Value Measurement ............................................................................................................................. 33
Note 14 – Contingent Liabilities .................................................................................................................................. 36
Note 15 – Related Party Transactions .......................................................................................................................... 38
Note 16 – Ultimate Parent and Controlling Party ........................................................................................................ 40
Note 17 – Subsequent Events ...................................................................................................................................... 40
Note 18 – Authorization of Issuance of Financial Statements ..................................................................................... 40

(This page has been left blank intentionally.)

1
INDEPENDENT AUDITORS’ REPORT To the Board of Directors of Mitsui & Co. (U.S.A.), Inc.: We have audited the accompanying financial statements of Mitsui & Co. (U.S.A.), Inc. (the ‘‘Company’’) (an ultimate wholly-owned subsidiary of Mitsui & Co., Ltd.), which comprise the statements of financial position as of March 31, 2016 and 2015, and the related statements of comprehensive income, changes in equity, and cash flows for the years then ended, and the related notes to the financial statements. Management’s Responsibility for the Financial Statements Management is responsible for the preparation and fair presentation of these financial statements in accordance with International Financial Reporting Standards as issued by the International Accounting Standards Board; this includes the design, implementation, and maintenance of internal control relevant to the preparation and fair presentation of financial statements that are free from material misstatement, whether due to fraud or error. Auditors’ Responsibility Our responsibility is to express an opinion on these financial statements based on our audits. We conducted our audits in accordance with auditing standards generally accepted in the United States of America. Those standards require that we plan and perform the audit to obtain reasonable assurance about whether the financial statements are free from material misstatement. An audit involves performing procedures to obtain audit evidence about the amounts and disclosures in the financial statements. The procedures selected depend on the auditor’s judgment, including the assessment of the risks of material misstatement of the financial statements, whether due to fraud or error. In making those risk assessments, the auditor considers internal control relevant to the Company’s preparation and fair presentation of the financial statements in order to design audit procedures that are appropriate in the circumstances, but not for the purpose of expressing an opinion on the effectiveness of the Company’s internal control. Accordingly, we express no such opinion. An audit also includes evaluating the appropriateness of accounting policies used and the reasonableness of significant accounting estimates made by management, as well as evaluating the overall presentation of the financial statements. We believe that the audit evidence we have obtained is sufficient and appropriate to provide a basis for our audit opinion. Opinion In our opinion, the financial statements referred to above present fairly, in all material respects, the financial position of the Company as of March 31, 2016 and 2015, and the results of its operations and its cash flows for the years then ended, in accordance with International Financial Reporting Standards as issued by the International Accounting Standards Board. Emphasis of Matter As discussed in Note 15 to the financial statements, the Company has extensive transactions with Mitsui & Co., Ltd. and its subsidiaries and affiliates. Accordingly, the accompanying financial statements may not be indicative of the financial position, the results of its operations or its cash flows which would have been attained by the Company if it had operated without such affiliations. Our opinion is not modified with respect to this matter. New York, NY
June 17, 2016
2
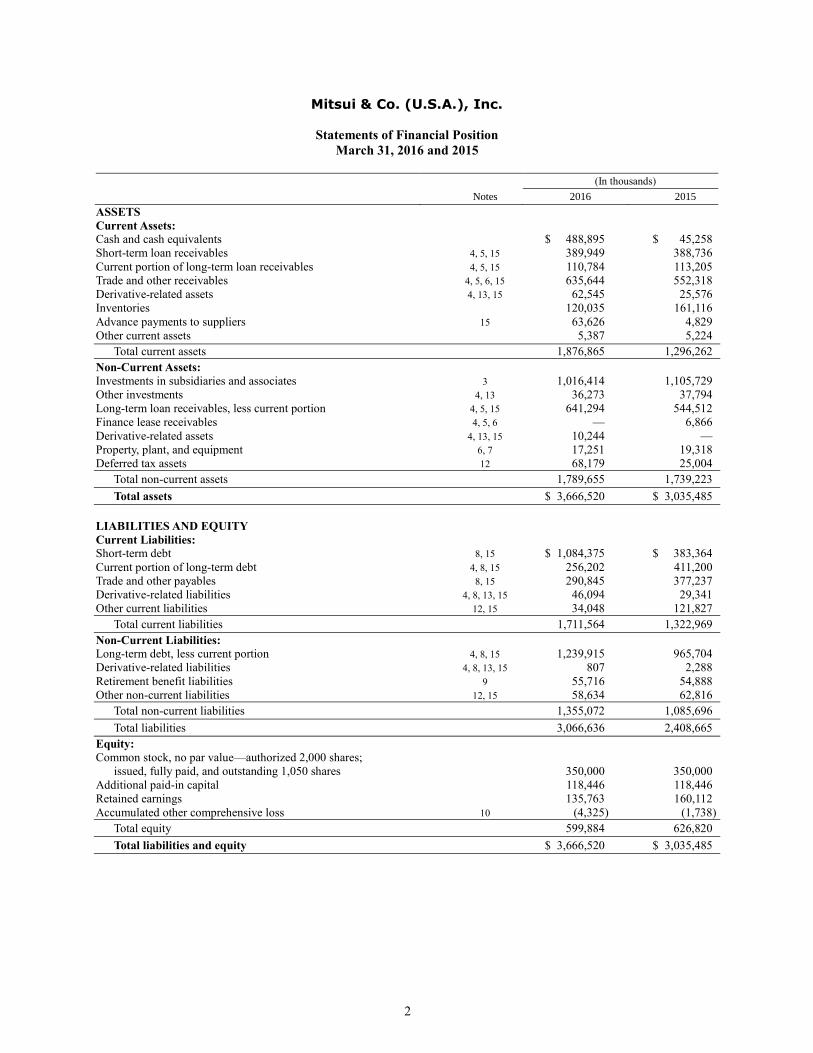
Mitsui & Co. (U.S.A.), Inc.
Statements of Financial Position
March 31, 2016 and 2015
(In thousands)
Notes 2016 2015
ASSETS
Current Assets:
Cash and cash equivalents $ 488,895 $ 45,258
Short-term loan receivables 4, 5, 15 389,949 388,736
Current portion of long-term loan receivables 4, 5, 15 110,784 113,205
Trade and other receivables 4, 5, 6, 15 635,644 552,318
Derivative-related assets 4, 13, 15 62,545 25,576
Inventories 120,035 161,116
Advance payments to suppliers 15 63,626 4,829
Other current assets 5,387 5,224
Total current assets 1,876,865 1,296,262
Non-Current Assets:
Investments in subsidiaries and associates 3 1,016,414 1,105,729
Other investments 4, 13 36,273 37,794
Long-term loan receivables, less current portion 4, 5, 15 641,294 544,512
Finance lease receivables 4, 5, 6 — 6,866
Derivative-related assets 4, 13, 15 10,244 —
Property, plant, and equipment 6, 7 17,251 19,318
Deferred tax assets 12 68,179 25,004
Total non-current assets 1,789,655 1,739,223
Total assets $ 3,666,520 $ 3,035,485
LIABILITIES AND EQUITY
Current Liabilities:
Short-term debt 8, 15 $ 1,084,375 $ 383,364
Current portion of long-term debt 4, 8, 15 256,202 411,200
Trade and other payables 8, 15 290,845 377,237
Derivative-related liabilities 4, 8, 13, 15 46,094 29,341
Other current liabilities 12, 15 34,048 121,827
Total current liabilities 1,711,564 1,322,969
Non-Current Liabilities:
Long-term debt, less current portion 4, 8, 15 1,239,915 965,704
Derivative-related liabilities 4, 8, 13, 15 807 2,288
Retirement benefit liabilities 9 55,716 54,888
Other non-current liabilities 12, 15 58,634 62,816
Total non-current liabilities 1,355,072 1,085,696
Total liabilities 3,066,636 2,408,665
Equity:
Common stock, no par value—authorized 2,000 shares;
issued, fully paid, and outstanding 1,050 shares 350,000 350,000
Additional paid-in capital 118,446 118,446
Retained earnings 135,763 160,112
Accumulated other comprehensive loss 10 (4,325) (1,738)
Total equity 599,884 626,820
Total liabilities and equity $ 3,666,520 $ 3,035,485

3
Mitsui & Co. (U.S.A.), Inc.
Statements of Comprehensive Income
Years Ended March 31, 2016 and 2015
(In thousands)
Notes 2016 2015
Revenue:
Sales of products $ 2,898,335 $ 2,948,361
Revenue from rendering of services 14,895 25,859
Total revenue 15 2,913,230 2,974,220
Cost of Revenue:
Cost of products sold (2,867,454) (2,925,439)
Cost of services rendering (54) (2,542)
Total cost of revenue 7 (2,867,508) (2,927,981)
Gross Profit 45,722 46,239
Other Income (Expenses):
Selling, general, and administrative expenses 6, 7, 11 (151,136) (144,461)
Other income 3, 4, 6, 7, 15 85,484 75,225
Other expense 3, 4, 6, 7, 13 (65,848) (44,935)
Total other expenses—net (131,500) (114,171)
Finance Income (Cost):
Interest income 4, 15 18,571 22,045
Dividend income 4 188,762 219,618
Interest expense 4, 15 (22,703) (21,916)
Total finance income—net 184,630 219,747
Profit before Income Taxes 98,852 151,815
Income Tax Benefit 12 45,829 17,257
Profit for the Year Attributable to Owner of the Company 144,681 169,072
Other Comprehensive Income (Loss):
Items that will not be reclassified to profit or loss:
Remeasurements of equity instruments 10 (5,087) (1,649)
Remeasurements of defined benefit plans 9, 10 1,142 (17,576)
Income tax relating to items not reclassified to profit or loss 10 1,399 7,073
Total other comprehensive loss (2,546) (12,152)
Comprehensive Income for the Year Attributable to Owner of the Company $ 142,135 $ 156,920
4
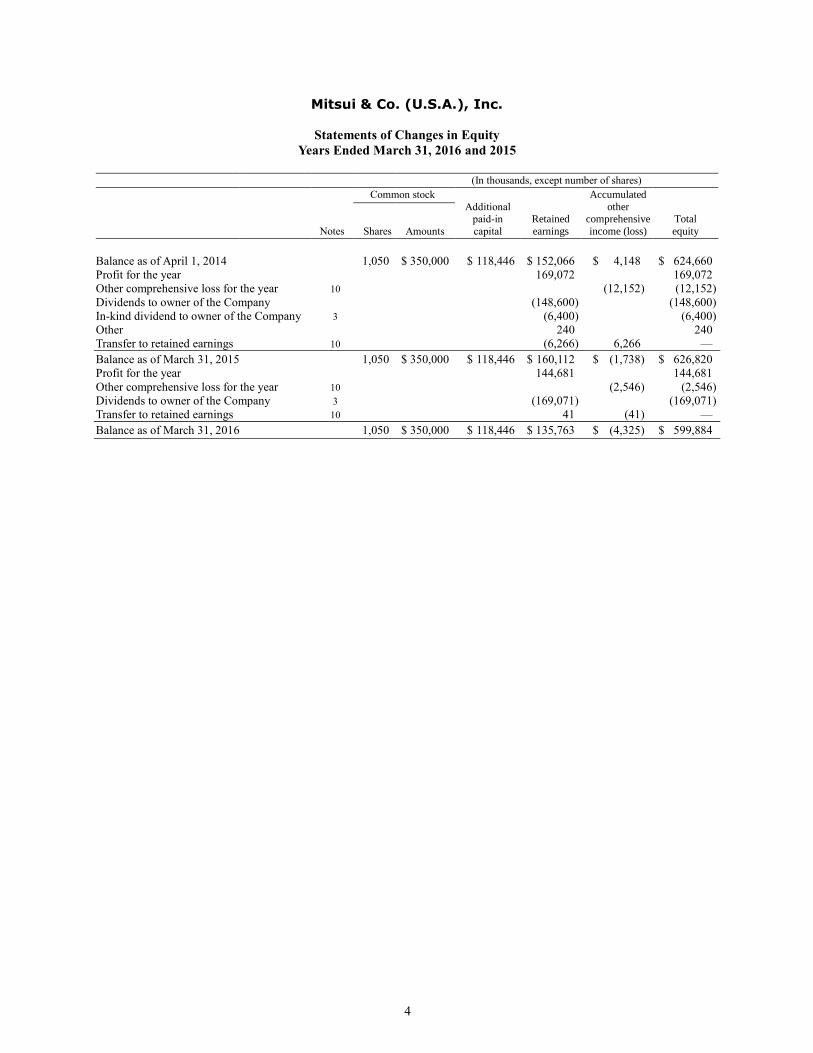
Mitsui & Co. (U.S.A.), Inc.
Statements of Changes in Equity
Years Ended March 31, 2016 and 2015
(In thousands, except number of shares)
Common stock
Additional paid-in
capital
Retained
earnings
Accumulated
other comprehensive
income (loss)
Total
equity
Notes Shares Amounts
Balance as of April 1, 2014 1,050 $ 350,000 $ 118,446 $ 152,066 $ 4,148 $ 624,660
Profit for the year 169,072 169,072
Other comprehensive loss for the year 10 (12,152) (12,152)
Dividends to owner of the Company (148,600) (148,600)
In-kind dividend to owner of the Company 3 (6,400) (6,400)
Other 240 240
Transfer to retained earnings 10 (6,266) 6,266 —
Balance as of March 31, 2015 1,050 $ 350,000 $ 118,446 $ 160,112 $ (1,738) $ 626,820
Profit for the year 144,681 144,681
Other comprehensive loss for the year 10 (2,546) (2,546)
Dividends to owner of the Company 3 (169,071) (169,071)
Transfer to retained earnings 10 41 (41) —
Balance as of March 31, 2016 1,050 $ 350,000 $ 118,446 $ 135,763 $ (4,325) $ 599,884

5
Mitsui & Co. (U.S.A.), Inc.
Statements of Cash Flows
Years Ended March 31, 2016 and 2015
(In thousands)
2016 2015
Operating Activities:
Profit for the year $ 144,681 $ 169,072
Adjustments to reconcile profit for the year to net cash provided by (used in) operating
activities:
Depreciation and amortization 2,319 4,872
Provision for doubtful receivables 1,852 (2,395)
Loss on investments—net 51,270 17,705
Gain on sales of finance lease receivables—net — (2,152)
Impairment loss and loss on sales of property, plant, and equipment—net — 1,657
Finance income—net (184,630) (219,747)
Income tax benefit (45,829) (17,257)
Changes in operating assets and liabilities:
Change in trade and other receivables (85,396) 362,186
Change in inventories 41,081 (9,881)
Change in advance payments to suppliers (58,797) (1,996)
Change in trade and other payables (86,730) (15,286)
Other—net (58,416) 169,163
Interest received 18,113 22,196
Interest paid (22,365) (23,264)
Dividends received 147,292 206,311
Income taxes (paid) received (7,438) 14,027
Net cash provided by (used in) operating activities (142,993) 675,211
Investing Activities:
Additional investments (39,255) (46,839)
Return of capital on investments 18,463 204,626
Proceeds from sales of investments 29,667 41,660
Net change in short-term loan receivables of three months or less (1,212) 246,202
Issuance of loan receivables of more than three months (275,432) (215,407)
Collections of loan receivables of more than three months 181,070 188,565
Collections of finance lease receivables 7,542 21,861
Proceeds from sales of finance lease receivables — 153,785
Proceeds from sales of property, plant, and equipment — 23,987
Purchases of property, plant, and equipment (281) (539)
Net cash provided by (used in) investing activities (79,438) 617,901
Financing Activities:
Net change in short-term debt of three months or less 702,011 (872,984)
Proceeds from debt of more than three months 164,198 841,250
Repayments of debt of more than three months (48,370) (1,139,771)
Dividends paid (151,771) (148,600)
Net cash provided by (used in) financing activities 666,068 (1,320,105)
Net Change in Cash and Cash Equivalents 443,637 (26,993)
Cash and Cash Equivalents at Beginning of Year 45,258 72,251
Cash and Cash Equivalents at End of Year $ 488,895 $ 45,258
Supplemental Cash Flow Information:
Non-cash investing and financing activities:
Assets received from subsidiaries and associates as capital returns and
in-kind dividends (Notes 3 and 4) $ 47,756 $ —
Debt assumed by a buyer on sale of finance leases (leveraged leases) (Note 8) — 22,979
Settlement of receivable with owner of the Company (Note 3) 17,300 —
In-kind dividend to owner of the Company (Note 3) — 6,400
Issuance and collections of loan receivables of more than three months (Note 15) 410,053 131,492
Proceeds and repayments of debt of more than three months (Note 15) 420,342 356,000

Notes to Financial Statements (In thousands, except where otherwise noted)
6
1. Reporting Entity
Mitsui & Co. (U.S.A.), Inc. (“Mitsui USA” or the “Company”) is a company incorporated in the United States.
Mitsui USA is a wholly-owned subsidiary of MBK USA Holdings, Inc. (“MUH”), which is a wholly-owned
subsidiary of Mitsui & Co., Ltd. (“Mitsui Japan” or the “Parent”). Mitsui USA was directly owned by Mitsui
Japan until March 31, 2014.
Mitsui USA as well as Mitsui Japan are general trading companies (Sogo Shosha) which engage in trading
activities worldwide. The Company is engaged in business activities such as trading in various commodities,
financing for customers and suppliers relating to such trading activities and organizing and coordinating industrial
projects through its business networks. The Company conducts sales, export, import and offshore trades in the
areas of ‘‘Iron & Steel Products,’’ ‘‘Mineral & Metal Resources,’’ ‘‘Infrastructure Projects,’’ ‘‘Integrated
Transportation Systems,’’ ‘‘Chemicals,’’ “Energy,” “Foods & Retail,” “Consumer Service Business,” and others,
each having a diverse customer base, while providing general services for retailing, information and
communications, technical support, transportation and logistics and financing. The Company has significant
transactions with Mitsui Japan and its subsidiaries and affiliates.
2. Basis of Financial Statements and Summary of Significant Accounting Policies
Statement of Compliance with International Financial Reporting Standards
The financial statements have been prepared in accordance with International Financial Reporting Standards
(“IFRS”) as issued by the International Accounting Standards Board (“IASB”).
Separate Financial Statements
The financial statements have been prepared in accordance with the International Accounting Standards (“IAS”)
27, Separate Financial Statements. The financial statements present information about the Company as an
individual entity and do not include accounts of its subsidiaries over which the Company has control. Investments
in subsidiaries and associates are accounted for under the cost method. Associates are those over which the
Company is able to exercise significant influence. The ultimate parent company of the Company, Mitsui Japan,
prepares consolidated financial statements in accordance with IFRS.
The Company’s financial statements are prepared on the historical cost basis, except for certain financial assets
or liabilities that are measured at fair value and retirement benefit liabilities that are measured based on the
accounting policies described in the later section. The financial statements are presented in U.S. dollars, which is
the functional currency of the Company. All financial information presented in U.S. dollars has been rounded to
the nearest thousands, except as otherwise indicated.
Use of Estimates and Judgments
The preparation of financial statements requires management to make certain estimates and assumptions that
affect the reported amounts of assets and liabilities and disclosure of contingent assets and liabilities at the date
of the financial statements, as well as the reported amounts of revenues and expenses during the reporting period.
Actual results could differ from those estimates. The judgments based on assumptions and estimates are reviewed
on an ongoing basis.
Management has made the following judgments and estimates which have the most significant effect on the
amounts recognized in the financial statements:
Impairment loss on investments in subsidiaries and associates – Note 3
Revaluation of financial instruments – Notes 4, 5, and 13
Allowance for doubtful receivables – Note 5
Impairment loss on property, plant, and equipment – Note 7
Measurement of defined benefit obligations – Note 9
Recoverability of deferred tax assets – Note 12
Notes to Financial Statements (In thousands, except where otherwise noted)
7
Fair value measurement – Note 13
Contingent liabilities – Note 14
Summary of Significant Accounting Policies
The accounting policies described below have been applied consistently to all periods presented in these financial
statements.
Foreign currency transactions
Foreign currency transactions are translated into U.S. dollars using the spot exchange rate at the date of
transactions. Monetary assets and liabilities denominated in foreign currencies are remeasured in U.S. dollar
amounts using year-end exchange rates and the resulting gains and losses are recognized in earnings. During the
years ended March 31, 2016 and 2015, net foreign exchange gains were $63 and $230, respectively, and included
in other income in the accompanying statements of comprehensive income.
Investments in subsidiaries and associates
The Company prepares separate financial statements and accounts for investments in subsidiaries and associates
at cost less impairment.
Financial instruments
The Company has early adopted IFRS 9 (2013), Financial Instruments. A financial instrument is any contract that
gives rise to a financial asset of one entity and a financial liability or equity instrument of another entity. Financial
assets of the Company mainly include cash and cash equivalents, trade and other receivables, loan receivables,
equity instruments, and derivative instruments with a positive fair value. Financial liabilities of the Company
mainly comprise notes and loans due to financial institutions and affiliated companies, trade and other payables,
and derivative instruments with a negative fair value.
Financial instruments are recognized in the accompanying statements of financial position when the Company
becomes a party to the contractual provisions of the instruments. All regular way purchases and sales of financial
assets are recognized on the trade date, which is the date that the Company commits to purchase or sell the asset.
Regular way transactions require delivery of assets within the timeframe generally established by regulation or
convention in the market place.
Cash equivalents – Cash equivalents are highly-liquid short-term investments with an original maturity of three
months or less that are readily convertible into cash and have no significant risk of change in value. Such cash
equivalents include time deposits and commercial paper with original maturities of three months or less.
Trade and other receivables and loan receivables – Trade and other receivables and loan receivables are measured
at amortized cost using the effective interest method, less any impairment losses. Impairment losses on receivables
are recognized using separate allowance accounts. Gains and losses are recognized in the accompanying
statements of comprehensive income when the loans and receivables are derecognized or impaired.
The Company recognizes allowances for doubtful receivables on an individual basis for receivables that are
considered to have been impaired based on the latest information, or upon events, such as the debtor’s bankruptcy,
financial failure, or failure to repay debts due to financial difficulty, even if the debtor is not yet in financial failure.
Impairment losses are measured by using the present value of expected future cash flows, discounted at the
effective interest rate based on the original terms of the contract, or fair value of the collateral if its value depends
on the collateral. The resulting value is compared to the carrying value of the financial asset and the difference
between the two values is recognized in profit or loss. After an impairment loss is recognized, interest income
continues to be recognized on the reduced carrying amount using the same discount rate used to discount the
expected future cash flows when the impairment loss was measured. If the fair value of previously impaired
receivables subsequently recovers due to factors occurring after the recognition of impairment, a reversal of
impairment loss is recognized in profit or loss. The reversal amount is deducted from the related provision for
receivables.
Notes to Financial Statements (In thousands, except where otherwise noted)
8
For receivables for which allowances are not recognized on an individual basis, the Company records an
allowance for doubtful receivables collectively based primarily on the Company’s credit loss experiences and the
current economic environment.
Equity instruments – Equity instruments (except for investments in subsidiaries and associates) are measured at
fair value through profit or loss (“FVTPL”). However, for certain equity instruments held primarily for the
purpose of enhancing the revenue base by maintaining or strengthening the trade relationship with the investees,
the Company elects at initial recognition to designate these instruments at fair value through other comprehensive
income (“FVTOCI”). When equity instruments measured at FVTOCI are derecognized, the accumulated other
comprehensive income (loss) is directly transferred to retained earnings without being recognized in profit or loss.
Dividend income received on those measured at FVTOCI is recognized in profit or loss.
Finance income and cost – Finance income and cost include interest income, interest expense, dividend income,
and gain or loss from derivatives instruments that were used to hedge financial assets and liabilities. Interest
income and interest expense are recognized using the effective interest method. Dividend income is recognized
on the date when the right of the Company to receive the dividends vest.
Derivative instruments and hedging activities – Derivative financial instruments, such as foreign currency
exchange contracts, foreign currency and interest rate swap contracts, commodity futures and forward contracts,
and contingent earnouts are measured at fair value. Changes in the fair value of derivative financial instruments
are recognized in profit or loss. Derivative instrument held for the purpose of eliminating the risk of changes in
the fair value of hedged items are designated as fair value hedge and subject to the assessment of hedge
effectiveness. To the extent that they satisfy the requirements for hedge accounting, any changes in fair value are
recognized in profit or loss together with the corresponding changes in fair value of hedged item. Currently, the
Company does not hold derivative instruments for cash flow hedge purposes.
Trade and other payable and debt – Trade and other payables and debt are measured at amortized cost.
Offsetting financial assets and financial liabilities – Financial assets and financial liabilities are offset and the net
amount is presented in the accompanying statements of financial position when, and only when, the Company
currently has a legally enforceable right to set-off the recognized amounts and intends either to settle on a net
basis, or to realize the asset and settle the liability simultaneously.
Leasing
The Company as lessor – For finance leases, unearned income is amortized to income over the lease term at a
constant periodic rate of return on the net investment. Initial direct costs of finance leases are deferred and
amortized using the interest method over the lease period. Finance lease income, net of direct amortization cost,
is included in interest income. For operating leases, income is recognized as revenue over the term of underlying
leases on a straight-line basis. The Company sold property leased to others under operating leases during the year
ended March 31, 2015.
The Company as lessee – Lease expenses on operating leases are recognized over the respective lease terms on a
straight-line basis.
Property, plant, and equipment
Property, plant, and equipment are recorded at cost. Depreciation of property, plant, and equipment is provided
over the estimated useful lives (ranging from 3 to 33 years) of such assets using the straight-line method.
Leasehold improvements are amortized using the straight-line method over the lesser of the useful life of the
improvement or the remaining term of the underlying lease. Significant renewals and additions are capitalized at
cost. Expenditures for improvements and betterments of operating rental properties are capitalized. Maintenance,
repairs, and minor renewals and betterments are charged to expense as incurred.
Notes to Financial Statements (In thousands, except where otherwise noted)
9
Impairment of non-financial assets and investments in subsidiaries and associates
The Company periodically performs analyses to determine whether there is any indication of impairment of non-
financial assets and investments in subsidiaries and associates. If any such indication exists, the recoverable
amounts of the non-financial assets and the investments are estimated.
The recoverable amount of an asset or a cash-generating unit (“CGU”) is the higher of its fair value, less costs of
disposal, and its value in use and is determined for an individual asset when the asset generates cash inflows that
are largely independent of those from other assets or groups of assets. Where the carrying amount of an asset or
CGU exceeds its recoverable amount, the asset is considered impaired and the carrying amount is written down
to its recoverable amount with the impairment loss recognized in profit or loss. An assessment is made at each
reporting date as to whether there is any indication that previously recognized impairment losses may no longer
exist or may have decreased. A previously recognized impairment loss is reversed and included in other income
only if there has been a change in the assumptions used to determine the recoverable amount of the asset since
the last impairment loss was recognized.
Inventories
Inventories, consisting of commodities and materials for sale, are measured at the lower of cost or net realizable
value. The costs of inventory of items that are not ordinarily interchangeable are assigned by using specific
identification of their individual costs. For those items which are interchangeable, the costs are mainly assigned
by using the weighted average cost formula.
Revenue recognition
Revenue is recognized as follows:
Sale of products – Revenues from sale of products include those arising from the sale of various products such as
metals, chemicals, foods, and general consumer merchandise. The Company acts as a principal in the sales
transactions and recognizes revenues on a gross basis when all of the following conditions are satisfied:
Significant risks and rewards of the goods have been transferred to the buyer;
Neither continuing managerial involvement to the degree usually associated with ownership nor effective
control over the goods sold is retained;
The amount of revenue can be measured reliably;
It is probable that the economic benefits associated with the transaction will flow to the Company; and
The costs incurred or to be incurred in respect of the transaction can be measured reliably.
These conditions are usually considered to have been met at the time of delivery and when conditions agreed
upon with customers are satisfied.
Revenue from rendering of services – Revenues from rendering of services include those arising from trading
margins and commissions related to various trading transactions in which the Company acts as a principal or an
agent. Specifically, the Company charges a commission for the performance of various services such as logistic
and warehouse services, information and communication services, and technical support. For certain back-to-
back sales and purchase transactions of products, the Company acts as an agent and records the net amount of
sales and purchase prices as revenues. All other sales of services in which the Company acts as principal are
recorded on a gross basis. The determination of whether the Company acts as a principal or agent in a transaction
is based on an evaluation of the terms of a transaction with respect to exposure to the risks and rewards associated
with the sale of products or rendering of services. Revenues from service-related businesses are recorded as
revenue when all of the following conditions are satisfied:
The amount of revenue can be measured reliably;
It is probable that the economic benefits associated with the transaction will flow to the Company;
The stage of completion of the transaction at the end of reporting period can be measured reliably; and
The costs incurred for the transaction and the costs to complete the transaction can be measured reliably.

Notes to Financial Statements (In thousands, except where otherwise noted)
10
These conditions are usually considered to have been met when the contracted services are rendered to third-party
customers pursuant to the agreements.
Employee benefits
The cost of providing benefits under the defined benefit plans is determined using the projected unit credit method,
which attributes entitlement to benefits to the current period (to determine current service cost) and to the current
and prior periods (to determine the present value of defined benefit obligations) and is based on actuarial advice.
Past service costs are recognized immediately as part of the current service cost. When a plan amendment,
settlement (eliminating all obligations for benefits already accrued), or a curtailment (reducing future obligations
as a result of a significant reduction in the plan membership or a reduction in future entitlement) occurs, the
obligations and related plan assets are remeasured using current actuarial assumptions and the resulting gain or
loss recognized in earnings during the period in which the plan amendment, settlement, or curtailment occurs.
The interest element of the defined benefit cost represents the change in present value of plan obligations resulting
from the passage of time, and is determined by applying the discount rate to the opening present value of the
benefit obligations, taking into account material changes in the obligations during the year. The expected return
on plan assets is based on a long-term market return assumption that is automatically set equal to the discount
rate used to value the benefit obligations, and then adjusted for the effect on the fair value of plan assets of
contributions received and benefits paid during the year. All components of net pension cost are presented as a
single net amount and included in selling, general, and administrative expenses in the accompanying statements
of comprehensive income. The remeasurements of defined benefit plans are recognized in other comprehensive
income (loss) and are transferred immediately to retained earnings.
Retirement benefit liabilities in the accompanying statements of financial position comprise the total of the present
value of the defined benefit obligations, less the fair value of plan assets out of which the obligations are to be
settled directly.
The Company and certain participating affiliated companies share the costs of the defined benefit pension plan.
See Note 9 for further discussion.
The Company also has defined contribution plans. Payments to defined contribution plans are recognized as an
expense when employees have rendered service.
Income taxes
The Company records income taxes based on IAS 12, Income Taxes.
Income taxes comprise current taxes and deferred taxes. Income tax expense is calculated based on profit before
income taxes. Deferred income taxes reflect the impact of temporary differences between assets and liabilities
recognized for financial reporting purposes and their tax bases, tax loss carryforwards, and tax credit
carryforwards. These deferred income taxes are measured using the currently enacted or substantively enacted
tax rates in effect for the year in which the temporary differences, tax loss carryforwards, or tax credit
carryforwards are expected to reverse.
Deferred tax assets are recognized only with respect to unused tax losses, unused tax credits, and deductible
temporary differences where it is probable to reduce future taxable income. The recoverability of deferred tax
assets is reviewed at the end of each period and the Company reduces the carrying amount of a deferred tax asset
to the extent that it is no longer probable that sufficient taxable profit will be available to allow the benefit of part
or all of that deferred tax asset to be utilized.
Deferred tax liabilities arising from taxable temporary differences concerning investments in subsidiaries and
associates are recognized unless the Company is able to control the timing of the reversal of the temporary
differences and it is probable that the temporary difference will not reverse in the foreseeable future.
As of April 1, 2014, the Company joined the MUH federal consolidated tax group, and the Company’s operations
are included in the consolidated federal income tax return of MUH. The Company records its current and deferred
income tax provision as if it were a separate taxable entity. The Company includes in its income tax provision the
Notes to Financial Statements (In thousands, except where otherwise noted)
11
tax effect of profits and losses of partnerships and limited liability companies that do not have a tax sharing
agreement with the Company.
The Company recognizes uncertain tax positions in income taxes in the financial statements when it is probable
that an economic outflow would occur if the tax positions were examined and challenged by tax authorities.
Provisions
Provisions are recognized when the Company has a present obligation (legal or constructive) as a result of a past
event, it is probable that outflows of resources embodying economic benefits will be required to settle the
obligation, and the reliable estimates of the amount of the obligation can be made. Provisions are measured as the
best estimate of the amount of expenditure required to settle the present obligation at the end of the reporting
period. If the effect of the time value of money is material, provisions are discounted to their present value using
a pre-tax rate that reflects current market assessments of the time value of money and the risks specific to the
liability. The unwinding of the discount is recognized as finance costs.
Financial guarantees
A financial guarantee contract is a contract that requires the Company to make specified payments to reimburse
the holder for a loss it incurs because a specified debtor fails to make payment when due. Financial guarantee
contracts are initially recognized at fair value and are subsequently measured at the greater of the best estimate of
the likely outflow and the amount initially recognized less, where appropriate, cumulative amortization.
Reclassifications, Restatements, and Financial Statement Presentations
Advance payments to suppliers were previously included in other current assets in the statement of financial
position at March 31, 2015. At March 31, 2016, the Company presented advance payments to suppliers in a
separate line item in the statement of financial position since the balance was significant. Prior year comparative
of $4,829 at March 31, 2015 has been reclassified from other current assets to advance payments to suppliers in
the statements of financial positions.
Subsequent to the issuance of the Company’s financial statements as of and for the year ended March 31, 2015,
the Company determined that certain non-cash transactions were included in the statements of cash flows
previously reported. As a result, prior year comparative for the year ended March 31, 2015 has been restated by
excluding non-cash transactions in investing activities of $131,492 and non-cash transactions in financing
activities of $356,000 from the statement of cash flows and disclosing those non-cash transactions as supplemental
cash flow information. The restatement had no impact on the Company’s financial position, result of operations,
or total cash flows from operating, investing, or financing activities.
New Accounting Standards
In August 2014, the IASB issued amendments to IAS 27, Equity Method in Separate Financial Statements. These
amendments permit entities to use the equity method to account for investments in subsidiaries, joint ventures,
and associates in their separate financial statements. These amendments are effective for the Company from the
fiscal year beginning April 1, 2016. The Company is currently evaluating the impact of adoption of these
amendments on its financial statements.
In January 2016, the IASB issued amendments to IAS 7, Statement of Cash Flows, to require entities to provide
disclosures that enable users of financial statements to evaluate changes in liabilities arising from financial
activities. These amendments are effective for the Company from the fiscal year beginning April 1, 2017, with
earlier application permitted. It requires new disclosures only and will have no impact on the Company’s financial
position, result of operations or cash flows.
In May 2014, the IASB issued IFRS 15, Revenue from Contracts with Customers. IFRS 15 establishes a single
comprehensive model for entities to use in accounting for revenue arising from contract with customers. The core
principle of this standard is that revenue is recognized to depict the transfer of promised goods or services to
customers in an amount that reflects the consideration to which the entity expects to be entitled in exchange for
those goods or services. IFRS 15 also requires extensive disclosures related to revenue recognition. In September
Notes to Financial Statements (In thousands, except where otherwise noted)
12
2015, the IASB deferred the effective date. This standard is effective for the Company from the fiscal year
beginning April 1, 2018, with earlier application permitted. The Company is currently evaluating the impact of
adoption of this standard on its financial statements.
In July 2014, the IASB issued amendments to IFRS 9, mainly to include impairment requirements for financial
assets and limited amendments to the classification and measurement requirements by introducing a fair value
through other comprehensive income measurement category for certain debt instruments. These amendments are
effective for the Company from the fiscal year beginning April 1, 2018, with earlier application permitted. The
Company is currently evaluating the impact of adoption of these amendments on its financial statements.
In January 2016, the IASB issued IFRS 16, Leases. IFRS 16 requires a lessee to recognize assets and liabilities
for all leases with a term of more than 12 months, unless the underlying asset is of low value, and depreciation of
lease assets separately from interest on lease liabilities in the statement of comprehensive income. IFRS 16 does
not introduce any significant change in lessor accounting, and accordingly, a lessor continues to classify its leases
as operating leases or finance leases. This standard is effective for the Company from the fiscal year beginning
April 1, 2019, with earlier application permitted. The Company is currently evaluating the impact of adoption of
this standard on its financial statements.
3. Investments in Subsidiaries and Associates
The Company prepares separate financial statements and records investments in subsidiaries and associates at
cost less impairment. The changes in the investments in subsidiaries and associates for the years ended March 31,
2016 and 2015 consisted of the following:
Investments in Investments in
subsidiaries associates Total
Balance at April 1, 2014 $ 1,085,397 $ 243,940 $ 1,329,337
Additions 17,138 15,449 32,587
Disposals (11,625) (14,211) (25,836)
Capital returns (190,255) (14,369) (204,624)
Impairment (24,991) (744) (25,735)
Reclassification (24,796) 24,796 —
Balance at March 31, 2015 $ 850,868 $ 254,861 $ 1,105,729
Additions 8,383 26,721 35,104
Disposals — (60,422) (60,422)
Capital returns (13,488) (11,261) (24,749)
Impairment (39,248) — (39,248)
Balance at March 31, 2016 $ 806,515 $ 209,899 $ 1,016,414
The followings are significant activities reflected in the table above:
Additions
Additions to investments in subsidiaries during the year ended March 31, 2016 mainly relate to the establishment
of wholly owned subsidiaries, namely, Engine Leasing 4, LLC, Engine Leasing 5, LLC, and Engine Leasing 6,
LLC with an initial aggregate investment of approximately $8.3 million.
Additions to investments in associates during the year ended March 31, 2016 mainly relate to the acquisition of
shares in Bluegrass Farms of Ohio Inc. and an additional investment in Yorozu Automotiva do Brasil Ltda. in the
amount of approximately $9.0 million and $6.2 million, respectively.
Additions to investments in subsidiaries during the year ended March 31, 2015 mainly relate to the establishment
of wholly owned subsidiaries, namely, Acieta, LLC with an initial investment of approximately $7.0 million and
Engine Leasing 1, LLC, Engine Leasing 2, LLC, and Engine Leasing 3, LLC with an initial aggregate investment
of approximately $8.3 million.
Notes to Financial Statements (In thousands, except where otherwise noted)
13
Disposals
Disposals in investments in associates during the year ended March 31, 2016 included the sale of all the
Company’s shares in Ellison Technologies, Inc. (“Ellison”) to MUH, Multiexport Pacific Farms S.A. to Mitsui
Japan, and Transfreight, LLC to a third party for a selling price of approximately $17.3 million, $20.7 million,
and $7.0 million, respectively. The Company recorded gain and loss on these sales of approximately $10.5 million
in other income and approximately $21.0 million in other expense, respectively, in the accompanying statement
of comprehensive income for the year ended March 31, 2016. The receivable from MUH of $17.3 million from
the sale of Ellison was settled by offsetting with a dividend distribution of the same amount during the year ended
March 31, 2016.
Disposals in investments in subsidiaries during the year ended March 31, 2015 mainly relate to the sale of all the
Company’s shares in Argo Sales Ltd. to a third party for a selling price of approximately $10.7 million. The
disposals in investments in associates during the year ended March 31, 2015 included the sale of all the
Company’s shares in Acero Prime, S. de. R.L. de C.V. to a third party for a selling price of approximately $3.9
million and Mitsui Rail Capital, LLC to Mitsui Japan for a selling price of approximately $12.5 million. The
Company recorded gain and loss on these sales of approximately $8.2 million in other income and approximately
$0.9 million in other expense, respectively, in the accompanying statement of comprehensive income for the year
ended March 31, 2015. The disposals in investments in associates during the year ended March 31, 2015 also
included the transfer of shares in Mitsui & Co. Precious Metals, Inc. as an in-kind dividend to MUH in the amount
of $6.4 million.
Capital Returns
During the year ended March 31 2016, the Company received a liquidating return of capital on its investment in
Prime Aviation Capital, LLC, a wholly-owned subsidiary, and an in-kind distribution from Mitsui & Co. Venture
Partners II, L.P. (“MCVP II” ), an associate, in the amount of approximately $11.3 million and $6.1 million,
respectively.
During the year ended March 31, 2015, the Company received a return of capital on its investments in wholly
owned subsidiaries, namely, Game Changer Holdings Inc. and Ginrei, Inc., as well as MCVP II in the amount of
approximately $181.6 million, $8.7 million, and $7.8 million, respectively.
Impairment
During the years ended March 31, 2016 and 2015, the Company recorded impairment losses on its investment in
Cinco Pipe and Supply, LLC, a wholly-owned subsidiary, of approximately $39.2 million and $24.0 million,
respectively. The impairment was recognized due to reduced product demand from continuous decline in oil prices.
The fair value of the investment was estimated using the discounted cash flow method and categorized as Level
3 in the fair value hierarchy. The significant unobservable input used for this fair value measurement was the
discount rate and projected cash flows. See Note 13 regarding the fair value hierarchy.
The impairment losses were included in other expense in the accompanying statements of comprehensive income
for the years ended March 31, 2016 and 2015.
Reclassification
The reclassification during the year ended March 31, 2015 relates to equity dilution in MAG Aliança Automóveis
do Brasil SSC, resulting in a change of its investment classification from subsidiary to associate.
Notes to Financial Statements (In thousands, except where otherwise noted)
14
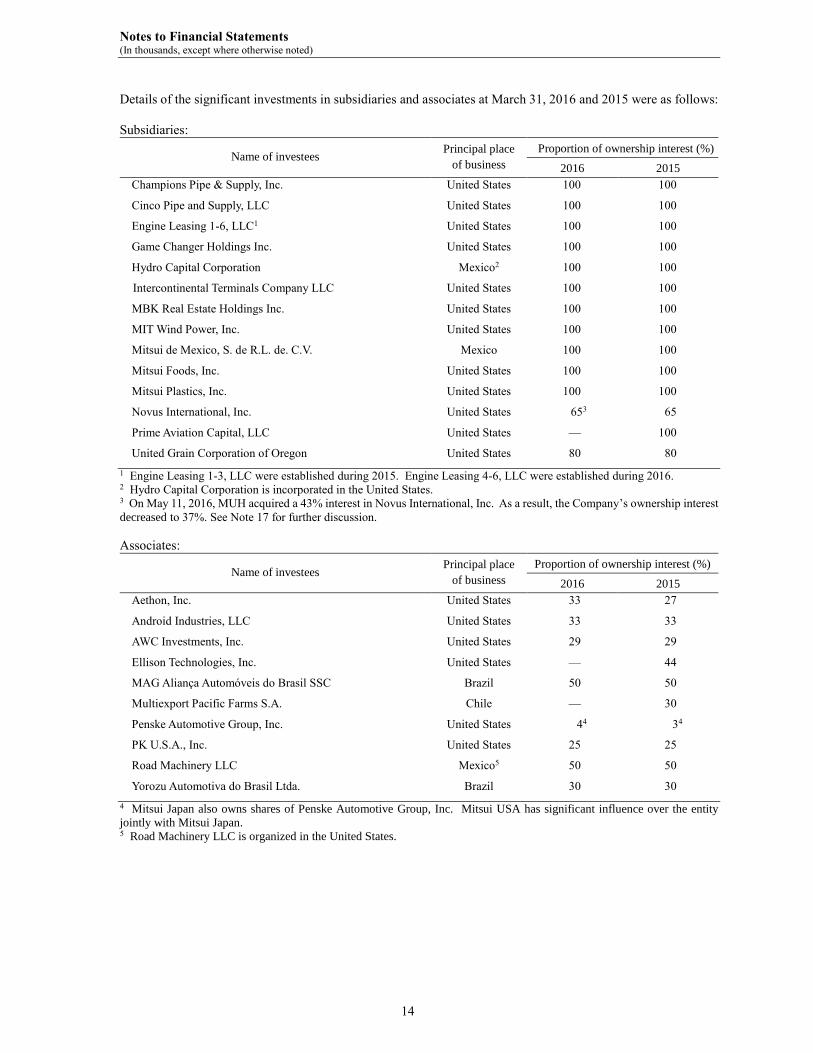
Details of the significant investments in subsidiaries and associates at March 31, 2016 and 2015 were as follows:
Subsidiaries:
Name of investees Principal place
of business
Proportion of ownership interest (%)
2016 2015
Champions Pipe & Supply, Inc. United States 100 100
Cinco Pipe and Supply, LLC United States 100 100
Engine Leasing 1-6, LLC1 United States 100 100
Game Changer Holdings Inc. United States 100 100
Hydro Capital Corporation Mexico2 100 100
Intercontinental Terminals Company LLC United States 100 100
MBK Real Estate Holdings Inc. United States 100 100
MIT Wind Power, Inc. United States 100 100
Mitsui de Mexico, S. de R.L. de. C.V. Mexico 100 100
Mitsui Foods, Inc. United States 100 100
Mitsui Plastics, Inc. United States 100 100
Novus International, Inc. United States 653 65
Prime Aviation Capital, LLC United States — 100
United Grain Corporation of Oregon United States 80 80
1 Engine Leasing 1-3, LLC were established during 2015. Engine Leasing 4-6, LLC were established during 2016.
2 Hydro Capital Corporation is incorporated in the United States. 3 On May 11, 2016, MUH acquired a 43% interest in Novus International, Inc. As a result, the Company’s ownership interest
decreased to 37%. See Note 17 for further discussion.
Associates:
Name of investees Principal place
of business
Proportion of ownership interest (%)
2016 2015
Aethon, Inc. United States 33 27
Android Industries, LLC United States 33 33
AWC Investments, Inc. United States 29 29
Ellison Technologies, Inc. United States — 44
MAG Aliança Automóveis do Brasil SSC Brazil 50 50
Multiexport Pacific Farms S.A. Chile — 30
Penske Automotive Group, Inc. United States 44 34
PK U.S.A., Inc. United States 25 25
Road Machinery LLC Mexico5 50 50
Yorozu Automotiva do Brasil Ltda. Brazil 30 30
4 Mitsui Japan also owns shares of Penske Automotive Group, Inc. Mitsui USA has significant influence over the entity
jointly with Mitsui Japan. 5 Road Machinery LLC is organized in the United States.

Notes to Financial Statements (In thousands, except where otherwise noted)
15
4. Financial Instruments and Related Matters
Trade and Other Receivables, Finance Lease Receivables, and Derivative-related Assets
Trade and other receivables, finance lease receivables, and derivative-related assets as of March 31, 2016 and
2015 were measured at amortized cost, except for derivative assets, and consisted of the following:
2016 2015
Current:
Trade and other receivables:
Customers $ 428,150 $ 298,998
Parent and affiliates 205,289 248,863
Finance lease receivables 4,345 7,168
Allowance for doubtful receivables (2,140) (2,711)
Total $ 635,644 $ 552,318
Derivative-related assets:
Derivative assets 50,569 19,788
Margin deposits 11,976 5,788
Total $ 62,545 $ 25,576
Non-current:
Finance lease receivables $ - $ 6,866
Derivative-related assets—Derivative assets 10,244 -
Other Investments
The carrying amounts of other investments as of March 31, 2016 and 2015 were as follows:
2016 2015
Equity instruments measured at FVTPL $ 13,171 $ 9,605
Equity instruments measured at FVTOCI 23,102 28,189
Total $ 36,273 $ 37,794
Equity Instruments Measured at FVTPL
The fair value of equity instruments measured at FVTPL as of March 31, 2016 and 2015 was as follows:
2016 2015
Unlisted securities $ 13,171 $ 9,605
There were no individually significant equity instruments measured at FVTPL as of March 31, 2016 and 2015.
Gain (Loss) on Equity Instruments Measured at FVTPL
The Company recorded a net loss of $1,102 and a net gain of $184 on sales and valuation of equity instruments
measured at FVTPL for the years ended March 31, 2016 and 2015, respectively. Net gain (loss) on equity
instruments measured at FVTPL is included in other income and other expense in the accompanying statements
of comprehensive income for the years ended March 31, 2016 and 2015.
Notes to Financial Statements (In thousands, except where otherwise noted)
16
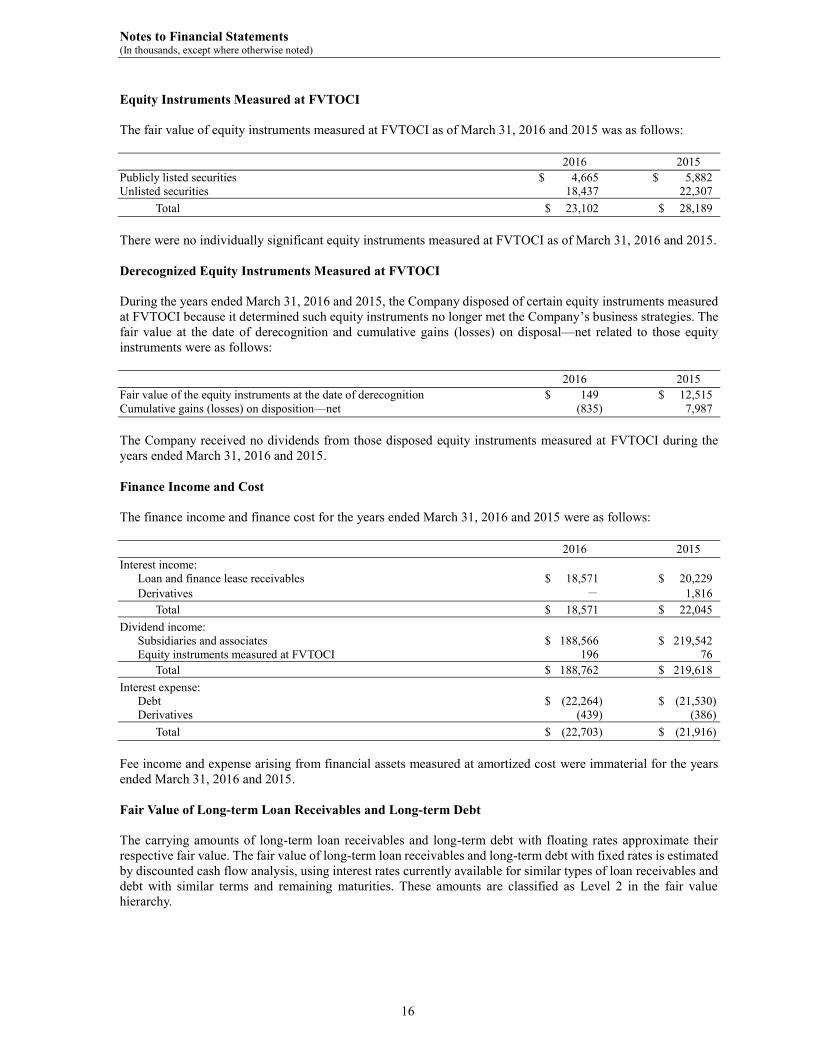
Equity Instruments Measured at FVTOCI
The fair value of equity instruments measured at FVTOCI as of March 31, 2016 and 2015 was as follows:
2016 2015
Publicly listed securities $ 4,665 $ 5,882
Unlisted securities 18,437 22,307
Total $ 23,102 $ 28,189
There were no individually significant equity instruments measured at FVTOCI as of March 31, 2016 and 2015.
Derecognized Equity Instruments Measured at FVTOCI
During the years ended March 31, 2016 and 2015, the Company disposed of certain equity instruments measured
at FVTOCI because it determined such equity instruments no longer met the Company’s business strategies. The
fair value at the date of derecognition and cumulative gains (losses) on disposal—net related to those equity
instruments were as follows:
2016 2015
Fair value of the equity instruments at the date of derecognition $ 149 $ 12,515
Cumulative gains (losses) on disposition—net (835) 7,987
The Company received no dividends from those disposed equity instruments measured at FVTOCI during the
years ended March 31, 2016 and 2015.
Finance Income and Cost
The finance income and finance cost for the years ended March 31, 2016 and 2015 were as follows:
2016 2015
Interest income:
Loan and finance lease receivables $ 18,571 $ 20,229
Derivatives - 1,816
Total $ 18,571 $ 22,045
Dividend income:
Subsidiaries and associates $ 188,566 $ 219,542
Equity instruments measured at FVTOCI 196 76
Total $ 188,762 $ 219,618
Interest expense:
Debt $ (22,264) $ (21,530)
Derivatives (439) (386)
Total $ (22,703) $ (21,916)
Fee income and expense arising from financial assets measured at amortized cost were immaterial for the years
ended March 31, 2016 and 2015.
Fair Value of Long-term Loan Receivables and Long-term Debt
The carrying amounts of long-term loan receivables and long-term debt with floating rates approximate their
respective fair value. The fair value of long-term loan receivables and long-term debt with fixed rates is estimated
by discounted cash flow analysis, using interest rates currently available for similar types of loan receivables and
debt with similar terms and remaining maturities. These amounts are classified as Level 2 in the fair value
hierarchy.
Notes to Financial Statements (In thousands, except where otherwise noted)
17
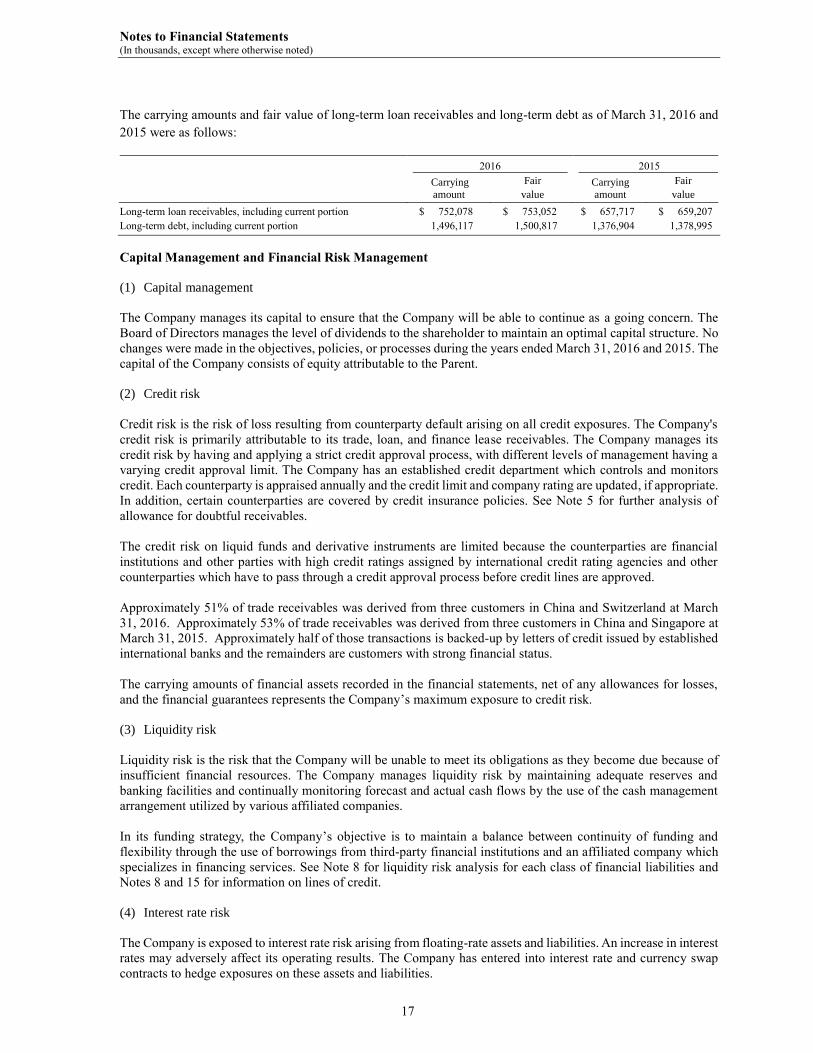
The carrying amounts and fair value of long-term loan receivables and long-term debt as of March 31, 2016 and
2015 were as follows:
2016 2015
Carrying
amount
Fair
value
Carrying
amount
Fair
value
Long-term loan receivables, including current portion $ 752,078 $ 753,052 $ 657,717 $ 659,207
Long-term debt, including current portion 1,496,117 1,500,817 1,376,904 1,378,995
Capital Management and Financial Risk Management
(1) Capital management
The Company manages its capital to ensure that the Company will be able to continue as a going concern. The
Board of Directors manages the level of dividends to the shareholder to maintain an optimal capital structure. No
changes were made in the objectives, policies, or processes during the years ended March 31, 2016 and 2015. The
capital of the Company consists of equity attributable to the Parent.
(2) Credit risk
Credit risk is the risk of loss resulting from counterparty default arising on all credit exposures. The Company's
credit risk is primarily attributable to its trade, loan, and finance lease receivables. The Company manages its
credit risk by having and applying a strict credit approval process, with different levels of management having a
varying credit approval limit. The Company has an established credit department which controls and monitors
credit. Each counterparty is appraised annually and the credit limit and company rating are updated, if appropriate.
In addition, certain counterparties are covered by credit insurance policies. See Note 5 for further analysis of
allowance for doubtful receivables.
The credit risk on liquid funds and derivative instruments are limited because the counterparties are financial
institutions and other parties with high credit ratings assigned by international credit rating agencies and other
counterparties which have to pass through a credit approval process before credit lines are approved.
Approximately 51% of trade receivables was derived from three customers in China and Switzerland at March
31, 2016. Approximately 53% of trade receivables was derived from three customers in China and Singapore at
March 31, 2015. Approximately half of those transactions is backed-up by letters of credit issued by established
international banks and the remainders are customers with strong financial status.
The carrying amounts of financial assets recorded in the financial statements, net of any allowances for losses,
and the financial guarantees represents the Company’s maximum exposure to credit risk.
(3) Liquidity risk
Liquidity risk is the risk that the Company will be unable to meet its obligations as they become due because of
insufficient financial resources. The Company manages liquidity risk by maintaining adequate reserves and
banking facilities and continually monitoring forecast and actual cash flows by the use of the cash management
arrangement utilized by various affiliated companies.
In its funding strategy, the Company’s objective is to maintain a balance between continuity of funding and
flexibility through the use of borrowings from third-party financial institutions and an affiliated company which
specializes in financing services. See Note 8 for liquidity risk analysis for each class of financial liabilities and
Notes 8 and 15 for information on lines of credit.
(4) Interest rate risk
The Company is exposed to interest rate risk arising from floating-rate assets and liabilities. An increase in interest
rates may adversely affect its operating results. The Company has entered into interest rate and currency swap
contracts to hedge exposures on these assets and liabilities.

Notes to Financial Statements (In thousands, except where otherwise noted)
18
The impact on profit before income taxes assuming a 1% rise in interest rates is a lower profit of approximately
$9.2 million and $6.3 million for the years ended March 31, 2016 and 2015, respectively. This sensitivity analysis
is calculated by multiplying the net amounts of floating-rate financial assets and liabilities as of March 31, 2016
and 2015 by 1%, without considering future changes in the balance, the effect of exchange rate fluctuations, or
the diversification effect of the timing of refinancing/interest rate revisions of floating-rate debts and assuming
that all other variables are constant.
The instruments that are included in the sensitivity analysis include floating-rate interest-bearing loan receivables
and debt, fixed-rate interest-bearing loan receivables and debt that are effectively converted to floating-rate
instruments with interest rate swap contracts, cash and cash equivalents, and time deposits.
(5) Foreign currency exchange rate risk
The Company has limited exposure to foreign currency exchange rate risk as most of its receivables and payables
arising from transactions such as purchases and sales of products and services and financial transactions are
denominated in U.S. dollars. The Company effectively eliminated the foreign currency exchange rate risk from
its Japanese-yen denominated borrowing by using a cross-currency swap contract. The impact on profit before
income taxes assuming a 1% rise in exchange rate of any currency is not material for the years ended March 31,
2016 and 2015.
(6) Commodity price risk
The Company trades in commodities, mainly agricultural products, and as a result it is exposed to the risk of price
fluctuations. The Company uses the Value at Risk (“VaR”) method to measure the price risk for certain
commodities for which historical price fluctuations are significant. VaR is a statistical measure of the potential
maximum loss in the fair value of a given portfolio over a certain holding period and within a certain confidence
level. It is calculated by mainly using a 10-day holding period and a confidence level of 99%. The VaR was $0.7
million and $4.2 million as of March 31, 2016 and 2015, respectively. Those figures do not take into account
correlations among various commodities. The actual results may differ significantly from VaR as VaR is calculated
by using historical fluctuations of each risk component.
(7) Contingent earnouts
The Company received certain receivables as an in-kind distribution from one of its investments on March 31,
2016 and recorded the receivables as derivatives. The receivables represent contingent development and sales
earnouts to be received at various times based on achievements of various clinical and regulatory milestones as
well as earnout payments based on achievements of various sales milestones. The fair value of such payments is
adjusted to reflect the estimated risk with the relative uncertainty of both the timing and achievement of individual
development and sales earnouts.
Derivative Instruments and Hedging Activities
The Company manages interest rates, foreign currency exchange rates, and commodity price risks associated with
individual transactions by using various derivative instruments.
Interest rate risk hedging activities
The Company uses interest rate swap contracts to convert certain fixed-rate financial assets to floating-rate to
match cash flows from the financial assets with floating-rate liabilities. The Company does not apply hedge
accounting on such interest rate swaps and hedged items, and changes in fair value, which are not significant, are
recognized in earnings.
Foreign currency exchange rate risk hedging activities
The Company mitigates the fluctuation in long-term debt fair value with a cross-currency swap contract. The
cross-currency swap contract offsets an impact of future changes in foreign exchange rates designated as the
hedged risk on the fair value of the underlying Japanese-yen denominated long-term debt. The Company applies
Notes to Financial Statements (In thousands, except where otherwise noted)
19
fair value hedge accounting on the cross-currency swap contract and hedged item. The Company also uses foreign
exchange forward contracts to reduce the risks from foreign currency-denominated receivables and payables.
Those foreign exchange forward contracts and hedged items do not qualify for hedge accounting and changes in
fair value, which are not significant, are recognized in earnings.
Commodity price risk hedging activities
The Company uses exchange-traded futures to manage its net position of agricultural commodity forward
purchase and sales contracts to reduce price risk caused by market fluctuations in agricultural commodities, such
as soy beans, wheat, and corn. The Company does not apply hedge accounting on such contracts and hedged
items.
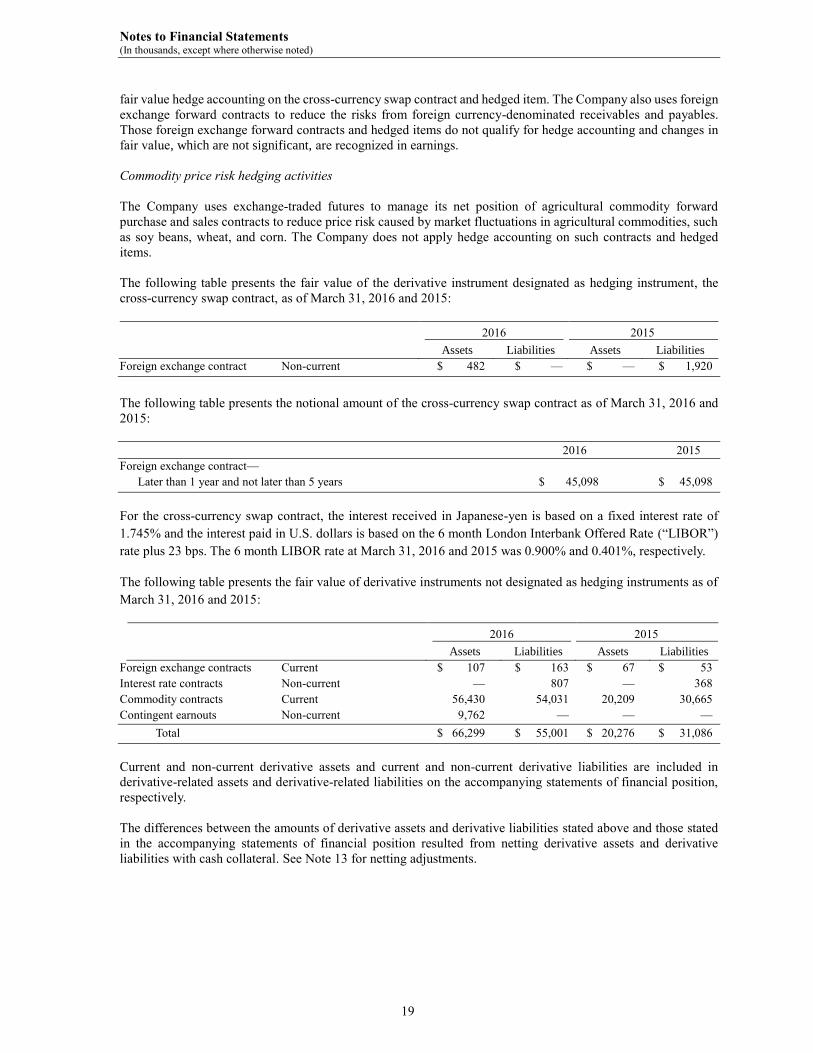
The following table presents the fair value of the derivative instrument designated as hedging instrument, the
cross-currency swap contract, as of March 31, 2016 and 2015:
2016 2015
Assets Liabilities Assets Liabilities
Foreign exchange contract Non-current $ 482 $ — $ — $ 1,920
The following table presents the notional amount of the cross-currency swap contract as of March 31, 2016 and
2015:
2016 2015
Foreign exchange contract—
Later than 1 year and not later than 5 years $ 45,098 $ 45,098
For the cross-currency swap contract, the interest received in Japanese-yen is based on a fixed interest rate of
1.745% and the interest paid in U.S. dollars is based on the 6 month London Interbank Offered Rate (“LIBOR”)
rate plus 23 bps. The 6 month LIBOR rate at March 31, 2016 and 2015 was 0.900% and 0.401%, respectively.
The following table presents the fair value of derivative instruments not designated as hedging instruments as of
March 31, 2016 and 2015:
2016 2015
Assets Liabilities Assets Liabilities
Foreign exchange contracts Current $ 107 $ 163 $ 67 $ 53
Interest rate contracts Non-current — 807 — 368
Commodity contracts Current 56,430 54,031 20,209 30,665
Contingent earnouts Non-current 9,762 — — —
Total $ 66,299 $ 55,001 $ 20,276 $ 31,086
Current and non-current derivative assets and current and non-current derivative liabilities are included in
derivative-related assets and derivative-related liabilities on the accompanying statements of financial position,
respectively.
The differences between the amounts of derivative assets and derivative liabilities stated above and those stated
in the accompanying statements of financial position resulted from netting derivative assets and derivative
liabilities with cash collateral. See Note 13 for netting adjustments.
Notes to Financial Statements (In thousands, except where otherwise noted)
20
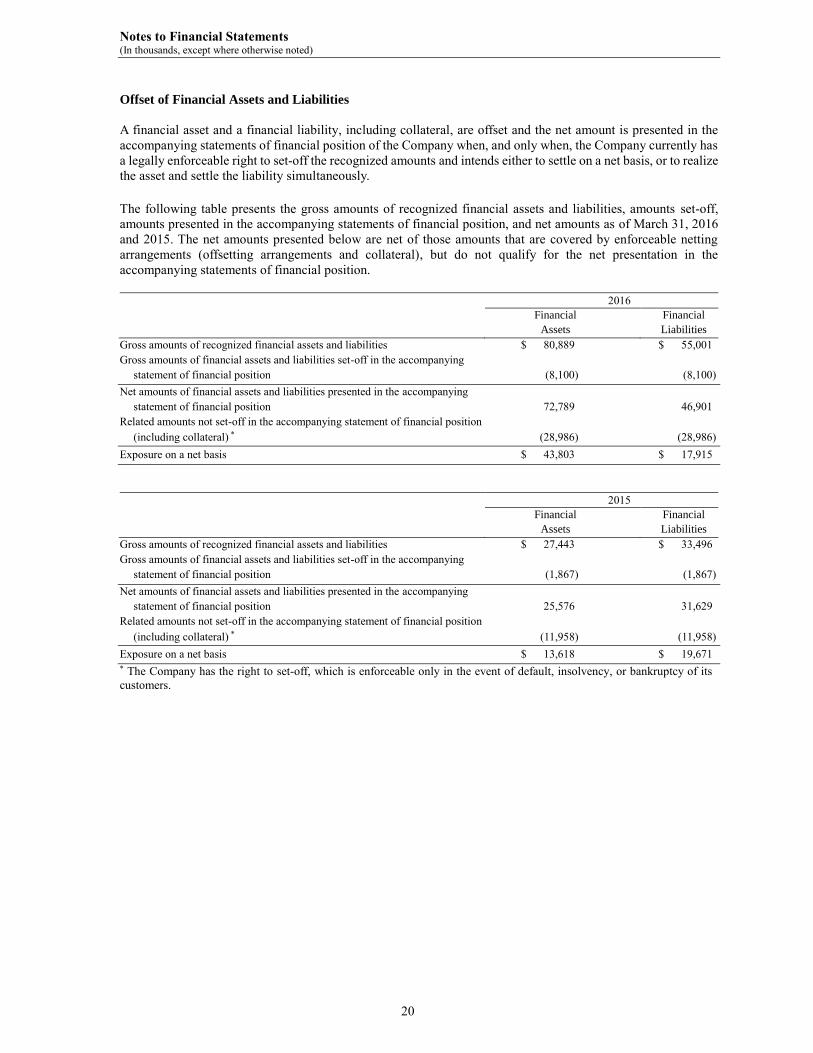
Offset of Financial Assets and Liabilities
A financial asset and a financial liability, including collateral, are offset and the net amount is presented in the
accompanying statements of financial position of the Company when, and only when, the Company currently has
a legally enforceable right to set-off the recognized amounts and intends either to settle on a net basis, or to realize
the asset and settle the liability simultaneously.
The following table presents the gross amounts of recognized financial assets and liabilities, amounts set-off,
amounts presented in the accompanying statements of financial position, and net amounts as of March 31, 2016
and 2015. The net amounts presented below are net of those amounts that are covered by enforceable netting
arrangements (offsetting arrangements and collateral), but do not qualify for the net presentation in the
accompanying statements of financial position.
2016
Financial
Assets
Financial
Liabilities
Gross amounts of recognized financial assets and liabilities $ 80,889 $ 55,001
Gross amounts of financial assets and liabilities set-off in the accompanying
statement of financial position (8,100) (8,100)
Net amounts of financial assets and liabilities presented in the accompanying
statement of financial position 72,789 46,901
Related amounts not set-off in the accompanying statement of financial position
(including collateral) * (28,986) (28,986)
Exposure on a net basis $ 43,803 $ 17,915
2015
Financial
Assets
Financial
Liabilities
Gross amounts of recognized financial assets and liabilities $ 27,443 $ 33,496
Gross amounts of financial assets and liabilities set-off in the accompanying
statement of financial position (1,867) (1,867)
Net amounts of financial assets and liabilities presented in the accompanying
statement of financial position 25,576 31,629
Related amounts not set-off in the accompanying statement of financial position
(including collateral) * (11,958) (11,958)
Exposure on a net basis $ 13,618 $ 19,671
* The Company has the right to set-off, which is enforceable only in the event of default, insolvency, or bankruptcy of its
customers.
Notes to Financial Statements (In thousands, except where otherwise noted)
21
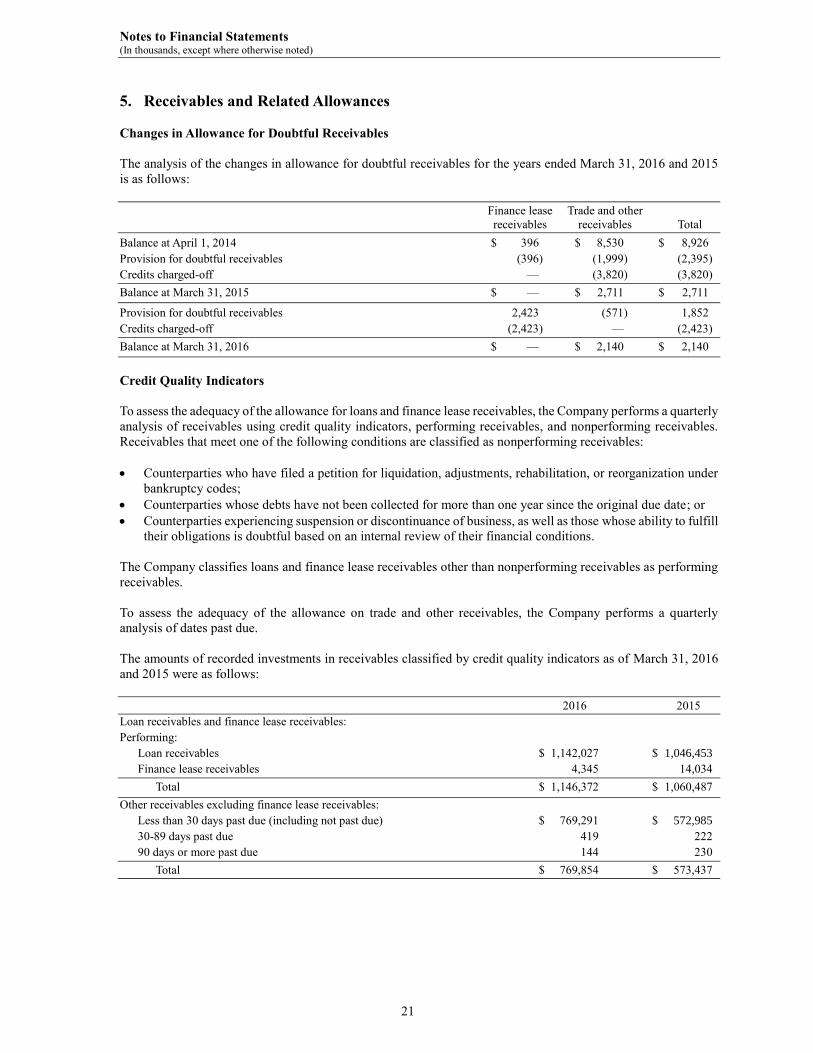
5. Receivables and Related Allowances
Changes in Allowance for Doubtful Receivables
The analysis of the changes in allowance for doubtful receivables for the years ended March 31, 2016 and 2015
is as follows:
Finance lease Trade and other
receivables receivables Total
Balance at April 1, 2014 $ 396 $ 8,530 $ 8,926
Provision for doubtful receivables (396) (1,999) (2,395)
Credits charged-off — (3,820) (3,820)
Balance at March 31, 2015 $ — $ 2,711 $ 2,711
Provision for doubtful receivables 2,423 (571) 1,852
Credits charged-off (2,423) — (2,423)
Balance at March 31, 2016 $ — $ 2,140 $ 2,140
Credit Quality Indicators
To assess the adequacy of the allowance for loans and finance lease receivables, the Company performs a quarterly
analysis of receivables using credit quality indicators, performing receivables, and nonperforming receivables.
Receivables that meet one of the following conditions are classified as nonperforming receivables:
Counterparties who have filed a petition for liquidation, adjustments, rehabilitation, or reorganization under
bankruptcy codes;
Counterparties whose debts have not been collected for more than one year since the original due date; or
Counterparties experiencing suspension or discontinuance of business, as well as those whose ability to fulfill
their obligations is doubtful based on an internal review of their financial conditions.
The Company classifies loans and finance lease receivables other than nonperforming receivables as performing
receivables.
To assess the adequacy of the allowance on trade and other receivables, the Company performs a quarterly
analysis of dates past due.
The amounts of recorded investments in receivables classified by credit quality indicators as of March 31, 2016
and 2015 were as follows:
2016 2015
Loan receivables and finance lease receivables:
Performing:
Loan receivables $ 1,142,027 $ 1,046,453
Finance lease receivables 4,345 14,034
Total $ 1,146,372 $ 1,060,487
Other receivables excluding finance lease receivables:
Less than 30 days past due (including not past due) $ 769,291 $ 572,985
30-89 days past due 419 222
90 days or more past due 144 230
Total $ 769,854 $ 573,437

Notes to Financial Statements (In thousands, except where otherwise noted)
22
Impaired Receivables
All of the loan receivables and finance lease receivables are classified as performing and there were no impaired
loan receivables and finance lease receivables at March 31, 2016 and 2015. In addition, there were no past due or
non-accrual loan receivables and finance lease receivables at March 31, 2016 and 2015.
Trade and other receivables that were classified as impaired amounted to $200 and $201 as of March 31, 2016
and 2015, respectively. Substantially all of the impaired receivables were provided with an allowance for doubtful
receivables.
During the year ended March 31, 2016, in conjunction with an agreement to sell all locomotives under finance
leases at the end of the lease term, the Company recorded a provision for credit loss of approximately $2.4 million
which represents the reduction in residual value of the locomotives. See Note 6 for further discussion.
6. Leases
Lessor
Leases of locomotives are classified as finance leases and the net investments are included as part of trade and
other receivables and finance lease receivables in the accompanying statements of financial position. The
unguaranteed residual value represents the estimate of the value of the leased assets at the end of the lease
contracts and are initially recorded based on appraisals and estimates at the commencement of the lease.
Realization of the residual value is dependent on the Company’s future ability to sell the related assets under then-
prevailing market conditions.
The following is a schedule of future minimum sublease payments to be received from finance leases as well as
the components of the present value as of March 31, 2016 and 2015:
Gross investment in finance leases
Present value of future minimum
lease payments receivable
2016 2015 2016 2015
Not later than 1 year $ 4,554 $ 7,846 $ 4,325 $ 7,015
Later than 1 year and not later than 5 years — 7,083 — 4,082
Total $ 4,554 $ 14,929 $ 4,325 $ 11,097
Unearned income (209) (895)
Unguaranteed residual value of leased
assets (present value) (20) (2,937)
The present value of future minimum lease
payments to be received $ 4,325 $ 11,097
During the year ended March 31, 2016, the Company entered into an agreement to sell all locomotives under
finance leases at the end of the lease term. Based on the sales amount, the Company recorded an impairment loss
on unguaranteed residual value of leases of approximately $2.4 million, which was recorded in the selling, general,
and administrative expenses in the accompanying statement of comprehensive income for the year ended March
31, 2016.
During the year ended March 31, 2015, the Company sold certain finance leases to third-party buyers for
approximately $131.8 million in aggregate and recorded a net loss on the sale of approximately $2.5 million. The
net loss on sale is included in other expense in the accompanying statement of comprehensive income for the year
ended March 31, 2015.
During the year ended March 31, 2015, the Company sold certain finance leases that were classified as held for
sale at the lower of carrying amount or estimated fair value, less costs to sell, for approximately $22.0 million.
Together with the lease payments received during the year, the Company recorded a gain on sale of $4.7 million,
which is included in other income in the accompanying statement of comprehensive income for the year ended
March 31, 2015.

Notes to Financial Statements (In thousands, except where otherwise noted)
23
During the year ended March 31, 2015, the Company sold certain operating leases and the related assets to third-
party buyers. See Note 7 for further discussion.
Lessee
The Company leases real estate, rolling stock, and storage tanks under operating leases. Most of the storage tanks
under operating leases are subleased to third parties and certain office spaces are subleased to affiliated companies.
The following is a schedule of future minimum lease payments under noncancellable operating leases as of March
31, 2016 and 2015:
2016 2015
Not later than 1 year $ 14,630 $ 9,997
Later than 1 year and not later than 5 years 41,365 18,957
Later than 5 years 146,296 3,161
Total $ 202,291 $ 32,115
The following is a schedule of future minimum sublease payments to be received under noncancellable operating
leases as of March 31, 2016 and 2015:
2016 2015
Not later than 1 year $ 4,756 $ 3,106
Later than 1 year and not later than 5 years 4,497 1,763
Total $ 9,253 $ 4,869
Rental expenses incurred for operating leases for the years ended March 31, 2016 and 2015 were $13,080 and
$10,339, respectively. Sublease rental income for the years ended March 31, 2016 and 2015 was $4,314 and
$4,727, respectively.
Notes to Financial Statements (In thousands, except where otherwise noted)
24
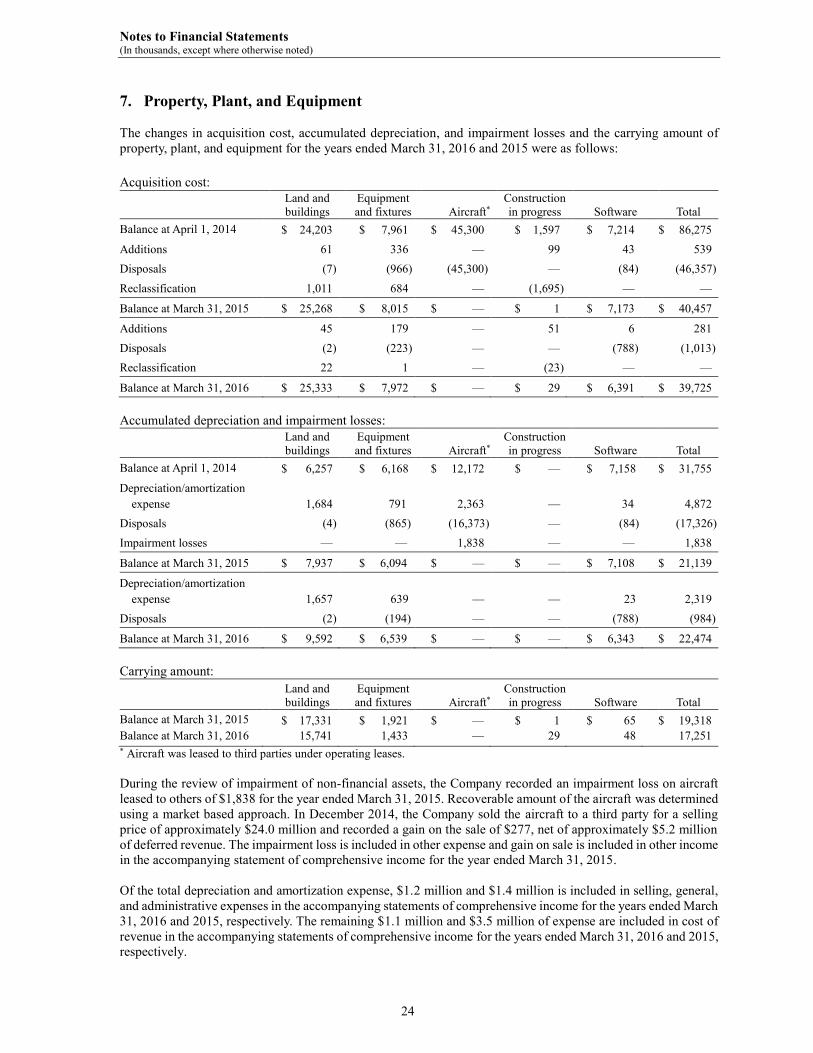
7. Property, Plant, and Equipment
The changes in acquisition cost, accumulated depreciation, and impairment losses and the carrying amount of
property, plant, and equipment for the years ended March 31, 2016 and 2015 were as follows:
Acquisition cost:
Land and
buildings
Equipment
and fixtures Aircraft*
Construction
in progress Software Total
Balance at April 1, 2014 $ 24,203 $ 7,961 $ 45,300 $ 1,597 $ 7,214 $ 86,275
Additions 61 336 — 99 43 539
Disposals (7) (966) (45,300) — (84) (46,357)
Reclassification 1,011 684 — (1,695) — —
Balance at March 31, 2015 $ 25,268 $ 8,015 $ — $ 1 $ 7,173 $ 40,457
Additions 45 179 — 51 6 281
Disposals (2) (223) — — (788) (1,013)
Reclassification 22 1 — (23) — —
Balance at March 31, 2016 $ 25,333 $ 7,972 $ — $ 29 $ 6,391 $ 39,725
Accumulated depreciation and impairment losses:
Land and
buildings
Equipment
and fixtures Aircraft*
Construction
in progress Software Total
Balance at April 1, 2014 $ 6,257 $ 6,168 $ 12,172 $ — $ 7,158 $ 31,755
Depreciation/amortization
expense 1,684 791 2,363 — 34 4,872
Disposals (4) (865) (16,373) — (84) (17,326)
Impairment losses — — 1,838 — — 1,838
Balance at March 31, 2015 $ 7,937 $ 6,094 $ — $ — $ 7,108 $ 21,139
Depreciation/amortization
expense 1,657 639 — — 23 2,319
Disposals (2) (194) — — (788) (984)
Balance at March 31, 2016 $ 9,592 $ 6,539 $ — $ — $ 6,343 $ 22,474
Carrying amount:
Land and
buildings
Equipment
and fixtures Aircraft*
Construction
in progress Software Total
Balance at March 31, 2015 $ 17,331 $ 1,921 $ — $ 1 $ 65 $ 19,318
Balance at March 31, 2016 15,741 1,433 — 29 48 17,251
* Aircraft was leased to third parties under operating leases.
During the review of impairment of non-financial assets, the Company recorded an impairment loss on aircraft
leased to others of $1,838 for the year ended March 31, 2015. Recoverable amount of the aircraft was determined
using a market based approach. In December 2014, the Company sold the aircraft to a third party for a selling
price of approximately $24.0 million and recorded a gain on the sale of $277, net of approximately $5.2 million
of deferred revenue. The impairment loss is included in other expense and gain on sale is included in other income
in the accompanying statement of comprehensive income for the year ended March 31, 2015.
Of the total depreciation and amortization expense, $1.2 million and $1.4 million is included in selling, general,
and administrative expenses in the accompanying statements of comprehensive income for the years ended March
31, 2016 and 2015, respectively. The remaining $1.1 million and $3.5 million of expense are included in cost of
revenue in the accompanying statements of comprehensive income for the years ended March 31, 2016 and 2015,
respectively.

Notes to Financial Statements (In thousands, except where otherwise noted)
25
8. Financial Liabilities
Short-term Debt
Short-term debts as of March 31, 2016 and 2015 were comprised of the following:
2016 2015
Interest Rate Interest Rate
Subsidiaries and affiliates $ 818,659 0.42% $ 283,420 0.05%
Commercial paper 265,716 0.57 % 99,944 0.22%
Total $ 1,084,375 $ 383,364
The interest rates represent weighted-average rates in effect as of March 31, 2016 and 2015.
Unused lines of credit for short-term financing from third-party financial institutions were $525 million as of
March 31, 2016 and 2015.
Long-term Debt
Long-term debts as of March 31, 2016 and 2015 consisted of the following:
2016 2015
Interest Rate Interest Rate
Affiliated company $ 1,450,478 1.33% to 3.22% $ 1,333,650 1.05% to 2.94%
Financial institution 45,639 1.75% 43,254 1.75%
Total long-term debt 1,496,117 1,376,904
Less current portion (256,202) (411,200)
Long-term debt, less current portion $ 1,239,915 $ 965,704
The long-term debt from financial institution is debt denominated in Japanese-yen.
Long-term debt with financial institutions included loans related to certain finance leases. During the year ended
March 31, 2015, approximately $33 million of these loans were matured or were transferred to the buyer of the
finance leases. These loan agreements included default provisions which granted the financial institutions sale or
possession rights of the leased assets. See Note 15 for more details on lines of credit for long-term financing from
related parties.
Trade and Other Payables and Derivative-Related Liabilities
Trade and other payables and derivative-related liabilities as of March 31, 2016 and 2015 were measured at
amortized cost, except for derivative liabilities, consisted of the following:
2016 2015
Current:
Trade and other payables:
Trade creditors $ 82,093 $ 114,080
Parent and affiliates 196,298 248,765
Accrued expenses 12,454 14,392
Total $ 290,845 $ 377,237
Derivative-related liabilities 46,094 29,341
Non-current:
Derivative-related liabilities 807 2,288

Notes to Financial Statements (In thousands, except where otherwise noted)
26
Liquidity Risk Analysis
Non-derivative financial liabilities
The contractual maturities of financial liabilities, excluding derivative liabilities, as of March 31, 2016 and 2015
were as follows:
2016
Not later than
1 year
Later than
1 year and not
later than
5 years
Later than
5 years Total
Short-term debt $ 1,084,375 $ ― $ ― $ 1,084,375
Trade and other payables 290,845 ― ― 290,845
Long-term debt (including current portion) 256,202 1,207,949 31,966 1,496,117
2015
Not later than
1 year
Later than
1 year and not
later than
5 years
Later than
5 years Total
Short-term debt $ 383,364 $ ― $ ― $ 383,364
Trade and other payables 377,237 ― ― 377,237
Long-term debt (including current portion) 411,200 965,704 ― 1,376,904
Derivative financial liabilities
The following tables reflect expected net cash receipts and payments from derivative financial liabilities. If
amounts to be received or paid are not fixed, the amounts are calculated using forward currency exchange rates
and interest rates estimated in reference to the yield curve as of March 31, 2016 and 2015.
2016
Not later than
1 year
Later than
1 year and not
later than
5 years
Later than
5 years Total
Foreign exchange contracts:
Receipts $ 495 $ 100 $ ― $ 595
Payments (163) ― ― (163)
Interest rate contracts:
Receipts ― ― ― ―
Payments (478) (1,096) (182) (1,756)
Commodity contracts:
Receipts 56,430 ― ― 56,430
Payments (54,031) ― ― (54,031)
2015
Not later than
1 year
Later than
1 year and not
later than
5 years
Later than
5 years Total
Foreign exchange contracts:
Receipts $ 447 $ 84 $ ― $ 531
Payments (53) (2,713) ― (2,766)
Interest rate contracts:
Receipts ― 10 204 214
Payments (604) (612) ― (1,216)
Commodity contracts:
Receipts 20,209 ― ― 20,209
Payments (30,665) ― ― (30,665)
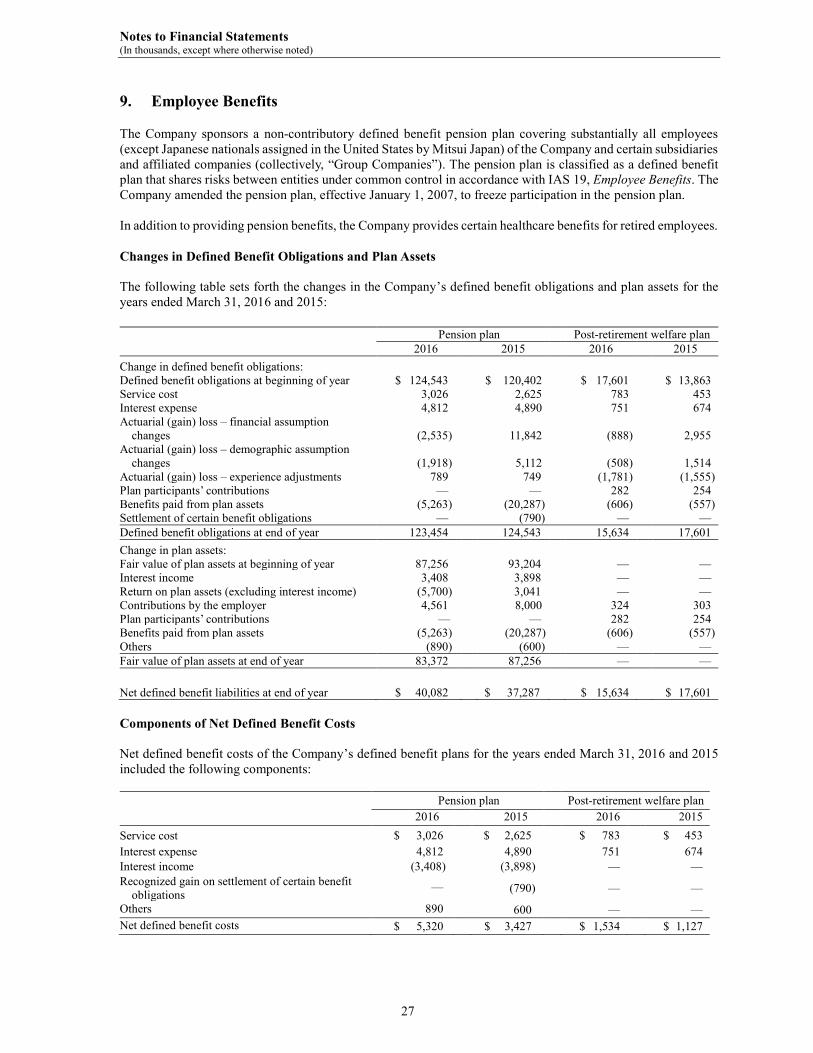
Notes to Financial Statements (In thousands, except where otherwise noted)
27
9. Employee Benefits
The Company sponsors a non-contributory defined benefit pension plan covering substantially all employees
(except Japanese nationals assigned in the United States by Mitsui Japan) of the Company and certain subsidiaries
and affiliated companies (collectively, “Group Companies”). The pension plan is classified as a defined benefit
plan that shares risks between entities under common control in accordance with IAS 19, Employee Benefits. The
Company amended the pension plan, effective January 1, 2007, to freeze participation in the pension plan.
In addition to providing pension benefits, the Company provides certain healthcare benefits for retired employees.
Changes in Defined Benefit Obligations and Plan Assets
The following table sets forth the changes in the Company’s defined benefit obligations and plan assets for the
years ended March 31, 2016 and 2015:
Pension plan Post-retirement welfare plan
2016 2015 2016 2015
Change in defined benefit obligations:
Defined benefit obligations at beginning of year $ 124,543 $ 120,402 $ 17,601 $ 13,863
Service cost 3,026 2,625 783 453
Interest expense 4,812 4,890 751 674
Actuarial (gain) loss – financial assumption
changes (2,535) 11,842 (888) 2,955
Actuarial (gain) loss – demographic assumption
changes (1,918) 5,112 (508) 1,514
Actuarial (gain) loss – experience adjustments 789 749 (1,781) (1,555)
Plan participants’ contributions — — 282 254
Benefits paid from plan assets (5,263) (20,287) (606) (557)
Settlement of certain benefit obligations — (790) — —
Defined benefit obligations at end of year 123,454 124,543 15,634 17,601 Change in plan assets:
Fair value of plan assets at beginning of year 87,256 93,204 — —
Interest income 3,408 3,898 — —
Return on plan assets (excluding interest income) (5,700) 3,041 — —
Contributions by the employer 4,561 8,000 324 303
Plan participants’ contributions — — 282 254
Benefits paid from plan assets (5,263) (20,287) (606) (557)
Others (890) (600) — —
Fair value of plan assets at end of year 83,372 87,256 — —
Net defined benefit liabilities at end of year $ 40,082 $ 37,287 $ 15,634 $ 17,601
Components of Net Defined Benefit Costs
Net defined benefit costs of the Company’s defined benefit plans for the years ended March 31, 2016 and 2015
included the following components:
Pension plan Post-retirement welfare plan
2016 2015 2016 2015
Service cost $ 3,026 $ 2,625 $ 783 $ 453
Interest expense 4,812 4,890 751 674
Interest income (3,408) (3,898) — —
Recognized gain on settlement of certain benefit
obligations — (790) — —
Others 890 600 — —
Net defined benefit costs $ 5,320 $ 3,427 $ 1,534 $ 1,127
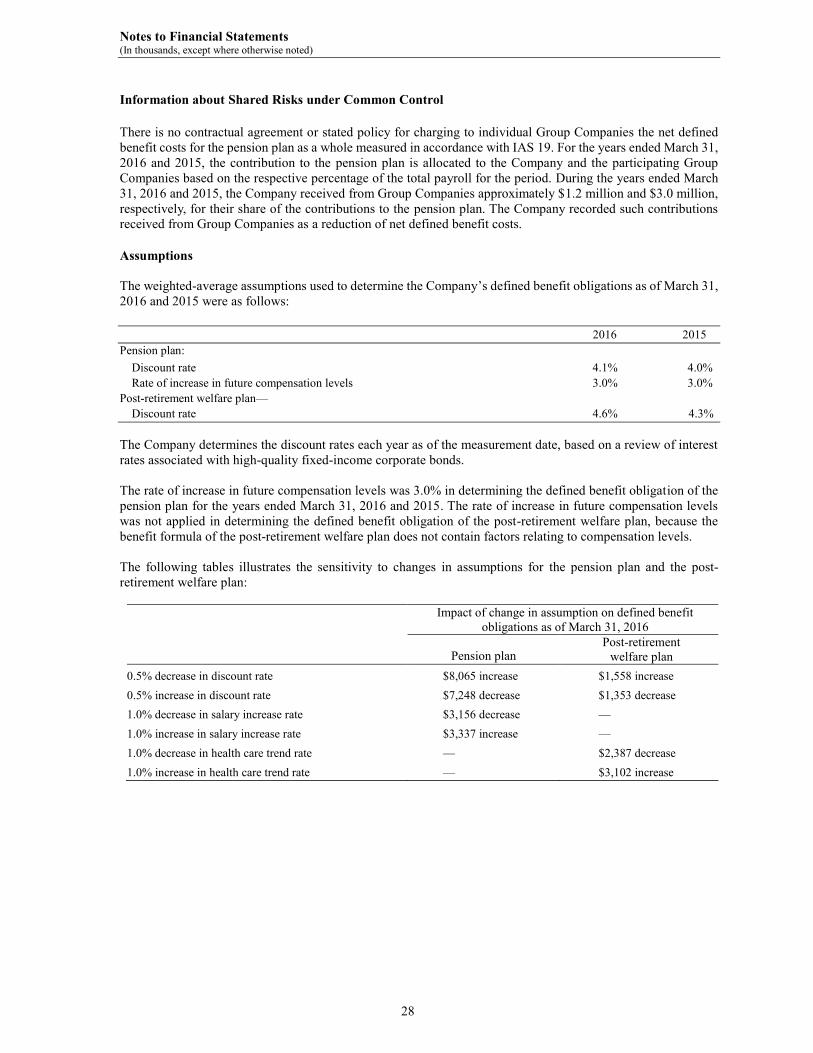
Notes to Financial Statements (In thousands, except where otherwise noted)
28
Information about Shared Risks under Common Control
There is no contractual agreement or stated policy for charging to individual Group Companies the net defined
benefit costs for the pension plan as a whole measured in accordance with IAS 19. For the years ended March 31,
2016 and 2015, the contribution to the pension plan is allocated to the Company and the participating Group
Companies based on the respective percentage of the total payroll for the period. During the years ended March
31, 2016 and 2015, the Company received from Group Companies approximately $1.2 million and $3.0 million,
respectively, for their share of the contributions to the pension plan. The Company recorded such contributions
received from Group Companies as a reduction of net defined benefit costs.
Assumptions
The weighted-average assumptions used to determine the Company’s defined benefit obligations as of March 31,
2016 and 2015 were as follows:
2016 2015
Pension plan:
Discount rate 4.1% 4.0%
Rate of increase in future compensation levels 3.0% 3.0%
Post-retirement welfare plan—
Discount rate 4.6% 4.3%
The Company determines the discount rates each year as of the measurement date, based on a review of interest
rates associated with high-quality fixed-income corporate bonds.
The rate of increase in future compensation levels was 3.0% in determining the defined benefit obligation of the
pension plan for the years ended March 31, 2016 and 2015. The rate of increase in future compensation levels
was not applied in determining the defined benefit obligation of the post-retirement welfare plan, because the
benefit formula of the post-retirement welfare plan does not contain factors relating to compensation levels.
The following tables illustrates the sensitivity to changes in assumptions for the pension plan and the post-
retirement welfare plan:
Impact of change in assumption on defined benefit
obligations as of March 31, 2016
Pension plan
Post-retirement
welfare plan
0.5% decrease in discount rate $8,065 increase $1,558 increase
0.5% increase in discount rate $7,248 decrease $1,353 decrease
1.0% decrease in salary increase rate $3,156 decrease —
1.0% increase in salary increase rate $3,337 increase —
1.0% decrease in health care trend rate — $2,387 decrease
1.0% increase in health care trend rate — $3,102 increase

Notes to Financial Statements (In thousands, except where otherwise noted)
29
Impact of change in assumption on defined benefit
obligations as of March 31, 2015
Pension plan
Post-retirement
welfare plan
0.5% decrease in discount rate $8,448 increase —
0.5% increase in discount rate $7,570 decrease —
1.0% decrease in salary increase rate $3,524 decrease —
1.0% increase in salary increase rate $3,762 increase —
1.0% decrease in discount rate — $4,219 increase
1.0% increase in discount rate — $3,128 decrease
1.0% decrease in health care trend rate — $2,949 decrease
1.0% increase in health care trend rate — $4,048 increase
The discount rate sensitivity was measured by adjusting the discount rate up and down by 0.5% for the pension
plan and the post-retirement welfare plan as of March 31, 2016 and 0.5% for the pension plan and 1.0% for the
post-retirement welfare plan as of March 31, 2015. The sensitivity due to the salary increase rate was measured
by adjusting the salary increase assumption up and down by 1.0% for the pension plan. The sensitivity due to
health care trend rate was measured by adjusting the health care trend rate assumption up and down by 1.0% for
the post-retirement welfare plan.
Plan Assets
The Company’s investment objective is to meet current and future benefit payment needs while maximizing total
investment returns (income and appreciation) after inflation within the constraints of diversification and prudent
risk taking. The Company invests primarily in a diversified portfolio of equity and fixed income securities that
provide for long-term growth within reasonable and prudent levels of risk. The asset allocation targets established
by the Company are strategic and intended to reduce exposure to risk assets in favor of long duration fixed income
securities as the funded status of the pension plan improves. The portfolio is maintained to provide adequate
liquidity to meet associated liabilities and minimize long-term expense and provide prudent diversification among
asset classes. The pension plan employs a diversified mix of actively managed investments around a core of
passively managed exposures in each asset class. Assets are rebalanced periodically to their strategic targets to
maintain the pension plan’s strategic risk/reward characteristics.
The fair value of the pension plan assets as of March 31, 2016 and 2015 by asset class was as follows:
2016 2015
Asset Class
Quoted market price
in an active market
Quoted market price
in an active market
Available Not available Total Available Not available Total
Equity instruments (US) $ — $ 26,807 $ 26,807 $ — $ 31,240 $ 31,240
Equity instruments (Non-US) — 21,902 21,902 — 20,286 20,286
Debt securities — 26,627 26,627 — 28,221 28,221 Life insurance company
general accounts — 8,006 8,006 — 7,479 7,479
Cash and deposits 30 — 30 30 — 30
Total $ 30 $ 83,342 $ 83,372 $ 30 $ 87,226 $ 87,256
Equity instruments and debt securities above are included in collective trust funds. Collective trust funds are
stated at the aggregate market value of units of participation. Such value reflects accumulated contributions,
dividends, and realized and unrealized investment gains or losses apportioned to such contributions. The insurance
contract is primarily valued at the present value of the future benefit payments owed by the insurance company
to the pension plan’s participants.

Notes to Financial Statements (In thousands, except where otherwise noted)
30
Cash Flows
Contributions
The Company expects to contribute $7.0 million and $0.5 million to the pension plan and the post-retirement
welfare plan, respectively, for the year ending March 31, 2017. The funding of the pension plan is through a
combination of contributions received from the employer and investment income generated by the pension plan’s
investments. The funding level is designed to comply with requirements of the Employee Retirement Income
Security Act of 1974, the 21st Century Act and the Highway and Transportation Funding Act of 2014, the Pension
Protection Act of 2006, and the Internal Revenue Code. These requirements include minimum funding levels. The
Company creates and implements the funding policy and monitors the funding level with the assistance of the
pension plan’s enrolled actuary and investment consultant.
Maturity profile
The weighted average duration of the benefit payments for the pension plan is 11.4 years and 12.3 years as of
March 31, 2016 and 2015, respectively. The weighted average duration of the benefit payments for the post-
retirement welfare plan is 17.1 years and 19.9 years as of March 31, 2016 and 2015, respectively.
In addition to the above defined pension plan and post-retirement welfare plan, Mitsui USA has a defined
contribution plan. The defined contribution plan expense was approximately $0.8 million and $0.7 million for the
years ended March 31, 2016 and 2015, respectively.
10. Accumulated Other Comprehensive Income (Loss)
Changes in accumulated other comprehensive income (loss) for the years ended March 31, 2016 and 2015 were
as follows:
2016 2015
Remeasurements of equity instruments:
Balance at beginning of year $ (1,738) $ 4,148
Decrease during the year (3,177) (1,093)
Transfer to retained earnings 590 (4,793)
Balance at end of year $ (4,325) $ (1,738)
Remeasurements of defined benefit plans:
Balance at beginning of year $ — $ —
Increase (decrease) during the year 631 (11,059)
Transfer to retained earnings (631) 11,059
Balance at end of year $ — $ —
Total:
Balance at beginning of year $ (1,738) $ 4,148
Decrease during the year (2,546) (12,152)
Transfer to retained earnings (41) 6,266
Balance at end of year $ (4,325) $ (1,738)
Each component of other comprehensive income (loss) and related tax benefit (expense) for the years ended
March 31, 2016 and 2015 was as follows:
2016 2015
Pre-tax
Tax
effect Net Pre-tax
Tax
effect Net
Items that will not be reclassified to profit or loss:
Remeasurements of equity instruments $ (5,087) $ 1,910 $ (3,177) $ (1,649) $ 556 $ (1,093)
Remeasurements of defined benefit plans 1,142 (511) 631 (17,576) 6,517 (11,059)
Total $ (3,945) $ 1,399 $ (2,546) $ (19,225) $ 7,073 $(12,152)
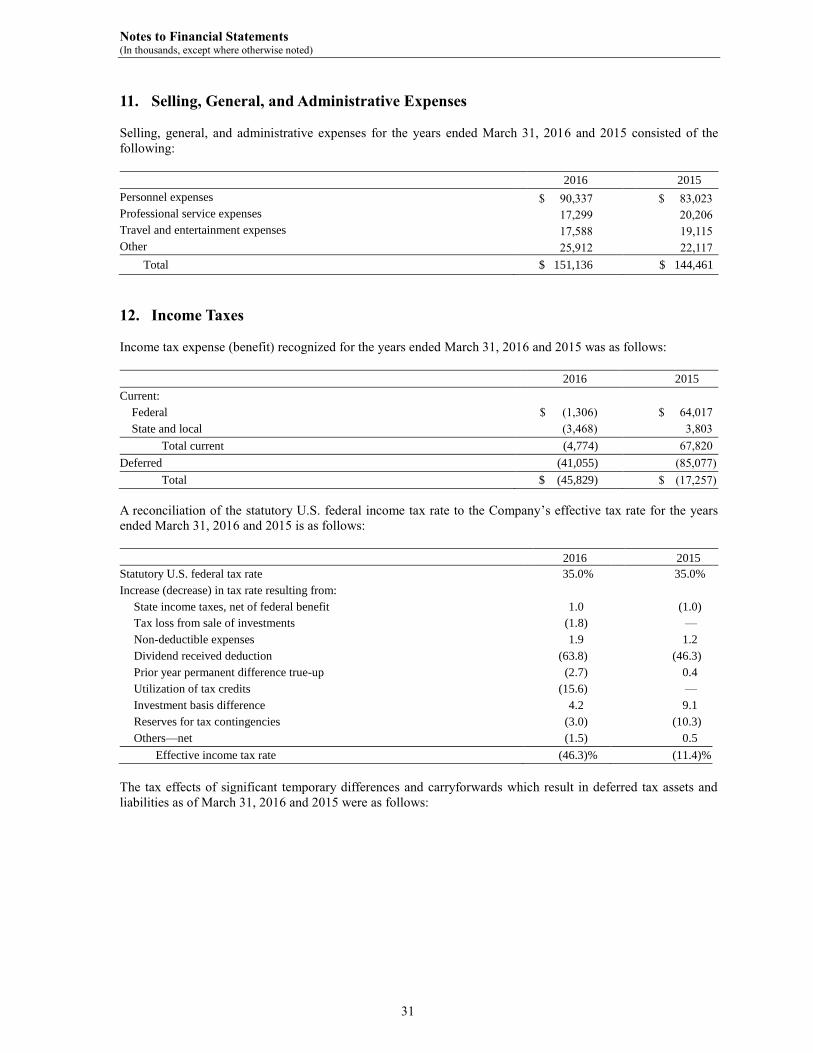
Notes to Financial Statements (In thousands, except where otherwise noted)
31
11. Selling, General, and Administrative Expenses
Selling, general, and administrative expenses for the years ended March 31, 2016 and 2015 consisted of the
following:
2016 2015
Personnel expenses $ 90,337 $ 83,023
Professional service expenses 17,299 20,206
Travel and entertainment expenses 17,588 19,115
Other 25,912 22,117
Total $ 151,136 $ 144,461
12. Income Taxes
Income tax expense (benefit) recognized for the years ended March 31, 2016 and 2015 was as follows:
2016 2015
Current:
Federal $ (1,306) $ 64,017
State and local (3,468) 3,803
Total current (4,774) 67,820
Deferred (41,055) (85,077)
Total $ (45,829) $ (17,257)
A reconciliation of the statutory U.S. federal income tax rate to the Company’s effective tax rate for the years
ended March 31, 2016 and 2015 is as follows:
2016 2015
Statutory U.S. federal tax rate 35.0% 35.0%
Increase (decrease) in tax rate resulting from:
State income taxes, net of federal benefit 1.0 (1.0)
Tax loss from sale of investments (1.8) —
Non-deductible expenses 1.9 1.2
Dividend received deduction (63.8) (46.3)
Prior year permanent difference true-up (2.7) 0.4
Utilization of tax credits (15.6) —
Investment basis difference 4.2 9.1
Reserves for tax contingencies (3.0) (10.3)
Others—net (1.5) 0.5
Effective income tax rate (46.3)% (11.4)%
The tax effects of significant temporary differences and carryforwards which result in deferred tax assets and
liabilities as of March 31, 2016 and 2015 were as follows:
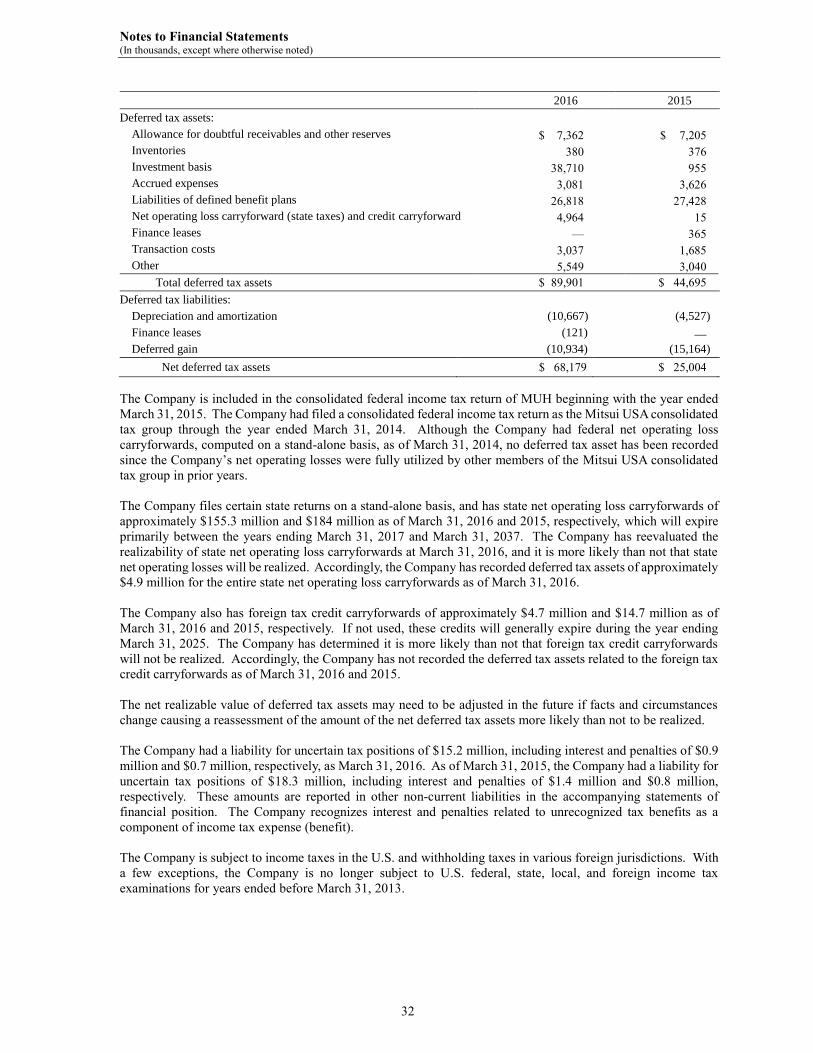
Notes to Financial Statements (In thousands, except where otherwise noted)
32
2016 2015
Deferred tax assets:
Allowance for doubtful receivables and other reserves $ 7,362 $ 7,205
Inventories 380 376
Investment basis 38,710 955
Accrued expenses 3,081 3,626
Liabilities of defined benefit plans 26,818 27,428
Net operating loss carryforward (state taxes) and credit carryforward 4,964 15
Finance leases — 365
Transaction costs 3,037 1,685
Other 5,549 3,040
Total deferred tax assets $ 89,901 $ 44,695
Deferred tax liabilities:
Depreciation and amortization (10,667) (4,527)
Finance leases (121) —
Deferred gain (10,934) (15,164)
Net deferred tax assets $ 68,179 $ 25,004
The Company is included in the consolidated federal income tax return of MUH beginning with the year ended
March 31, 2015. The Company had filed a consolidated federal income tax return as the Mitsui USA consolidated
tax group through the year ended March 31, 2014. Although the Company had federal net operating loss
carryforwards, computed on a stand-alone basis, as of March 31, 2014, no deferred tax asset has been recorded
since the Company’s net operating losses were fully utilized by other members of the Mitsui USA consolidated
tax group in prior years.
The Company files certain state returns on a stand-alone basis, and has state net operating loss carryforwards of
approximately $155.3 million and $184 million as of March 31, 2016 and 2015, respectively, which will expire
primarily between the years ending March 31, 2017 and March 31, 2037. The Company has reevaluated the
realizability of state net operating loss carryforwards at March 31, 2016, and it is more likely than not that state
net operating losses will be realized. Accordingly, the Company has recorded deferred tax assets of approximately
$4.9 million for the entire state net operating loss carryforwards as of March 31, 2016.
The Company also has foreign tax credit carryforwards of approximately $4.7 million and $14.7 million as of
March 31, 2016 and 2015, respectively. If not used, these credits will generally expire during the year ending
March 31, 2025. The Company has determined it is more likely than not that foreign tax credit carryforwards
will not be realized. Accordingly, the Company has not recorded the deferred tax assets related to the foreign tax
credit carryforwards as of March 31, 2016 and 2015.
The net realizable value of deferred tax assets may need to be adjusted in the future if facts and circumstances
change causing a reassessment of the amount of the net deferred tax assets more likely than not to be realized.
The Company had a liability for uncertain tax positions of $15.2 million, including interest and penalties of $0.9
million and $0.7 million, respectively, as March 31, 2016. As of March 31, 2015, the Company had a liability for
uncertain tax positions of $18.3 million, including interest and penalties of $1.4 million and $0.8 million,
respectively. These amounts are reported in other non-current liabilities in the accompanying statements of
financial position. The Company recognizes interest and penalties related to unrecognized tax benefits as a
component of income tax expense (benefit).
The Company is subject to income taxes in the U.S. and withholding taxes in various foreign jurisdictions. With
a few exceptions, the Company is no longer subject to U.S. federal, state, local, and foreign income tax
examinations for years ended before March 31, 2013.
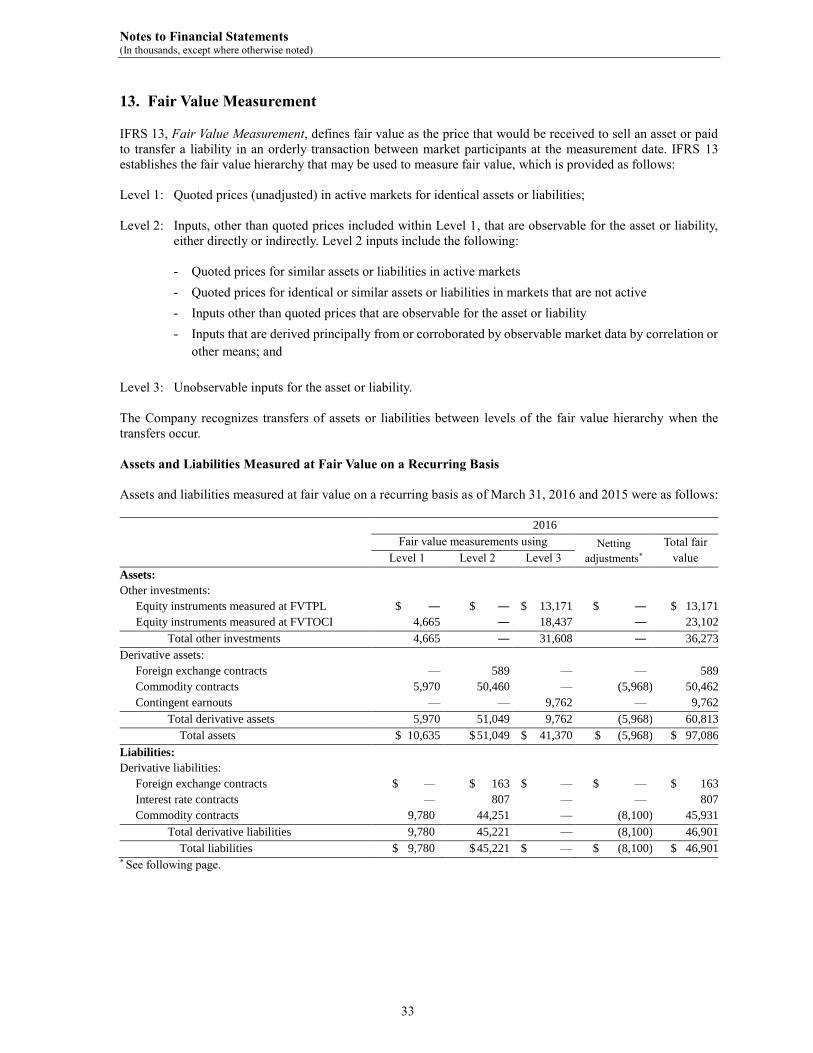
Notes to Financial Statements (In thousands, except where otherwise noted)
33
13. Fair Value Measurement
IFRS 13, Fair Value Measurement, defines fair value as the price that would be received to sell an asset or paid
to transfer a liability in an orderly transaction between market participants at the measurement date. IFRS 13
establishes the fair value hierarchy that may be used to measure fair value, which is provided as follows:
Level 1: Quoted prices (unadjusted) in active markets for identical assets or liabilities;
Level 2: Inputs, other than quoted prices included within Level 1, that are observable for the asset or liability,
either directly or indirectly. Level 2 inputs include the following:
- Quoted prices for similar assets or liabilities in active markets
- Quoted prices for identical or similar assets or liabilities in markets that are not active
- Inputs other than quoted prices that are observable for the asset or liability
- Inputs that are derived principally from or corroborated by observable market data by correlation or
other means; and
Level 3: Unobservable inputs for the asset or liability.
The Company recognizes transfers of assets or liabilities between levels of the fair value hierarchy when the
transfers occur.
Assets and Liabilities Measured at Fair Value on a Recurring Basis
Assets and liabilities measured at fair value on a recurring basis as of March 31, 2016 and 2015 were as follows:
2016
Fair value measurements using Netting
adjustments*
Total fair
value Level 1 Level 2 Level 3
Assets:
Other investments:
Equity instruments measured at FVTPL $ ― $ ― $ 13,171 $ ― $ 13,171
Equity instruments measured at FVTOCI 4,665 ― 18,437 ― 23,102
Total other investments 4,665 ― 31,608 ― 36,273
Derivative assets:
Foreign exchange contracts — 589 — — 589
Commodity contracts 5,970 50,460 — (5,968) 50,462
Contingent earnouts — — 9,762 — 9,762
Total derivative assets 5,970 51,049 9,762 (5,968) 60,813
Total assets $ 10,635 $ 51,049 $ 41,370 $ (5,968) $ 97,086
Liabilities:
Derivative liabilities:
Foreign exchange contracts $ — $ 163 $ — $ — $ 163
Interest rate contracts — 807 — — 807
Commodity contracts 9,780 44,251 — (8,100) 45,931
Total derivative liabilities 9,780 45,221 — (8,100) 46,901
Total liabilities $ 9,780 $ 45,221 $ — $ (8,100) $ 46,901 * See following page.
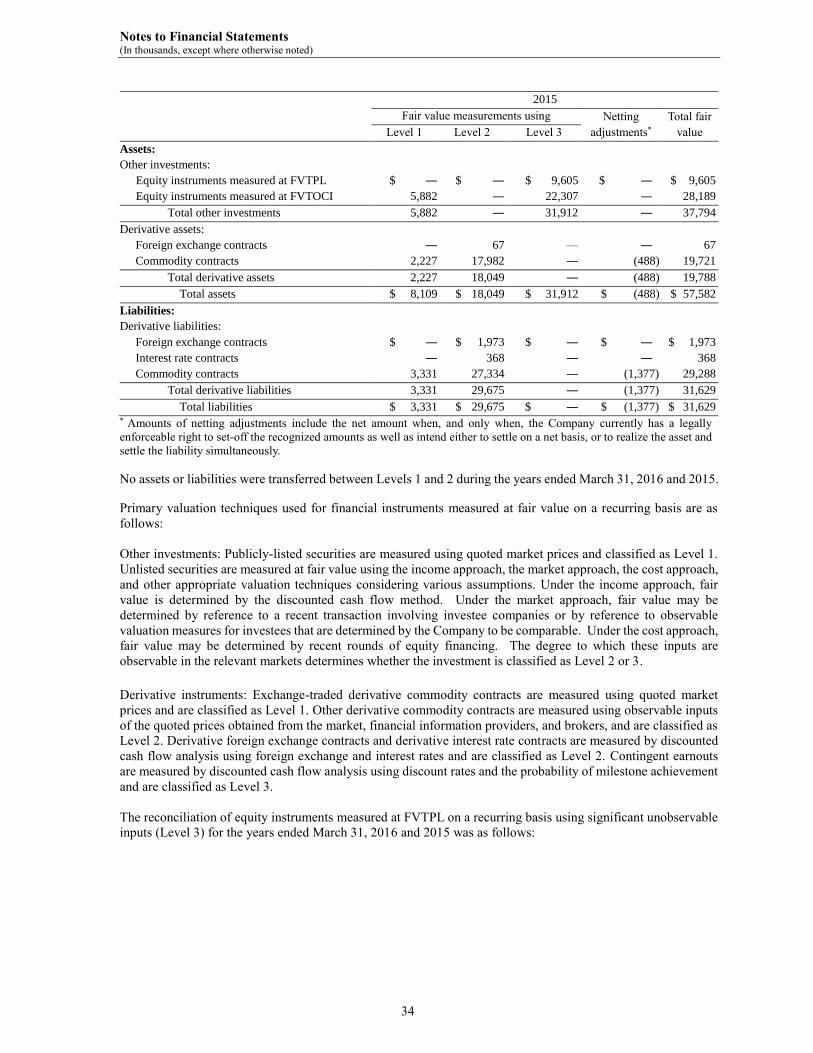
Notes to Financial Statements (In thousands, except where otherwise noted)
34
2015
Fair value measurements using Netting
adjustments*
Total fair
value Level 1 Level 2 Level 3
Assets:
Other investments:
Equity instruments measured at FVTPL $ ― $ ― $ 9,605 $ ― $ 9,605
Equity instruments measured at FVTOCI 5,882 ― 22,307 ― 28,189
Total other investments 5,882 ― 31,912 ― 37,794
Derivative assets:
Foreign exchange contracts ― 67 — ― 67
Commodity contracts 2,227 17,982 ― (488) 19,721
Total derivative assets 2,227 18,049 ― (488) 19,788
Total assets $ 8,109 $ 18,049 $ 31,912 $ (488) $ 57,582
Liabilities:
Derivative liabilities:
Foreign exchange contracts $ ― $ 1,973 $ ― $ ― $ 1,973
Interest rate contracts ― 368 ― ― 368
Commodity contracts 3,331 27,334 ― (1,377) 29,288
Total derivative liabilities 3,331 29,675 ― (1,377) 31,629
Total liabilities $ 3,331 $ 29,675 $ ― $ (1,377) $ 31,629 * Amounts of netting adjustments include the net amount when, and only when, the Company currently has a legally
enforceable right to set-off the recognized amounts as well as intend either to settle on a net basis, or to realize the asset and
settle the liability simultaneously.
No assets or liabilities were transferred between Levels 1 and 2 during the years ended March 31, 2016 and 2015.
Primary valuation techniques used for financial instruments measured at fair value on a recurring basis are as
follows:
Other investments: Publicly-listed securities are measured using quoted market prices and classified as Level 1.
Unlisted securities are measured at fair value using the income approach, the market approach, the cost approach,
and other appropriate valuation techniques considering various assumptions. Under the income approach, fair
value is determined by the discounted cash flow method. Under the market approach, fair value may be
determined by reference to a recent transaction involving investee companies or by reference to observable
valuation measures for investees that are determined by the Company to be comparable. Under the cost approach,
fair value may be determined by recent rounds of equity financing. The degree to which these inputs are
observable in the relevant markets determines whether the investment is classified as Level 2 or 3.
Derivative instruments: Exchange-traded derivative commodity contracts are measured using quoted market
prices and are classified as Level 1. Other derivative commodity contracts are measured using observable inputs
of the quoted prices obtained from the market, financial information providers, and brokers, and are classified as
Level 2. Derivative foreign exchange contracts and derivative interest rate contracts are measured by discounted
cash flow analysis using foreign exchange and interest rates and are classified as Level 2. Contingent earnouts
are measured by discounted cash flow analysis using discount rates and the probability of milestone achievement
and are classified as Level 3.
The reconciliation of equity instruments measured at FVTPL on a recurring basis using significant unobservable
inputs (Level 3) for the years ended March 31, 2016 and 2015 was as follows:

Notes to Financial Statements (In thousands, except where otherwise noted)
35
2016 2015
Balance at beginning of year $ 9,605 $ 8,606
Remeasurement losses (1,096) (1)
Purchases 5,500 1,000
Sales (875) ―
In-kind distribution 37 ―
Balance at end of year $ 13,171 $ 9,605
The remeasurement losses related to equity instruments measured at FVTPL were included in other expense in
the accompanying statements of comprehensive income.
The reconciliation of equity instruments measured at FVTOCI on a recurring basis using significant unobservable
inputs (Level 3) for the years ended March 31, 2016 and 2015 was as follows:
2016 2015
Balance at beginning of year $ 22,307 $ 14,881
Other comprehensive loss (3,870) (824)
Purchases ― 13,251
Sales ― (2,001)
Transfers out of Level 3** ― (3,000)
Balance at end of year $ 18,437 $ 22,307 ** Certain securities that were previously measured at FVTOCI became publicly-traded during the year ended March 31, 2015.
Other comprehensive loss related to equity instruments measured at FVTOCI was included in remeasurements of
equity instruments in the accompanying statements of comprehensive income.
The reconciliation of contingent earnouts measured at fair value on a recurring basis using significant
unobservable inputs (Level 3) for the year ended March 31, 2016 was as follows:
2016
Balance at beginning of year $ ―
In-kind distribution 9,762
Balance at end of year $ 9,762
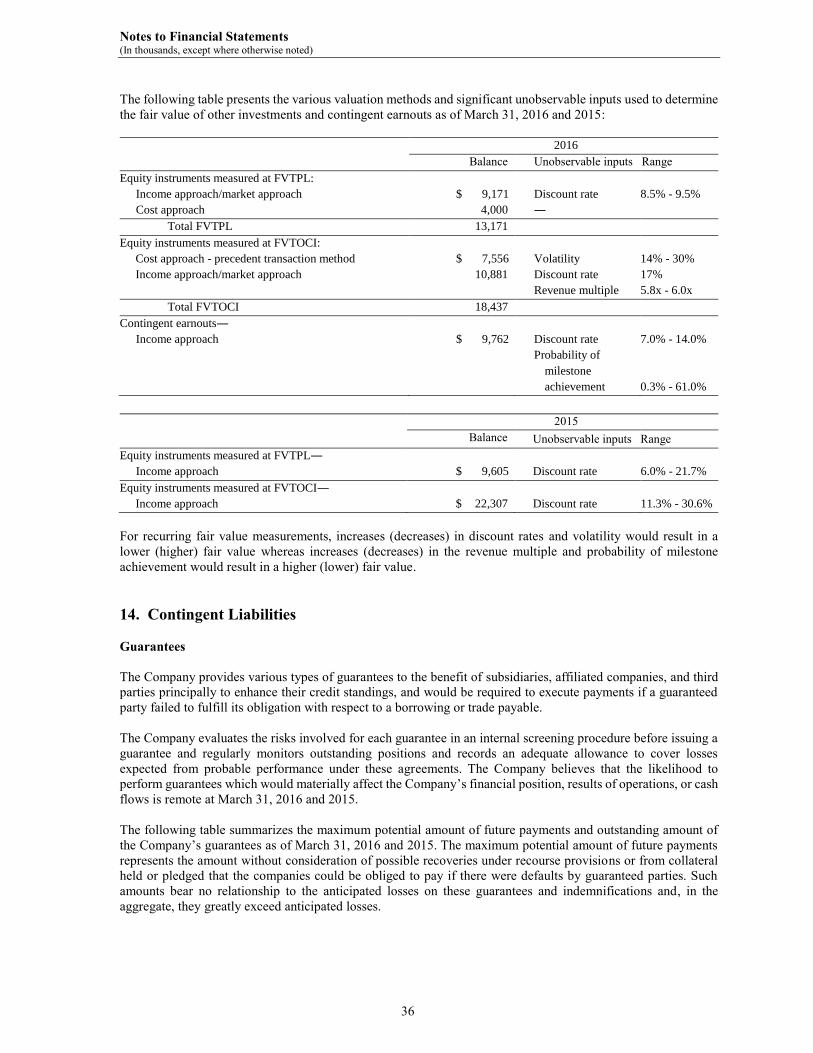
Notes to Financial Statements (In thousands, except where otherwise noted)
36
The following table presents the various valuation methods and significant unobservable inputs used to determine
the fair value of other investments and contingent earnouts as of March 31, 2016 and 2015:
2016
Balance Unobservable inputs Range
Equity instruments measured at FVTPL:
Income approach/market approach $ 9,171 Discount rate 8.5% - 9.5%
Cost approach 4,000 ―
Total FVTPL 13,171
Equity instruments measured at FVTOCI:
Cost approach - precedent transaction method $ 7,556 Volatility 14% - 30%
Income approach/market approach 10,881 Discount rate 17%
Revenue multiple 5.8x - 6.0x
Total FVTOCI 18,437
Contingent earnouts―
Income approach $ 9,762 Discount rate 7.0% - 14.0%
Probability of
milestone
achievement 0.3% - 61.0%
2015
Balance Unobservable inputs Range
Equity instruments measured at FVTPL―
Income approach $ 9,605 Discount rate 6.0% - 21.7%
Equity instruments measured at FVTOCI―
Income approach $ 22,307 Discount rate 11.3% - 30.6%
For recurring fair value measurements, increases (decreases) in discount rates and volatility would result in a
lower (higher) fair value whereas increases (decreases) in the revenue multiple and probability of milestone
achievement would result in a higher (lower) fair value.
14. Contingent Liabilities
Guarantees
The Company provides various types of guarantees to the benefit of subsidiaries, affiliated companies, and third
parties principally to enhance their credit standings, and would be required to execute payments if a guaranteed
party failed to fulfill its obligation with respect to a borrowing or trade payable.
The Company evaluates the risks involved for each guarantee in an internal screening procedure before issuing a
guarantee and regularly monitors outstanding positions and records an adequate allowance to cover losses
expected from probable performance under these agreements. The Company believes that the likelihood to
perform guarantees which would materially affect the Company’s financial position, results of operations, or cash
flows is remote at March 31, 2016 and 2015.
The following table summarizes the maximum potential amount of future payments and outstanding amount of
the Company’s guarantees as of March 31, 2016 and 2015. The maximum potential amount of future payments
represents the amount without consideration of possible recoveries under recourse provisions or from collateral
held or pledged that the companies could be obliged to pay if there were defaults by guaranteed parties. Such
amounts bear no relationship to the anticipated losses on these guarantees and indemnifications and, in the
aggregate, they greatly exceed anticipated losses.

Notes to Financial Statements (In thousands, except where otherwise noted)
37
2016
Maximum potential
amount of future
payments
Outstanding
amount
Type of guarantees:
Guarantees for subsidiaries $ 534,318 $ 90,231
Guarantees for associates and other related parties 86,670 39,984
Guarantees for third parties 9,110 9,110
Total $ 630,098 $ 139,325
2015
Maximum potential
amount of future
payments
Outstanding
amount
Type of guarantees:
Guarantees for subsidiaries $ 769,915 $ 86,468
Guarantees for associates and other related parties 132,807 88,045
Guarantees for third parties 9,110 9,110
Total $ 911,832 $ 183,623
The table below summarizes the maximum potential amount of future payments for the Company’s guarantees
by the remaining contractual periods as of March 31, 2016 and 2015.
2016 2015
Not later than 1 year $ 578,299 $ 786,723
Later than 1 year and not later than 5 years 8,881 23,733
Later than 5 years 42,918 101,376
Total $ 630,098 $ 911,832
Letter of Credit
At March 31, 2016 and 2015, the Company had commercial letters of credit outstanding of approximately $23.8
million and $25.4 million, respectively.
Litigation
Various claims and legal actions are pending against the Company in respect to contractual obligations and other
matters arising out of the conduct of the Company’s business. Appropriate provision has been recorded for the
estimated loss on claims and legal actions. In the opinion of management, any additional liabilities will not
materially affect the financial position, results of operations, or cash flows of the Company.
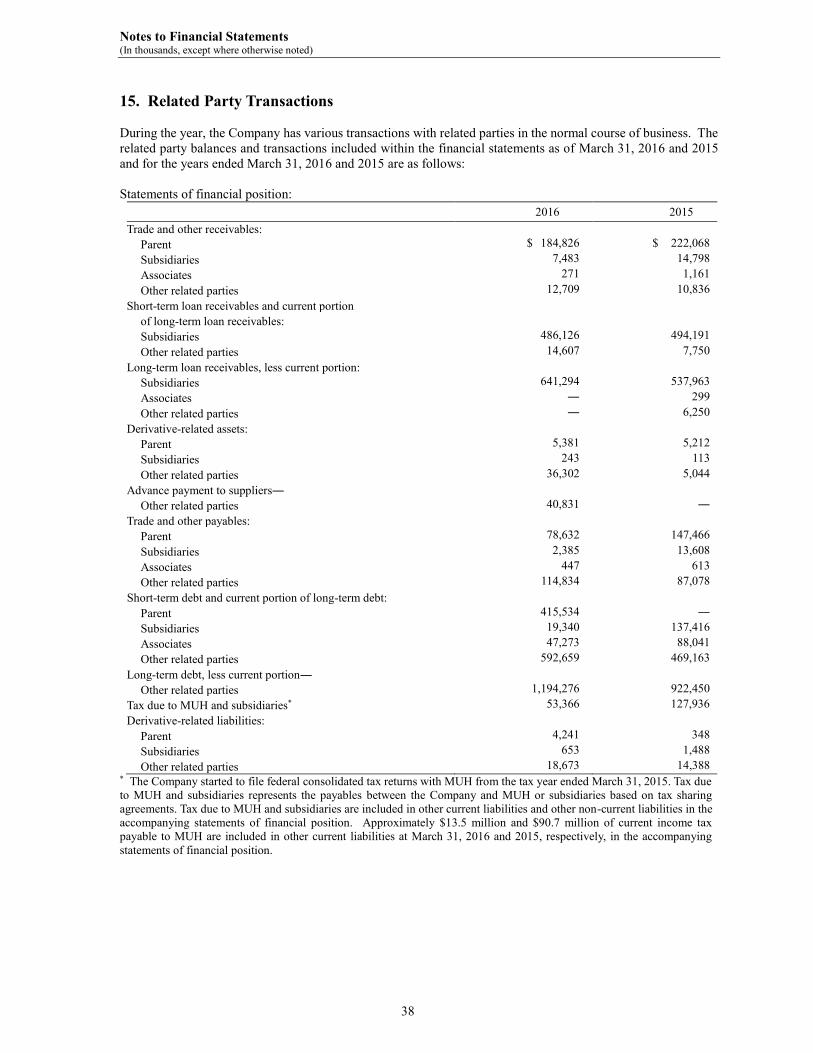
Notes to Financial Statements (In thousands, except where otherwise noted)
38
15. Related Party Transactions
During the year, the Company has various transactions with related parties in the normal course of business. The
related party balances and transactions included within the financial statements as of March 31, 2016 and 2015
and for the years ended March 31, 2016 and 2015 are as follows:
Statements of financial position:
2016 2015
Trade and other receivables:
Parent $ 184,826 $ 222,068
Subsidiaries 7,483 14,798
Associates 271 1,161
Other related parties 12,709 10,836
Short-term loan receivables and current portion
of long-term loan receivables:
Subsidiaries 486,126 494,191
Other related parties 14,607 7,750
Long-term loan receivables, less current portion:
Subsidiaries 641,294 537,963
Associates ― 299
Other related parties ― 6,250
Derivative-related assets:
Parent 5,381 5,212
Subsidiaries 243 113
Other related parties 36,302 5,044
Advance payment to suppliers―
Other related parties 40,831 ―
Trade and other payables:
Parent 78,632 147,466
Subsidiaries 2,385 13,608
Associates 447 613
Other related parties 114,834 87,078
Short-term debt and current portion of long-term debt:
Parent 415,534 ―
Subsidiaries 19,340 137,416
Associates 47,273 88,041
Other related parties 592,659 469,163
Long-term debt, less current portion―
Other related parties 1,194,276 922,450
Tax due to MUH and subsidiaries* 53,366 127,936
Derivative-related liabilities:
Parent 4,241 348
Subsidiaries 653 1,488
Other related parties 18,673 14,388 * The Company started to file federal consolidated tax returns with MUH from the tax year ended March 31, 2015. Tax due
to MUH and subsidiaries represents the payables between the Company and MUH or subsidiaries based on tax sharing
agreements. Tax due to MUH and subsidiaries are included in other current liabilities and other non-current liabilities in the
accompanying statements of financial position. Approximately $13.5 million and $90.7 million of current income tax
payable to MUH are included in other current liabilities at March 31, 2016 and 2015, respectively, in the accompanying
statements of financial position.

Notes to Financial Statements (In thousands, except where otherwise noted)
39
Statements of comprehensive income:
2016 2015
Revenue from related parties:
Parent $ 56,521 $ 41,294
Subsidiaries 688 228
Other related parties 16,265 30,534
Purchases from related parties:
Parent 378,861 415,367
Subsidiaries 417,667 323,731
Other related parties 1,309,391 1,447,627
Service income included in other income:
Parent 54,516 49,012
Subsidiaries 2,433 1,423
Associates 783 354
Other related parties 4,351 3,364
Interest income:
Parent 1,191 1,092
Subsidiaries 14,484 14,018
Associates 15 1,076
Other related parties 626 1,780
Interest expense:
Parent 1,161 ―
Subsidiaries 89 126
Associates 100 15
Other related parties 18,626 19,041
The Company has trading relationships such as sales and purchase of goods with Mitsui Japan and its subsidiaries
and other affiliated companies. The Company enters into certain commodity derivatives transactions with related
parties in order to hedge market risks. Gains and losses on such derivatives transactions are included in purchases
from related parties in above table.
The Company provides short-term and long-term financing to subsidiaries and affiliates. The Company provides
a centralized cash management arrangement whereby subsidiaries and affiliates deposit excess cash for overnight
investments and borrow funds to meet daily working capital needs. The Company provided approximately $2,251
million and $2,286 million line of credit to subsidiaries and affiliated companies effective March 31, 2016 and
2015, respectively. Those lines of credit generally expire within a year. The Company obtains long-term debt
from one of the subsidiaries of Mitsui Japan. The Company had $2,234 million and $2,526 million line of credit
from the affiliated company effective March 31, 2016 and 2015, respectively. Those lines of credit generally
expire within a year. See Note 8 for more details on debt. For most of investing and financing transactions with
related parties, interest accrues at a mutually agreed-upon rate, typically the LIBOR, plus a margin.
During the years ended March 31, 2016 and 2015, the Company renewed loan receivables with original maturities
of more than three months with certain subsidiaries and affiliates in the total amount of $410,053 and $131,492,
respectively, without cash settlement. During the years ended March 31, 2016 and 2015, the Company renewed
debt with original maturities of more than three months with a subsidiary of Mitsui Japan in the total amount of
$420,342 and $356,000, respectively, without cash settlement.
The Company provides various types of guarantees to the benefit of subsidiaries and affiliated companies. See
Note 14 for more details on guarantees. The Company’s loan receivables guaranteed by Mitsui Japan are $40,613
and $32,762 at March 31, 2016 and 2015, respectively. The Company’s debt guaranteed by Mitsui Japan are
$44,373 amd $41,608 at March 31, 2016 and 2015, respectively.
The Company performs certain administrative services for Mitsui Japan, MUH, and other affiliated companies
and receives service fees based on various service agreements. Service fee income is included in other income in
the accompanying statements of comprehensive income.

Notes to Financial Statements (In thousands, except where otherwise noted)
40
The Company has extensive transactions with Mitsui Japan and its subsidiaries and affiliates. Accordingly, the
accompanying financial statements may not be indicative of the financial position, the results of its operations, or
its cash flows which would have been attained by the Company if it had operated without such affiliations.
Key management personnel
Remunerations for members of the Board of Directors, who are considered as key management personnel, for the
years ended March 31, 2016 and 2015 were $2,107 and $2,548, respectively.
16. Ultimate Parent and Controlling Party
Mitsui Japan is the Company’s ultimate parent and controlling party. Copies of the consolidated financial
statements of Mitsui Japan that complies with IFRS are available from:
Mitsui & Co., Ltd.
Corporate Communications Division
1-3, Marunouchi 1-chome, Chiyoda-ku
Nippon Life Marunouchi Garden Tower
Tokyo 100-8631, Japan
17. Subsequent Events
In May 2016, Novus International, Inc. (“Novus”), a 65%-owned subsidiary, completed a series of transactions
that effectively recapitalized Novus. On May 6, 2016, Novus declared a cash dividend to the shareholders. On
May 10, 2016, the Company provided a long-term loan to Novus of $370 million with a 2.72% interest, maturing
on March 31, 2021, and received a cash dividend of approximately $525 million from Novus. On May 11, 2016,
Novus issued additional shares to MUH in exchange for a 43% interest. As a result, the Company’s interest in
Novus decreased to 37%.
18. Authorization of Issuance of Financial Statements
The issuance of the financial statements was authorized by Yasushi Takahashi, President and Chief Executive
Officer, and Yoshimitsu Gushiken, Senior Vice President and Chief Financial Officer, on June 17, 2016.
Office Directory
NEW YORK—Headquarters
200 Park Avenue
New York, NY 10166
212-878-4000
212-878-4800-Fax
CHICAGO
200 East Randolph Drive
Suite 5200
Chicago, IL 60601
312-540-4000
312-540-4026-Fax
CLEVELAND
4125 Highlander Parkway
Suite 220
Richfield, OH 44286
330-659-2920
330-659-3196-Fax
HOUSTON
1300 Post Oak Blvd.
Suite 1700
Houston, TX 77056
713-236-6100
713-236-6134-Fax
LOS ANGELES
350 South Grand Avenue
Suite 3900
Los Angeles, CA 90071
213-896-1100
213-688-1138-Fax
Our Home Page on the Internet:
http://www.mitsui.com
NASHVILLE
25 Century Blvd.
Suite 310
Nashville, TN 37214
615-885-5318
615-885-5483-Fax
SEATTLE
1201 Third Avenue
Suite 1560
Seattle, WA 98101
206-223-5604
206-223-5651-Fax
SILICON VALLEY
535 Middlefield Road
Suite 100
Menlo Park, CA 94025
650-234-5000
650-234-5029-Fax
WASHINGTON, D.C.
750 17th Street, N.W.
Suite 400
Washington, D.C. 20006
202-861-0660
202-861-0437-Fax

Mitsui & Co. (U.S.A.), Inc.
200 Park Avenue New York, New York 10166