Financial Statement Information and Evaluation of Newly...
38
Electronic copy available at: http://ssrn.com/abstract=1599614 Financial Statement Information and Evaluation of Newly Listed High- Technology “Nano Caps” Harri J. Seppänen Aalto University School of Economics Department of Accounting & Finance, Office CG2.12 Runeberginkatu 22-24 00076 Aalto, Helsinki, Finland [email protected] Initial version: August 30, 2008 This version: May 3, 2010 Abstract This study examines the usefulness of financial statement information in evaluating very small newly listed high-technology nano cap firms’ (i.e., market capitalization less than USD 50 million) by employing data from 36 countries during the high investor sentiment era of 1995-2000. I find that financial statement information is useful in screening nano caps from non-nano caps as well as explaining nano caps’ delisting risk and valuing them. The evidence based on these three approaches is consistent with the view that financial statements provide useful information to investors for evaluating high financial risk, hard-to-value firms irrespective of the institutional setting during a high investor sentiment period. Key words: financial statements, nano caps, newly listed firms, delisting, valuation JEL: G15, G18, M41 Acknowledgments: I am grateful to Harri Kalliokoski, Juha Kinnunen, Joni Kokkonen, Antti Miihkinen Mikko Niemenmaa and Lasse Niemi, Mari Onkamo, Janne Seppänen, Pekka Suhonen as well as workshop participants at the Aalto University School of Economics for discussions and comments. Funding for this project was provided by Liikesivistysrahasto. Maarit Karvonen provided excellent research assistance with the data collection.
Transcript of Financial Statement Information and Evaluation of Newly...

Electronic copy available at: http://ssrn.com/abstract=1599614
Financial Statement Information and Evaluation of Newly Listed High-Technology “Nano Caps”
Harri J. Seppänen
Aalto University School of Economics Department of Accounting & Finance,
Office CG2.12 Runeberginkatu 22-24
00076 Aalto, Helsinki, Finland [email protected]
Initial version: August 30, 2008 This version: May 3, 2010
Abstract
This study examines the usefulness of financial statement information in evaluating very small newly listed high-technology nano cap firms’ (i.e., market capitalization less than USD 50 million) by employing data from 36 countries during the high investor sentiment era of 1995-2000. I find that financial statement information is useful in screening nano caps from non-nano caps as well as explaining nano caps’ delisting risk and valuing them. The evidence based on these three approaches is consistent with the view that financial statements provide useful information to investors for evaluating high financial risk, hard-to-value firms irrespective of the institutional setting during a high investor sentiment period.
Key words: financial statements, nano caps, newly listed firms, delisting, valuation JEL: G15, G18, M41
Acknowledgments: I am grateful to Harri Kalliokoski, Juha Kinnunen, Joni Kokkonen, Antti Miihkinen Mikko Niemenmaa and Lasse Niemi, Mari Onkamo, Janne Seppänen, Pekka Suhonen as well as workshop participants at the Aalto University School of Economics for discussions and comments. Funding for this project was provided by Liikesivistysrahasto. Maarit Karvonen provided excellent research assistance with the data collection.

Electronic copy available at: http://ssrn.com/abstract=1599614
1
1. Introduction
In this study I examine whether financial statements provide useful information for
evaluating future prospects of very small newly listed high-technology firms during a high
investor sentiment period. Financial statements provide an important publicly available source of
information for investors in their assessment of a firm’s future prospects. However, their
usefulness in the case of young high-technology firms especially during high investor sentiment
periods, or “market bubbles,” is ambiguous. The accounting system is shown to poorly capture
the economics of such firms (e.g., Lev and Zarowin, 1999; Francis and Schipper, 1999; Core et
al., 2003). Nevertheless, Penman (2003) argues that financial reporting should ideally serve as an
anchor during market bubbles and suppress speculative tendencies.
Small newly listed high-technology firms represent a special challenge to investors and
market regulators. For example, investors and analysts consider firms with low market
capitalization to be highly speculative and risky in general (e.g., Pastor and Veronesi, 2003;
Baker and Wurgler, 2006; Lui et al. 2007). Especially, firms with low market capitalization,
newly listed and operating in the high-technology industry are likely to exhibit “high financial
risk” (e.g., Duff and Phelps, 2008). In fact, the low market capitalization suggests that investors
perceive nano caps to have only modest future potential to generate a substantial amount of
future cash flows.
Similarly, the world’s most prominent market regulator, the Securities Exchange
Commission (SEC) in the U.S., considers small firms to be risky investments for investors due to
the quality of firms, public information available, liquidity and susceptibility to fraud (e.g., U.S.
Securities and Exchange Commission, 2004; see also Lui et al., 2007). Especially risky are
considered to be so-called nano cap firms that have market capitalization less than USD 50
million.1 Nevertheless, one should note that nano caps have been accepted for public trading, and
hence they have passed the criteria imposed in listing standards.
1 For example, the SEC revised the Penny Stock Reform Act of 1990 in 2005 and imposed minimum requirements for newly listed firms to have a positive net income, a market value of listed securities of USD 50 million and a minimum bid price of USD 4 per share. For various definitions of firm size classes used by market participants, see for example www.investordictionary.com, http://financial-dictionary.thefreedictionary.com/, and http://www.investopedia.com/. Nano caps are sometimes interchangeably called penny stocks, micro caps or small caps. However, the important distinction is that penny stock is sometimes defined based only on the maximum stock price level (e.g., less than USD 5.00) regardless of the total market capitalization. Hence, penny stocks are at least partly determined by the number of shares outstanding. Nano caps are, in turn, defined solely based on the total market capitalization.

2
On the other hand, young emerging high-technology firms are considered to be important
for economic growth (see Levine, 1997, 2005). As a response to growing demand by investors
seeking riskier but higher yielding investments, as well as riskier firms with undeveloped
business models and uncertain future cash flows seeking funding for their growth opportunities,
several stock exchanges have developed new, so-called junior or parallel marketplaces that aim
to facilitate such firms’ access to public equity financing.2 The potential role of financial
statement information in facilitating efficient capital allocation among such risky firms is
pronounced due to high uncertainty and undeveloped information environment.
Motivated by the importance of and challenges presented by newly listed high-
technology firms with very low market capitalization, I examine the relevance of financial
statement information, or firm fundamentals measured with accounting data, of newly listed
high-technology nano caps from all over the world during a high investor sentiment period of
1995-2000. I employ data on newly listed firms as they provide an interesting context in which
to examine very small firms, as the initiation of public trading is the first time a firm is exposed
to public market scrutiny and the resulting market valuation reflects investors’ assessment of
their future prospects and ability to generate free cash flows.3 Moreover, the investors’ irrational
behavior and ignorance of firm fundamentals (‘fundamentals don’t matter’) is argued to be
prevalent for speculative firms during high investor sentiment periods (e.g., Malkiel, 1999; Baker
and Wurgler, 2006). I employ international sample of firms to enhance the power of the
statistical tests and to provide more generalizable evidence as the closely related existing
evidence is based on the U.S. data (see Section 2.).4
I conduct my investigation of the usefulness of financial statement information in three
complementary ways. First, I examine whether firm fundamentals provide information for 2 These marketplaces include Alternative Investment Market (AIM) of the London Stock Exchange, the Kosdaq of the Korea Exchange and TSX Venture of the Toronto Stock Exchange. The junior or Small and Medium Enterprise (SME) marketplaces consist of roughly 30 marketplaces and the number of firms traded on SMEs was 7,271 with domestic market capitalization of USD 491.5 billion in 2006. See the Annual Reports of the World Federation of Exchanges for further statistics available at www.-world-exchanges.org. 3 While the hurdle of market capitalization of USD 50 million may seem as an arbitrary cut-off, it has roots in the regulatory and investment practices motivating the upper limit for firm size as discussed above. Nevertheless, such numeric thresholds should be considered suggestive about firm size in relative terms especially across countries as well as to represent heuristic rules of thumb potentially employed by investors and regulators. An alternative method to define very small firms would be to use the sample distribution of market values. However, such definition may lack any intuitive foundation potentially used by investors and regulators. 4 In sum, one may consider the sample in this study to provide an interesting international stress test of the usefulness of accounting information as the sample firms are newly listed, represent high-technology industry and were listed during a presumably irrational market bubble period.

3
categorizing, or screening, newly listed high-technology nano caps by their market capitalization
in the global sample. Categorizing investment targets is argued to be an important mechanism
that investors use to cope with uncertainty in their investment decisions (see Daniel et al. 2002;
Hirshleifer and Teoh 2003; Chan et al. 2004; Hirshleifer et al. 2004). Second, I examine how
firm fundamentals explain nano caps’ tendency to exit after their initial listing year (i.e., delisting
risk). Delisting represents an ultimate failure of a listed firm as a stand alone listed company and
can be a high cost event to investors (e.g., Shumway, 1997; see also Demers and Joos, 2007).
Finally, I examine how firm fundamentals explain the differences in relative valuation among the
nano cap firms. Use of financial statement information in firm valuation is one of its primary
purpose of use and it is a widely employed approach in accounting research (see Kothari, 2001).
These tests aim to mimic three different ways that investors can use financial statement
information, namely, for screening investment candidates, conducting firms’ risk assessment and
executing their relative valuation.
I assign the firm fundamentals measured with financial statement information in three
groups for my empirical tests as follows. Maturity of a firm’s business model is measured with
total assets, return on assets and existence of no sales. A firm’s investment activity is measured
with capital expenditures, R&D expenses and indicators of negative operating income, negative
operating cash flows and no dividends paid. A firm’s financial position is measured with cash
resources, financial leverage, an indicator of existence of no debt and an indicator of negative
equity.
The descriptive evidence in this study reveals that nano caps are common among newly
listed high-technology, comprising roughly 40% of my large sample of 3,915 firms even during a
period of high investor sentiment. This is striking as newly listed high-technology firms are
commonly asserted to exhibit extreme growth opportunities and excessive valuations (e.g.,
Pastor and Veronesi, 2003; Baker and Wurgler, 2006). Most of the 1,543 nano caps (82.9%) in
my sample are located in strong investor protection countries that facilitate relatively better
public external financing for new business ventures, but also relatively higher valuation of firms
in general (e.g., Beck and Demirguc-Kunt, 2006; La Porta et al., 2002). Moreover, the
emergence of nano caps is concentrated (roughly 79%) in the so-called Internet bubble years of
1998-2000, potentially reflecting low quality new listings during that period (e.g., Fama and
French, 2004).

4
My screening analysis on firm fundamentals based on multivariate logistic regression
model shows that firm fundamentals separate nano caps from non-nano caps. In particular, nano
cap firms are more likely to have firm fundamentals that are associated with less mature business
models, less investment activity to create both tangible and intangible future cash-generating
assets, and more limited liquid resources to support future investments, and hence to exploit
growth opportunities, than their non-nano cap counterparts.
Moreover, I document based on my risk assessment analysis using logistic regression
method that firm fundamentals are significant determinates of nano caps’ tendency to delist. That
is, the evidence shows that firms that exit under poor financial conditions invest more in
intangible assets and are financially weaker. There is also some evidence that more mature firms
are more likely to exit. Furthermore, the speed of the exit after the initial listing year is higher for
firms with more mature business models, higher investment activity and weaker financial
positions based on the Cox proportional hazard model that accounts for the potential bias
introduced by data being right-hand censored.
Finally, the evidence from my relative valuation analysis using multivariate ordinary least
squares regression technique indicates that firms with less mature business models but relatively
higher investment activity in tangible assets and operating and organizational intangible assets
(but not in R&D) and weaker financial positions are valued relatively higher among the nano cap
firms. The evidence also is consistent with prior research on the unconventional valuation of
high-technology firms during the new economy era.
Overall, the evidence in this study indicates that the accounting-based firm fundamentals
measuring the maturity of a small newly listed business venture, the intensity of activity to create
tangible and intangible assets, and financial strength are important in screening nano caps,
assessment of their survival as a stand alone listed company and valuation. The results are
consistent with the view that financial statements provide useful information for evaluating
future viability of small, newly listed high-technology business ventures that are potentially
engaged in new, innovative business activities and exhibit high uncertainty regarding their future
profitability. The results are robust to controlling for the level of investor protection in a firm’s
domain. In fact, the evidence suggests that country level factors including controls for investor
5
protection have relatively modest explanatory power relative to firm specific fundamentals
measured with financial statement data.5
This study contributes to our understanding of the usefulness of financial statement
information of young hard-to-value high-technology business ventures’ in the context of a global
new list markets in three main ways. First, this study is first to focus on the usefulness of
financial statement information for newly listed high-technology firms that are presumably
highly speculative, difficult to value and very small in terms of their market capitalization but
large in number. Second, the study adds new evidence on the role of financial statement
information in valuing (e.g., Demers and Lev, 2001; Bartov et al., 2002; Hand, 2003, 2005;
Armstrong et al., 2006; Aggrawal et al., 2007) and assessing the delisting risks of newly listed
high technology firms (e.g., Bhattacharya et al., 2009; Demers and Joos, 2007) showing that
financial statement information is important for evaluating such high financial risk firms
regardless of the institutional setting. Finally, my study uses three complementary approaches to
examine and to validate the results on the usefulness of financial statement information, while
the extant research typically employs only one of the approaches employed in this study.
This study is organized as follows. Section 2 discusses the relevant literature on the
association between firm fundamentals and delisting and valuation and makes testable
predictions. Section 3 discusses the sample. Section 4 presents the analysis and results. Section 5
concludes.
2. Relevant literature and predictions
In this section, I focus on studies that examine the relationships between firm
fundamentals, performance and market valuation with emphasis on small firms and high-
technology firms. In general, Pastor and Veronesi (2003) argue that young firms are likely to
exhibit greater uncertainty about their future profitability. Baker and Wurgler (2006) suggest that
newer (younger, newly listed), smaller, more volatile in terms of stock returns, unprofitable, non-
dividend paying, distressed or with extreme growth potential (i.e., less stable firms) firms are
highly sensitive to market sentiments. Lui et al. (2007) conjecture that analysts consider riskier
5 While most of the nano caps in my sample are from strong legal investor protection countries (e.g., the English Law system), the country-specific factors associated with the legal protection of investors as suggested in the law and finance literature (see La Porta et al., 2000) add only marginally to the explanatory power of my empirical models.

6
firms to have high leverage, low market-to-book and low market capitalization. Smaller firms
also earn on average higher returns than larger firms due to their higher riskiness (Banz, 1981;
see also Ibbotson, 2005).
Moreover, the information environment is likely to be more challenging for investors in
the case of newly listed smaller firms. Grinblatt and Titman (2002) argue that informational
problems are the highest among new lists for which there is potentially little proven track record,
historical information and comparative firms. The listing process in general is documented to be
informationally inefficient, and not all public information is fully incorporated into the offer
pricing range (Lowry and Schwert, 2004). The information environment is also poorer for
smaller firms than for larger firms (e.g., Atiase, 1985).
2.1. Low valuation and firm performance
While valuation theory in general asserts that firms with relatively higher profitability
and growth and/or lower risk are valued at a higher level, prior studies have not examined the
determinants of nano caps or penny stocks relative to higher valued firms. However, the research
on so-called penny stock IPOs (stock price less than USD 5.00) indicates that such firms are
riskier in general. For example, Bradley et al. (2005) find that U.S. penny stock IPOs are more
severely underpriced than other IPOs (that is, they have higher initial returns) and perform even
worse than other IPOs in the long-run. Seguin and Smoller (1997) document that U.S. penny
stocks are less likely to survive as listed firms and thus exhibit relatively higher exit or
“mortality” rates. In contrast to expectations, they find no evidence that mortality is associated
with market capitalization. Carpentier and Suret (2007) find that for Canadian penny stock IPOs,
only firm size (equity over CAD 25 million) and industry are significantly associated with firm
success, measured as graduation to a higher level exchange from a junior market, while
profitability among other firm characteristics are not. Finally, a related study on small business
IPOs in Young and Zaima (1988) finds that younger firms (a measure of risk) perform relatively
more poorly than older firms after the listing of their stock.
2.2. Survival of newly listed firms
In general, there is considerable uncertainty regarding the long-term viability of newly
listed technology firms (Jain et al., 2008). The evidence from small firms indicates that a strong

7
financial position is an essential protection against financial distress for small businesses in
general (see Mudambi and Treichel, 2005). In fact, Welsh and White (1981) argue that liquidity
is even more important than profitability. Hambrick and D’Aveni (1988), in turn, document that
a higher financial leverage (debt-to-equity) ratio and a lower profitability (ROA) are associated
with corporate failures. Similarly, Mudambi and Treichel (2005) find that the probability that
newly listed Internet ventures run into cash crises is increasing in a weaker financial position,
measured by debt to total assets and equity and firm size to total assets, among other criteria.
However, the evidence on newly listed, young, high-technology firms also emphasizes
investments in future assets as a key to survival. Jain and Kini (1999) find that while firms that
go public early in their growth cycle (e.g., unprofitable firms) are more likely to risk failure, the
firms in high R&D intensity industries are more likely to survive.
The evidence from newly listed high-technology firms suggests that the delisting risk is
associated with firm fundamentals. In particular, Bhattacharya et al. (2009) and Demers and Joos
(2007) examine the delisting risk for newly listed internet firms and high-technology (excluding
internet) firms, respectively.6 In particular, smaller firms (Bhattacharya et al., 2009; Demers and
Joos, 2007), firms with lower profitability (Demers and Joos, 2007), firms with higher leverage
(Bhattacharya et al., 2009; Demers and Joos, 2007) and firms with lower R&D (Demers and
Joos, 2007) are more likely to delist. In addition to firm fundamentals, other factors are
associated with survival. Jain et al. (2008) find that the probability of the future profitability of
newly listed technology firms decreases with pre-IPO investor demand and changes with the top
management team, but increases with venture capital participation, the proportion of outsiders on
the board, and pre-market valuation uncertainty. On the other hand, a higher delisting risk is
associated with a lower stock price (Bhattacharya et al., 2009; Demers and Joos, 2007) and a
shorter firm age (Demers and Joos, 2007).7
2.3. Valuation of high-technology firms
The valuation theory demonstrates that a firm’s value is a function of its expected
profitability, growth and risk. In particular, value increases in profitability and growth but 6 In general, the reasons for involuntary delisting by exchange or market regulators are due to (i) violations of listing rules related to market performance such as minimum market value and trading volume and (ii) adverse or poor operating performance-related insolvency or bankruptcy (e.g., Macey et al., 2005). 7 Duff and Phelps (2008) suggest that small caps consists of a disproportionate number of high-technology firms, start-ups, and recent IPOs, which are inherently riskier than firms with a track record of viable performance.

8
decreases in riskiness of a business venture. However, the extant evidence provides mixed and
perhaps seemingly contradicting evidence to the conventional valuation theory on the association
between firm fundamentals and the value of newly listed high-technology firms.
2.3.1. Fundamental determinates of valuation multiples for high-technology firms
The evidence from valuation multiples of high-technology firms in Bhojraj and Lee
(2002) shows that, in addition to average industry valuation multiples, operating profit margin,
negative profitability, forecasted growth and R&D expenses, Enterprise Value/Sales (EVS) is an
important determinate of a relative firm valuation multiple, while leverage and ROA are not. On
the other hand, average industry valuation multiples, operating profit margin, negative
profitability, growth, R&D expenses, leverage and ROE are all important determinates of a
relative equity valuation multiple, price-to-book (P/B). Profitability, growth leverage and ROE
and R&D were all positively associated with valuation multiple, while loss was negatively
associated with it.
2.3.2. Value relevance of financial statement information in venture capital IPOs
Value relevance of financial statements for early stage high-technology firms during pre-
IPO and post-IPO time periods is documented in Hand (2005) and Armstrong et al. (2006). Hand
(2005) finds that the value-relevance of financial statement information increases as the firm
matures consistently with financial statements, capturing the increasing intensity of assets-in-
place relative to future investment options. In particular, Hand (2005) documents that for listed
ventures, cash, noncash assets and sales are positively associated with the pre-money valuation
of venture-backed biotechnology firms, while long-term debt is negatively associated. He finds
no evidence that R&D, among other expenses, is significantly associated with firm value during
the first year of listing. Armstrong et al. (2006) find that post-IPO venture-backed firms’ sales
are positively associated with market value (‘value enhancing’), while cost is negatively
associated with market value (‘value diminishing’). However, for pre-IPO costs, sales,
marketing, general and administrative expenses are all value enhancing. They argue that the
evidence is consistent with venture-backed firms having a strong “investment aspect,” as the
companies build a platform/infrastructure to growth and validate their business model(s).

9
Moreover, Armstrong et al. (2006) suggest that cash is the single most important balance sheet
asset for early-stage, venture-backed companies.
2.3.3. Valuation of Internet IPOs
Several studies have examined the valuation of Internet firms during the new economy
era (1995-2000). In general, the evidence in these studies is mixed regarding the association
between firm fundamentals and value. In particular, Trueman et al. (2000) find no significant
association between net income and market prices. They find that the evidence is consistent with
the claim that financial statement information has limited usefulness for the valuation of Internet
firms. However, the decomposition of net income into its components shows that gross profits
are positively associated with value. Bartov et al. (2002) find that cash flows, sales, and sales
growth are significantly related to offer prices, while earnings, book value of equity, and R&D
are not significantly associated with the IPO offer price. They argue that the valuation of Internet
firms departs from conventional wisdom, with earnings not being priced and negative cash flows
being priced perhaps because they are viewed as investments.
Moreover, Hand (2003) documents that IPO valuation is linearly and positively
associated with book value of equity but negatively and concavely related to income before non-
recurring items. However, Hand (2003) also documents that the value is not related to sales and
cost of goods sold. Aggrawal et al. (2007) finds a V-shaped valuation relationship in which firms
with more negative earnings have higher valuations than do firms with less negative earnings,
and firms with more positive earnings have higher valuations than firms with less positive
earnings. They suggest that negative earnings are a proxy for growth opportunities for internet
firms. Furthermore, Hand (2003) and Demers and Lev (2001) find that R&D and marketing
expenses are positively associated with value, consistent with the idea that such expenses are
implicitly capitalized by investors to create intangible assets. Finally, Demers and Lev (2001)
find that cash burn is a significant valuation driver. This finding is consistent with the positive
valuation of various expenses and negative earnings, suggesting that the current period’s
reported expenses are considered value-enhancing investments in the future.
2.4. Empirical predictions

10
Based on the prior literature, I make the following predictions regarding the relationship
between the newly listed nano caps’ fundamentals, their exit from public trading and valuation.
The predictions are summarized in Exhibit 1 together with the description of instruments
measured with financial statement data employed to measure the underlying constructs. The
measurement of variables is discussed in Section 4.
First, what are the firm fundamentals that distinguish nano cap from non-nano cap firms
among newly listed high-technology firms; alternatively, what determines a firm’s market
capitalization based size category when it becomes a public company? I predict that nano caps
are firms with relatively less mature business models, less activity in creating future tangible and
intangible assets, as well as less financial resources. The above literature indicates that the
market values relatively higher firms with larger sales, assets or profitability, which are
considered here as measures of the maturity of a firm’s business model.
Moreover, investment activity in creating future intangible assets, as reflected by higher
R&D expenses, negative operating profitability and operating cash flows, as well as future
tangible assets, as reflected by larger capital expenditures, is valued at a higher level. Also, a low
or no dividends paid reflects that a firm invests its potential profits back into its future
operations. Finally, the above evidence also suggests that an important determinant of a firm’s
financial strength for young innovative firms is liquid resources. However, the level of financial
leverage, and especially a relatively higher level of debt financing, is also considered to reduce a
firm’s financial strength and flexibility, while no debt indicates that a firm has high debt
capacity. Conventionally interpreted, a negative book value of equity reflects that a firm is in
financial distress (e.g., Dichev, 1999).
Second, which nano caps are likely to exit from public trading? Essentially the
predictions are the same as for the factors that separate nano caps from non-nano caps. I predict
that nano caps that are more likely to exit relative to the other nano caps have relatively less
mature business models, less activity in creating future tangible and intangible assets, as well as
lower financial strength. The motivation for these predictions is the same as above.
Finally, I predict that nano caps that have higher relative valuation among the nano caps
have, based on the evidence on the unconventional valuation of high-technology firms during the
new economy period of 1995-2000 discussed in previous section, less mature business models,
more activity in creating future tangible and intangible assets, as well as greater financial

11
resources (see also Pastor and Veronesi 2003). In other words, I expect that the fundamental laws
of valuation are not applicable to nano caps in general in terms of firm maturity especially
regarding firm size and profitability measures.
In sum, the above predictions suggest that financial statement data reflecting maturity of
a firm’s business model, firm’s investment activity and its financial strength should provide
useful information for evaluating newly listed high-technology nano caps.
3. Sample
My sample of nano cap firms consists of newly listed high-technology firms all over the
world that were listed during 1995-2000. I collect the sample firms and data on them from the
Worldscope (WS) database in Thomson ONE Banker. I require that the firms’ primary industry is
high-technology.8 I further require that the sample firms have data on their market capitalization,
total assets, sales, net income, equity, cash flow from operating activities, and cash and short-
term investments at the end of a reporting year. The new lists are determined based on
Worldscope and Datastream databases in Thomson ONE Banker.
Given the substantial differences even in the information regarding the initial listing year
in these two databases, I include only firms for which the year of the initial recording of the
market capitalization data at the end of the reporting year in Worldscope is the same or earlier
than the year of the initial market price data in Datastream. This procedure aims to ensure that
there is reasonable certainty that the correct year is selected as a firm’s initial listing year and
also that there is data on firm fundamentals available in Worldscope.
Finally, I eliminate firms that have re-entries to listing (i.e., missing data in the time-
series of market capitalization) to avoid double counting firms with potentially multiple initial
entries (i.e., an initial entry, exit and a re-entry). These criteria result in a sample of 3,915 newly
listed high-technology firms in different stock exchanges in 48 countries from 1995-2000. Of
these newly listed firms, I identify 1,543 (or approximately 40%) newly listed nano cap firms
with a market capitalization less than USD 50 million at the end of the initial listing year from 36
countries.
8 The classification of high-technology firms is based on Standard Industrial Codes (SIC) as defined in Kasznik and Lev (1995), Francis and Schipper (1999), Bhojrah and Lee (2002), Bushee et al. (2003) and AeA's High-Tech Industry Definition. AeA was formerly the American Electronics Association (http://www.aeanet.org/).

12
Panel A of Table 1 reports the distribution of the newly listed high-technology nano cap
firms by country and initial listing year. The 1,543 sample firms are from 36 countries. The data
shows that most sample firms are domiciled in the US (908 firms or 58.8%), while the countries
with the second and third greatest numbers of newly listed high-technology firms are the U.K.
(111 firms or 7.2%) and Canada (87 firms or 5.6%). All other countries have less than 5% of the
all sample firms. Interestingly, most of the nano caps were listed during the bubble years 1998-
2000 (1,212 firms or 78.5%) when market valuations were exceptionally high in general.
Panel B of Table 1 reports the newly listed nano caps by legal system as classified in La
Porta et al. (1997). A large majority (82.9%) of the nano cap sample firms are from countries
classified as having an English Legal System. While the evidence is consistent with the view that
better legal protection of the investors enhances the public financing for new innovative business
ventures (e.g., Rajan and Zingales, 1998; Beck and Levine, 2002), it is surprising as it
contradicts the evidence that firms in English Law systems have, on average, higher valuations
(La Porta et al., 2002). The other legal systems have a fairly similar portion of firms constituting
each, roughly five percent of the nano cap sample firms.
Panel C of Table 1 reports the sample distribution of the newly listed sample firms by the
three-digit SIC industry code. Roughly 40% or 625 sample firms are from the programming
industry (SIC 737). The electronics industry (SIC 361-369) is the second largest with 279
(18.1%) nano caps. The biotechnology industry (SCI 283, 385 and 873) has 214 nano cap new
lists (13.9%) and the measurement, analysis and control instruments sector has 196 (12.7%) nano
caps. Communications (SIC 481-484 and 489) and Computers (SIC 357) have 123 (8.0%) and 79
(5.1%) newly listed nano caps, respectively.
Table 1 also reports the fraction of nano caps of all newly listed high technology firms in
my sample. Interestingly, Germany and German legal system countries as well as the
Communications industry have a considerably lower portion of nano caps of all the newly listed
high-technology firms. On the other hand, several countries with a low number of newly listed
firms tend to have a relatively higher portion of nano caps than the overall average, except for
Korea. This is consistent with the evidence that countries with more constraint access to public
equity financing in general also have lower valuation levels in general (e.g., La Porta et al.,
2002).

13
4. Results
The empirical predictions in the previous section posit that the relative maturity of a
firm’s business model, investment activity and financial position are key factors affecting a
firm’s survival and valuation. My analysis of nano caps is conducted in three steps. First, I
examine firm fundamentals that separate nano caps from non-nano cap firms. Second, I examine
how firm fundamentals are associated with the delisting risk of nano caps. Finally, I examine
how the firm fundamentals are associated with firm value among nano caps.
4.1. Description of key independent variables
The description of the variables that are related to firm fundamentals based on financial
statement data constructed for the empirical analysis are summarized in Exhibit 1 along with the
predictions of the signs for the three tests. Table 2, in turn, provides descriptive statistics on the
variables.9 All variables on firm fundamentals are measured at the end of the reporting year.
Maturity of the business model. Relatively more mature firms with relatively more
proven business models are likely to be relatively larger and more profitable. I measure the
maturity of a firm’s business model with the following proxy variables. I measure firm size with
total assets (Assets), which reflects the assets-in-place currently. I measure the profitability with
return on assets (ROA) calculated as operating income divided by total assets. I also construct an
indicator variable for firms that have no sales revenue (ZeroSales). A firm with no sales receives
a value of one, and a firm with positive sales receives a value of zero. New lists that have no
sales revenue are likely to be in the early stages of their life-cycle.10
Investment activity. Firms that invest in operations and various types of assets are
relatively more likely to create tangible and intangible assets that generate relatively greater
future cash flows. As proxies for firms’ investment activity, I employ capital expenditure
(Capex), measured as capital expenditure divided by total assets, to reflect investments in
tangible assets and R&D expenses divided by total assets (RD) as investments in creating
intangible assets. Moreover, I construct indicator variables for negative ROA (NegROA) and 9 I do not report correlations among variables, as several of my variables are indicator variables for which a correlation analysis is not a proper method. Nevertheless, the correlations among the variable and also diagnostics of the multivariate analysis indicate no harmful multicollinearity. 10 I also considered firm age as a measure of firm maturity. However, a thorough search for complete information on the sample firms’ age in Worldscope and Datastream databases provided only scant data to calculate firm age. Consequently, I am not able to use such data. Also, growth of the firm’s sales, a measure of the maturity of a firm, is not available for a large number of my newly listed sample firms in the WS database and, hence, is omitted here.

14
negative operating cash flows (NegCFO) that receive a value of one, if the profitability is
negative, and zero otherwise. I also employ an indicator variable that receives a value of one if
the firm pays no dividends (ZeroDiv) and zero if it does. New lists that have negative
profitability or cash flows (that is, revenues do not cover expenses) and/or pay no dividends but
potentially invest income back in operations if operations are profitable are likely to be in the
early stages of their life-cycle and make investments in setting up their operating infrastructure
as well as creating future intangible assets such as organizational assets and brand.
Financial position. Financial resources are invaluable for new, growth-seeking business
ventures. Without sufficient financial resources, any attempt to create tangible or intangible
assets is imperiled. I measure a firm’s financial resources with liquidity calculated as cash and
short-term investments divided by total assets (Cash). I further consider the degree of a firm’s
indebtedness as a measure of financial flexibility. In particular, I construct two measures. The
first measure is long-term debt divided by total capital (Debt), where the total capital is long-
term debt plus shareholders’ equity. The other debt-related variable is an indicator variable that
receives a value of one if the firm has no debt (ZeroDebt) and zero otherwise. In general, a firm
with a relatively lower degree of debt financing or no debt is likely to have more financial
flexibility due to better debt capacity. Moreover, a low debt burden allows management greater
operating flexibility to execute its strategy. Finally, I include in my analysis an indicator variable
that receives a value of one if a firm’s book value of equity is negative (NegEquity) and zero
otherwise. A negative book value of equity is considered an indicator of financial distress
(Dichev, 1998). As a result, a firm’s financial flexibility is likely to be severely limited.
However, note that as my sample is constructed of newly listed high-technology firms, which
have gone through the exchange listing application process and thus a test of viability, one could
also argue that negative book value is due to heavy investments in future assets by a firm with
growth opportunities.
4.1. What separates nano caps from non-nano caps?
My first empirical test aims to examine firms’ accounting fundamentals that explain why
a newly listed high-technology firm is “classified” by the equity market as a nano cap. That is,
the market evaluates the present value of future cash flows discounted with the risk-adjusted
required rate of return as less than USD 50 million. My prediction states that firms with

15
relatively less mature business models, less investment activity in future cash generating assets
and less financial resources are more likely to become nano caps at the end of the initial listing
year.
I employ the market price data at the end of the initial listing year for two main reasons.
A pragmatic reason is that identification of the initial listing dates, access to financial statement
data in tier prospectuses and the availability of market prices on the initial listing date are not
available for my large sample of global new lists. A fundamental reason is that even the access to
the initial pricing data of the new issues does not necessarily equalize the pricing process of new
lists due to, for example, differential allocation and floatation of shares as well as market
stabilization (see Ritter and Welch, 2002, and Eckbo et al., 2007), including differences in the
existence of pre-markets (e.g., Cornelli et al., 2006). Moreover, even in the U.S., where stock
markets are considered to be most informationally efficient, the pricing process is not fully
efficient (Lowry and Schwert, 2004). Consequently, I choose to standardize the data across the
sample firms by drawing stock market and financial statement data at the end of the initial listing
year. This potentially allows both private and public information to be impounded into the stock
price, generating an informationally more efficient estimate of a firm value and, hence, reflecting
its future profitability.
Table 2 provides descriptive statistics on the variables in my sample of 1,543 newly listed
high-technology nano caps and a sample of 2,372 newly listed high-technology firms for which
the market capitalization exceeds USD 50 million at the end of the initial listing year. Potential
influential outliers and extreme observations are not eliminated from the descriptive data. The
evidence indicates that nano caps are significantly (Wilcoxon test p-value less than 0.05) smaller,
in addition to the market capitalization (Mcap), in terms of sales (Sales) and total assets (Assets).
They are also more likely to have no sales revenues (ZeroSales). Furthermore, they are less
profitable (ROA).
Moreover, nano caps have a lower level of capital expenditures (Capex), and R&D
expenses (RD)11 are more likely to have negative profitability (both NegROA and NegCFO).
Also, nano caps are slightly less likely to pay dividends than non-nano caps. Finally, nano caps 11 A very low average R&D investment is puzzling, as the sample industries are from high-technology industries. An explanation for observed low R&D expenses is that firms, especially from non-U.S. reporting regimes, did not report such information in their public financial statements, and as a result, it was not available for the WS database. If this is the case, then the RD variable should be interpreted as a measure that reflects not only the level of R&D, but also the extent of reporting such presumably important information to investors.

16
carry less debt (Debt) and are more likely to carry no debt (ZeroDebt) but are more likely to have
negative equity (NegEquity). Overall, the descriptive analysis indicates that nano caps have less
mature business models, engage less in investment activity, and have weaker financial positions.
Also, nano caps are valued at a lower level, as reflected by market capitalization (Mcap) and
relative valuation measures (price-to-book ratio, PB, and Tobin’s q, TQ).
I employ a logistic regression technique to examine the firm fundamentals that are
associated with a firm being a valued as a nano cap by the capital markets. I eliminate potential
influential observations in my multivariate analysis as they may cause violations of critical
assumptions underlying the multivariate methods employed. The outliers are identified with an
analog to Cook’s D statistic for logistic regressions. Observations with D statistic values in
excess of one are eliminated (e.g., Belsley et al., 1980) in Tables 2 through 6. The dependent
variable is an indicator variable that receives a value of one if a newly listed firm’s market
capitalization at the end of its initial listing year is less than USD 50 million and zero otherwise.
In addition to the key fundamental variables, the model controls for a firm’s growth
opportunities as measured with book-to-price ratio (BP), industry membership and listing year
fixed-effects.
I further examine the sensitivity of the results to different country-specific controls
employing the instruments developed in law and finance literature. Model 1 has no controls for
country-specific factors. In Model 2 I employ controls for the disclosure levels in a country, as
classified in Bhattacharya et al. (2003). Model 3 controls for judicial efficiency, as rated in La
Porta et al. (1997). Model 4 controls for antidirector rights, as classified in La Porta et al. (1997).
The legal system specific (English Law, French Law, German Law, Scandinavian Law and
unclassified countries as a benchmark) controls are employed from La Porta et al. (1997).
Models 2 to 5 also include a U.S. country dummy, as close to 60% of the 3,915 sample firms are
from the U.S. The number of observations available for a particular model also varies by the
number of observations available on country-specific control variables.
The results reported in Table 3 show that regardless of the type of the country-specific
control, nano caps tend to have significantly (at a conventional five percent level) less assets-in-
place, as measured with total assets (Assets), and engage less in investment activities to create
tangible (Capex) and intangible assets (RD). Moreover, they have less financial resources, as
measured with liquid assets (Cash). In contrast to expectations, the negative operating cash flows

17
(NegCFO) variable is significantly and negatively associated with a newly listed firm’s tendency
to be a nano cap, while negative profitability measured with accrual-based measure ROA
(NegROA) is positively associated with nano cap firm category. One may speculate that this is
due to newly listed nano caps’ potential tendency to record more non-cash or accrual-based
expenses such as write-offs of past investments during their initial listing year having a negative
impact on their accrual result (ROA) but leaving the operating cash flows (CFO) intact.
All other proxies for financial strength except cash (that is, Debt, ZeroDebt, NegEquity)
as well as a firm’s tendency to pay dividends (DivPaid) and book-to-price ratio (BP), a market-
based proxy for growth opportunities, are not significant. Of the country-specific controls,
disclosure level and efficiency of the judicial system are significant and negatively associated
with a firm being a nano cap, indicating that nano caps are more likely to emerge in countries
with relatively lower disclosure requirements and/or judicial efficiency, after controlling for
other factors. This is consistent with the evidence on lower valuation of firms in countries with
weaker investor protection (La Porta et al. 2002). However, the various country-specific controls
employed in this study contribute only marginally to the explanatory power of the models,
suggesting that firm fundamentals are important cross-sectional drivers of a firm’s size class,
measured with market capitalization regardless of the firm domain.
In sum, the evidence in Table 3 indicates that nano caps are likely to have less mature
business models reflected in assets-in-place, less investment activity to create both tangible and
intangible future cash generating assets, and less liquid resources that can be employed to
support future investments and, hence, exploit growth opportunities. The evidence on
multivariate analysis does not suggest that nano caps are more likely to be financially distressed
or exhibit a higher financial risk in general, beyond lower liquid resources, than their non-nano
cap counterparts. The evidence provides support to the view that financial statement information
provides important information for investors in order to evaluate a newly listed high-technology
firms future growth opportunities and as a result in valuing them relative to other industry
counterparts globally.
4.2. Delisting risk of nano caps
Next I examine whether fundamentals are associated with a nano cap’s exit from public
trading or delisting risk. My prediction states that firms with relatively less mature business

18
models, less investment activity in future cash generating assets, and less financial resources are
more likely to exit public trading..
In my main analysis I employ a logistic regression. The dependent variable receives a
value of one if the firm exited public trading under different scenarios and zero otherwise. In
Model 1, the dependent variable is simply an exit from public trading under any condition,
including both voluntary (e.g., acquisitions by another company) and involuntary (e.g., violations
of listing standards) delistings. I identify the year in which a firm exited public trading by
observing the omission of year end market capitalization data in the Worldscope database.12
There are 413 firms, or 26.9% of the nano caps sample firms, that exited public trading. The
problem with such a general exit variable is that the exit can be a positive or negative event. The
analysis here is more concerned about firm exit under potential financial difficulties.
Consequently, in Models 2 and 3, I employ exit variables that are associated with financial
distress.
In Model 2, the dependent variable receives a value of one if the firm exited and its
equity is negative at the end of the last available reporting year. There are 188 (12.3%) such
firms. A negative book value of equity is considered to indicate a firm in financial distress
(Dichev, 1998). In Model 3, the dependent variable receives a value of one if the firm exited and
its price-to-book at the end of the last available reporting year is less than one. The valuation
theory asserts that firms with a price-to-book ratio less than one are considered to destroy
shareholders’ wealth by the market (e.g., Penman, 2007). There are 290 (18.9%) such exit firms.
The exits are identified within a three-year tracking period; that is, a firm is considered to
be delisted if there is no market capitalization data available at the end of the fourth year of being
a listed firm. In addition to the variables discussed above, I also include the natural logarithm
transformation of the total market capitalization (LnMcap) at the end of a firm’s initial listing
year and an indicator variable that receives a value of one if the firm’s auditor is a Big N auditing
firm (BigN) and zero otherwise. The two control variables have been documented to be
associated with a firm’s delisting risk (e.g., Li et al., 2006).13 Also, the additional control
variables, as all firm fundamental-related variables, are measured at the end of the initial listing 12 I am not aware of any global database with data on the exits and, in particular, reasons for the exits. I examined the Worldscope and Datastream databases, but these included no statements regarding exits. 13 Other potentially informative variables about a firm’s delisting risk include the reputation of a firm’s investment banker and involvement of a venture capitalist (e.g., Li et al., 2006). However, I do not have access to such data on a global basis.

19
year, except for BigN, which is measured at the moment of data collection in 2004, as the WS
database does not provide historical information on the auditor by each reporting year. Again, I
control for the industry and listing year fixed effects as well as U.S. country effects and the effect
of legal system, measured by judicial efficiency (La Porta et al., 1997), as an important control
for country-specific factors related to a firm’s access to finance and growth opportunities. The
results on country and jurisdiction-related controls are not reported in Table 4 in the interest of
brevity.14
The results in Table 4 shows that market capitalization (LnMcap) is systematically
significantly and negatively associated with firm exit across the three models. In other words,
relatively larger nano caps are more likely to survive as listed firms. In contrast, relatively larger
firms measured with the natural logarithm transformation of assets (LnAssets) are more likely to
exit in general (Model 1) and under a low price-to-book ratio condition. This is in contrast to the
idea that relatively more viable firms with mature business models are less likely to exit public
trading. There is also evidence in Models 2 and 3 that nano caps that have engaged themselves
relatively more in R&D activity (RD) or that have negative equity (NegEquity) and negative
operating cash flows (NegCFO) are more likely to exit under financial distress conditions.
Also, assets-in-place (LnAssets) is positively associated with exit under a low price-to-
book condition (Model 3). No other variable is statistically significantly associated with a nano
cap firm’s propensity to exit. Overall, the evidence suggests that nano caps that are relatively
larger in terms of market capitalization but not necessarily in terms of assets-in-place. Also,
financially stronger nano caps that have engaged relatively less in R&D activity as well as in
creating operational and organizational assets (positive operating cash flows) are more likely to
survive in public trading during the three-year tracking window employed in this study.
Consequently, the evidence indicates that financial statement information is useful for investors
in evaluating a newly listed nano cap’s delisting risk.
I also estimated time to exit, or speed of exit, using the Cox proportional hazard model (a
survival analysis) as an additional related analysis. The estimation procedure adjusts for the
potential bias introduced by truncated data due to the unobservables of a firm’s survival period
beyond four years in my dataset. The results for the three exit conditions, as discussed above, are
14 I employ JudEff (La Porta et al., 1997) in Tables 4 though 6, as it is significant in Table 3 and facilitates more observations than the Disclosure (Bhattacharya et al., 2003) variable, which is the only other investor protection and capital market functioning-related variable that is significant.

20
reported in Table 5. While the results are consistent regarding the market capitalization
(LnMcap), assets-in-place (LnAssets), R&D activity (RD), negative equity (NegEquity) and
liquid resources (Cash) in Table 4, the negative operating cash flow (NegROA) is not significant
anymore. On the other hand, both operating profitability (ROA) and capital expenditures (Capex)
become significantly and positively associated with the time to exit under the financial distress
conditions in Models 2 and 3. Overall, the results suggest that nano cap firms with lower market
capitalization, negative equity, relatively more investments in tangible and intangible assets, but
higher profitability are likely to exit relatively sooner from public trading. The results are
consistent with the idea that financial statement information provides a useful basis for investors
to assess a newly listed nano cap’s delisting risk.
4.3. Valuation of nano caps
My final analysis focuses on how firm fundamentals explain cross-sectional differences
in firm relative valuation among the nano caps. The dependent variable, which measures relative
valuation of a firm, is a natural logarithm of Tobin’s q, calculated as total assets less book value
of equity plus market value of equity divided by book value of total assets at the end of a
reporting year, following the literature on international valuation (e.g., La Porta et al., 2002;
Doidge et al., 2003).
In addition to the fundamental variables employed in the previous models, I also include
auditor type (BigN) and an average industry valuation multiple of Tobin’s q for a control of
annual industry-wide valuation effects of all (3,915) newly listed firms, calculated based on
global industry membership (e.g., Kim and Ritter, 1999; Bhojraj and Lee, 2002; Bhojraj et al.,
2003). The models control for industry effects, listing year effects, U.S. country fixed-effects and
judicial efficiency for each country (coefficients not reported).
I modify my benchmark model (Model 1) to include two naïve indicator variables as a
proxy for a firm’s delisting risk under negative equity (ExitNegEq) in Model 2 and low valuation
(ExitLowPB) in Model 3, as defined in the previous analysis. This implicitly assumes that the
market has perfect foresight of a firm’s exit within the three year tracking window. I expect that
the exit under poor financial conditions is costly to the firm and its investors and, consequently,
expect that the sign of the exit indicator variables is negative in Models 2 and 3.
21
Table 6 reports the results. The results show that in all model specifications, the value of
a firm is associated significantly and negatively with assets-in-place (LnAssets) and profitability
(ROA). In contrast, it is significantly and positively associated with no sales variable
(ZeroSales). These results are consistent with the unconventional valuation of high-technology
firms during the high investor sentiment period under study, 1995-2000. Moreover, the value of
a firm is significantly and positively associated with capital expenditures (Capex) and negative
operating cash flows (NegCFO). These results are consistent with market valuing firms with
relatively higher investment activity at a higher level. However, there is no evidence that R&D
(RD), negative ROA (NegROA) or dividends paid (DivPaid) are significant factors in valuing
nano caps. Further, only negative equity (NegEquity) is significantly associated with a firm’s
value with a positive sign. This is consistent with the unconventional valuation of high-techs and
suggests that negative equity, through negative retained earnings, is considered a proxy for past
investments made to achieve future profitable growth. Other variables of financial strength are
not significantly associated with firm value. It is especially surprising that liquid cash resources
(Cash) are not significantly associated with firm value or delisting propensity (Tables 4 and 5),
as they are an important resource for high-technology firms (e.g., Armstrong et al., 2006).
Finally, the naïve indicator variable for a firm’s delisting risk is significant and negatively
associated with the firm value only in Model 2 but not in Model 3. This suggests that investors
are able to rationally anticipate a firm’s propensity to delist under some conditions, and it may
provide them price protection, at least under some conditions. The evidence also suggests that
investors use information from other sources, beyond the information reflected by the variables
included in Model 3 in Table 6, to evaluate the delisting risk under poor conditions.
Overall the results suggest, consistently with the arguments in Pastor and Veronesi
(2003) as well as with Baker and Wurgler (2006) and the evidence on unconventional valuation
as discussed in Section 2, that firms with greater uncertainty about their future profitability (e.g.,
less mature business models, negative profitability due to relatively greater investments in assets
that are expensed immediately and weaker financial position) are valued relatively higher among
nano caps. Despite of the unconventional valuation of the fundamental signals, the evidence in

22
Table 6 provides support to the view that financial statement information is useful for valuing
such hard-to-value business ventures.15
5. Conclusions
The usefulness of financial statement information in evaluation of hard-to-value firms
such as small, young newly listed high-technology firms is an important question especially
during the periods of high investor sentiment. In this study I aimed to answer three questions on
the usefulness of financial statement information of newly listed high-technology nano caps.
First, do firm fundamentals measured with financial statement information provide useful
information for separating, or classifying, nano cap firms from non-nano cap firms (i.e., firms
with perceived remote growth opportunities from superior growth opportunities)? Measuring the
firm characteristics with financial statement data, I find evidence that newly listed nano caps are
likely to have less mature business models, less investment activity to create both tangible and
intangible future cash generating assets, and less liquid resources than can be employed to
support future investments and, hence, exploit growth opportunities as compared to their non-
nano cap counterparts.
Second, do financial statement data explain which nano caps exit the public trading
system or, alternatively stated, do not survive as listed companies and, hence, exhibit a relatively
larger delisting risk? The evidence indicates that the likelihood of exit is greater for firms that
invest more, especially in intangible assets, or that have weaker financial positions (i.e., negative
equity) as well as firms that are valued lower among the nano caps. Similarly, nano cap firms
with higher investment activity, weaker financial positions and higher market valuation but
higher profitability tend to exit public trading sooner than their counterparts.
Finally, is financial statement information relevant for valuing nano caps among their
size category? The evidence shows that firms with less mature business models, relatively higher
investment activity on tangible assets and organizational intangible assets (but surprisingly not in
R&D) and weaker financial positions (i.e., negative equity) are valued relatively higher among
nano caps.
15 The examination of the causes of unconventional valuation is beyond the scope of this paper and is conducted in a concurrent study.
23
Overall, the evidence suggests that the relative maturity of a newly listed business
venture, intensity of activity to create tangible and intangible assets, and also financial strength,
all measured with accounting-based data reflecting firm fundamentals, are important
determinants of nano caps’ valuation and survival as listed companies. The results are consistent
with the view that financial statement information is useful for evaluating the future performance
potential of a hard-to-value new business ventures during high investor sentiment (irrational)
market periods. A potential area for future research is to examine whether accounting contributes
to investors’ misperception of difficult to value firms’ prospects resulting in over- or
undervaluation of such firms.

24
References Armstrong, Chris, Antonio Davila, and George Foster. 2006. Venture-backed Private Equity
Valuation and Financial Statement Information. Review of Accounting Studies, Volume 11, Number 1, March, 2006, 119-154.
Aggarwal, Rajesh, Sanjai Bhagat, and Srinivasan Rangan, 2007. The Impacts of Fundamentals on IPO Valuation. Working Paper (July).
Atiase, Rowland Kwame. 1985. Predisclosure Information, Firm Capitalization, and Security Price Behavior around Earnings Announcements. Journal of Accounting Research, Vol. 23, No. 1 (Spring), pp. 21-36.
Banz, Rolf. 1981. The Relationship between Return and Market Value of Common Stocks. Journal of Financial Economics, 9 (March), pp. 3-18.
Baker, Malcolm, and Jefffrey Wurgler, 2006. Investor Sentiment and the Cross-Section of Stock Returns, Journal of Finance, Vol. 61, No. 4, pp. 1645-1680.
Bartov, Eli, Partha Mohanram, and Chandrakanth Seethamraju, 2002. Valuation of Internet Stocks—An IPO Perspective. Journal of Accounting Research, Vol. 40, No. 2, pp. 321 – 346.
Beck, Thorsten, and Asli Demirguc-Kunt, 2006. Small and Medium-Size Enterprises: Access to Finance as a Growth Constraint. Journal of Banking & Finance, 30, pp. 2931-2943.
Beck, Thorsten, and Ross Levine. 2002. Industry Growth and Capital Allocation: Does Having a Market- or Bank-Based System Matter? Journal of Financial Economics, 64, 147-180.
Belsley, D., Kuh, E. and Welsch, R., 1980. Regression Diagnostics: Identifying Influential Data and Sources of Collinearity, Wiley, New York.
Bhattacharya, Utpal, Hazem Daouk, and Michael Welker, 2003. The World Price of Earnings Opacity. The Accounting Review, Vol. 78, No. 3, pp. 641-678.
Bhattacharya, Nilabhra, Elizabeth Demers, and Philip Joos, 2009. The Relevance of Accounting Information in a Stock Market Bubble: Evidence from Internet IPOs. Journal of Business Finance & Accounting, Forthcoming.
Bhojraj, Sanjeev, and Charles M.C. Lee. 2002. Who Is My Peer? A Valuation-Based Approach to the Selection of Comparable Firms. Journal of Accounting Research, Vol. 40, No.2, (May), pp. 407-439.
Bhojraj, Sanjeev, Charles M.C. Lee, and David T. Ng. 2003. International Valuation Using Smart Multiples. Working Paper (March 14).
Bradley, Daniel J., Cooney, John W., Dolvin, Steven D. and Jordan, Bradford D. 2006. Penny Stock IPOs. Financial Management, Vol. 35, No. 1, Spring, pp. 5-29.
Bushee, Brian J., Dawn A. Matsumoto, and Gregory S. Miller. 2003. Open versus Closed Conference Calls: The Determinants and Effects of Broadening Access to Disclosure. Journal of Accounting and economics, Vol. 34, No. 1-3, pp. 149-180.
Carpentier, Cécile, and Jean-Marc Suret, 2007. The Survival and Success of Penny Stock IPOs: Canadian Evidence. Working paper (October 31).
Chan, Wesley S., Richard Frankel, and S.P. Kothari, 2004. Testing Behavioral Finance Theories Using Trends and Consistency in Financial Performance. Journal of Accounting and Economics, Vol. 38, No. 1, pp. 3-50.
Core, John E., Wayne R. Guay, and Andrew Van Buskirk. Market Valuations in the New Economy: an Investigation of What Has Changed. Journal of Accounting and Economics, Vol. 34, No. 1-3, pp. 43-67.

25
Cornelli, Francesca, David Goldreich, and Alexander Ljungqvist. 2006. Investor Sentiment and Pre-IPO Markets. The Journal of Finance, Vol. 61, No. 3 , pp. 1187–1216.
Daniel, Kent, David Hirshleifer, and Siew Hong Teoh, 2002. Investor Psychology in Capital Markets: Evidence and Policy Implications. Journal of Monetary Economics, Vol. 49, No. 1, pp. 139-209.
Demers, Elizabeth, and Baruch Lev. 2001. A Rude Awakening: Internet Shakeout in 2000. Journal Review of Accounting Studies, Vol. 6, No. 2-3 (June), pp. 331-359.
Demers, Elizabeth, and Philip Joos. 2007. IPO Failure Risk. Journal of Accounting Research, May, Vol. 45 Issue 2, pp. 333-371.
Dichev, Illia D. 1998. Is the Risk of Bankruptcy a Systematic Risk. The Journal of Finance, Vol. 53, No. 3 (June), pp. 1131-1147.
Doidge, Craig A., G. Andrew Karolyi, and René M. Stultz, 2003. Why Are Foreign Firms Listed in the U.S. Worth More? Journal of Financial Economics, Vol. 71, No. 2, pp. 205-238.
Duff & Phleps, 2008. Risk Premium Report 2008. Duff & Phelps, LLC. Eckbo, B. Espen, Ronald W. Masulis, and Øyvind Norli. 2007. Security Offerings. In Handbook
of Corporate Finance: Empirical Corporate Finance - Volume 1. Edited by B. Espen. Elsevier B.V.
Fama, Eugene F., and Kenneth R. French, 2004. New Lists: Fundamentals and Survival Rates. Journal of Financial Economics, Vol. 73, No. 2, 229-269.
Francis, Jennifer, and Kathrine Schipper. 1999. Have Financial Statement Lost Their Relevance? Journal of Accounting Research, Vol.37, pp. 319-352.
Grinblatt, Mark, and Sheridan Titman, 2002. Financial Markets and Corporate Strategy. 2nd. Edition. McGraw-Hill/Irwin.
Hambrick, Donald C., and Richard A. D'Aveni. 1988. Large Corporate Failures as Downward Spirals. Administrative Science Quarterly, Vol. 33, Issue 1 (March), pp. 1-23.
Hand, John R. M. 2003. Profits, Losses, and the Non-Linear Pricing of Internet Stocks. In Intangible Assets edited by John Hand and Baruch Lev. Oxford Management Readers, Oxford University Press, Inc., New York, 2003.
Hand, John R.M. 2005.The Value Relevance of Financial Statements in the Venture Capital Market. The Accounting Review, Volume 80, Issue 2, April, pp. 613-648.
Hirshleifer, David, and Siew Hong Teoh, 2003. Limited Attention, Information Disclosure, and Financial Reporting. Journal of Accounting and Economics, Vol. 36, No. 1-3, pp. 337-386.
Hirshleifer, David, Kewei Hou, Siew Hong Teoh, and Yinglei Zhang, 2004. Do Investors Overvalue Firms with Bloated Balance Sheets? Journal of Accounting and Economics, Vol. 38, No. 1, pp. 297-331.
Ibbotson, 2005. SBBI Valuation Edition 2005 Yearbook. Ibbotson Associates. Jain, Bharat A., Narayanan Jayaraman, and Omesh Kini, 2008. The Path-to-Profitability of
Internet IPO Firms. Journal of Business Venturing, Vol. 23, No. 2, pp 165-194. Jain, Bharat A., and Omesh Kini. 1999. The Life Cycle of Initial Public Offering Firms. Journal
of Business Finance & Accounting, Vol. 26, No. 9-10, pp. 1281 – 1307. Kasnik, Ron, and Baruch Lev, 1995. To Warn or Not to Warn: Management Disclosures in the
Face of an Earnings Surprise. The Accounting Review, Vol. 70, No. 1, pp. 113-134. Kim, Moonchul, and Jay R. Ritter. 1999. Valuing IPOs. Journal of Financial Economics, 53, pp.
409-437.

26
Kothari, S.P., 2001. Capital Markets Research in Accounting. Journal of Accounting and Economics, Vol. 31, No. 1-3, pp. 105-231.
La Porta, Rafael, Florencio Lopez-de-Silanes, Andrei Shleifer, Robert W. Vishny, 2000. Investor Protection and Corporate Governance. Journal of Financial Economics, Vol. 58, pp.3-27.
La Porta, Rafael, Florencio Lopez-De-Silanes, Andrei Shleifer, and Robert W. Vishny. 1997. Legal Determinants of External Finance. The Journal of Finance, Vol. 52, No. 3, July, pp. 1131-1150.
La Porta, Rafael, Florencio Lopez-De-Silanes, Andrei Shleifer, and Robert W. Vishny, 2002. Investor Protection and Corporate Valuation. Journal of Finance, Vol. 57, No. 3, pp. 1147-1170.
Lev, Baruch, and Zarowin, Paul, 1999. The Boundaries of Financial Reporting and How to Extend Them. Journal of Accounting Research, Vol. 37, No. 2, pp. 353-385.
Levine, Ross. 1997. Financial Development and Economic Growth: Views and Agenda. Journal of Economic Literature, 35, pp. 688-726.
Levine, Ross. 2005. Finance and Growth: Theory and Evidence. Handbook of Economic Growth. Eds. Phillipe Aghion and Steven Durlauf, Amsterdam: North-Holland Elsevier Publishers.
Li, Jinliang, Lu Zhang, and Jian Zhou. 2006. Earnings Management and Delisting Risk of Initial Public Offerings. Working Paper (March, 2006).
Lui, Daphne, Stanimir Markov, and Ane Tamayo, 2007. What Makes a Stock Risky? Evidence from Sell Side Analysts’ Risk Ratings. Journal of Accounting Research, Vol. 45, No. 3, pp. 629-665.
Lowry, Michelle, and G. William Schwert. 2004. Is the IPO Pricing Process Efficient? Journal of Financial Economics, Vol. 71, No. 1 (January), pp. 3-26.
Macey, Jonathan, Maureen O’Hara, and David Pompilio, 2005. Down and Out in the Stock Market: The Law and Finance of the Delisting Process. Working Paper.
Mudambi, Ram, and Monica Zimmerman Treichel. 2005. Cash Crisis in Newly Public Internet-Based Firms: An Empirical Analysis. Journal of Business Venturing, Volume 20, Issue 4, Pages 543-571.
Pástor, Ĺuboš, and Pietro Veronesi. 2003. Stock Valuation and Learning about Profitability. The Journal of Finance, Vol. 58, No. 5, pp. 1749-1789.
Penman, Stephen, H. 2003. The Quality of Financial Statements: Perspectives from the Recent Stock Market Bubble. Accounting Horizons, Vol. 17, pp. 77-96.
Penman, Stephen, H. 2007. Financial Statement Analysis and Security Valuation. 3rd. Edition. The McGraw-Hill Companies, Inc.
Rajan, Raghuram G., and Luigi Zingales. 1998. Financial Dependence and Growth. The American Economic Review, Vol. 88, No. 3 (June), pp. 559-586.
Ritter, Jay R., and Ivo Welch. 2002. A Review of IPO Activity, Pricing, and Allocations. The Journal of Finance, Vol. 57, No. 4, pp. 1795–1828.
Sequine, P.J., and M.M. Smoller, 1997. Share Price and Mortality: An Empirical Evaluation of Newly Listed Nasdaq Stocks. Journal of Financial Economics, Vol. 45, pp. 333-363.
Tyler Shumway, Tyler, 1997. The Delisting Bias in CRSP Data. The Journal of Finance, Vol. 52, No. 1, pp. 327-340.
Trueman, Brett M. H. Franco Wong, and Xiao-Jun Zhang, 2000. The Eyeballs Have It: Searching for the Value in Internet Stocks. Journal of Accounting Research, Vol. 38 (Supplement), pp. 137–162.

27
U.S. Securities Exchange Commission, 2004. Microcap Stock: A Guide for Investors. www.sec.gov/investor/pubs/microcapstock.htm (August).
Welsh, John A., and Jerry F. White. 1981. A Small Business Is Not a Little Big Business. Harvard Business Review, Vol. 59, Issue 4 (July/August), pp. 18-27.
Young, John E., and Janis K. Zaima, 1988. The Aftermarket Performance of Small Firm Initial Public Offerings. Journal of Business Venturing, 3, pp. 77-87.

28
Exhibit 1Description of variables and predicted signs
Expected signsVariable Description Size class Exit ValuationIndependent variables
Maturity of the business model(Ln)Assets Total assets at the end of the reporting year. LnAsset is a
natural logarithm of one plus total assets.- - +
ROA Return on assets calculated as operating income divided by total assets at the end of the reporting year.
- - +
ZeroSales Indicator variable that receives a value of one if sales is zero and zero otherwise.
+ + ?
Investment activityCapex Capital expenditure divided by total assets. - - +RD R&D expenses divided by total assets. - - +NegROA Indicator variable that receives a value of one if profitability is
negative and zero otherwise.+ + +
NegCFO Indicator variable that receives a value of one if operating cash flows is negative and zero otherwise.
+ + +
DivPaid Indicator variable that receives a value of one if dividends are positive (i.e., paid) and zero otherwise.
- - ?
Financial positionDebt Long-term interest-bearing debt-to-total capital (i.e.,
shareholders’ equity plus long-term interest-bearing debt).+ + ?
ZeroDebt Indicator variable that receives a value of one if debt is zero and zero otherwise.
- - +
NegEquity Indicator variable that receives a value of one if equity less than zero and zero otherwise.
+ + +
Cash Cash and short-term investments divided by total assets. - - +Controls
Mcap Total market capitalization at the end of the reporting year. LnMcap is a natural logarithm of one plus market capitalization.
na. - na.
Sales Net sales for the reporting period. LnSales is a natural logarithm of one plus sales.
na. na. na.
BP Total book value of shareholders’ equity divided by total market capitalization at the end of the reporting year.
+ + na.
IndMultiple Listing year specific harmonic mean of Tobin's q calculated annual basis based on newly listed firms in the same three-digit SIC industry.
na. na. +
AuditBig An indicator variable that receives a value of one if a firm's auditor is a member of Big N and zero otherwise.
+ - +
Disclosure Level of financial disclosure in a country. See Bhattacharya et al. (2003).
+ ? +
JudEff Level of judicial efficiency in a country. See La Porta et al. (1997).
+ ? +
AntiDirRgth Level of antidirector rights in a country. See La Porta et al. (1997).
+ ? +
Legal systems Indicator of legal system (English, French, German, and Scandinavian) in a country. See La Porta et al. (1997).
na. na. na.

29
Exhibit 1 (cont.)Description of variables and predicted signs
Expected signsVariable Description Size class Exit Valuation
Dependent variablesFirm size classification
NanoCap Indicator variable that receives a value of one if market capitalization is below USD 50 million at the end of the initial listing year.
na. na. na.
ExitExit Indicator variable receives a value of one if a firm exited public
trading within a four-year period and zero otherwise. na. na. na.
ExitEqNeg Indicator variable receives a value of one if a firm’s equity is negative at the end of the reporting year prior to exit and zero otherwise.
na. na. -
ExitPBLow Indicator variable that receives a value of one if PB is below one at the end of the reporting year prior to exit and zero otherwise.
na. na. -
ValuationLnTQ A natural logarithm of Tobin's q. Tobin's q calculated as total
assets less book value of equity plus market capitalization at the end of the initial listing year divided by total assets at the end of the year.
na. na. na.

30
Table 1Sample of newly listed (NL) high-technology nano caps by country, legal system, industry and listing year
Panel A: Nanocaps by country % of All % of 1995 1996 1997 1998 1999 2000 Total total NL NL
Australia 2 1 2 4 5 40 54 3,5 87 62,1Austria 0 1 0 0 0 2 3 0,2 13 23,1Belgium 0 0 0 0 0 1 1 0,1 4 25,0Bermuda 0 0 0 0 2 1 3 0,2 3 100,0Brazil 0 0 0 1 6 3 10 0,6 13 76,9Canada 1 3 3 25 28 27 87 5,6 189 46,0Chile 0 0 0 0 3 0 3 0,2 4 75,0Czech Republic 0 0 1 0 0 0 1 0,1 5 20,0Denmark 0 2 0 1 0 0 3 0,2 19 15,8Finland 0 1 1 0 3 4 9 0,6 30 30,0France 0 8 5 8 10 12 43 2,8 103 41,7Germany 0 0 0 2 5 23 30 1,9 164 18,3Hong Kong 2 5 1 1 0 24 33 2,1 74 44,6Indonesia 0 0 0 0 1 3 4 0,3 8 50,0Ireland 0 0 0 0 1 0 1 0,1 5 20,0Israel 1 1 0 0 2 3 7 0,5 28 25,0Japan 0 0 0 0 0 6 6 0,4 44 13,6Korea, Republic of 0 0 2 7 25 24 58 3,8 107 54,2Malaysia 0 0 2 1 1 14 18 1,2 28 64,3Mexico 0 0 0 1 0 0 1 0,1 5 20,0Netherlands 0 0 0 1 1 1 3 0,2 24 12,5New Zealand 0 0 0 1 0 0 1 0,1 2 50,0Norway 0 2 1 2 1 3 9 0,6 22 40,9Pakistan 0 1 0 0 0 1 2 0,1 3 66,7Philippines 0 0 0 0 0 6 6 0,4 15 40,0Poland 1 0 0 1 0 2 4 0,3 12 33,3Portugal 0 1 0 0 0 0 1 0,1 7 14,3Singapore 0 1 0 0 0 15 16 1,0 46 34,8South Africa 1 0 1 8 19 9 38 2,5 70 54,3Spain 0 0 0 0 1 0 1 0,1 2 50,0Sweden 0 1 3 12 12 26 54 3,5 116 46,6Switzerland 0 1 0 0 0 1 2 0,1 24 8,3Taiwan 0 0 0 0 1 8 9 0,6 94 9,6Thailand 0 0 0 1 0 2 3 0,2 4 75,0U.K. 1 28 26 12 9 35 111 7,2 257 43,2U.S. 88 64 65 485 96 110 908 58,8 2215 41,0Total 97 121 113 574 232 406 1543 100,0 3846 -% of total 6,3 7,8 7,3 37,2 15,0 26,3 100,0 - - 40,1
Panel B: Nano caps by legal system % of All % of 1995 1996 1997 1998 1999 2000 Total total NL NL
English 96 104 100 538 161 280 1279 82,9 3016 42,4French 0 9 5 11 22 26 73 4,7 223 32,7German 0 1 3 9 31 63 107 6,9 427 25,1Scandinavian 0 6 5 15 16 33 75 4,9 187 40,1Missing 1 1 0 1 2 4 9 0,6 62 14,5Total 97 121 113 574 232 406 1543 100,0 3915 -% of total 6,3 7,8 7,3 37,2 15,0 26,3 100,0 - - 39,4
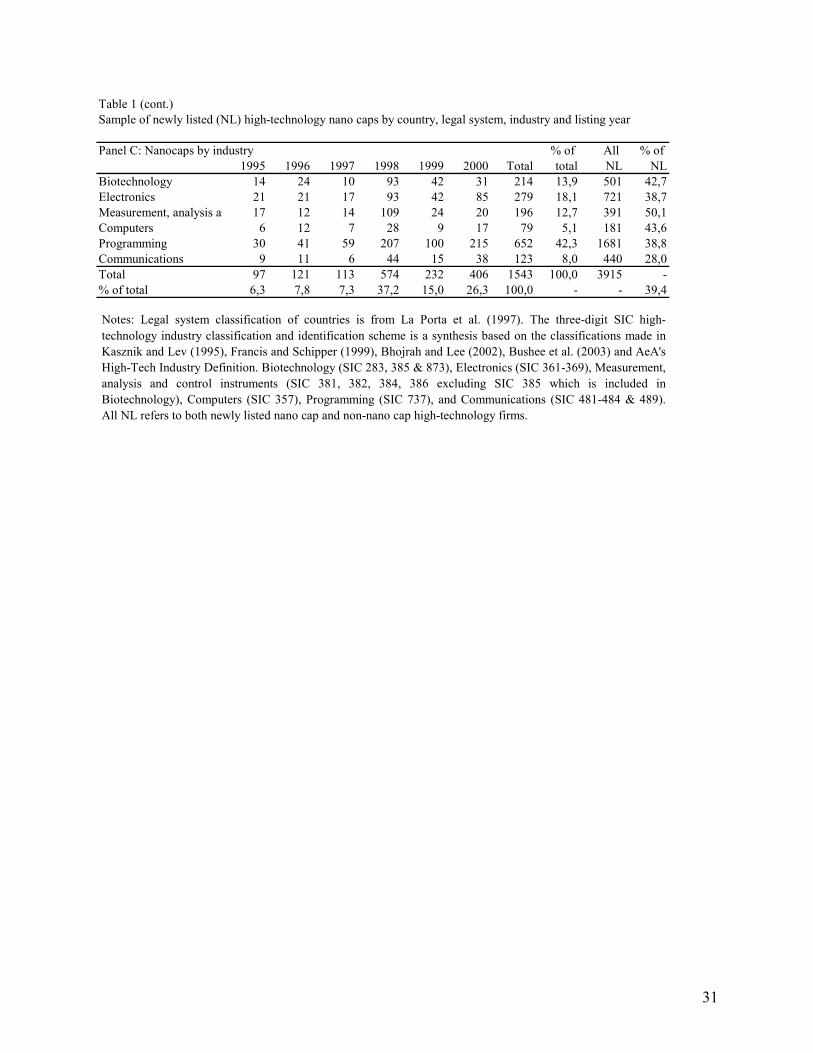
31
Table 1 (cont.)Sample of newly listed (NL) high-technology nano caps by country, legal system, industry and listing year
Panel C: Nanocaps by industry % of All % of 1995 1996 1997 1998 1999 2000 Total total NL NL
Biotechnology 14 24 10 93 42 31 214 13,9 501 42,7Electronics 21 21 17 93 42 85 279 18,1 721 38,7Measurement, analysis an 17 12 14 109 24 20 196 12,7 391 50,1Computers 6 12 7 28 9 17 79 5,1 181 43,6Programming 30 41 59 207 100 215 652 42,3 1681 38,8Communications 9 11 6 44 15 38 123 8,0 440 28,0Total 97 121 113 574 232 406 1543 100,0 3915 -% of total 6,3 7,8 7,3 37,2 15,0 26,3 100,0 - - 39,4
Notes: Legal system classification of countries is from La Porta et al. (1997). The three-digit SIC high-technology industry classification and identification scheme is a synthesis based on the classifications made inKasznik and Lev (1995), Francis and Schipper (1999), Bhojrah and Lee (2002), Bushee et al. (2003) and AeA'sHigh-Tech Industry Definition. Biotechnology (SIC 283, 385 & 873), Electronics (SIC 361-369), Measurement,analysis and control instruments (SIC 381, 382, 384, 386 excluding SIC 385 which is included inBiotechnology), Computers (SIC 357), Programming (SIC 737), and Communications (SIC 481-484 & 489).All NL refers to both newly listed nano cap and non-nano cap high-technology firms.

32
Table 2Descriptive statistics on firm characteristics (independent variables) of newly listed high-technology nano caps and non-nano caps
Nano caps Non-nano caps Wilcoxon
Continuous variables N Median STD N Median STD p-valueMcap 1543 14,7 14,1 2372 206,4 5553,8 0,000Sales 1543 5,4 27,4 2372 34,8 1481,2 0,000Assets 1543 8,5 32,0 2372 70,8 2974,6 0,000ROA 1543 -0,143 85,370 2372 -0,003 1,637 0,000Debt 1543 0,005 1,823 2372 0,010 0,667 0,000Cash 1543 0,201 0,293 2372 0,428 0,301 0,000RD 1543 0,000 1,518 2372 0,012 0,217 0,000Capex 1543 0,036 0,133 2372 0,043 0,083 0,000BP 1543 0,329 11,8 2372 0,205 0,380 0,000TQ 1543 2,010 379593 2372 3,509 12108 0,000
Indicator variables N Event N % of all N Event N % of all p-valueDivPaid 1543 201 0,130 2372 430 0,180 0,000NegROA 1543 1008 0,653 2372 1196 0,504 0,000NegCFO 1543 1046 0,678 2372 1261 0,532 0,000ZeroSales 1543 139 0,090 2372 67 0,028 0,000AuditBig 1543 582 0,380 2372 1810 0,760 0,000ZeroDebt 1543 348 0,226 2372 491 0,207 0,167NegEquity 1543 269 0,1743 2372 60 0,025 0,000
Notes: Description of the variables is provided in Exhibit 1.

33
Table 3Logistic regression of firm characteristics associated with nano cap firms
Model (1) (2) (3) (4) (5)
LnAsset -1,569 *** -1,618 *** -1,621 *** -1,567 *** -1,607 ***(0,000) (0,000) (0,000) (0,000) (0,000)
ROA 0,000 0,000 0,000 0,000 0,000 (0,881) (0,866) (0,874) (0,891) (0,877)
ZeroSales -0,461 -0,409 -0,480 -0,448 -0,474 (0,061) (0,101) (0,052) (0,068) (0,055)
RD -0,371 ** -0,368 ** -0,352 ** -0,359 ** -0,363 **(0,002) (0,002) (0,004) (0,003) (0,003)
Capex -1,622 ** -1,441 ** -1,599 ** -1,542 ** -1,672 **(0,002) (0,005) (0,002) (0,002) (0,001)
NegROA 0,426 ** 0,468 *** 0,554 *** 0,453 *** 0,472 ***(0,001) (0,000) (0,000) (0,000) (0,000)
NegCFO -0,283 * -0,281 * -0,272 * -0,294 * -0,293 *(0,025) (0,028) (0,033) (0,020) (0,020)
DivPaid 0,041 0,057 0,091 0,032 0,023 (0,760) (0,683) (0,513) (0,814) (0,864)
Debt 0,051 0,049 0,051 0,049 0,052 (0,161) (0,186) (0,154) (0,185) (0,148)
ZeroDebt -0,229 -0,189 -0,180 -0,222 -0,197 (0,069) (0,141) (0,160) (0,081) (0,122)
NegEquity 0,019 -0,120 -0,097 -0,009 -0,014 (0,938) (0,624) (0,691) (0,971) (0,956)
Cash -2,236 *** -2,135 *** -2,126 *** -2,198 *** -2,229 ***(0,000) (0,000) (0,000) (0,000) (0,000)
BP 0,011 0,010 0,010 0,010 0,011 (0,077) (0,092) (0,089) (0,094) (0,075)
UScountryD - -0,132 0,165 -0,149 -0,093- (0,273) (0,196) (0,371) (0,484)
Disclosure - -0,03 *** - - -- (0,003) - - -
JudEff - - -0,29 *** - -- - (0,000) - -
AntiDirRgth - - - 0,019 -- - - (0,750) -
English - - - - 0,109- - - - (0,807)
French - - - - 0,100- - - - (0,833)
German - - - - 0,622- - - - (0,173)
Scandinavian - - - - -0,227(0,635)
Constant 5,774 *** 8,225 *** 8,572 *** 5,778 *** 5,859 ***(0,000) (0,000) (0,000) (0,000) (0,000)
Sample N 3912 3792 3869 3870 3912Event N 1540 1503 1532 1532 1540% of firms 0,394 0,396 0,396 0,396 0,394Model chi-square 19,860 20,318 22,788 18,963 17,856Pseudo adj. R2 0,636 0,638 0,643 0,636 0,639

34
Table 3 (cont.)Logistic regression of firm characteristics associated with nano cap firms
Notes: The sample consists of 3,915 newly listed high-technology firms during 1995-2000 from 48 countries.Dependent variable (NanoCap) is an indicator variable that receives a value of one if firm's market capitalization isless than USD 50 million at the end of the initial listing year and zero otherwise. Description of all variables isprovided in Exhibit 1. Potential influential observations receiving value of equal or greater than one based on ananalog of Cook's D statistic for logistic regression are eliminated. The model includes controls for industry andlisting year fixed effects. p-values are reported in parentheses and * is significant at 0.05, ** at 0.01 and *** at0.001 level.

35
Table 4Logistic regression analysis of nano cap firms' propensity to exit public trading under different conditions
Model (1) (2) (3)Exit ExitNegEq ExitLowPB
LnAssets 0,310 *** -0,037 0,265 **(0,000) (0,723) (0,002)
ROA 0,001 0,043 0,033 (0,705) (0,052) (0,080)
ZeroSales -0,084 -0,095 -0,074 (0,724) (0,762) (0,787)
RD 0,132 0,222 * 0,192 *(0,220) (0,023) (0,033)
Capex 0,733 1,046 0,854 (0,105) (0,071) (0,082)
NegROA 0,136 0,407 0,184 (0,406) (0,118) (0,336)
NegCFO 0,169 0,519 * 0,448 *(0,301) (0,040) (0,019)
DivPaid -0,369 -0,201 0,104 (0,073) (0,564) (0,657)
Debt 0,044 0,014 0,016 (0,329) (0,658) (0,623)
ZeroDebt -0,179 -0,362 0,018 (0,283) (0,146) (0,928)
NegEquity 0,132 0,832 *** 0,542 **(0,463) (0,000) (0,005)
Cash -0,010 -0,210 -0,370 (0,968) (0,553) (0,203)
BP -0,005 0,001 0,001 (0,352) (0,917) (0,780)
LnMcap -0,190 * -0,387 *** -0,445 ***(0,013) (0,000) (0,000)
AuditBig 0,124 -0,257 -0,064 (0,361) (0,219) (0,693)
Constant -2,375 ** -0,953 -1,462 (0,001) (0,403) (0,093)
Sample N 1534 1534 1534Event N 413 188 290% firms 0,269 0,123 0,189Model chi-square 8,343 7,086 10,314Pseudo adj. R2 0,082 0,241 0,156
Notes: The sample consists of 1,543 newly listed nano cap high-technology firms during 1995-2000 from 36countries. Dependent variables measure a firm exit under different conditions. Description of all variables isprovided in Exhibit 1. Potential influential observations receiving value of equal or greater than one based onan analog of Cook's D statistic for logistic regression are eliminated. Models control for the U.S. countryfixed-effects, country specific judicial efficiency (JudEff) as well as industry and listing year fixed effects. p-values are reported in parentheses and * is significant at 0.05, ** at 0.01 and *** at 0.001 level.

36
Table 5Cox proportional hazard model for nano cap firms time to exit from public trading
Model (1) (2) (3)Exit ExitNegEq ExitLowPB
LnAssets 0,252 *** 0,068 0,273 ***(0,000) (0,477) (0,000)
ROA 0,001 0,020 ** 0,018 *(0,699) (0,008) (0,018)
ZeroSales -0,051 -0,086 -0,066 (0,799) (0,752) (0,782)
RD 0,073 0,100 ** 0,092 *(0,329) (0,007) (0,011)
Capex 0,536 0,866 ** 0,753 *(0,055) (0,005) (0,012)
NegROA 0,144 0,436 0,217 (0,296) (0,072) (0,197)
NegCFO 0,109 0,388 0,315 (0,430) (0,090) (0,058)
DivPaid -0,297 -0,223 0,054 (0,098) (0,489) (0,793)
Debt 0,039 0,020 0,016 (0,334) (0,527) (0,596)
ZeroDebt -0,183 -0,399 -0,076 (0,194) (0,078) (0,656)
NegEquity 0,129 0,669 *** 0,444 **(0,376) (0,000) (0,005)
Cash -0,001 -0,212 -0,293 (0,995) (0,502) (0,251)
BP -0,002 0,000 0,000 (0,460) (0,908) (0,881)
LnMcap -0,151 * -0,353 *** -0,368 ***(0,016) (0,000) (0,000)
AuditBig 0,113 -0,072 0,040 (0,324) (0,710) (0,783)
Sample N 1534 1534 1534Event N 413 188 290% of firms 0,269 0,123 0,189Chi-square 93,206 225,589 161,641p-value 0,000 0,000 0,000
Notes: The sample consists of 1,543 newly listed nano cap high-technology firms during 1995-2000 from 36countries. Dependent variables measure a firm's exit time under different conditions. Description of allvariables is provided in Exhibit 1. Potential influential observations receiving value of equal or greater thanone based on an analog of Cook's D statistic for logistic regression are eliminated. Models control for theU.S. country fixed-effects, country specific judicial efficiency (JudEff) as well as industry and listing yearfixed effects. p-values are reported in parentheses and * is significant at 0.05, ** at 0.01 and *** at 0.001level.

37
Table 6Valuation of nano cap firms
Model (1) (2) (3)LnTQ LnTQ LnTQ
Constant 1,837 *** 1,856 *** 1,865 ***(7,004) (7,073) (7,125)
LnAssets -0,581 *** -0,583 *** -0,579 ***(23,945) (24,014) (23,906)
ROA -0,017 *** -0,017 *** -0,016 ***(12,295) (12,238) (12,248)
ZeroSales 0,647 *** 0,645 *** 0,643 ***(7,504) (7,479) (7,470)
RD 0,021 0,023 0,024 (1,344) (1,453) (1,501)
Capex 0,547 ** 0,561 ** 0,563 **(3,211) (3,288) (3,309)
NegROA -0,112 -0,109 -0,107 (1,867) (1,818) (1,786)
NegCFO 0,149 * 0,153 * 0,157 **(2,504) (2,570) (2,641)
DivPaid 0,103 0,103 0,105 (1,464) (1,456) (1,492)
Debt -0,002 -0,001 0,000 (0,145) (0,106) (0,079)
ZeroDebt 0,047 0,043 0,048 (0,782) (0,721) (0,804)
NegEquity 0,762 *** 0,78 *** 0,782 ***(11,281) (11,412) (11,551)
Cash 0,138 0,134 0,125 (1,547) (1,499) (1,396)
AuditBig 0,052 0,049 0,048 (1,034) (0,971) (0,973)
IndMultiple 0,065 0,064 0,062 (1,786) (1,753) (1,704)
Exit - -0,121 -0,174 **- (1,687) (2,982)
Adj. R^2 0,609 0,609 0,611N 1534 1534 1534F-statistic 92,808 89,585 90,168F-statistic sig. 0,000 0,000 0,000
Notes: The sample consists of 1,543 newly listed nano cap high-technology firms during 1995-2000 from 36countries. Dependent variable is natural logarithmic transformation of Tobin's q measured at the end of the initiallisting year. Exit refers to ExitNegEquity in Model 2 and ExitLowPB in Model 3. Description of all variables isprovided in Exhibit 1. Potential influential observations receiving value of equal or greater than one based on Cook'sD statistic are eliminated. Model controls for the U.S. country fixed-effects, country specific judicial efficiency(JudEff) as well as industry and listing year fixed effects. t-values are reported in parentheses and * is significant at0.05, ** at 0.01 and *** at 0.001 level.