Financial Statement Comparability and the Expected Crash ...
17
Advances in mathematical finance & applications, 3 (3), (2018), 77-93 Published by IA University of Arak, Iran Homepage: www.amfa.iau- arak.ac.ir * Corresponding author Tel.: +989122182747 E-mail address: [email protected] © 2018. All rights reserved. Hosting by IA University of Arak Press Financial Statement Comparability and the Expected Crash Risk of Stock Prices Bahram Pasandideh Parsa, Fatemeh Sarraf * Department of Accounting, Tehran South Branch, Islamic Azad University, Tehran, Iran. ARTICLE INFO Article history: Received 02 May 2018 Accepted 28 August 2018 Keywords: Financial statements Compa- rability, risk of expected crash in stock prices, Financial Leverage. ABSTRACT The purpose of this study is to explain the relationship between the comparability of financial statements as a qualitative financial reporting feature with the ex- pected risk of stock price crash. The statistical population of this research includes all companies admitted to Tehran Stock Exchange. In order to achieve the re- search goal, 81 companies were selected for the period between 2010 and 2017 as a sample of the study. The research aimed at being an applied research and the research method is in terms of the nature and content of the correlation. The re- search has been performed in the framework of deductive-deductive reasoning and for analysis of the research hypothesis; statistical analysis of the logistics has been assisted. The results of the research hypothesis test showed a significant and nega- tive relationship between the comparability of financial statements and the ex- pected crash in stock prices. 1 Introduction Decisions made by users of financial reports deal with selecting one chance out of alternative ones. So information of reporter unit is useful when they can be compared with similar information from other unites and other periods. Comparability is one of the main qualitative characteristic of providing in- formation which makes it more useful. Based on FASB8 standard and IASB’s conceptual frame work for financial reporting [12] comparability, verifiability, timeliness and understandability are qualita- tive characteristics that enhance the usefulness of information that are relevant and faithfully repre- sented. Comparability helps users to identify and understand similarities and differences, to reduce cost of information obtaining and processing and to increase general quantity and quality of compa- ny’s information [10]. Based on other researchers attempt, it is perceived that comparability of fina n- cial statements can alleviate effect of hiding private information and bad news by managers and not exposing them which causes sudden distribution of negative news in capital market and eventually extreme decrease of stock price hence it reduces expected crash risk of investors stock price [16]. Increased commercial competitions in different industries, competition for finding new markets and financing methods required industrial owners and investors to have wide, accurate and relevant in- formation. One of the main information utilized by many users is financial reporting. Financial report- ing users need to be able to compare financial statements of commercial unit over time in order to
Transcript of Financial Statement Comparability and the Expected Crash ...

Advances in mathematical finance
& applications, 3 (3), (2018), 77-93
Published by IA University of
Arak, Iran
Homepage: www.amfa.iau-
arak.ac.ir
* Corresponding author Tel.: +989122182747
E-mail address: [email protected]
© 2018. All rights reserved.
Hosting by IA University of Arak Press
Financial Statement Comparability and the Expected Crash
Risk of Stock Prices
Bahram Pasandideh Parsa, Fatemeh Sarraf *
Department of Accounting, Tehran South Branch, Islamic Azad University, Tehran, Iran.
ARTICLE INFO
Article history:
Received 02 May 2018
Accepted 28 August 2018
Keywords:
Financial statements Compa-
rability,
risk of expected crash in stock
prices,
Financial Leverage.
ABSTRACT
The purpose of this study is to explain the relationship between the comparability
of financial statements as a qualitative financial reporting feature with the ex-
pected risk of stock price crash. The statistical population of this research includes
all companies admitted to Tehran Stock Exchange. In order to achieve the re-
search goal, 81 companies were selected for the period between 2010 and 2017 as
a sample of the study. The research aimed at being an applied research and the
research method is in terms of the nature and content of the correlation. The re-
search has been performed in the framework of deductive-deductive reasoning and
for analysis of the research hypothesis; statistical analysis of the logistics has been
assisted. The results of the research hypothesis test showed a significant and nega-
tive relationship between the comparability of financial statements and the ex-
pected crash in stock prices.
1 Introduction
Decisions made by users of financial reports deal with selecting one chance out of alternative ones. So
information of reporter unit is useful when they can be compared with similar information from other
unites and other periods. Comparability is one of the main qualitative characteristic of providing in-
formation which makes it more useful. Based on FASB8 standard and IASB’s conceptual frame work
for financial reporting [12] comparability, verifiability, timeliness and understandability are qualita-
tive characteristics that enhance the usefulness of information that are relevant and faithfully repre-
sented. Comparability helps users to identify and understand similarities and differences, to reduce
cost of information obtaining and processing and to increase general quantity and quality of compa-
ny’s information [10]. Based on other researchers attempt, it is perceived that comparability of finan-
cial statements can alleviate effect of hiding private information and bad news by managers and not
exposing them which causes sudden distribution of negative news in capital market and eventually
extreme decrease of stock price hence it reduces expected crash risk of investors stock price [16].
Increased commercial competitions in different industries, competition for finding new markets and
financing methods required industrial owners and investors to have wide, accurate and relevant in-
formation. One of the main information utilized by many users is financial reporting. Financial report-
ing users need to be able to compare financial statements of commercial unit over time in order to

Financial Statement Comparability and the Expected Crash Risk of Stock Prices
[78]
Vol. 3, Issue 3, (2018)
Advances in mathematical finance and applications
identify changes happen in financial status, financial performance and financial feasibility of com-
mercial unit. Users also need to compare various financial statements of commercial units by which
evaluate their financial status, financial performance and financial feasibility comparatively [23]. Un-
ambiguous and comparable financial data is essential for accountability and informed economic deci-
sion making and it is necessary for economic growth and development in private and governmental
sectors. If informed decisions is not based on clear and comparable data, rare economic resources are
wasted and the state economy is damaged. Comparability requires financial statements to be compa-
rable because similar and consistent accounting methods are useless. In this case, users compares cur-
rent value of the companies and their risk rate and compare them then make decision. Users can com-
pare different company’s information and make decision by accessing to this information and by risk
anticipation [11].
Stock price crash occurs often due to stock price bubble of the firm which happens by some manage-
rial decisions such as delay in exposing bad news and acceleration in blurting good news, tax evasion,
keeping projects with negative current value and ambiguity of financial data [18]. According to ac-
counting researches, commercial unit managers are always able to postpone bad news distribution and
store them as private information which is due to high costs of exposing the information or lack of
management ability to keep performing other policy (such as change of commercial unit manage-
ment). Finally, when negative information volume reaches its final value, managers cannot prevent
distribution of news to the market and investors. By publicizing the news in the market, investors re-
vise their previous belief as a basis of the firm current stock price and establish their expectations
based on their new information which suddenly provides negative balances of stock price called stock
price crash in financial literature [15]. Thus comparability of financial statements is a crucial qualita-
tive characteristic in providing financial statements and it aims at taking benefit of financial state-
ments for making economic decisions by wide ranges of users. Since extreme reduction of stock price
and its risks is very important and investors might suffer from losses, this study attempts to study the
relationship between comparability of financial statements and expected crash risk of stock price in
Tehran stock exchange. However the main question is that main question of the researcher is whether
there is significant relationship between financial statements and expected crash risk of stock price?
2 Literature review
2.1. Financial statement comparability
The objective of general-purpose financial reporting is to provide users with information that enables
them to assess the amount, timing, and uncertainty of a firm’s future net cash flow. The FASB [12]
states that information is most likely to satisfy this objective when it can be readily compared with
similar information reported by other entities and by the same entity in other periods. Implicit is the
idea that comparability enables users to make sharper inferences about economic similarities and dif-
ferences across comparable firms so that investors can better understand and evaluate firm perfor-
mance. Recent empirical studies have emerged in response to the development of empirically testable
proxies for comparability [7].While these studies vary in their settings or empirical measures, their
general theme is that comparability lowers information acquisition and processing costs and enhances
the quality of information available to investors. For example, De Franco et al [10] argue that compa-
rability allows meaningful comparison among firms so that analysts can not only make sharper infer-
ences about economic similarities and differences across comparable firms, but also better understand

Sarraf and Pasandideh Parsa
Vol. 3, Issue 3, (2018)
Advances in mathematical finance and applications
[79]
how economic events are translated into firm performance. Moreover, because comparable firms con-
stitute good benchmarks for each other, information transfer among them could reduce the amount of
effort exerted by analysts in understanding and analyzing their financial statements. Kim et al [19]
argue that higher comparability facilitates more standardized or otherwise less judgmental calcula-
tions of accounting information for users, especially for firms with comparable peers.
2.2 The expected crash risk
Academic communities, policy-makers and public media increasingly have recognized crash risk of
stock price from 2008 (year of financial crisis). Not trusting in investor is one mistake that reduce
stock price severely. Investors are worried about drop of stock price in worldwide economic financial
crisis which can enhance decrease of stock value. Blanchard [3] stated that although elimination of
crash risk is very important, removing crash risk idea is vital in asset value marketing (especially dur-
ing market collapse). New studies illustrated that investors need to change historic crash risk to ex-
pected crash risk of stock price. Notwithstanding, most prior studies on the determinants of stock
price crashes have paid little attention to expected crash risk, though they have paid considerable at-
tention to ex post realized crash risk. A notable exception is Kim et al [19], who show that accounting
opacity, captured by absolute discretionary accruals, financial restatements, and internal control
weaknesses, is an important determinant of expected crash risk. In this study, our analysis focuses on
the role of financial statement comparability in determining expected crash risk of stock price.
2.3 Link between financial statement comparability and the expected crash risk
The signaling theory states that there is incentive to attract volunteers when it comes to attracting cap-
ital. Similarly, keeping investor interest in the company is also an incentive for regular reporting.
Companies that perform well have a strong incentive to report their operational results. Therefore,
competitive disclosure will allow other companies, although not good, to report. Silence (short report-
ing) will be interpreted as bad news. Firms with bad news are also motivated to report to avoid being
accused of having poor results. Thus, only bad news companies will not report. This situation will
make companies with bad news also have to disclose their results in order to maintain their credibility
in the capital market .This economic motive for reporting (even bad news) is the heart of the signaling
theory on voluntary financial reporting [25]. Thus, our results are relevant to standard setters and reg-
ulators who underscore the importance of understanding expected crash risk. Finally, our study adds
to prior literature that focuses on the managerial asymmetric disclosure of good versus bad news [20].
We show that financial statement comparability disinclines corporate managers from withholding bad
news. The theoretical model of Jin and Myers [17] suggests that managers have incentives to withhold
bad news from investors due to their concerns about employment, compensation, reputation, and so
forth. However, there is a limit to managers’ hiding and accumulating bad news within the firm.
When the amount of hidden bad news accumulated over time reaches a tipping point, it is released all
at once, resulting in an abrupt, large-scale decline in stock price, that is, a stock price crash.
At the center of this information-based theory is the importance of managers’ ability and incentive to
hide bad news from investors. If either the ability or the incentive is gone or diminishes, the bad news
previously accumulated becomes too costly to keep inside the firm and will suddenly become publicly

Financial Statement Comparability and the Expected Crash Risk of Stock Prices
[80]
Vol. 3, Issue 3, (2018)
Advances in mathematical finance and applications
released, causing a stock price crash [15]. This study examines the impact of financial statement com-
parability on expected crash risk. As discussed previously, comparability facilitates information about
comparable peers being available to outside investors and thus makes it easier for investors to under-
stand financial statement information across comparable firms. We argue that, by having access to
and being able to understand information from comparable firms, investors could not only have a bet-
ter understanding of a firm’s performance but also obtain value-relevant information through infer-
ences based on the performance and/or disclosures of the firm’s comparable peers. For example, in
the absence of bad news disclosure for a particular firm, investors may be able to obtain at least some
of the negative information through inferences based on the performance and/or disclosures of the
firm’s comparable peers. This enhanced understanding of firm performance by investors plays an im-
portant role in constraining managers’ ability and incentives to hoard bad news.
Maintaining the assumption that managers of firms with higher comparability have limited ability and
incentives to hoard bad news, we predict that expected crash risk, captured by the options implied
volatility smirk, is lower for firms with more comparable financial statements, because outside inves-
tors perceive these firms to be less crash prone. High comparability potential of financial statements
reduces managers’ motivation and their capacity for hiding negative news, because by accessing to
information related to similar firms and chance of identifying information, investors can have better
understanding from the firm performance and also they can obtain some negative news about it
through analysis of performance or exposure of similar firms (even negative news are exposed). Since
investors obtain some negative unexposed news about the similar firm, it is not advantages for them to
hide this news yet and it will cost more, so more comparability reduces manager’s motivation for hid-
ing news. This study is essential because firstly it reviews advantages of financial statements compa-
rability literature. Second, it develops growing resources aimed at identifying the relationship between
crash risk and financial reporting transparency. Third, it develops growing resources that intended to
determine the relationship between crash risk and financial reporting informing. Fourth, it improves
resources related to unequal exposure of positive and negative news by managers. Thus, based on
above statements, this study investigated the relationship between comparability of financial state-
ments and expected crash risk of stock price in companies listed in Tehran stock exchange. Firms, as
economic units, are looking for profitability and achieving wealth. According to experimental evi-
dence, financial reporting accountability is the most efficient path for those aims. Recent years, due to
many financial scandals in big companies (such as Enron and world come and …) and no trust in ac-
counting numbers which are the main part of financial reporting , investors cannot simply trust in fi-
nancial statements provided by managers. When stock price crash happens, investors lose their trust.
Hence, in this study, the main aim is explaining the relationship between comparability of financial
statements and expected crash risk of stock price. Secondary aims of this study are as following:
- Explanation and analysis of expected crash risk of stock price ;
- Identifying effect of financial statements comparability of companies listed in stock exchange
on expected crash risk of stock price in order to make optimal decisions by investors;
- Clarifying accounting information importance in evaluating supervision task and
- Providing necessary evidence for answering the research questions
Applied purposes of the study are as following:
- Improving information of current and potential investors including investors of stock ex-
change and also people that intend to invest on capital markets; and

Sarraf and Pasandideh Parsa
Vol. 3, Issue 3, (2018)
Advances in mathematical finance and applications
[81]
- Improving knowledge of managers in companies listed in stock exchange and
- Helping companies’ financial creditors; and
- Helping capital market analyzers
- Enhancing scientific information of students and researchers of relevant fields.
Ahmad et al [1] investigated effect of financial statements comparability on pricing error caused by
accounting accruals’ abnormalities. Results illustrated that comparability is qualitative characteristic
that reflects information in stock price on-time and efficiently so inappropriate stock pricing is re-
duced. Chen et al [6] studied effect of smoothing profit on stock price crash risk. Results indicated
that crash risk of stock price is increased by smoothing profit.
Crash risk of stock price is enhanced when smoothing profit happens with discretionary accruals.
Anenn, et al [2] analyzed the relationship between stock price crash and modification of companies
leverage in 14 different countries. Results indicated that in companies with had higher stock price
crash, there is less inclination to modify operational leverage and this negative relationship is poorer
in countries with clearer informational environment. Foroughi et al [13] investigated debt maturity
effect on future crash risk of stock price. In order to test research hypothesis, multivariate regression
and mixed data method were used based on two criteria of crash risk of stock price. Results concluded
that debt maturity has negative effect on future crash risk of stock price. In other word, by debt ma-
turity decrease, chance of crash risk of stock price is reduced. Jeong et al [16] studied effect of finan-
cial statements comparability on expected crash risk. Results showed that expected crash risk is re-
duced by increase of financial statements comparability while this negative relationship is more sever
in environments in which managers are prefer to hide negative news rather than exposing them.
Rahnama Roodposhti et al [21] studied auditor style and comparability of financial statements. Re-
sults of the study indicated that auditor style is effective on comparability of financial statements that
have crucial role in achieving comparability; in addition to need to uniform accounting standards.
Choi et al [9] investigated the relationship between financial statements comparability with stock
price informing in case of future profits. They concluded that in companies with higher potential of
comparing with same-industry companies, informing stock price is higher. Their findings indicated
that financial statements comparability accelerates reflecting specific information of the company and
information of future profit of the company.
Cambell and Young [5] illustrated effect of financial statements comparability on intensity of reaction
of company’s stock price so they revised providing financial statements same-industrial companies.
Chen et al [7] studied financial statements comparability and efficiency of purchase decision about
buyer’s investment. Results indicated that when companies’ financial statements have higher compa-
rability, purchasers obtain higher stock return and indicate higher operational improvement after buy-
ing. Bollerslev and Todorov [4] outline that, since realized crash events are invariably rare and possi-
bly even nonexistent over a limited calendar time span, it is the fear of such events that accounts for a
surprisingly large fraction of historically observed crash or crisis events. Santa-Clara and Yan [22]
find that the required compensation for the expected crash risk is more than 70 percent higher than the
compensation for the actual realized risk. Hong and Stein [14] argue that investors’ belief heteroge-
neity affects future crash likelihood and predict that higher trading volume is associated with more
negatively skewed stock return.

Financial Statement Comparability and the Expected Crash Risk of Stock Prices
[82]
Vol. 3, Issue 3, (2018)
Advances in mathematical finance and applications
3 Research hypothesis and Methodology
According to statement of the problem, research hypothesis is: “there is significant relationship be-
tween comparability of financial statements and expected crash risk of stock price “.
3.1 Research statistical model
Model of the study adopted from Jeong et al [16] was estimated as follow:
Model elements are as following:
CRASH: expected crash risk of stock price
CompAcct: comparability of financial statements
LEV: financial leverage
ROA: return of asset
Size: firm size
In this model, dependent variable is expected crash risk of stock price. Crash period in a certain finan-
cial year is a period during which monthly specific return of company is 3.2 standard deviation lower
than monthly specific return mean. This definition is based on statistical concept in that monthly spe-
cific return distribution is assumed as normal according which fluctuations between mean +3.2 stand-
ard deviation and mean -3.2 standard deviation are considered as normal fluctuations while fluctua-
tions out of this range are regarded as abnormal ones. Since stock price crash is a virtual variable, its
value is 1 if the firm suffered from at least one crash period in one financial year or this value be-
comes 0. Monthly specific return is calculated as follow:
In which:
Wj,θ: is monthly specific return of j company in month θ in one financial year
ξj,θ: Residual stock return of j Company in θ month which is considered as residual
Model in second equation:
In which:
rj,θ: is monthly specific return of j company in month θ in one financial year
rm,θ: Market return in month θ. For calculating monthly return of market, subtract first day of month
index from last day of month index and divide it by first day of month index.

Sarraf and Pasandideh Parsa
Vol. 3, Issue 3, (2018)
Advances in mathematical finance and applications
[83]
Second equation is estimated by logistic regression and mixed data method and its residual obtained
from first equation is used for calculating specific monthly return of firm. Specific monthly return of
firm is applied for measuring expected crash risk of stock price. Independent variable is comparability
of financial statements (CompAcctijt) which is estimated by Di Franco et al [10] solution. For creating
year-firm scale, comparability (CompAcctijt) of following equation is used for a five year period:
In which Earnings and return are net income and return respectively. Forecast Coefficients in above
equations are αi and βi which are used as a standard for accounting performance of company i.
Then based on above equations, E (Earningsiit), expected earning of company i is estimated according
to accounting function of company i and, E (Earningsijt), earning of company i is estimated according
to accounting function of company j. Finally, accounting comparability of company i and j for a five
year period from t-4 to t is defined as follow:
In which high values of CompAcct reflect higher accounting comparability. In other word, the more
this value is close to zero, the higher is comparability [9].
Control variables of the research include:
Financial leverage LEV which is obtained by dividing total debts by total assets.
Firm size, SIZE, is calculated by natural logarithm of firm total assets book value at the end of the
year.
Return on assets (ROA) which is calculated through dividing annual operational earning by total
company asset which is stated by percentage.
3.2 Research methodology
This study was performed in order to be applied research and considering its nature and content it is
correlation. It was carried out in comparative-deductive framework. It belongs to descriptive re-
searches (non-experimental) and correlation which is logistic analysis type. Considering data collec-
tion method, it is causative- ex post facto research. Sampling was performed purposefully so that pop-
ulation was screened and companies were analyzed as sample companies which were selected by sys-
tematic elimination method. Statistical population included all companies listed in stock before 2002
which were active until end of 2016. It should be noted that this research was carried out in 2010-
2016 period. So for calculating comparability of financial statements variable, stock return data and
net profit of last 8 years was necessary. Thus, for attaining this data we used data of companies listed

Financial Statement Comparability and the Expected Crash Risk of Stock Prices
[84]
Vol. 3, Issue 3, (2018)
Advances in mathematical finance and applications
in stock before 2002.Therefore, six criteria were determined and only companies were selected
that had all standards or they were removed from the study. Selection of statistical population
was as follow:
- Companies need to be listed in stock before 2002 and be active until end of 2016; and
- Companies should not belong to holding, insurance, leasing, banks, financial institu-
tions and investment because they are very different with production companies and
trade firms; and
- Financial year of the firm needs to be ended at last day of the year and it is not sup-
posed to have financial year change or be active; and
- Company has no trading interval more than three months during financial year; and
- Based on necessity of calculation method of comparability as independent variable at
least two companies are required in under studied industry; and
- Financial information of companies needs to be accessible.
Taking all above information into account, 81 companies were remained as screened companies
which were selected as a sample of the study. Thus, our observations were performed during 2010 to
2016 which equals 567 financial year (7 years* 81companies). In order to study sample competence,
Kukran formula was used. Accordingly, at least 74 companies are considered as statistical sample so
it can be said that statistical sample enjoys required competence so results can be generalized.
4 Descriptive static of research variable
In descriptive section, data analysis was performed by central indices such as mean, dispersion indices
including standard deviation, skewness and kurtosis. At the following, descriptive statistic related to
567 year-company and research variables, after screening and elimination of outliers are provided:
Table 1: Descriptive Statistic of Research Variables
Variables Central indices
Dispersion indices
Symbol Mean Median Standard
deviation skewness kurtosis minimum Maximum
CRASH 0.641 1.000 0.479 -0.592 1.350 0.000 1.000
Comp Acct 0.150 -0.002 0.904 1.465 4.455 -8.976 7.240
LEV 0.647 0.642 0.259 2.149 1.485 0.147 2.658
ROA 0.139 0.119 0.159 -1.172 1.432 -1.240 0.636
Size 14.207 14.083 1.323 0.765 4.160 10.952 19.066
According to Table 1, expected crash risk of stock price averagely was 0.641 and it asserts that during
research time 64.1% observations are expected to have at least on crash risk period. Standard devia-
tion of this variable is 0.479 and its skewness and kurtosis are -0.592 and 1.350 respectively. Annual
trend of expected crash risk of stock price were studied on time period out of which highest stock

Sarraf and Pasandideh Parsa
Vol. 3, Issue 3, (2018)
Advances in mathematical finance and applications
[85]
price crash risk was related to 2014 and lowest risk was for 2010. In addition, financial statements
comparability mean was 0.150 and highest and lowest rate were -8.976 and 7.240 respectively. Stand-
ard deviation of this variable was 0.904 and its skewness was 1.465 and kurtosis was 4.455. It was
illustrated that financial statements comparability of sample firms was in their minimum level in 2013
however this variable has been increased since 2014. Financial leverage, as control variable, was
0.647 which indicated that sample firms provided 64.7% financial resources from extra organizational
loan. Then by Pearson correlation coefficient, relationship between research variable and their corre-
lation were studied. Correlation coefficient matrixes of research variables are indicated in figure two.
Based on Pearson results, expected crash risk of stock price has significant and negative correlation
with comparability of financial statements, firm size and return of assets while it has positive and sig-
nificant relationship with financial leverage. Comparability of financial statements has significant and
positive relationship with firm size and has negative and significant relationship with financial lever-
age. And finally there is negative and significant relationship between return of assets and financial
leverage.
Table 2: Pearson Correlation Coefficient Matrix for Research Variables
Correlation coefficient (level of
significance) CRASH CompAcct Size LEV ROA
CRASH 1
CompAcct -0.245
1 (0.000)
Size -0.194 0.117
1 (0.000) (0.005)
LEV 0.200 -0.084 -0.015
1 (0.000) (0.044) (0.714)
ROA -0.160 0.023 (0.053) -0.345
1 (0.000) (0.570) (0.206) (0.000)
In this study, Levin, Lin & Chu statistics was used for testing variables’ stationary. In this test
null hypothesis which was non-stationary or unit-root was rejected so variable is stationary.
Based on the results of figure 3, Levin, Lin & Chu values and also level of significance
shows that all variables are 95% stationary so that level of significance is lower than 0.05 in
all of them. So integration test is not needed and there is no problem with fake regression.
5 Testing research hypothesis
Aim of this test is investigating effect of financial statements comparability on expected crash risk of
stock price? Statistical hypothesis is defined as follow:

Financial Statement Comparability and the Expected Crash Risk of Stock Prices
[86]
Vol. 3, Issue 3, (2018)
Advances in mathematical finance and applications
H0: there is no significant relationship between financial statements comparability and expected crash
risk of stock price.
H1: there is significant relationship between financial statements comparability and expected crash
risk of stock price.
As it was stated, this hypothesis was tested based on Jeong et al [16] research and logestic regression
model.
Table 3: Variables’ Stationary Test
Variable Calculated statistic Level of signifi-
cance Result
Expected crash risk of stock price -3.355 0.0004 Stationary
Comparability of financial statements -9.501 0.0000 Stationary
Firm size -17.93 0.0000 Stationary
Financial leverage -16.671 0.0000 Stationary
Return of assets -12.752 0.0000 Stationary
5.1 Likelihood Ratio test
This test is for finding out model significance and it determines whether model fit is signifi-
cant. In fact, null hypothesis is that all coefficients of variables are zero. In total study of sig-
nificance, if p value of likelihood ratio is lower than 0.05, model significance is approved by
95% confidence. Results of this test are indicated in figure 4. Since level of significance in
figure 4 is 0.0000 so model is significant by 95% confidence.
Table 4: Likelihood Ratio of the Model
Test Statistic Level of significance Result
Likelihood Ratio 157.233 0.0000 Approved
5.2 Goodness of Fit Test
This index compares observed dependent variable value with predicted dependent variable
based on model. If the difference is not significant, goodness of fit is fulfilled. In this study,
for testing goodness of fit, Hosmer-Lemeshow was used. If p-value is higher than 5%, H0 is
approved and it states that difference of observed dependent variable with predicted depend-

Sarraf and Pasandideh Parsa
Vol. 3, Issue 3, (2018)
Advances in mathematical finance and applications
[87]
ent variable is not significant and goodness of fit is met. Based on figure 5, since level of sig-
nificance is 0.0804 so goodness of fit is met.
Table 5: Goodness of Fit Test
Test Statistic Level of significance Result
Hosmer-Lemeshow 79.985 0.0804 Approved
5.3 Multicollinearity Test of Research Variables
Multicollinearity means there is relationship between independent variable. In this study, for
testing lack of multicollinearity, VIF test was used. When VIF of each variables is lower than
10, there is no high multicollinearity between variables. Results of this test are indicated in
figure 6. And if VIF is lower than 10 for all variables and they are close to 1 it can be said
that there is high multicollinearity between variables.
Table 6: Multicollinearity Test of Research Variables
Variable Symbol statistic VIF
Comparability of financial statements CompAcc 1.021
Firm size Size 1.032
Financial leverage LEV 1.120
Return of assets ROA 1.109
5.4 McFadden Determination Coefficients
McFadden determination coefficient is similar to normal regression determination coefficient
and it ranges from 1 to 0 so that number 1 fully explains variables by the model. This statistic
which is indicated in figure 8 is 0.2125 which explains 21.25% of dependent variable by in-
dependent and control variables in the model.
5.5 Model Categorization Accuracy
In Table 7, model categorization accuracy is provided. Based on results it was cleared that
model is 73.37% accurate. So, 103 observations from 203 ones had lower crash risk of stock
price (50.74%) and 313 observation or 364 one lacked crash risk of stock price (85.98%) so
model has categorized accurately.

Financial Statement Comparability and the Expected Crash Risk of Stock Prices
[88]
Vol. 3, Issue 3, (2018)
Advances in mathematical finance and applications
Table 7: Categorization Accuracy percentage
Observation
Forecasting
Stock price Categorization competence (percent-
age) Crash No crash
Stock price crash 103 100 50.74
No Stock price crash 51 313 85.98
Total percentage 73.37
5.6 Regression Model Estimation
In table 8, results of likelihood ratio, goodness of fit and multicollinearity of VIF, model was estimat-
ed. T statistic for constant coefficient was 1.872 (insignificant), for comparability financial statements
was -6.288 (significant and negative), for firm size was -2.529 (significant and negative), for financial
leverage was 3.717 (significant and positive) and for return of assets was -1.681 (insignificant).
Table 8: Estimation of Logistic Model
Variable Coefficient T statistic Level of significance
Constant Coefficient 2.240 1.872 0.0611
Comparability of financial statements -5.633 -6.288 0.0000
Firm size -0.202 -2.529 0.0114
Financial leverage 2.301 3.717 0.0002
Return of assets -1.240 -1.681 0.0926
McFadden determination coefficient 0.2125
5.7 Test Result
Based on provided results in table 9, H0 is rejected because level of significance for t test related to
comparability of financial statements is lower than 0.05 and its coefficient is negative (-5.663). So by
95% level of confidence, it was approved that there is relationship between comparability of financial
statements and expected crash risk of stock price so that if comparability of financial statements of
companies listed in Tehran stock exchange is increased, expected crash risk of stock price is reduced.
Thus, main hypothesis is approved with 95% confidence. Jeong et al [16] studied effect of financial
statements comparability on expected crash risk and concluded that there is significant and negative
relationship between those variables.
We also obtained significant and negative relationship between financial statements comparability and
expected crash risk of stock price.

Sarraf and Pasandideh Parsa
Vol. 3, Issue 3, (2018)
Advances in mathematical finance and applications
[89]
Table 9: Abstract of Main Hypothesis
Hypothesis Description Relationship Orientation The mark
Main
There is significant relationship be-
tween comparability of financial state-
ments and Expected crash risk of stock
price
Approved Reversed Negative
5.8 Interpretation of Hypothesis Test and Comparing the Results
Since investors value their stock return highly, stock price crash severely reduces the return and it is
considered more important than stock price jump.
- Based on results of hypothesis which asserted that there is significant and negative relation-
ship between comparability of financial statements and expected crash risk of stock price, it is
clear that there is significant and reverse relationship between comparability of financial
statements and expected crash risk of stock price. This means that if comparability of finan-
cial statements of companies listed in Tehran stock exchange [24] is increased, expected crash
risk of stock price is decreased. This reverse relationship is more evident in companies that
have information with lower quality, with no outsider supervision so they have poor infor-
mation and there is no competition in this industry. In addition, it has been clear that manag-
er’s do not inclined to keep negative news as secretes is less in compare to positive news in
companies with higher comparability of financial statements. So these results approve that
comparability of financial statements dissuade managers to hide negative news and this
makes investors doubtful about using financial reporting and reducing expected of compa-
nies’ stock price.
- Results of the study indicated that there is significant relationship between control variables
including firm size, return of assets and financial leverage with expected crash risk of stock
price and comparability of company’s financial statements. So based on results of Pearson
statistics (Table 2), expected crash risk of stock price has negative and significant relationship
with firm size and return of assets and they show positive and significant correlation with fi-
nancial leverage. Results related to the relationship between financial leverage and expected
crash risk of stock price is compatible with Anenn, et al [3]. They studied relationship between
stock price crash and modification of companies leverage in 14 different countries. Results
indicated that in companies with higher stock price crash, there is less inclination to modifica-
tion of operational leverage. This negative relationship in countries with clear information is
weaker.
- In addition comparability of financial statements has significant and positive correlation with
firm size and it has negative and significant relationship with financial leverage. Another cor-
relation is related to negative and significant correlation of return of assets with financial lev-
erage.

Financial Statement Comparability and the Expected Crash Risk of Stock Prices
[90]
Vol. 3, Issue 3, (2018)
Advances in mathematical finance and applications
5.9 Comparing Hypothesis Results
Based on results of main hypothesis test and R2 value which was obtained 8% by Mc Fad-
den, in this study it was illustrated that there are least variable changes are expressed by de-
ponent on independent and control variables. In addition, since 64% model value were pre-
dicted correctly and 21% of model 1 value were anticipated accurately, so obtained results
are 21% reliable and 21 dependent variables were forecasted by dependent and control varia-
bles. Based on variables’ stationary and other models of the research, and considering dealing
with heterogenousity of variance and acceptable variable for VIF index, it can be concluded
that provided model is a good and reliable model.
Table 10: Summary of Hypothesis Test Results and Comparing it with Other Researches
Hypothesis Hypothesis Result Other researches
Main
There is significant relationship be-
tween comparability of financial
statements and Expected crash risk of
stock price
Not rejected It is compatible with Jong et al
results [16].
6 Conclusions
Our study adds to the prior literature that examines the benefits of financial statement comparability.
Our results suggest that accounting comparability reduces expected crash risk by helping outside in-
vestors make cross-firm comparisons of disclosure policies and firm performance. Moreover, our
study extends the literature on the role of financial reporting quality in the capital market by focusing
on its relation to expected crash risk. We find that managers’ general tendency to withhold bad news
relative to good news is mitigated for firms with higher financial statement comparability. These re-
sults support our argument that financial statement comparability discourages managers from hiding
bad news and accumulating it within a firm, which reduces investors’ perceptions of a firm’s future
crash risk. We show that financial statement comparability disinclines corporate managers from with-
holding bad news [16]. Thus, our results are relevant to standard setters and regulators who under-
score the importance of understanding expected crash risk. Finally, our study adds to prior literature
that focuses on the managerial asymmetric disclosure of good versus bad news [20]. We our results
suggest that there is significant Negative relationship between comparability of financial statements
and Expected crash risk of stock price.
Based on main hypothesis test which maintained that there is significant relationship between compa-
rability of financial statements and expected crash risk of stock price, it is emphasized that there is
reverse and significant relationship between financial statements and expected crash risk of stock
price. Investors are noted that if financial statements of one company can be compared with another
same-industrial companies, for analyzing stock price of their company, investors take more benefit
from new and information of other countries and use those information of industry and market in their
Sarraf and Pasandideh Parsa
Vol. 3, Issue 3, (2018)
Advances in mathematical finance and applications
[91]
trades. In their decision making, investors pay higher attention to comparability of financial state-
ments aiming at efficient allocation of the investments. In addition, for helping investors, commercial
units’ managers, policymakers and accounting standards’ codifiers are recommended to plan for im-
proving qualitative characteristics of comparability of financial statements.
In this study, relationship between comparability of financial statements with expected crash risk of
stock price is investigated. Thus, future researchers are recommended to:
- Carry out study on comparability of financial statements and expected crash risk of stock
price highlighting companies’ life cycle in companies listed in stock exchange companies;
and
- Carry out study on the effect of Value Relevance of Accounting Information and expected
crash risk of stock prices, in companies listed in stock exchange companies; and
- Carry out study on the effect of the Financial ratios and expected crash risk of stock prices,
in companies listed in stock exchange companies; and
- Carry out study on comparability of financial statements and expected crash risk of stock
prices, Using the market model in listed companies on the stock exchange; and
- Performing this study on relationship between comparability of financial statements and ex-
pected stock price in individual industries in companies listed in Tehran stock exchange [24].
- Performing this study in holding and leasing companies, banks, financial institutes and in-
vestment in companies listed in Tehran stock exchange [24].
- Performing this research on relationship between comparability of financial statements and
expected crash risk of stock price in companies listed in Tehran stock exchange [24] capital
market.
Appendix A: Variables definitions
Summary table of variables:
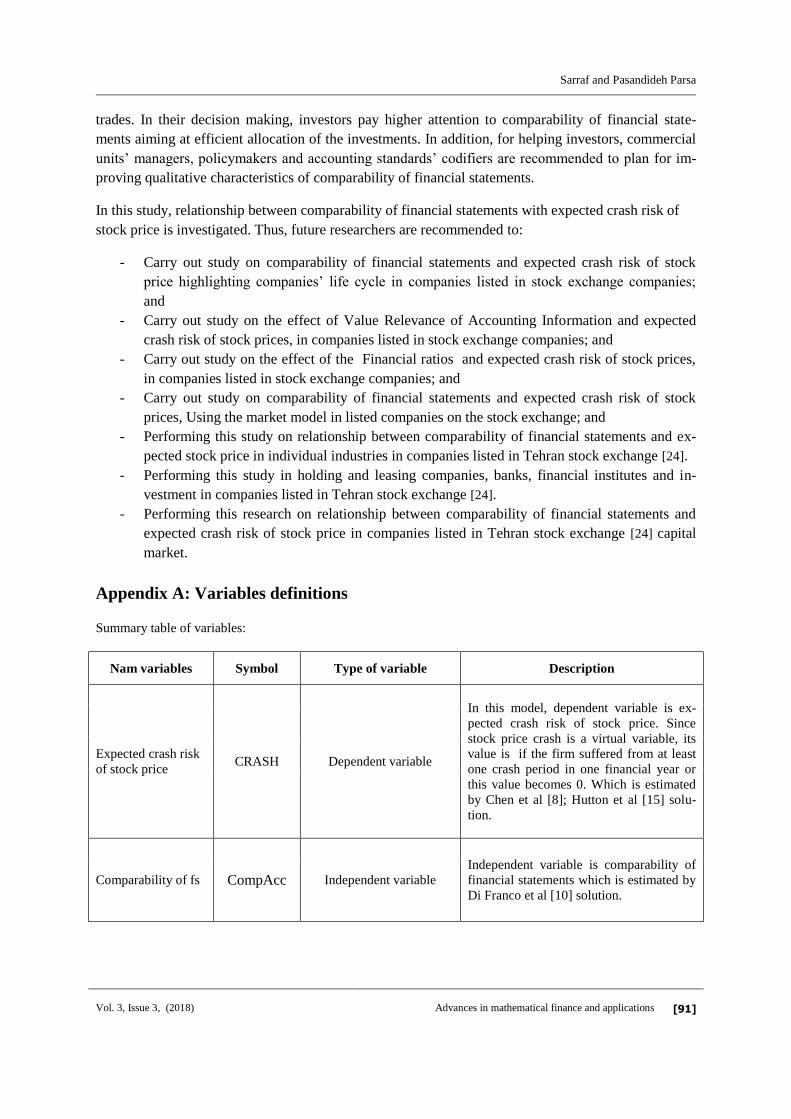
Nam variables Symbol Type of variable Description
Expected crash risk
of stock price CRASH Dependent variable
In this model, dependent variable is ex-
pected crash risk of stock price. Since
stock price crash is a virtual variable, its
value is if the firm suffered from at least
one crash period in one financial year or
this value becomes 0. Which is estimated
by Chen et al [8]; Hutton et al [15] solu-
tion.
Comparability of fs CompAcc Independent variable
Independent variable is comparability of
financial statements which is estimated by
Di Franco et al [10] solution.

Financial Statement Comparability and the Expected Crash Risk of Stock Prices
[92]
Vol. 3, Issue 3, (2018)
Advances in mathematical finance and applications
Financial leverage LEV Control variables Financial leverage which is obtained by
deviding total debts by total assets.
Return of asset ROA Control variables
Return on assets which is calculated
through dividing annual operational earn-
ing by total company asset which is stated
by percentage.
Firm size Size Control variables
Firm size, is calculated by natural loga-
rithm of firm total assets book value at the
end of the year.
References
[1] Ahmed, S. A., Neel, M., & Safdar I. Evidence on the Association between Accounting Compara-
bility and Stock Price Efficiency. 10th Annual Lone Star Accounting Research Conference, United
States. University of Texas at Dallas, 2017, January 30.
[2] Anenn, P.C., Antoniou, C., Horton, J., Louca, C., Corporate Governance and Stock Price Crash-
es. Working Paper. Cyprus University of Technology and Exeter University Business School, 2016.
[3] Blanchard, O., (Nearly) Nothing to fear but fear itself. The Economist, 2007, January 29th. Bleck,
A., Liu, X., Market transparency and the accounting regime. Journal of Accounting Research, 2009,
45(2), P.229-256.
[4] Bollerslev, T., Todorov, V., Tails, fears, and risk premia. Journal of Finance, 2011, 66 (6), P.
2165-2211.
[5] Campbell, J., & Yeung, P. E. Comparability, Investor Sophistication, and Contagion Effects. Fi-
nancial Accounting and Reporting Section Midyear Meeting, San Diego, California, 2013.
[6] Chen C., Kim J .B, Yao L, Earnings Smoothing and Stock Price Crash Risk,2017, http://ssrn.com
[7] Chen, C.-W., W. Collins, D. Kravet, T., D. Mergenthaler, R. Financial statement comparability
and the efficiency of acquisition decisions. Working Paper, University of Iowa and University of Tex-
as at Dallas. 2013, Available at: http://ssrn.com/abstract, 2169082.
[8] Chen, J., Hong, H., Stein, J. Forecasting Crashes: Trading Volume, Past Returns, and Conditional
Skewness in Stock Prices. Journal of Financial Economics, 2001, 61, P.345–381.
[9] Choi, J.-H., Choi, s. A. Myers, L., Ziebart, D., Financial Statement Comparability and the Ability
of Current Stock Returns to Reflect the Information in Future Earnings, 2014, available at:
http://ssrn.com/abstract,2337571.
[10] De Franco, G., Kothari, S., & S. Verdi, R., The benefits of financial statement comparability.
Journal of Accounting Research, 2011, 49(4), P.895-931.
[11] Drachshi, R., Badavar Nadini, Y., Hassanzadeh Brothers, R., The Impact of Ownership Structure

Sarraf and Pasandideh Parsa
Vol. 3, Issue 3, (2018)
Advances in mathematical finance and applications
[93]
and Financial Structure on Financial Finance Comparison Capacity, Audit Quarterly, 2012, 6, P.23-
34 (in Persian).
[12] Financial Accounting Standards Board (FASB). Statement of Financial Accounting Concepts
No. 8: Conceptual Framework for Financial Reporting, 2010.
[13] Foroughi, Daryoosh, Amin Sakiany, Eeffect of Debt deadline on the Expected Crash Risk of
Stock Prices, quarterly journal of accounting investigations. 2016, 5, P.99-116.
[14]Hong, H., Stein, J. C., Differences of opinion, short-sales constraints, and market crashes. Review
of Financial Studies, 2003, 16(2), P.487-525.
[15] Hutton, A.P., Marcus, A.J., Tehranian, H., Opaque Financial Reports, R2, and Crash Risk. Jour-
nal of Financial Economic, 2009, 94, P.67-87.
[16] Jeong-Bon Kim. Leye Li, Financial Statement Comparability and Expected Crash Risk, 2015,
12, P.23-45.
[17] Jin, L., Myers, S., R2 around the world: New theory and new tests. Journal of Financial Econom-
ics, 2006, 79 (2), P.257-292.
[18] Kim, J.-B., Li, Y., Zhang, L, Corporate tax avoidance and stock price crash risk: Firm-level
analysis. Journal of Financial Economics. 2011,100, P.639-662.
[19] Kim, J. B., Zhang, L., Financial reporting opacity and expected crash risk: Evidence from im-
plied volatility smirks. Contemporary Accounting Research, 2014, 31(3), P.851-875.
[20]Kothari, S. P., Shu, S., Wysocki, P. D., Do managers withhold bad news? Journal of Accounting
Research, 2009, 47 (1), P.241-276.
[21] Rahnama RoodPoshti, Fereydoon, Vakilifard, Hamidreza, Study accounting style and compara-
bility of financial statements quarterly journal of management accounting, 2015, 25, P.67-99.
[22] Santa-Clara, P., Yan, S., Crashes, volatility, and the equity premium: Lessons from S&P 500
options. Review of Economics and Statistics, 2010, 92 (2), P.435-451.
[23] Sherzai, Mohammad Reza and Abidine Barzegar Khondaziz. Information asymmetry and the
role of conservative information, examination of different perspectives on conservatism, Journal of
Accountant, 2009, 210, P. 63-56.
[24] Tehran Stock Exchange, http://iranpaper.ir.
[25] Volk, Harry I, Accounting theories. Book of Theory Accounting, Chapter Four, 1930, P.144-145.