Financial statement analysis martin s. fridson, fernando al-3260
413
Transcript of Financial statement analysis martin s. fridson, fernando al-3260


Financial Statement Analysis

John Wiley & Sons
Founded in 1807, John Wiley & Sons is the oldest independent publishingcompany in the United States. With offices in North America, Europe, Aus-tralia, and Asia, Wiley is globally committed to developing and marketingprint and electronic products and services for our customers’ professionaland personal knowledge and understanding.
The Wiley Finance series contains books written specifically for financeand investment professionals as well as sophisticated individual investorsand their financial advisors. Book topics range from portfolio managementto e-commerce, risk management, financial engineering, valuation and fi-nancial instrument analysis, as well as much more.
For a list of available titles, please visit our Web site at www.WileyFinance.com.

Financial Statementanalysis
A Practitioner’s Guide
Third Edition
MARTIN FRIDSONFERNANDO ALVAREZ
John Wiley & Sons, Inc.

Copyright © 2002 by Martin Fridson and Fernando Alvarez. All rights reserved.
Published by John Wiley & Sons, Inc.
No part of this publication may be reproduced, stored in a retrieval system or transmitted inany form or by any means, electronic, mechanical, photocopying, recording, scanning orotherwise, except as permitted under Section 107 or 108 of the 1976 United States CopyrightAct, without either the prior written permission of the Publisher, or authorization throughpayment of the appropriate per-copy fee to the Copyright Clearance Center, 222 RosewoodDrive, Danvers, MA 01923, (978) 750-8400, fax (978) 750-4744. Requests to the Publisherfor permission should be addressed to the Permissions Department, John Wiley & Sons, Inc.,605 Third Avenue, New York, NY 10158-0012, (212) 850-6011, fax (212) 850-6008, E-Mail: [email protected].
This publication is designed to provide accurate and authoritative information in regard tothe subject matter covered. It is sold with the understanding that the publisher is not engagedin rendering professional services. If professional advice or other expert assistance is required,the services of a competent professional person should be sought.
This title is also available in print as ISBN 0-471-40915-4. Some content that appears in theprint version of this book may not be available in this electronic edition.
For more information about Wiley products, visit our web site at www.Wiley.com

In memory of my father, Harry Yale Fridson, whointroduced me to accounting, economics, and logic, aswell as the fourth discipline essential to the creation ofthis book—hard work!
M. F.
For Shari, Virginia, and Armando.
F. A.

ADDIT IONAL PRAISE FOR FINANCIAL STATEMENT ANALYSIS, THIRD EDITION
“With a solid understanding of accepted accounting standards, one must peel throughthe fog generated by audited accounting numbers to get a clear picture of any company’sfinancial health. Certainly, Fridson and Alvarez show us how to do just that. What I likebest about the book is the authors’ ability to provide examples of real-life debacles dis-cussed in the business press that could have been foreseen using the techniques explainedin the book and having a healthy dose of skepticism. Their approach to analyzing finan-cial statements should be commended.”
—Ivan BrickProfessor and Chair, Finance and Economics Department, Rutgers Business School
“This book should be required reading for the seasoned investor and novice alike. Frid-son and Alvarez show, in a very readable format, that diligent analysis still can make adifference. Finally a book that covers not just the basics, but all the subtleties and every-thing that management doesn’t want you to know.”
—Robert S. Franklin, CFAPortfolio Manager, Neuberger Berman, LLC
“Read it, digest it, and review it frequently. Fridson and Alvarez take you through finan-cial statement analysis with many salient examples that expose hidden agendas and helpwith assessing the true value of securities.”
—Ron HabakusDirector of High Yield Investments, Brown Brothers Harriman
“Fridson and Alvarez clearly show why the most successful financial analysts approachtheir jobs with healthy doses of cynicism. Well written, insightful, and with numerablereal life war stories, this book is required reading for all high yield bond analysts at AIG.”
—Gordon MassieManaging Director, High Yield BondsAmerican International Group Global Investment Advisors
“Fridson and Alvarez give financial analysts, accountants, investors, auditors and allother finance professionals something to chew over. They succeed in illustrating the useof financial statement analysis with many astonishing real life examples. This book startswhere others stop. Clearly, a must read that brings the reader beyond the pure numbercrunching!”
—Marc J.K. De CeusterProfessor at the University of Antwerp (Belgium) and Director of Risk Management atDeloitte & Touche
“Alvarez and Fridson have a real gift for expressing the concepts of finance in down-to-earth, understandable ways. The situations they choose, and the skillful way they lay outeach example, make all the subtle relationships come to. They are real artists withspreadsheets that are easy for the reader to follow, and easy to adapt to new situations.For instant financial empowerment, buy this book and let Alvarez and Fridson ramp upyour financial modeling skills.”
—John EdmundsDirector of the Stephen D. Cutler Investment Management Center at Babson College

vii
preface to third edition
This third edition of Financial Statement Analysis, like its predecessors,seeks to equip its readers for practical challenges of contemporary busi-
ness. Once again, the intention is to acquaint readers who have already ac-quired basic accounting skills with the complications that arise in applyingtextbook-derived knowledge to the real world of extending credit and in-vesting in securities. Just as a swiftly changing environment necessitated ex-tensive revisions and additions in the second edition, new concerns andchallenges for users of financial statements have accompanied the dawn ofthe twenty-first century.
For one thing, corporations have shifted their executive compensationplans increasingly toward rewarding senior managers for “enhancing share-holder value.” This lofty-sounding concept has a dark side. Chief executiveofficers who are under growing pressure to boost their corporations’ shareprices can no longer increase their bonuses by goosing reported earningsthrough financial reporting tricks that are transparent to the stock market.They must instead devise more insidious methods that gull investors intobelieving that the reported earnings gains are real. In response to this trend,we have expanded our survey of revenue recognition gimmicks designed todeceive the unwary.
Another innovation that demands increased vigilance by financial ana-lysts is the conversion of stock market proceeds into revenues. In terms ofaccounting theory, this kind of transformation is the equivalent of alchemy.Companies generate revenue by selling goods or services, not by sellingtheir own shares to the public.
During the Internet stock boom of the late 1990s, however, clever opera-tors found a way around that constraint. Companies took the money theyraised in initial public offerings, bought advertising on one another’s web-sites, and recorded the shuttling of dollars as sales. Customers were superflu-ous to the revenue recognition process. In another variation on the theme,franchisers sold stock, lent the proceeds to franchisees, then immediately hadthe cash returned under the rubric of fees. By going out for a short stroll andcoming back, the proceeds of a financing mutated into revenues.

viii PREFACE TO THIRD EDITION
The artificial nature of these revenues becomes apparent when readerscombine an understanding of accounting principles with a corporate fi-nance perspective. We facilitate such integration of disciplines throughoutFinancial Statement Analysis, making excursions into economics and busi-ness management as well. In addition, we encourage analysts to considerthe institutional context in which financial reporting occurs. Organiza-tional pressures result in divergences from elegant theories, both in the con-duct of financial statement analysis and in auditors’ interpretations ofaccounting principles. The issuers of financial statements also exert a stronginfluence over the creation of the financial principles, with powerful politi-cians sometimes carrying their water.
A final area in which the new edition offers a sharpened focus involvessuccess stories in the critical examination of financial statements. Whereverwe can find the necessary documentation, we show not only how a corpo-rate debacle could have been foreseen through application of basis analyti-cal techniques, but how practicing analysts actually did detect the problembefore it became widely recognized. Readers will be encouraged by theseexamples, we hope, to undertake genuine, goal-oriented analysis, instead ofsimply going through the motions of calculating standard financial ratios.Moreover, the case studies should persuade them to stick to their guns whenthey spot trouble, despite management’s predictable litany. (“Our financialstatements are consistent with Generally Accepted Accounting Principles.They have been certified by one of the world’s premier auditing firms. Wewill not allow a band of greedy short-sellers to destroy the value created byour outstanding employees.”) Typically, as the vehemence of management’sprotests increases, conditions deteriorate and accusations of aggressive ac-counting give way to revelations of fraudulent financial reporting.
As for the plan of Financial Statement Analysis, readers should not feelcompelled to tackle its chapters in the order we have assigned to them. Toaid those who want to jump in somewhere in the middle of the book, thethird edition provides increased cross-referencing and an expanded Glos-sary. Words that are defined in the Glossary are shown in bold faced type inthe text. Although skipping around will be the most efficient approach formany analysts, a logical flow does underlie the sequencing of the material.
In Part I (“Reading between the Lines”), we show that financial state-ments do not simply represent unbiased portraits or corporations’ financialperformance and explain why. The section explores the complex motiva-tions of issuing firms and their managers. We also study the distortions pro-duced by the organizational context in which the analyst operates.
Part II (“The Basic Financial Statements”) takes a hard look at the in-formation disclosed in the balance sheet, income statement, and statement

Preface to Third Edition ix
of cash flows. Under close scrutiny, terms such as value and income begin tolook muddier than they appear when considered in the abstract. Even cashflow, a concept commonly thought to convey redemptive clarification, isvulnerable to stratagems designed to manipulate the perceptions of in-vestors and creditors.
In Part III (“A Closer Look at Profits”), we zero in on the lifeblood ofthe capitalist system. Our scrutiny of profits highlights the manifold ways inwhich earnings are exaggerated or even fabricated. By this point in thebook, the reader should be amply imbued with the healthy skepticism nec-essary for a sound, structured approach to financial statement analysis.
Application is the theme of Part IV (“Forecasts and Security Analysis”).For both credit and equity evaluation, forward-looking analysis is empha-sized over seductive but ultimately unsatisfying retrospection. Tips for max-imizing the accuracy of forecasts are included and real-life projections byprofessional securities analysts are dissected. We cast a critical eye on stan-dard financial ratios and valuation models, however widely accepted theymay be.
Financial markets continue to evolve, but certain phenomena appearagain and again in new guises. In this vein, companies never lose their re-sourcefulness in finding new ways to skew perceptions of their performance.By studying their methods closely, analysts can potentially anticipate the vari-ations on old themes that will materialize in years to come.
MARTIN FRIDSON
FERNANDO ALVAREZ


xi
acknowledgments
Mukesh AgarwalJohn BaceMitchell BartlettRichard BernsteinRichard ByrneRichard CagneyGeorge ChalhoubSanford CohenMargarita DecletSylvan FeldsteinDavid FittonThomas Flynn IIIDaniel FridsonIgor FuksmanRyan GelrodKenneth GoldbergSusannah GrayEvelyn HarrisDavid HawkinsAvi KatzRebecca KeimJames KenneyAndrew KrollLes LeviRoss LevyJennie MaMichael Marocco
Eric MatejevichJohn MattisPat McConnellOleg MelentyevKrishna MemaniAnn Marie MullanKingman PennimanRichard RolnickClare SchiedermayerGary SchienemanBruce SchwartzDevin ScottElaine SismanCharles SnowVladimir StadnykJohn ThieroffScott ThomasJohn TinkerKivin VargheseSharyl Van WinkleDavid WaillSteven WaiteDouglas WatsonBurton WeinsteinStephen WeissDavid WhitcombMark Zand


xiii
contents
PART IReading between the Lines 1
CHAPTER 1The Adversarial Nature of Financial Reporting 3
The Purpose of Financial Reporting 4The Flaws in the Reasoning 8Small Profits and Big Baths 11Maximizing Growth Expectations 12Downplaying Contingencies 18The Importance of Being Skeptical 20Conclusion 24
PART IIThe Basic Financial Statements 27
CHAPTER 2The Balance Sheet 29
The Value Problem 30Issues of Comparability 31“Instantaneous” Wipeout of Value 33How Good Is Goodwill? 34Losing Value the Old-Fashioned Way 37True Equity Is Elusive 39Pros and Cons of a Market-Based Equity Figure 42Undisclosed Hazards 45The Common Form Balance Sheet 46Conclusion 48

xiv CONTENTS
CHAPTER 3The Income Statement 49
Making the Numbers Talk 49How Real Are the Numbers? 55Conclusion 90
CHAPTER 4The Statement of Cash Flows 91
The Cash Flow Statement and the LBO 93Analytical Applications 98Cash Flow and the Company Life Cycle 99The Concept of Financial Flexibility 107In Defense of Slack 110Conclusions 112
PART IIIA Closer Look at Profits 115
CHAPTER 5What is Profit? 117
Bona Fide Profits versus Accounting Profits 117What Is Revenue? 118Which Costs Count? 120How Far Can the Concept Be Stretched? 122Conclusion 123
CHAPTER 6Revenue Recognition 125
Informix’s Troubles Begin 125Calling the Signals 130Astray on Layaway 136Recognizing Membership Fees 137A Potpourri of Liberal Revenue Recognition Techniques 140Conclusion 152

Contents xv
CHAPTER 7Expense Recognition 153
AOL’s Search for Wiggle Room 153IBM’s Innovative Expense Reduction 156Simple Analysis Foils Elaborate Deception 157Oxford’s Plans Go Astray 159Conclusion 162
CHAPTER 8The Applications and Limitations of EBITDA 163
EBIT, EBITDA, and Total Enterprise Value 164The Role of EBITDA in Credit Analysis 168Abusing EBITDA 172A More Comprehensive Cash Flow Measure 174Working Capital Adds Punch to Cash Flow Analysis 177Conclusion 179
CHAPTER 9The Reliability of Disclosures and Audits 181
An Artful Deal 182Death Duties 185Chainsaw Al 186Stumbling Down the Audit Trail 190Conclusion 191
CHAPTER 10Mergers-and-Acquisitions Accounting 193
The Twilight of Pooling-of-Interests Accounting 194Maximizing Postacquisition Reported Earnings 197Managing Acquisition Dates and Avoiding Restatements 198Conclusion 200
CHAPTER 11Profits in Pensions 201
An Admonition from the SEC 206Conclusion 207

xvi CONTENTS
PART IVForecasts and Security Analysis 209
CHAPTER 12Forecasting Financial Statements 211
A Typical One-Year Projection 211Sensitivity Analysis with Projected Financial Statements 224How Accurate Are Projections in Practice? 230Projecting Financial Flexibility 232Pro Forma Financial Statements 234Multiyear Projections 244Conclusion 265
CHAPTER 13Credit Analysis 267
Balance Sheet Ratios 268Income Statement Ratios 280Statement of Cash Flows Ratios 285Combination Ratios 287Relating Ratios to Credit Risk 294Conclusion 313
CHAPTER 14Equity Analysis 315
The Dividend Discount Model 316The Price-Earnings Ratio 322Why P/E Multiples Vary 325The Du Pont Formula 333Valuation through Restructuring Potential 336Conclusion 343
Bibliography 345
Glossary 347
Notes 365
Index 377

PARToneReading between
the Lines


3
CHAPTER 1The Adversarial Nature of
Financial Reporting
F inancial statement analysis is an essential skill in a variety of occupationsincluding investment management, corporate finance, commercial lend-
ing, and the extension of credit. For individuals engaged in such activities,or who analyze financial data in connection with their personal investmentdecisions, there are two distinct approaches to the task.
The first is to follow a prescribed routine, filling in boxes with standardfinancial ratios, calculated according to precise and inflexible definitions. Itmay take little more effort or mental exertion than this to satisfy the formalrequirements of many positions in the field of financial analysis. Operatingin a purely mechanical manner, though, will not provide much of a profes-sional challenge. Neither will a rote completion of all of the “proper” stan-dard analytical steps ensure a useful, or even a nonharmful, result. Someindividuals, however, will view such problems as only minor drawbacks.
This book is aimed at the analyst who will adopt the second and morerewarding alternative, the relentless pursuit of accurate financial profiles ofthe entities being analyzed. Tenacity is essential because financial state-ments often conceal more than they reveal. To the analyst who pursues thisproactive approach, producing a standard spreadsheet on a company is ameans rather than an end. Investors derive but little satisfaction from theknowledge that an untimely stock purchase recommendation was sup-ported by the longest row of figures available in the software package. Gen-uinely valuable analysis begins after all the usual questions have beenanswered. Indeed, a superior analyst adds value by raising questions thatare not even on the checklist.
Some readers may not immediately concede the necessity of going be-yond an analytical structure that puts all companies on a uniform, objectivescale. They may recoil at the notion of discarding the structure altogetherwhen a sound assessment depends on factors other than comparisons of

4 READING BETWEEN THE LINES
standard financial ratios. Comparability, after all, is a cornerstone of gen-erally accepted accounting principles (GAAP). It might therefore seem tofollow that financial statements prepared in accordance with GAAP neces-sarily produce fair and useful indications of relative value.
The corporations that issue financial statements, moreover, would ap-pear to have a natural interest in facilitating convenient, cookie-cutteranalysis. These companies spend heavily to disseminate information abouttheir financial performance. They employ investor-relations managers, theycommunicate with existing and potential shareholders via interim financialreports and press releases, and they dispatch senior management to peri-odic meetings with securities analysts. Given that companies are so eager tomake their financial results known to investors, they should also want it tobe easy for analysts to monitor their progress. It follows that they can beexpected to report their results in a transparent and straightforward fash-ion . . . or so it would seem.
THE PURPOSE OF FINANCIAL REPORTING
Analysts who believe in the inherent reliability of GAAP numbers and thegood faith of corporate managers misunderstand the essential nature of fi-nancial reporting. Their conceptual error connotes no lack of intelligence,however. Rather, it mirrors the standard accounting textbook’s idealisticbut irrelevant notion of the purpose of financial reporting. Even HowardSchilit (see the MicroStrategy discussion, later in this chapter), an acerbiccritic of financial reporting as it is actually practiced, presents a high-minded view of the matter:
The primary goal in financial reporting is the dissemination of financialstatements that accurately measure the profitability and financial condi-tion of a company.1
Missing from this formulation is an indication of whose primary goal isaccurate measurement. Schilit’s words are music to the ears of the financialstatements users listed in this chapter’s first paragraph, but they are not theones doing the financial reporting. Rather, the issuers are for-profit com-panies, generally organized as corporations.2
A corporation exists for the benefit of its shareholders. Its objective isnot to educate the public about its financial condition, but to maximize itsshareholders’ wealth. If it so happens that management can advance thatobjective through “dissemination of financial statements that accurately

The Adversarial Nature of Financial Reporting 5
measure the profitability and financial condition of the company,” then inprinciple, management should do so. At most, however, reporting financialresults in a transparent and straightforward fashion is a means unto an end.
Management may determine that a more direct method of maximizingshareholder wealth is to reduce the corporation’s cost of capital. Simplystated, the lower the interest rate at which a corporation can borrow or thehigher the price at which it can sell stock to new investors, the greater is thewealth of its shareholders. From this standpoint, the best kind of financialstatement is not one that represents the corporation’s condition most fullyand most fairly, but rather one that produces the highest possible credit rat-ing (see Chapter 13) and price-earnings multiple (see Chapter 14). If thehighest ratings and multiples result from statements that measure profitabil-ity and financial condition inaccurately, the logic of fiduciary duty to share-holders obliges management to publish that sort, rather than the type heldup as a model in accounting textbooks. The best possible outcome is a costof capital lower than the corporation deserves on its merits. This admittedlyperverse argument can be summarized in the following maxim, presentedfrom the perspective of issuers of financial statements:
The purpose of financial reporting is to obtain cheap capital.
Attentive readers will raise two immediate objections. First, they willsay, it is fraudulent to obtain capital at less than a fair rate by presenting anunrealistically bright financial picture. Second, some readers will argue thatmisleading the users of financial statements is not a sustainable strategyover the long run. Stock market investors who rely on overstated historicalprofits to project a corporation’s future earnings will find that results fail tomeet their expectations. Thereafter, they will adjust for the upward bias inthe financial statements by projecting lower earnings than the historical re-sults would otherwise justify. The outcome will be a stock valuation nohigher than accurate reporting would have produced. Recognizing that thepractice would be self-defeating, corporations will logically refrain fromoverstating their financial performance. By this reasoning, the users of fi-nancial statements can take the numbers at face value, because corporationsthat act in their self-interest will report their results honestly.
The inconvenient fact that confounds these arguments is that financialstatements do not invariably reflect their issuers’ performance faithfully. Inlieu of easily understandable and accurate data, users of financial state-ments often find numbers that conform to GAAP yet convey a misleadingimpression of profits. Worse yet, outright violations of the accounting rulescome to light with distressing frequency. Not even the analyst’s second line

6 READING BETWEEN THE LINES
of defense, an affirmation by independent auditors that the statements havebeen prepared in accordance with GAAP, assures that the numbers are reli-able. A few examples from recent years indicate how severely an overlytrusting user of financial statements can be misled.
Mercury Plunges
In January 1997, Mercury Finance’s controller was reported to have disap-peared3 after the company reduced its 1996 earnings to $56.7 million froman originally reported $120.7 million. The used-car loan company’s co-founder and chief executive officer, John Brincat, contended that the irregu-larities necessitating the restatements were apparently “the result ofunauthorized entries being made to the accounting records of the companyby the principal accounting officer,” the missing James A. Doyle.4 On Janu-ary 28, the day before the earnings revision, Mercury’s stock closed at$14.875 a share. When trading in the shares reopened on January 31, theprice plunged to $2.125.
As the story developed, controller Doyle’s attorney denied that his clienthad disappeared. Rather, “He decided with the advice of counsel to nolonger participate in the charade taking place at Mercury Finance.”5 Speak-ing through his lawyer, Doyle added that he was cooperating with a federalinvestigation of the company.
Thickening the plot was the provision in CEO Brincat’s managementcontract whereby he was not entitled to any bonus in any year in whichearnings per share rose by less than 20%. Doyle had no such bonusarrangement, leading some observers to wonder what motive he would havehad to falsify the financials. Additional earnings revisions announced alongwith the 1996 restatement indicated that Mercury did not, after all, achievethe 20% target in 1994 or 1995, even though Brincat received bonuses of$1.4 million and $1.6 million, respectively, for those years.6 In any case,Brincat resigned as chief executive officer on February 3. A year later hestepped down from the company’s board and agreed to repay part of his1994–1996 bonuses.
Also in February 1998, Mercury announced that it would file for bank-ruptcy. By then, the company had revised its originally reported 1996 profitof $120.7 million to a net loss. In hindsight, the financial statements had in-corporated unrealistic assumptions about the percentage of Mercury’s low-income borrowers who would fail to keep up their loan payments. Theauditors had certified the results, despite the telltale warning sign that thestatements showed Mercury earning more than double the historical aver-age return on equity (see Chapter 13) of other companies in its business.

The Adversarial Nature of Financial Reporting 7
Securities analyst Charles Mills of Anderson & Strudwick likened such im-probably superior performance to a human running a two-minute mile.7
MicroStrategy Changes Its Mind
On March 20, 2000, MicroStrategy announced that it would restate its1999 revenue, originally reported as $205.3 million, to around $150 mil-lion. The company’s shares promptly plummeted by $140 to $86.75 ashare, slashing chief executive officer Michael Saylor’s paper wealth by over$6 billion. The company explained that the revision had to do with recog-nizing revenue on the software company’s large, complex projects.8 Micro-Strategy and its auditors initially suggested that the company had beenobliged to restate its results in response to a recent (December 1999) Secu-rities and Exchange Commission (SEC) advisory on rules for booking soft-ware revenues. After the SEC objected to that explanation, the companyconceded that its original accounting was inconsistent with accountingprinciples published way back in 1997 by the American Institute of Certi-fied Public Accountants.
Until MicroStrategy dropped its bombshell, the company’s auditors hadput their seal of approval on the company’s revenue recognition policies.That was despite questions raised about MicroStrategy’s financials by ac-counting expert Howard Schilit six months earlier and by reporter DavidRaymond in an issue of Forbes ASAP distributed on February 21.9 It was re-portedly only after reading Raymond’s article that an accountant in the au-ditor’s national office contacted the local office that had handled the audit,ultimately causing the firm to retract its previous certification of the 1998and 1999 financials.10
No Straight Talk from Lernout & Hauspie
On November 16, 2000, the auditor for Lernout & Hauspie Speech Prod-ucts (L&H) withdrew its clean opinion of the company’s 1998 and 1999 fi-nancials. The action followed a November 9 announcement by the Belgianproducer of speech-recognition and translation software that an internal in-vestigation had uncovered accounting errors and irregularities that wouldrequire restatement of results for those two years and the first half of 2000.Two weeks later, the company filed for bankruptcy.
Prior to November 16, 2000, while investors were relying on the audi-tor’s opinion that Lernout & Hauspie’s financial statements were consis-tent with generally accepted accounting principles, several events castdoubt on that opinion. In July 1999, short-seller David Rocker criticized

8 READING BETWEEN THE LINES
transactions such as L&H’s arrangement with Brussels Translation Group(BTG). Over a two-year period, BTG paid L&H $35 million to developtranslation software. L&H then bought BTG and the translation productalong with it. The net effect was that instead of booking a $35 million re-search and development expense, L&H recognized $35 million of rev-enue.11 In August 2000, certain Korean companies that L&H claimed ascustomers said that they in fact did no business with the corporation. InSeptember, the Securities and Exchange Commission and Europe’s Easdaqstock market began to investigate L&H’s accounting practices.12 Along theway, Lernout & Hauspie’s stock fell from a high of $72.50 in March 2000to $7 before being suspended from trading in November. In retrospect, un-critical reliance on the company’s financials, based on the auditor’s opinionand a presumption that management wanted to help analysts get the truepicture, was a bad policy.
THE FLAWS IN THE REASONING
As the preceding deviations from GAAP demonstrate, neither fear of anti-fraud statutes nor enlightened self-interest invariably deters corporationsfrom cooking the books. The reasoning by which these two forces ensurehonest accounting rests on hidden assumptions. None of the assumptionscan stand up to an examination of the organizational context in which fi-nancial reporting occurs.
To begin with, corporations can push the numbers fairly far out of jointbefore they run afoul of GAAP, much less open themselves to prosecutionfor fraud. When major financial reporting violations come to light, as inmost other kinds of white-collar crime, the real scandal involves what is notforbidden. In practice, generally accepted accounting principles counte-nance a lot of measurement that is decidedly inaccurate, at least over theshort run.
For example, corporations routinely and unabashedly smooth theirearnings. That is, they create the illusion that their profits rise at a consis-tent rate from year to year. Corporations engage in this behavior, with theblessing of their auditors, because the appearance of smooth growth re-ceives a higher price-earnings multiple from stock market investors than thejagged reality underlying the numbers.
Suppose that, in the last few weeks of a quarter, earnings threaten tofall short of the programmed year-over-year increase. The corporation sim-ply “borrows” sales (and associated profits) from the next quarter by offer-ing customers special discounts to place orders earlier than they had

The Adversarial Nature of Financial Reporting 9
planned. Higher-than-trendline growth, too, is a problem for the earnings-smoother. A sudden jump in profits, followed by a return to a more ordi-nary rate of growth, produces volatility, which is regarded as an evil to beavoided at all costs. Management’s solution is to run up expenses in the cur-rent period by scheduling training programs and plant maintenance that,while necessary, would ordinarily be undertaken in a later quarter.
These are not tactics employed exclusively by fly-by-night companies.Blue chip corporations openly acknowledge that they have little choice butto smooth their earnings, given Wall Street’s allergy to surprises. Officials ofGeneral Electric have indicated that when a division is in danger of failingto meet its annual earnings goal, it is accepted procedure to make an acqui-sition in the waning days of the reporting period. According to an executivein the company’s financial services business, he and his colleagues hunt foracquisitions at such times, saying, “Gee, does somebody else have some in-come? Is there some other deal we can make?”13 The freshly acquired unit’sprofits for the full quarter can be incorporated into GE’s, helping to ensurethe steady growth so prized by investors.
Why do auditors not forbid such gimmicks? They hardly seem consis-tent with the ostensible purpose of financial reporting, namely, the accurateportrayal of a corporation’s earnings. The explanation is that sound princi-ples of accounting theory represent only one ingredient in the stew fromwhich financial reporting standards emerge.
Along with accounting professionals, the issuers and users of financialstatements also have representation on the Financial Accounting StandardsBoard (FASB), the rule-making body that operates under authority dele-gated by the Securities and Exchange Commission. When FASB identifiesan area in need of a new standard, its professional staff typically defines thetheoretical issues in a matter of a few months. Issuance of the new standardmay take several years, however, as the corporate issuers of financial state-ments pursue their objectives on a decidedly less abstract plane.
From time to time, highly charged issues such as executive stock op-tions and mergers lead to fairly testy confrontations between FASB and thecorporate world. The compromises that emerge from these dustups fail tosatisfy theoretical purists. On the other hand, rule-making by negotiationheads off all-out assaults by the corporations’ allies in Congress. If the law-makers were ever to get sufficiently riled up, they might drastically curtailFASB’s authority. Under extreme circumstances, they might even replaceFASB with a new rule-making body that the corporations could more easilybend to their will.
There is another reason that enlightened self-interest does not invariablydrive corporations toward candid financial reporting. The corporate executives

10 READING BETWEEN THE LINES
who lead the battles against FASB have their own agenda. Just like the in-vestors who buy their corporations’ stock, managers seek to maximize theirwealth. If producing bona fide economic profits advances that objective, it isrational for a chief executive officer (CEO) to try to do so. In some cases,though, the CEO can achieve greater personal gain by taking advantage ofthe compensation system through financial reporting gimmicks.
Suppose, for example, the CEO’s year-end bonus is based on growth inearnings per share. Assume also that for financial reporting purposes, thecorporation’s depreciation schedules assume an average life of eight yearsfor fixed assets. By arbitrarily amending that assumption to nine years (andobtaining the auditors’ consent to the change), the corporation can lower itsannual depreciation expense. This is strictly an accounting change; the ac-tual cost of replacing equipment worn down through use does not decline.Neither does the corporation’s tax deduction for depreciation expense risenor, as a consequence, does cash flow 14 (see Chapter 4). Investors recognizethat bona fide profits (see Chapter 5) have not increased, so the corpora-tion’s stock price does not change in response to the new accounting policy.What does increase is the CEO’s bonus, as a function of the artificially con-trived boost in earnings per share.
This example explains why a corporation may alter its accounting prac-tices, making it harder for investors to track its performance, even thoughthe shareholders’ enlightened self-interest favors straightforward, transpar-ent financial reporting. The underlying problem is that corporate executivessometimes put their own interests ahead of their shareholders’ welfare.They beef up their bonuses by overstating profits, while shareholders bearthe cost of reductions in price–earnings ratios to reflect deterioration in thequality of reported earnings.15
The logical solution for corporations, it would seem, is to align the in-terests of management and shareholders. Instead of calculating executivebonuses on the basis of earnings per share, the board should reward seniormanagement for increasing shareholders’ wealth by causing the stock priceto rise. Such an arrangement gives the CEO no incentive to inflate reportedearnings through gimmicks that transparently produce no increase in bonafide profits and therefore no rise in the share price.
Following the logic through, financial reporting ought to have movedcloser to the ideal of accurate representation of corporate performance ascompanies have increasingly linked executive compensation to stock priceappreciation. In reality, though, no such trend is discernible. If anything, thepreceding examples of Mercury Finance, MicroStrategy, and Lernout &Hauspie suggest that corporations are becoming more creative and moreaggressive in their financial reporting.

The Adversarial Nature of Financial Reporting 11
Aligning management and shareholder interests, it turns out, has a darkside. Corporate executives can no longer increase their bonuses through fi-nancial reporting tricks that are readily detectable by investors. Instead,they must devise better-hidden gambits that fool the market and artificiallyelevate the stock price. Financial statement analysts must work harder thanever to spot corporations’ subterfuges.
SMALL PROFITS AND BIG BATHS
Certainly, financial statement analysts do not have to fight the battle single-handedly. The Securities and Exchange Commission and the Financial Ac-counting Standards Board prohibit corporations from going too far inprettifying their profits to pump up their share prices. These regulators re-frain from indicating exactly how far is too far, however. Inevitably, corpo-rations hold diverse opinions on matters such as the extent to which theymust divulge bad news that might harm their stock market valuations. Forsome, the standard of disclosure appears to be that if nobody happens toask about a specific event, then declining to volunteer the information doesnot constitute a lie.
The picture is not quite that bleak in every case, but the bleakness ex-tends pretty far. A research team led by Harvard economist Richard Zeck-hauser has compiled evidence that lack of perfect candor is widespread.16
Zeckhauser et al. focus on instances in which a corporation reports quar-terly earnings that are only slightly higher or slightly lower than its earningsin the corresponding quarter of the preceding year.
Suppose that corporate financial reporting followed the accountants’idealized objective of depicting performance accurately. By the laws of prob-ability, corporations’ quarterly reports would include about as many casesof earnings that barely exceed year-earlier results as cases of earnings thatfall just shy of year-earlier profits. Instead, Zeckhauser et al. find that cor-porations post small increases far more frequently than they post small de-clines. The strong implication is that when companies are in danger ofshowing slightly negative earnings comparisons, they locate enough discre-tionary items to squeeze out marginally improved results.
On the other hand, suppose a corporation suffers a quarterly profit de-cline too large to erase through discretionary items. Such circumstances cre-ate an incentive to “take a big bath” by maximizing the reported setback.The reasoning is that investors will not be much more disturbed by a 30%drop in earnings than by a 20% drop. Therefore, management may find itexpedient to accelerate certain future expenses into the current quarter,

12 READING BETWEEN THE LINES
thereby ensuring positive reported earnings in the following period. It mayalso be a convenient time to recognize long-run losses in the value of assetssuch as outmoded production facilities and goodwill created in unsuccessfulacquisitions of the past. In fact, the corporation may take a larger write-offon those assets than the principle of accurate representation would dictate.Reversals of the excess write-offs offer an artificial means of stabilizing re-ported earnings in subsequent periods.
Zeckhauser and his associates corroborate the big bath hypothesis byshowing that large earnings declines are more common than large increases.By implication, managers do not passively record the combined results oftheir own skill and business factors beyond their control, but intervene inthe calculation of earnings by exploiting the latitude in accounting rules.The researchers’ overall impression is that corporations regard financial re-porting as a technique for propping up stock prices, rather than a means ofdisseminating objective information.17
If corporations’ gambits escape detection by investors and lenders, therewards can be vast. For example, an interest-cost savings of one-half of apercentage point on $1 billion of borrowings equates to $5 million (pretax)per year. If the corporation is in a 34% tax bracket and its stock trades at15 times earnings, the payoff for risk-concealing financial statements is$49.5 million in the cumulative value of its shares.
Among the popular methods for pursuing such opportunities for wealthenhancement, aside from the big bath technique studied by Zeckhauser, are:
� Maximizing growth expectations.
� Downplaying contingencies.
MAXIMIZING GROWTH EXPECTATIONS
Imagine a corporation that is currently reporting annual net earnings of$20 million. Assume that five years from now, when its growth has leveledoff somewhat, the corporation will be valued at 15 times earnings. Furtherassume that the company will pay no dividends over the next five years andthat investors in growth stocks currently seek returns of 25% (before con-sidering capital gains taxes).
Based on these assumptions, plus one additional number, the analystcan place an aggregate value on the corporation’s outstanding shares. Thefinal required input is the expected growth rate of earnings. Suppose thecorporation’s earnings have been growing at a 30% annual rate and appear

The Adversarial Nature of Financial Reporting 13
likely to continue increasing at the same rate over the next five years. At theend of that period, earnings (rounded) will be $74 million annually. Apply-ing a multiple of 15 times to that figure produces a valuation at the end ofthe fifth year of $1.114 billion. Investors seeking a 25% rate of return willpay $365 million today for that future value.
These figures are likely to be pleasing to a founder/chief executive offi-cer who owns, for sake of illustration, 20% of the outstanding shares. Thesuccessful entrepreneur is worth $73 million on paper, quite possibly upfrom zero just a few years ago. At the same time, the newly minted multi-millionaire is a captive of the market’s expectations.
Suppose investors conclude for some reason that the corporation’s po-tential for increasing its earnings has declined from 30% to 25% perannum. That is still well above average for Corporate America. Neverthe-less, the value of corporation’s shares will decline from $365 million to$300 million, keeping previous assumptions intact.
Overnight, the long-struggling founder will see the value of his personalstake plummet by $13 million. Financial analysts may shed few tears forhim. After all, he is still worth $60 million on paper. If they were in hisshoes, however, how many would accept a $13 million loss with perfectequanimity? Most would be sorely tempted, at the least, to avoid incurringa financial reverse of comparable magnitude via every means available tothem under GAAP.
That all-too-human response is the one typically exhibited by owner-managers confronted with falling growth expectations. Many, perhaps,most, have no intention to deceive. It is simply that the entrepreneur is bynature a self-assured optimist. A successful entrepreneur, moreover, has hadthis optimism vindicated. Having taken his company from nothing to $20million of earnings against overwhelming odds, he believes he can lickwhatever short-term problems have arisen. He is confident that he can getthe business back onto a 30% growth curve, and perhaps he is right. Onething is certain—if he were not the sort who believed he could beat the oddsone more time, he would never have built a company worth $300 million.
Financial analysts need to assess the facts more objectively. They mustrecognize that the corporation’s predicament is not unique, but on the con-trary, quite common. Almost invariably, senior managers try to dispel theimpression of decelerating growth, since that perception can be so costly tothem. Simple mathematics, however, tends to make false prophets of corpo-rations that extrapolate high growth rates indefinitely into the future. More-over, once growth begins to level off (see Exhibit 1.1), restoring it to thehistorical rate requires overcoming several powerful limitations.

14 READING BETWEEN THE LINES
Limits to Continued Growth
Saturation Sales of a hot new consumer product can grow at astronomicalrates for a time. Eventually, however, everybody who cares to will own one(or two, or some other finite number that the consumer believes is enough).At that point, potential sales will be limited to replacement sales plus growthin population, that is, the increase in the number of potential purchasers.
Entry of Competition Rare is the company with a product or service that can-not either be copied or encroached on by a “knockoff” sufficiently similarto tap the same demand, yet different enough to fall outside the bounds ofpatent and trademark protection.
EXHIBIT 1.1 The Inevitability of Deceleration
Shifting investors’ perceptions upward through the Corporate Credibility Gap between actualand management-projected growth is a potentially valuable but inherently difficult undertak-ing for a company. Liberal financial reporting practices can make the task somewhat easier. Inthis light, analysts should read financial statements with a skeptical eye.
Time
Ear
ning
s pe
r Sh
are
($)
Projected atHistorical Rate
Actual
The CorporateCredibility Gap

The Adversarial Nature of Financial Reporting 15
Increasing Base A corporation that sells 10 million units in Year I can regis-ter a 40% increase by selling just 4 million additional units in Year 2. Ifgrowth continues at the same rate, however, the corporation will have togenerate 59 million new unit sales to achieve a 40% gain in Year 10.
In absolute terms, it is arithmetically possible for volume to increase in-definitely. On the other hand, a growth rate far in excess of the gross do-mestic product’s annual increase is nearly impossible to sustain over anyextended period. By definition, a product that experiences higher-than-GDPgrowth captures a larger percentage of GDP each year. As the numbers getlarger, it becomes increasingly difficult to switch consumers’ spending pat-terns to accommodate continued high growth of a particular product.
Market Share Constraints For a time, a corporation may overcome the limitsof growth in its market and the economy as a whole by expanding its salesat the expense of competitors. Even when growth is achieved by marketshare gains rather than by expanding the overall demand for a product,however, the firm must eventually bump up against a ceiling on furthergrowth at a constant rate. For example, suppose a producer with a 10%share of market is currently growing at 25% a year while total demand forthe product is expanding at only 5% annually. By Year 14, this supergrowthcompany will require a 115% market share to maintain its rate of increase.(Long before confronting this mathematical impossibility, the corporation’sgrowth will likely be curtailed by the antitrust authorities.)
Basic economics and compound-interest tables, then, assure the analystthat all growth stories come to an end, a cruel fate that must eventually bereflected in stock prices. Financial reports, however, frequently tell a differ-ent tale. It defies common sense yet almost has to be told, given the stakes.Users of financial statements should acquaint themselves with the most fre-quently heard corporate versions of “Jack and the Beanstalk,” in whichearnings—in contradiction to a popular saw—do grow to the sky.
Commonly Heard Rational izat ions for Decl in ing Growth
“Our Year-over-Year Comparisons Were Distorted” Recognizing the sensitivityof investors to any slowdown in growth, companies faced with earnings de-celeration commonly resort to certain standard arguments to persuade in-vestors that the true, underlying profit trend is still rising at its historicalrate (see Exhibit 1.2). Freak weather conditions may be blamed for suppos-edly anomalous, below-trendline earnings. Alternatively, the company may

16 READING BETWEEN THE LINES
allege that shipments were delayed (never canceled, merely delayed) becauseof temporary production problems caused, ironically, by the company’s ex-plosive growth. (What appeared to be a negative for the stock price, in otherwords, was actually a positive. Orders were coming in faster than the com-pany could fill them—a high-class problem indeed.) Widely publicizedmacroeconomic events such as the Y2K problem18 receive more than theirfair share of blame for earnings shortfalls. However plausible these expla-nations may sound, analysts should remember that in many past instances,short-term supposed aberrations have turned out to be advance signals ofearnings slowdowns.
“New Products Will Get Growth Back on Track” Sometimes, a corporation’sclaim that its obviously mature product lines will resume their formergrowth path becomes untenable. In such instances, it is a good idea for
EXHIBIT 1.2 “Our Year-over-Year Comparisons Were Distorted”
Is the latest earnings figure an outlier or does it signal the start of a slowdown in growth? No-body will know for certain until more time has elapsed, but the company will probably pro-pound the former hypothesis as forcefully as it can.
Time
DecelerationHypothesis
Steady GrowthHypothesis
Ear
ning
s pe
r Sh
are
($)

The Adversarial Nature of Financial Reporting 17
management to have a new product or two to show off. Even if the productsare still in development, some investors who strongly wish to believe in thecorporation will remain steadfast in their faith that earnings will continuegrowing at the historical rate. (Such hopes probably rise as a function ofowning stock on margin at a cost well above the current market.) A hard-headed analyst, though, will wait to be convinced, bearing in mind that newproducts have a high failure rate.
“We’re Diversifying Away from Mature Markets” If a growth-minded com-pany’s entire industry has reached a point of slowdown, it may have littlechoice but to redeploy its earnings into faster-growing businesses. Hungerfor growth, along with the quest for cyclical balance, is a prime motivationfor the corporate strategy of diversification.
Diversification reached its zenith of popularity during the “conglomer-ate” movement of the 1960s. Up until that time, relatively little evidencehad accumulated regarding the actual feasibility of achieving high earningsgrowth through acquisitions of companies in a wide variety of growth in-dustries. Many corporations subsequently found that their diversificationstrategies worked better on paper than in practice. One problem was thatthey had to pay extremely high price-earnings multiples for growth com-panies that other conglomerates also coveted. Unless earnings growth accel-erated dramatically under the new corporate ownership, the acquirer’sreturn on investment was fated to be mediocre. This constraint was partic-ularly problematic for managers who had no particular expertise in thebusinesses they were acquiring. Still worse was the predicament of a corpo-ration that paid a big premium for an also-ran in a “hot” industry. Regret-tably, the number of industry leaders available for acquisition was bydefinition limited.
By the 1980s, the stock market had rendered its verdict. The price-earnings multiples of widely diversified corporations carried a “conglomer-ate discount.” One practical problem was the difficulty security analystsencountered in trying to keep tabs on companies straddling many differentindustries. Instead of making 2 + 2 equal 5, as they had promised, the con-glomerates’ managers presided over corporate empires that traded atcheaper prices than their constituent companies would have sold for in ag-gregate had they been listed separately.
Despite this experience, there are periodic attempts to revive the notionof diversification as a means of maintaining high earnings growth indefi-nitely into the future. In one variant, management makes lofty claims aboutthe potential for “cross-selling” one division’s services to the customers ofanother. It is not clear, though, why paying premium acquisition prices to

18 READING BETWEEN THE LINES
assemble the two businesses under the same corporate roof should provemore profitable than having one independent company pay a fee to use theother’s mailing list. Battle-hardened analysts wonder whether such corpo-rate strategies rely as much on the vagaries of mergers-and-acquisitions ac-counting (see Chapter 10) as they do on bona fide synergy.
All in all, users of financial statements should adopt a “show-me” atti-tude toward a story of renewed growth through diversification. It is oftennothing more than a variant of the myth of above-average growth forever.Multi-industry corporations bump up against the same arithmetic that lim-its earnings growth for “focused” companies.
DOWNPLAYING CONTINGENCIES
A second way to mold disclosure to suit the issuer’s interests is by down-playing extremely significant contingent liabilities. Thanks to the advent ofclass action suits, the entire net worth of even a multi-billion-dollar corpo-ration may be at risk in litigation involving environmental hazards or prod-uct liability. Understandably, an issuer of financial statements would preferthat securities analysts focus their attention elsewhere.
At one time, analysts tended to shunt aside claims that ostensibly threat-ened major corporations with bankruptcy. They observed that massivelawsuits were often settled for small fractions of the original claims. Further-more, the outcome of a lawsuit often hinged on facts that emerged onlywhen the case finally came to trial (which by definition never happened ifthe suit was settled out of court). Considering also the susceptibility of juriesto emotional appeals, securities analysts of bygone days found it extremelydifficult to incorporate legal risks into earnings forecasts that relied primar-ily on micro- and macroeconomic variables. At most, a contingency that hadthe potential of wiping out a corporation’s equity became a qualitative factorin determining the multiple assigned to a company’s earnings.
Manville Corporation’s 1982 bankruptcy marked a watershed in theway analysts have viewed legal contingencies. To their credit, specialists inthe building-products sector had been asking detailed questions aboutManville’s exposure to asbestos-related personal injury suits for a long timebefore the company filed. Many investors nevertheless seemed to regard thecorporation’s August 26, 1982, filing under Chapter 11 of the BankruptcyCode as a sudden calamity. Manville’s stock plunged by 35% on the day fol-lowing its filing.
In part, the surprise element was a function of disclosure. The corpora-tion’s last quarterly report to the Securities and Exchange Commissionprior to its bankruptcy had implied a total cost of settling asbestos-related

The Adversarial Nature of Financial Reporting 19
claims of about $350 million. That was less than half of Manville’s $830million of shareholders’ equity. On August 26, by contrast, Manville esti-mated the potential damages at no less than $2 billion.
For analysts of financial statements, the Manville episode demonstratedthe plausibility of a scenario previously thought inconceivable. A bank-ruptcy at an otherwise financially sound company, brought on solely bylegal claims, had become a nightmarish reality. Intensifying the shock wasthat the problem had lain dormant for many years. Manville’s bankruptcyresulted from claims for diseases contracted decades earlier through contactwith the company’s products. The long-tailed nature of asbestos liabilitieswas underscored by a series of bankruptcy filings over succeeding years.Prominent examples, each involving a billion dollars or more of assets, in-cluded Walter Industries (1989), National Gypsum (1990), USG Corpora-tion (1993 and again in 2001), Owens Corning (2000), and ArmstrongWorld Industries (2000).
Bankruptcies connected with asbestos exposure, silicone gel breast im-plants, and assorted environmental hazards (see Chapter 13) have height-ened analysts’ awareness of legal risks. Even so, analysts still miss the forestfor the trees in some instances, concentrating on the minutiae of financialratios of corporations facing similarly large contingent liabilities. They canstill be lulled by companies’ matter-of-fact responses to questions about thegigantic claims asserted against them.
Thinking about it from the issuer’s standpoint, one can imagine severalreasons why the investor-relations officer’s account of a major legal contin-gency is likely to be considerably less dire than the economic reality. Tobegin with, the corporation’s managers have a clear interest in downplayingrisks that threaten the value of their stock and options. Furthermore, as par-ties to a highly contentious lawsuit, the executives find themselves in a con-flict. It would be difficult for them to testify persuasively in their company’sdefense while simultaneously acknowledging to investors that the plaintiffs’claims have merit and might, in fact, prevail. (Indeed, any such public ad-mission could compromise the corporation’s case. Candid disclosure there-fore may not be a viable option.) Finally, it would hardly represent aberrantbehavior if, on a subconscious level, management were to deny the real pos-sibility of a company-wrecking judgment. It must be psychologically verydifficult for managers to acknowledge that their company may go bust forreasons seemingly outside their control. Filing for bankruptcy may prove tobe the only course available to the corporation, notwithstanding an excel-lent record of earnings growth and a conservative balance sheet.
For all these reasons, analysts must take particular care to rely on theirindependent judgment when a potentially devastating contingent liabilitylooms larger than their conscientiously calculated financial ratios. It is not a

20 READING BETWEEN THE LINES
matter of sitting in judgment on management’s honor and forthrightness. Ifcorporate executives remain in denial about the magnitude of the problem,they are not deliberately misleading analysts by presenting an overly opti-mistic picture. Moreover, the managers may not provide a reliable assess-ment even if they soberly face the facts. In all likelihood, they have neverworked for a company with a comparable problem. They consequently havelittle basis for estimating the likelihood that the worst-case scenario will befulfilled. Analysts who have seen other corporations in similar predicamentshave more perspective on the matter, as well as greater objectivity. Instead ofrelying entirely on the company’s periodic updates on a huge class action suit,analysts should also speak to representatives of the plaintiffs’ side. Theirviews, while by no means unbiased, will expose logical weaknesses in man-agement’s assertions that the liability claims will never stand up in court.
THE IMPORTANCE OF BEING SKEPTICAL
By now, the reader presumably understands why this chapter is entitled “TheAdversarial Nature of Financial Reporting.” The issuer of financial state-ments has been portrayed in an unflattering light, invariably choosing the ac-counting option that will tend to prop up its stock price, rather thangenerously assisting the analyst in deriving an accurate picture of its financialcondition. Analysts have been warned not to partake of the optimism thatdrives all great business enterprises, but instead to maintain an attitude ofskepticism bordering on distrust. Some readers may feel they are not cut outto be financial analysts if the job consists of constant naysaying, of posingembarrassing questions, and of being a perennial thorn in the side of com-panies that want to win friends among investors, customers, and suppliers.
Although pursuing relentless antagonism can indeed be an unpleasantway to go through life, the stance that this book recommends toward issuersof financial statements implies no such acrimony. Rather, analysts shouldview the issuers as adversaries in the same manner that they temporarily de-monize their opponents in a friendly pickup basketball game. On the court,the competition can be intense, which only adds to the fun. Afterward, ev-eryone can have a fine time going out together for pizza and beer. In short,financial analysts and investor-relations officers can view their work withthe detachment of litigators who engage in every legal form of shin-kickingout of sheer desire to win the case, not because the litigants’ claims neces-sarily have intrinsic merit.
Too often, financial writers describe the give-and-take of financial reporting and analysis in a highly moralistic tone. Typically, the author

The Adversarial Nature of Financial Reporting 21
exposes a tricky presentation of the numbers and reproaches the companyfor greed and chicanery. Viewing the production of financial statements asan epic struggle between good and evil may suit a crusading journalist, butfinancial analysts need not join the ethics police to do their job well.
An alternative is to learn to understand the gamesmanship of financialreporting, perhaps even to appreciate on some level the cleverness of issuerswho constantly devise new stratagems for leading investors off the track.Outright fraud cannot be countenanced, but disclosure that shades eco-nomic realities without violating the law requires truly impressive ingenuity.By regarding the interaction between issuers and users of financial state-ments as a game, rather than a morality play, analysts will find it easier toview the action from the opposite side. Just as a chess master anticipates anopponent’s future moves, analysts should consider which gambits theythemselves would use if they were in the issuer’s seat.
“Oh no!” some readers must be thinking at this point. “First the authorstell me that I must not simply plug numbers into a standardized spreadsheet.Now I have to engage in role-playing exercises to guess what tricks will beembedded in the statements before they even come out. I thought this bookwas supposed to make my job easier, not more complicated.”
In reality, this book’s goal is to make the reader a better analyst. If thatgoal could be achieved by providing shortcuts, the authors would not hesi-tate to do so. Financial reporting occurs in an institutional context thatobliges conscientious analysts to go many steps beyond conventional calcu-lation of financial ratios. Without the extra vigilance advocated in thesepages, the user of financial statements will become mired in a system thatprovides excessively simple answers to complex questions, squelches indi-viduals who insolently refuse to accept reported financial data at face value,and inadvisably gives issuers the benefit of the doubt.
These systematic biases are inherent in selling stocks. Within the uni-verse of investors are many large, sophisticated financial institutions thatutilize the best available techniques of analysis to select securities for theirportfolios. Also among the buyers of stocks are individuals who, not beingtrained in financial statement analysis, are poorly equipped to evaluate an-nual and quarterly earnings reports. Both types of investors are importantsources of financing for industry, and both benefit over the long term fromthe returns that accrue to capital in a market economy. The two groups can-not be sold stocks in the same way, however.
What generally sells best to individual investors is a “story.” Sometimesthe story involves a new product with seemingly unlimited sales potential.Another kind of story portrays the recommended stock as a play on somecurrent economic trend, such as declining interest rates or a step-up in

22 READING BETWEEN THE LINES
defense spending. Some stories lie in the realm of rumor, particularly thosethat relate to possible corporate takeovers. The chief characteristics of moststories are the promise of spectacular gains, superficially sound logic, and apaucity of quantitative verification.
No great harm is done when an analyst’s stock purchase recommenda-tion, backed up by a thorough study of the issuer’s financial statements, istranslated into soft, qualitative terms for laypersons’ benefit. Not infre-quently, though, a story originates among stockbrokers or even in the exec-utive offices of the issuer itself. In such an instance, the zeal with which thestory is disseminated may depend more on its narrative appeal than on thesolidity of the supporting analysis.
Individual investors’ fondness for stories undercuts the impetus for seri-ous financial analysis, but the environment created by institutional investorsis not ideal, either. Although the best investment organizations conduct rig-orous and imaginative research, many others operate in the mechanicalfashion derided earlier in this chapter. They reduce financial statementanalysis to the bare bones of forecasting earnings per share, from whichthey derive a price-earnings multiple. In effect, the less conscientious invest-ment managers assume that as long as a stock stacks up well by this singlemeasure, it represents an attractive investment. Much Wall Street research,regrettably, caters to these institutions’ tunnel vision, sacrificing analyticalcomprehensiveness to the operational objective of maintaining up-to-the-minute earnings estimates on vast numbers of companies.
Investment firms, moreover, are not the only workplaces in which seri-ous analysts of financial statements may find their style crimped. The creditdepartments of manufacturers and wholesalers have their own set of institu-tional hazards.
Consider, to begin with, the very term “credit approval process.” As thename implies, the vendor’s bias is toward extending rather than refusingcredit. Up to a point, this is as it should be. In Exhibit 1.3, “neutral” CutoffPoint A, where half of all applicants are approved and half are refused, rep-resents an unnecessarily high credit standard. Any company employing itwould turn away many potential customers who posed almost no threat ofdelinquency. Even Cutoff Point B, which allows more business to be writtenbut produces no credit losses, is less than optimal. Credit managers whoseek to maximize profits aim for Cutoff Point C. It represents a level ofcredit extension at which losses on receivables occur but are slightly morethan offset by the profits derived from incremental customers.
To achieve this optimal result, a credit analyst must approve a certainnumber of accounts that will eventually fail to pay. In effect, the analyst isrequired to make “mistakes” that could be avoided by rigorously obeying

The Adversarial Nature of Financial Reporting 23
the conclusions derived from the study of applicants’ financial statements.The company makes up the cost of such mistakes by avoiding mistakes ofthe opposite type (rejecting potential customers who will not fail to pay).
Trading off one type of error for another is thoroughly rational andconsistent with sound analysis, so long as the objective is truly to maximizeprofits. There is always a danger, however, that the company will insteadmaximize sales at the expense of profits. That is, the credit manager maybias the system even further, to Cutoff Point D in Exhibit 1.3. Such a prob-lem is bound to arise if the company’s salespeople are paid on commissionand their compensation is not tightly linked to the collection experience oftheir customers. The rational response to that sort of incentive system is topressure credit analysts to approve applicants whose financial statementscry out for rejection.
A similar tension between the desire to book revenues and the need tomake sound credit decisions exists in commercial lending. At a bank or a fi-nance company, an analyst of financial statements may be confronted byspecial pleading on behalf of a loyal, long-established client that is under al-legedly temporary strain. Alternatively, the lending officer may argue that aloan request ought to be approved, despite substandard financial ratios, onthe grounds that the applicant is a young, struggling company with the po-tential to grow into a major client. Requests for exceptions to establishedcredit policies are likely to increase in both number and fervor during peri-ods of slack demand for loans.
When considering pleas of mitigating circumstances, the credit analystshould certainly take into account pertinent qualitative factors that the fi-nancial statements fail to capture. At the same time, the analyst must bearin mind that qualitative credit considerations come in two flavors, favorable
EXHIBIT 1.3 The Bias toward Favorable Credit Evaluations
Populationof
PotentialCustomers
A. Approve 50%, Reject 50%
Possible Cutoff PointsMost Creditworthy
Least Creditworthy
Measures ofFinancial Strength B. Zero Credit Loss
C. Profit Margin on Incremental CustomersNarrowly Exceeds Credit Losses
D. Credit Losses Exceed Profit Margin

24 READING BETWEEN THE LINES
and unfavorable. It is also imperative to remember that the cold, hard sta-tistics show that companies in the “temporarily” impaired and start-up cat-egories have a higher-than-average propensity to default on their debt.
Every high-risk company seeking a loan can make a plausible soft casefor overriding the financial ratios. In aggregate, though, a large percentageof such borrowers will fail, proving that many of their seemingly valid qual-itative arguments were specious. This unsentimental truth was driven homeby a massive 1989–1991 wave of defaults on high-yield bonds that had beenmarketed on the strength of supposedly valuable assets not reflected on theissuers’ balance sheets. Bond investors had been told that the bold dreamsand ambitions of management would suffice to keep the companies solvent.Another large default wave in 2001 involved early-stage telecommunica-tions ventures for which there was scarcely any financial data from which tocalculate ratios. The rationale advanced for lending to these nascent com-panies was the supposedly limitless demand for services made possible bymiraculous new technology.
To be sure, defaults also occur among companies that satisfy estab-lished quantitative standards. The difference is that analysts can test finan-cial ratios against a historical record to determine their reliability aspredictors of bankruptcy (see Chapter 13). No comparable testing is feasi-ble for the highly idiosyncratic, qualitative factors that weakly capitalizedcompanies cite when applying for loans. Analysts are therefore on moresolid ground when they rely primarily on the numbers than when they tryto discriminate among companies’ soft arguments.
CONCLUSION
A primary objective of this chapter has been to supply an essential ingredi-ent that is missing from many discussions of financial statement analysis.Aside from accounting rules, cash flows, and definitions of standard ratios,analysts must consider the motivations of corporate managers, as well asthe dynamics of the organizations in which they work. Neglecting these fac-tors will lead to false assumptions about the underlying intent of issuers’communications with users of financial statements.
Moreover, analysts may make incorrect inferences about the quality oftheir own work if they fail to understand the workings of their own organi-zations. If a conclusion derived from thorough financial analysis is deemed“wrong,” it is important to know whether that judgment reflects a flawedanalysis or a higher-level decision to override analysts’ recommendations.Senior managers sometimes subordinate financial statement analysis to adetermination that idle funds must be put to work or that loan volume must

The Adversarial Nature of Financial Reporting 25
be increased. At such times, organizations rationalize their behavior by per-suading themselves that the principles of interpreting financial statementshave fundamentally changed. Analysts need not go to the extreme of resign-ing in protest, but they will benefit if they can avoid getting caught up in theprevailing delusion.
To be sure, organizational behavior has not been entirely overlooked upuntil now in the literature of financial statement analysis. Typically, aca-demic studies depict issuers as profit-maximizing firms, inclined to over-state their earnings if they can do so legally and if they believe it will boosttheir equity market valuation. This model lags behind the portrait of thefirm now prevalent in other branches of finance.19 Instead of a monolithicorganization that consistently pursues the clear-cut objective of share pricemaximization, the corporation is now viewed more realistically as an aggre-gation of individuals with diverse motivations.
Using this more sophisticated model, an analyst can unravel an other-wise vexing riddle concerning corporate reporting. Overstating earningswould appear to be a self-defeating strategy in the long term, since it has atendency to catch up with the perpetrator. Suppose, for example, a corpo-ration depreciates assets over a longer period than can be justified by phys-ical wear-and-tear and the rate of technological change in manufacturingmethods. When the time comes to replace the existing equipment, the cor-poration will face two unattractive options. The first is to penalize reportedearnings by writing off the remaining undepreciated balance on equipmentthat is obsolete and hence of little value in the resale market. Alternatively,the company can delay the necessary purchase of more up-to-date equip-ment, thereby losing ground competitively and reducing future earnings.Would the corporation not have been better off if it had refrained from over-stating its earnings in the first place, an act that probably cost it some mea-sure of credibility among investors?
If the analyst considers the matter from the standpoint of management,a possible solution to the riddle emerges. The day of reckoning, when thefirm must “pay back” the reported earnings “borrowed” via underdepreci-ation, may be beyond the planning horizon of senior management. A chiefexecutive officer who intends to retire in five years, and who will be com-pensated in the interim according to a formula based on reported earningsgrowth, may have no qualms about exaggerating current results at the ex-pense of future years’ operations. The long-term interests of the firm’s own-ers, in other words, may not be consistent with the short-term interests oftheir agents, the salaried managers.
Plainly, analysts cannot be expected to read minds or to divine the truemotives of management in every case. There is a benefit, however, in simplybeing cognizant of objectives other than the ones presupposed by introductory

26 READING BETWEEN THE LINES
accounting texts. If nothing else, the awareness that management may havesomething up its sleeve will encourage readers to trust their instincts whensome aspect of a company’s disclosure simply does not ring true. In a giveninstance, management may judge that its best chance of minimizing ana-lysts’ criticism of an obviously disastrous corporate decision lies in stub-bornly defending the decision and refusing to change course. Even thoughthe chief executive officer may be able to pull it off with a straight face,however, the blunder remains a blunder. Analysts who remember that man-agers may be pursuing their own agendas will be ahead of the game. Theywill be properly skeptical that management is genuinely making toughchoices designed to yield long-run benefits to shareholders, but which indi-viduals outside the corporation cannot envision.
Armed with the attitude that the burden of proof lies with those makingthe disclosures, the analyst is now prepared to tackle the basic financialstatements. Methods for uncovering the information they conceal, as well asthat which they reveal, constitute the heart of the next three chapters. Fromthat elementary level right on up to making investment decisions with thetechniques presented in the final two chapters, it will pay to maintain anadversarial stance at all times.

PARTtwoThe Basic
Financial Statements


29
CHAPTER 2The Balance Sheet
T he balance sheet is a remarkable invention, yet it has two fundamentalshortcomings. First, although it is in theory useful to have a summary of
the values of all the assets owned by an enterprise, these values frequentlyprove elusive in practice. Second, many kinds of things have value and couldbe construed, at least by the layperson, as assets. Not all of them can be as-signed a specific value and recorded on a balance sheet, however. For exam-ple, proprietors of service businesses are fond of saying, “Our assets godown the elevator every night.” Everybody acknowledges the value of acompany’s “human capital”—the skills and creativity of its employees—butno one has devised a means of valuing it precisely enough to reflect it on thebalance sheet. Accountants do not go to the opposite extreme of banishingall intangible assets from the balance sheet, but the dividing line betweenthe permitted and the prohibited is inevitably an arbitrary one.1
During the late 1990s, doctrinal disputes over accounting for assets in-tensified as intellectual capital came to represent growing proportions ofmany major corporations’ perceived value. A study conducted on behalf ofBig Five accounting firm Arthur Andersen showed that between 1978 and1999, book value fell from 95% to 71% of the stock market value of publiccompanies in the United States.2 Increasingly, investors were willing to payfor things other than the traditional assets that GAAP (generally acceptedaccounting principles) had grown up around, including buildings, machin-ery, inventories, receivables, and a limited range of capitalized expenditures.
At the extreme, start-up Internet companies with negligible physical as-sets attained gigantic market capitalizations. Their valuations derived from“business models” purporting to promise vast profits far in the future.Building up subscriber bases through heavy consumer advertising was anexpensive proposition, but one day, investors believed, a large, loyal follow-ing would translate into rich revenue streams.

30 THE BASIC FINANCIAL STATEMENTS
Much of the dot-coms’ stock market value disappeared during the “techwreck” of 2000, but the perceived mismatch between the information-intensive New Economy and traditional notions of assets persisted. Promi-nent accounting theorists argued that financial reporting practices rooted inan era more dominated by heavy manufacturing grossly understated the valuecreated by research and development outlays, which GAAP was resistant tocapitalizing. They observed further that traditional accounting generallypermitted assets to rise in value only if they were sold. “Transactions are nolonger the basis for much of the value created and destroyed in today’s econ-omy, and therefore traditional accounting systems are at a loss to capturemuch of what goes on,” argued Baruch Lev of New York University. As ex-amples, he cited the rise in value resulting from a drug passing a key clinicaltest and from a computer software program being successfully beta-tested.“There’s no accounting event because no money changes hands,” Lev noted.3
THE VALUE PROBLEM
The problems of value that accountants wrestle with have also historicallyplagued philosophers, economists, tax assessors, and the judiciary. Moralphilosophers over the centuries grappled with the notion of a “fair” pricefor merchants to charge. Early economists attempted to derive a product’sintrinsic value by calculating the units of labor embodied in it. Several dis-tinct approaches have evolved for assessing real property. These include cap-italization of rentals, inferring a value based on sales of comparableproperties, and estimating the value a property would have if put to its“highest and best” use. Similar theories are involved when the courts seekto value the assets of bankrupt companies, although vigorous negotiationsamong the different classes of creditors play an essential role in the final de-termination.
With commendable clarity of vision, the accounting profession has cutthrough the thicket of valuation theories by establishing historical cost asthe basis of its system. The cost of acquiring or constructing an asset has thegreat advantage of being an objective and verifiable figure. As a benchmarkfor value, it is, therefore, compatible with accountants’ traditional principleof conservatism.
Whatever its strengths, however, the historical cost system also has dis-advantages that are apparent even to the beginning student of accounting.As noted, basing valuation on transactions means that no asset can be re-flected on the balance sheet unless it has been involved in a transaction. Themost familiar difficulty that results from this convention involves goodwill.

The Balance Sheet 31
Company A has value above and beyond its tangible assets, in the form ofwell-regarded brand names and close relationships with merchants built upover many years. None of this intangible value appears on Company A’s bal-ance sheet, however, for it has never figured in a transaction. When Com-pany B acquires Company A at a premium to book value, though, theintangibles are suddenly recognized. To the benefit of users of financialstatements, Company A’s assets are now more fully reflected. On the nega-tive side, Company A’s balance sheet now says it is more valuable thanCompany C, which has equivalent tangible and intangible assets but hasnever been acquired.
Liabilities, too, can become distorted under historical cost accounting.Long-term debt obligations floated at rates of 5% or lower during the1950s and 1960s remained outstanding during the late 1970s and early1980s, when rates on new corporate bonds soared to 15% and higher. Theeconomic value of the low-coupon bonds, as evidenced by market quota-tions, plunged to as little as 40 cents on the dollar. At that point, corpora-tions that had had the foresight (or simply the luck) to lock in low rates for30 years or more enjoyed a significant cost advantage over their competi-tors. A company in this position could argue with some validity that its low-cost debt constituted an asset rather than a liability. On its books, however,the company continued to show a $1,000 liability for each $1,000 faceamount of bonds. Consequently, its balance sheet did not reflect the valuethat an acquirer, for example, might capture by locking in a cheap cost ofcapital for an extended period.
ISSUES OF COMPARABILITY
Although some would regard the prohibition of adjusting debt figures to themarket as artificial, they might at least find it tolerable if it applied in everyinstance. Consider what happens, however, in an acquisition. Statement ofFinancial Accounting Standards (SFAS) 141 (“Business Combinations”)makes it mandatory to revalue the acquired company’s debt to current mar-ket if its value differs significantly from face value as a consequence of ashift in interest rates since the debt was issued. Here again, as in the case offirst-time recognition of goodwill, the historical cost principle makes com-parable companies appear quite dissimilar. The equally large “hidden assetvalue” of another company with low-cost debt will not be reflected on itsbalance sheet, simply because it has never been acquired.
The lack of comparability arising from the revaluation of the liabilitypersists long after the acquisition is consummated. By contrast, the footnote

32 THE BASIC FINANCIAL STATEMENTS
detailing the adjustment eventually disappears from the acquired firm’s an-nual report. In later years, readers receive no hint that the company’s debtshave been reduced—not in fact, but through one of accounting’s conven-ient fictions.
Critics of historical-cost accounting deplore the quirks that give rise tosuch distortions, arguing that corporations should be made to report thetrue economic value of their assets. Such criticisms assume, however, thatthere is a true value. If so, determining it is a job better left to metaphysi-cians than to accountants. In the business world, it proves remarkably diffi-cult to establish values with which all the interested parties concur.
The difficulties a person may encounter in the quest for true value arenumerous. Consider, for example, a piece of specialized machinery, ac-quired for $50,000. On the day the equipment is put into service, even be-fore any controversies surrounding depreciation rates arise, value is alreadya matter of opinion. The company that made the purchase would presum-ably not have paid $50,000 if it perceived the machine to be worth a lesseramount. A secured lender, however, is likely to take a more conservativeview. For one thing, the lender will find it difficult in the future to monitorthe value of the collateral through “comparables,” since only a few similarmachines (perhaps none, if the piece is customized) are produced each year.Furthermore, if the lender is ultimately forced to foreclose, there may be noready purchaser of the machinery for $50,000, since its specialized naturemakes it useful to only a small number of manufacturers. All of the poten-tial purchasers, moreover, may be located hundreds of miles away, so thatthe machinery’s value in a liquidation would be further reduced by the costsof transporting and reinstalling it.
The problems encountered in evaluating one-of-a-kind industrial equip-ment might appear to be eliminated when dealing with actively traded com-modities such as crude oil reserves. Even this type of asset, however, resistsprecise, easily agreed on valuation. Since oil companies frequently buy andsell reserves “in the ground,” current transaction prices are readily avail-able. These transactions, however, are based on estimates of eventual pro-duction from unique geologic formations, for there is no means of directlymeasuring oil reserves. Even when petroleum engineers employ the most ad-vanced technology, their estimates rely heavily on judgment and inference.It is not unheard of, moreover, for a well to begin to produce at the rate pre-dicted by the best scientific methods, only to peter out a short time later, ul-timately yielding just a fraction of its estimated reserves. With this degree ofuncertainty, recording the true value of oil reserves is not a realistic objec-tive for accountants. Users of financial statements can, at best, hope for in-formed guesses, and there is considerable room for honest people (not tomention rogues with vested interests) to disagree.

The Balance Sheet 33
“INSTANTANEOUS” WIPEOUT OF VALUE
Because the value of many assets is so subjective, balance sheets are proneto sudden, arbitrary revisions. To cite one dramatic example, on July 27,2001, JDS Uniphase, a manufacturer of components for telecommunica-tions networks, reduced the value of its goodwill by $44.8 billion. It was thelargest write-off in corporate history up to that time.
This drastic decline in economic value did not occur in one day. Severalmonths earlier, JDS had warned investors to expect a big write-off arisingfrom declining prospects at businesses that the company had acquired dur-ing the telecommunications euphoria of the late 1990s.4 If investors had re-lied entirely on JDS’s balance sheet, however, they would have perceived theloss of value as a sudden event.
Shortly before JDS Uniphase’s action, Nortel Networks took a $12.3billion goodwill write-off and several major companies in such areas as In-ternet software and optical fiber quickly followed suit. High-tech companieshad no monopoly on “instantaneous” evaporation of book value, however.In the fourth quarter of 2000, Sherwin-Williams recognized an impairmentcharge of $352.0 million ($293.6 million after taxes). Most of the write-offrepresented a reduction of goodwill that the manufacturer of paint and re-lated products had created through a string of acquisitions. Even after thehuge hit, goodwill represented 18.8% of Sherwin-Williams’s assets and ac-counted for 47.9% of shareholders’ equity.
Both Old Economy and New Economy companies, in short, are vulner-able to a sudden loss of stated asset value. Therefore, users of financialstatements should not assume that balance sheet figures invariably corre-spond to the current economic worth of the assets they represent. A morereasonable expectation is that the numbers have been calculated in accor-dance with GAAP. The trick is to understand the relationship between theseaccounting conventions and reality.
If this seems a daunting task, the reader may take encouragement fromthe success of the bond rating agencies (see Chapter 13) in sifting throughthe financial reporting folderol to get to the economic substance. The multi-billion-dollar goodwill write-offs in 2001 did not, as one might have ex-pected, set off a massive wave of rating downgrades. As in many previousinstances of companies writing down assets, Moody’s and Standard &Poor’s did not equate changes in accounting values with reduced protectionfor lenders. To be sure, if a company wrote off a billion dollars worth ofgoodwill, its ratio of assets to liabilities declined. Its ratio of tangible assetsto liabilities did not change, however. The rating agencies monitored bothratios, but had customarily attached greater significance to the version thatignored intangible assets such as goodwill.

34 THE BASIC FINANCIAL STATEMENTS
HOW GOOD IS GOODWILL?
By maintaining a skeptical attitude to the value of intangible assets through-out the New Economy excitement of the late Nineties, Moody’s and Stan-dard & Poor’s were bucking the trend. The more stylish view was thatbalance sheets constructed according to GAAP seriously understated thevalue of corporations in dynamic industries as computer software and e-commerce. Their earning power, so the story went, derived from inspiredideas and improved methods of doing business, not from the bricks andmortar for which conventional accounting was designed. To adapt to theeconomy’s changing profile, proclaimed the heralds of the New Paradigm,the accounting rule makers had to allow all sorts of items traditionally ex-pensed to be capitalized onto the asset side of the balance sheet. Againstthat backdrop, analysts who questioned the value represented by goodwill,an item long deemed legitimate under GAAP, look conservative indeed.
In reality, the stock market euphoria that preceded Uniphase’s mind-boggling write-off illustrated in classic fashion the reasons for rating agencyskepticism toward goodwill. Through stock-for-stock acquisitions, thesharp rise in equity prices during the late 1990s was transformed into in-creased balance sheet values, despite the usual assumption that fluctuationsin a company’s stock price do not alter its stated net worth. It was a form offinancial alchemy as remarkable as the transmutation of proceeds fromstock sales into revenues described in Chapter 3.
The link between rising stock prices and escalating goodwill is illus-trated by the fictitious example in Exhibit 2.1. In Scenario I, the shares ofAssociated Amalgamator Corporation (“Amalgamator”) and United Con-solidator Inc. (“Consolidator”) are both trading at multiples of 1.0 timesbook value per share. Shareholders’ equity is $200 million at Amalgamatorand $60 million at Consolidator, equivalent to the companies’ respectivemarket capitalizations. Amalgamator uses stock held in its treasury to ac-quire Consolidator for $80 million. The purchase price represents a pre-mium of 331⁄3% above the prevailing market price.
Let us now examine a key indicator of credit quality. Prior to the acquisi-tion, Amalgamator’s ratio of total assets to total liabilities (see Chapter 13) is1.25 times whereas the comparable figure for Consolidator is 1.18 times.The stock-for-stock acquisition introduces no new hard assets (e.g., cash,inventories or factories). Neither does the transaction eliminate any existingliabilities. Logically, then, Consolidator’s 1.18 times ratio should drag downAmalgamator’s 1.25 times ratio, resulting in a figure somewhere in betweenfor the combined companies.
In fact, though, the total-assets-to-total-liabilities ratio after the deal is1.25 times. By paying a premium to Consolidator’s tangible asset value,

The Balance Sheet 35
Amalgamator creates $20 million of goodwill. This intangible asset repre-sents just 1.4% of the combined companies’ total assets, but that suffices toenable Amalgamator to acquire a company with a weaker debt-quality ratiowithout showing any deterioration on that measure.
If this outcome seems perverse, consider Scenario II. As the scene opens,an explosive stock market rally has driven up both companies’ shares to150% of book value. The ratio of total assets to total liabilities, however, re-mains at 1.25 times for Amalgamator and 1.18 times for Consolidator. Con-servative bond buyers take comfort from the fact that the assets remain onthe books at historical cost less depreciation, unaffected by euphoria on thestock exchange that may dissipate at any time without notice.
EXHIBIT 2.1 Pro Forma Balance Sheets, December 31, 20XX ($000 omitted)
Associated United CombinedAmalgamator Consolidator Purchase CompaniesCorporation Inc. Price Pro Forma
Scenario I
Tangible assets $,1000 $400 $1,400Intangible assets 0 0 20
Total assets 1,000 400 1,420
Liabilities 800 340 1,140Shareholders’ equity (SE) 200 60 80 280
Total liabilities and SE $1,000 $400 $1,420
Tangible assets/total liabilities 1.25 1.18 1.23Total assets/total liabilities 1.25 1.18 1.25Market capitalization 200 60 280
Scenario II
Tangible assets $1,000 $400 $1,400Intangible assets 0 0 60
Total assets 1,000 400 1,460
Liabilities 800 340 1,140Shareholders’ equity (SE) 200 60 120 320
Total liabilities and SE $1,000 $400 $1,460
Total assets/total liabilities 1.25 1.18 1.28Tangible assets/total liabilities 1.25 1.18 1.23Market capitalization 300 90 520*

36 THE BASIC FINANCIAL STATEMENTS
As in Scenario I, Amalgamator pays a premium of 331⁄3% above theprevailing market price to acquire Consolidator. The premium is calculatedon a higher market capitalization, however. Consequently, the purchaseprice rises from $80 million to $120 million. Instead of creating $20 millionof goodwill, the acquisition gives rise to a $60 million intangible asset.
When the conservative bond investors calculate the combined com-panies’ ratio of total assets to total liabilities, they make a startling discov-ery. Somehow, putting together a company boasting a 1.25 times ratio withanother sporting a 1.18 times ratio has produced an entity with a ratio of1.28 times. Moreover, a minute of experimentation with the numbers willshow that the ratio would be higher still if Amalgamator had bought Con-solidator at a higher price. Seemingly, the simplest way for a company toimprove its credit quality is to make stock-for-stock acquisitions at grosslyexcessive prices.
Naturally, this absurd conclusion embodies a fallacy. In reality, the re-ceivables, inventories, and machinery available to be sold to satisfy credi-tors’ claims are no greater in Scenario II than in Scenario I. Given that thetotal-assets-to-total-liabilities ratio is lower at Consolidator than at Amal-gamator, the combined companies’ ratio logically must be lower than atAmalgamator. Common sense further states that Amalgamator cannottruly have better credit quality if it overpays for Consolidator than if it ac-quires the company at a fair price.
As it happens, there is a simple way out of the logical conundrum. Letus exclude goodwill in calculating the ratio of assets to liabilities. As shownin the exhibit, Amalgamator’s ratio of tangible assets to total liabilities fol-lowing its acquisition of Consolidator is 1.23 times in both Scenario I andScenario II. This is the outcome that best reflects economic reality. To en-sure that they reach this commonsense conclusion, credit analysts must fol-low the rating agencies’ practice of calculating balance sheet ratios bothwith and without goodwill and other intangible assets, giving greater em-phasis to the latter version.
Calculating ratios on a tangibles-only basis is not equivalent to sayingthat the intangibles have no value. Amalgamator will likely recoup all ormost of the $60 million accounted for as goodwill if it turns around andsells Consolidator tomorrow. Such a transaction is hardly likely, however. Asale several years hence, after stock prices have fallen from today’s lofty lev-els, is a more plausible scenario. Under such conditions, the full $60 millionprobably will not be recoverable.
Even leaving aside the possibility of a plunge in stock prices, it makeseminent sense to eliminate or sharply downplay the value of goodwill in a balance-sheet-based analysis of credit quality. Unlike inventories or

The Balance Sheet 37
accounts receivable, goodwill is not an asset that can be readily sold or fac-tored to raise cash. Neither can a company enter into a sale-leaseback of itsgoodwill, as it can with its plant and equipment. In short, goodwill is not aseparable asset that management can either convert into cash or use to raisecash to extricate itself from a financial tight spot. Therefore, the relevanceof goodwill to an analysis of asset protection is questionable.
On the whole, the rating agencies appear to have shown sound judg-ment during the 1990s by resisting the New Economy’s siren song. Whileenthusiasm mounted for all sorts of intangible assets, they continued to geartheir analysis to tangible-assets-only versions of key balance sheet ratios. Byand large, therefore, companies did not alter the way they were perceived byMoody’s and Standard & Poor’s when they suddenly took an axe to theirintangible assets.
More generally, asset write-offs do not cause ratings to fall. Occasion-ally, to be sure, the announcement of a write-off coincides with the disclo-sure of a previously unrevealed impairment of value, ordinarily arisingfrom operating problems. That sort of development may trigger a down-grade. In addition, a write-off sometimes coincides with a decision to closedown certain operations. The associated severance costs (payments to ter-minated employees) may represent a substantial cash outlay that doesweaken the company’s financial position. Finally, a write-off can put acompany in violation of a debt covenant (see Chapter 12). Nervous lendersmay exploit the technical default by canceling the company’s credit lines,precipitating a liquidity crisis. In and of itself, however, adjusting the bal-ance sheet to economic reality does not represent a reduction in credit pro-tection measures.
LOSING VALUE THE OLD-FASHIONED WAY
Goodwill write-offs by technology companies such as Uniphase makesplashy headlines in the financial news, but they by no means represent theonly way in which balance sheet assets suddenly and sharply decline invalue. In the “Old Economy,” where countless manufacturers earn slendermargins on low-tech industrial goods, companies are vulnerable to long-runerosion in profitability. Common pitfalls include fierce price competitionand a failure, because of near-term pressures to conserve cash, to invest ad-equately in modernization of plants and equipment. As the rate of return ontheir fixed assets declines, producers of basic commodities such as paper,chemicals, and steel must eventually face up to the permanent impairmentof their reported asset values.

38 THE BASIC FINANCIAL STATEMENTS
In the case of a chronically low rate-of-return company, it is not feasibleto predict precisely the magnitude of a future reduction in accounting val-ues. Indeed, there is no guarantee that a company will fully come to gripswith its overstated net worth, especially on the first round. To estimate theexpected order of magnitude of future write-offs, however, an analyst canadjust the shareholders’ value shown on the balance sheet to the rate of re-turn typically being earned by comparable corporations.
To illustrate, suppose Company Z’s average net income over the pastfive years has been $24 million. With most of the company’s modest earn-ings being paid out in dividends, shareholders’ equity has been stagnant ataround $300 million. Assume further that during the same period, the aver-age return of companies in the Standard & Poor’s 400 index of industrialcorporations has been 14%.
Does the figure $300 million accurately represent Company Z’s equityvalue? If so, the implication is that investors are willing to own the com-pany’s shares and accept a return of only 8% ($24 million divided by $300million), even though a 14% return is available on other stocks. There is noobvious reason why investors would voluntarily make such a sacrifice, how-ever. Therefore, Company Z’s book value is almost certainly overstated.
A reasonable estimate of the low-profit company’s true equity valuewould be the amount that produces a return on equity equivalent to thegoing rate:
Although useful as a general guideline, this method of adjusting the share-holders’ equity of underperforming companies neglects important sub-tleties. For one thing, Company Z may be considered riskier than theaverage company. In that case, shareholders would demand a return higherthan 14% to hold its shares. Furthermore, cash flow (see Chapter 4) may bea better indicator of the company’s economic performance than net income.This would imply that the adjustment ought to be made to the ratio of cashflow to market capitalization, rather than return on equity. Furthermore, in-vestors’ rate-of-return requirements reflect expected future earnings, ratherthan past results. Depending on the outlook for its business, it might be rea-sonable to assume that Company Z will either realize higher profits in thenext five years than in the past five or see its profits plunge further. By the
Company Z average earnings stream
XAverage return on equity
for U.S. corporations
million
XX = $171 million
=
=$
%24
14

The Balance Sheet 39
same token, securities analysts may expect the peer group of stocks thatrepresent alternative investments to produce a return higher or lower than14% in coming years. The further the analyst travels in search of true value,it seems, the murkier the notion becomes.
TRUE EQUITY IS ELUSIVE
What financial analysts are actually seeking, but are unable to find in the fi-nancial statements, is equity as economists define it. In scholarly studies,the term equity generally refers not to accounting book value, but to thepresent value of future cash flows accruing to the firm’s owners. Consider afirm that is deriving huge earnings from a trademark that has no accountingvalue because it was developed internally rather than acquired. The presentvalue of the profits derived from the trademark would be included in theeconomist’s definition of equity, but not in the accountant’s, potentially cre-ating a gap of billions of dollars between the two.
The contrast between the economist’s and the accountant’s notion ofequity is dramatized by the phenomenon of negative equity. In the econo-mist’s terms, equity of less than zero is synonymous with bankruptcy. Thereasoning is that when a company’s liabilities exceed the present value of allfuture income, it is not rational for the owners to continue paying off the li-abilities. They will stop making payments currently due to lenders and tradecreditors, which will in turn prompt the holders of the liabilities to try to re-cover their claims by forcing the company into bankruptcy. Suppose on theother hand, that the present value of a highly successful company’s futureincome exceeds the value of its liabilities by a substantial margin. If thecompany runs into a patch of bad luck, recording net losses for several yearsrunning and writing off selected operations, the book value of its assets mayfall below the value of its liabilities. In accounting terms, the result is nega-tive shareholders’ equity. The economic value of the assets, however, maystill exceed the stated value of the liabilities. Under such circumstances, thecompany has no reason to consider either suspending payments to creditorsor filing for bankruptcy.
Negative shareholders’ equity can also arise from a leveraged recapi-talization, a type of transaction that gained a considerable vogue in the1980s. The analytical relevance of leveraged recaps does not arise solelyfrom the insight they provide into the differences between economic andaccounting-based equity. One day, they may be of more than historical in-terest. If stock prices ever become as depressed as they were in the early1980s, the massive stock repurchases with borrowed funds may easilymake a comeback.

40 THE BASIC FINANCIAL STATEMENTS
A leveraged recap is ostensibly designed to remedy a corporation’s lowstock market valuation. Another, unadvertised purpose may be to fend off ahostile takeover. Suppose that several large shareholders, who are sympa-thetic (or even identical to) the corporation’s incumbent management, retaintheir stock as the total number of outstanding shares declines sharply. Thesmall group of shareholders will materially increase its proportional owner-ship. If all goes well, the leveraged recap will kill two birds with one stone,solidifying the insiders’ control of the company while boosting the shareprice to appease shareholders who were disposed to support the hostile bid.
In the fictitious example shown in Exhibit 2.2, Sluggard Corporation’sstock is languishing at a modest 9.3 times earnings, or $25 a share. Restiveshareholders are urging management to improve Sluggard’s operating per-formance, explore the possibility of selling the company at a premium to itspresent stock price, or step aside in favor of others who can do a better jobof enhancing shareholder value. A dissident group has even nominated itsown slate of directors, who are committed to divesting unprofitable opera-tions and replacing the current chief executive officer.
Management counters by asserting that the real problem is with thestock market. Fickle, short-term-oriented investors are not attributing ap-propriate value to Sluggard’s excellent long-term business prospects. Undercurrent market conditions, says the CEO, shareholders cannot realize fullvalue on their investment by engineering the sale of Sluggard to a biggercompany.
To satisfy shareholders’ legitimate desire for better stock performance,while preserving Sluggard’s ability to capitalize on its outstanding opportu-nities as an independent company, management and the board announce abold financial transaction. The company will tender for 32 million of its 45million outstanding shares at a 25% premium to the current market price,or $30 a share. To pay for the $960 million stock repurchase, Sluggard hasarranged an interim credit line, which it plans to refinance through a long-term bond offering. The greatly increased debt load that will result willraise interest expense from $68 million to $183 million annually, on a proforma basis. After-tax income will consequently drop from $121 million to$46 million. That decline will be more than offset, however, by the reduc-tion in shares outstanding. Earnings per share, management concludes, willrise from $2.69 to $3.54.
To be sure, the market may lower Sluggard’s price-earnings ratio to re-flect the increase in financial risk indicated by a sharply higher ratio oflong-term debt to capital and a significantly reduced pretax interest cover-age ratio (see Chapter 13). Under reasonable assumptions, however, thecompany’s stock should continue to trade at the tender price of $30 a share

The Balance Sheet 41
EXHIBIT 2.2 Leveraged Recapitalization (Illustration)
Sluggard CorpoorationCondensed Balance Sheet and Income Statement
December 31, 20XX($000 omitted)
BeforeRecapitalization Transaction Pro Forma
Current assets $0.500 $ 0 $ 500Fixed assets 1,500 0 1,500
Total assets 2,000 0 2,000
Current liabilities 250 0 250Long-term debt 850 +960 1,810Shareholders’ equity 900 (960) (60)
Total liabilities and equity $2,000 2,000
Earnings before interest and taxes 252 0 252Interest expense 68 +115 183
Pretax income 184 69Income tax 63 23
Net income $0.121 $2,046
Shares outstanding (milions) 45 13Shareholders’ equity per share $20 $ (4.62)Market price per share $25 $30Purchase price per share 30 N.A.Interest rate on new borrowing 12.0%Numbers of shares purchased (millions) 32Earnings per share $2.69 $3.54Return on shareholders’ equity 13.4% N.M.Pretax interest coverage 3.7X 1.4XLong-term debt as a percentage
of total capital 48.6% 103.4%Price-earnings ratio (at market price) 9.3X 8.5X

42 THE BASIC FINANCIAL STATEMENTS
after the tender offer is completed. Accordingly, the currently disgruntledstockholders will get a chance to sell some of their shares at a big premiumto the current market and also enjoy a longer-run boost to the share price.Furthermore, for the next few years, Sluggard plans to devote the cash gen-erated from its operations to debt repayment. That should take care of thebiggest concern raised by management’s plan, namely, the heightened riskof financial strain posed by sharply increased interest costs.
Based on the bankruptcies of many prominent companies that under-went leveraged buyouts or leveraged recapitalizations in the 1980s, investors’worries about Sluggard’s expanded debt load are by no means unfounded. Inthe period of the leveraged recaps’ greatest popularity, in fact, many veteranfinancial analysts perceived the leveraged recaps to be bankrupt from incep-tion. The only instances in which they had previously observed negativeshareholders’ equity, comparable to the −$60 million figure shown in Exhibit2.2, involved moribund companies that had wiped out their retained earningsthrough repeated losses. Typically, those companies were approaching nega-tive equity in the economic, as well as the accounting sense.
The leveraged recaps presented a very different case, however. Theirnegative shareholders’ equity figures arose from the conventions of double-entry-bookkeeping. Unlike other kinds of asset purchases, a company’s pur-chase of its own stock does not simply result in one type of asset (cash)being replaced by another (such as inventory or plant and equipment) onthe balance sheet. Instead, the entry that offsets the reduction in cash is a re-duction in shareholders’ equity. In the illustration, Sluggard pays a premiumover book value, with the consequence that a buyback of less than 100% ofthe shares costs more than the stated shareholders’ equity.
Despite the resulting negative shareholders’ equity that arises, Sluggardis by no means faced with an immediate prospect of bankruptcy. The com-pany’s pretax earnings continue to cover expense, albeit by a slimmer mar-gin than formerly. Moreover, Sluggard is continuing to earn a profit, whichthe stock market is capitalizing at $30 a share times 13 million shares, or$390 million. This is a plain demonstration that in economists’ terms, thecompany continues to have a substantially positive equity, whatever the fi-nancial statements show.
PROS AND CONS OF A MARKET-BASED EQUITY FIGURE
Relying on market capitalization is the practical means by which financialanalysts commonly estimate the economists’ more theoretically rigorousdefinition of equity as the present value of expected future cash flows.

The Balance Sheet 43
Monumental difficulties confront anyone who instead attempts to arrive atthe figure through conventional financial reporting systems. The problem isthat traditional accounting favors items that can be objectively measured.Unfortunately, future earnings and cash flows are unobservable. Moreover,calculating present value requires selecting a discount rate representing thecompany’s cost of capital. Determining the cost of capital is a notoriouslycontroversial subject in the financial field, complicated by thorny tax con-siderations and risk adjustments. The figures needed to calculate econo-mists’ equity are not, in short, the kind of numbers accountants like to dealwith. Their ideal value is a price on an invoice that can be independentlyverified by a canceled check.
Market capitalization has additional advantages beyond its compara-tive ease of calculation. For one thing, it represents the consensus of largenumbers of analysts and investors who constantly monitor companies’ fu-ture earnings prospects as the basis for their evaluations. In addition, an up-to-the-minute market capitalization can be calculated on any day that thestock exchange is open. This represents a considerable advantage over theshareholders’ equity shown on the balance sheet, which is updated onlyonce every three months. Market capitalization adjusts instantaneously tonews such as a surprise product launch by a competitor, an explosion thathalts production at a key plant, or a sudden hike in interest rates by the Fed-eral Reserve. In contrast, these events may never be reflected in book valuein a discrete, identifiable manner. Ardent advocates of market capitalizationcannot conceive any more accurate estimate of true equity value.
Against these advantages, however, the analyst must weigh severaldrawbacks to relying on market capitalization to estimate a company’s ac-tual equity value. For one thing, although the objectivity of a price quota-tion established in a competitive market is indeed a benefit, it is obtainableonly for corporations with publicly traded stocks. For privately owned com-panies, the proponents of market capitalization typically generate a proxyfor true equity through reference to industry-peer public companies. For ex-ample, to calculate the equity of a privately owned paper producer, an ana-lyst might multiply the publicly traded peer group’s average price-earningsratio (see Chapter 14) by the private company’s earnings. By failing to cap-ture the impact of company-specific events, however, this approach sacri-fices one of the great merits of using market capitalization as a gauge ofactual equity value.
Even if analysts rely on market capitalization exclusively in connectionwith publicly traded companies, they will still encounter pitfalls. Considerthe case of Intel, a leading manufacturer of computer components. On May13, 2000, Intel’s market capitalization of $407.5 billion was the thirdlargest among the 30 companies represented in the Dow Jones Industrial

44 THE BASIC FINANCIAL STATEMENTS
Average. The following day, the Dow plummeted by 618 points, a decline of5.7%. Intel had the dubious distinction of losing more market value onMarch 14 than any other company in the Dow Industrials. If the stockmarket was a reliable guide, then Intel’s equity contracted by 8.8%, or astaggering $35.7 billion, in a single day. Collectively, the Dow Industrials’value fell by $227.2 billion.
Whatever theoretical arguments can be advanced in favor of regardingmarket capitalization as a company’s true equity value, short-run changes ofthe magnitude experienced by Intel on May 14, 2000, raise a caution. Suchincidents justify a bit of skepticism about the assertion that the aggregatemarket price of a company’s shares represents its correct value at every mo-ment. To an observer who is not wedded to a belief that securities prices areperfect reflections of underlying value, sudden swings in market capitaliza-tion sometimes reveal more about the dynamics of the market than they doabout short-run changes in companies’ earnings prospects.
An inference along those lines is supported by extensive academic re-search conducted under the rubric of “behavioral finance.” In contrast tomore traditional financial economists, the behavioralists doubt that in-vestors invariably process information accurately and act on it according torules of rationality, as defined by economists. Empirical studies by adher-ents of behavioral finance show that instead of faithfully tracking com-panies’ intrinsic values, market prices frequently overreact to news events.Even though investors supposedly evaluate stocks on the basis of expectedfuture dividends (see Chapter 14), the behavioralists find that the stockmarket is far more volatile than the variability of dividends can explain.5
To be sure, these conclusions remain controversial. Traditionalists havechallenged the empirical studies that underlie them, producing a vigorousdebate. Nevertheless, the findings of behavioral finance lend moral supportto analysts who find it hard to believe that the one-day erasure of $35.7 bil-lion of Intel’s market capitalization must automatically be a truer represen-tation of the company’s change in equity value than a figure derived fromfinancial statement data.
Market capitalization, then, is a useful tool, but not one to be heededblindly. In the end, “true” equity remains an elusive number. Instead ofstriving for theoretical purity on the matter, analysts should adopt a flexi-ble attitude, using the measure of equity value most useful to a particularapplication.
For example, historical-cost-based balance sheet figures are the onesthat matter in estimating the risk that a company will violate a loancovenant requiring maintenance of a minimum ratio of debt to net worth(see Chapter 12). The historical cost figures are less relevant to a liquidationanalysis aimed at gauging creditors’ asset protection. That is, if a company

The Balance Sheet 45
were sold to pay off its debts, the price it would fetch would probably reflectthe market’s current valuation of its assets more nearly than the carryingcost of those assets.
Neither measure, however, could be expected to equate precisely to theproceeds that would actually be realized in a sale of the company. Betweenthe time that a sale was decided on and executed, its market capitalizationmight change significantly, purely as a function of the stock market’s dy-namics. By the same token, the current balance sheet values of certain assetscould be overstated through tardy recognition of impairments in value, orunderstated reflecting the prohibition on writing up an asset that has notchanged hands.
UNDISCLOSED HAZARDS
Yet another complication in the quest for true equity involves disclosure.Despite the pitfalls previously discussed, analysts can feel comfortable in re-lying on market capitalization for certain applications, provided they be-lieve that all material information affecting companies’ equity values isavailable for investors to assess. In practice, though, companies’ equity val-ues can be significantly altered by items that are either undisclosed or dis-closed only in a limited fashion.
Early in 1994, analysts were largely caught off guard by problems in-volving financial derivatives. (The collective term for these instruments re-flects that their valuations derive from the values of other assets, e.g.,commodities, indexes of securities.) For years, corporations had used deriv-atives such as swaps and structured financings to hedge against swings in in-terest rates, currency exchange rates, and other cost factors.
As time went on, some corporate treasurers sought to capitalize furtheron expertise gained through hedging. Instead of merely trying to controlrisk, they hoped to profit by correctly predicting the direction of interestrates or the future relationship among various commodity prices. If theirpredictions proved wrong, trading losses would result.
Provided the companies understood and limited the risks incurred inthese transactions, they did not act irresponsibly. Often, the trading wasprofitable, producing a welcome supplement to earnings generated in moretraditional activities.
As a comparatively new phenomenon, though, derivatives trading didnot generate highly detailed mandatory disclosure. Typically, corpora-tions divulged the scale, but not the terms or riskiness of the transactions.Some types of derivative were merely aggregated with the general cash accounts.

46 THE BASIC FINANCIAL STATEMENTS
Just as accounting rule makers were urging companies to expand theirderivatives disclosure, while also considering new mandatory reporting onthe subject, a sudden burst of interest rate volatility socked several majorcorporations with huge trading losses. Procter & Gamble took a one-timecharge of $102 million on two interest rate swaps it had entered into in theUnited States and Germany. Air Products & Chemicals charged off $60 mil-lion on five swap contracts, acknowledging that with hindsight, its riskanalysis had been faulty. Dell Computer sustained a $26.3 million loss onderivatives and other investments related to interest rates. (All figures are onan aftertax basis.)
The shock of these announcements probably moved companies towardgreater conservatism in their use of derivatives. Additionally, the surpriselosses strengthened the hand of those calling for fuller disclosure. SFAS 133(“Accounting for Derivative and Similar Instruments and Hedging Activi-ties”) now requires all derivatives to be recorded as either assets or liabilitiesat fair value. As the values change, the resulting gains or losses may be rec-ognized immediately or deferred, depending on whether the derivative qual-ifies for classification as a hedge.
At the same time, the incidents underscored the misfortunes that canbefall even meticulous and thoughtful analysts. Users of financial state-ments can process only the information they have, and they do not alwayshave the information they need.
While FASB was able to bring about fuller disclosure of derivatives, theaccounting rule makers did not and could not resolve the larger issue for alltime. Innovation in the financial markets is unlikely to abate, meaning thatit will remain a challenge for accounting rule makers to keep pace. To rec-ognize possible undisclosed hazards, therefore, analysts must stay abreastof new types of transactions. Where feasible, users of financial statementsshould also solicit as much detail as management will disclose regardingrisks not spelled out in the balance sheet or footnotes.
THE COMMON FORM BALANCE SHEET
As the technology companies’ huge 2001 write-offs demonstrate, deteriora-tion in a company’s financial position may catch investors by surprise be-cause it occurs gradually and is reported suddenly. It is also possible for anincrease in financial risk to sneak up on analysts even though it is reportedas it occurs. Many companies alter the mix of their assets, or their methodsof financing them, in a gradual fashion. To spot these subtle, yet frequentlysignificant, changes, it is helpful to prepare a common form balance sheet.

The Balance Sheet 47
EXHIBIT 2.3 Lowe’s Companies Inc. Consolidated Balance Sheet in Thousands
PercentJanuary 28, 2000 Total
AssetsCurrent Assets:Cash and cash equivalents $ 491,122 5.4Short-term investments 77,670 0.9Accounts receivable—net 147,901 1.6Merchandise inventory 2,812,361 31.2Deferred income taxes 53,145 0.6Other current assets 127,342 1.4Total current assets 3,709,541 41.2Property, less accumulated depreciation 5,177,222 57.5Long-term investments 31,114 0.3Other assets 94,446 1.0
Total assets $9,012,323 100.0
Liabilities and Shareholders’ EquityCurrent Liabilities:Short-term borrowings $ 92,475 1.0Current maturities of long-term debt 59,908 0.7Accounts payable 1,566,946 17.4Employee retirement plans 101,946 1.1Accrued salaries and wages 164,003 1.8Other current liabilities 400,676 4.5Total current liabilities 2,385,954 26.5Long-term debt, excluding current maturities 1,726,579 19.2Deferred income taxes 199,824 2.2Other long-term liabilities 4,495 —
Total liabilities $4,316,852 47.9
Shareholders’ Equity:Preferred stock—$5 par value, none issued —Common stock—$.50 Par value; issued and outstanding
January 28, 2000 382,359January 29, 1999 374,388 $ 191,179 2.1
Capital in excess of par value 1,755,616 19.5Retained earnings 2,761,964 30.6Unearned compensation-restricted stock awards (12,868) (0.1)Accumulated other comprehensive income (loss) (420) N.M.Total shareholders’ equity 4,695,471 52.1
Total liabilities and shareholders’ equity $9,012,323 100.0
Calculations are subject to rounding error.Source: Lowe’s Companies Inc., Form 10-K405, April 26, 2000.

48 THE BASIC FINANCIAL STATEMENTS
Also known as the percentage balance sheet, the common form balancesheet converts each asset into a percentage of total assets and each liabilityor component of equity into a percentage of total liabilities and sharehold-ers’ equity. Exhibit 2.3 applies this technique to the 2000 balance sheet ofLowe’s Companies, Inc., a home improvement retailer.
The analyst can view a company’s common form balance sheets overseveral quarters to check, for example, whether inventory is increasing sig-nificantly as a percentage of total assets. An increase of that sort might sig-nal involuntary inventory buildup resulting from an unanticipatedslowdown in sales. Similarly, a rise in accounts receivable as a percentage ofassets may point to increasing reliance on the extension of credit to generatesales or a problem in collecting on credit previously extended. Over a longerperiod, a rise in the percentage of assets represented by property, plant, andequipment can signal that a company’s business is becoming more capital-intensive. By implication, fixed costs are probably rising as a percentage ofrevenues, making the company’s earnings more volatile.
CONCLUSION
By closely examining the underlying values reflected in the balance sheet,this chapter emphasizes the need for a critical, rather than a passive, ap-proach to financial statement analysis. The discussions of return on equity,goodwill, and leveraged recapitalizations underscore the chapter’s domi-nant theme, the elusiveness of “true” value. Mere tinkering with the con-ventions of historical cost cannot bring accounting values into line withequity as economists define it and, more to the point, as financial analystswould ideally like it to be. Market capitalization probably represents a su-perior approach in many instances. Under certain circumstances, however,serious questions can be raised about the validity of a company’s stock priceas a standard of value. In the final analysis, users of financial statementscannot retreat behind the numbers derived by any one method. They mustinstead exercise judgment to draw sound conclusions.

49
CHAPTER 3The Income Statement
The goal of analyzing an income statement is essentially to determinewhether the story it tells is good, bad, or indifferent. To accomplish this
objective, the analyst draws a few initial conclusions, then puts the incomestatement into context by comparing it with income statements of earlierperiods, as well as statements of other companies. These steps are describedin the section of this chapter entitled “Making the Numbers Talk.”
Simple techniques of analysis can extract a great deal of informationfrom an income statement, but the quality of the information is no less aconcern than the quantity. A conscientious analyst must determine how ac-curately the statement reflects the issuer’s revenues, expenses, and earnings.This deeper level of scrutiny requires an awareness of imperfections in theaccounting system that can distort economic reality.
The section entitled “How Accurate Are the Numbers?” documents theindefatigability of issuers in devising novel gambits for exploiting these vul-nerabilities. Analysts must be equally resourceful. In particular, students offinancial statements must keep up with the innovations of the past few yearsin transforming rising stock values into revenues of dubious quality.
MAKING THE NUMBERS TALK
By observing an income statement in its raw form, the reader can make sev-eral useful, albeit limited, observations. Boston Beer’s 2000 income state-ment (Exhibit 3.1) shows, for example, that the company was profitablerather than unprofitable. The statement also provides some sense of thefirm’s cost structure. Selling, general, and administrative expenses (SG&A)were the largest component of total costs. These outlays exceeded cost ofgoods sold (COGS), an item that includes materials and labor directly in-volving in brewing.

50 THE BASIC FINANCIAL STATEMENTS
A conspicuous feature of Boston Beer’s income statement is the absenceof interest expense, reflecting the company’s debt-free balance sheet. Thischaracteristic eliminates one source of earnings volatility—fluctuations in in-terest rates.1 (Note that even if a company confines its borrowings to fixed-rate debt, its interest expense is variable in the sense that the company mayreplace maturing debt with higher-cost or lower-cost debt as a consequence ofchanges in interest rates.) For most beverage producers (and for companies inthe industrial sector, generally), rising and falling interest rates have only alimited effect on the earnings. They are not invariably debt-free, but interestexpense typically represents a minor portion of their total costs. Changes ininterest rates have a dramatic impact, however, on banks and finance com-panies which have cost structures heavily concentrated in interest expense.
One of the most powerful tools for advancing beyond basic conclusionsabout a company’s cost structure is the percentage income statement. In thisformat, each income statement item is expressed as a percentage of the “topline” (sales or revenues), which is represented as 100%. Recasting the fig-ures in this way permits the analyst to compare a company’s income state-ment in a meaningful way with its income statement from an earlier year orwith an industry peer company’s income statement. The percentage incomestatement’s facilitation of comparisons gives rise to its other name, the“common form income statement.”
Exhibit 3.2 converts Boston Beer’s 2000 income statement to per-centages and compares the year’s results with the company’s 1999 figures.
EXHIBIT 3.1 Boston Beer Annual Income Statement ($000 omitted)
2000
Sales $190,554Cost of goods sold 77,741
Gross profit 112,813Selling, general, and administrative expense 90,377
Operating income before depreciation 22,436Depreciation, depletion, and amortization 6,316
Operating profit 16,120Nonoperating income/expense 2,930
Pretax income 19,050Total income taxes 7,811
Net income $111,239
Source: Compustat.
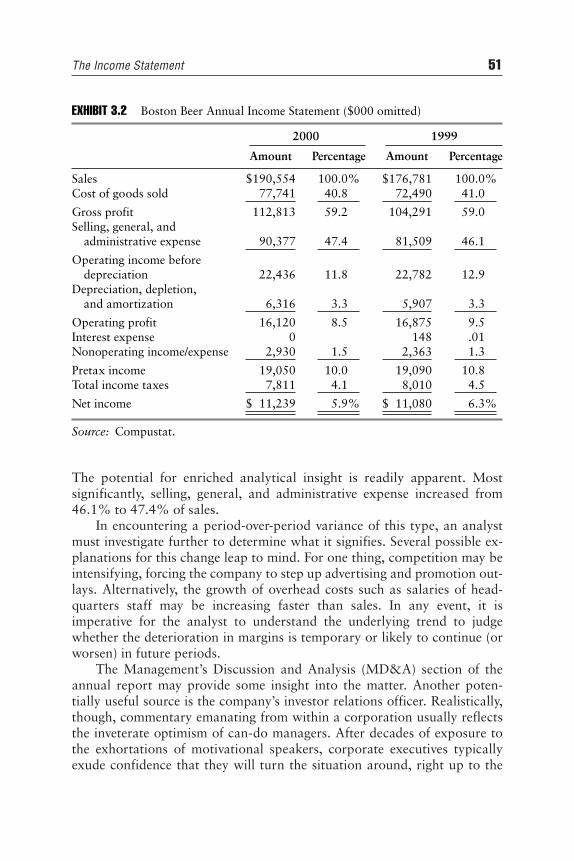
The Income Statement 51
The potential for enriched analytical insight is readily apparent. Most significantly, selling, general, and administrative expense increased from46.1% to 47.4% of sales.
In encountering a period-over-period variance of this type, an analystmust investigate further to determine what it signifies. Several possible ex-planations for this change leap to mind. For one thing, competition may beintensifying, forcing the company to step up advertising and promotion out-lays. Alternatively, the growth of overhead costs such as salaries of head-quarters staff may be increasing faster than sales. In any event, it isimperative for the analyst to understand the underlying trend to judgewhether the deterioration in margins is temporary or likely to continue (orworsen) in future periods.
The Management’s Discussion and Analysis (MD&A) section of theannual report may provide some insight into the matter. Another poten-tially useful source is the company’s investor relations officer. Realistically,though, commentary emanating from within a corporation usually reflectsthe inveterate optimism of can-do managers. After decades of exposure tothe exhortations of motivational speakers, corporate executives typicallyexude confidence that they will turn the situation around, right up to the
EXHIBIT 3.2 Boston Beer Annual Income Statement ($000 omitted)
2000 1999
Amount Percentage Amount Percentage
Sales $190,554 100.0% $176,781 100.0%Cost of goods sold 77,741 40.8 72,490 41.0
Gross profit 112,813 59.2 104,291 59.0Selling, general, and
administrative expense 90,377 47.4 81,509 46.1
Operating income beforedepreciation 22,436 11.8 22,782 12.9
Depreciation, depletion,and amortization 6,316 3.3 5,907 3.3
Operating profit 16,120 8.5 16,875 9.5Interest expense 0 148 .01Nonoperating income/expense 2,930 1.5 2,363 1.3
Pretax income 19,050 10.0 19,090 10.8Total income taxes 7,811 4.1 8,010 4.5
Net income $911,239 5.9% $711,080 6.3%
Source: Compustat.

52 THE BASIC FINANCIAL STATEMENTS
steps of the bankruptcy court. Accordingly, analysts should solicit otherviews of the situation from the company’s customers, suppliers, competi-tors, and lenders, as well as from analysts who have followed the companyover a lengthy period.
Besides facilitating comparisons between a company’s present and pastresults, the percentage income statement can highlight important factsabout a company’s competitive standing. Exhibit 3.3 displays the 2000performance of Boston Beer alongside that of Anheuser-Busch, producer ofthe leading brand, Budweiser. Despite their vast difference in size, the twocompanies can be compared head-to-head through the common form ap-proach. The contrast is sharp, with cost of goods sold accounting for55.4% of the sales dollar at Anheuser-Busch, but only 40.8% at BostonBeer. Despite Boston Beer’s substantial advantage in gross margin, however,Anheuser-Busch achieves a far higher operating margin—20.3% versus8.5%. With its much greater unit volume, Anheuser-Busch can spread itsadvertising and other marketing costs across a larger revenue base. Conse-quently, SG&A expenses represent a dramatically lower portion of its salesdollar (17.7%) than in Boston Beer’s case (47.4%). The SG&A edge enablesAnheuser-Busch to overcome the handicap of a 2.8% interest componentand bring 12.7% of sales down to the bottom line. That is more than dou-ble the net margin achieved by Boston Beer (5.9%).
EXHIBIT 3.3 Boston Beer and Anheuser-Busch Comparative Percentage IncomeStatements 2000
Boston Beer Anheuser-Busch
Sales 100.0% 100.0%Cost of goods sold 40.8 55.4
Gross profit 59.2 44.6Selling, general, and administrative expense 47.4 17.7
Operating income before depreciation 11.8 26.9Depreciation, depletion, and amortization 3.3 6.6
Operating profit 8.5 20.3Interest expense 2.8Nonoperating income/expense 1.5 1.9
Pretax income 10.0 19.4Total income taxes 4.1 6.8
Net income 5.9% 12.7%
Source: Compustat.

The Income Statement 53
Contrasting operating strategies explain the large difference between thetwo companies in percentage of sales represented by product costs (COGS).Anheuser-Busch’s income statement reflects the heavy costs of doing businessthe traditional way. The company sells beer produced in breweries that itowns and operates. Boston Beer, on the other hand, relies largely on contractbrewing, a strategy of utilizing the excess capacity of breweries owned byother companies.
Naturally, the total cost of producing a barrel of beer is the same, whetherthe brewery sells it under its own label or sells it to another company under acontract brewing arrangement. Nevertheless, it is not surprising that contractbrewing can prove economical to Boston Beer. The brewery owner’s fixedcosts, including occupancy, depreciation, and interest expense, will be incurredwhether the brewery operates at 60% or 90% of capacity. If the company hasidle capacity, it can increase its profit by utilizing it to produce incrementalvolume, even if it sells the beer at a price only slightly higher than its variablecost. Accordingly, a company following Boston Beer’s strategy can potentiallynegotiate terms under which its share of fixed costs is less than proportionateto its share of the brewery’s output. Its total cost per barrel can therefore belower than the total cost per barrel to a brewery’s owner-operator (see “Be-hind the Numbers—Fixed versus Variable Costs,” later in this chapter).
Boston Beer’s management maintains that contract brewing promotesquality control by allowing it to select breweries that use traditional meth-ods. Management adds that brewing in several locations enables the com-pany to hold down its distribution costs. Moreover, according to BostonBeer, multiple production facilities permit it to deliver fresher beer to itscustomers than competing “craft” brewers, which distribute the output ofsingle breweries over large territories. By not emphasizing ownership of itsbrewing operations, Boston Beer not only limits its product costs, but alsoexpends half as much of its sales dollar (3.3% versus 6.6%) on depreciationof fixed assets as Anheuser-Busch.
While Boston Beer sources most of its product through contract brewing,it also brews some beer in its own facilities. Its Boston Brewery supplies lim-ited quantities of beer for the local market. In addition, effective March 1,1997, the company acquired, through its wholly owned subsidiary, SamuelAdams Brewery Company, Ltd., all of the equipment of an independentbrewer located in Cincinnati, Ohio. Pursuant to the agreement, SamuelAdams Brewery also completed acquisition of the Cincinnati brewer’s landand buildings as of November 15, 2000.
Boston Beer’s management contended that the deviation from its generalapproach of contract brewing enhanced its brewing flexibility. A percentageincome statement comparison between the company’s results in 2000 and at
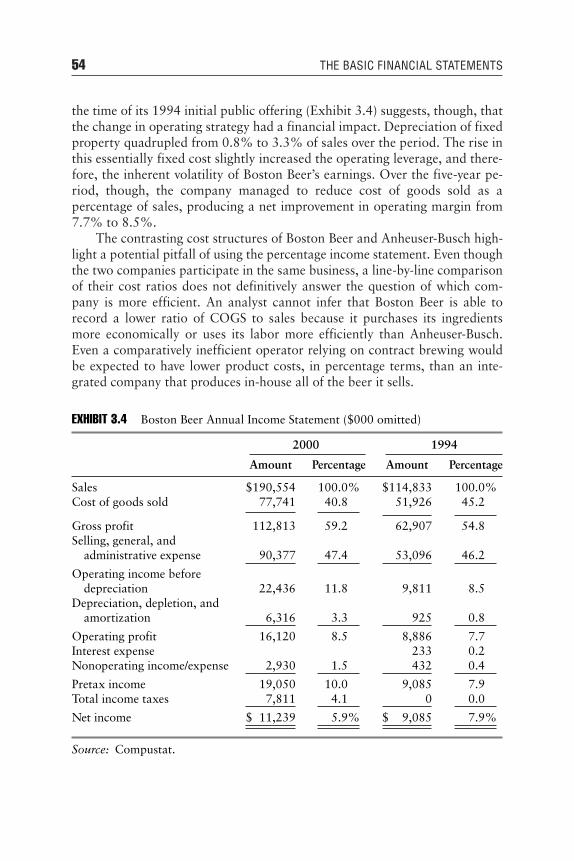
54 THE BASIC FINANCIAL STATEMENTS
the time of its 1994 initial public offering (Exhibit 3.4) suggests, though, thatthe change in operating strategy had a financial impact. Depreciation of fixedproperty quadrupled from 0.8% to 3.3% of sales over the period. The rise inthis essentially fixed cost slightly increased the operating leverage, and there-fore, the inherent volatility of Boston Beer’s earnings. Over the five-year pe-riod, though, the company managed to reduce cost of goods sold as apercentage of sales, producing a net improvement in operating margin from7.7% to 8.5%.
The contrasting cost structures of Boston Beer and Anheuser-Busch high-light a potential pitfall of using the percentage income statement. Even thoughthe two companies participate in the same business, a line-by-line comparisonof their cost ratios does not definitively answer the question of which com-pany is more efficient. An analyst cannot infer that Boston Beer is able torecord a lower ratio of COGS to sales because it purchases its ingredientsmore economically or uses its labor more efficiently than Anheuser-Busch.Even a comparatively inefficient operator relying on contract brewing wouldbe expected to have lower product costs, in percentage terms, than an inte-grated company that produces in-house all of the beer it sells.
EXHIBIT 3.4 Boston Beer Annual Income Statement ($000 omitted)
2000 1994
Amount Percentage Amount Percentage
Sales $190,554 100.0% $114,833 100.0%Cost of goods sold 77,741 40.8 51,926 45.2
Gross profit 112,813 59.2 62,907 54.8Selling, general, and
administrative expense 90,377 47.4 53,096 46.2
Operating income beforedepreciation 22,436 11.8 9,811 8.5
Depreciation, depletion, andamortization 6,316 3.3 925 0.8
Operating profit 16,120 8.5 8,886 7.7Interest expense 233 0.2Nonoperating income/expense 2,930 1.5 432 0.4
Pretax income 19,050 10.0 9,085 7.9Total income taxes 7,811 4.1 0 0.0
Net income $111,239 5.9% $119,085 7.9%
Source: Compustat.

The Income Statement 55
A similar problem arises with companies ostensibly competing in thesame industry, but producing substantially different product lines. For ex-ample, some pharmaceutical manufacturers also manufacture and marketmedical devices, nonprescription health products, toiletries, and beautyaids. The more widely diversified manufacturers can be expected to havehigher percentage product costs, as well as lower percentage research anddevelopment expenses, than industry peers that focus exclusively on pre-scription drugs. Analysts must take care not to mistake a difference that isactually a function of business strategy as evidence of inferior or superiormanagerial skills. A subtler explanation may be available at the modest costof contacting some long-established industry watchers. All the while, ana-lysts must watch for evidence that the reported numbers are somehow dis-torting the company’s true financial performance, the subject of the nextsection of this chapter.
HOW REAL ARE THE NUMBERS?
Many individuals are attracted to business careers not only by monetary re-wards but by the opportunity, lacking in many other professions, to be mea-sured against an objective standard. The personal desire to improve thebottom line, that is, a company’s net profit, challenges a businessperson inmuch the same way that an athlete is motivated by the quantifiable goal ofbreaking a world record. The income statement is the stopwatch againstwhich a company runs; net profit is the corporation’s record of wins andlosses for the season.
The analogy between business and athletics extends to the fact, whichis apparent to any close observer, that superior skills and teamwork alonedo not win championships. A baseball manager can intimidate the umpireby heatedly protesting a call on the basepaths, hoping thereby to have thenext close ruling go in his team’s favor. A corporation has the power to fireits auditor, and may use that power to influence accounting decisions thatare matters of judgment, rather than clear-cut reporting standards. A base-ball team’s front office can shorten the right-field fence in its home stadiumto favor a lineup stocked with left-handed power hitters; a corporation’smanagement can select the accounting method that shows its results in themost favorable light. Collectively, the team owners can urge the RulesCommittee to lower the pitching mound if they believe that a predictableincrease in base hits and runs will boost attendance. Similarly, a group ofcorporations can try to block the introduction of new accounting standardsthat might reduce their reported earnings.

56 THE BASIC FINANCIAL STATEMENTS
Attempts to transform the yardstick become most vigorous when themeasure of achievement becomes more important to participants than theaccuracy of the measure itself. Regrettably, this is often the case when cor-porations seek to motivate managers by linking their compensation to theattainment of specific financial goals. Executives whose bonuses rise in tan-dem with earnings per share have a strong incentive not only to generatebona fide earnings, but also to use every lawful means of inflating the fig-ures through accounting sleight of hand.
It would take many more pages than are allotted to this chapter to de-tail all the ways that companies can manipulate the accounting rules to in-flate their earnings. Instead, the following examples should convey to thereader the thought process involved in this rule bending. Equipped with anunderstanding of how the rule benders think, users of financial statementswill be able to detect other ruses they are sure to encounter.
Not Al l Sales Are Final
“Take care of the top line and the bottom line will take care of itself.” Sogoes a business bromide, which underscores the importance of revenues(the top line) to net income (the bottom line). The point is that if a companywants to cure an earnings problem, it should concentrate on bringing inmore sales.
Generally, this is sound advice, as long as the needed sales are broughtin by the salesforce. A company can compound its problems, however, if thefinancial staff makes up the shortfall in revenues through accounting gim-micks. Some revenue-inflating tricks are achievable within GAAP bound-aries, whereas others clearly fall outside the law. They all produce similar illeffects, however. Enhancements to reported sales boost reported earningswithout increasing cash flow commensurately.
Often, a company’s earnings and cash flow diverge to an extent that be-comes unsustainable. The eventual result is an abrupt adjustment to the fi-nancial statements of previous periods. In the process, earnings and cashflow come back into alignment, but management’s credibility plummets.Even when no such shock occurs, the practice of pumping up revenuesthrough discretionary accounting decisions represents a hazard for analysts.At a minimum, it reduces the comparability of a company’s financial state-ments from one period to the next.
The revenue recognition practices of International Business Machinescame in for criticism when competition heated up in the computer businessduring the late 1980s. Management responded by becoming more accom-modating in its marketing practices. The company stretched out payment

The Income Statement 57
periods, offered to make partial refunds if prices were subsequently re-duced, and allowed customers to try out equipment without making anyinitial payments. For additional variations on the theme of aggressive rev-enue recognition, see Chapter 6.
Addit ional Reasons to Be Skeptical about Revenues
Unfortunately for analysts, companies do not always spell out in the Notesto Financial Statements the means by which they have artificially inflatedtheir revenues. A company might lower the credit standards it applies toprospective customers without simultaneously raising the percentage of re-serves it establishes for losses on receivables. The result would be a rise inboth revenues and earnings, in the current period, with the correspondingincrease in credit losses not becoming apparent until a later period. Alter-natively, a manufacturer may institute short-term discounts that encourageits dealers or wholesalers to place orders earlier than they otherwise would.In this case, sales and earnings will be higher in the current quarter thanthey would be in the absence of the incentives, but the difference will repre-sent merely a shifting of revenues from a later to an earlier period. Analystswill face disappointment if they regard such inflated quarterly sales as in-dicative of the future.
Although the current-period income statement may offer no clues thatthese gambits have been used, several techniques can help the analyst detectartificial expansion of revenues. On a retrospective basis, a surge in creditlosses or an unexpected shortfall in revenues may indicate that revenueswere inflated in an earlier period with the techniques described in the pre-ceding paragraph. (Hindsight of this kind is not without value; an analystwho finds a historical pattern of hyperbolized sales will be appropriatelyskeptical about future income statements that look surprisingly strong.) Ona current basis, analysts should take notice if a company posts a substan-tially greater sales increase than its competitors. If discussions with the com-pany and other industry sources fail to elicit a satisfactory explanation (suchas the introduction of a successful new product), artificial methods may bethe root of the matter. Industry sources can also provide direct testimonyabout tactics being used to shift revenues from future periods to the present.
Making the Most of Depreciat ion and Amortizat ion
Along with provisions for credit losses, another major expense categorythat can be controlled through assumptions is depreciation. As a check

58 THE BASIC FINANCIAL STATEMENTS
against possible abuses, analysts should compare a company’s ratio of de-preciation to property, plant, and equipment with the ratios of its industrypeers. An unusually low ratio may indicate that management is being unre-alistic in acknowledging the pace of wear and tear on fixed assets. Under-statement of expenses and overstatement of earnings would result.
Knowing that astute analysts will compare their depreciation policieswith competitors’ practices, companies commonly represent accountingchanges in this area as efforts to get into line with industry norms. They donot ordinarily stress another plausible motive, a desire to pump up earn-ings. Verbs such as extend and liberalize are considered expendable in thepress releases disclosing revisions in depreciable lives.
Depreciation Assumptions—Fort Howard and Weirton Steel Fort Howard pro-duced a typical announcement of a change in depreciation assumptions inApril 1992:
During the first quarter of 1992, the company prospectively changed itsestimates of the depreciable lives of certain machinery and equipment.These changes were made to better reflect the estimated periods duringwhich such assets will remain in service. As a result, the lives overwhich the company depreciates the cost of its operating equipment andother capital assets will more closely approximate industry norms. Forthe three months ended March 31, 1992, the change had the effect of re-ducing depreciation expense by $9.9 million and reducing net loss by$6.1 million.
In the same month, Weirton Steel described a change in accounting fordepreciation even more tersely. The company did not alter the depreciablelives of the assets, but instead switched its accounting method:
Weirton reported a change in depreciation method (accounting princi-ple) effective January 1, 1992, for its steelmaking facilities from thestraight-line method to a production-variable method, which adjustsstraight-line depreciation to reflect production levels.
In explaining the change, the company did not emphasize a yearning forconformity with its fellow steelmakers. Nevertheless, Weirton was not thefirst in its group to abandon straight-line depreciation (already a less con-servative technique than the various accelerated methods), for the still moreliberal production-variable approach. During the first quarter of 1992,

The Income Statement 59
Weirton’s switch in depreciation accounting had the convenient effect of re-ducing its net loss by nearly half.
A method that “adjusts straight-line depreciation to reflect productionlevels” may sound innocuous. Analysts should keep in mind, however, thatthe adjustment is far more likely to be downward than upward. As demandfalls, the plant will incur more idle time and the company will record lessdepreciation expense. The same will be true if the facility turns unprofitableand temporarily shuts down, while lower-cost, more technologically ad-vanced facilities owned by competitors continue to operate. Under theseconditions, the book value of the plant will decline more slowly, even as ap-proaching obsolescence.
Extraordinary and Nonrecurring Items
To most individuals who examine a company’s income statement, the docu-ment is less important for what it tells about the past than for what it im-plies about future years.2 Last year’s earnings, for example, have no directimpact on a company’s stock price, which represents a discounting of a fu-ture stream of earnings (see Chapter 14). An equity investor is therefore in-terested in a company’s income statement from the preceding year primarilyas a basis for forecasting future earnings. Similarly, a company’s creditorsalready know whether they were paid the interest that came due in the pre-vious year before the income statement arrives. Their motivation for study-ing the document is to form an opinion about the likelihood of payment inthe current year and in years to come.
In addition to recognizing that readers of its income statement will viewthe document primarily as an indicator of the future, a company knows thatcreating more favorable expectations about the future can raise its stock priceand lower its borrowing cost. It is therefore in the company’s interest to per-suade readers that a major development that hurt earnings last year will notadversely affect earnings in future years. One way of achieving this is to sug-gest that any large loss suffered by the company was somehow outside thenormal course of business, anomalous and, by implication, unlikely to recur.
To create the desired impression that a loss was alien to the company’snormal pattern of behavior, the loss can be shown on a separate line on theincome statement and labeled an “extraordinary item.” Note that an ex-traordinary item is reported on an aftertax basis, below the line of income(or loss) from continuing operations. This presentation creates the strongestpossible impression that the loss was outside the ordinary course of busi-ness. It maximizes the probability that analysts of the income statement willgive it little weight in forecasting future performance.

60 THE BASIC FINANCIAL STATEMENTS
Because the effect created by a “below-the-line” treatment is so strong,the accounting rules carefully limit its use. To qualify as extraordinaryunder the relevant Accounting Principles Board opinion, events must be“distinguished by their unusual nature and by the infrequency of their oc-currence.”3 These criteria are not easily satisfied. According to the opinion,unusual nature means that “the underlying event or transaction should pos-sess a high degree of abnormality and be of a type clearly unrelated to, oronly incidentally related to, the ordinary and typical activities of the entity,taking into account the environment in which the entity operates.” Lest theextraordinary label be employed indiscriminately, the opinion prohibits itsuse for several types of events considered unusual in nature under the strictstandard being applied. Among these are:
� Write-offs of receivables and inventories.
� Gains or losses on foreign currency translation (even when they resultfrom major devaluations or revaluations).
� Gains or losses on disposal of a segment of a business or the sale orabandonment of property, plant, or equipment.
Not even the September 11, 2001, terrorist attacks on the Pentagonand World Trade Center qualified as an extraordinary event under FASB’sstringent criteria. After tentatively deciding that companies could breakout costs arising from the disaster as below-the-line items, the task forceon the subject voted not to allow the practice. The chairman of the taskforce, FASB research director Timothy S. Lucas, noted that even the air-lines, which were plainly hurt by the events, would have difficulty separat-ing the impact of the attacks from other revenue and earnings pressuresduring the period.4
Considering the exacting tests that an item must meet to be consideredextraordinary, analysts may consider themselves on solid ground if theylargely disregard any such item in forecasting future earnings. The APBopinion, after all, adds that “infrequency of occurrence” means that theevent or transaction in question must be “of a type not reasonably expectedto recur in the foreseeable future.” Occasionally, one would suppose, anevent meeting this strict standard might be followed just a few years later byan event at the same company, radically different in nature but also qualify-ing for classification as extraordinary and below-the-line reporting. Oneven rarer occasions, an extraordinary event might be followed the verynext year by a qualifying event of a similar nature, even though such a re-currence was “not reasonably expected,” to quote the accounting standard.Judging by the highly restrictive language of the APB opinion, however, it

The Income Statement 61
would be extremely surprising if any company ever booked an extraordi-nary item more than twice in a matter of several years.
Improbable though it might seem, however, a search of Standard &Poor’s Compustat database identified 42 companies that recorded extraor-dinary gains or losses in at least four of the eight years ended 1998. Amongthe companies that repeatedly experienced events of an allegedly infrequentand unusual nature were such blue chips as Bell Atlantic, Fannie Mae, GTE,Maytag, Ralston Purina, Sears Roebuck, Sunoco, Time Warner, and U.S.West. BellSouth recorded seven extraordinary items during the period. Sixwere losses, including whacks of $1.6 billion in 1991 and $2.2 billion in1994. In light of actual experience, analysts cannot simply project a com-pany’s future earnings as though an extraordinary event had never occurred,however fervently management might wish them to do precisely that.
Actually, companies lean on analysts to be even more accommodatingwhen they evaluate past results to forecast future performance. Corporateofficials not only encourage users of their financial statements to disregardlosses that qualify for the label extraordinary, but also ask them to ignorecertain hits to earnings simply because management pronounces them aber-rant. To steer analysts toward the true (that is, higher trajectory) trend ofearnings deemed official by management fiat, companies break out the sup-posed aberrations from their other operating earnings. The accounting rulesprohibit them from displaying such carve-outs “above the line” (that is, ona pretax basis) and from using the label extraordinary. Accordingly theyemploy designations such as “nonrecurring” or “unusual.” These termshave no official standing under GAAP, but they foster the impression thatthe highlighted items are exceptional in nature. Sometimes, losses that failto meet the criteria of extraordinary items appear under the more neutralheading, “special charges.” Even this terminology, however, leaves the im-pression that the company has put the problem behind itself. The seman-tics are so appealing to corporate managers that each year, more than aquarter of all companies filing with the Securities and Exchange Commis-sion take a nonrecurring charge. As recently as 1970, only one percent ofcompanies did so.5
In recent years, “restructuring” has become a catchall for charges thatcompanies wish analysts to consider outside the normal course of business,but which do not qualify for below-the-line treatment. The term has a pos-itive connotation, implying that the corporation has cast off its money-losingoperations and positioned itself for significantly improved profitability. Ifabused, the segregation of restructuring charges can create too rosy a pic-ture of past performance. It can entrap the unwary analyst by downplay-ing the significance of failed business initiatives, which have a bearing on

62 THE BASIC FINANCIAL STATEMENTS
management’s judgment. Additionally, the losses associated with a restruc-turing may be blamed on the company’s previous chief executive officer,provided they are booked early in the successor CEO’s tenure. Within ayear’s time, the new kingpin may be able to take credit for a turnaround,based on an improvement in earnings relative to a large loss that can beconveniently attributed to the predecessor regime.
Even more insidiously, companies sometimes write off larger sums thanwarranted by their actual economic losses on a failed business. Corporatemanagers commonly perceive that the damage to their stock price will beno greater if they take (for sake of argument) a $1.5 billion write-off than ifthey write off $1.0 billion. The benefit of exaggerating the damage is that insubsequent years, the overcharges can be reversed in small amounts that donot generate any requirement for specific disclosure. Management can usethese gains to supplement and smooth the corporation’s bona fide operatingearnings.
The most dangerous trap that users of financial statements must avoid,however, is inferring that the term restructuring connotes finality. Some cor-porations have a bad habit of remaking themselves year after year. For suchcompanies, the analyst’s baseline for forecasting future profitability shouldbe earnings after, rather than before, restructuring charges.
Procter & Gamble is a case in point. As of April 2001, the consumergoods company had booked restructuring charges in seven consecutivequarters, aggregating to $1.3 billion. Moreover, management indicated thatit planned to continue taking these ostensibly nonrecurring charges untilmid-2004, ultimately charging off approximately $4 billion.
P&G defended its reporting by saying that Securities and ExchangeCommission accounting rules precluded it from taking one huge charge atthe outset of the restructuring program launched in June 1999. Instead, thecompany was required to record the charges in the periods in which it actu-ally incurred them. Granting the point, the SEC did not compel Procter &Gamble to segregate the costs of closing factories and laying off workersfrom its other operating expenses. Indeed, the arguments were stronger fortreating the chargeoffs as normal costs of operating in P&G’s highly com-petitive consumer goods business, where countless products fail or becomeobsolete over time.
Abstract issues of accounting theory, however, had little impact on bro-kerage house securities analysts’ treatment of P&G’s earnings record. All14 analysts who followed the company and submitted earnings per shareforecasts to Thomson Financial/First Call excluded the restructuring chargesfrom their calculations. P&G management was bound to like Wall Street’sinterpretation of the numbers. Including all of the ostensibly unusual gains

The Income Statement 63
and losses, operating income declined in all four quarters of 2000. Leavingout all the items deemed aberrant by management, net income rose in allquarters but the first. The latter interpretation surely gave investors a moreoptimistic view of P&G’s prospects than the sourpuss GAAP numbers.6
Naturally, companies encourage analysts to include special items intheir earnings calculations when they happen to be gains, rather thanlosses. They evidently reason that turnabout is fair play and judging by theresults, many securities analysts apparently agree. The 14 Wall Street ana-lysts mentioned earlier unanimously chose to include in their “core netearnings” figures the gains that Procter & Gamble classified as nonrecur-ring or extraordinary, even as they excluded the extraordinary and nonre-curring losses.
By characterizing the extraordinary as standard, Coca-Cola has steeredanalysts toward a net income surrogate that suggests steadier year-over-yearincreases than its business can deliver in reality. In particular, managementhas encouraged investors to treat gains on sales of interests in bottlers aspart of its normal stream of earnings. These inherently temporary boosts toprofits “are an integral part of the soft drink business,” according to thecompany.7
The difference in perceptions is by no means negligible. Beverage ana-lyst Marc Cohen of Goldman Sachs has estimated that excluding non-operating items, Coca-Cola’s earnings increased by 11% in 1996. Thatwould have been a highly respectable number for most long-establishedcompanies, but it was well below the 18% to 20% annual advance thatmanagement was promising investors. Including nonrecurring and ex-traordinary items earnings per share, as management preferred to presentthe numbers, EPS rose by 19%.
Coca-Cola’s 1996 dependence on out-of-the-ordinary-course-of-eventsitems was not an isolated event. In the first quarter of 1997, Coca-Colamaintained its targeted upper-teens growth rate, at least by its own reckon-ing, when $0.08 of total EPS of $0.40 represented a gain on the sale ofCoca-Cola & Schweppes Bottlers. Oppenheimer analyst Roy Burry went sofar as to say that with so many such discretionary items at its disposal,Coca-Cola’s management had absolute control over the earnings it wouldreport through the end of 1998, despite the vagaries of weather and com-petitors’ initiatives.
Notwithstanding the creative methods employed by Procter & Gambleand Coca-Cola, the award for ingenuity rewriting history with the help ofspecial items should probably go to Brooke Group. In 1990, the diversifiedcompany booked a special gain of $433 million. The gain arose from a re-versal of a previously recognized loss generated by Brooke’s 50.1% interest

64 THE BASIC FINANCIAL STATEMENTS
in New Valley Corporation (formerly Western Union). By reducing its vot-ing interest in New Valley to less than a majority, Brooke contrived to de-consolidate the company and erase the red ink retroactively.
Redefining Pro Forma Earnings
As highlighted by the P&G and Coca-Cola examples, companies encourageinvestors to focus on favorably constructed profit measures. The term corenet earnings has enjoyed a vogue in recent years. Like above-the-line nonre-curring events, such numbers have no official status under GAAP. Com-panies’ press releases, however, are not subject to GAAP. As time has goneon, corporations have devoted increasing energy to diverting analysts’ at-tention to unofficial numbers that present their results in a better light thanFASB-mandated net income. Companies helpfully package their preferredversions of earnings so that analysts can save themselves the trouble of tear-ing the numbers apart on their own and potentially obtaining more reveal-ing data.
In the boldest innovation in this area, corporate managers have shang-haied the venerable term pro forma. Traditionally, the Latin phrase wasused in the realm of financial statements exclusively in reference to illustra-tions of the impact of major discontinuities. The technique came into playwhen a company announced an acquisition, divestment, or change in ac-counting policy. Management displayed the company’s recent results, alongwith a pro forma statement incorporating its estimate of what the numberswould have looked like if the discontinuity had occurred prior to the begin-ning of the period. The purpose of providing pro forma results was to helpanalysts to project future financial results accurately when some event out-side the ordinary course of business caused the unadjusted historical resultsto convey a misleading impression.
By contrast, many companies now routinely issue press releases high-lighting so-called pro forma quarterly earnings. The adjustments to GAAPearnings are not prompted by significant discontinuities. Instead, the com-panies add back standard expenses that they incur every quarter. This is adramatic departure from traditional practice, but it does not violate any lawor regulation. The right to report non-GAAP-conforming figures in anearnings release is protected by the constitutional guarantee of freedom ofthe press. According to a Securities and Exchange Commission spokesper-son, regulators rarely object to a nonstandardized format employed in apress release unless it appears to be intentionally misleading or fraudulent.As an example of its rare intervention in such matters, the SEC fined SonyCorporation $1 million in 1998 for playing up the box office success of

The Income Statement 65
certain of its recent film releases “without tempering those statements withany specific disclosures of the losses sustained by Sony Pictures.”8
Companies have become quite aggressive in encouraging analysts tojudge their performance by the new-style pro forma figures. Their zeal isunderstandable, considering that the alternative numbers may create an im-pression of substantially higher profits than the GAAP earnings. As an ex-ample of how wide the disparity can be, online merchant Amazon.comreported an actual net loss of $317 million in 2000’s second quarter, but itsearnings release for the period headlined positive operating profit on salesof books and records. After deducting GAAP-mandated expenses such asamortization of goodwill and other intangibles, the cost of stock options,and costs associated with investments, mergers, and acquisitions, the com-pany declared its pro forma EPS to be −$0.33. That was far closer to thepositive-earnings zone that management was under pressure to reach thanthe GAAP figure of −$0.91.
Amazon.com was by no means alone in publishing an earnings releasefeaturing the new-fashioned pro forma figures. Other companies followingthe same practice included Cisco Systems, Disney Internet Group, andYahoo! Publication of pro forma earnings was so widespread, in fact, thatPatrick E. Hopkins, assistant professor of accounting of Indiana University’sKelley School of Business, likened it to “creation of a de facto GAAP.”9
Amazon.com went a step further than many other companies, however, bypublishing its pro forma earnings in its SEC financial filings, as well as itspress releases. That envelope-pushing action required a disclaimer in whichthe company explained that the pro forma results did not conform to GAAPand were provided solely for informational purposes.
Quarterly pro forma earnings would present fewer stumbling blocks toanalysts if all companies were obliged to calculate them according to a stan-dard accounting method, as is the case with GAAP earnings. When it comesto computing pro forma earnings, though, corporations make their ownrules. Consequently, they eliminate the company-to-company comparabilitythat accounting standards are designed to achieve. To cite an example, in itsfiscal year ending July 31, 2000, Cisco added back $51 million of payrolltaxes on exercises of employee stock options in calculating its pro formaearnings per share. Disney Internet Group, on the other hand, made no sim-ilar adjustment to its GAAP earnings.
In another innovation of the late 1990s, many Internet companies didEBITDA (earnings before interest, taxes, depreciation, and amortization)one better by adding back marketing expenses to their GAAP income. Theresult was a pro forma earnings variant called EBITDAM. Such liberties bydot-com companies led short-seller Michael Murphy to coin the acronym

66 THE BASIC FINANCIAL STATEMENTS
“IAAP” (for “Inter-nut Accepted Accounting Principles”).10 Computer soft-ware producers got into the act by omitting amortization of purchased re-search and development from the expenses considered in calculating proforma earnings. Using that technique and other adjustments, Veritas Soft-ware turned a GAAP loss of $103.1 million in the second quarter of 1999into a pro forma profit of $29.2 million. The Software and Information In-dustry Association added an air of legitimacy to the process when, in Janu-ary 1999, the trade organization issued guidelines for beefing up pro formaresults by adding back amortization of software patents and other intangi-bles.11 Quest Communications International fused several different adjust-ments in its earnings release for the third quarter of 2001 by reporting itspro forma normalized recurring earnings before interest, taxes, deprecia-tion, and amortization. Newsletter author Carol Levenson facetiouslydubbed the new profit measure PENREBITDA.12
Gabelli Asset Management’s earnings release for the three months end-ing March 31, 1999, its first quarter after the mutual fund company wentpublic, informed investors that pro forma earnings for the period were $9.3million. The figure excluded a $30.9 million (aftertax) charge to cover a $50million lump-sum payment that chairman and chief executive officer MarioGabelli was scheduled to receive in 2002. Again, there was no suggestion ofa securities law violation. Indeed, for analysts attempting to project GabelliAsset Management’s future earnings, there was a clear need to be able toseparate the $30.9 million charge from the rest of the results. Entirely omit-ting the word “loss” from the company’s eight-page press release strucksome analysts as aggressive, however. “The right way to do it,” said portfo-lio manager James K. Schmidt of John Hancock Financial Industries Fund,“would have been to show the loss but give me the information I need tofigure out the operating results.”13
The divergences in methodology that inevitably accompany departuresfrom GAAP have affected the reporting of aggregate corporate profits, aswell as individual companies’ results. Both Standard & Poor’s and Thom-son Financial/First Call compute “operating earnings” for the S&P 500index of major stocks. Unlike operating income, a concept addressed byFASB standards, operating earnings is a number that subjectively excludesmany above-the-line one-time events that lack any standing under GAAP.S&P takes a comparatively tough line in deciding whether to exclude lossesthat companies characterize as nonrecurring. First Call, on the other hand,tends to follow the comparatively liberal standards of Wall Street securitiesanalysts. Loews Corporation’s performance in the second quarter of 2001provided a dramatic demonstration of the potential for wide disparities atthe individual company level. By First Call’s calculation, the diversified

The Income Statement 67
company posted operating earnings per share of $1.14. S&P, which wasmore inclined to regard management-designated “special items” as costsoccurred in the ordinary course of business, put the figure at a loss of $7.18a share. Naturally, First Call and S&P do not disagree so sharply in everyinstance. Taking into account all 500 companies in the index, however, FirstCall calculated that operating earnings fell by 17%, year-over-year, in2001’s first quarter, whereas S&P put the decline at 33%.14
Divergent computational methods also produced a gap in gauging howattractively the stock market was priced. According to First Call’s numbers,the S&P 500 was valued at 22.2 times trailing-12-months operating earn-ings in August 2001. Using S&P’s figures, the market index’s valuation wasmaterially richer 24.2 times. By the way, both calculations of the market’smultiple were far below the figure derived by using GAAP net income as thebasis for measurement. Excluding only below-the-line items (those that metthe comparatively strict test to qualify as extraordinary items), the S&P’smultiple was a record-high 36.8 times. The gaping difference between thatfigure and ratios based on the more loosely defined operating earningsgraphically explain why companies prefer investors to base their valuationjudgments on the latter. Stocks look cheaper when their multiples aregeared to management-generated pro forma earnings that lie outside the ju-risdiction of FASB’s rules.
Notwithstanding the many problems that can arise from abusing thepractice, making adjustments to reported earnings is neither wrongheadednor inherently misleading. In fact, analysts who hope to forecast future fi-nancial results accurately must apply common sense and set aside genuinelyout-of-the-ordinary-course-of-business events. The need for analysts to in-ject their own judgment applies, whether GAAP requires a particular itemto be reported above or below the line. Even FASB officials acknowledge, atleast unofficially, that it can be useful to consider earnings stripped of non-recurring events. Getting carried away with adjustments can produce falsejudgments about companies’ earnings potential, however. “The statementof income presented according to GAAP,” FASB Chairman Edmund L.Jenkins contends, “is still the best predictor of future cash flows.”15
On a bright note, one of the largest and therefore most contentious ex-penses typically added back in pro forma earnings calculations has beeneliminated with the abolition of pooling-of-interests accounting for mergersin 2001 (see Chapter 10). As a quid pro quo for making purchase account-ing mandatory, FASB ended the requirement to amortize goodwill. (Com-panies remained obligated to write down this intangible asset to the extentthat it became impaired.) For many companies, FASB’s change in the ac-counting rules for mergers substantially narrowed the gap between reported

68 THE BASIC FINANCIAL STATEMENTS
earnings and pro forma figures. Perhaps in a calmer environment, com-panies will not press analysts as strenuously as in recent years to conform totheir highly customized versions of earnings. Analysts may then find it eas-ier to rely on their common sense in adjusting reported earnings to obtainmaximum analytical insight.
Go to the Source
Although analysts must exercise judgment when considering pro formaearnings, there is one rule they should follow without fail. They must makesure to examine the actual SEC filings, instead of trying to save time by re-lying solely on company communications. The consequences of failing tocheck the filings are illustrated by an incident involving telecommunicationsservices provider I.D.T.
On October 14, 1999, I.D.T. issued a press release highlighting recordrevenues in its fiscal fourth quarter and year ended July 31. For the thirdquarter, according to the press release, earnings per share were $0.15. OnNovember 4, I.D.T. filed its SEC annual report on Form 10-K. The filingshowed higher expenses in several categories than the press release had in-dicated, resulting in a per share loss of $0.18. TheStreet.com reported thediscrepancy between the press release and the 10-K, but investors did notseem to care. I.D.T.’s stock barely budged in response to the SEC filing,whereas the shares had jumped by 3.6% in response to the press releasethat subsequently proved inaccurate.
According to the company, the mistake was unintentional. I.D.T.spokesperson Norman Rosenberg explained that figures supplied by a sub-sidiary, Net2Phone, contained an error that was not discovered until afterpublication of the press release. Surely, then, the company must have putout a corrected press release for the benefit of investors who relied on thatdocument instead of verifying the results in an SEC document releasedthree weeks later? No, management took the position that becauseNet2Phone did not issue a corrected press release, I.D.T. could not do so.I.D.T., however, had voting control of the subsidiary. Therefore, New YorkTimes reporter Gretchen Morgenson asked Rosenberg, could I.D.T. nothave required Net2Phone to publish a corrected release? “Technically, wecould have done it,” the company spokesperson conceded. “Nobody herefelt like forcing them to do it.”16
The net result was that I.D.T.’s stock rose when the company releasedthe incorrect numbers, but did not react significantly to the disclosure of thecorrect numbers. In all likelihood, few investors bothered to examine the10-K. If analysts skip that essential step, they run the risk of basing theirvaluations on similar mistaken numbers. Recognizing the dissimilar stock

The Income Statement 69
market reactions to the correct and incorrect numbers in I.D.T.’s case, dis-honest managers might even publish intentionally overstated numbers intheir press releases, rectifying the “error” in their subsequent SEC filings.
Capital iz ing into Insignif icance
A final point worth remembering about pro forma alternatives to GAAPearnings is that even if analysts remove the items that management hasadded back, they may still derive an unrealistically high impression of acompany’s future earnings capacity. An older, but not obsolete, device forbeefing up reported income is capitalization of selected expenditures. Thepractice has a legitimate basis in the accounting objective of matching rev-enues and expenses by period. A current-year outlay that will generate rev-enues in future years should not be expensed immediately and in full.Rather, a portion should be written off each year as the value created by theoutlay diminishes. As with many other basically sound accounting prac-tices, however, problems arise in the execution.
The rule makers, to be sure, have tried to prevent obvious abuses. Theyhave barred altogether the capitalization of certain outlays that have un-doubted future-year benefits, including advertising and research and devel-opment. Despite such pronouncements, however, a fair amount ofdiscretion remains for the issuers of financial statements. Even the most re-spectable companies use this latitude to their advantage at times. Firms ex-ploit it to inflate their earnings artificially for as long as possible.Eventually, however, those earnings are offset by huge write-offs of previ-ously capitalized, but in fact worthless, assets.
To avoid being surprised by such nasty events, analysts should be waryof companies that report lower ratios of depreciation to property, plant, andequipment (PP&E) than their industry peers. The implication is that thecompany is recognizing the wear and tear on its assets more slowly than thenorm. A comparatively high ratio of PP&E to sales or cost of goods sold isanother sign of potential trouble.
Transforming Stock Market Proceeds into Revenues
At the same time that corporate managers have been supplementing theirtraditional tactics with new adjustments to earnings, they have also concen-trated in recent years on applying their ingenuity to revenues. This focusmakes eminent sense for corporations that want to present the best possi-ble, if not necessarily most accurate, profile to investors. If a companyachieves its revenue objectives, its battle for profitability is more than half

70 THE BASIC FINANCIAL STATEMENTS
won. To be sure, success also depends on controlling expenses. Without arobust top line, however, the company cannot economize its way to a re-spectable bottom line.
Garnering sales is not only a vital task, but a tough job as well. Com-petitors are forever striving to snatch away revenues by introducing superiorproducts or devising means of lowering prices to customers. From thestandpoint of maximizing value to consumers and promoting economic ef-ficiency, management’s optimal response to this challenge is to upgrade itsown products and generate cost savings that it can pass along to customers.Stepping up expenditures on advertising or expanding the sales force canalso lead to increased revenues. Along with effective execution of productdesign or marketing plans, however, another option exists. Managementcan boost sales through techniques that more properly fall into the categoryof corporate finance.
Increasing the rate of revenue increases through mergers and acquisi-tions is the most common example. A corporation can easily accelerate itssales growth by buying other companies and adding their sales to its own.Creating genuine value for shareholders through acquisitions is more diffi-cult, although unwary investors sometimes fail to recognize the distinction.
In the fictitious example in Exhibit 3.5, Big Time Corp.’s sales increaseby 5% between Year 1 and Year 2. Small Change, a smaller, privatelyowned company in the same industry, also achieves 5% year-over-year salesgrowth. Suppose now that at the end of Year 1, Big Time acquires SmallChange with shares of its own stock. The Big Time income statementsunder this assumption (“Acquisition Scenario”) show a 10% sales increasebetween Year 1 and Year 2. (Note that Year 1 is shown as originally re-ported, with Small Change still an independent company, while in Year 2,the results of the acquired company, Small Change, are consolidated intothe parent’s financial reporting. Analysts might also examine a pro formaincome statement showing the levels of sales, expenses, and earnings thatBig Time would have achieved in Year 1, if the acquisition had occurred atthe beginning of that year.)
On the face of it, a company growing at 10% a year is sexier than onegrowing at only 5% a year. Observe, however, that Big Time’s profitability,measured by net income as a percentage of sales, does not improve as a re-sult of the acquisition. Combining two companies with equivalent profitmargins of 3% produces a larger company that also earns 3% on sales.Shareholders do not gain anything in the process, as the supplementary fig-ures in Exhibit 3.5 demonstrate.
If Big Time decides not to acquire Small Change, its number of sharesoutstanding remains at 75.0 million. The earnings increase from $150.0million in Year 1 to $157.5 million in Year 2 raises earnings-per-share from

The Income Statement 71
$2.00 to $2.10. With the price-earnings multiple constant at 14 times,equivalent to the average of the company’s industry peers, Big Time’s stockprice rises from $28.00 to $29.40 a share.
In the Acquisition Scenario, on the other hand, Big Time pays its in-dustry-average earnings multiple of 14 times for Small Change, for a totalacquisition price of $7.1 million × 14 = $99.4 million. At Big Time’s Year 1share price of $28.00, the purchase therefore requires the issuance of
EXHIBIT 3.5 Sales Growth Acceleration without Profitability Improvement BigTime Corporation and Small Change, Inc.—Illustration ($000 omitted)
Nonacquisition AcquisitionScenario Scenario
Big Time Small Big TimeCorporation Change Inc. Corporation
Year 1 Year 2 Year 1 Year 2 Year 1 Year 2
Sales $5,000.0 $5,250.0 $238.1 $250.0 $5,000.0 $5,500.1Costs and expenses
Cost of goods sold 3,422.7 3,591.4 160.6 171.1 3,422.7 3,762.5Selling, general, and
administrative expense 1,250.0 1,315.0 61.9 62.5 1,250.0 1,377.5
Interest expense 100.0 105.0 4.8 5.0 100.0 110.0
Total costs and expenses 4,772.7 5,011.4 227.3 238.6 4,772.7 5,250.0
Income before income taxes 227.3 238.6 10.8 11.4 227.3 250.0
Income taxes 77.3 81.1 3.7 3.9 77.3 85.0
Net income $ 150.0 $ 157.5 $ 7.1 $ 7.5 $ 150.0 $ 165.0
Year-over-yearsales increase — 5% — 5% — 10%
Net income as apercentage of sales 3% 3% 3% 3% 3% 3%
Shares outstanding(million) 75 75 75 78.6
Earnings per share $2.00 $2.10 $2.00 $2.10Price-earnings
multiple (times) 14 14 14 14Price per share $28.00 $29.40 $28.00 $29.40

72 THE BASIC FINANCIAL STATEMENTS
$99.4 million ÷ $28.00 = 3.6 million shares. With the addition of SmallChange’s net income, Big Time earns $165.0 million in Year 2. Dividingthat figure by the increased number of shares outstanding (78.6 million)produces earnings per share of $2.10. At a price-earnings multiple of 14times, Big Time is worth $29.40 a share, precisely the price calculated in theNonacquisition Scenario. The mere increase in annual sales growth from5% to 10% has not benefited shareholders, whose shares increase in valueby 5% whether Big Time acquires Small Change or not.
Analysts should note that this analysis is sensitive to the assumptionsunderlying the scenarios. Suppose, for instance, that Big Time finances theacquisition of Small Change with borrowed money, instead of issuing stock.Let us suppose that Big Time must pay interest at a rate of 8% on the $99.4million of new borrowings. Interest expense in Year 2 of the AcquisitionScenario is now $118.0 million, rather than $100.0 million. Pretax incometherefore falls from $250.0 million to $242.0 million, reducing net incomefrom $165.0 million to $159.7 million at the company’s effective tax rate of34%. Only 75.0 million shares are outstanding at the conclusion of thetransaction, however, rather than the 78.6 million observed in the acquisition-for-stock case. As a result, Big Time’s earnings per share rise to $159.7million ÷ 75.0 million = $2.13.
Assuming the market continues to assign a multiple of 14 times to BigTime’s earnings, the stock is now worth $29.82, a bit more than in theNonacquisition Scenario. In practice, the investors may reduce Big Time’sprice-earnings multiple slightly to reflect the heightened risk represented byits decreased interest coverage. (Following the formulas laid out in Chapter13, income before interest and taxes declines from $360.0 million ÷ $110.0million = 3.3 times in the stock-acquisition case to $360.0 million ÷ $118.0million = 3.1 times in the debt-financed-acquisition case.) If the price-earnings multiple falls only from 14 to 13.8 times as a result of this declinein debt protection, Big Time’s stock price in this variant again comes to$29.40, equivalent to the Year 2 price in the Nonacquisition Scenario. As inthe case of Big Time paying with stock for the acquisition of Small Change,shareholders do not benefit if Big Time instead borrows the requisite funds,assuming investors are sensitive to the impact of the company’s increaseddebt load on its credit quality.
Internal versus External Growth
More important than the fine-tuning of the calculations is the principle thata company cannot truly increase shareholders’ wealth by accelerating itsrevenue growth without also improving profitability. This does not dissuade

The Income Statement 73
companies from attempting to mesmerize analysts with high rates of salesgrowth generated by grafting other companies’ sales onto their ownthrough acquisitions. Analysts may fall for the trick by failing to distinguishbetween internal growth and external growth.
Internal growth consists of sales increases generated from a company’sexisting operations, while the latter represents incremental sales brought inthrough acquisitions. An internal growth rate greater than the averagerecorded for the industry implies that the company is gaining market sharefrom its competitors. As a precaution, the analyst must probe further to de-termine whether management has merely increased unit sales by acceptinglower gross margins. If that is not the case, however, the company may infact be improving its competitive position and, ultimately, increasing itsvalue. On the other hand, if Company A generates external growth by ac-quiring Company B and neither Company A nor its new subsidiary in-creases its profitability, then the intrinsic value of the merged companies isno greater than the sum of the two companies’ values.
External growth can increase shareholders’ wealth, however, if themergers and acquisitions lead to improvements in profitability. This effect iscommonly referred to as synergy. It is a term much abused by companiesthat promise to achieve operating efficiencies, without offering many spe-cific examples, through acquisitions that appear to offer few such opportu-nities. Nevertheless, even analysts who have grown cynical after years ofseeing purported synergies remain unrealized will acknowledge the exis-tence of several bona fide means of raising a company’s profit marginsthrough external growth.
For one thing, a company may be able to reduce its cost per unit by in-creasing the size of its purchases. Suppliers commonly offer volume dis-counts to their large customers, which they can service more efficiently thancustomers who order in small quantities. If the cost of materials, fuel, andtransportation required to produce each widget goes down while the sellingprice of widgets remains unchanged in a stable competitive environment,the company’s gross margin increases.
Another way to increase profitability through external growth involveseconomies of scope. In a simple illustration, a manufacturer of potato chipshas a sales force calling on retail stores. Much of the associated expense rep-resents the time and transportation costs incurred as the salespeople travelfrom store to store, as well as the salespeople’s health insurance and otherbenefits. Now suppose that the potato chip manufacturer acquires a pretzelmanufacturer. For the sake of explication, assume that the pretzel companyformerly relied on food brokers, rather than an in-house sales force. The ac-quiring company terminates the contracts with the brokers and adds pretzels

74 THE BASIC FINANCIAL STATEMENTS
to its potato chip sales force’s product line. Revenues and gross profits persales call rise with the addition of the pretzel line. The number of sales callsper salesperson remains essentially constant, because taking orders for theadditional product consumes little time. Accordingly, time and transporta-tion costs per sales call do not rise materially, while the cost of health insur-ance and other benefits does not rise at all. Adding it all up, the profitabilityof selling both potato chips and pretzels through the same distribution chan-nel is greater than the profitability of selling one snack food only.
Analysts should be forewarned that claims of potential economies ofscope often prove, in retrospect, to be exaggerated. Over a period of severaldecades, for example, banks, brokerage houses, and insurance companieshave frequently proclaimed the advent of the “financial supermarket,” inwhich a single distribution channel will efficiently deliver all classes of finan-cial services to consumers. A fair amount of integration between these busi-nesses has certainly occurred, but cultural barriers between the businesseshave turned out to be more formidable than corporate planners have fore-seen. Considerable training is required to teach salespeople how to shift gearsbetween the fast-paced business of dealing in stocks and the more painstak-ing process of selling insurance policies. In general, the less closely related thecombining businesses are, the less certain it is that the hoped-for economiesof scope will be realized. When disparate companies combine in pursuit ofnovel synergies, analysts should treat with extreme caution the margin in-creases shown in pro forma income statements produced by management.
Capturing Economies of Scale
Finally, and perhaps most famously, mergers can genuinely increase prof-itability and shareholder wealth through economies of scale. As illustratedin Exhibit 3.6, Central Widget is currently utilizing only 83.3% of its pro-ductive capacity. At the present production level, the company’s fixed costsamount to $300 million ÷ 250 million = $1.20 per unit, or 12% of eachsales dollar. These irreducible costs represent a major constraint on thecompany’s net profit margin, just 2.0%, and in turn its return on equity (seeChapter 13), which is an unexciting 11.1%.
Central Widget spies an opportunity in the form of its smaller competi-tor, Excelsior Widget. Because the two companies operate in the same geo-graphic region, it would be feasible to consolidate production in CentralWidget’s underutilized factories. Management proposes a merger premisedon achieving economies of scale.
Excelsior’s cost structure is similar to Central’s, except that its generaland administrative expense is higher as percentage of sales (6.7% versus

The Income Statement 75
EXHIBIT 3.6 Economies of Scale (Illustration)
Selected Production and Financial Statement Data
Central WidgetCentral Widget Excelsior Widget (Pro Forma)
Units of capacity (million) 300 36 300Unit sales 250 30 280Capacity utilization 83.3% 83.3% 93.3%
Unit sales (million) 250 30 280Price per unit $ 10.00 $ 10.00 $ 10.00Variable costs per unit
Labor $ 4.75 $ 4.75 $ 4.75Materials 3.00 3.00 3.00Variable sales costs 0.75 0.75 0.75
Total $ 8.50 $ 8.50 $ 8.50
Total fixed costs ($million)Depreciation $200.00 $ 24.00 $200.00*Interest expense 25.00 3.00 28.00General and administrative 75.00 20.00 85.00†
Total $300.00 $ 47.00 $313.00
($000,000 omitted)Sales $2,500.00 $300.00 $2,800.00Variable costs 2,125.00 255.00 2,380.00Fixed costs 300.00 47.00 313.00
Income before income taxes 75.00 2.00 107.00Income tax 25.00 0.70 35.30
Net income $50.00 $1.30 $ 71.70
Net income as a percentage of sales 2.0% 0.4% 2.6%
Shares outstanding (million) 20 3 22.2††
Earnings per share $ 2.50 $ 0.43 $ 3.33Price-earnings multiple (times) 13 N.M. 13
Price per share $32.50 $18.00 $43.29
*Assumes closure of Excelsior Widget factory.†Assumes elimination of 50% of Excelsior Widget’s general and administrative
expense through closure of company headquarters.††Assumes acquisition price of $23.40 per Excelsior Widget share.

76 THE BASIC FINANCIAL STATEMENTS
3.0%). The problem is that certain costs (such as the upkeep on a head-quarters building and salaries of senior executives) are nearly as great forExcelsior as for Central, but Excelsior has a smaller base of sales over whichto spread them. As a result, Excelsior is running at a loss at current operat-ing levels. Its board of directors therefore accepts the acquisition offer. Cen-tral pays $23.40 worth of its own stock (0.72 shares) for each share ofExcelsior, a 30% premium to Excelsior’s prevailing market price.
Unlike the acquisition of Small Change by Big Time depicted in Exhibit3.5, this transaction not only increases the acquiring company’s sales, butalso improves its profitability. Following the acquisition, on a pro formabasis, Central Widget’s fixed cost per unit is $313.0 million ÷ 280 million =$1.12, down from $1.20. The net margin is up from 2.0% to 2.6%, whileearnings per share have jumped from $2.50 to $3.33, pro forma. If the mar-ket continues to assign a multiple of 13 times to Central’s earnings, thestock should theoretically trade at $43.29, up from $32.50 before the trans-action. Realistically, that increase probably overstates the actual rise thatCentral Widget shareholders can expect. Aside from severance costs notshown in the pro forma income statement, investors may reduce the price-earnings multiple to reflect the myriad uncertainties faced in any merger,such as potential loss of key personnel and the predictable traumas of meld-ing distinct corporate cultures. After all the dust has settled, however, Cen-tral Widget’s shareholders will assuredly benefit from the economies ofscale achieved through the acquisition of Excelsior Widget.
Scale economies become available for a variety of reasons. Technologicaladvances can make a sizable portion of existing capacity redundant. For ex-ample, computerization has increased the productivity of financial servicesworkers engaged in clearing transactions. Consolidation in the banking andbrokerage industries has been hastened by cost savings achievable throughhandling two companies’ combined volume of transactions with fewer backoffice workers than the companies previously employed in aggregate.
Economies of scale also arise through consolidation of a “mom-and-pop” business, that is, an industry characterized by many small companiesoperating within small market areas. For example, waste hauling hasevolved from a highly localized business to an industry with companies op-erating on a national scale. Among the associated efficiencies is the abilityto reduce garbage trucks’ idle time by employing them in several adjacentmunicipalities.
Behind the Numbers: F ixed versus Variable Costs
As synergies go, projections of economies of scale in combinations of com-panies within the same business tend to be more plausible than economies

The Income Statement 77
of scope purportedly available to companies in tangentially connected busi-nesses. The existence of chronically underutilized capacity is apparent tooperations analysts within corporations and to outside management consul-tants. Word inevitably spreads from there until the possibility of achievingsizable efficiencies through consolidation becomes common knowledgeamong investors. Companies’ published financial statements typically pro-vide too little detail to quantify directly the potential for realizingeconomies of scale.
Companies do not generally break out their fixed and variable costs inthe manner shown in Exhibit 3.6. Instead, they include a combination ofvariable and fixed costs in cost of goods sold. Somewhat helpfully, the es-sentially fixed costs of depreciation and interest appear as separate lines.On the whole, however, a company’s published income statement providesonly limited insight into its operating leverage, or the rate at which net in-come escalates once sales volume rises above the breakeven rate. This is un-fortunate, because a breakout of fixed and variable costs would beimmensely helpful in quantifying the economies of scale potentially achiev-able through a merger. More generally, such information would greatly fa-cilitate the task of forecasting a company’s earnings as a function ofprojected sales volume.
Exhibit 3.7 uses data from the Central Widget example to plot the rela-tionship between sales volume and pretax income (income before incometaxes). The company breaks even at a sales volume of 200 million units, thelevel at which the $1.50 per unit contribution (margin of revenue over vari-able cost) exactly offsets the $300 million of fixed costs. Once fixed costsare covered, the contribution on each incremental unit sold flows directly tothe pretax income line. At full capacity, 300 million units, Central Widgetearns $150 million before taxes. (Note that analysts can alternatively re-move interest expense from the calculation and base a breakeven analysison operating income.)
In theory, an analyst can back out the fixed and variable components ofa company’s costs from reported sales and income data. The object is toproduce a graph along the lines of the one shown in Exhibit 3.7, while alsoestimating the contribution per unit. At that point, the analyst can create atable like that shown in the exhibit and establish the sensitivity of profits tothe portion of capacity being utilized.
Exhibit 3.8 presents the fictitious case of West Coast Whatsit. The topgraph plots the company’s reported unit sales volume versus pretax incomefor each of the past 10 years. (West Coast is debt-free and has no other non-operating income or expenses, so the company’s operating income is equiv-alent to its pretax income.) Observe that the plotted points are concentratedin the upper right-hand corner of the graph, reflecting that annual sales

78 THE BASIC FINANCIAL STATEMENTS
volume never declined to less than 380 million units (63% of capacity) dur-ing the period. At that low ebb, pretax income fell below zero.
The next step is to fit a diagonal line through the points, as shown inthe upper graph. (For a precise technique of fitting a line, see the discussionof the least-squares method in Chapter 14.) According to the line derivedfrom the empirical observations, the company’s breakeven sales volume is400 million units, that is, the point on the diagonal line that corresponds tozero on the horizontal scale (pretax income). Although West Coast Whatsithas not utilized 100% of its capacity in any of the past 10 years, the graphindicates that at that level (600 million on the vertical scale), pretax incomewould amount to $400 million.
To complete the analysis, the analyst must also plot the reported unitsales volume versus dollar sales for the past 10 years, as shown in the lowergraph. The remaining task is to back into the data required to fill in the
EXHIBIT 3.7 Operating Leverage—Illustration Central Widget
*Price per unit − Variable cost per unit = Contribution per unit.$10.00 − 8.50 = $1.50
0
50
100
150
200
250
300
350
–300 –200 –100 0 100 200
(Units in millions. Contribution, fixed costs, and pretax income in millions of dollars.)
Units * = –Contribution
per Unit300250200150100500
$1.501.501.501.501.501.501.50
Contribution$450375300225150750
FixedCosts$300300300300300300300
=PretaxIncome$150
750
(75)(150)(225)(300)
Sale
s V
olum
e (M
illio
ns o
f U
nits
)
Pretax Income ($000,000 Omitted)

The Income Statement 79
EXHIBIT 3.8 Backing out Fixed and Variable Costs—Illustration West Coast Whatsit
Sales / = ×= =–UnitsUnitPrice
050010001500200025003000
0100200300400500600
Units0
100200300400500600
5555555
VariableCost
per Unit3333333
–FixedCosts800800800800800800800
ContributionperUnit
2222222
Contribution0
200400600800
10001200
=PretaxIncome–800–600–400–200
0200400
Sale
s V
olum
e (M
illio
ns o
f U
nits
)
0
100
200
300
400
500
600
700
0
100
200
300
400
500
600
700
–800 –600 –200–400 0 200 400 600
Sale
s V
olum
e (M
illio
ns o
f U
nits
)
Pretax Income ($000,000 Omitted)
0 500 15001000 2000 2500 3000 3500Sales ($000,000 Omitted)

80 THE BASIC FINANCIAL STATEMENTS
table at the bottom of Exhibit 3.8. At the outset, the analyst knows only thefigures shown in boldface, which can be derived directly from the twographs. For example, the fitted line shows that at full capacity (600 millionunits), sales would total $3.0 billion.
According to the known data, the increase in pretax income betweenthe breakeven volume (400 million units) and a volume of 500 million unitsis $200 million. That dollar figure must represent the contribution on 100million units. Dividing $200 million by 100 million yields the contributionper unit of $2.00, enabling the analyst to fill in that whole column. Dividingany figure in the sales column by its corresponding number of units (e.g.,$2.5 billion and 500 million) provides the unit price of $5.00, which goeson every line in that column. Cost per unit, by subtraction, is $3.00.
At the breakeven level (pretax income = $0), contribution totals 400million units times $2.00 = $800 million. The analyst can put that numberon every line in the entire Fixed Costs column. All that remains is to fill inthe Contribution column by multiplying each remaining line’s number ofunits by the $2.00 contribution per unit figure.
Regrettably, the elegant procedure just described tends to be highly hy-pothetical, even though it is useful to go through the thought process. Tobegin with, companies engaged in a wide range of products do not disclosethe explicit unit volume figures that the analysis requires. Relating theirsales volumes to prices and costs is more complicated than in the case of aproducer of a basic metal or a single type of paper. The Management Dis-cussion and Analysis section of a multiproduct company’s financial reportmay disclose period-to-period changes in unit volume, but not absolute fig-ures, by way of explaining fluctuations in revenues. A rise or drop in rev-enue, however, may also reflect changes in the sales price per unit, whichmay in turn be sensitive to industrywide variance in capacity utilization. Inaddition, revenue may vary with product mix. When a recession causes con-sumers to turn cautious about spending on major appliances, for example,they may trade down to lower-priced models that provide smaller contribu-tions to the manufacturers. Finally, multiproduct companies’ product linestypically change significantly over periods as long as the 10 years assumedin Exhibit 3.8.
For all these reasons, analysts generally cannot back out fixed and vari-able costs in practice. When projecting a company’s income statement forthe coming year, they instead work their way down to the operating incomeline by making assumptions about cost of goods sold (COGS) and selling,general, and administrative expenses (SG&A) as percentages of sales (seeChapter 12). They try in some sense to take into account the impact of fixed

The Income Statement 81
and variable costs, but they cannot be certain that their forecasts are inter-nally consistent.
In Exhibit 3.8, total pretax costs are equivalent to the sum of COGS andSG&A. (Remember that West Coast Whatsit has no interest expense or othernonoperating items.) An analyst who projects that the two together will rep-resent 92% of sales is making a forecast consistent with sales volume of 500million units, or 83% of capacity. At that unit volume, variable costs total500 million × $3.00 = $1.5 billion, which when added to fixed costs of$800 million, produces total costs of $2.3 billion, or 92% of sales measuring$2.5 billion. The assumption of a total pretax cost 92% ratio would be toopessimistic if the analyst actually expected West Coast to operate in line withthe whatsit industry as a whole at 90% of capacity. That would imply unitsales of 540 million, resulting in variable costs of $1.62 billion and total costsof $2.42 billion. The ratio of operating expenses to sales of $2.7 billion (540million units @ $5.00) would be only 90%. Observe that not only operatingincome, but also the operating margin rises as sales volume increases.
Estimating COGS and SG&A as percentages of sales is an imperfect,albeit necessary, substitute for an analysis of fixed and variable costs. Con-scientious analysts must strive to mitigate the distortions introduced by theshortcut method. They should avoid the trap of uncritically adopting theprojected COGS and SG&A percentages kindly provided by companies’ in-vestor relations departments. Analysts who do so risk sacrificing their inde-pendent judgment. After all, the preceding paragraph demonstrates that aforecast of the operating margin must reflect an implicit assumption aboutsales volume. Accordingly, a company’s “guidance” regarding COGS andSG&A percentages necessarily incorporates management’s assumptionabout the coming year’s sales volume. At the risk of stating the obvious,management’s embedded sales projection will often be more optimistic thanthe analyst’s independently generated forecast.
Readers should not infer from the absence of disclosure about fixed andvariable costs that the information is unimportant to understanding com-panies’ financial performance. On the contrary, a company’s fixed-variablemix can be a dominant factor in analyzing both its credit quality and its eq-uity value (see Chapters 13 and 14, respectively). A company with relativelylarge fixed costs has a high breakeven level. Even a modest economic down-turn will reduce its capacity utilization below the rate required to keep thecompany profitable. A cost structure of this sort poses a substantial risk ofearnings falling below the level needed to cover the company’s interest ex-pense. On the other hand, if the same company has low variable costs, itsearnings will rise dramatically following a recession. Each incremental unit

82 THE BASIC FINANCIAL STATEMENTS
of sales will contribute prodigiously to operating income. Two real-life ex-amples demonstrate the analytical value of understanding the fixed-versus-variable nature of a company’s cost structure, even though it may not befeasible to document the mix precisely from the financial statements.
As an amusement park operator, Six Flags exemplifies the high-fixed-cost company. Attendance (and therefore revenue), shows wide seasonalvariations, but the company’s costs are concentrated in categories that donot vary with attendance. Examples include occupancy, depreciation onrides, insurance, and wages of employees who must be on site whether theparks are full or nearly empty.
A time series of the company’s cost of sales as a percentage of sales(Exhibit 3.9) shows wide quarterly fluctuations, largely reflecting extremeseasonality in the company’s business. In 2000, for example, the warm-weather second and third calendar quarters accounted for more than 90%of the parks’ attendance. During those two quarters, which perennially con-tribute the vast majority of annual revenues, cost of sales runs less than50% of revenues. In the cold-weather quarters ending December 31 andMarch 31, by contrast, the ratio soars to over 100%. Year-over-year vari-ances in profit margins, also arising from wide fluctuations in attendance,are substantial as well. Cost of sales soared to 272% of sales in the quarterending December 31, 1996, but measured only 109% in the correspondingquarter of 1999.
Washington Group International, known as Morrison Knudsen duringmost of the period shown in Exhibit 3.10, represents the opposite extreme in
EXHIBIT 3.9 Six Flags, Inc. Cost of Sales as a Percentage of Sales. Quarterly1996–2000.
Source: Compustat.
0
50
100
150
200
250
300
1996 1997 1998 1999 2000Year
Perc
ent

The Income Statement 83
cost structures. The engineering and construction concern incurs variablelabor and material costs with each contract it obtains. Once WashingtonGroup completes the project, the associated costs cease. If the volume ofavailable work declines from one year to the next, the company’s total costsdecline nearly in proportion, as fixed costs are too low to have a large impact.
Consistent with this qualitative description of Washington Group’s mixof fixed and variable costs, the company’s cost of sales as a percentage ofsales scarcely budges from period to period. The ratio consistently ran be-tween 90% and 95% from 1996 through 2000. In the quarter ending De-cember 31, 1997, the percentage was identical to the preceding quarter’s, at94.0%. Similar quarter-to-quarter stability, at the 93.9% level, was observedin the successive quarters ending December 31, 1998 and March 31, 1999.
Credit analysts ordinarily perceive substantial risk in the sort of high-fixed-cost pattern revealed by the Six Flags graph in Exhibit 3.9. Even acomparatively modest drop in revenue and, by extension, contribution candrive operating income below the level required to cover interest expense.By contrast, a highly variable cost structure like Washington Group’s inher-ently provides a great deal of financial flexibility. With few other fixed coststo meet in the event of a revenue decline, an engineering and constructioncompany ought to be able to stay current on its interest expense, provided itkeeps its debt burden at a prudent level.
Surprisingly, however, Washington Group defaulted on its debt and filedfor bankruptcy in May 2001. The action followed a severe liquidity squeezearising from unprofitable contracts that the company took over in connection
EXHIBIT 3.10 Washington Group International, Inc. Cost of Sales as a Percentageof Sales. Quarterly 1996–2000.
Source: Compustat.
01020
4030
6050
8070
10090
1996 1997 1998 1999 20000
1020
4030
6050
8070
10090
Year
Perc
ent

84 THE BASIC FINANCIAL STATEMENTS
with its April 2000 acquisition of Raytheon Engineers & Constructors(RE&C). In response to the credit crisis, Washington Group halted certainwork on two major projects related to the acquisition and sued the seller ofRE&C, Raytheon Company, alleging fraud and breach of contract.
Washington Group’s sudden descent into bankruptcy did not negate thegeneral rule that a predominantly variable cost structure aids financial flexi-bility. Rather, the lesson for students of financial statements was the possibil-ity of discontinuities in any company’s earnings record. Ordinarily, the sort ofconsistency in profit margins depicted in Exhibit 3.10 is reassuring to creditanalysts, but they must never feel reassured to the point of complacency.
Playing with Price-Earnings Mult ip les
Vigilance, as exemplified by the need to watch for earnings discontinuities,has been a recurring theme throughout this exploration of the ins and outsof income statements. Other pitfalls to watch out for include unrealizablesynergies and company-furnished projections of cost ratios that incorporatemanagement’s assumptions regarding sales volume. Before moving on, vigi-lant analysts should familiarize themselves with a device that companieshave developed to get around the general proposition that mergers do notincrease value unless they increase profitability.
Turning back to the fictitious acquisition case presented in Exhibit 3.5,let us change one assumption (see Exhibit 3.11). As a comparatively smallcompany within its industry, Small Change probably will not command ashigh a price-earnings multiple as its larger industry peers. Therefore, weshall assume that Big Time is able to acquire the company for only 12 timesearnings, rather than 14 times, as indicated in Exhibit 3.5.
Our revised assumption does not alter the income statements in eitheryear under either the Acquisition or Nonacquisition Scenario. The acquisitionprice, however, falls from $99.4 million to $7.1 million x 12 = $85.2 mil-lion. Big Time issues only $85.2 million ÷ $28.00 = 3.0 million shares topay for the acquisition, rather than 3.6 million under the previous assump-tion. Consequently, Big Time has 78.0 million shares outstanding at the endof Year 2 under the Acquisition Scenario, instead of 78.6 million. Earningsper share come to $165.0 million ÷ 78.0 million = $2.12. At a price-earningsmultiple of 14 times, Big Time’s stock is valued at $29.68 a share followingthe Small Change acquisition, slightly higher than the $29.40 figure shown inthe Nonacquisition Scenario. Big Time could vault its share price to a consid-erably loftier level by making a series of acquisitions on a similar basis.
In contrast to the outcome depicted in Exhibit 3.5, Big Time increasesthe value of its stock through the acquisition of Small Change. The company

The Income Statement 85
achieves this effect without realizing operating efficiencies through the com-bination. Following the transaction, Big Time’s ratio of net income to salesis 3%, unchanged from its preacquisition level.
The rational explanation of this apparent alchemy lies in Big Time’sability to exchange its stock for shares of privately owned Small Change onhighly favorable terms. By acquiring the smaller company at a price of 12times earnings with stock valued at a multiple of 14 times, Big Time spreadsSmall Change’s earnings across fewer shares than would be the case if themarket valued the two companies at the same multiple. The effect, achieved
EXHIBIT 3.11 Exploiting a Difference in Price-Earnings Multiples Big TimeCorporation and Small Change, Inc.—Illustration ($000 omitted)
Nonacquisition AcquisitionScenario Scenario
Big Time Small Big TimeCorporation Change, Inc. Corporation
Year 1 Year 2 Year 1 Year 2 Year 1 Year 2
Sales $5,000.0 $5,250.0 $238.1 $250.0 $5,000.0 $5,500.0Cost and Expenses
Cost of goods sold 3,422.7 3,591.4 160.6 171.1 3,422.7 3,762.5Selling, general, and
administrativeexpenses 1,250.0 1,315.0 61.9 62.5 1,250.0 1,377.5
Interest expense 100.0 105.0 4.8 5.0 100.0 110.0
Total costs and expenses 4,772.7 5,011.4 227.3 238.6 4,772.7 5,250.0
Income before income expenses 227.3 238.6 10.8 11.4 227.3 250.0
Income taxes 77.3 81.1 3.7 3.9 77.3 85.0
Net income $ 150.0 $ 157.5 $ 7.1 $ 7.5 $ 150.0 $ 165.0
Year-over-year salesincrease — 5% — 5% — 10%
Net income as a percentage of sales 3% 3% 3% 3% 3% 3%
Shares outstanding (million) 75.0 75.0 75.0 78.0
Earnings per share $2.00 $2.10 $2.00 $2.12Price-earnings
multiple (times) 14 14 14 14Price per share $28.00 $29.40 $28.00 $29.68

86 THE BASIC FINANCIAL STATEMENTS
purely through financial engineering, is a parody of the economies of scalerealized in mergers premised instead of improvements in operations.
In fairness to the many real-world companies that have exploited dis-parities in price-earnings multiples over the years, Big Time’s share-price-enhancing acquisition rests squarely within the bounds of fair play.Companies legitimately take advantage of favorable currency exchangerates when deciding whether to purchase materials and equipment domes-tically or overseas. If the dollar is high relative to the Euro, companiesbased in the United States can source goods more economically in Europethan at home. In principle, it is no less appropriate or beneficial to share-holders to buy earnings with a highly valued “acquisition currency,” thatis, its own stock.
Furthermore, as shareholders of a private company, Small Change’sowners do not have to be coerced to sell out to Big Time. The disparity inprice-earnings multiples is justified by the private company’s owners’ op-portunity to exchange an illiquid investment for public stock, for which adeep and active trading market exists. If anything, the difference betweenBig Time’s multiple of 14 times and Small Change’s 12 times understates thevaluation gap between the public and private shares. Lacking a secondarymarket that would reward higher reported income with a higher shareprice, private owner-managers commonly extract compensation throughperquisites that their companies can lawfully account for as business ex-penses. The result is lower net income than comparably successful publiccompanies would report, but with the value of the “perks” delivered on apretax basis. Instead of buying cars with dividends distributed from aftertaxincome, the owner-managers can drive fancier, more expensive company-provided cars purchased with pretax dollars. After adjusting Small Change’sreported income for expenses that would not be incurred at a public companysuch as Big Time, the $85.2 million acquisition price might represent a mul-tiple of only 10 or 11 times, rather than 12 times.
In short, there is nothing inherently unsavory about paying for low-multiple companies with high-multiple stock. Why, then, does the tech-nique warrant special focus in a chapter covering the broad subject ofincome statements? The answer is that like many other legitimate financialpractices, exploiting disparities in price-earnings multiples is prone toabuse. Capitalizing on disparities in price-earnings multiples can lead totrouble in several ways.
To begin with, suppose a high-multiple company acquires a low-multiple company during a period of exceptionally wide dispersion in valu-ations. In a shift from normal conditions to a “two-tiered” market, therespective multiples might go, for sake of example, from 15 and 12 to 25

The Income Statement 87
and 10. Selling stockholders of the low-multiple company would likely con-sider it a fair exchange to accept payment in shares of the high-multiplecompany at the prevailing market price. Their feelings would probablychange dramatically, however, if the two-tiered market abruptly ended withthe purchaser’s stock receding from 25 times earnings to a more ordinary15 times. Sellers who retained the acquiring company’s shares would dis-cover that their value received had suddenly fallen by 40%. (It is reasonableto assume that many shareholders would have held on to the shares, be-cause doing so would ordinarily delay the incurrence of capital gains taxeson the sale. Unlike cash-for-stock transactions, stock-for-stock acquisitionsgenerally qualify as tax-free exchanges.)
Readers might accuse the selling shareholders of being crybabies. Afterall, they knew when they accepted the acquiring company’s shares as pay-ment that they would be exposed to stock market fluctuations, much asthey were prior to the deal. The difference, however, is that if they had heldonto their low-multiple stock, their loss would not have been 40%, but only17%, that is, from 12 times to 10 times earnings. (A complete comparisonmust also take into account any premium over the previously prevailingstock price received by the selling shareholders.)
Financial statement analysis would not have warned the selling share-holders of the impending marketwide drop in price-earnings multiples.Careful scrutiny of the acquiring company’s income statement might verywell have determined, however, that its shares were susceptible to a sharpdecline. Over the years, many voracious acquirers have temporarilyachieved stratospheric multiples on their acquisition currency through fi-nancial reporting gimmicks that hard-nosed analysts were able to detect be-fore the share prices fell back to earth.
In some instances, the basis for an exaggerated P/E multiple is rapidearnings per share growth achieved through financial engineering, ratherthan bona fide synergies. Starting with a modest multiple on its stock, acompany can make a few small acquisitions of low-multiple companies toget the earnings acceleration started. Each transaction may be too small tobe deemed material in itself. That would eliminate any obligation on thecompany’s part to divulge details that would make it easy for analysts toquantify the impact of the company’s exploitation of disparities in P/E mul-tiples. As quarter-to-quarter percentage increases in EPS escalate, the com-pany’s equity begins to be perceived as a high-growth glamour stock.Obliging investors award the stock a higher multiple, which increases thecompany’s ability to buy earnings on favorable terms. Management maysucceed in pumping up the P/E multiple even further by asserting that it canachieve economies of scope through acquiring enterprises outside, yet in

88 THE BASIC FINANCIAL STATEMENTS
some previously unrecognized way, complementary to the company’s corebusiness.
The conglomerate craze of the 1960s relied heavily on these techniques,and with variations, they have been reused in more recent times. Massivedeclines in the share prices of the insatiable acquirers’ stock prices have fre-quently resulted. Contributing to the downslides have been the practicalproblems of integrating the operations of diverse companies. Deals thatwork on paper have often foundered on incompatible information systems,disparate distribution channels, clashes of personality among senior execu-tives, and contrasting corporate cultures. In addition, the process of boost-ing earnings per share through acquisition of lower-multiple companies mayprove unsustainable. For example, if competition heats up among corpora-tions seeking to grow through acquisition, the P/E gap between acquirersand target companies may narrow. That could get in the way of the contin-uous stream of acquisitions needed to maintain EPS growth in the absenceof profit improvements. Inevitably, too, the voracious acquirer will suffer anormal cyclical decline in the earnings of its existing operations. The com-pany’s price-earnings multiple may then decline relative to the multiples ofits potential targets, interrupting the necessary flow of acquisitions.
It is no small task to dissect the income statement of a corporation thatmakes frequent acquisitions and discloses as few details as possible. Never-theless, an energetic analyst can go a long way toward segregating ongoingoperations from purchased earnings growth. Acquisitions of public com-panies leave an information trail in the form of regulatory filings. Conscien-tious searching of the media, including the industry-specialized periodicalsand local newspapers, may yield useful tidbits on acquisitions of privatecompanies. Such investigations will frequently turn up the phrase, “terms ofthe acquisition were not disclosed,” but reliable sources may provide in-formed speculation about the prices paid. Finally, the acquirers may furnishgeneral information regarding the range of earnings multiples paid in recentdeals. If an analysis of the available data indicates that management is ex-panding its empire without creating additional value through genuineeconomies of scale or scope, the prudent action is to sell before the bottomfalls out.
Is Fraud Detectable?
As a final point on the reality underlying the numbers, readers should notethat although the tactics detailed in the preceding discussion may not winawards for candor in financial reporting, neither will most of them land cor-porate managers in the penitentiary. Analysts must be mindful that thereare many ways for companies to pull the wool over investors’ eyes without

The Income Statement 89
fear of legal retribution. Sometimes, however, corporate executives stepover the line into illegality.
Outright misrepresentation falls into a category entirely separate fromthe mere exploitation of financial reporting loopholes. Moreover, the grav-ity of such misconduct is not solely a matter of temporal law. In 1992, theRoman Catholic Church officially classified fraudulent accounting as a sin.A catechism unveiled in that year listed book-cooking in a series of “new”transgressions, that is, offenses not known in 1566, the time of the last pre-vious overhaul of church teachings.
Neither fear of prosecution nor concern for spiritual well-being, how-ever, entirely deters dishonest presenters of financial information. Audits,even when conducted in good faith, sometimes fail to uncover dangerousfictions. Financial analysts must therefore strive to protect themselves fromthe consequences of fraud.
No method is guaranteed to uncover malfeasance in financial report-ing, but neither are analysts obliged to accept a clean auditor’s opinion asfinal. Even without the resources that are available to a major accountingfirm, it is feasible to find valuable clues about the integrity of financialstatements.
Messod Daniel Beneish, Professor of Accounting and Information Sys-tems at the Kelley School of Business at Indiana University, has developed amodel for identifying companies that are likely to manipulate their earn-ings, based on numbers reported in their financial statements.17 (Beneishdefines manipulation to include both actual fraud and the management ofearnings or disclosure within GAAP. In either case, his definition specifiesthat the company subsequently must have been required to restate results;write off assets; or change its accounting estimates or policies at the behestof its auditors, an internal investigation, or a Securities and Exchange Com-mission probe.) Beneish finds, by statistical analysis, that the presence ofany of the following five factors increases the probability of earnings ma-nipulation:
1. Increasing days sales in receivables.2. Deteriorating gross margins.3. Decreasing rates of depreciation.4. Decreasing asset quality (defined as the ratio of noncurrent assets other
than property, plant, and equipment to total assets).5. Growing sales.
Note that Beneish does not characterize these indicators as irrefutableevidence of accounting malfeasance. Indeed, it would be disheartening ifevery company registering high sales growth were shown to be achieving its

90 THE BASIC FINANCIAL STATEMENTS
results artificially. Nevertheless, Beneish’s data suggest a strong associationbetween the phenomena he lists and earnings manipulation.
CONCLUSION
At several points in this chapter, analysis of the income statement has posedquestions that could be answered only by looking outside the statement.Mere study of reported financial figures never leads to a fully informedjudgment about the issuer. Financial statements cannot capture certain non-quantitative factors that may be essential to an evaluation. These include in-dustry conditions, corporate culture, and management’s ability to anticipateand respond effectively to change.
In a few applications of income statement analysis, the limitations oflooking only at the reported numbers pose no difficulty. For example, an in-vestment organization may be permitted to buy the bonds only of com-panies that meet a quantitative financial test such as a minimum ratio ofearnings to interest expense. If the analyst’s task is narrowly defined as cal-culating the ratio to see whether it meets the guideline, then there is no needto go beyond the income statement itself. In most instances, however, theobject of the analysis is to assess the company’s future financial perfor-mance. For analysts engaged in forward-looking tasks, poring over the income statement is merely the jumping-off point. Armed with an under-standing of what happened in past periods, the analyst can approach the is-suer and other sources to find out why.

91
CHAPTER 4The Statement of Cash Flows
The present version of the statement that traces the flow of funds in andout of the firm, the statement of cash flows, became mandatory, under
SFAS 95, for issuers with fiscal years ending after July 15, 1988. Exhibit 4.1,the fiscal 2000 cash flow statement of battery producer Rayovac, illustratesthe statement’s division into cash flows from operations, investments in thebusiness, and financing. The predecessor of the statement of cash flows, thestatement of changes in financial position, was first required under APB 19,in 1971.
Prior to that time, going as far back as the introduction of double-entrybookkeeping in Italy during the fifteenth century, financial analysts hadmuddled through with only the balance sheet and the income statement.Anyone with a sense of history will surely conclude that the introduction ofthe cash flow statement must have been premised by expectations of greatnew analytical insights. Such an inference is in fact well founded. The ad-vantages of a cash flow statement correspond to the shortcomings of the in-come statement, and more specifically, the concept of profit. Over time,profit has proven so malleable a quantity, so easily enlarged or reduced tosuit management’s needs, as to make it useless, in many instances, as thebasis of a fair comparison among companies.
An example of the erroneous comparisons that can arise involves thecontrasting objectives that public and private companies have in preparingtheir income statements.
For financial-reporting (as opposed to tax-accounting) purposes, a pub-licly owned company generally seeks to maximize its reported net income,which investors use as a basis for valuing its shares. Therefore, its incentivein any situation where the accounting rules permit discretion is to minimizeexpenses. The firm will capitalize whatever expenditures it can and depreci-ate its fixed assets over as long a period as possible. All that restrains the

92 THE BASIC FINANCIAL STATEMENTS
EXHIBIT 4.1 Rayovac Corporation
Consolidated Statements of Cash Flows(in thousands, except per share amounts)
Year Ended September 30, 2000
Cash flows from operating activitiesNet income $338,350Adjustments to reconcile net income to net cash provided (used) by
operating activities:Amortization 6,309Depreciation 16,024Deferred income taxes 2,905(Gain) loss on disposal of fixed assets acquired (1,297)Accounts receivable (15,697)Inventories (20,344)Prepaid expenses and other assets (5,416)Accounts payable and accrued liabilities 22,126Accrued recapitalization and other special charges (5,147)
Net cash (used) provided by operating activities 37,813
Cash flows from investing activitiesPurchases of property, plant, and equipment (18,996)Proceeds from sale of property, plant, and equipment 1,051
Net cash used by investing activities (17,945)
Cash flows from financing activitiesReduction of debt (215,394)Proceeds from debt financing 203,189Cash overdraft (4,971)Proceeds from (advances for) notes receivable from officers/shareholders (2,300)Acquisition of treasury stock (886)Exercise of stock options 621Payments on capital lease obligation (1,233)
Net cash provided (used) by financing activities (20,974)Effect of exchange rate changes on cash and cash equivalents (202)
Net increase (decrease) in cash and cash equivalents (1,308)Cash and cash equivalents, beginning of year 11,065
Cash and cash equivalents, end of year $449,757
Supplemental disclosure of cash flow information:Cash paid for interest 27,691Cash paid for income taxes 14,318
Source: Rayovac Corporation Form 10-K December 19, 2000.

The Statement of Cash Flows 93
public company in this respect (other than conscience) is the wish to avoidbeing perceived as employing liberal accounting practices, which may leadto a lower market valuation of its reported earnings. Using depreciationschedules much longer than those of other companies in the same industrycould give rise to such a perception.
In contrast, a privately held company has no public shareholders to im-press. Unlike a public company, which shows one set of statements to thepublic and another to the Internal Revenue Service, a private company typ-ically prepares one set of statements, with the tax authorities foremost in itsthinking. Its incentive is not to maximize, but to minimize, the income it re-ports, thereby minimizing its tax bill as well. If an analyst examines its in-come statement and tries to compare it with those of public companies inthe same industry, the result will be an undeservedly poor showing by theprivate company.
THE CASH FLOW STATEMENT AND THE LBO
Net income becomes even less relevant when one analyzes the statementsof a company that has been acquired in a leveraged buyout, or LBO (Ex-hibit 4.2). In a classic LBO, a group of investors acquires a business byputting up a small amount of equity and borrowing the balance (90% inthis example) of the purchase price. As a result of this highly leveragedcapital structure, interest expense is so large that the formerly quite prof-itable company reports a loss in its first year as an LBO (2002). Hardly anattractive investment, on the face of it, and one might also question thewisdom of lenders who provide funds to an enterprise that is assured oflosing money.
A closer study, however, shows that the equity investors are no fools. In2002, the company’s sales are expected to bring in $1,500 million in cash.Cash outlays include cost of sales ($840 million), selling, general, and ad-ministrative expense ($300 million), and interest expense ($265 million),for a total of $1,405 million. Adding in depreciation of $105 million pro-duces total expenses of $1,510 million, which when subtracted from salesresults in a $10-million pretax loss. The amount attributable to deprecia-tion, however, does not represent an outlay of cash in the current year.Rather, it is a bookkeeping entry intended to represent the gradual reduc-tion in value, through use, of physical assets. Therefore, the funds generatedby the leveraged buyout firm equal sales less the cash expenses only. (Notethat the credit for income taxes is a reduction of cash outlays.)

EXHIBIT 4.2 Leveraged Buyout Forecast—Base Case ($000 omitted)
CapitalizationDecember 31, 2001
Senior debt $1,375 55%Subordinated debt 875 35
Total debt 2,250 90%Common Equity 250 10
Total capital $2,500 100%
Projected Income Statement
2001 2002 2003 2004 2005 2006
Sales $1,429 $1,500 $1,575 $1,654 $1,737 $1,824Cost of sales 800 840 882 926 973 1021Depreciation 100 105 110 116 122 128Selling, general, and
administrative expense 286 300 315 331 347 365
Operating income 243 255 268 281 295 310Interest expense 70 265 265 263 251 257
Income before income taxes 173 (10) 3 18 44 53
Provision (credit) forincome taxes 61 (3) 1 6 12 18
Net income $ 112 $ (7) $ 2 $ 12 $ 22 $ 35
Projected Cash Flow
2002 2003 2004 2005 2006
Net income $ (7) $ 2 $ 12 $ 22 $ 35Depreciation 105 110 116 122 128
Cash from operations 98 112 128 144 163Less: Property and
equipment additions 95 100 105 110 116
Cash available for debt reduction $ 3 $ 12 $ 23 $ 34 $ 47
Projected Capitalization
2001 2002 2003 2004 2005 2006
Senior debt $1,375 $1,372 $1,360 $1,337 $1,303 $1,256Subordinated debt 875 875 875 875 875 875
Total debt 2,250 2,247 2,235 2,212 2,178 2,131Common equity 250 243 245 257 279 314
Total capital $2,500 $2,490 $2,480 $2,469 $2,457 $2,445

The Statement of Cash Flows 95
The same figure can be derived by simply adding back depreciation toincome.1
Viewed in terms of cash inflows and outflows, rather than earnings, theleveraged buyout begins to look like a sound venture. Projected net incomeremains negative, but as shown under “Projected Cash Flow,” cash genera-tion should slightly exceed cash use in 2002. (Note that the equity investorstake no dividends but instead dedicate any surplus cash generated to reduc-tion of debt.)
The story improves even more during subsequent years. As sales growat a 5% annual rate, the Projected Income Statement shows a steady in-crease in operating income. In addition, a gradual paydown of debt causesinterest expense to decline a bit, so net income increases over time. With de-preciation rising as well, funds from operations in this example keep mod-estly ahead of the growing capital expenditure requirements.
If the projections prove accurate, the equity investors will, by the end of2006, own a company with $1.8 billion in sales and $310 million of oper-ating income, up from $1.4 billion and $243 million, respectively, in 2001.They will have captured that growth without having injected any additionalcash beyond their original $250 million investment.
Suppose the investors then decide to monetize the increase in firm valuerepresented by the growth in earnings. Assuming they can sell the companyfor the same multiple of EBITDA (earnings before interest, taxes, deprecia-tion, and amortization)2 that they paid for it, they will realize net proceedsof $685 million, derived as follows ($000 omitted):
Net income $ (7) millionPlus: Depreciaton 105
Equals: Cash generated $ 98 million
Sales $1,500 millionLess: Cash expenses
Cost of sales 840Selling, general, and administrative expense 300Interest expense 265Provision (credit) for income taxes (3)
Equals: Cash generated $ 98 million

96 THE BASIC FINANCIAL STATEMENTS
1. Calculate the multiple of EBITDA paid in 2001.
2. Multiply this factor by 2006 EBITDA to determine sale price in thatyear.
(7.3) × ($35,000 + $18,000 + $257,000 + $128,000) = $3,197,400
3. From this figure subtract remaining debt to determine pretax proceeds.
$3,197,400 − $2,131,000 = $1,066,400
4. Subtract taxes on the gain over original equity investment to determinenet proceeds.
The increase in the equity holders’ investment from $250 million to$789 million over five years represents a compounded annual return of25.8% after tax. Interestingly, the annual return on equity (based on re-ported net income and the book value of equity) averages only 4% duringthe period of the projection. Analysts evaluating the investment merits ofthe LBO proposal would miss the point if they focused on earnings ratherthan cash flow.
The same emphasis on cash flow, rather than reported earnings, isequally important in analyzing the downside in a leveraged buyout.
=+( )
+ ++ +
=+ + +
=
Purchase price Equity borrowed funds
Net income Income taxes Interest expenseDepreciation Amoritization
$ ,$ $ $ $
.
2 500112 61 70 100
7 3
$1,066,400 Pretax proceeds− 250,000 Original equity investment
$ 816,400 Capital gain× .34 Capital gains tax rate
$ 277,576 Tax on capital gain
$1,066,400 Pretax proceeds− 277,576 Tax on capital gain
$ 788,824 Net proceeds

The Statement of Cash Flows 97
As one might expect, the equity investors do not reap such spectaculargains without incurring significant risk. There is a danger that everythingwill not go according to plan and that they will lose their entire investment.Specifically, there is a risk that sales and operating earnings will fall short ofexpectations, perhaps as a result of a recession or because the investors’ ex-pectations were unrealistically high at the outset. With a less debt-heavycapital structure, a shortfall in operating earnings might not be worrisome.In a leveraged buyout, however, the high interest expense can quickly turndisappointing operating income into a sizable net loss (Exhibit 4.3). Theloss may be so large that even after depreciation is added back, the com-pany’s funds generated from operations may decline to zero or to a negativefigure. (Note that the shortfall shown here resulted from deviations of just8% each in the projections for sales, cost of sales, and selling, general andadministrative expense, shown in Exhibit 4.2.)
Now the future does not look so rosy for the equity investors. If theycannot reduce operating expenses sufficiently to halt the cash drain, theywill lack the cash required for the heavy interest expenses they have in-curred, much less the scheduled principal payments. Most of the choicesavailable if they cannot cut costs sufficiently are unappealing. One option isfor the investors to inject more equity into the company. This will cause any
EXHIBIT 4.3 Leveraged Buyout Forecast—Pessimistic Case ($000 omitted)
Projected Income Statement 2002
Sales $1,380Cost of sales 907Depreciation 105Selling, general, and administrative expense 324
Operating income 44Interest expense 265
Income before income taxes (221)Provision (credit) for income taxes (75)
Net income $ (146)
Net income $(146) million
Plus: Depreciation 105
Equals: Cash generated $ (41) million

98 THE BASIC FINANCIAL STATEMENTS
profits they ultimately realize to represent a smaller percentage return onthe equity invested, besides possibly straining the investors’ finances. Alter-natively, the existing equity holders can sell equity to a new group of in-vestors. The disadvantage of this strategy is that anyone putting in newcapital at a time when the venture is perceived to be in trouble is likely toexact terms that will severely dilute the original investors’ interest and, pos-sibly, control. Comparably harsh terms may be expected from lenders whoare willing (if any are) to let the company try to borrow its way out of itsproblems. A distressed exchange offer, in which bondholders accept re-duced interest or a postponement of principal repayment, may be more at-tractive for the equity holders but is likely to meet stiff resistance.
If all these options prove unpalatable or unfeasible, the leveraged com-pany will default on its debt. At that point, the lenders may force the firminto bankruptcy, which could result in a total loss for the equity investors.Alternatively, the lenders may agree to reduce the interest rates on theirloans and postpone mandatory principal repayments, but they will ordinar-ily agree to such concessions only in exchange for a larger influence on thecompany’s management. In short, once cash flow turns negative, the poten-tial outcomes generally look bleak to the equity investors.
The key point here is that the cash flow statement, rather than the in-come statement, provides the best information about a highly leveragedfirm’s financial health. Given the overriding importance of generating (andretaining) cash to retire debt, and because the equity investors have no de-sire for dividends, there is no advantage in showing an accounting profit,the main consequence of which is incurrence of taxes, resulting in turn inreduced cash flow. Neither are there public shareholders clamoring for in-creases in earnings per share. The cash flow statement is the most usefultool for analyzing highly leveraged companies because it reflects the truemotivation of the firm’s owners—to generate cash, rather than to maximizereported income.
ANALYTICAL APPLICATIONS
Although privately held and highly leveraged companies illustrate mostvividly the advantages of the cash flow statement, the statement also hasconsiderable utility in analyzing publicly owned and more conventionallycapitalized firms. One important application lies in determining where acompany is in its life cycle, that is, whether it is “taking off,” growing rap-idly, maturing, or declining. Different types of risk characterize these vari-ous stages of the life cycle. Therefore, knowing which stage a company is incan focus the analyst’s efforts on the key analytical factors. A second use of

The Statement of Cash Flows 99
the cash flow statement is to assess a company’s financial flexibility. Thisterm refers to a company’s capacity, in the event of a business downturn, tocontinue making expenditures that, over the long term, minimize its cost ofcapital and enhance its competitive position. Finally, the cash flow state-ment is the key statement to examine when analyzing a troubled company.When a company is verging on bankruptcy, its balance sheet may overstateits asset value, as a result of write-offs having lagged the deterioration inprofitability of the company’s operations. On the other hand, the balancesheet may fail to reflect the full value of certain assets recorded at historicalcost, which the company might sell to raise cash. The income statement isnot especially relevant in the context of pending bankruptcy. For the mo-ment, the company’s key objective is not to maintain an impeccable earn-ings record, but to survive. The cash flow statement provides the mostuseful information for answering the critical question: Will the companysucceed in keeping its creditors at bay?
CASH FLOW AND THE COMPANY LIFE CYCLE
Business enterprises typically go through phases of development that are inmany respects analogous to a human being’s stages of life. Just as childrenare susceptible to illnesses different from those that afflict the elderly, therisks of investing in young companies are different from the risks inherent inmature companies. Accordingly, it is helpful to understand which portion ofthe life cycle a company is in and which financial pitfalls it is therefore mostlikely to face.
Exhibit 4.4 depicts the business life cycle in terms of sales and earningsgrowth over time. Revenues build gradually during the start-up phase, dur-ing which time the company is just organizing itself and launching its prod-ucts. Growth and profits accelerate rapidly during the emerging growthphase, as the company’s products begin to penetrate the market and theproduction reaches a profitable scale. During the established growth pe-riod, growth in sales and earnings decelerates as the market nears satura-tion. In the mature industry phase, sales opportunities are limited to thereplacement of products previously sold, plus new sales derived fromgrowth in the population. Price competition often intensifies at this stage,as companies seek sales growth through increased market share (a largerpiece of a pie that is growing at a slower rate). The declining industry stagedoes not automatically follow maturity, but over long periods some indus-tries do get swept away by technological change. Sharply declining salesand earnings, ultimately resulting in corporate bankruptcies, characterizeindustries in decline.

100 THE BASIC FINANCIAL STATEMENTS
The characteristic growth patterns of firms at various stages in the com-pany life cycle correspond to typical patterns of cash generation and usage.For example, outright start-up companies are typically voracious cash users.They require funds to pay the salaries of the employees who plan the initialattempts to gear up production and launch marketing efforts. With no rev-enues yet coming in, the risk is high that the organization will fail to gel.Such companies offer little basis for conventional financial statement analy-sis. Before offering their securities in the public market and subjecting theirfinancial results to scrutiny by general investors, they operate as privatelyowned companies under the auspices of venture capitalists. “VCs” are pro-fessional investors with special expertise in evaluating infant companies.They assess the new ventures’ prospects for generating sufficient revenuesto go public.3
Emerging growth companies are start-ups that survive long enough toreach the stage of entering the public market. Focal Communications (Ex-hibit 4.5) illustrates the cash flow pattern of an emerging growth company.As a competitive local exchange carrier (CLEC), Focal offers long-distancevoice and data telecommunications services to large business customers. Itsmarket is characterized by rapid growth, but Focal is not yet at the point ofbeing able to harvest profits on its large capital investments.
EXHIBIT 4.4 The Business Life Cycle
Time
Sale
s an
d E
arni
ngs
Declining Industry
Emerg
ing
Growth
Establish
ed
Growth
Mature Industry
Start-up

101
EXHIBIT 4.5 Focal Communications Corporation
Consolidated Statements of Cash Flows for the Three Years Ended December 31, 2000(Dollars in thousands, except share amounts)
2000 1999 1998
CASH FLOWS FROM OPERATING ACTIVITIES:Net loss $(105,857) $ (22,386) $ (7,969)Adjustments to reconcile net loss to net
cash provided by operating activities—Depreciation and amortization 56,985 23,763 6,671Amortization of obligation under
capital lease 2,275 1,077 —Noncash compensation expense 6,360 7,186 3,070Amortization of discount on senior
discount notes 23,487 20,713 16,080Loss on disposal of fixed assets — 609 —Gain on sale of investment affiliate (199) — —Provision for losses on accounts receivable 6,987 7,090 720
Changes in operating assets and liabilities—Accounts receivable (26,563) (24,545) (8,157)Other current assets (16,526) (3,699) (718)Accounts payable and accrued liabilities 105,755 8,522 12,491Other noncurrent assets and liabilities, net (508) 219 319
Net cash provided by operating activities 52,196 18,549 22,507
CASH FLOWS FROM INVESTING ACTIVITIES:Capital expenditures (309,617) (128,550) (64,229)Change in short-term investments (320) (2,040) (7,960)
Net cash used in investing activities (309,937) (130,590) (72,189)
CASH FLOWS FROM FINANCING ACTIVITIES:Deferred debt issuance cost (14,549) — —Proceeds from issuance of long-term debt 273,020 31,768 163,103Payments on long-term debt (9,254) (5,985) (3,537)Net proceeds from the issuance of
common stock 1,799 138,359 13,900
Net cash provided by financing activities 251,016 164,142 173,466
NET INCREASE (DECREASE) IN CASH AND CASH EQUIVALENTS (6,725) 52,101 123,784
CASH AND CASH EQUIVALENTSBeginning of period 178,142 126,041 2,257
CASH AND CASH EQUIVALENTSEnd of period $(171,417 $178,142 $126,041
Source: Focal Communications Corporation Form 10K March 30, 2001.

102 THE BASIC FINANCIAL STATEMENTS
Over the past three years shown in the exhibit, Focal has recordedmounting losses on operations. Noncash expenses, principally depreciationand amortization of fixed assets and amortization of debt discount,4 repre-sent much of the reported losses. With increases in accounts payable andaccrued liabilities as additional sources, operations have been cash-flow-positive. Focal’s capital budget is several times as great as its depreciationcharges, which conceptually represent the requirement to replace existingplant and equipment as a consequence of wear and tear. This large ongoingconstruction has required outside financing, consisting of both long-termdebt and stock issuance.
Heavy reliance on external financing creates substantial vulnerability inperiods of limited access to capital. Late in 2000, emerging growth telecom-munications companies lost the ability to raise funds in the public equityand high yield bond markets. By the summer of 2001, Focal indicated thatit would run out of cash by the first quarter of 2002 unless it could raisenew funds, either in the private market or as a result of the public marketsreopening to telecom issuers. The company’s stock price and bond ratingsdeclined in reaction to the funding squeeze.
Established growth companies are in a less precarious state in terms ofcash flow than their emerging growth counterparts. Solectron (Exhibit 4.6),a provider of electronics manufacturing and supply-chain management ser-vices, has reached the stage of profitability. Still in its high-growth phase,the company has chalked up increases of approximately 40% in each of thepast two years. Capital expenditures exceed depreciation, although not byas large a margin as observed in emerging growth companies. In 2000,Solectron substantially increased its inventories and acquired $1.1 billion ofmanufacturing locations and assets. The company funded this expansionprimarily with debt issuance.
Mature industry companies such as American Greetings, the second-largest greeting card manufacturer in the United States (Exhibit 4.7), arepast the cash strain faced by growth companies that must fund large con-struction programs. Cash flow from depreciation and amortization morethan covers American Greetings’s capital budget. Consequently, the com-pany has consistently generated positive cash flow from operations, al-though working capital accounts represented a net use of cash in two of thepast three years. Even in fiscal 2001, when the company suffered a net loss,operations generated $110 million of cash. The external funding require-ment arose from $180 million of acquisitions, which included the purchaseof Gibson Greetings, the third-largest company in its business. Consolida-tion is a typical feature of mature industries, where companies seek to bol-ster their diminishing profit margins by capturing economies of scale.

The Statement of Cash Flows 103
EXHIBIT 4.6 Solectron Corporation Supplemental Consolidated Statements ofCash Flows (in millions)
Years Ended August 31
2000 1999 1998
Cash flows from operating activities:Net income $ 497.20 $ 350.30 $ 251.30Adjustments to reconcile net income to
net cash provided by (used in) operating activities:
Depreciation and amortization 251.4 200.4 134.6Noncash interest expense 52.5 18.5 —Tax benefit associated with the exercise
of stock options 60.1 35.4 11.5Adjustment to conform fiscal year ends
of pooled acquisitions (11.8) — —Cumulative effect of change in
accounting principle for start-up costs 3.5 — —Gain on disposal of fixed assets (8.7) (4.6) (2.3)Other 20.9 5.5 (0.6)Changes in operating assets and liabilities:Accounts receivable (934.1) (505.2) (271.2)Inventories (2,096.00) (329.7) (165.2)Prepaid expenses and other current assets (102.9) 16.2 (38.7)Accounts payable 1,710.70 294.8 248.8Accrued expenses and other current
liabilities 214.5 15 44.1
Net cash (used in) provided by operating activities (342.7) 96.6 212.3
Cash flows from investing activities:Purchases and sales of short-term
investments 982 (598) (244.9)Purchases and sales and maturities of
short-term investments (1,498.60) 327.8 358.1Acquisition of manufacturing locations
and assets (1,097.90) (164.2) (204)Capital expenditures (506) (449.4) (279.1)Proceeds from sales of fixed assets 88.9 41.7 60.4Other (35.1) (32) (15.6)
Net cash used in investing activities (2,066.70) (874.1) (325.1)
(continued)

104 THE BASIC FINANCIAL STATEMENTS
Declining industry companies struggle to generate sufficient cash as aconsequence of meager earnings. Polaroid (Exhibit 4.8) earned no cumula-tive profit over the period 1998–2000. For the three years, net cash pro-vided by operating activities of $228.6 million fell considerably short ofadditions to property, plant, and equipment of $490.8 million. The cameramanufacturer nearly made up the difference with $243.7 million of pro-ceeds from sales of property, plant, and equipment. In 2000, however, thecash squeeze became more acute as a result of a rising need to finance inventories.
EXHIBIT 4.6 (Continued)
Years Ended August 31
2000 1999 1998
Cash flows from financing activities:Net proceeds from bank lines of credit 16.9 22.1 22.8Proceeds from issuance of long-term debt 2,296.30 729.4 (0.9)Repayment of long-term debt (0.8) — —Repurchase of common stock — (7.1) (9.2)Proceeds from exercise of stock options 121.9 81.5 54.3Net proceeds from issuance of common
stock 11.2 1,069.90 15.7Dividends paid (1.4) (1.4) (0.4)Other 29.9 (0.4) (2.2)
Net cash provided by financing activities 2,474.00 1,894.00 80.1
Effect of exchange rate changes on cash and cash equivalents (6.5) 5.2 1.7
Net increase (decrease) in cash and cash equivalents 58.1 1,121.70 (31)
Cash and cash equivalents at beginning of year (1) 1,417.40 306.4 337.4
Cash and cash equivalents at end of year $ 1,475.50 $ 1,428.10 $ 306.40
Cash paid:Interest $ 17.60 $ 27.70 $ 25.70Income taxes $ 135.70 $ 114.50 $ 93.70
Noncash investing and financing activities:Issuance of common stock upon
conversion of long-term debt, net $ — $ 225.40 $ —Issuance of common stock for business
combination, net of cash acquired $ 6.40 $ 14.70 $ —
Source: Solectron Corporation Form 10-K November 13, 2000.

105
EXHIBIT 4.7 American Greetings Corporation
Consolidated Statement of Cash Flows Years Ended February 28 or 29, 2001, 2000, and 1999
(Dollars in thousands)
2001 2000 1999
OPERATING ACTIVITIES:Net (loss) income $(113,814) $ 89,999 $180,222Adjustments to reconcile to net cash provided
by operating activities:Cumulative effect of accounting change,
net of tax 21,141 — —Write-down of equity investment 32,554 — —Nonrecurring items — 30,704 5,544Depreciation and amortization 98,057 76,600 74,783Deferred income taxes 61,227 54,248 (8,940)Changes in operating assets and liabilities,
net of effects of acquisitions:Decrease (increase) in trade accounts
receivable 29,201 (35,883) (10,450)(Increase) decrease in inventories (46,587) 11,655 17,809Increase in other current assets (67,292) (57,261) (3,271)Decrease (increase) in deferred costs—net 4,110 (5,640) (65,588)Increase (decrease) in accounts payable
and other liabilities 87,256 (689) 24,211Other—net 3,947 4,786 (3,052)
Cash provided by operating activities 109,800 168,519 211,268
INVESTING ACTIVITIES:Business acquisitions (179,993) (65,947) (52,957)Property, plant, and equipment additions (74,382) (50,753) (60,950)Proceeds from sale of fixed assets 22,294 1,490 2,522Investment in corporate-owned life insurance 181 2,746 18,413Other 33,944 (25,183) 8,040
Cash used by investing activities (197,956) (137,647) (84,932)
FINANCING ACTIVITIES:Increase in long-term debt — 1,076 317,096Reduction of long-term debt (80,431) (16,397) (22,669)Increase (decrease) in short-term debt 257,541 81,097 (158,657)Sale of stock under benefit plans — 1,171 18,981Purchase of treasury shares (45,530) (130,151) (131,745)Dividends to shareholders (52,743) (51,213) (52,410)
Cash provided (used) by financing activities 78,837 (114,417) (29,404)
(DECREASE) INCREASE IN CASH AND EQUIVALENTS (9,319) (83,545) 96,932
Cash and equivalents at beginning of year 61,010 144,555 47,623
Cash and equivalents at end of year $ 51,691 $ 61,010 $144,555
Source: American Greetings Corporation Form 10-K405 May 3, 2001.

106
EXHIBIT 4.8 Polaroid Corporation and Subsidiary Companies
Consolidated Statement of Cash Flows(Dollars in millions)
Year Ended December 31
2000 1999 1998
CASH FLOWS FROM OPERATING ACTIVITIESNet earnings/(loss) $ 37.7 $ 8.70 $ (51.00)Depreciation of property, plant, and equipment 113.9 105.9 90.7Gain on the sale of real estate (21.8) (11.7) (68.2)Other noncash items 22.9 73.8 62.2Decrease/(increase) in receivables 41.8 (52.7) 79Decrease/(increase) in inventories (100.6) 88 (28.4)Decrease in prepaids and other assets 32.9 62.4 39Increase/(decrease) in payables and accruals 9.2 (16.5) 25.3Decrease in compensation and benefits (105) (72.5) (21)Decrease in federal, state and foreign income
taxes payable (31.5) (54) (29.9)
Net cash provided/(used) by operating activities (0.5) 131.4 97.7
CASH FLOWS FROM INVESTING ACTIVITIESDecrease/(increase) in other assets 4.5 16.5 (25.4)Additions to property, plant, and equipment (129.2) (170.5) (191.1)Proceeds from the sale of property, plant, and
equipment 56.6 36.6 150.5Acquisitions, net of cash acquired — — (18.8)
Net cash used by investing activities (68.1) (117.4) (84.8)
CASH FLOWS FROM FINANCING ACTIVITIESNet increase/(decrease) in short-term debt
(maturities 90 days or less) 108.2 (86.2) 131.2Short-term debt (maturities of more than 90 days)
Proceeds — 41.8 73Payments — (24.9) (117.2)
Proceeds from issuance of long-term debt — 268.2 —Repayment of long-term debt — (200) —Cash dividends paid (27) (26.6) (26.5)Purchase of treasury stock — — (45.5)Proceeds from issuance of shares in connection
with stock incentive plan 0.1 0.3 6
Net cash provided/(used) by financing activities 81.3 (27.4) 21
Effect of exchange rate changes on cash (7.5) 0.4 3.1
Net increase/(decrease) in cash and cash equivalents 5.2 (13) 37
Cash and cash equivalents at beginning of year 92 105 68
Cash and cash equivalents at end of year $ 97.20 $ 92.00 $105.00
Source: Polaroid Corporation Form 10-K April 2, 2001.

The Statement of Cash Flows 107
Polaroid’s underlying problem was deterioration in its core business.The company introduced instant photography with the Land Camera in1947, following up that success with an instant color photography systemin 1971. Consumer interest waned, however, with the advent of one-hourphoto developing stores and digital cameras. New products failed to revivePolaroid’s fortunes, while costs became bloated through sales force expan-sion far in excess of sales growth.5 The company compounded its problemsin 1988 by aggressively repurchasing stock in an effort to fend off an at-tempted hostile takeover, sharply increasing its financial leverage as a conse-quence. Polaroid had an opportunity to reduce its debt load in 1991, whenit received $925 million from a settlement of a patent violation suit againstEastman Kodak. Instead, the company used the proceeds to retire moreshares and purchase resource-planning software in an attempt to boostefficiency.6
By the summer of 2001, Polaroid was failing to meet its scheduled bondcoupons. As a cost-saving measure, the company slashed health care bene-fits for employees and required retirees to shoulder an increased portion oftheir health care costs. After attempts to sell all or part of the company boreno fruit, Polaroid filed for bankruptcy on October 12, 2001.
THE CONCEPT OF FINANCIAL FLEXIBILITY
Besides reflecting a company’s stage of development, and therefore the cate-gories of risk it is most likely to face, the cash flow statement provides es-sential information about a firm’s financial flexibility. By studying thestatement, an analyst can make informed judgments on such questions as:
� How safe (likely to continue being paid) is the company’s dividend?
� Could the company fund its needs internally if external sources of cap-ital suddenly become scarce or prohibitively expensive?
� Would the company be able to continue meeting its obligations if itsbusiness turned down sharply?
Exhibit 4.9 provides a condensed format that can help answer thesequestions. At the top is basic cash flow, defined as net income (excludingnoncash components), depreciation, and deferred income taxes. The vari-ous uses of cash are deducted in order, from least to most discretionary.
In difficult times, when a company must cut back on various expendi-tures to conserve cash, management faces many difficult choices. A key ob-jective is to avoid damage to the company’s long-term health. Financial

108 THE BASIC FINANCIAL STATEMENTS
flexibility, as captured by the presentation in Exhibit 4.9, is critical to meet-ing this objective.
Wal-Mart, the United States’ largest retailer, exhibited exceptional fi-nancial flexibility in the fiscal year ended January 31, 2001. Cash generatedby operations, at a robust $9.6 billion, precluded any need to borrow orissue stock to pay for the company’s ambitious $8.0 billion capital spendingprogram. Wal-Mart floated $2.1 billion of long-term debt (net of retire-ments), but that issuance merely refunded a similar amount of outstandingshort-term debt. Proceeds of the company’s $388 million of net stock is-suance essentially made up the small amount ($180 million) by which in-vesting activities (primarily investment in international operations)exceeded internally generated cash after dividends.
Wal-Mart’s ability to self-finance most of its expansion is a great ad-vantage. At times, new financing becomes painfully expensive, as a functionof high interest rates or depressed stock prices. During the “credit
EXHIBIT 4.9 Wal-Mart Stores Inc.
Analysis of Financial Flexibility Fiscal Years Ended January 31, 2001
(000 omitted)
Basic cash flow (1) $9,749
Increase in adjusted working (2) (145)
Operating cash flow 9,604
Capital expenditures (8,042)
Discretionary cash flow 1,562Dividends (1,070)Investing activities (672)
Cash flow before financing (180)Net increase in long-term debt (3) 2,086Net decrease in short-term debt (2,022)Net issuance of common stock 388Other (74)
Increase in cash and cash equivalents $ 198
(1) Includes net income, depreciation and amortization,deferred income taxes, and other.
(2) Excludes cash and notes payable.(3) Includes capital lease obligations.Source: Wal-Mart Stores Inc. Form 10-K/A April 17, 2001.

The Statement of Cash Flows 109
crunches” that occasionally befall the business world, external financing isunavailable at any price.
Underlying Wal-Mart’s lack of dependence on external funds is a highlyprofitable discount store business. If this engine were to slow down for atime, as a result of an economic contraction or increased competitive pres-sures, the company would have two choices. It could reduce its rate of storeadditions and profit-enhancing investments in technology or it could be-come more dependent on external financing. The former approach couldfurther impair profitability, while the latter option would earmark a greaterportion of Wal-Mart’s EBITDA for interest and dividends. Loss of financialflexibility, in short, leads to further loss of financial flexibility.
If the corporation’s financial strain becomes acute, the board of direc-tors may take the comparatively extreme step of cutting or eliminating thedividend. (About the only measures more extreme than elimination of thedividend are severe retrenchment, entailing a sell-off of core assets to gener-ate cash, and cessation of interest payments, or default.) Reducing the divi-dend is a step that corporations try very hard to avoid, for fear of losingfavor with investors and consequently suffering an increase in cost of capi-tal. Boards sometimes go so far as to borrow to maintain a dividend at itsexisting rate. This tactic cannot continue over an extended period, lest in-terest costs rise while internal cash generation stagnates, ultimately leadingto insolvency.
Notwithstanding the lengths to which corporations sometimes go topreserve them, dividends must be viewed as a potential source of financialflexibility in a period of depressed earnings. After all, the term “discre-tionary,” applied to the cash flow that remains available after operating ex-penses and capital expenditures, emphasizes that dividends are notcontractual payments, but disbursed at the board’s discretion. When preser-vation of the dividend jeopardizes a company’s financial wellbeing, share-holders may actually urge the board to cut the payout as a means ofenhancing the stock value over the longer term.
To gauge the safety of the dividend, analysts can observe the margin bywhich discretionary cash flow covers it. In Wal-Mart’s case, the ratio is acomfortable $1.562 billion ÷ $1.070 billion = 1.46x. By the same token, thatratio would fall below 1.0x if Wal-Mart’s net income (a component of basiccash flow) declined by $1.562 billion − $1.070 billion = $492 million. Thatwould represent a drop of only 8% in Wal-Mart’s earnings. (Net income,which is not shown in Exhibit 4.9, was $6.295 million in the fiscal year.)
Wal-Mart, however, has an additional cushion in the form of potentialcutbacks in its capital budget. Management could not only reduce the paceof store additions, but also defer planned refurbishment of existing stores.

110 THE BASIC FINANCIAL STATEMENTS
The latter measure, though, could cut into future competitiveness. Retailersfind that their sales drop off if their stores start to look tired. Similarly, in-dustrial companies can lose their competitive edge if they drop back to“maintenance level capital spending” for any extended period. This is theamount required just to keep existing plant and equipment in good workingorder, with no expenditures for adding to capacity or upgrading of facilitiesto enhance productivity. Analysts, by the way, should seek independent con-firmation of the figure that management cites as the maintenance level, pos-sibly from an engineer familiar with the business. Companies mayexaggerate the extent to which they can cut capital spending to conservecash in the event of a downturn.
A final factor in assessing financial flexibility is the change in adjustedworking capital. Unlike conventional working capital (current assets minuscurrent liabilities), this figure excludes notes payable, as well as cash andshort-term investments. In Exhibit 4.9, the former is part of the net changein short-term debt, while the period’s increase or decrease in cash is treatedas a residual in the analysis of financial flexibility.
For Wal-Mart, adjusted working capital represented a minor ($145 mil-lion) use of funds during the fiscal year. In general, inventories and receiv-ables expand as sales grow over time. A company with a strong balancesheet can fund much of that cash need by increasing its trade payables(credit extended by vendors). External financing may be needed, however, ifaccumulation of unsold goods causes inventories to rise disproportionatelyto sales. Similarly, if customers begin paying more slowly than formerly, re-ceivables can widen the gap between working capital requirements andtrade credit availability. The resulting deterioration in credit quality mea-sures (see Chapter 13), in turn, may cause vendors to reduce the amount ofcredit they are willing to provide. Once again, loss of financial flexibilitycan feed on itself.
IN DEFENSE OF SLACK
Conditions are tough enough when credit is scarce, either because of gen-eral conditions in the financial markets or as a result of deterioration in acompany’s debt quality measures. Sometimes the situation is much worse,as a company finds itself actually prohibited from borrowing. Bank creditagreements typically impose restrictive covenants, which may include limi-tations on total indebtedness (see “Projecting Financial Flexibility” inChapter 12). Beyond a certain point, a firm bound by such covenants can-not continue borrowing to meet its obligations.

The Statement of Cash Flows 111
A typical consequence of violating debt covenants or striving to headoff bankruptcy is that management reduces discretionary expenditures toavoid losing control. Many items that a company can cut without disruptingoperations in the short run are essential to its long-term health. Advertisingand research are obvious targets for cutbacks. Their benefits are visible onlyin future periods, while their costs are apparent in the current period. Overmany years, a company that habitually scrimps on such expenditures canimpair its competitiveness, thereby transforming a short-term problem intoa long-term one.
Avoiding this pattern of decline is the primary benefit of financial flexi-bility. If during good times a company can generate positive cash flow be-fore financing, it will not have to chop capital expenditures and otheroutlays that represent investments in its future. Nor, in all likelihood, will acompany that maintains some slack be forced to eliminate its dividendunder duress. The company will consequently avoid tarnishing its image inthe capital markets and raising the cost of future financings.
Despite the blessings that financial flexibility confers, however, main-taining a funds cushion is not universally regarded as a wise corporate pol-icy. The opposing view is based on a definition of free cash flow as “cashflow in excess of that required to fund all of a firm’s projects that have pos-itive net present values when discounted at the relevant cost of capital.”7
According to this argument, management should dividend all excess cashflow to shareholders. The only alternative is to invest it in low-return proj-ects (or possibly even lower-return marketable securities), thereby prevent-ing shareholders from earning fair returns on a portion of their capital. Leftto their own devices, argue the proponents of this view, managers will trapcash in low-return investments because their compensation tends to be pos-itively related to the growth of assets under their control. Therefore, man-agement should be encouraged to remit all excess cash to shareholders. Ifencouragement fails to do the trick, the threat of hostile takeover should beemployed, say those who minimize the value of financial flexibility.
The argument against retaining excess cash flow certainly sounds logi-cal. It is supported, moreover, by numerous studies8 indicating the tendencyof companies to continue investing even after they have exhausted theirgood opportunities. Growing as it does out of economic theory, though, theargument must be applied judiciously in practice. Overinvestment has un-questionably led, in many industries, to prolonged periods of excess capac-ity, producing in turn chronically poor profitability. In retrospect, the firmsinvolved would have served their shareholders better if they had increasedtheir dividend payouts or repurchased stock, instead of constructing newplants. That judgment, however, benefits from hindsight. Managers may

112 THE BASIC FINANCIAL STATEMENTS
have overinvested because they believed forecasts of economic growth thatultimately proved too optimistic. Had demand grown at the expected rate, afirm that had declined to expand capacity might have been unable to main-tain its market share. In the long run, failing to keep up with the scaleeconomies achieved by more expansion-minded competitors could haveharmed shareholders more than a few years of excess capacity. The financialanalyst’s job includes making judgments about a firm’s reinvestment poli-cies—without the benefit of hindsight—and does not consist of passivelyaccepting the prevailing wisdom that low returns in the near term prove thatan industry has no future opportunities worth exploiting.
A subtler point not easily captured by theorists is that financial flexibil-ity can translate directly into operating flexibility. Keeping cash “trapped”in marketable securities can enable a firm to gain an edge over “lean-and-mean” competitors when tight credit conditions make it difficult to financeworking capital needs. Another less obvious risk of eschewing financialflexibility is the danger of permanently losing experienced skilled workersthrough temporary layoffs occasioned by recessions. Productivity suffersduring the subsequent recovery as a consequence of laid-off skilled employ-ees finding permanent jobs elsewhere. It may therefore be economical tocontinue to run plants, thereby deliberately building up inventory, to keepvalued workers on the payroll. This strategy is difficult to implement with-out some capability of adjusting to a sudden increase in working capital fi-nancing requirements.
CONCLUSIONS
Over the past three decades, the statement of cash flow has become a valu-able complement to the other statements. It is invaluable in many situationswhere the balance sheet and income statement provide only limited insight.For example, the income statement is a dubious measure of the success of ahighly leveraged company that is being managed to minimize, rather thanmaximize, reported profits. Similarly, it is largely irrelevant whether the bal-ance sheet of a company with an already substantially depleted net worthshows 10% lower equity in the current quarter than in the previous one.The primary concern of the investor or creditor at such times is whether thecompany can buy enough time to solve its operating problems by continu-ing its near-term obligations.
The cash flow statement does more than enrich the analysis of com-panies encountering risks and opportunities that the income statementand balance sheet are not designed to portray. It also helps to identify the

The Statement of Cash Flows 113
life-cycle categories into which companies fit. At all stages of development,and whatever challenges a company faces, financial flexibility is essential tomeeting those challenges. The cash flow statement is the best tool for measur-ing flexibility, which, contrary to a widely held view, is not merely a securityblanket for squeamish investors. In the hands of an aggressive but prudentmanagement, a cash flow cushion can enable a company to sustain essentiallong-term investment spending when competitors are forced to cut back.


PARTthreeA Closer Look at Profits


117
CHAPTER 5What Is Profit?
P rofits hold an exalted place in the business world and in economic the-ory. The necessity of producing profits imposes order and discipline on
business organizations. It fosters cost-reducing innovations, which in turnpromote the efficient use of scarce resources. The profit motive also encour-ages savings and risk-taking, two indispensable elements of economic devel-opment. Finally, profitability is a yardstick by which businesspeople canmeasure their achievements and justify their claims to compensation.
In view of all these essential economic functions, one might supposethat users of financial statements would have long since devised a univer-sally agreed-on definition of profit. This is the case, however, only at the fol-lowing, extremely rudimentary level:
Profit = Revenue − Costs
Defining profit in such a manner merely stirs up questions, however:What is revenue? Which costs count? Or, more precisely, which costs countnow and which count later? Because these questions can be answered inmany different ways, countless definitions of profit are in common use. Foranalysts of financial statements, the most important distinction to under-stand is between bona fide profits and accounting profits.
BONA FIDE PROFITS VERSUS ACCOUNTING PROFITS
In defining bona fide profits, the simple formula, revenue minus costs, repre-sents a useful starting point. When calculating this kind of profit, the analystmust take care to consider only genuine revenues and deduct all relevantcosts. A nonexhaustive list of costs includes labor, materials, occupancy,services purchased, depreciation of equipment, and taxes. No matter how

118 A CLOSER LOOK AT PROFITS
meticulously the analyst carries out these computations, however, no calcu-lation of profit can be satisfactory unless it passes a litmus test:
After a company earns a bona fide profit, its owners are wealthier thanthey were beforehand.
To underscore the point, there can be no bona fide profit without an in-crease in wealth. Bona fide profits are the only kind of profits that trulymatter in financial analysis.
As for accounting profits, Generally Accepted Accounting Principles de-fine voluminous rules for calculating them with extraordinary precision. Forfinancial analysts, however, the practical definition of an accounting profitis simple:
An accounting profit is whatever the accounting rules say it is.
If, during a stated interval, a business adds nothing to its owners’wealth, but the accounting rules state that it has earned a profit, that isgood enough. An accounting profit that reflects no genuine increase inwealth is certainly sufficient for many stock market investors. They cheer-fully assign a price-earnings multiple to any number that a reputable ac-counting firm waves its magic wand over and declares to be a profit.
WHAT IS REVENUE?
Suppose, for example, that an entrepreneur launches a restaurant franchis-ing business. The fictitious Salsa Meister International does not operate anySalsa Meister restaurants. It merely sells franchises to other entrepreneursand collects franchise fees.
The franchised restaurants, sad to say, consistently lose money. Thatfact has no bearing on Salsa Meister International’s accounting profit, how-ever. The restaurants’ operations are not part of Salsa Meister International,their revenues are not its revenues, and their costs are not its costs. SalsaMeister International’s income consists entirely of franchise fees, which itearns by rendering the franchisees such services as developing menus, pro-viding accounting systems, training restaurant employees, and creating ad-vertising campaigns.
An astute analyst will ask how money-losing franchisees come up withcash to pay fees. The diagram in Exhibit 5.1 answers this riddle. Salsa Meis-ter International sells stock to the public, then lends the proceeds to the

What Is Profit? 119
franchisees. The franchisees send the cash right back to Salsa Meister Inter-national under the rubric of fees. Salsa Meister International gratefully ac-cepts the fees, which exceed the modest costs of running a corporateheadquarters, and renames them revenue.
According to generally accepted accounting principles, Salsa MeisterInternational has earned a profit. Investors apply a price-earnings multipleto the accounting profit. On the strength of that valuation, the companygoes forward with its next public stock offering. Once again, the proceedsfinance the payment of fees by franchisees, whose numbers have meanwhileincreased in connection with the Salsa Meister chain’s expansion into newregions. Accounting profits rise and the cycle of relabeling stock marketproceeds first as fees and finally as earnings starts all over again.
The astute analyst is troubled, however. Cutting through the form of thetransactions to the substance, it is clear that Salsa Meister International’swealth has not increased. Cash has simply traveled from the shareholders tothe company, to the franchisees, and then back to the company, undergoinga few name changes along the way.
EXHIBIT 5.1 Turning Stock Market Proceeds into Revenue
SalsaMeister
Franchise 1
Loans
Stock Sale Proceeds
Fees
Salsa
Salsa
Salsa
Salsa
Salsa
Fees
Franchise 4
Franchise 2
Franchise 3
Franchise 5

120 A CLOSER LOOK AT PROFITS
Merely circulating funds does not increase wealth. If Jack hands Jill adollar, which she promptly hands right back to him, neither party is betteroff after the “transaction” than before it. By definition, neither Jack nor Jillhas earned a bona fide profit. Salsa Meister International has not earned abona fide profit, either, regardless of what GAAP may say about accountingprofits.
Sooner or later, investors will come to this realization. When that hap-pens, the company will lose its ability to manufacture accounting profits byraising new funds in the stock market. Salsa Meister’s stock price will thenfall to its intrinsic value—zero. Investors will suffer heavy losses that theycould have avoided by asking whether the company’s reported profits trulyreflected increases in wealth. Moreover, the investors will continue makingsimilar mistakes unless they begin to understand that bona fide profitssometimes differ radically from accounting profits.
WHICH COSTS COUNT?
The willingness to take accounting profits at something other than facevalue is an essential element of genuinely useful financial statement analysis.It is likewise imperative that analysts exercise care in deciding what to sub-stitute for a GAAP definition of profit. Once they leave the GAAP world ofagreed-on rules, analysts enter a free market of ideas, where numerous par-ties hawk competing versions of earnings.
Many of the variations hang on the question of which costs to deduct inderiving the most analytically informative definition of earnings. Althoughsome of the popular variants offer insight into knotty problems of financialstatement analysis, others have the opposite effect of obscuring the facts.Many issuers of financial statements attempt to exploit dissatisfaction withGAAP by encouraging analysts to adopt earnings measures that make theirown profits appear higher than either their accounting profits or their bonafide profits.
The archetype for most of today’s alternative earnings measures is aversion that adds back depreciation. As far back as 1930, an investment ex-pert urged investors to ignore accounting-based earnings in the followingwords:
Textbooks will advise the investor to look for earnings figures which giveeffect to depreciation charges. But depreciation, after all, is a purely ac-counting item, and can be adjusted, within limits, to show such net earn-ings as are desired. Therefore it would seem preferable for the investor to

What Is Profit? 121
obtain, if possible, earnings before depreciation, and to make his own es-timate of depreciation in arriving at approximate net earnings.1
Observe that the author does not dispute the relevance of depreciationto the calculation of earnings. Rather, he objects that they are too mal-leable.2 The issuer of the statements can raise or lower its reported earningssimply by using its latitude to assume shorter or longer average lives for itsdepreciable assets.
It is fair to assume, in the case of financial statements that companiespresent to potential investors, that “such net earnings as are desired” arehigher than the company’s bona fide profits. Therefore, the necessary ad-justment is to increase depreciation and thereby reduce earnings. The au-thor agrees with today’s boosters of alternative earnings measures thatproper analysis requires adjustments to reported income, but he is very farfrom urging analysts to ignore depreciation altogether.
Promoters of many companies with negligible reported earnings, on theother hand, are not bashful about urging investors to disregard deprecia-tion. This audacious assault on the very foundations of accrual accountingdraws its inspiration from the world of privately owned real estate, wherethe logic of managing a public company is turned upside-down. Instead ofexploiting every bit of latitude in the accounting rules to maximize reportedearnings, private owners of real estate strive to minimize reported income,and by extension, income taxes. Accordingly, when a private investor ac-quires a building (a depreciable asset) and the land that it sits on (which isnot depreciable), she typically attributes as large a portion of the purchaseprice as possible to the building. That treatment maximizes the deprecia-tion expense and minimizes the owner’s taxes.
Let us suppose that annual rental revenue on the building offsets thelandlord’s out-of-pocket expenses, such as maintenance, repairs, propertytaxes, and interest on the property’s mortgage. The owner, in other words,is breaking even, before taking into account the noncash expense of depre-ciation. Including depreciation, the property shows an annual loss, whichreduces the owner’s income tax bill. Let us also assume that after a fewyears, the owner sells the land and building. After paying off the mortgagebalance, she walks away with more cash than she originally invested, thanksto the tendency of real estate values to rise over time.
Recapping the real estate investor’s experience, she has sold the prop-erty for more than she paid. Her gain has not been reduced along the wayby net cash outlays on operations. On the contrary, the tax savings pro-duced by the noncash depreciation expense have contributed to the rise in her wealth. The key point is that the investor is wealthier than she was

122 A CLOSER LOOK AT PROFITS
before she bought the building. According to our definition, she has realizeda bona fide profit, despite reporting losses every single year. Adding to theparadox is the investor’s success in selling the property for a gain. Economictheory states that an investment has value only because it produces profits.By extension, the value can increase only if the profits increase. In this in-stance, however, the property’s value rose despite an uninterrupted flow ofred ink. (The result calls to mind the observation of two officials of the So-viet Union in the 1939 film Ninotchka: “Capitalistic methods . . . They ac-cumulate millions by taking loss after loss.”3)
Naturally, these curious events have a rational explanation. The rate atwhich the tax code allows owners to write off property overstates actualwear-and-tear. Over the typically very long life of a building, it may get de-preciated several times over for tax purposes. The disparity between eco-nomic depreciation and tax-based depreciation may be viewed as a subsidyfor socially productive investment. Alternatively, it can be seen as a testa-ment to the real estate operators’ influence over the legislators who writethe United States Tax Code.
Either way, a conventional income statement provides a cockeyed viewof the profitability of buying and selling buildings. A closer approximationof reality ignores the depreciation expense altogether and focuses on cash-on-cash profit. In the simplest terms, the owner lays out a sum at the begin-ning of the investment and takes out a bigger sum at the end, while alsogenerating cash—through tax savings—during the period in which sheowns the building.
HOW FAR CAN THE CONCEPT BE STRETCHED?
To a limited extent, a profitability analysis that ignores depreciation is ap-plicable outside the world of real estate. In the broadcasting business, com-panies typically record depreciation and amortization expense that farexceeds physical wear-and-tear on assets. For example, when a company buysa radio or television station, the price reflects a comparatively smallcomponent of plant and equipment. The larger portion of the station’s valuederives from its exclusive right to utilize part of the broadcasting spectrum, ascarce resource that tends to become more valuable over time. Much as in thereal estate illustration, the broadcaster may show perennial losses after de-preciation, yet realize a handsome profit when it finally sells the station. In-stead of analyzing broadcasters on the basis of conventional net income, it isappropriate for analysts to focus on broadcast cash flow, usually defined as:
operating income + depreciation and amortization + corporate overhead

What Is Profit? 123
(A more meticulous calculation of broadcast cash flow deducts cash outlaysfor acquisition of new programming while deducting the amortization ofthe cost of previously acquired programming, both of which can be foundon the statement of cash flows.)
The deliberate neglect of depreciation is an analytical option thatshould be used with discretion. In many industries, fixed assets consistmainly of machines or vehicles that really do diminish in value through use.The major risk of analytical error does not arise from the possibility that re-ported depreciation expense will substantially exceed economic deprecia-tion, but the reverse.
Through a false analogy with real estate and broadcasting, any margin-ally unprofitable company in a capital-intensive business can declare itselfto be in the black. The trick is simply to proclaim that analysts should nolonger consider depreciation. Supposed earnings generated in such fashion,however, qualify as neither accounting profits nor bona fide profits.
CONCLUSION
Despite the critical importance of measuring profit, businesspeople cannotproduce a definition that is satisfactory in every situation. Even the simpleformula of revenue minus costs founders on the malleability of accounting-based revenues and costs. As Chapters 6 and 7 demonstrate, these basicmeasures of corporate performance are far too subject to manipulation anddistortion to be taken at face value. Also, our brief discussions of real estateand leveraged buyouts show that net earnings can be calculated in perfectaccordance with GAAP, yet bear little relation to an investor’s rate of return.
In light of such observations, financial analysts must walk a fine line.On the one hand, they must not lose touch with economic reality by hewingto accounting orthodoxy. On the other hand, they must not accept the ver-sion of reality that seekers of cheap capital would like to foist on them. An-alysts should be skeptical of claims that a business’s alleged “costs” aremere accounting conventions and that anyone who believes otherwise is afuddy-duddy.


125
CHAPTER 6Revenue Recognition
E xperience teaches that it can be dangerous to accept reported revenues atface value, even if they have been audited. Many corporations employ
highly aggressive recognition practices that comply with GAAP yet distortthe underlying economic reality. Sometimes, executives hell-bent on “mak-ing their numbers” will cross the line into fraudulent revenue recognition.Often, outward signs of exceptional success indicate, in reality, a high prob-ability of downward revisions of previously reported revenues. Under in-tense pressure to maintain their stock prices, companies characterized byextremely rapid sales growth seem particularly prone to take liberties. In-formix vividly portrayed these hazards in 1997 by rescinding a substantialportion of its past revenues.
INFORMIX’S TROUBLES BEGIN
Informix was the best-performing United States software stock for the pe-riod 1990 through 1995.1 By the beginning of 1997, the company waswidely regarded as a serious challenger to Oracle’s leadership in the busi-ness of creating large corporate databases. Informix even taunted its rivalon a billboard alongside the interstate highway near Oracle’s office towers,warning drivers that they were approaching a “dinosaur crossing.”
At the same time that it was trash-talking the competition, however,management was taking a huge risk in its operating strategy. Hoping toboost its market share, Informix shifted its marketing resources to Univer-sal Server, a new type of database intended to store different kinds of data,such as images and video. Informix’s strategic initiative proved premature.Not only did the new product remain unperfected, but corporate customerswere not yet indicating demand for multimedia database technology.

126 A CLOSER LOOK AT PROFITS
On top of the product-related woes, some analysts were questioning In-formix’s revenue recognition practices. They grew wary when Informix re-vealed that about $170 million of its 1996 sales to computer makers andother resellers represented software that had not yet been resold to finalcustomers. Roughly $55 million of that total involved agreements by com-puter manufacturers to purchase software equivalent in value to the hard-ware that Informix bought from them.
The Fine Points of Software Revenues
Chairman and Chief Executive Officer Phillip E. White declared that hiscompany’s sales practices were properly disclosed and in compliance withthe accounting rules. Several independent accounting experts backed up hisstatement. None of this meant, however, that Informix’s revenue recognitionpolicies were the only, or even the best, approach available under GAAP.
For software producers, shipping a product to a reseller does not neces-sarily represent a definitive sale. Just like “old-economy” manufacturers ofbasic industrial and consumer goods, software producers can expect run-of-the-mill returns of defective items. In addition, a reasonably predictableportion of customers will fail to pay their accounts in full. Deferring a por-tion of revenue for these contingencies is comparatively straightforward, butother recognition issues are more judgmental for a company such as In-formix. Uncertainty lingers over a sale until the software has been installedat the end user and the end user’s staff has been trained in its use. Further-more, resellers often have latitude to return products they cannot sell. At thebeginning of 1997, with the accounting profession still developing stan-dards to address these complicating factors, software companies variedwidely in their revenue recognition practices. Critics contended that In-formix’s approach was overly optimistic.
The Picture Worsens
As the year wore on, the company’s troubles mounted. On April Fools’ Dayof 1997, Informix stunned investors by disclosing that its first-quarter saleshad fallen short of analysts’ expectations by $100 million, or 40%. Two dayslater, the company reported a $140.1 million loss for the quarter, down froma $15.9 million profit in the comparable 1996 period. Sales were 34% belowyear-earlier levels, at $133.7 million versus $204.1 million. Between March31 and April 3, Informix’s stock price plummeted by 41%.
Yet another shock arrived on May 1. Chief Financial Officer Alan Hen-ricks resigned after just three months in the position. To seasoned investors,

Revenue Recognition 127
such an abrupt departure by a senior manager represented a telltale sign oftrouble. They were not reassured when Henricks declined to explain his de-cision, even as former Informix executives reportedly said that he hadpressed for more conservative accounting policies than CEO White fa-vored.2 White denied that policy differences caused his CFO to step down,instead citing unspecified personal considerations.
Before long, White himself was contributing to the front-office turmoil.In July, under pressure from the company’s board of directors he resignedfirst as CEO and then as chairman. Meanwhile, Informix failed to meet thedeadline for filing its second-quarter financials, another classic red flag forinvestors. When the quarterly filing belatedly arrived on August 7, it re-vealed a loss of $120.5 million, including a $62.1 million charge for re-structuring costs. Informix’s operating loss of $80.5 million before thespecial charge was larger than analysts had expected.
The charge for restructuring costs showed that the financial reportingcontroversy was heating up, rather than simmering down. To correct earlierinstances of improper revenue recognition, Informix announced that itwould reduce its previously reported 1996 revenue of $939.3 million by$70 million to $100 million. According to new chief executive officerRobert Finocchio, the company had booked some transactions in the wrongperiods and others without proper documentation. He added that Informixwould recognize some of the revenues in future quarters, but the rest woulddisappear.3 The company’s investigation of past accounting practices haduncovered forty incidents of improper recognition, primarily in Japan, theUnited Kingdom, Germany, and Central and Eastern Europe, with a fewfound in the United States.
Still, the parade of bad news continued. On September 22, Informix’salready depressed share price tumbled 22% as the company announcedthat the downward restatement of 1997 revenues might be as great as $200million, twice the previously announced high-end figure of $100 million.Moreover, management revealed that the improper recognition practicesextended back to 1995, resulting in a possible revenue reduction of as muchas $50 million for that year. In certain instances, said the company, salesrepresentatives had made informal side agreements to provide resellersextra funds to finance sales.4 Informix’s 1997 10-K elaborated:
The unauthorized and undisclosed agreements with resellers introducedacceptance contingencies, permitted resellers to return unsold licensesfor refunds, extended payment terms, or committed the Company to as-sist resellers in reselling the licenses to end-users. Accordingly, licenserevenue from these transactions that was recorded at the time product
128 A CLOSER LOOK AT PROFITS
was delivered to resellers should have instead been recorded at the timeall conditions on the sale lapsed.5
Lessons for Analysts
In the end, the company restated its revenues downward by a total of $244million for the period 1994 through the second quarter of 1997. Informix ac-knowledged that it had overstated its revenue by 4.0% in 1994, 12.9% in1995, and 29.1% in 1996. This year-by-year escalation followed a frequentlyobserved pattern of falsification. Bonus-seeking managers may initially veeroff the straight-and-narrow by “borrowing” a small amount from future rev-enue, intending to “pay it back” the following year, but they instead fall fur-ther and further behind. Eventually, the gap between reported revenues andeconomic reality grows too large to sustain. Outside analysts’ skepticismmounts and closer auditing of the books unmasks the false reporting.
The Informix affair also teaches analysts not to construe auditor-certified compliance with GAAP as an assurance of integrity in financial re-porting. If senior managers set the tone by pushing the rules to their limits,executives a step or two lower in hierarchy may feel emboldened to break therules altogether. Liberal reporting differs from fraudulent reporting, in a legalsense, but a corporate culture that embraces the former can foster the latter.
In October 1997, the American Institute of Certified Public Accoun-tants reduced the wiggle room for companies such as Informix. The ac-counting body’s Statement of Position 97-2 (SOP 97-2), “Software RevenueRecognition,” superseded SOP 91-1 and at long last addressed the industry-specific complexities of determining when a sale was truly a sale. SOP 97-2required companies to recognize revenue from a software arrangement byallocating a fair value to each element, such as software products, enhance-ments, upgrades, installation, training, and post-contract customer support.Determination of each element’s fair value was to be based on objective ev-idence specific to the software vendor. The AICPA subsequently deferredthe effective date of SOP 97-2 until, with SOP 98-4 (“Modification of SOP97-2, Software Revenue Recognition with Respect to Certain Transac-tions”) in February 1998, the accounting body was able to specify whatconstituted “objective evidence.”
As a consequence of adopting SOP 97-2 as of January 1998, Informixbegan deferring some license revenues that it formerly would have recog-nized on delivery of the software. That is to say, the company took consid-erable latitude in booking revenues until the accounting professiondeveloped rules to deal with all the complexities of the software business.Investors should not have been lulled by the fact that Informix’s pre-1998

Revenue Recognition 129
financial reporting satisfied the minimum requirements of GAAP. Manage-ment’s aggressiveness painted a rosier picture than it would have been al-lowed under standards better adapted to the intricacies of the softwarebusiness.
Neither did the certification of Informix’s statements by independentauditor Ernst & Young prevent investors from receiving revenue figures thatproved too high, in retrospect. As the reliability of the company’s past fi-nancial statements became increasingly suspect during 1997, Informix feltobliged to hire a second accounting firm to advise its directors. Meanwhile,both Informix and Ernst & Young became targets of a class action suit byshareholders. The plaintiffs alleged that the company’s executives had over-stated revenues by claiming to have sold software that was merely shippedto resellers temporarily and then returned. On the strength of these fakedsales, the shareholders claimed, the officials had boosted Informix’s shareprice to facilitate their personal sales of stock. In May 1999, Ernst & Youngagreed to pay $34 million as its share of a $142 million settlement of the lit-igation. The auditor stated, as defendants often do under such circum-stances, that it settled to avoid costly litigation.6
By the time Ernst & Young accepted the financial consequences of its rolein the matter, Informix had replaced the firm with a new auditor. In dismiss-ing Ernst & Young, Informix’s board did not criticize the firm for signing offon 1994–1997 revenue figures that subsequently turned out to be overstated.The board did, however, mention a dispute over recognition of revenue fromindustrial manufacturers in the first quarter of 1998. The disagreement, inshort, arose well after the earlier improper booking of sales came to light andnew management controls were implemented. According to Informix, thecompany resolved the dispute to Ernst & Young’s satisfaction, deferred ap-proximately $6.2 million of revenue, and underwent yet another restatementof its financials. Ernst & Young responded that Informix’s statement was in-complete. Shortly before its dismissal, said the auditing firm, it had informedthe board’s audit committee that a lack of necessary resources in Informix’sfinancial reporting departments had created difficulty in accumulating theaccurate information required for timely disclosure. This condition was a ma-terial weakness, in Ernst & Young’s view.7
To an outside analyst, it appeared that Ernst & Young ran into conflictwith Informix for enforcing strict standards in 1998 after being sued byshareholders for alleged laxity in earlier years. Dismissal of Informix’s audi-tor was one more classic warning sign for analysts, on top of the seniormanagement upheavals and delayed financial statement filing of 1997.Events throughout 1997 and 1998 reinforced an essential point about rev-enue recognition: Even when an independent accounting firm certifies that

130 A CLOSER LOOK AT PROFITS
a company’s financials have been prepared in accordance with generally ac-cepted accounting principles, the analyst must stay alert for evidence thatthe numbers misrepresent the economic reality.
CALLING THE SIGNALS
Aspiring analysts should extract at least one invaluable lesson from thestudy of Informix’s aggressive revenue recognition: Staying alert to evidenceof flawed, or possibly fraudulent, reporting is essential, even when the audi-tors put their blessing on the numbers. Exactly what sort of evidence shouldone look for, however?
The specific answer is not the same in every case. As a rule, though, dis-torting one section of the financial statements throws the numbers out ofwhack in some other section. Assiduous tracking of financial ratios shouldraise serious questions about a company’s reporting, at a minimum. To il-lustrate this point, let us consider another example from the computer soft-ware industry.
KnowledgeWare’s chief executive officer was Pro Football Hall of Famequarterback Fran Tarkenton. After retiring from the National FootballLeague in 1978, the one-time record-holder in touchdowns and passingyards founded Tarkenton Software, which he merged with KnowledgeWarein 1986. Specializing in client-server development tools, a type of softwareused in creating programs for networked personal computers, the companycame to be regarded as an emerging star in its industry. In the early 1990s,however, KnowledgeWare fell behind its competitors in adopting new tech-nology8 and overextended itself through a series of acquisitions.9 As thecompany’s new products failed to take off, KnowledgeWare began report-ing losses and in July 1994 laid off a quarter of its workforce. With opera-tions reporting negative cash flow, KnowledgeWare “appeared to be closeto being out of money,” according to an industry analyst.10
At that point, Tarkenton, who was renowned as a scrambler during hisprofessional football days, managed to get KnowledgeWare out of an ex-tremely tight spot. On August 1, 1994, the company announced an agree-ment to be acquired by Sterling Software. Sterling, a leader in electroniccommerce and systems software, agreed to pay 0.2893 shares of its com-mon stock for each KnowledgeWare share, producing a purchase price ofapproximately $143 million.
The rebound in KnowledgeWare’s fortunes proved short-lived, however.Within a month of its pact with Sterling, the company announced a $19.0million loss for the fiscal year ending June 30, 1994. In addition to recording

Revenue Recognition 131
$15.4 million of red ink in the fourth quarter, KnowledgeWare restated itsearnings for the first nine months. The previously reported $4.46 millionprofit turned into a $3.6 million loss and the company’s stock price plungedby 45% in one day.
KnowledgeWare’s new travails arose from a decision implemented dur-ing fiscal 1994. In an effort to boost revenues, the company began supple-menting its own sales force’s efforts with agreements to market its productsthrough resellers. Almost immediately, the company started to encounterdifficulties in collecting receivables generated by the resellers. In restatingthe results, management said that it had booked as revenues certain salesfor which collections were not made.
The revelation of financial reporting problems initially threatened toscuttle the acquisition by Sterling Software.11 In the end, though, Sterlingagreed to go ahead on revised terms. Instead of paying 0.2893 of its ownshares for each of KnowledgeWare’s, Sterling slashed its offer to 0.1653shares. Furthermore, Sterling announced that it would acquire only 80% ofKnowledgeWare’s stock for the time being. The other 20% of the purchaseprice would go into escrow as a contingency for possible lawsuits by Knowl-edgeWare shareholders.
Fran Tarkenton succeeded in obtaining approval of the reduced terms,but the shareholders’ meeting was testy. Sterling’s concerns about possiblelawsuits had proven well founded, with the plaintiffs alleging that man-agement had inflated KnowledgeWare’s stock price by misrepresenting thecompany’s financial condition. An attorney representing the disgruntledshareholders attempted to query Tarkenton about the merits of the Ster-ling offer, but the wily ex-quarterback refused to take questions.12 Hisstiff-arm tactics worked. The favorable shareholder vote eliminated thefinal obstacle to the merger. By the terms of the agreement, Tarkentongained a seat on Sterling’s board and a three-year consulting agreement at$300,000 per annum.
Despite all his nimbleness, Tarkenton failed to emerge from the affairentirely unscathed. In 1999, the Securities and Exchange Commissioncharged him with directing a plan to overstate KnowledgeWare’s revenuesand profits during 1993 and 1994. According to the allegations, the com-pany recorded sales in instances in which distributors were told that theydid not have to pay for software unless they succeeded in reselling it. TheSEC claimed that the objective was to convince investors that Knowledge-Ware was making a comeback from its fiscal 1992 operating loss.13
Tarkenton settled the SEC charges by paying a $100,000 civil penalty anddisgorging an amount equivalent to the bonus he received as a consequence ofthe overstated profits—$54,187, plus interest. His attorney hastened to say

132 A CLOSER LOOK AT PROFITS
that his client had neither admitted nor denied the charges and was“pleased to have this matter behind him.” Continuing in a vein familiar toaficionados of financial reporting scandals, the lawyer added, “The eventsin question took place about five or six years ago during Mr. Tarkenton’stenure at KnowledgeWare, and he has long since moved on with his life andto other business ventures.”14
To be fair, KnowledgeWare amended its financial reporting practicesonce the receivables problem came to light. The company altered its methodof recognizing revenue to bring reported results into line with the collectionexperience in its reseller program. Under the new, more conservative policy,KnowledgeWare recognized software license revenue from resellers only onreceipt of payment. Reasonably enough, the company continued to booksales on shipment when it sent the goods directly to end users, as long asspecific credit information was available to form a reasonable basis for esti-mating the collectibility of the receivables.
Fixing the accounting problem after the fact, however, did not help in-vestors who valued KnowledgeWare on the basis of its originally reportedprofits. Analysts had to rely on their own devices to identify the potentialfor an earnings restatement before the disclosure devastated Knowledge-Ware’s stock price. At least a few analysts, it appears, did just that. Aroundthe time that the Sterling Software deal was announced, some analysts werereportedly worried that liberal revenue recognition would lead to a write-off.15 They could have drawn that inference by careful scrutiny of standardfinancial ratios.
Exhibit 6.1 shows that revenues and receivables began moving out ofsync from the moment KnowledgeWare launched its reseller program. Inthe first quarter of fiscal 1994 (ending September 30, 1993), revenuesdropped by 15.5% from the preceding quarter, yet receivables rose by
EXHIBIT 6.1 Revenues and Accounts ReceivableKnowledgeWare, Inc. ($000 omitted)
Quarter Ending
1993 1994
June 30 September 30 December 31 March 31
Revenues $40,426 $34,144 $38,178 $38,928Accounts receivable 36,894 37,084 41,506 50,252Days sales outstanding* 83 98 100 117
*As reported by company.Source: KnowledgeWare Forms 10Q and 10K.

Revenue Recognition 133
0.5%. Management’s discussion and analysis in the Form 10-Q for the pe-riod noted that in terms of days sales outstanding, receivables leaped from83 to 98 days. The adverse trend continued, with DSO growing to 100 daysin the second fiscal quarter, then soaring to 117 in the third, when receiv-ables increased by 21.1% on nearly flat revenues. By the end of the third fis-cal quarter (March 31, 1994), accounts receivable stood roughly one-thirdhigher than at the preceding fiscal year-end, even though revenues hadfallen slightly.
To seasoned financial analysts, the diverging trends of revenues and re-ceivables looked worrisome even in fiscal 1994’s first quarter. Manage-ment’s discussion of the matter, however, was as brief as its analysis wasthin. The “Liquidity and Capital Resources” section of the MD&A for Sep-tember 30, 1993, elaborated on the data only to offer the encouraging newsthat the percentage of gross trade accounts receivable subject to paymentterms beyond 90 days had fallen from 25.0% to 21.7% during the quarter.The change implied that KnowledgeWare would be able to convert assets tocash more swiftly than formerly, thereby bolstering its liquidity. On the faceof it, the quality of KnowledgeWare’s receivables was improving, possiblyoffsetting concerns about their increasing quantity. In the quarter endingDecember 31, 1993, management proudly reported a further drop in theportion of receivables dated beyond ninety days, to 10.4%.
During the quarter ending March 31, 1994, according to Knowledge-Ware’s Form 10-Q, the percentage declined once again, to 9.4%. Curiously,though, the company now indicated that the beyond-90-days ratio on June30, 1993 had been 17.8%, rather than 25.0%, as previously reported.Management did not explain the discrepancy or even draw attention to it.Analysts had to discover the restated number by comparing the latest 10-Qwith its predecessors.
The March 31, 1994, report also contained several entirely new dis-closures:
� On top of the 9.4% of receivables subject to payment terms beyond 90days, another 16% were subject to government funding provisions andwould likely take more than 90 days to collect. Federal and state gov-ernment agencies, which are generally slow to pay, represented a grow-ing portion of KnowledgeWare’s business.
� Notwithstanding the relative decline in receivables dated beyond 90days, the number of transactions with “extended payment terms” (notspecifically defined) was growing.
� Resellers in the nongovernment market accounted for approximately6.2% of revenues for the three months ending March 31, 1994. Manyof the resellers, said KnowledgeWare, were not well capitalized and

134 A CLOSER LOOK AT PROFITS
therefore represented greater credit risk than the company’s typicalend-user customers. KnowledgeWare compounded the inherent creditrisk of dealing with resellers by offering them payment terms in excessof 90 days. Management hoped that the generous terms would induceresellers to initiate, increase, or accelerate revenues.
� On March 31, 1994, KnowledgeWare had $3.1 million of accounts re-ceivable (6.1% of the net total) that were past their due date by 90 daysor more.
In summary, the receivables-related bombshell that KnowledgeWaredropped on August 30, 1994 was telegraphed by a simple comparison ofrevenues and receivables in KnowledgeWare’s 10Q for the first fiscal quar-ter, received by the SEC way back on November 2, 1993. The companyblunted the impact of that danger signal by stressing the declining ratio ofreceivables subject to payment terms beyond 90 days. Days sales outstand-ing continued to escalate over the following two quarters, however. In thefiscal third-quarter report, KnowledgeWare suddenly began disclosing addi-tional, less upbeat, details about its receivables. Battle-scarred analysts of fi-nancial statements would have guessed that management’s increased candorwas the product of external prodding. To those alert enough to notice theunexplained change in the previously reported receivables-beyond-90-daysratio for the end of fiscal 1993, the sense of impending disaster should havebecome inescapable. By the middle of May 1994, more than three monthsbefore KnowledgeWare’s restatement, the company’s reported revenueswere highly suspect. Not even the great Fran Tarkenton, in his glory days inthe National Football League, benefited from so many tip-offs of his oppo-nents’ moves.
An Income versus Cash Disparity
The financial statements of a computer manufacturer likewise telegraphedfuture problems in the area of revenue recognition. Shortly before KendallSquare Research’s October 1993 revision of its previously reported earn-ings, a research service known as Financial Statement Alert warned that thecompany was recognizing revenues too early.
Kendall Square reported $45.4 million in revenue in the first six quar-ters after it went public in March 1992. Loren Kellogg, copublisher of Fi-nancial Statement Alert, compared this income statement information witha figure from the company’s statement of cash flows. Over the same 18-month period, Kendall Square’s “cash received from customers” was just$25.7 million. Kellogg viewed the $19.7 million disparity between the two

Revenue Recognition 135
numbers as evidence that a large proportion of sales being booked byKendall were dubious.
The warning proved prescient. Less than a month after Kellogg’s analy-sis was reported in The Wall Street Journal, Kendall Square disclosed that itsthird-quarter 1993 revenues would be “substantially below” securities ana-lysts’ expectations. In lieu of earnings per share of 11 cents (the consensusforecast according to the forecast-tracking firm of Zacks Investment Re-search), the company said that it would report a loss. Additionally, KendallSquare delayed the release of its third-quarter earnings and announced theresignation of its senior vice president/treasurer, who had joined the com-pany only a month earlier. All these developments, by the way, were classicindications of serious corporate problems.
Revenue recognition controversies were central to Kendall Square’s dif-ficulties. The company indicated that although third-quarter shipmentswere “generally in line with expectations,” there was some question aboutthe proper amount of revenue to recognize from the shipments. JeffryCanin, an analyst at Salomon Brothers, speculated about a possible area ofdisagreement within the company. Some officials, he suggested, may haveobjected to counting as revenue rebates that might have been given to cus-tomers who agreed to upgrade to Kendall’s next generation of computers.Smith Barney Shearson analyst Barry Bosak proposed the possibility thatKendall Square had been hurt by its reliance on sales to universities. A num-ber of these institutions, which were in turn dependent on diminishing gov-ernment funding, proved unable to pay. Indeed, some critics insinuated thatKendall Square had made research grants to educational institutions as quidpro quos for orders, a charge that management denied.
At any rate, Kendall Square’s troubles continued, as auditor Price Wa-terhouse withdrew its clean opinion from the company’s 1992 financialstatements. Management revealed that the year’s sales figure, originally re-ported as $20.5 million, included $4.2 million of “improperly recognized”revenue. Unaudited numbers for the first half of 1993 would also require re-statement, the company added.
In the wake of these announcements, Kendall Square demoted and thenfired its president, its chief financial officer, and the head of its technicalproducts group. The company’s acting chief executive officer announcedthat henceforth, Kendall Square would concentrate on building computersto order, instead of creating inventories in anticipation of orders. That re-form was likely to reduce problems associated with revenue recognition,but by the time it was introduced, the damage to users of financial state-ments was substantial. At 71⁄2, the company’s stock price was down byabout 70% from its peak three months earlier.16

136 A CLOSER LOOK AT PROFITS
ASTRAY ON LAYAWAY
On August 9, 2000, Wal-Mart Stores reported a 28% year-over-year in-crease in net income for its fiscal second quarter ending July 31. At $0.36,earnings per share (diluted) were up by 29%. Sales rose by a healthy 20%,climbing 5% at Wal-Mart units open for more than one year.
In light of these results, which one analyst characterized as “a verygood quarter,” the discount chain’s share price might have been expected torise. At the very least, investors would have expected the stock to holdsteady, given that the EPS increase was in line with Wall Street analysts’ con-sensus forecast, as reported by First Call/Thomson Financial. As it turnedout, however, Wal-Mart’s shares fell by $4.375 to $53.125. That repre-sented an 8% decline on a day on which the Dow Jones Industrial Averagechanged only modestly (down 0.6%).
Both the Wall Street Journal17 and the Bloomberg newswire18 linked theparadoxical drop in Wal-Mart’s stock to an accounting change that was ex-pected to reduce the following (third) quarter’s earnings. The retailer’s man-agement advised analysts to lower their earnings per share estimates for theAugust-to-October period by one-and-a-half to two cents, to reflect a shiftin the company’s method of accounting for layaway sales. In such transac-tions, customers reserve goods with down payments, then make additionalpayments over a specified period, receiving their merchandise when theyhave paid in full. Prior to the change in accounting practice, which FAS 101made mandatory, Wal-Mart booked layaway sales as soon as it placed themerchandise on layaway. Under the new and more conservative method, thecompany began to recognize the sales only when customers completed therequired payments and took possession of the goods.
According to one analyst, Wal-Mart’s 8% stock price decline repre-sented “somewhat of an overreaction.” In reality, the price drop was anoverreaction in its entirety. Changing the accounting method altered neitherthe amount of cash ultimately received by the retailer nor the timing of itsreceipt. The planned change in Wal-Mart’s revenue recognition processtherefore entailed no loss in time value of money. Lest anyone mistakenlycontinue to attribute economic significance to the timing of the revenuerecognition, Wal-Mart explained that the small reduction in reported earn-ings in the third fiscal quarter would be made up in the fourth. On top ofeverything else, management had already announced the accounting changeprior to its August 9 conference call.
An institutional portfolio manager spoke truly when he called the mar-ket’s reaction to the supposed news “more confusion than anything else.” Iftaken at face value, the press reports indicate that investors bid the shares

Revenue Recognition 137
down on “news” that was both dated and irrelevant. Alternatively, investorsmay have had other reasons for driving down the shares. For one thing,store traffic declined in the three months ended July 31 from the precedingquarter’s level. Additionally, German operations posted a larger loss thanmanagement had forecast. If these events were the true causes of Wal-Mart’s slide, then the Wall Street Journal and the Bloomberg newswireerred in attributing the sell-off to an accounting change with no real eco-nomic impact. Either way, confusion reigned; the only question is whether itwas the investors or the journalists who were confused.
RECOGNIZING MEMBERSHIP FEES
Bally Total Fitness provided another case in which questions about revenuerecognition contributed to an unfavorable stock market reaction to seem-ingly upbeat earnings news. On July 30, 1998, the health club chain re-ported diluted earnings per share of $0.08, up from a year-earlier loss of$0.59. According to the Wall Street Journal,19 the improved profits were“unexpectedly encouraging.” They suggested that the success of the com-pany’s newer, more upscale clubs was bolstering overall performance. In themonth following the earnings report, however, Bally’s shares declined by44%. The Dow Jones Industrial Average fell by a less severe 16% over thesame period. In the wake of Bally’s report, moreover, short sales (represent-ing bets that the price would fall) accounted for 15% of all outstandingshares. During the first quarter of 1998, the company’s short interest ratiofluctuated in a range of 3% to 5%.
Investors were unwilling to accept Bally’s earnings increase at face valuebecause of the company’s growing reliance on memberships that it fi-nanced, as opposed to selling for cash. Bally’s financed customers’ initialmembership fees, which ranged from $600 to $1,400, for up to 36 months,charging annual interest rates of 16% to 18%.20 (Ongoing dues representedjust 27.9% of net revenues, with approximately 90% of members paying anaverage of only about seven dollars a month in 1998.) On the whole, thecompany’s reported profit margins benefited from the increase in financedmemberships as a percentage of total revenues. The reported earnings,however, rested on assumptions regarding the percentage of customers whowould ultimately fail to make all of the scheduled installments.
Even under the best of circumstances, a considerable portion of anyhealth club’s new members let their memberships lapse, despite paying an ini-tial fee. As New York University accounting professor Paul Brown notes,“People have little to lose from walking away from a health-club membership.

138 A CLOSER LOOK AT PROFITS
It’s not a health-care plan we’re talking about, or even a car, which theymight need for transportation.”21
To be sure, Bally set aside reserves for uncollectible amounts, consistentwith good accounting practice. The size of the reserves, however, requiredjudgment about the credit quality of the new members. Because financedmemberships were not entirely new to Bally, management had some experi-ence on which to base its assumptions. In addition, the company had suc-ceeded in increasing the use of an electronic funds transfer payment optionin recent years. Collection rates were higher for members whose creditcards or bank accounts were automatically charged for fees than for thosebilled through monthly statements. There were risks, though, in stepping upreliance on customers who needed to borrow in order to join. As in anysales situation, aggressive pursuit of new business could result in acceptanceof more marginally qualified customers. On average, the newer membersmight prove to be less financially capable or less committed to physical fit-ness than the previous purchasers of financed memberships. If more mem-bers failed on their payments than management assumed, Bally would provein hindsight to have been too aggressive in recognizing revenue and wouldhave to rescind previously reported income.
By taking the second-quarter 1998 earnings with a grain of salt, usersof financial statements were not necessarily casting aspersions on Bally’smanagement. Rather, they were understandably applying caution in evalu-ating a company in a service industry historically identified with question-able revenue recognition practices. Some analysts sprang to Bally’s defensefollowing the Wall Street Journal’s critical article by highlighting the com-pany’s adoption of a conservative practice at the Securities and ExchangeCommission staff’s behest in July 1997. Previously, Bally had fully recog-nized initial membership fees at the time that the memberships were sold. Ahealth club operator could abuse this approach by using high-pressure tac-tics to book financed memberships for individuals who were highly unlikelyto keep up their payments. Outsiders relying on the financial statementswould perceive a growth in revenues that must, in time, prove unsustain-able. Under the new accounting treatment, Bally spread the revenues fromthe initial fees over the expected membership lives—36 months for salesmade for cash on the barrelhead and 22 months for financed sales.
The SEC’s urging of Bally’s to spread out its recognition of membershipfees was part of a broader effort extending beyond the health club industry.There was no change in the accounting principle, namely, the matching con-cept. In the case of a health club, members’ up-front fees represent pay-ments for services received over the terms of their membership. Cluboperators should therefore recognize the revenue over the period in which

Revenue Recognition 139
they render the service. During the late 1990s, the underlying theory under-went no change, but the SEC intensified its focus on membership fees afterdetermining that some companies were interpreting the rules too liberally.Among the industries that came under increased scrutiny were the member-ship club retailers. In this type of operation, consumers pay up-front fees forthe privilege of shopping at stores that sell discounted merchandise.
On October 19, 1998, BJ’s Wholesale Club switched from immediaterecognition of its annual membership fee (typically $35 for two familymembers) to incremental recognition of the fee over the full membershipterm, generally 12 months. In conjunction with the change in accountingpolicy, BJ’s restated its net income for the fiscal first half ending August 1 to$10.4 million. That was down 64% from the previously reported $28.6million. The restatement reflected a one-time charge for the accountingchange’s cumulative effect on preceding years, as well as a $1.1 million af-tertax charge arising from a change to more conservative accounting fornew-store preopening expenses.
Just a month-and-a-half before these events, BJ’s had issued a press re-lease asserting that its practice of immediately recognizing annual member-ship fees was consistent with GAAP.22 Management had also argued that nodeferral was required, on the grounds that BJ’s offered its members the rightto cancel and receive refunds for only 90 days after enrollment. A mere0.5% of members actually requested refunds. In contrast to the situation atBally Total Fitness, moreover, membership fees represented a minor portionof BJ’s revenues, 98% of which derived from merchandise sales.
Under GAAP, however, the general requirement was to spread member-ship fees over the full membership period. If a company offered refunds, itcould not book any of the revenue until the refund period expired, unlessthere was a sufficiently long history to enable management to estimate fu-ture experience with reasonable confidence. At most, BJ’s refund recordmight have entitled the company to begin booking the fees on the date thatmembers enrolled. Spreading the revenue recognition over the membershipperiod would have been mandatory in any case.23
In December 1999, the SEC staff clarified the point by issuing “StaffAccounting Bulletin No. 101—Revenue Recognition in Financial State-ments” (SAB 101). The staff stated its preference that companies not bookmembership fees until refund privileges expired. MemberWorks, a providerof membership programs offering services and discounts in a wide range offields including health care, personal finance, and travel, altered its ac-counting in response to SAB 101, effective July 1, 2000. A one-time non-cash charge of $25.7 million resulted, reflecting the deferral of previouslyrecognized membership fees.24

140 A CLOSER LOOK AT PROFITS
A POTPOURRI OF LIBERAL REVENUE RECOGNITION TECHNIQUES
By intensifying its enforcement of established revenue recognition rules inSAB 101, the SEC put a stop to techniques that the staff considered overlyaggressive. Professional Detailing, a recruiter and manager of sales staff forpharmaceutical companies, had to stop including in revenues the reim-bursements that it received from clients for placing help wanted ads. Withina month, the company’s share price fell by 31%. Physician & Hospital Sys-tems & Services, a unit of National Data Corporation, abandoned its long-standing policy of booking revenues for its back-offices services not merelybefore it completed the work, but before it mailed out bills. National Dataended the practice and took a $13.8 million one-time charge to correct theprevious pumping up of revenues. First American Financial took a cumula-tive $55.6 million charge when it embraced the matching principle by be-ginning to book revenues for loan services over the loan’s duration, ratherthan immediately.25
Percentage-of-Complet ion Method
Under certain circumstances, a company engaged in long-term contractwork can book revenue before billing its customer. This result arises fromGAAP’s solution to a mismatch commonly observed at construction firms.A variety of service companies, defense contractors, and capital goods man-ufacturers come up against the same accounting issue.
Typically, the company agrees to bill its customers in several install-ments over the life of the contract. The billing may lag behind the com-pany’s incurring of expenses to fulfill its obligations. Without some meansof correcting this mismatch, reported profit will be inappropriately high inthe contract’s early stages and inappropriately low in the late stages.
GAAP addresses the problem through the percentage-of-completionmethod, which permits the company to recognize revenue in proportion tothe amount of work completed, rather than in line with its billing. The per-centage-of-completion method can rectify the mismatch, but may also en-tail considerable subjectivity. This is particularly so when the companyspecializes in finding creative solutions to particular companies’ uniqueproblems, a sort of work that cannot be readily measured by engineeringstandards. Management can speed up revenue recognition on such con-tracts by making assumptions that are liberal, yet difficult for the auditorsto reject on objective grounds. As is generally the case with artificial accel-eration, taking liberties with the percentage of completion borrows futurerevenues, making a surprise shortfall inevitable at some point.

Revenue Recognition 141
Crossing the L ine
In the foregoing cases, the regulators merely complained that the com-panies’ existing revenue recognition policies painted too rosy a picture, butin other instances the management has been accused of misrepresentation.For example, in 1996, the SEC claimed that computer manufacturer Se-quoia Systems and four former executives engaged in a “fraudulentscheme” aimed at inflating the company’s revenue and income. Accordingto the complaint filed in U.S. District Court in Washington, the ex-chair-man and three other officials booked letters of intent as revenue, backdatedsome purchase orders, and granted customers special terms that Sequoianever disclosed. Furthermore, charged the SEC, the executives profited fromthe scheme by selling stock before a true picture of the company’s financialcondition emerged. The company and its former officials settled the SEC’scivil charges without admitting or denying guilt.26
Loading the Distribut ion Channels
A classic technique that manufacturing companies use to exaggerate revenuesover the short run is to “load” their distribution channels. Loading consistsof inducing distributors or retailers to accept larger shipments of goods thantheir near-term sales expectations warrant. This produces a temporary bulgein the commercial customers’ inventories, which they must work off by re-ducing purchases in later periods. By loading the distribution channels, themanufacturer reports higher current-period revenue than it would have oth-erwise. The apparent gain is necessarily offset, however, by lower reportedrevenue down the road. Loading does not boost physical sales volume, butmerely shifts the timing of its recognition as reported revenues.
As a further distortion of economic reality, the distributors will proba-bly agree to accept higher-than-necessary inventories only if the manufac-turer offsets the resulting increase in their inventory-financing costs bygranting price concessions. In so doing, the manufacturer reduces its bonafide profits to make earnings seem higher in the near term. Loading there-fore creates the appearance of higher company value (based on the impliedtrajectory of profits) but the reality of lower value.
Worse still, the manufacturer may try to bolster revenues indefinitely byloading the distribution channels year after year. Inevitably, the underlyingtrend of final sales to consumers slows down, at least temporarily. At thatpoint, the manufacturer’s growth in reported revenue will maintain its trendonly if its distributors take on even bigger inventories, relative to their sales.If the distributors balk, the loading scheme will unravel, forcing a sizablewrite-off of previously recorded profits.

142 A CLOSER LOOK AT PROFITS
Through a Lens Darkly
At a special December 13, 1993, meeting, according to a Business Week re-port,27 Bausch & Lomb (B&L) informed its 32 independent contact lensdistributors of a new policy. Going forward, the company would makefewer direct shipments to eye doctors and do a larger portion of its businessthrough the distributors. On the face of it, the distributors appeared to bebig winners under B&L’s revised strategy. Lens division head Harold O.Johnson then revealed a substantial quid pro quo. To meet the increased de-mand, he said, the distributors would have to expand their lens inventories.
B&L’s sales representatives promptly presented distributors with listsof the products they were expected to buy. The distributors were dismayedto learn that they would have to pay carrying costs on inventories equivalentto as much as two years’ sales. Furthermore, they discovered that B&L’sprices were 50% or more above the levels of just three months earlier. Totop it off, Johnson told the distributors that they would have to purchasesthe lenses by December 24, when the company closed its books for the year.Any firm that refused to accept its quota, he added, would lose its distribu-torship. By January 1994, B&L had terminated the two distributors that re-jected the new arrangement.
Bausch & Lomb’s aggressive stance in December 1993 may not havegenerated much Christmas cheer among its contact lens distributors, butthe near-term impact on reported earnings was like a gift from Santa. Thecompany loaded $25 million into the distribution channels in the last fewdays of the year, raising 1993 lens sales by 20%, to $145 million. Half ofthe division’s $15 million of earnings for the year were attributable to theenforced buildup of distributors’ inventories.
To outside analysts, it was not clear that the fourth-quarter sales rise re-sulted from channel-loading, rather than increased consumer demand forB&L lenses. Presumably, the distributors’ inventory-to-sales ratios rose asthey reluctantly stocked up on lenses, a classic clue that something was outof kilter. Those private companies’ financial statements were not generallyavailable to analysts, however. As a consequence, investors were caught offguard in June 1994, when the company announced that its results for theyear would suffer as a result of “high distributor inventories” in both con-tact lenses and sunglasses. Between May 31, 1994, just prior to the disclo-sure of the inventory problem, and the end of the year, the company’s stockplunged by 31.2%, a far worse performance than the 2.0% rise in the DowJones Industrial Average over the same interval.
The ostensible rationale for Bausch & Lomb’s stepped-up inventoryrequirement, a shift toward greater reliance on distributors, was some-what undercut by the company’s continued direct sales to high–volume

Revenue Recognition 143
eye doctors and optical retailing chains. An executive of one small chain re-ported that early in 1994, he was able to buy a particular type of lens di-rectly from B&L at 75% of the price that the distributors were charged.Many distributors saw their sales rise in response to the company’s newstrategy, but by only modest amounts.
As for B&L’s insistence that the distributors place new orders by De-cember 24, 1993, even though they said their inventories were already highas a result of an earlier promotion in September, one distributor’s contactlens marketing manager commented, “It was just a blatant attempt to maketheir numbers.” For lens chief Johnson, it appears, achieving sales targetswas an outcome much to be desired. According to the company’s proxystatement, he received a 64% bonus on top of his 1993 salary of $275, 000for performance “substantially in excess” of corporate goals. (B&L laterdeclined to discuss Johnson’s compensation, but claimed that the year-endsales surge accounted for just “a small fraction” of the bonuses received bycontact lens executives.)
Business Week contended that in addition to presenting an overly rosyimpression of consumer demand for its contact lenses, Bausch & Lomb im-properly recognized the revenue generated by its channel-loading. Generallyaccepted accounting principles forbid the recognition of a sale until the riskof owning the goods has passed from buyer to seller. According to BusinessWeek, however, the loading up of the distribution channels prior to year-end1993 did not meet that standard:
In interviews with more than a dozen of B&L’s distributors, most tell aremarkably similar tale: Company executives promised that the distrib-utors wouldn’t have to pay for the lenses until they were sold and saidthat a final payment would be renegotiated if the program flopped.28
B&L executives admitted telling distributors that during the first sixmonths of the new arrangement, they would have to pay only for the mer-chandise they sold. The company officials insisted, however, that final pay-ment was unequivocally due in June 1994. Nevertheless, in October 1994 thecompany agreed to take back approximately three-quarters of the December1993 shipments and discount the remainder. By then, Harold O. Johnson hadstepped down as head of the lens division and shareholders had filed a classaction accusing B&L of falsely overstating its sales and profits.
The Bausch & Lomb affair teaches the valuable lesson that analystswho uncover solid evidence of inaccurate financial reporting should stick totheir guns, even in the face of indignant and vehement denials by corporatemanagement. Franklin T. Jepson, B&L’s vice president of communications

144 A CLOSER LOOK AT PROFITS
and investor relations immediately decried Business Week’s December 1994report as an “unwarranted assault on the reputation and ethics of Bausch &Lomb” and “the product of poor editorial and journalistic judgment.”29
His comment appeared in a B&L press release that claimed Business Week’sarticle “falsely allege[d] the company may have improperly accounted forsales related to” its December 1993 marketing program. The press releasefurther stated:
� Company officials had not represented that lenses sold in the specialprogram were returnable if unsold.
� The distributors understood that the sales were final and irrevocable.
� B&L’s financial and accounting staff, as well as its independent ac-countants, continued to believe that questions about revenue recogni-tion were unmerited.
A month after issuing its strongly worded press release, Bausch &Lomb conceded that a reexamination by Price Waterhouse and a second in-dependent accounting firm “identified certain items which were inappropri-ately recorded as sales.”30 According to the newest comment, the companycontinued to believe that the improperly recognized revenue was immaterialto 1993 full-year results and that the accounting for the contact lens divi-sion’s special marketing initiative was appropriate. At the same time, B&Lnoted, the Securities and Exchange Commission staff had begun an inquiry“apparently prompted” by the program.
In October 1995, the company’s board named four independent direc-tors to a committee to review the 1994 internal review that produced an es-sentially clean bill of health. Three months later, B&L restated 1993 resultsfor its contact lens and sunglass businesses. The downward revisions, whichB&L had said a year earlier it believed would be immaterial, totaled $42.1million in sales and $17.6 million in earnings. Those numbers were hardlyinconsequential, compared with originally reported fourth-quarter 1993revenues of $479.1 million and a loss of $62.9 million. The company addedthat its 1994 results would rise by corresponding amounts.31
By the time B&L disclosed the restatement, Chairman and Chief Exec-utive Officer Daniel Gill had announced that he would step down from hisposts at the age of 59, an action attributed by some observers to the com-pany’s lackluster earnings.32 Outside analysts could not know all of the in-ternal machinations that led to the 1993 special marketing program, butthe subsequent resignations of both the contact lens division’s head and theCEO made it plausible to suppose that senior management was indeedunder pressure to make the numbers.

Revenue Recognition 145
After six months of internal investigation, though, B&L’s committee ofoutside directors concluded that the company’s top executives were not toblame for the accounting improprieties. Without issuing a written report,the committee characterized the January 1996 restatement of contact lensand sunglass earnings as “appropriate” and said that control procedureshad been strengthened. Committee chairman William Balderston III addedthat no future meetings were planned.33
The committee had added credibility to its findings by hiring GaryLynch, former director of enforcement for the SEC, to assist in the investi-gation. Some seasoned observers of such inquiries, however, said that it wasimpossible to assess the quality of an internal investigation without infor-mation on the methods employed and the basis for its conclusions. “An in-vestor can’t find comfort in just the reputation of the investigator,”shareholder advocate Ralph Whitworth asserted. Commented attorneyEdwin H. Stier, “A lot of what is called an independent investigation is re-ally advocacy.”34
In any case, Bausch & Lomb’s step-by-step retreat in the months fol-lowing the December 1994 Business Week article is instructive. The com-pany began by saying that the magazine “flagrantly disregarded factspresented to the magazine’s reporter.”35 A month later, the company fellback to the position that immaterial amounts of revenue had been recordedimproperly. Eventually, management conceded that the incorrect accountingwas material enough to warrant a $42.1 million restatement. In light of thissequence, which has countless parallels in the annals of financial reportingcontroversies, users of financial statements should not be intimidated bycorporate press releases that denounce allegedly irresponsible securities an-alysts and journalists.
Making the Numbers . . . Up, i f Necessary
An executive on the receiving end of Bausch & Lomb’s 1993 channel-loadingescapade cited a desire to “make the numbers” as a motive for the lens divi-sion’s pumping up of its reported revenues. In the achievement-orientedworld of business, gung-ho salespeople sometimes go so far as to make thenumbers up. A desire for bragging rights, rather than revenue figures, ap-pear to have caused General Motors’ Cadillac division to exaggerate its1998 performance.
In December of that year, GM’s luxury car unit was trailing its arch-rival, Ford’s Lincoln division, in the annual competition to make the most finalsales of vehicles to motorists. Cadillac’s six-decade reign as the top Americanluxury car brand was in jeopardy. This danger was regarded as nothing

146 A CLOSER LOOK AT PROFITS
short of apocalyptic, reflecting a strong view among auto industry executivesthat capturing the number-one position in a product category conferred avaluable marketing advantage.36
When Cadillac announced December results in January 1999, however,it appeared that the hard-charging sales force had achieved a come-from-behind victory straight out of Chariots of Fire, the cinematic epic of theOlympiad. According to the division’s report, sales surged from 13,698 inNovember to a remarkable 23,861 in December. Even more astonishingly,and implausibly, in the view of many observers, sales of Cadillac’s Escaladesport-utility vehicle skyrocketed from 960 to 3,642 in the space of a month.
After Escalade volume mysteriously receded to just 225 in January 1999,Lincoln’s executives quietly began circulating data from the consumer market-ing company R. L. Polk. The figures showed a sizable discrepancy between thenumber of cars that Cadillac claimed to have sold and the number registeredby consumers during December. Cadillac officials responded by vehementlydenying that its reported sales reflected any improper manipulation.
In May 1999, however, General Motors abruptly changed its story.Management confessed that Cadillac had inflated its December sales by4,773 vehicles. The revelation followed an internal audit that resulted invaguely described “appropriate disciplinary action.” A spokesman blamedthe false sales report on “a combination of an internal control breakdownand overzealousness on the part of some folks.”
Interestingly, the automaker added that the revision of December vehi-cle sales would not necessitate a restatement of its 1998 financials. GM’saccounting practice was to recognize a sale when a vehicle left the factoryand became the dealer’s property. The vehicles involved in the overcounthad left the factory, but had not yet been sold to consumers.
Evidently, Cadillac officials manipulated the numbers solely to beat outLincoln, rather than to puff up revenues or earnings. Strictly speaking, theaffair lay outside the realm of financial statement analysis. Still, the over-statement of Cadillac’s competitive position may have caused investors toplace slightly too high a value on General Motors stock. After all, a stock’svalue is a function of expected future earnings (see Chapter 14), whichpartly depend on the popularity of the company’s products vis-à-vis those ofits competitors.
For analysts of financial statements, Cadillac’s fib reinforces the mes-sage that when an issuer’s numbers look too good to be true, they probablyare. Generally, the initial response of corporate executives caught in a lie isto dig themselves a deeper hole, but gratifyingly often, the truth ultimatelyemerges. An equally valuable object lesson is Lincoln’s detection of the mis-chief through checking Cadillac’s figures against an independent source,

Revenue Recognition 147
R. L. Polk. Analysts who strive to go beyond routine number-crunching canprofit by seeking independent verification of corporate disclosure, evenwhen the auditors have already placed their stamp of approval on it.
Managing Earnings with “Rainy Day” Reserves
Overstating near-term reported earnings by recognizing sales prematurelyis the revenue-related abuse that creates the greatest notoriety. Analystsmust also watch out for the opposite sort of finagle, however. Sometimes,management delays revenue recognition to understate short-run profits.The motive for this paradoxical behavior is a desire to report the sort ofsmooth year-to-year earnings growth that equity investors reward with highprice-earnings multiples (see Chapter 14).
Steady earnings growth rarely occurs naturally. A company can pro-duce it artificially, however, by creating a “rainy day” reserve. When netprofit happens to be running above expectations, management stows part ofit in a “rainy day” reserve. Later on, when the income is needed to boost re-sults to targeted levels, management pulls the earnings out of storage.Smoothing the bottom line is not uncommon, but companies are touchyabout the subject.
Chemical producer W. R. Grace reacted with indignation when it wasaccused of managing its earnings through improper reserves. On December22, 1998, the Securities and Exchange Commission charged the companyand six of its former executives with falsely reporting earnings over the pre-ceding five years by improperly shifting revenue. Grace followed the stan-dard script, declaring that it would “vigorously contest”37 the charges,stating its belief that its financial reporting was proper, and pointing outthat its outside auditors had raised no objections to the accounting. An at-torney for former Grace chief executive officer J. P. Bolduc, who was amongthe accused executives, said that his client would fight the charges and ex-pected to be vindicated. The SEC, complained the lawyer, was trying topunish Bolduc for carrying out his duties exactly as he should have.
The SEC specifically alleged that Grace had declined to report $10 mil-lion to $20 million of revenue that its kidney dialysis services subsidiary,National Medical Care (NMC), received in the early 1990s as the result ofa change in Medicare reimbursement rules. According to the commission’senforcement division, the Grace executives reckoned that with earnings al-ready meeting Wall Street analysts’ forecasts, the windfall would not helpthe company’s stock price. Such an inference would have been consistentwith investors’ customary downplaying of profits and losses that they per-ceive to be generated by one-time events (see Chapter 3). In fact, it was

148 A CLOSER LOOK AT PROFITS
possible that the unexpected revenue would actually hurt the stock pricedown the road by causing NMC’s profits to increase by 30 %, an above-target and unsustainable level.
To solve the perceived problem of excessively high profits at NMC,Grace’s management allegedly placed the extra revenue in another account,which it later drew on to increase the health care group’s reported revenuesbetween 1993 and 1995. As an example, claimed the SEC, senior managersof Grace asked NMC’s managers to report an extra $1.5 million of incomein the fourth quarter of 1994, when corporate earnings needed a boost.
Brian J. Smith, who was Grace’s chief financial officer until July 1995,testified in a deposition that because the kidney dialysis unit could notmaintain its pace of earnings increases, “We believed that it was prudent toreduce the growth rates.”38 His attorney denied, however, that the goal wasto please Wall Street analysts by keeping reported earnings smooth, as for-mer Grace and NMC employees asserted. Smith had bona fide liabilities inmind, claimed the attorney.
A senior partner at Grace’s auditing firm, Price Waterhouse, did notagree that the additions to reserves were appropriate. Eugene Gaughan tes-tified that in 1991, he pointed out the accounting rules clearly stated thatprofits could be set aside only for foreseeable and quantifiable liabilities.GAAP did not give companies discretion to create rainy day funds.
In its year-end audit, Price Waterhouse proposed reversing the reserves,but management refused. According to the auditing firm’s records, the Graceexecutives said that they wanted a “cushion for unforeseen future events.39
(Italics added.) Eventually, Price Waterhouse allowed the additions to reservesto stand. The auditors’ decision reflected a finding that the amount placed inthe reserve was not material from Grace’s corporatewide standpoint, al-though it would be if NMC were a stand-alone company. (At the time, audi-tors generally judged an item material if it affected earnings by 5% or 10%.The Securities and Exchange Commission later established the criterion thatan event was material if it would affect an investor’s decision.)
According to Gaughan, Price Waterhouse objected again around theend of 1992, after seeing a memo that described Grace’s use of reserves toinfluence reported growth in profits, while gearing NMC executives’ incen-tive compensation to “actual results.” Another Price Waterhouse partner,Thomas Scanlon, said that he told Grace CEO Bolduc that stockpiling re-serves was wrong and would have to stop. By that time, the contents of the“rainy day” reserve had grown to about $55 million.
It appears, in short, that Grace’s 1998 statement that its auditors hadraised no objections to its accounting for the Medicare reimbursementwindfall was true only in the technical sense that Price Waterhouse issued

Revenue Recognition 149
clean financials, based on materiality considerations. As a spokeswomanfor the auditing firm pointed out, such an opinion does not imply agree-ment with everything in the statements. As late as April 1999, however,Grace was still insisting that Price Waterhouse had approved its accounting“without reservation.”40
On June 30, 1999, Grace settled the case without admitting or denyingthe SEC’s charges. The company agreed to cease and desist from further se-curities law violations and also to set up a $1 million education fund to pro-mote awareness of and education about financial statements and generallyaccepted accounting principles. Adhering again to the standard script, thecorporation explained that it settled the case “because we think it is in thebest interests of our employees and shareholders to put this matter behindus and move forward.”41
The Grace affair serves as a reminder that almost invariably, an allega-tion of irregularities in corporate financial reporting is followed by a vehe-ment, formulaic denial. No matter how offended the company purports tobe about having its integrity questioned, analysts should take the protests ofinnocence with a grain of salt. The record does not suggest that the com-panies that bray loudest in defending their accounting practices are sure tobe vindicated in the end.
Fudging the Numbers: A Systematic Problem
As the preceding examples demonstrate, manipulation of reported revenueis distressingly common. Readers may nevertheless wonder whether this dis-cussion presents too bleak a picture of human nature. Are not most peoplebasically honest, after all? To a novice analyst who has never been blind-sided by revisions of previously reported sales figures that proved mislead-ing or fraudulent, it may seem paranoid to view every company’s incomestatement with suspicion.
Harvard Business School Professor Emeritus Michael C. Jensen observes,however, that misrepresenting revenues is the inevitable consequence of usingbudget targets in employee compensation formulas.42 “Tell a manager that hewill get a bonus when targets are realized and two things will happen,”writes Jensen. “First, managers will attempt to set easy targets, and, second,once these are set, they will do their best to see that they are met even if itdamages the company.” He cites real-life examples of managers who “didtheir best” through such stratagems as:
� Shipping fruit baskets that weighed exactly the same amount as theirproduct and booking them as sales.

150 A CLOSER LOOK AT PROFITS
� Announcing a price increase, effective January 2, to induce customersto order before year-end and thereby help managers achieve their salestargets. The price hike put the company out of line with the competi-tion.
� Shipping unfinished heavy equipment from a plant in England (result-ing in revenue recognition in the desired quarter) to the Netherlands. Atconsiderable cost and inconvenience, the manufacturer then completedthe assembly in a warehouse located near its customer.
Compounding the problem of managers who play games with their rev-enues is the willingness of some corporate customers to play along. “All toooften, companies wouldn’t be able to accomplish the frauds without the as-sistance of their customers,” observes Helane L. Morrison, a district admin-istrator for the Securities and Exchange Commission.43 For example,one-third of wireless communications provider Hybrid Networks’s revenuein the fourth quarter of 1997 consisted of a sale made on the final day of thereporting period to a distributor, Ikon Office Solutions. Ikon agreed to pur-chase $1.5 million worth of modems from Hybrid, despite knowing that ithad no customers for the equipment. Hybrid closed the sale by providing aside letter essentially permitting Ikon to return the modems without payingfor them. Ikon exercised that option in 1998, yet Ronald Davies, the Ikonexecutive who handled the purchase, sent an e-mail to Hybrid denying anyknowledge of the side letter. Unfortunately, Hybrid later gave a copy of theside letter to its auditors. The SEC then sued Hybrid, which was forced torestate its revenues to eliminate the nonfinal sale of modems to Ikon. Fur-thermore, Davies received a cease-and-desist order to refrain from furtherviolations of the securities laws. In certain other recent enforcement actionsalleging improper recognition of sales, as well, the SEC has charged execu-tives of corporate customers with collusion.
How widespread are revenue recognition gambits that enrich managersbut impair bona fide profits? According to Ikon executive Davies, “It’s verycommon for a manufacturer to call you up and say, ‘I need to hit my quar-terly number, would you mind giving me a purchase order for $100,000?’”44
In the litigation surrounding W. R. Grace’s alleged delay of revenue recogni-tion to smooth earnings, the chief financial officer’s attorney defended hisclient’s action by arguing, “Any CFO anywhere has managed earnings in away the SEC is now jumping up and down and calling fraud.”45 MichaelJensen chimes in, “Almost every company uses a budget system that re-wards employees for lying and punishes them for telling the truth.” He pro-poses reforming the system by severing the link between budget targets and

Revenue Recognition 151
compensation. Realistically, however, radical reforms are not likely to occurany time soon.
Analysts therefore need to scrutinize carefully the revenues of everycompany they examine. Even in the case of the bluest of the blue chips,watching for rising levels of accounts receivable or inventory, relative tosales, should be standard operating procedure. Regardless of management’sprogrammed reassurances, conspicuous surges in unbilled receivables anddeferred income are telltale danger signals. It is imperative that analystsraise a red flag when a membership-based company’s registrations deviatefrom their customary relationship with reported sales. “Budget-gaming isrife,” says Jensen, and “in most corporate cultures, much of this is ex-pected, even praised.” Let the analyst beware.
Restatements of revenues and earnings arise in a wide range of circum-stances. Many well-publicized cases involve young companies in compara-tively new industries. Until the potential abuses have been demonstrated,managements may be able to take greater liberties than the auditors willcountenance at a later point. On the other hand, major, long-establishedcorporations are sometimes overzealous in booking sales. Mature com-panies may pump up revenues out of a desire to meet high expectations cre-ated by earlier, rapid growth.
After the fact, companies variously attribute excesses in reporting tomisjudgment, bookkeeping errors, deliberate misrepresentation by “roguemanagers,” or some combination of the three. Seasoned analysts, havingbeen burned on many occasions by revenue revisions, tend to doubt thatoverstatements are ever innocent mistakes. To gain some of the veterans’perspective, if not necessarily their jaundiced view of human nature, it isworthwhile to review a few case histories of adjustments to previouslyrecorded revenues.
In November 1991, Citicorp restated $23 million in revenues associ-ated with its credit card processing division. The bank holding companydismissed the unit’s head and several other officials, saying they had beenmisreporting data for nearly two years. Financial executives were amongthose involved in the scam, which helped to explain why it had gone unde-tected for so long. Deadpanned the Wall Street Journal, “[Citicorp] officialsdidn’t specify why the employees had been inflating revenue, although theirbonuses were tied directly to the unit’s performance.”46
Cincinnati Milacron credited an anonymous tip for its uncovering of a$2.3 million overstatement of sales in the first half of 1993. The “isolated”incident, said the company, involved a failure by the Sano plastic machineryunit to observe the “sales cutoff” rule. Contrary to Cincinnati Milacron’s

152 A CLOSER LOOK AT PROFITS
policy, Sano had counted in sales units that had not been shipped. Theobligatory firing centered on a senior manager, while others escaped withreprimands.47
First Financial Management blamed accounting errors, rather than pol-icy violations, for its restatement of revenues for the first nine months of1991. (Some of the employees at fault were fired, all the same.) The problemarose in the Basis Information Technologies subsidiary, a unit that First Fi-nancial had formed by consolidating 19 separate companies. Basis Informa-tion Technologies reportedly lost track of certain accruals of revenue, whichshould have been reduced as contracts expired. While uncovering the mess,First Financial also found that certain acquisition-related expenses had beenamortized improperly.48
In July 1993, T2 Medical placed in Fortune’s list of the 25 fastest grow-ing companies. The following month, the manager of home infusion ther-apy centers acknowledged that accounting irregularities had contributed toits remarkable sales growth. T2 (pronounced “T squared”) had evidentlyrecognized revenues on billings that neither patients nor insurers wouldcover. On the same day that T2’s financial reporting came under a cloud,the Department of Health and Human Services announced it was investi-gating possible Medicare fraud at the company. T2’s president resigned inthe wake of the disclosures, and the company’s stock price promptly fell35% to $8.875. Only three months earlier, rumors of a management-ledbuyout of T2 had been rife, with one securities analyst speculating that thestock might run to $20 in such a scenario.49
CONCLUSION
Motivational speakers assure their audiences that if they visualize success,success will follow. Some of the corporate executives who live by the self-help creed take this advice a bit too literally. Seeing conditional sales anddubious memberships, they visualize GAAP revenues, believing that real-ity will follow. They transfer their own mirage to the financial statements,pumping up their companies’ perceived market value and credit quality.When the revenues derived from wishful thinking fail to materialize, themanagers may resort to fraud to maintain the illusion. The positive men-tal attitude that overstates revenues in the early stage is no less damaging,however, than the fraud responsible at a later point. When evidence ofoverly aggressive revenue recognition appears, analysts must act swiftlyand decisively, lest they become infected by the managers’ dangerous optimism.

153
CHAPTER 7Expense Recognition
A s Chapter 6 illustrated, companies can grossly distort their earningsthrough aggressive revenue recognition. Analysts who arm themselves
with appropriate skepticism about financial statements are bound to won-der whether companies also pump up the bottom line by taking liberties inbooking expenses. The answer is resoundingly affirmative. Corporatemanagers are just as creative in minimizing and slowing down the recogni-tion of expenses as they are in maximizing and speeding up the recognitionof revenues.
AOL’S SEARCH FOR WIGGLE ROOM
In 1994, the American Institute of Certified Public Accountants created anexception to the general rule that advertising expenditures must be ex-pensed, rather than capitalized. The new rule permitted companies to capi-talize outlays for direct mail, a form of advertising that makes an offer andsolicits a direct response. To qualify for this special treatment, however, adirect mailer needed to demonstrate that it possessed historical evidencesufficient to predict response rates and, by extension, the revenue that theadvertising would generate.
America Online (AOL), a leader in the then-young field of interactivemedia, quickly adopted the new accounting method. To attract subscribers,AOL mailed millions of solicitations and, through arrangements with com-puter manufacturers, gave away free trial subscriptions. The company didnot recognize these costs as incurred. Instead, AOL capitalized the expendi-tures, then amortized them over periods of 12 to 18 months. By the end of itsfiscal year ending June 30, 1994, AOL’s balance sheet showed $37 million ofsubscriber capitalized acquisition costs. Thanks to the AICPA’s exception fordirect response advertising, AOL reported a $6.2 million net profit in fiscal1994 instead of a loss of around $6 million.

154 A CLOSER LOOK AT PROFITS
AOL defended its accounting practice by arguing that its average sub-scriber remained on its system for 32 months, far longer than its maximum18-month amortization period. The more conservative approach of expens-ing subscriber acquisition costs as incurred was the path chosen by AOL’slargest competitor, however. CompuServe reasoned that its subscribers, likeAOL’s, could cancel at any time. Moreover, there was no way to predicthow competition might heat up in an infant industry.
As early as October 1994, Forbes contributor Gary Samuels was voic-ing the skepticism of some security analysts toward AOL’s reported earn-ings.1 Investors lost none of their enthusiasm for the trendy Internet stock,however. Between the month in which Samuels’s article appeared and April1996, AOL shares rose by 624%.
Along the way, deferred subscriber acquisition costs on the company’sbalance sheet grew from $37 million in fiscal 1994 to $77 million in fiscal1995. In fiscal 1996, the company squeezed out even bigger reported prof-its by extending the amortization period for its capitalized costs to 24months. That change boosted net income by $48 million.
Pumping up earnings did not prevent the air from beginning to comeout of AOL’s stock, however. From its May 7, 1996, peak, the sharesplunged by 67% through October 14, 1996. AOL precipitated the declineby cutting the price of its online service by 63%. The move represented acompetitive response to rival providers’ low rates, as well as to the migra-tion of online services to the Internet, where most information and enter-tainment was offered to subscribers at no charge.
Investors did not buy AOL’s story that reduced fees would generateenough new subscribers to offset the revenue loss.2 A decision by Interna-tional Business Machines and Sears, Roebuck & Co. to divest their jointlyowned Prodigy Services venture underscored the lack of profitability in on-line services. AOL’s accounting made its earnings look better than rivalCompuServe’s, but the industry’s underlying economic reality was equallybad for all online providers.
By the end of fiscal 1996, AOL’s capitalized subscriber acquisition costshad mushroomed to $314 million. On October 29, 1996, the company fi-nally faced up to reality. The company announced that it would retroac-tively expense all of its capitalized subscriber acquisition costs and expenseall future marketing outlays. Management linked the abandonment of itsformer practice to a new pricing policy.
Defending the integrity of the previous accounting approach, an AOLspokesman commented, “Look at the track record. For the past 16 quar-ters, this company delivered on expectations of revenues, profits, and sub-scribers.”3 This statement skated over the fact that all of the profits that the

Expense Recognition 155
company had delivered, since inception, were wiped out by a $385 millionone-time charge that accompanied the change in accounting policy.
More than three-and-a-half years later, AOL agreed to pay $3.5 millionto settle SEC charges that it had exaggerated its earnings. The company alsoagreed to restate its fiscal 1995 and 1996 financials. In place of the one-time charge of $385 million, analysts would henceforth see the subscriberacquisition costs allocated to the periods in which they were incurred.
According to the SEC, AOL had never qualified for the exemption to thegeneral rule that advertising costs must be expensed. Amortization was per-mitted “only when persuasive historical evidence exists that allows the en-tity to reliably predict future net revenues that will be obtained as a result ofthe advertising.”4 The environment in which AOL operated in the mid-1990s, said the commission, was not sufficiently stable to make its esti-mates of future revenue reliable. Repeating a recurrent theme in the annalsof financial reporting controversies, AOL had initially managed to reportnet income, to which investors duly assigned a price-earnings multiple, byexploiting the not yet well defined accounting rules of a new industry.
As it happened, the wipeout of that income did not cause AOL to fol-low the path to extinction trod by countless other companies in similar cir-cumstances. By the time the company settled the SEC’s charges in 2000, itsshares were trading at 38 times their low point following the accountingchange. Building its subscriber base had been staggeringly expensive, butAOL had survived to become by far the largest provider of Internet access inthe United States.
Analysts hoping to get a clear picture of the company’s financial perfor-mance were not out of the woods, however. Partly to justify its earlier prac-tice of capitalizing subscriber acquisition costs, AOL had traditionallydisclosed its acquisition cost per customer and the number of canceled sub-scriptions. After switching to the more conservative approach of expensingits marketing expenditures, the company cut back to divulging only totalmarket expenses and net subscriber growth. While disclosure of these de-tails was not mandatory under the accounting rules, analysts complainedthat without the information they could not satisfactorily assess the value ofAOL’s customer base.5 Once again, AOL was shown up by CompuServe,which continued to disclose the percentage of subscribers remaining on itssystem for 3, 6, 9, and 12 months. The company justified the reduced infor-mation flow by arguing that as a result of stepped-up emphasis on advertisingrevenues, subscriptions would play a smaller role in its success in the future.
Still, AOL could not seem to shake its image as an aggressive exploiterof wiggle room in the accounting rules. In 1998, the company raised someeyebrows by employing aggressive accounting while the controversy over its

156 A CLOSER LOOK AT PROFITS
subscriber acquisition costs was still fresh in investors’ minds. Through aclever gambit, management avoided booking as a one-time gain AOL’sprofit of approximately $380 million on the exchange of its ANS Communi-cations network-services business for CompuServe’s online unit.
As noted in Chapter 3, investors attach little significance to nonrecur-ring profits and losses in valuing stocks. Therefore, a public company has astrong incentive to aggregate cumulative losses into a one-time event and tobreak up a unique, nonrecurring gain into smaller pieces and recognize itover several years. AOL achieved the latter effect by structuring the swap ofcompanies as a sale-leaseback, based on its agreement to use ANS’s servicesfor five years following the transaction.
Sale-leaseback accounting is more commonly used for individual assets,such as railcars and buildings. AOL’s use of it for an entire operating com-pany was nonetheless permissible. Several accountants commented, how-ever, that it was unprecedented in their experience.6
IBM’S INNOVATIVE EXPENSE REDUCTION
One-time gains can be transformed in even more miraculous ways thanturning them into operating income. International Business Machines hasfound a means of moving such items into its reported costs, where they sur-reptitiously reduce expenses. Instead of giving its bottom line a one-timeboost, which investors will likely attribute little value to, IBM creates the il-lusion of a more sustained improvement in operating efficiency.
During 1999, Chairman Louis Gerstner hailed IBM’s “strong expensemanagement” as a key to its recent earnings improvement.7 On the face ofit, the numbers bore him out. For the full year, the world’s largest computermanufacturer reported that selling, general, and administrative expense fellto $14.7 billion from $16.7 billion in 1998, even though total revenue in-creased to $87.5 billion from $81.7 billion. Taken at face value, IBM’s num-bers indicated that Gerstner’s team had chopped SG&A spending from20.4% to 16.8% of revenue. On closer examination, it turned out that IBMcut less fat than it appeared.
A portion of one sentence in the Management Discussion of IBM’s1999 annual report notes that the year-over-year decrease in SG&A expense“reflects the net pre-tax benefit associated with the sale of the Global Net-work.” Analysts who doggedly followed the trail to the Notes to Consoli-dated Financial Statements discovered that the pretax gain on IBM’s sale ofits Global Network business to AT&T totaled $4.057 billion. That ac-counted two times over for the year’s reduction in SG&A. Excluding the

Expense Recognition 157
benefit of the unit’s sale, one-time event, SG&A rose as a percentage ofIBM’s total revenues from 20.4% to 21.4% in 1998.
Diligent analysts could find all of this information in IBM’s annual re-port. The company did not explain, however, why it categorized a gain onan asset sale as a reduction in expenses. Accounting expert Howard Schilitwas perhaps too kind in calling the practice “pretty unusual.”8 An IBMspokesman, responding to a question raised about the treatment, said thatthe company had been putting one-time gains and charges into the “gen-eral” portion of selling, general, and administrative costs since about 1994.
The great advantage of this practice, from IBM’s viewpoint, is that itboosts operating income. A $4 billion improvement at that level is likely toboost the stock price more than the aftertax equivalent amount highlightedas a once-only occurrence. It is precisely to prevent such repackaging of re-ality that GAAP requires material gains from asset sales to appear below theline as nonoperating income. A senior accounting fellow at the Securitiesand Exchange Commission opined that IBM’s $4 billion gain on the GlobalNetwork “would seem to be material,”9 implying that it ought to bebooked as a nonoperating item. Taken together with the integration of pen-sion plan investment returns into operating income in the same year (seeChapter 10), IBM’s handling of the gain on the Global Network sale beliedChairman Gerstner’s claims to have fortified profits through effective man-agement—unless he meant earnings management.
SIMPLE ANALYSIS FOILS ELABORATE DECEPTION
Encouragingly, elementary techniques of financial statement analysis canoften expose chicanery, as demonstrated by the case of Wickes PLC.
On June 25, 1996, the British building materials retailer’s managementdisclosed that its 1995 profits and year-end shareholders’ equity were over-stated. Wickes shares promptly plummeted by 36.7%. Shares of CaradonPLC, another building materials company, traded down by as much as 5.3%on the day of the disclosure, merely because its finance director, TreforLlewellyn, had held the comparable position at Wickes up until June 1995.10
Wickes’s management explained that the accounting problem involvedrebates offered by suppliers, conditioned on sales of their products reachingagreed-on levels. Llewellyn’s successor as finance director, Stuart Stradling,said that the company had credited rebates (thereby reducing its cost ofgoods sold) before selling enough merchandise to qualify for the discounts.At the same time, Wickes assured investors that no fraud had occurred andthat the company had no plans to bring in outsiders to conduct a probe to

158 A CLOSER LOOK AT PROFITS
supplement its own internal investigation. Wickes added that there was lit-tle likelihood of chairman and chief executive officer Henry Sweetbaumbeing compelled to repay part of the bonus he had recently received, eventhough it was linked to both earnings and stock performance.11
Quickly reversing its earlier stance, Wickes hired both an accountingand a legal firm to examine its books and report on the company’s financialposition. Chairman Sweetbaum soon resigned, but the company said thatthere was no evidence that he was involved in the inaccurate accounting. Itlater emerged, however, that Wickes had given about £200,000 a year ofbusiness to Sweetbaum’s privately owned travel firm, a fact never disclosedin the financial reports.12
Over the next two months, additional details of the financial reportingproblem emerged. The prematurely booked items included not only volume-based discounts, but also payments in support of advertising and storeopenings. In some instances, new suppliers gave Wickes legitimate rebatesas part of multiyear agreements. Instead of amortizing the amounts of thelives of the contracts, the company booked them entirely in the first year.Along with every formal contract, according to sources close to the com-pany, there was a side letter containing the true terms of the deal.13
As the investigation continued, analysts’ estimates of the potential over-statement of profits escalated from £15 million to £25 million. As it turnedout, the overstatement totaled £26 million in 1995 alone, according to thereport of the specially hired outside lawyers and accountants, which Wickessummarized for its shareholders in October 1996. Prematurely booked re-bates had also inflated earnings by £14 million in 1994 and £11 million inearlier years, producing a grand total of £51 million.
In the wake of the report, former finance director Llewellyn paid back£485,000, or 92%, of his 1995 bonus, which was directly related to Wickes’sshare price. Chairman and Chief Executive Henry Sweetbaum, who had re-signed shortly after the scandal broke in June, returned £720,000, represent-ing about two-thirds of the payments he received under Wickes’s long-termincentive plan, while denying any knowledge of the scheme to overstate prof-its. The company said that Sweetbaum was not directly responsible for thesystem, implemented within the purchasing department, to conceal the termson which suppliers had made the rebates.14 At the same time, Wickes de-clared that senior management had been aware of the accounting irregulari-ties at least six months before the problems became public and “should havereacted more positively to [the] warning signals.”15
As a further outgrowth of Wickes’s October 1996 report, Britain’s Se-rious Fraud Office (SFO) launched a formal investigation into the com-pany’s overstatement of profits. Two-and-a-half years later, the SFO

Expense Recognition 159
charged ex-chairman Sweetbaum, former finance director Llewellyn, andthree other executives with fraudulent trading and making false statements.By now, events had undercut Wickes’s initial insistence that no fraud hadoccurred, its statement that there were no plans to engage outsiders to sup-plement management’s own investigation, and its contention that Sweet-baum was unlikely to have to repay a portion of his bonus. Analysts shouldlearn, from this example, to regard the statements of beleaguered com-panies with a high level of skepticism.
According to Stuart Stradling, Llewellyn’s successor as finance director,the financial misrepresentations were “extremely well concealed and diffi-cult to find.”16 He added that the deception would have remained unde-tected even longer if the company had not chanced on some previouslyunavailable documentation. The investigating accountants and lawyers in-terviewed more than 200 suppliers of Wickes to determine how many hadpaid rebates ahead of schedule. Outside analysts, working only with publicstatements, could not have pieced together all of the details of the scheme.
Interestingly, though, it was a simple income statement relationship thatfirst aroused Stradling’s suspicions. During the second quarter of 1996,sales improved, yet profits failed to rise in sympathy. Wickes had bookedthe upturn earnings earlier, through its premature recognition of rebates.Once Stradling joined the company in August 1995 and tightened up thecompany’s audit procedures, the scam had ceased to be sustainable.Wickes’s purchasing managers kept outside analysts in the dark, yet the af-fair underscores the analytical power of the elementary ratios described inChapter 13. In other instances, such ratios, appearing in published finan-cials, have signaled the breakdown of a similar ruse to borrow profits fromfuture periods.
OXFORD’S PLANS GO ASTRAY
In contrast to the carefully controlled scheme by which employees ofWickes PLC artificially reduced the company’s expenses, an utter lack ofcontrols was the source of a massive understatement of costs at OxfordHealth Plans. That difference mattered little to users of the companies’ fi-nancial reports, who were misled in both instances. In both cases, more-over, an astute reader of the income statements determined through simpleratio analysis that something was amiss.
Stephen F. Wiggins started Oxford, a Connecticut-based health mainte-nance organization (HMO), in 1984 in a spare bedroom. By 1997, the com-pany grew to 2.1 million members generating $4.1 billion of revenue.

160 A CLOSER LOOK AT PROFITS
Investors benefited richly from the Oxford’s success. A $100 investment inthe company’s 1991 initial public offering rose to $4,000 at the stock’s peakin July 1997.
Oxford’s data handling systems failed to keep up with the company’sexplosive growth. The HMO had to track billing codes for hundreds of di-agnoses, accounts for thousands of doctors, and personal data on membersthat numbered over one million by 1996. With claims beginning to back up,Oxford switched over to a new computer system created by its own people.Immediately, billing procedures began to misfire, data became corruptedthrough links between the old and new systems, and the claims-paying pro-cess broke down. The company temporarily ceased sending out monthlybills to many of its accounts, fearing that it might annoy them with incor-rect statements. By the spring of 1997, uncollected premiums owed to Ox-ford had swollen to approximately 40 % of revenue, double the percentageof six months earlier.
These revenue problems and the resulting cash flow strains were com-pounded by a loss of control over costs. As many as 30,000 customers hadtheir medical care paid by Oxford despite having withdrawn from its plans orhaving refused to pay their premiums after months of receiving no bills. In1997, Oxford’s health care cost per Medicare patient rose by 21%, aboutthree times as much as the company had projected, while revenue per patientgrew by only 4.3%. To make matters worse, the computer system breakdownprevented management from even becoming aware of the problem.17
Complaints by physicians, who were irate over Oxford’s failure to payits bills even as it was reporting robust profits, finally brought matters to ahead. New York insurance regulators investigated the company’s financesand determined that its reserves for future medical claims were inadequate.On October 28, 1997, the state’s insurance commissioner told Oxford’sboard of directors that the company would either have to adopt the correc-tive measures that he prescribed or stop enrolling new members and possi-bly even put itself up for sale. Seeing that the regulators were about tolower the boom, the company announced on October 27 that it would postits first loss ever in its third-quarter report. That day, the HMO’s stockplunged from $683⁄4 to $243⁄4. In the fourth quarter, Oxford reported a lossso large that it erased all profits reported since the company went public.On February 24, 1998, founder Stephen Wiggins resigned as chairman.
As in many other debacles involving expense recognition, rudimentaryanalysis of Oxford’s financial statements provided more than a hint of thetrouble that lay ahead. Consider the Form 10-Q report for the quarterended June 30, 1997, the last filed by the company before the Octoberbloodbath. The statement of cash flows (Exhibit 7.1) displayed the classicproblem that first gave rise to cash flow analysis (see Chapter 4). Even

Expense Recognition 161
though net earnings for 1997’s first half rose by 74.6% over the comparable1996 period, cash from operating activities deteriorated to −$107.3 millionfrom $141.8 million. The bulk of that adverse swing resulted from medicalcosts payable turning from a large cash source to a major cash use. As the notes to financial statements disclosed, Oxford advanced cash to the
EXHIBIT 7.1 Oxford Health Plans, Inc.
Statement of Cash Flows Six Months Ended June 30
($ in millions)
June June1997 1996
INDIRECT OPERATING ACTIVITIESIncome before extraordinary items $ 71.6 $ 41.0Depreciation and amortization 27.5 20.1Deferred taxes 3.9 0.2Equity in net loss (earnings) 1.0 2.0Sale of property, plant, and equipment and sale of investments—
loss (gain) (7.5)Funds from operations—other 0.2 1.3Receivables—decrease (increase) (99.7) (31.3)Accounts payable and accrued liabilities—increase (decrease) (71.9) 136.5Income taxes—accrued—increase (decrease) 17.5 14.8Other assets and liabilities—net change (49.9) (42.7)
Operating activities—net cash flow (107.3) 141.8
INVESTING ACTIVITIESInvestments—increase 20.6 6.3Short-term investments—change 111.5 (282.6)Capital expenditures 42.7 29.9Investing activities—other 0.4 0.1
Investing activities—net cash flow 48.6 (318.7)
FINANCING ACTIVITIESSale of common and preferred stock 10.3 226.8Financing activities—net cash flow 10.3 226.8
Cash and equivalents—change (48.4) 49.9
DIRECT OPERATING ACTIVITIESIncome taxes paid $ 35.0 $ 18.6
Source: Compustat.

162 A CLOSER LOOK AT PROFITS
disgruntled physicians and hospitals while it tried to get its billing proce-dures back on track, deducting the amounts from the medical costs payable.
Readers should not imagine that analysts identified these signs of trou-ble only in hindsight. Christopher Teeters, an analyst at the Center for Fi-nancial Research & Analysis, highlighted the divergence between earningsand cash flow in a report that he published ten days before Oxford’s Octo-ber 1997 bombshell. “We had no idea it was as bad as it was,” Teeters ac-knowledged. “We just saw some indicators that looked kind of strange.”18
As far back as 1994, Anne Anderson of Atlantis Investment Company notedthe haphazardness of Oxford’s membership reports. They were prone to re-statement and in some cases contained handwritten changes.
CONCLUSION
Just as companies have myriad ways of exaggerating revenues, they follow avariety of approaches in downplaying expenses. Corporate managers makeliberal assumptions about costs that may be capitalized, dilute expenseswith one-time gains, and jump the gun in booking rebates from suppliers.Sometimes they understate expenses through sheer sloppiness in their book-keeping. Like corresponding techniques of aggressive revenue recognition,misleading reporting of expenses can often be detected by careful scrutinyof financial statements. To benefit from such insights, analysts must be dis-ciplined enough to disbelieve the innocent explanations that companies rou-tinely provide for ratios that in reality reveal trouble down the road.

163
CHAPTER 8The Applications and Limitations of EBITDA
A s noted in Chapter 3, corporations have attempted in recent years tobreak free from the focus on aftertax earnings that has traditionally
dominated their valuation. The impetus for trying to redirect investors’focus to operating income or other variants has been the minimal net prof-its recorded by many “new economy” companies. Conventionally calcu-lated price-earnings multiples of such companies, most inconveniently,make their stocks look expensive. “Old economy” companies generallyhave larger denominators (the E in P/E), so their multiples look extremelyreasonable by comparison.
Long before the dot-com companies began seeking alternatives to netincome, users of financial statements had discovered certain limitations innet income as a valuation tool. They observed that two companies in thesame industry could report similar income, yet have substantially differenttotal enterprise values. Similarly, credit analysts realized that in a given year,two companies could generate similar levels of income to cover similar lev-els of interest expense, yet represent highly dissimilar risks of defaulting ontheir debt in the future.
Net income was not, to the disappointment of analysts, a standard bywhich every company’s value and risk could be compared. Had theythought deeply about the problem, they might have hypothesized that nosingle measure could capture financial performance comprehensivelyenough to fulfill such a role. Instead, they set off in quest of the “correct”single measure of corporate profitability, believing in its existence as res-olutely as the conquistadors who went in search of El Dorado.

164 A CLOSER LOOK AT PROFITS
EBIT, EBITDA, AND TOTAL ENTERPRISE VALUE
The fictitious case of Deep Hock and Breathing Room (Exhibit 8.1) illus-trates the problems of relating net income to total enterprise value. Bothcompanies compete within the thingmabob industry. Their net profits forthe latest year are $28.6 million and $33.0 million, respectively.
When Breathing Room announces an agreement to be acquired by amultinational thingmabob producer for $666 million, Deep Hock’s founderand controlling shareholder, Philip Atlee, realizes that his company is a hotitem in the mergers-and-acquisitions market. Trusting his own skills as a ne-gotiator, he dispenses with M&A advisers and directly contacts an investorgroup that has previously approached him about buying Deep Hock. Withthingmabob makers in strong demand, Atlee reasons, now is the time to sell.
Breathing Room’s selling price represented a multiple of 20 times its$33.0 million net income, in line with levels paid in other recent thingmabobacquisitions. On that basis, Atlee sets his sights on a price of 20 times DeepHock’s $28.6 million of net income, or $572 million. He starts the negotia-tions at a higher level and, after some haggling, accepts a $572 million offer.After popping open the champagne, Atlee begins shopping for a yacht.
One month later, Atlee’s quiet retirement is rudely disturbed by newsthat the investors who bought Deep Hock have quickly resold it to a largeindustrial corporation for $666 million. The ex-CEO realizes, to his dismay,
EXHIBIT 8.1 Comparative Financial Data ($000 omitted) Year Ended December31, 2001
Deep Hock BreathingCorporation Room, Inc.
Total debt $ 67.0 $ 0.0Shareholders’ equity 133.0 200.0
Sales $500.0 $500.0Cost of sales 415.0 415.0Depreciation and amortization 25.0 25.0Selling, general, and administrative expense 10.0 10.0
Operating income 50.0 50.0Interest expense 6.7 0.0
Income before income taxes 43.3 50.0Provision for income taxes 14.7 17.0
Net income $ 28.6 $ 33.0

The Applications and Limitations of EBITDA 165
that he apparently left $94 million on the table. Dumbfounded by the turnof events, Atlee wonders why anyone would pay $666 million for DeepHock. That is equivalent to the price paid for Breathing Room, a companywith net income 15% higher. Surely, the investment group that paid $572million for Deep Hock could not have boosted its profits materially in thespace of a month. Neither have price-earnings ratios on thingmabob com-panies risen from 20 times in the interim.
Determined to solve the mystery, Atlee seeks an explanation from hisniece, Alana, an intern at an investment management firm. Drawing on herexperience in analyzing financial statements, she obliges by pointing outthat Deep Hock’s income from operations, at $50.0 million, is equivalent toBreathing Room’s. The difference at the bottom line arises because Breath-ing Room, with a debt-free balance sheet, has no interest expense.
“If I had bought your company, Uncle Phil,” Alana explains, “I wouldhave immediately created pro forma financials showing what Deep Hock’snet income would be if all of its debt were paid off. Without the $6.7 mil-lion of interest expense, its income before income taxes would be $50.0 mil-lion, just like Breathing Room’s. At the company’s effective tax rate of 34%,the tax bill would be higher ($17.0 million versus $14.7 million), but net in-come would rise from $28.6 million to $33.0 million, the same as at Breath-ing Room. Then I would put the company up for sale at 20 times earnings,or $666 million. That’s probably what that group of investors did after theybought Deep Hock from you.”
Pausing for effect, Alana adds a detail concerning the transaction. “Inorder to raise Deep Hock’s earnings from $28.6 million to $33.0 million onan actual, as opposed to a pro forma basis, somebody has to retire the $67million of debt. Assuming the investor group paid off the borrowings andsold the company debt-free, its net gain wasn’t $94 million, as you assumed,but only $27 million. I mention that, just in case it’s any consolation to you.An alternative way to structure the deal would have been to make the $67million debt assumption part of the $666 million purchase price. Eitherway, the net cash proceeds to the seller come to $599 million, for a quickprofit of $27 million.”
Still unhappy about failing to get top-dollar, but intrigued by his niece’sinsights into financial statement analysis, Atlee asks a follow-up question.“I see now that applying a multiple to net income is not a good way to com-pare the total enterprise values of companies with dissimilar capital struc-tures. This kind of situation must arise frequently. Is there a simple, directvaluation method that would have shown us what our company was trulyworth, even if we weren’t clever enough to think of increasing the earningsby eliminating the debt?”

166 A CLOSER LOOK AT PROFITS
“Yes,” answers Alana. “Instead of calculating a multiple of net incomeon the comparable transaction, that is, the sale of Breathing Room, youshould have calculated a multiple of EBIT. That stands for ‘earnings beforeinterest and taxes.’ Add Breathing Room’s net income, income taxes, andinterest expense to get the denominator. The numerator is the sale price:
“Let’s apply that same EBIT multiple of 13.32 to the comparable data fromDeep Hock’s income statement,” Alana continues.
Net Income + Income Taxes + Interest Expense = $28.6 + 14.7 + 6.7= $50.0
$50.0 × 13.32 = $666.0
“So that’s how the pros ensure that valuation multiples will be consis-tent between companies with similar operating characteristics but differentfinancial strategies?” asks the sadder but wiser ex-CEO of Deep Hock.
“Actually, Uncle Phil,” Alana replies, “there’s one more comparabilityissue that we need to address. As you know, the accounting standards leavecompanies considerable discretion regarding the depreciable lives they as-sign to their property, plant, and equipment. The same applies to amortiza-tion schedules for intangible assets. Now, let’s imagine for a moment thatBreathing Room’s managers had been writing off its assets not at a rate of$25 million a year, but only $20 million a year. That means that they wouldhave been depreciating assets more slowly than you were, since the twocompanies’ rates of depreciation were identical. Here’s Breathing Room’sincome statement, revised for this hypothetical change in depreciation rates(Exhibit 8.2).
“Let’s calculate EBIT from this statement and apply the EBIT multiplethat, according to our previous analysis, represents the value being assignedto thingmabob companies currently:
Net Income + Income Taxes + Interest Expense = $36.3 + 18.7 + 0.0= $55.0
$55.0 × 13.32 = $732.6 million
“It appears that simply by stretching out the depreciable lives of its assets,Breathing Room has boosted its value from $666 million to $732.6 million.
Total Enterprise Value
Net Income Income Taxes Interest ExpenseX
+ +=
+ +=
$
$ . . ..
666
33 0 17 0 0 013 32

The Applications and Limitations of EBITDA 167
But that can’t be correct. Depreciation is an accrual, rather than a cash ex-pense. Changing the depreciation rate for financial reporting purposes istherefore nothing but an alteration of a bookkeeping entry. It doesn’t in-crease or decrease the number of dollars actually flowing into the company.If management had changed the depreciation rate for tax reporting pur-poses, then the actual tax payments would decline. In that case, more dol-lars would flow into Breathing Room. But that’s another matter. Whatwe’re concerned about is that Breathing Room might fetch a higher pricethan Deep Hock, merely because of a difference in accounting policy thatrepresents no difference in economic value.
“To prevent this sort of distortion, we calculate a multiple on a basethat’s even better than EBIT. It’s called EBITDA. That stands for ‘earningsbefore interest, taxes, depreciation, and amortization.’ (Yes, I know that onthe income statement, the correct order, moving from top to bottom, isEBDAIT. But the convention is to use the acronym EBITDA, pronounced“eebit-dah.”) Breathing Room’s EBITDA multiple is the same, whether itdepreciates its assets at the rate of $25 million a year or $20 million a year:
EBITDA Multiple =
Total Enterprise Value
Net Income Income Taxes Interest ExpenseDepreciation Amortization
+ ++ +
EXHIBIT 8.2 Breathing Room, Inc.
Statement of Consolidated Income Year Ended December 31, 2001
($000 omitted)
Sales $500.0Cost of sales 415.0Depreciation and amortization 20.0Selling, general, and administrative expense 10.0
Operating income 55.0Interest expense 0.0
Income before income taxes 55.0Provision for income taxes 18.7
Net Income $336.3

168 A CLOSER LOOK AT PROFITS
Original Depreciation Schedule:
Decelerated Depreciation Schedule:
“If we calculate Deep Hock’s EBITDA and apply that same multiple of8.88X, we get the correct total enterprise value of $666 million, meaningthat we’ve achieved comparability with respect to both capital structure anddepreciation policy:
“In summary, Uncle Phil, it’s much smarter to calculate total enterprisevalue as a multiple of EBITDA than to use net income. But the most impor-tant lesson is that if you decide to come out of retirement and start anothercompany, be sure to hire me as your financial adviser.”
Atlee grins. “I guess you’re never too old to learn new and better ap-proaches to financial statement analysis.”
THE ROLE OF EBITDA IN CREDIT ANALYSIS
The dialogue between Phil Atlee and his niece shows that similar companieswith similar net income can have substantially different total enterprise val-ues. Much in the same way, companies with similar interest coverage canhave substantially different default risk. In credit analysis, as in valuingbusinesses, EBITDA can discriminate among companies that look similarwhen judged in terms of EBIT. Consider the fictitious examples of RockSolid Corporation and Hollowman, Inc. (Exhibit 8.3).
Net Income Income Taxes Interest ExpenseDepreciation Amortization
+ ++ + = + + +
=× =
$ . . . .
$ .$ . . $ .
28 6 14 7 6 7 25 0
75 075 0 8 88 666 0
$$ . . . .
$.
66636 3 18 7 0 0 20 0
66675
8 88+ + +
= = X
$$ . . .
$.
66633 17 0 0 0 25 0
66675
8 88+ + +
= = X

The Applications and Limitations of EBITDA 169
Measured by conventional fixed charge coverage (Chapter 13), the twocompanies look equally risky, with ratios of 2.10X and 2.11X, respectively:
Fixed Charge Coverage
Net Income + Income Taxes + Interest Expense
Interest Expense
(For convenience of exposition, we shall refer to this standard credit mea-sure as the EBIT-based coverage ratio. Note that for some companies, thesum of net income, income taxes, and interest expense is not equivalent to
Rock Solid Corp.:$73.0
Hollowman, Inc.:$66.0
X
. .$ .
.
. .$ .
.
+ +=
+ +=
37 0 100 0100 0
2 10
34 0 90 090 0
2 11
X
EXHIBIT 8.3 Comparative Financial Data ($000 omitted) Year Ended December 31, 2000
Rock Solid Hollowman,Corporation Inc.
Total debt $ 950.0 $ 875.0Shareholders’ equity 750.0 675.0
Total capital 1,700.0 1,550.0
Sales 2,000.0 1,750.0Cost of sales 1,600.0 1,400.0
Depreciation and amortization 75.0 30.0Selling, general, and administrative expense 115.0 130.0
Operating income 210.0 190.0Interest expense 100.0 90.0
Income before income taxes 110.0 100.0Provision for income taxes 37.0 34.0
Net income $ 73.0 $ 66.0

170 A CLOSER LOOK AT PROFITS
EBIT, reflecting the presence of such factors as extraordinary items and mi-nority interest below the pretax income line.)
As it happens, Hollowman and Rock Solid are almost perfectlymatched on financial leverage, another standard measure of credit risk. (Fora discussion of calculating the total-debt-to-total-capital ratio in more com-plex cases, see Chapter 13.)
Total-Debt-to-Total-Capital Ratio
By these criteria, lending to Hollowman, Inc. is as safe a proposition aslending to Rock Solid Corp. Bringing EBITDA into the analysis, however,reveals that Rock Solid is better able to keep up its interest payments in theevent of a business downturn.
In the current year, Rock Solid’s gross profit—sales less cost of goodssold—is $400 million. Suppose that through a combination of reduced
Rock Solid Corp.:$950.00
Hollowman, Inc.: $875.0
%
$ . .. %
$ . ..
950 0 750 055 9
875 0 675 056 5
+=
+=
Total DebtTotal Debt Equity+
EXHIBIT 8.4 Statements of Income ($000 omitted) Year Ended December 31, 2001
Deep Hock BreathingCorporation Room, Inc.
Sales $1,800.0 $1,575.0Cost of sales 1,560.0 1,365.0Depreciation and amortization 75.0 30.0Selling, general, and adminstrative expense 115.0 130.0
Operating income 50.0 50.0Interest expense 100.0 90.0
Income (loss) before income taxes (50.0) (40.0)Provision (credit) for income taxes (17.0) (14.0)
Net income (loss) $ (33.0) $ (26.0)

The Applications and Limitations of EBITDA 171
revenue and margin deterioration, the figure drops by 40% to $240 mil-lion, while other operating expenses remain constant (Exhibit 8.4). Oper-ating income now totals only $50 million, just half of the $100 millioninterest expense. Fixed charge coverage falls to 0.50X from the previouslycalculated 2.10X.
Is Rock Solid truly unable to pay the interest on its debt? No, becausethe $75.0 million of depreciation and amortization charged against incomeis an accounting entry, rather than a current-year outlay of cash. Addingback these noncash charges shows that the company keeps its head abovewater, covering its interest by a margin of 1.25X:
EBITDA Coverage of Interest
By contrast, if Hollowman’s gross profit falls by 40%, as also shown in Ex-hibit 8.4, its interest coverage is below 1.0 times, even on an EBITDA basis:
Rock Solid can sustain a larger decline in gross margin than Hollow-man can before it will cease to generate sufficient cash to pay its interest infull. The reason is that noncash depreciation charges represent a larger por-tion of Rock Solid’s total operating expenses—4.2% of $1.790 billion, ver-sus 1.9% of $1.560 billion for Hollowman (Exhibit 8.3). This difference, inturn, indicates that Rock Solid’s business is more capital-intensive than Hol-lowman’s. Further examination of the companies’ financial statementswould probably show Rock Solid to have a larger percentage of total assetsconcentrated in property, plant, and equipment.
In summary, conventionally measured fixed charge coverage is nearlyidentical for the two companies, yet they differ significantly in their probabil-ity of defaulting on interest payments. Taking EBITDA into account enablesanalysts to discriminate between the two similar-looking credit risks. This isa second major reason for the ratio’s popularity, along with its usefulness in
$ . . . .
..
26 0 14 0 90 0 30 0
90 00 89
( ) + ( ) + += X
Net Income Income Taxes Interest ExpenseDepreciation Amortization Interest Expense
$33.0X
+ ++ + =
( ) + ( ) + +=
17 0 100 0 75 0
100 01 25
. . .
..

172 A CLOSER LOOK AT PROFITS
ensuring comparability of companies with dissimilar depreciation policies,when estimating the total enterprise values.
ABUSING EBITDA
Like many other financial ratios, EBITDA can provide valuable insightwhen used properly. It is potentially misleading, however, when applied inthe wrong context. A tip-off to the possibility of abuse is apparent from thepreceding illustration. By adding depreciation to the numerator, manage-ment can emphasize (legitimately, in this case) that although Rock Solid’soperating profits suffice to pay only 50% of its 2001 interest bill, the com-pany is generating 125% as much cash as it needs for that purpose. Lendersderive a certain amount of comfort simply from focusing on a ratio that ex-ceeds 1.0X, rather than one that falls below that threshold.
In their perennial quest for cheap capital, sponsors of leveraged buyoutshave noted with interest the comfort that lenders derive from a coverage ratiogreater than 1.0X, regardless of the means by which it is achieved. To exploitthe effect as fully as possible, the sponsors endeavor to steer analysts’ focusaway from traditional fixed charge coverage and toward EBITDA coverage ofinterest. Shifting investors’ attention was particularly beneficial during the1980s, when some buyouts were so highly leveraged that projected EBITwould not cover pro forma interest expense even in a good year. The spon-sors reassured nervous investors by ballyhooing EBITDA coverage ratios thatexceeded the psychologically critical threshold of 1.0 times. Meanwhile, thesponsors’ investment bankers insinuated that traditionalists who fixated onsub-1.0X EBIT coverage ratios were hopelessly antiquated and unreasonablyconservative in their analysis.
In truth, a bit of caution is advisable in the matter of counting depreci-ation toward interest coverage. The argument for favoring the EBITDA-based over EBIT-based fixed charge coverage rests on a hidden assumption.Adding depreciation to the numerator is appropriate only for the periodover which a company can put off a substantial portion of its capital spend-ing without impairing its future competitiveness.
Over a full operating cycle, the capital expenditures reported in a com-pany’s statement of cash flows are ordinarily at least as great as the depreci-ation charges shown on its income statement. The company must repair thephysical wear and tear on its equipment. Additional outlays are required forthe replacement of obsolete equipment. If anything, capital spending islikely to exceed depreciation over time, as the company expands its produc-tive capacity to accommodate rising demand. Another reason that capital

The Applications and Limitations of EBITDA 173
spending may run higher than depreciation is that newly acquired equip-ment may be costlier than the old equipment being written off, as a functionof inflation.
In view of the ongoing need to replace and add to productive capacity,the cash flow represented by depreciation is not truly available for payinginterest, at least not on any permanent basis. Rather, the “D” in EBITDA isa safety valve that the corporate treasurer can use if EBIT falls below “I” fora short time. Under such conditions, the company can temporarily reduceits capital spending, freeing up some of its depreciation cash flow for inter-est payments. Delaying equipment purchases and repairs that are essential,but not urgent, should inflict no lasting damage on the company’s opera-tions, provided the profit slump lasts for only a few quarters. Most com-panies, however, would lose their competitive edge if they spent only thebare minimum on property, plant, and equipment, year after year. It wasdisingenuous for sponsors of the most highly leveraged buyouts of the1980s to suggest that their companies could remain healthy while payinginterest substantially greater than EBIT over extended periods.
Naturally, the sponsors were prepared with glib answers to this objec-tion. Prior to the buyout, they claimed, management had been overspendingon plant and equipment. The now-deposed chief executives allegedly hadwasted billions on projects that were monuments to their egos, ratherthan economically sound corporate investments. In fact, the story went, in-vestments in low-return projects were the cause of the stock becomingcheap enough to make the company vulnerable to takeover. Investors oughtto be pleased, rather than alarmed, to see capital expenditures fall precipi-tously after the buyout. Naturally, this line of reasoning was less persuasivein cases where the sponsors teamed up with the incumbent CEO in a“management-led” buyout.
Investors in many of the 1980s transactions were advised to take com-fort as well from the fact that a portion of the annual interest expense con-sisted of accretion on zero-coupon bonds, rather than conventional cashcoupons (interest payments). By way of explanation, investors buy a zero-coupon issue in its initial distribution at a steep discount—say, 50%—to itsface value. Instead of receiving periodic interest payments, the purchasersearn a return on their investment through a gradual rise in the bond’s price.At the bond’s maturity, the obligor must redeem the security at 100% of itsface value.
By using zero-coupon financing along with conventional debt, LBO spon-sors could generate financial projections that showed all interest being paid onschedule, while at the same time making capital expenditures large enough tokeep the company competitive. Often, the projections optimistically assumed

174 A CLOSER LOOK AT PROFITS
that the huge debt repayment obligations would be financed with the pro-ceeds of asset sales. The sponsors declared that they would raise immensequantities of cash by unloading supposedly nonessential assets.
With the benefit of hindsight, the assumptions behind many of theLBOs’ financial projections were extremely aggressive. Still, the sponsors’arguments were not entirely unfounded. At least some of the vast, diversi-fied corporations that undertook leveraged buyouts during the 1980s hadcapital projects that deserved to be canceled. Some of the bloated conglom-erates owned deadweight assets that were well worth shedding.
The subsequent wave of LBO-related bond defaults,1 however, vindi-cated analysts who had voiced skepticism about the new-styled corporate fi-nance. Depreciation was not, after all, available as a long-run source of cashfor interest payments. This was a lesson applicable not only to the extremelyleveraged deals of the 1980s, but also to the more conservatively capitalizedtransactions of later years.
A MORE COMPREHENSIVE CASH FLOW MEASURE
Despite its limitations as a tool for quantifying credit risk, EBITDA has be-come a fixture in securities analysis. Many practitioners now consider theratio synonymous with cash flow, or more formally, operating cash flow(OCF). The interchangeability of EBITDA and OCF in analysts’ minds is ex-tremely significant in light of a long tradition of empirical research linkingcash flow and bankruptcy risk.
In an influential 1966 study,2 William H. Beaver tested various financialratios as predictors of corporate bankruptcy. Among the ratios he testedwas a definition of cash flow still widely used today:
Cash Flow (as defined by Beaver, 1966)
Net Income + Depreciation, Depletion, and Amortization
(Depletion, a noncash expense applied to natural resource assets, is ordi-narily taken to be implicit in depreciation and amortization, hence the useof the acronym EBITDA, rather than EBITDDA.)
Beaver found that of all the ratios he tested, the best single predictor ofbankruptcy was a declining trend in the ratio of cash flow to total debt.This relationship made intuitive sense. Practitioners reasoned that bank-ruptcy risk was likely to increase if net income declined or total debt in-creased, either of which event would reduce the cash-flow-to-total-debt

The Applications and Limitations of EBITDA 175
ratio. The empirical evidence indicated that by adding depreciation to thenumerator, analysts improved their ability to predict which companieswould go bust, relative to comparing total debt with net income alone.
Note that Beaver’s definition of cash flow was more stringent thanEBITDA, since he did not add back either taxes or interest to net income.Even so, bond analysts have developed a tradition of telescoping default riskinto the single ratio of cash flow (meaning EBITDA) as a percentage of totaldebt, all based ultimately on Beaver’s 1966 finding.3 In so doing, practition-ers have institutionalized a method that Beaver never advocated and thatsubsequent experience has shown to be fatally flawed.
Beaver did not conclude that analysts should rely solely on the cash-flow-to-debt ratio, but merely that it was the single best bankruptcy predictor. Ashe noted in his study, other academic researchers were already attemptingto build bankruptcy models with greater predictive power by combining ra-tios into a multivariate analysis. As of 1966, no one had yet succeeded, butjust two years later, Edward I. Altman introduced a multivariate modelcomposed of five ratios4 (see Chapter 13). The development of Altman’s Z-Score and other multivariate models has demonstrated that no single fi-nancial ratio predicts bankruptcy as accurately as a properly selected com-bination of ratios.
Since 1968, there has been no excuse for reducing bankruptcy risk tothe sole measure of EBITDA-to-total-debt. Nevertheless, that procedure re-mains a common practice. Similarly unjustifiable, on the basis of empiricalevidence, is the widely used one-variable approach of ranking a sample ofcorporate borrowers according to their EBITDA coverage of interest.
Bizarrely, investment managers sometimes ask bond analysts to providerankings of companies by their “actual credit risk,” as opposed to Moody’sand Standard & Poor’s ratings. Asked to elaborate on this request, the in-vestment managers reply that “actual” risk obviously means EBITDA cov-erage. Apparently, they consider it self-evident that the single ratio of cashflow (as they define it) to fixed charges predicts bankruptcy better than allof the rating agencies’ quantitative and qualitative considerations com-bined. Little do the investment managers realize that they are setting creditanalysis back by more than 30 years!
Nearly as outmoded as exclusive reliance on a single EBITDA-based ratiois analysts’ belief that they can derive a satisfactory measure of cash flow bysimply selecting some version of earnings and adding back depreciation. Itbecame apparent that neither EBITDA nor net-income-plus-depreciationwas a valid proxy for cash flow at least as far back as 1975, whenW. T. Grant filed for bankruptcy. The department store chain’s collapseshowed that reliance on an earnings-plus-depreciation measure could cause

176 A CLOSER LOOK AT PROFITS
analysts to overlook weakness at a company with substantial working capi-tal needs. Many subsequent failures in the retailing and apparel industrieshave corroborated that finding.
At the time of its bankruptcy filing, W. T. Grant was the largest retailerin the United States. Up until two years before it went belly-up, the com-pany reported positive net income (see Exhibit 8.5). Moreover, the depart-ment store chain enjoyed positive and stable cash flow (as defined byBeaver, i.e., net income plus depreciation). Bankruptcy therefore seemed aremote prospect, even though the company’s net income failed to grow be-tween the late 1960s and early 1970s. In 1973, W. T. Grant’s stock tradedat 20 times earnings, indicating strong investor confidence in the company’sfuture. The board of directors reinforced that confidence by continuing toauthorize dividends up until mid-1974.
Investors would have been less sanguine if they had looked beyond thecash sources (earnings and depreciation) and uses (interest and dividends)shown on the income statement. It was imperative to investigate whether
EXHIBIT 8.5 W. T. Grant Alternative Cash Flow Measures 1967–1975
Sources: Clyde P. Stickney and Paul R. Brown, Financial Reporting and Statement Analysis: AStrategic Perspective, Fourth Edition, Orlando, Florida: The Dryden Press, a subsidiary of Har-court Brace & Company, pp. 106–123. James Largay, “Cash Flows, Ratio Analysis and theW. T. Grant Company Bankruptcy,” Financial Analysts Journal, July–August 1980, pp. 51–55.
–3500
–3000
–2500
–2000
–1500
–1000
–500
0
500
1000
1500
Years
Dol
lars
(M
illio
ns)
1968 1969 1970 1971 1972 1973 1974 1975
Traditional Cash FlowAdjusted Cash Flow

The Applications and Limitations of EBITDA 177
two balance sheet items, inventories and accounts receivable, were tying upincreasing amounts of cash. If so, it became vital to determine whether thecompany could generate an offsetting amount of cash by expanding its ac-counts payable. Recognizing the need for this added level of analysis, FASBeventually prescribed a more comprehensive definition of operating cashflow, as defined in SFAS 95, “Statement of Cash Flows”:
Operating Cash Flow (as defined by FASB, 1987)
Where:
Note that this definition focuses on the elements of working capital that ordi-narily grow roughly in proportion with the scale of operations. FASB’s for-mulation excludes cash and marketable securities, as well as short-term debt.
WORKING CAPITAL ADDS PUNCH TO CASH FLOW ANALYSIS
Adding working capital to cash flow analysis frequently reveals problemsthat may not be apparent from observing the trend of EBITDA or net-income-plus-depreciation. In fact, reported earnings often exceed true eco-nomic profits specifically as a function of gambits involving inventories oraccounts receivable. Fortunately, such ploys leave telltale signs of earningsmanipulation. Aside from seasonal variations, the amount of working capi-tal needed to run a business represents a fairly constant percentage of acompany’s sales. Therefore, if inventories or receivables increase materiallyas a percentage of sales, analysts should strongly suspect that the earningsare overstated, even though management will invariably offer a more benignexplanation.
Consider, for example, an apparel manufacturer that must produce itsgarments before knowing which new styles will catch the fancy of shoppersin the season ahead. Suppose that management guesses wrong about thefashion trend. The company now holds inventory that can be sold, if at all,only at knockdown prices. Instead of selling the unfashionable garments,
Working CapitalRequirements Accounts Receivable Inventory Accounts Payable= + −
Net Income Depreciation Changes in Working Capital Requirements+ −

178 A CLOSER LOOK AT PROFITS
which would force the manufacturer to recognize the loss in value, manage-ment may decide to retain the goods in its finished goods inventory. Ac-counting theory states that the company should nevertheless recognize theloss by writing down the merchandise. In practice, though, managementmay persuade its auditors that no loss of value has occurred. After all, judg-ing what is fashionable is a subjective process. Moreover, management canalways argue that the goods remain in its warehouse only because of a tem-porary slowdown in orders. If the auditors buy the story, it will not alter thefact that the company has suffered an economic loss. Analysts focusing ex-clusively on EBITDA will have no inkling that earnings are down or that thecompany’ cash resources may be starting to strain.
In contrast, analysts will recognize that something is amiss if they mon-itor a cash flow measure that includes working capital as well as net incomeand depreciation. While the current season’s goods remain in inventory, thecompany is producing clothing for the next season. Observe what happensto working capital requirements, bearing in mind the FASB 95 definition, asthe new production enters inventory:
Inventory increases, causing working capital requirements to increase. Ac-cording to the FASB definition, a rise in working capital requirements re-duces operating cash flow. Analysts receive a danger signal, even thoughnet-income-plus-depreciation advances steadily.
A surge in accounts receivable, similarly, would reduce operating cashflow. The buildup in receivables could signal either of two types of underly-ing problems. On the one hand, management may be trying to prop up salesby liberalizing credit terms to its existing customers. Specifically, the com-pany may be “carrying” financially strained businesses by giving them moretime to pay up their accounts. If so, average accounts receivable will behigher than in the past. That will soak up more cash and force the companyto absorb financing costs formerly borne by its customers. Alternatively, abuildup in receivables may result from extension of credit to new, less cred-itworthy customers that pay their bills comparatively slowly. To reflect thegreater propensity of such customers to fail on their obligations, the com-pany ought to increase its reserve for bad debts. Current-period reportedincome would then decline. Unfortunately, companies do not invariably dowhat they ought to do, according to good accounting practice. If they donot, a cash flow measure that includes working capital requirements will re-veal a weakness not detected by net-income-plus-depreciation or EBITDA.
Working CapitalRequirements Accounts Receivable Inventory Accounts Payable= + −

The Applications and Limitations of EBITDA 179
To be sure, management may attempt to mask problems related to in-ventory or receivables by pumping up the third component of working cap-ital requirements, accounts payable. If the company takes longer to pay itsown bills, the resulting rise in payables may offset the increase on the assetside. Fortunately for analysts, companies think twice before playing thiscard, because of potential repercussions on operations. The company’s sup-pliers might view a slowdown in payments as a sign of financial weakness.Vital trade credit could dry up as a consequence.
In any case, analysts should use operating cash flow as one of many di-agnostic tools. They should not rely on it exclusively, any more than theyshould limit their surveillance solely to tracking EBITDA. If a company re-sorts to stretching out its payables, other ratios detailed in Chapter 13 (re-ceivables to sales and inventories to cost of goods sold) will neverthelesssend out warning signals. Note, as well, that if the company does not fi-nance the bulge in inventories and receivables by extending its payables ordrawing down cash, it must add to its borrowings. Accordingly, a risingdebt-to-capital ratio (see Chapter 13) can confirm an adverse credit trendrevealed by operating cash flow.
CONCLUSION
Despite repeated demonstrations of the truism that no single measure en-capsulates all of a company’s pertinent financial traits, investors continue tosearch for the silver bullet. If a company’s value is not a direct function of itsnet income, they tell themselves, the problem must be that net income is toogreatly affected by incidental factors such as tax rates and financial lever-age. The answer must be to move up the income statement to a measure thatputs companies on a more even plane with one another. As Merrill Lynchinvestment strategist Richard Bernstein points out,5 operating earnings tendto be more stable than reported earnings, EBIT tends to be more stable thanoperating earnings, and EBITDA tends to be more stable than EBIT. Com-panies welcome analytical migration toward less variable measures of per-formance, because investors reward stability with high price-earningsmultiples. The trend of moving up the income statement reached its logicalconclusion during the technology stock boom of the late 1990s. Investorslatched onto the highest, most stable figure of all by valuing stocks on price-sales ratios. (To obscure what was going on, some companies actually re-sorted to discussing their earnings before expenses, or EBE.)
Strategist Bernstein found that by attempting to filter out the volatilityinherent in companies’ earnings, investors reduced the effectiveness of their

180 A CLOSER LOOK AT PROFITS
stock selection. In a study spanning the period 1986 to July 2001, he com-pared the performance of portfolios of stocks based on low ratios of price toearnings with alternative portfolios of stocks priced at low multiples ofEBITDA, cash flow, book value, and sales. The good old-fashioned low P/Ecriterion produced the highest average return (16.7%) of any of the strate-gies. Stocks chosen on the basis of low total enterprise value6 to EBITDAproduced the lowest average return, 12.3%. Adjusted for risk, as well, in-vestors achieved far better results by relying on the bottom line, net income,instead of moving up the income statement to EBITDA. Bernstein’s findingsreinforced the message that instead of seeking an alternative to net incomethat summarizes corporate performance in its entirety, analysts of financialstatements should examine a variety of measures to derive maximum insight.

181
CHAPTER 9The Reliability of
Disclosure and Audits
A naïve observer might consider it overkill to scrutinize a company’s finan-cial statements for signs that management is presenting anything less
than a candid picture. After all, extensive regulations compel publiclytraded corporations to disclose material events affecting the value of theirsecurities. Even if a company’s management is inclined to finagle, investorshave a second line of defense in the form of mandatory annual certificationof the financials by highly trained auditors.
These arguments accurately portray how the system is supposed towork for the benefit of the users of financial statements. As in so manyother situations, however, the gap between theory and practice is substan-tial when it comes to relying on legal mechanisms to protect shareholdersand lenders. Up to a point, it is true, fear of the consequences of breakingthe law keeps corporate managers in line. Bending the law is another mat-ter, though, in the minds of many executives. If their bonuses depend onpresenting results in an unfairly favorable light, they can usually see theirway clear to adopting that course.
“Getting the job done,” in the corporate world’s success-manual jar-gon, most definitely includes hard-nosed negotiating with auditors over thelimits to which the accounting standards may be stretched. Technically, theboard of directors appoints the auditing firm, but management is the pointof contact in hashing out the details of presenting financial events for exter-nal consumption. A tension necessarily exists between standards of profes-sional excellence (which, it must be acknowledged, matter a great deal tomost accountants) and fear of the consequences of losing a client.
At some point, resigning the account becomes a moral imperative, butin the real world, accounting firms must be pushed rather far to reach thatpoint. As a part of the seasoning process leading to a managerial role, ac-countants become reconciled to certain discontinuities between the bright,

182 A CLOSER LOOK AT PROFITS
white lines drawn in college accounting courses and the fuzzy boundariesfor applying the rules. Consequently, it is common for front-line auditors tobalk at an aggressive accounting treatment proposed by a company’s man-agers, only to be overruled by their senior colleagues.
Even if the auditors hold their ground against corporate managers whobelieve that everything in life is a negotiation, the outcome of the hagglingwill not necessarily be a fair picture of the company’s financial perfor-mance. At the extreme, executives may falsify their results. Fraud is an un-ambiguous violation of accounting standards, but audits do not invariablycatch it. Cost considerations preclude reviewing every transaction or exam-ining every bin to see whether it actually contains the inventory attributedto it. Instead, auditors rely on sampling. If they happen to inspect the wrongitems, falsified data will go undetected. Extremely clever scamsters mayeven succeed in undermining the auditors’ efforts to select their samples atrandom, a procedure designed to foil concealment of fraud.
When challenged on inconsistencies in their numbers, companies some-times blame error, rather than any intention to mislead the users of financialstatements. On April 16, 2001, Computer Associates International prelimi-narily reported operating earnings of $0.40 a share for the fiscal year endedMarch 31. On May 4, the software producer put the figure at $0.16. Thediscrepancy, said management, resulted from a typographical error. Accord-ing to the company, an employee transcribed a number incorrectly inpreparing a news release.1
Investors might have been excused for reacting skeptically. Shortly be-fore the May 4 announcement, Computer Associates’s accounting practiceshad come under attack in the press. Besides, seasoned followers of the cor-porate scene realize that companies are not always as forthcoming as in-vestors might reasonably expect. The following examples, drawn from thecasino and consumer appliances businesses, illustrate the point.
AN ARTFUL DEAL
On October 25, 1999, Trump Hotels & Casino Resorts reported a year-over-year rise in its third-quarter earnings per share, from $0.24 to $0.63,excluding a one-time charge related to the closing of the Trump World’s FairCasino Hotel. The net exceeded analysts’ consensus forecast of $0.54 ashare,2 resulting in a jump in the Trump’s share price from $4 to $45⁄16. Alsoup on the day were the bonds of one of the company’s casinos, Trump At-lantic City, which climbed about one point to 841⁄4.
“Our focus in 1999 was threefold,” said president and chief executive of-ficer Nicholas Ribis, in explaining the profit surge, which surprised industry

The Reliability of Disclosure and Audits 183
analysts. “First, to increase our operating margins at each operating entity;second, to decrease our marketing costs; and third, to increase our cashsales from our non-casino operations. We have succeeded in achieving posi-tive results in each of these three categories.”3
The company’s self-congratulatory press release contained no mentionof another important contributor to the third-quarter surge in revenues, andby extension, net income. As the subsequently filed Quarterly Report onForm 10-Q finally acknowledged, $17.2 million of the period’s revenuearose from bankrupt restaurant operator Planet Hollywood’s abandonmentof its lease on the All Star Café at Trump’s Taj Mahal casino. With the ter-mination of the lease, all improvements and alterations, along with certainother assets, became the property of Trump, which took over the restau-rant’s operation. An independent appraisal valued the assets received byTrump at $17.2 million. Without that boost, the company’s revenues wouldhave declined, year over year, and net income would have undershot, ratherthan exceeded, analysts’ expectations.
The discrepancy between the October 25 disclosure and the fuller ac-counting in the 10-Q “became an embarrassment” to Trump Hotels &Casino Resorts, according to the Wall Street Journal.4 Moreover, the timingwas unfortunate. The incident occurred as management was making around of investor presentations aimed at generating support for its plans todevelop a new resort on the Atlantic City, New Jersey, site of the shutteredWorld’s Fair casino.
Worse yet, from the company’s standpoint, the fact that Trump had omit-ted some rather useful information was detectable. Bear, Stearns & Co. bondanalyst Tom Shandell noticed that the company’s press release reported mys-teriously large revenues for the Trump Taj Mahal. The unit’s revenues in-creased by $4.9 million over the comparable 1998 quarter, even though theNew Jersey Casino Control Commission reported a $12.1 million decline inthe Taj Mahal’s casino revenues. Shandell was correct in suspecting thatsome other large, unspecified item was buried in the numbers; the differ-ence between the purported $4.9 million increase and the Commission’s reported decline of $12.1 million was essentially identical to the $17.2 mil-lion of All Star Café assets that later came to light. No such inference orbacking-out of numbers would have been required if Trump’s third-quarter1999 press release had provided as much detail on the Taj Mahal’s opera-tions as the corresponding 1998 release. That was not the case, however, asExhibit 9.1 demonstrates.
Was the drastic cutback in disclosure in Trump’s third-quarter 1999earnings release part of a deliberate attempt to conceal the fact that the year-over-year revenue gain was solely attributable to a nonrecurring event? Not tohear the company’s president tell it. “It was never hidden,” Ribis insisted.

184 A CLOSER LOOK AT PROFITS
EXHIBIT 9.1 Disclosure of Trump Taj Mahal Results inTrump Hotels and Casino Resorts Earnings ReleaseThree Months Ended September 30, 1998 ($000 omitted)
RevenuesCasino $148,011
Number of slots 4,137Win per slot/day $ 277
Slot win $ 82,456
Number of tables 157Win per table/day $ 4,160Table win $ 60,087Table drop $328,456Hold % 18.3%
Poker, keno, race win $ 5,468
Rooms $ 11,410Number of rooms sold 112,875Average room rates $101.09Occupancy % 98.2%
Food and beverage $ 15,034Other 5,667Promotional allowances (18,018)
Net revenues $162,104
Costs and expensesGaming 83,711Rooms 3,752Food and beverage 4,844General and administrative 23,785
Total expenses 116,092
EBITDA* $ 46,012
*EBITDA reflects earnings before depreciation, interest,taxes, Casino Reinvestment Development Authority write-down, and nonoperating income.
Three Months Ended September 30, 1999 ($000 omitted)Revenues $167.7Operating profit 41.4EBITDA 51.0Margin 30.4%
Sources: Trump Hotels and Casino Resorts Press Releasesdated October 7, 1998 and October 25, 1999.

The Reliability of Disclosure and Audits 185
“When there was a specific question about it, we broke it out.”5 The gainon the All Star Café simply got lost in the shuffle, he maintained, when thelawyers pressed him to put out third-quarter earnings before commencingthe roadshow for the proposed new casino. “As soon as I learned of the ac-counting treatment we spoke with all of our investors and analysts,” addedRibis.6
By apparently claiming that he discovered the true source of his com-pany’s year-over-year earnings increase only after the quarterly results hadbeen released, Ribis did not burnish his reputation as a details man. Thatprofessed shortcoming may not explain why, seven months later, TrumpHotels & Casino Resorts decided not to renew Ribis’s expiring contract asCEO. Perhaps it had more to do with the 56% drop in Trump’s stock pricein the 12 months ending May 2000. One thing is certain, however. Investorswho relied solely on the company’s disclosure were burned if they boughtinto the rally that followed the bullish-sounding press release. After analystShandell’s inquiries uncovered the All Star Café’s contribution to third-quarter results, the stock promptly sagged from $45⁄16 to $37⁄8, while theTrump Atlantic City bonds slid from 841⁄4 to 80. On January 16, 2002,Trump Hotels and Casinos agreed to settle SEC charges that it “recklessly”misled investors in this incident, without admitting or denying the commis-sion’s findings.7
DEATH DUTIES
In roughly the same period in which the Trump Hotels & Casino Resortscontroversy arose, the gambling industry provided another example of thehazards of relying on company disclosures. Arthur Goldberg, chief execu-tive officer of Park Place Entertainment, entered the hospital in June 1999.The company attributed his confinement to a respiratory infection, but ru-mors began to circulate that he was gravely ill.8 By the time Goldberg wasreleased from the hospital on July 7, Park Place’s stock had fallen by 6%.Over the same period, the 12 stocks constituting the Chicago Board Op-tions Exchange Gaming Index rose by an average of 8%.
As late as September 2000, Park Place denied a report that Goldbergplanned to step down as CEO the following year.9 Asked about his health,the 58-year-old casino king tersely replied, “It’s okay. Things wear out asyou get older.”10 On October 19, 2000, Goldberg died of complications ofbone marrow failure—decidedly not a condition that develops suddenly.
The stock market’s reaction to Goldberg’s death was surprising, in viewof his reputation as “the driving force behind Park Place Entertainment, the

186 A CLOSER LOOK AT PROFITS
man who in just ten years turned a failing casino company into a power-house that dominated the industry.”11 After dropping initially, the stock fin-ished up a quarter-point on the day. Analysts credited the shares’ resilienceto Goldberg’s success in assembling a strong management team. Be that asit may, investors who relied on the company’s disclosures during Goldberg’s1999 hospitalization, while ignoring rumors of a potentially fatal illness,failed to capitalize on information that influenced the stock and ultimatelyproved to be correct.
Park Place Entertainment might be criticized for tardiness in divulgingGoldberg’s health problems, but at least its disclosure was more punctualthan that of Sun City Industries under similar circumstances. On May 29,1997, the food-service distributor announced with deepest regret the deathof its president, Gustave Minkin. This initial disclosure of Minkin’s passingcame four days after the event. For investors who have noticed that senior-level personnel changes often affect the value of a stock, somewhat prompterreporting is desirable.
CHAINSAW AL
Plainly, corporate disclosure does not invariably satisfy investors’ reason-able demands for information. What about the external auditors whomusers of financial statements rely on to ensure that the information is pre-sented in accordance with GAAP? Judging by certain details of the Sunbeamaffair of the late 1990s, this second line of defense does not always prove dependable.
Few corporate managers in history have generated as wide a range ofreactions as Albert Dunlap has. In June 1996, on the day after he signed onas chairman and chief executive officer of Sunbeam, a manufacturer ofsmall appliances, the company’s stock soared by nearly 50%. Dunlap’s au-tobiography, Mean Business, became a best-seller, and he reportedly com-manded fees of $100,000 per appearance12 for lecturing on leadership. Onthe other hand, when Sunbeam’s board dismissed him on June 13, 1998,there was open rejoicing by some of the 18,000 employees he had fired overthe preceding four years. (That cost-cutting rampage had earned him thenickname “Chainsaw Al.”) After hearing about the champion headcount-slasher’s own firing on a news telecast, Dunlap’s estranged son reportedthat he “laughed like hell,” delighted at his father’s failure. “He got exactlywhat he deserved,” added Al Dunlap’s sister.13
The hard-charging executive was determined to boost Sunbeam’s re-ported profits, thereby replicating his earlier successes at American Can,

The Reliability of Disclosure and Audits 187
Lilly Tulip, Crown Zellerbach, and Scott Paper. In that pursuit, he pushedhard on the accounting principles to make them yield the numbers he coveted. Later on, however, a reexamination of the company’s originally reported 1997 financial statements rejected huge chunks of earnings thatthe auditors had deemed consistent with GAAP.
One source of Sunbeam’s supposedly robust 1997 profits, according tothe accounting firm that the company’s board hired for the review, was anexcessively large restructuring charge in 1996. (The Securities and Ex-change Commission subsequently alleged that the massive charge-off hadcreated “cookie jar” reserves, which Dunlap’s management team later re-versed to inflate 1997 earnings.14) In addition, Sunbeam reduced its 1997reported income by $29 million to undo the recognition of bill-and-holdsales. These were transactions in which the company booked sales while ar-ranging to deliver merchandise to customers at a later date, rather thanshipping it immediately. In one case, a distributor that (according to Sun-beam’s revenue account) bought $4 million of electric blankets was paid aone-percent-a-month fee to hold the items in storage.15 Sunbeam shippedanother $10 million of blankets to a warehouse that it rented near its Hat-tiesburg, Mississippi, distribution center, booking a sale to Wal-Mart de-spite keeping the goods in the warehouse for weeks.16 A further $36 millionof retroactive reductions in income resulted from invalidating sales madeunder such liberal return policies that they could be considered consign-ments, rather than bona fide sales under GAAP.
Although such practices were not previously unheard of in the corpo-rate world, the Dunlap regime refined them to new levels. Indeed, ChainsawAl inspired one of the most lyrical descriptions of accounting practices wehave ever encountered, in an article penned by Jonathan Laing of Barron’sshortly before Dunlap got the boot:
Sunbeam’s financials under Dunlap look like an exercise in high-energyphysics, in which time and space seem to fuse and bend. They are a ver-itable cloud chamber. Income and costs move almost imperceptiblyback and forth between the income statement and balance sheet likecharged ions, whose vapor trail has long since dissipated by the end ofany quarter, when results are reported.17
Confronted with the overall conclusion of the board-mandated ac-counting review, which nullified 65% of the net income that the master ofcorporate turnarounds had claimed to produce in 1997, Dunlap dismissedthe whole affair as a bunch of “technical accounting issues.”18 For in-vestors, however, the fluff in the originally reported numbers had a

188 A CLOSER LOOK AT PROFITS
substantial dollars-and-cents impact. On June 22, 1998, when the WallStreet Journal reported that the SEC was probing Sunbeam’s accountingpractices, the company’s stock plummeted by 22% to close at $813⁄16. Thatwas on top of an earlier plunge from $53 on March 4, as Sunbeam, unableto maintain the earnings momentum produced by artificial means in 1997,reported a first-quarter loss. Still worse news was to come, as the companyfiled for bankruptcy in February 2001.
The restatements of 1997 earnings came long after the fact, but theproblems were apparent to some observers much earlier. In March 1998,three months before the board of directors ordered a reexamination of theresults that the external auditors had certified for the preceding year, a 26-year-old Sunbeam internal auditor raised a red flag about the Dunlap team’sfinancial reporting practices. Deidra DenDanto, formerly of the accountingfirm of Arthur Andersen, stated in a memo (which never reached the board)that booking the bill-and-hold transactions as sales was “clearly in viola-tion of GAAP.”19
Even without the benefit of an inside look at the numbers, other practi-tioners of basic financial statement analysis voiced skepticism that ulti-mately proved well founded. A year before the board authorized its review,Laing of Barron’s argued20 that the large reserves taken in 1996 for litiga-tion and bad debts might be drawn on to boost future earnings. He furtherpointed out that the $90 million inventory write-down could boost 1997earnings as the goods in question were sold. Additionally, Laing observedthat after making much bigger allowances for bad debts than in the imme-diately preceding years, Sunbeam could potentially juice its 1997–1998earnings by cutting back on bad-debt provisions. The Barron’s contributoralso pointed out that in light of the company’s sizable write-down of prop-erty, plant, and equipment and trademarks, one would expect depreciationand amortization charges to decline in 1997, yet they were on the rise. Thisraised the possibility that Sunbeam was capitalizing certain advertising andproduct-development costs previously expensed, which would be allowedunder GAAP but considered aggressive. Finally, Laing reported that a 13%surge in sales during 1997’s first quarter had prompted the press to specu-late about possible “inventory stuffing” (see “Loading the DistributionChannels,” in Chapter 6).
With the financial statements raising eyebrows both inside and outsidethe company, why did the auditors fail to curb the Dunlap regime’s aggres-sive reporting practices? Insight into this question is provided by the tale ofthe spare parts. Briefly, Sunbeam stored spare parts for the repair of its ap-pliances in the warehouse of a company known as EPI Printers. Near theend of 1997, Dunlap’s colleagues hatched a scheme to sell the parts to EPI

The Reliability of Disclosure and Audits 189
for $11 million and book a profit of $8 million. When EPI balked, sayingthat it believed the parts to be worth only $2 million, Sunbeam induced thecompany to sign an “agreement to agree” to pay $11 million, with a clauseallowing EPI to opt out of the deal after year-end. With that contract inhand, Sunbeam booked an $8-million profit. When the accounting firmpartner in charge of the Sunbeam audit objected that GAAP did not permitsuch treatment, Dunlap’s minions commenced a negotiation. They agreedto knock $2 million off the recorded profit, leaving an amount that thepartner deemed immaterial. In the end, the auditors provided a clean opin-ion on Sunbeam’s 1997 statements, despite a number of such messy littleitems.21
Floyd Norris, the journalist who brought the spare parts tale to wide-spread attention, filed an even more remarkable story following Sunbeam’sbankruptcy filing in 2001.22 The New York Times columnist found that inAugust 1976, Al Dunlap was fired as president of Nitec, a paper mill oper-ator in Niagara Falls, New York. Dunlap’s abrasive management style wasreportedly the cause. A short while later, Nitec’s auditors concluded thatfar from earning a profit of nearly $5 million in the fiscal year ended Sep-tember 30, 1976, as had been expected, the company had suffered a $5.5million loss.
When Nitec canceled an agreement to repurchase Dunlap’s stock in thecompany, he sued and was promptly countersued by Nitec, which allegedthat a fraud had occurred. According to Norris, whose employer obtainedthe relevant court records from the National Archives, the auditors foundevidence of nonexistent sales, overstated inventory and cash figures, andunrecorded expenses. Albert J. Edwards, Nitec’s former financial vice-president and the principal witness against Dunlap, testified that Dunlaphad ordered him to falsify the financial reports to meet profit targets.
Chainsaw Al called Edwards’s testimony “outrageously false.” Indeed,the witness had denied, in an earlier deposition, that he had played any partin cooking the books. Dunlap also suggested that Nitec’s principal ownerwas trying to drive down earnings to reduce the amount he would have topay him under a stock repurchase agreement.
Whatever the truth of the matter was, Dunlap omitted any mention ofhis Nitec stint from his self-celebratory book. The executive search firmthat Sunbeam retained in connection with hiring Chainsaw Al failed to un-cover the gap in his résumé, a classic red flag, even though Norris turned upmentions of Dunlap’s tenure at Nitec, using electronic retrieval services.More diligent checking might have given Sunbeam’s board second thoughtsabout hiring a chief executive whose commitment to accurate financial re-porting had been questioned.
190 A CLOSER LOOK AT PROFITS
STUMBLING DOWN THE AUDIT TRAIL
The Sunbeam affair will probably make readers wonder how confident theycan be in the quality of audits in general. They are right to be concerned.Abundant evidence has emerged over the years of corporate managers lean-ing on auditors to paint as rosy a picture as possible. The following exam-ples convey the magnitude of the problem:
� Following a downward restatement of results for the second throughfourth quarters of 1993, Woolworth launched an internal investigationby a special committee of its outside directors. The committee’s reportquoted the company’s auditor as saying that the retailer’s managementhad repeatedly pushed for reporting “another good quarter.” Severalemployees told the committee that it was a company “tradition” torecord a profit, however small, in every period. The former controller ofWoolworth Canada said that in pursuit of that objective, he was in-structed to send corporate headquarters first-half 1993 numbers thatbore no resemblance to the actual results. He added that he was told tokeep track of the discrepancy and offset it in the second half of the yearby underreporting that period’s performance.23 The committee con-cluded that “senior management failed to create an environment inwhich it was clear to employees at all levels that inaccurate financial re-porting would not be tolerated.”24 On the contrary, the committeefound, otherwise capable and conscientious financial staff people evi-dently concluded that such behavior was acceptable.
� In 1997, National Auto Credit’s auditors warned the board of directorsthat the company’s internal accounting controls were inadequate. Sup-posedly, the finance company, which had previously been obliged to re-state downward by $9 million the profit on the sale of its rental carbusiness, corrected the shortcomings. A short time later, however, theauditors received information from some current or former employeesof the company that cast doubt on the validity of the financial state-ments. Concluding that management was untrustworthy, the auditorsresigned. A committee of three of National Auto Credit’s outside direc-tors investigated and found “substantial competent evidence”25 thatthe auditors’ mistrust of management was well grounded. The commit-tee advised the full board to suspend the company’s top managementand recommended that chairman and majority shareholder Sam J.Frankino place his stock in a voting trust. Frankino responded by ap-pointing two new directors, who voted with him and the company’spresident to reject the special committee’s report. The outside directorsresigned following their defeat.

The Reliability of Disclosure and Audits 191
� In 1989, the auditor of California Micro Devices’s cited “material in-ternal control weaknesses” and urged the manufacturer of computerchips to replace Chief Financial Officer Steven J. Henke. The companyresponded by switching Henke to the treasurer’s slot. He later testifiedat a criminal trial that contrary to what his résumé stated, he had notmajored in accounting, but had taken only one course in the subjectand received a D. A new auditing firm took over in 1990 and foundthat contrary to the preferred practice of having outside directors serveon the board’s audit committee, in Cal Micro’s case the panel includedChairman Chan Desaigoudar, who owned 45.7% of the company’sstock. On August 4, 1994, Cal Micro’s stock plunged by 40% after thecompany wrote off nearly half of its accounts receivable. The followingmonth, Cal Micro’s financials received a clean opinion, but it soon be-came apparent that the auditors had missed a massive accounting fraud.An internal investigation disclosed that one-third of fiscal 1994 revenuewas spurious. According to Wade Meyercord, an outside director whohelped to uncover the fraud and took over as chairman, the fakery in-cluded fictitious sales of nonexistent goods to imaginary companies. ACal Micro staffer testified that the outside auditor assigned inexperi-enced employees “fresh out of college” to the job. One of the novicesasked a bookkeeping question so elementary that it gave rise to a run-ning joke among Cal Micro accounting officials. Imitating cartooncharacter Elmer Fudd, they asked one another, “What’s wevenue?”26
In theory, the audit committee of the board of directors serves as an ad-ditional line of defense in the struggle for candid financial reporting. Thisadded protection does not invariably guarantee the integrity of the financialstatements, however. In a study of financial frauds that came to light be-tween 1987 and 1997, the Securities and Exchange Commission found thatthe audit committees of many of the companies involved met only once ayear or so. Some had no audit committees. In one of the few encouragingnotes of recent years, the SEC has imposed a “financial literacy” require-ment on audit committee members. This might seem too obvious a criterionto necessitate a specific regulation, but readers should bear in mind that O. J. Simpson once served on the audit committee of Infinity BroadcastingCorporation.27
CONCLUSION
If the horror stories recounted in this chapter were isolated incidents, it mightbe valid to argue that in most cases, the combined impact of corporate

192 A CLOSER LOOK AT PROFITS
disclosure requirements and external audits ensures a high level of reliabil-ity in financial statements. Intense analysis of the statements by the userswould then seem superfluous. Many companies, however, are either stingywith information or slippery about the way they present it. Rather thanlaying down the law (or GAAP), the auditors typically wind up negotiatingwith management to arrive at a point where they can convince themselvesthat the bare minimum requirements of good practice have been satisfied.Taking a harder line may not produce fuller disclosure for investors, butmerely mean sacrificing the auditing contract to another firm with a moreaccommodating policy. Given the observed gap between theory and prac-tice in financial reporting, users of financial statements must providethemselves an additional layer of protection through tough scrutiny of thenumbers.

193
CHAPTER 10Mergers-and-
Acquisitions Accounting
Choosing a method of accounting for a merger or acquisition does not af-fect the combined companies’ subsequent competitive strength or ability
to generate cash. The discretionary accounting choices can have a substan-tial impact, however, on reported earnings. As a consequence, seemingly es-oteric debates over mergers and acquisitions (M&A) have turned intohigh-level political issues.
In September 2000, Democratic vice presidential nominee JosephLieberman took a position on the long-standing debate over pooling-of-interests accounting (see following section). Along with 12 other UnitedStates senators, he urged the Financial Accounting Standards Board to post-pone a decision until all of the alternatives had been fully considered.1
On March 14 of the same year, Cisco Systems chairman John Cham-bers donated $100,000 to the Republican House of Representatives andSenate campaign committees. The next day, Virginia congressman TomDavis, head of the Republicans’ House campaign, and the House Com-merce Committee chairman, Republican Thomas Bliley of Virginia, wroteto FASB chairman Edmund Jenkins urging a delay of the proposal to banpooling. Chambers, whose company had been an active user of the pool-ing method,2 insisted that the timing of the contribution and letter was co-incidental. “I had no knowledge of a letter being written,” he said.3
Indeed, Chambers indicated that he had written the check a few weeks be-fore it was reported, while Davis said that he had been pursuing the pooling issue on his own constituents’ behalf before the letter went toFASB’s Jenkins.

194 A CLOSER LOOK AT PROFITS
THE TWILIGHT OF POOLING-OF-INTERESTS ACCOUNTING
Political contributions may or may not have been what induced leaders ofboth major parties to become energetic lobbyists on pooling-of-interests ac-counting. Unquestionably, however, the seemingly esoteric issue attracted at-tention in high places. Exhibit 10.1 helps to explain why, by detailing thealternative accounting treatments for Company A’s acquisition of Company B.
Under purchase accounting, the combined companies’ balance sheet in-cludes the acquiring company’s assets at book value (historical cost less ac-cumulated depreciation) plus the acquired company’s assets at fair marketvalue. In Company B’s case, fair market value exceeds book value by$198,750, representing the difference between the price paid by CompanyA (5,000 shares @ $88 per share = $440,000) and Company B’s sharehold-ers’ equity ($250,000), plus $8,750 (35% of $25,000) of deferred incometax liability. Of the $198,750, the auditors allocate $25,000 to ordinary de-preciable (tangible) assets, which rise from $250,000 to $275,000. The re-mainder, $173,750, becomes an intangible asset called goodwill, whichmust be amortized over a period no longer than 40 years.
In this example, we assume that the combined companies amortize thenewly created goodwill over the maximum allowable period, resulting in anannual expense of $4,344. Amortization of goodwill entails no cash outlay.Neither does it generate cash through tax savings, because it is not a tax-deductible expense. The amortization does reduce reported income, how-ever, along with the $5,000 annual depreciation (over five years) of the$25,000 write-up of Company B’s tangible assets. All told, the combinedcompanies’ initial-post-merger-year pretax income of $740,000 ($600,000from Company A + $90,000 from Company B + $50,000 of efficienciesgained through combining operations) is reduced by $5,000 (pretax) of newdepreciation and $4,344 (after tax) of goodwill amortization.
Under pooling-of-interests accounting, by contrast, the combined bal-ance sheet includes the assets of both Company A and Company B at bookvalue. There is no excess over Company B’s book value to allocate to tangi-ble assets or goodwill, so no new depreciation or amortization arises. Taxesalone reduce the combined companies’ pretax income of $740,000. Net in-come, at $481,000, exceeds the $473,406 figure reported under the pur-chase method.
From a cash flow standpoint, investors are actually better off under thepurchase method, in this example. Assuming that changes in working capi-tal accounts will be identical under the two scenarios we shall use net in-come + depreciation + amortization as a proxy for cash flow. (Depreciationof net property, plant, and equipment is calculated at 20% per annum.)

Mergers-and-Acquisitions Accounting 195
Under purchase accounting, the total comes to $473,406 + $390,000 +$5,000 + $4,344 = $872,750. Cash generated under pooling of interests,on the other hand, totals just $481,000 + $390,000 = $871,000. The differ-ence represents the tax savings on the extra depreciation expense under thepurchase method: $5,000 × 35% = $1,750.
EXHIBIT 10.1 Alternative Accounting Treatments for Company A’s Acquisition ofCompany B
Companies A and B
B Shown Consolidated at
at Current Date of AcquisitionHistorical Costs Market PoolingA B Values Purchase of Interests
Balance SheetAssets
Current assets $1,500,000 $450,000 $450,000 $1,950,000 $1,950,000Property, plant, and equipment, net
of accumulated depreciation 1,700,000 250,000 275,000 1,975,000 1,950,000Goodwill 173,750 173,750Total assets $3,200,000 $700,000 $898,750 $4,098,750 $3,900,000
LiabilitiesCurrent liabilities $1,300,000 $450,000 $450,000 $1,750,000 $1,750,000Deferred income tax liability 8,750 8,750Shareholders’ equity 1,900,000 250,000 440,000 2,340,000 2,150,000Total liabilities and shareholders’
equity $3,200,000 $700,000 $898,750 $4,098,750 $3,900,000
Income StatementPrecombination income before
income taxes $600,000 $90,000 $690,000 $690,000From combination cost savings 50,000 50,000Total income after cost savings 740,000 740,000Extra depreciation expense 5,000Base for income tax expense $600,000 $90,000 $735,000 $740,000Income tax expense 210,000 31,500 257,250 259,000Goodwill amortization 4,344Net income $390,000 $58,500 $473,406 $481,000Number of common shares
outstanding 100,000 20,000 105,000 105,000Earnings per share $3.90 $2.93 $4.51 $4.58
A issues Market price per share $88.00 $22.00 5,000Tax rate 35% shares of
its stock to B stockholders
Depreciation: Straight lineAccounting asset life 5 yrsGoodwill life 40 yrsPrice earnings ratio 23 8
Adapted from Clyde P. Stickney, Financial Reporting and Statement Analysis: A Strategic Perspective, ThirdEdition, The Dryden Press, a subsidiary of Harcourt Brace & Company, (1996) p. 371.

196 A CLOSER LOOK AT PROFITS
Before FASB abolished pooling of interests in 2001, companies typi-cally structured mergers and acquisitions to qualify for pooling-of-intereststreatment, even though the cash flow impact of using the purchase methodwas either favorable or neutral. (The latter would be the case if none of theexcess of purchase price over shareholders’ equity were allocated to tangibleassets). Conceivably, managers believed that they could achieve the highestshare price for stockholders by maximizing net income and, as indicated inExhibit 10.1, earnings per share. Alternatively, they may have been trying tomaximize their own performance bonuses, which at least in years past,tended to be tied to reported earnings, rather than performance of the com-pany’s stock.
The potential for abuse of pooling-of-interests accounting had beenapparent for many years by the time Senator Lieberman and other politi-cians urged FASB to slow down its supposedly hasty effort to abolish thepractice. In the layperson’s mind, the pooling-of-interests method was re-served for transactions that represented a merger of equals. In practice, bigfish routinely swallowed small fish in acquisitions that qualified as poolingsunder APB Accounting Opinion No. 16, “Business Combinations” (1970).As discussed later in this chapter, certain acquisitions made by NavigantConsulting qualified for pooling-of-interests accounting while also beingsmall enough, relative to Navigant, to be deemed immaterial for financialreporting purposes.
On January 24, 2001, the protracted wrangling ended in a compromise.The Financial Accounting Standards Board officially marked the poolingmethod for extinction. As a quid pro quo, FASB eliminated the requirementto amortize the goodwill created in mergers consummated after June 30,2001. Neither did companies have to continue amortizing existing goodwillin fiscal years beginning after December 15, 2001.
Gone was the mandatory annual reduction of earnings, which had beenthe issuers’ primary objection to the purchase method all along. Cisco Sys-tems controller Dennis Powell, for example, found the resolution highly sat-isfactory. “Clearly,” commented Powell, “the FASB listened and respondedto extensive comments from the public and the financial community tomake the purchase method of accounting more effective and realistic.”4
To be sure, the new rules required companies to test annually for possi-ble impairment of the goodwill on their books. Any loss of value wouldhave to be recognized through a partial or complete write-down. Inevitably,however, there would be a sizable judgmental component to the determina-tion that impairment had occurred.
Remarkably, Wall Street securities analysts recommended certainstocks that they contended would benefit from FASB’s decision. Reported

Mergers-and-Acquisitions Accounting 197
earnings, the analysts noted, would rise as a consequence of the eliminationof goodwill amortization. This argument made no sense, given that thechange in financial reporting practice could not improve the companies’economic profits one iota. The analysts nevertheless insisted that the stockswould rise, asserting that investors were too unsophisticated to understandthat goodwill was a noncash expense.
One member of the analysts’ own ranks, Morgan Stanley managing di-rector Trevor J. Harris, conspicuously rejected the notion that the change infinancial reporting practices would vault shares higher. “It makes no eco-nomic sense,” said Harris, who doubled as a professor of accounting at Co-lumbia Business School. “There should be no long-term price effect.”5
Pepperdine University Professor of Accounting Michael Davis addedthat there were approximately 10 academic studies of the issue, covering pe-riods from the 1960s to the 1990s. The studies consistently found that thehigher reported earnings generated by pooling did not cause the stocks ofthe acquiring companies to outperform the stocks of companies employingthe purchase method.6 This empirical evidence did not necessarily guide thepractices of analysts, however. Assistant Professor of Accounting Patrick E.Hopkins of the Kelley School of Business at Indiana University conductedan experiment in which he showed three versions of a company’s financialstatements to 113 analysts employed by money management organizations.The statements differed only in that one version used pooling-of-interestsaccounting for mergers, whereas the other two did not. Based only on thecosmetic difference in accounting treatment, the analysts awarded highervaluations to the company’s stock when pooling was not used.7
MAXIMIZING POSTACQUISITION REPORTED EARNINGS
Among technology companies, a popular way to boost earnings in thepooling-of-interests era involved write-offs of in-process research and devel-opment of acquired companies. By getting rid of that component of the ac-quisition price at the outset, the acquirer could avoid a drag on futureearnings through goodwill amortization. The Securities and Exchange Com-mission cracked down on the practice, forcing some companies to restatetheir earnings and limiting the practice in future years. Closing down thatscheme did not exhaust corporate managers’ bag of M&A-related tricks.
The conglomerate Tyco International devised an ingenious means ofdressing up postacquisition performance in its 1998 acquisition of UnitedStates Surgical. Shortly before closing its deal with Tyco, the acquiree took a

198 A CLOSER LOOK AT PROFITS
$190 million write-off, reducing future depreciation charges and therebyboosting future earnings. United States Surgical filed no further financialstatements after taking the write-off, however. The reduction in asset valueswas consequently never reported to investors. After the renowned short-sellerJames Chanos drew journalist Floyd Norris’s attention to the issue, Tyco’schief financial officer provided more details than the New York Times colum-nist had managed to back out of the Tyco’s SEC filings. Norris commentedthat the unreported write-off was significant for the light that it shed onTyco’s reputation for improving the operations of companies that it acquired.8
MANAGING ACQUISITION DATES AND AVOIDING RESTATEMENTS
Although the pooling-of-interests method has been abolished, M&A ac-counting remains an area in which analysts must be on their toes. Com-panies have developed increasingly subtle strategies for exploiting thediscretion afforded by the rules. Maximizing reported earnings in thepostacquisition period remains a key objective.
For example, one M&A-related gambit entails the GAAP-sanctioneduse, for financial reporting purposes, of an acquisition date other than theactual date on which a transaction is consummated. Typically, companiesuse this discretion to simplify the closing of their books at month- or quar-ter-end. For example, if an acquisition agreement is completed on May 27,the acquirer may begin reporting the acquired company’s results in its ownfigures as of May 31.
In 1999, Navigant Consulting (formerly known as Metzler Group andunrelated to the travel-management company Navigant International) ex-ploited the acquisition-date leeway in an unusually aggressive fashion. Theutilities consulting company acquired Penta Advisory Services in mid-September, but designated July 1 as the acquisition date. Following stan-dard practice under purchase accounting rules, Navigant included Penta’srevenues in its own totals from the acquisition date forward. Navigant’s rev-enue therefore received a boost for the entire third quarter, even thoughPenta entered the corporate fold only at the tail end of the period.
To be sure, the numbers involved were small. Penta’s trailing-12-monthsrevenues were in the range of $5 million to $6 million, while Navigant’s1998 sales were $348 million. Nevertheless, Merrill Lynch analyst ThatcherThompson took management to task for shifting the acquisition date by 21⁄2months. It was a more aggressive approach, he wrote, than he had ever pre-viously observed under comparable circumstances.9

Mergers-and-Acquisitions Accounting 199
Thompson was not the only commentator with qualms about Navi-gant’s merger accounting, notwithstanding its number-three ranking, at thetime, on the Forbes list of the Best Small Companies in America. Othercritics focused on management’s exploitation of the standards, which werelater tightened up, governing the classification of acquisitions as materialto overall financial results. Under Securities and Exchange Commissionrules, companies do not have to restate previous statements to reflect therevenues and earnings of acquired businesses deemed immaterial in size.Navigant grew rapidly after going public in 1996 by making many moderate-size acquisitions. Individually, the acquired consulting businesses were im-material under GAAP, but collectively, they had a large impact on thecompany’s results.
Barron’s columnist Barry Henderson estimated revenues for Navigant’s1998 acquisitions for the final three quarters of 1998 by tracing the increasein shares outstanding, quarter by quarter.10 He deducted the number ofshares representing exercise of management stock options to estimate howmany shares were issued to pay for acquisitions. Multiplying this figure bythe share price gave the estimated dollar amount paid for acquisitions dur-ing the quarter. (To be conservative, the journalist used the minimum stockprice for the period.) Next, Henderson divided the estimated aggregate ac-quisition price by 2.2, the multiple of trailing-12-months revenue that Navi-gant said it usually paid for consulting businesses. The answer representeda reasonable estimate of the revenues produced by the “immaterial” com-panies acquired during the second through fourth quarters of 1998. If Nav-igant had been required to restate its 1998 first-quarter results for thesetransactions, Henderson concluded, revenue would have been $83 millionto $84 million, instead of the $79 million reported. That would have re-duced first-quarter 1999 year-over-year revenue growth to around 16%from the sexier 22% commonly cited by securities analysts.
As it turned out, investors were wise to react to the red flag raised byNavigant’s liberal accounting for acquisitions. On November 22, chairmanand chief executive officer Robert P. Maher resigned under pressure, touch-ing off a 48% plunge in Navigant’s stock. The company’s directors had un-covered evidence that Maher and two other senior officials were involved in“inappropriate” stock purchases.
In brief, Maher borrowed $10 million from the company in August1999, saying it was for a real estate investment.11 Navigant’s board subse-quently came to believe that he in fact advanced the funds to StephenDenari, the company’s vice president of corporate development. Denari hadborrowed a like amount to purchase Navigant shares at $28.3912 from theformer owner of a company that Navigant had acquired for stock. A short
200 A CLOSER LOOK AT PROFITS
while later, the shares soared to $54.25 when Navigant hired a financial ad-viser to explore strategic options, including a possible sale of the company.13
Besides leading to the CEO’s resignation, these machinations affectedthe accounting for four acquisitions that Navigant had treated as pooling-of-interests transactions in the first quarter of 1999. To qualify as a poolingunder APB 16, a business combination must entail no planned transactionsthat would benefit some shareholders. For example, there can be no guar-antee of loans secured by stock issued in the combination, which would ef-fectively negate the transfer of risk implicit in a bona fide exchange ofsecurities. Reacquisitions of stock and special distributions are likewiseprohibited. After a review by a special committee of the board of directors,Navigant’s auditors reclassified the earlier pooling transactions as pur-chases. The retroactive change necessitated a 34% downward restatementof the company’s operating income for the first three quarters of 1999, re-flecting the goodwill amortization required under purchase accounting.
CONCLUSION
With the abolition of pooling-of-interests accounting, companies will un-doubtedly turn to new methods of disguising the true impact of their merg-ers and acquisitions. Navigant Consulting’s aggressiveness in determiningthe transaction date is but one illustration of financial executives’ boundlessingenuity in playing with numbers. Regulators may tighten up rules that canbe abused, such as the standards for materiality, but corporate managersusually manage to stay one step ahead. Analysts who hope to understandthe thought process of the field’s most notorious innovators would do wellto study the classic gambits employed in the M&A area.

201
CHAPTER 11Profits in Pensions
I n 1999, International Business Machines (IBM) reported operating in-come of $11,927 billion. Of that amount, $799 million, or 6.7%, had
nothing directly to do with the sale of computers. Instead, it represented in-vestment returns on the computer manufacturer’s pension plans.
Under SFAS No. 87, “Accounting for Pensions,” the investment returnson a corporate pension plan’s investment portfolio flow into the sponsoringcompany’s operating income. Management can elect to capitalize all or aportion of the year’s net pension benefit (cost) as part of inventory and thenrun it through cost of goods sold. Alternatively, the company can recognizethe pension-related income by reducing its selling, general, and administra-tive expenses.
As Exhibit 11.1 shows, IBM’s income statement for 1999 does notbreak out this component of earnings. The statement highlights severalNotes to Financial Statements (indicated by the letters K, P, Q, S, and T),but not Note W (“Retirement Plans”). Neither does IBM mention the im-pact of pension-related income in the 1999 Management Discussion. To as-certain the pension plans’ $799 million contribution to the bottom line,analysts must be diligent in plucking from Note W the net periodic pensionbenefit of $638 million for U.S. plans and $161 million for non-U.S. plans.
By contrast, the Management Discussion in General Electric’s 1999 an-nual report explicitly refers to pension-related income, which represented asmaller portion (4.1%) of GE’s operating income than IBM’s.1
Principally because of the funding status of the GE Pension Plan (de-scribed in Note 5) and other benefit plans (described in Note 6), principalU.S. postemployment benefit plans contributed cost reductions of $1,062million and $703 million in 1999 and 1998, respectively.2
There is a good reason why General Electric does, and analysts should,take careful note of pension-related income, even though IBM makes noeffort to draw attention to it. During any given year, net pension cost orbenefit depends importantly on the short-run return that the pension plan

202 A CLOSER LOOK AT PROFITS
EXHIBIT 11.1 Statement of Earnings
International Business Machines Corporation and Subsidiary Companies
($000 omitted)
Year Ended December 31
Notes 1999 1998
RevenueHardware $37,041 $35,419Global services 32,172 28,916Software 12,662 11,863Global financing 3,137 2,877Enterprise investments/other 2,536 2,592
Total revenue 87,548 81,667
CostHardware 27,071 24,214Global 23,304 21,125Software 2,240 2,260Global financing 1,446 1,494Enterprise investments/other 1,558 1,702
Total cost 55,619 50,795
Gross profit 31,929 30,872
Operating ExpensesSelling, general and administrative Q 14,729 16,662Research, development and engineering S 5,273 5,046
Total operating expenses 20,002 21,708
Operating income 11,927 9,164Other income, principally interest 557 589Interest expense K 727 713
Income before Income Taxes 11,757 9,040Provision for income taxes P 4,045 2,712
Net income $37,712 $36,328
Earnings per share of common stocksAssuming dilution T $4.12 $3.29*Basic T $4.26 $3.38*
The indicated notes appear on pages 69 through 92 of the IBM document.*Adjusted to reflect a two-for-one stock split effective May 10, 1999.Source: IBM 1999 Annual Report.
Profits in Pensions 203
earns on its assets. As explained in Exhibit 11.2, the plan’s expected returnincreases if the market-related value of plan assets increases.
The 1996–1999 period was a bull market for stocks. Not surprisingly, agrowing portion of IBM’s reported earnings reflected the rising value of thepension plan’s investment portfolio, as opposed to management’s effective-ness in producing and marketing competitive products. From 1.8% of oper-ating income in 1996, net pension benefit grew to 6.7%, as already noted,in 1999. When projecting IBM’s future earnings, it is important to segre-gate genuinely business-related income from profits on retirement plans.Otherwise, the analysis will give management undeserved credit for a gen-eral rise in stock prices.
Accounting specialists within investment bank Bear Stearns’s researchdepartment used the IBM example to underscore further the importance ofscrutinizing pension plan disclosures in the Notes to Financial Statements.They stripped IBM’s 1999 operating income of all pension and retireehealth effects except service cost, which represents the present value of fu-ture benefits earned by employees in the current year. This purer measure ofearnings from operations grew at a compound annual growth rate (CAGR)of 38%, far below the 97% CAGR for the version of operating income thatIBM reported.3 No other company in the Standard & Poor’s 500 index hadas wide a disparity in CAGR, calculated in terms of reported and adjustedoperating income for the period. Considering the key role that compoundannual growth rates play in stock valuations (see Chapter 14), it behoovesanalysts to scrutinize the impact of net pension cost (benefit) on operatingincome, even if the reporting company does not remind them to explorethat subtlety.
Analysts should also note that the accounting rules for pension incomeallow management, within certain bounds, to divert earnings from the non-operating to the operating category. Such a transfer involves form more thansubstance. Nevertheless, it may raise the company’s stock price because in-vestors value operating income more highly than the non-operating variety.
To illustrate, suppose that a company accumulates more cash than itsbusiness requires. If management leaves the cash in the current assets sec-tion of its balance sheet and invests it, the dividends and interest therebygenerated must be recorded as other income. By using the cash to step upthe funding of the pension plan, however, management can produce operat-ing income under SFAS No. 87, as explained previously. Fortunately for un-wary investors, the exploitation of this quirk is limited by Internal RevenueService rules that discourage excessive funding of pension plans.
Another matter meriting close attention involves the multiple opportu-nities for earnings management that pension accounting provides. To begin

204 A CLOSER LOOK AT PROFITS
EXHIBIT 11.2 Components of Net Pension Cost (Benefit)
Service costPresent value of retirement benefits earned by employees working during thecurrent year.
Interest cost on the benefit obligationInterest cost arising from deferred payment of previously earned retirementbenefits. (The benefit obligation consists of all earned and unpaid service cost.)
Amortization of net deferred gains and lossesDeferred recognition of actual earnings on the pension portfolio above or below theexpected return and changes in the benefit obligation that arise from changes in theassumptions (including such items as the discount rate, employee turnover, andmortality) used to estimate it.
Amortization of prior service costRecognition over several periods of an increase or decrease in the benefitobligation that results from the employer deciding to increase or reduce theamount that it expects to pay retired employees for services already performed.
Amortization of the transition amountAmortization of the difference (either positive or negative) between the benefitobligation and the fair value of the assets in the fund at the time the companyadopted FAS No. 87 (sometime between January 1, 1985 and January 1, 1987).
Gain or loss recorded due to a settlement or curtailmentCurrent recognition of some or all previously deferred gains and losses and priorservice costs. A settlement occurs when an employer takes an irrevocable action torelieve itself of primary responsibility for the benefit obligation. A curtailmentoccurs when an employer significantly reduces the expected years of service ofexisting employees or eliminates the accrual of defined benefits for some or all ofexisting employees’ future service.
Expected return on plan assetsA deduction from the other components of pension cost that is a surrogate for theannual return on the fund’s assets. Defined as the product of an expected long-termrate of return and a market-related value of plan assets. Expected return is used inlieu of actual return to minimize annual fluctuations in net pension cost (benefit)resulting from volatility in stock and bond prices.
Adapted from Pat McConnell, Janet Pegg, and David Zion, “Retirement Benefits Im-pact Operating Income,” Bear Stearns, September 17, 1999, pp. 21–22.

Profits in Pensions 205
with, GAAP specifies no period for amortizing the deferred amounts bywhich the plan’s actual earnings exceed or fall short of expected earnings.Five-to-seven-year amortization is typical, but management may abruptlyalter the period to boost or restrain reported earnings as desired.
Furthermore, SFAS No. 87 provides little guidance on determining theexpected rate. In principle, one would expect a company to base its assump-tion on the long-run rates of return observed in stocks, bonds, and othertypes of investments. Once in a great while, the plan might overhaul its long-range investment strategy. The plan’s trustees might deemphasize bonds infavor of a heavier concentration in common stocks, which entail greater riskbut have historically provided higher returns. On still rarer occasions, thepension plan’s actuaries might conclude that a profound structural changein the financial markets warranted a revision of the expected return. Underno reasonable scenario, however, would the plan’s expected return rise orfall with each annual report. Implicit in the long-run expectation is an as-sumption that returns will fluctuate from one year to the next.
In light of this reasoning, some companies’ expectations for long-runreturn change with remarkable frequency. Two of the corporations in Ex-hibit 11.3 (IMC Global and E.W. Scripps) revised their expected returnsseven years in succession. Boeing displayed extraordinary confidence infine-tuning its forecast of investment performance, raising its expected re-turn by 0.33% in 1997 and nudging it up another 0.42% the followingyear. Note, too, that the companies did not simply grow steadily moreoptimistic or pessimistic over the period shown. Instead, they lowered
EXHIBIT 11.3 Expected Return on Plan Assets (Percent)—Selected Companies
Company Name 1991 1992 1993 1994 1995 1996 1997 1998
Boeing 8.5 8.5 8.5 8.0 8.0 8.0 8.33 8.75Caterpillar 9.6 9.9 9.9 9.4 9.4 9.4 9.5 9.6Del Laboratories 9.5 9.5 9.5 9.5 8.0 8.0 8.0 9.0IMC Global 9.6 9.7 9.2 7.9 7.8 7.0 9.6 9.9Laclede Steel 11.0 11.0 11.7 9.9 9.8 9.8 9.9 10.0Moog 9.0 9.0 9.0 8.9 8.2 8.6 8.5 9.0Northeast Utilities 9.7 9.0 8.5 8.5 8.5 8.75 9.25 9.5Scripps (E.W.) 9.5 9.0 8.0 9.5 8.0 8.5 7.5 8.5Sysco 12.0 12.0 12.0 10.0 9.0 9.0 9.0 10.5UST 12.0 12.0 9.5 9.0 9.0 8.0 8.0 9.0
Source: Standard & Poor’s Compustat.

206 A CLOSER LOOK AT PROFITS
their expected returns during the mid-1990s, by and large, then raised themagain toward the end of the decade. Skeptical analysts are bound to suspectcorporate managers of ratcheting expected returns up and down to smoothreported operating earnings, rather than to reflect profound, long-lastingchanges in the financial markets.
A final point to keep in mind regarding pension plans is that manage-ment cannot invariably modulate their impact on reported earnings as de-sired. Among the effects described in Exhibit 11.2 is the gain or loss thatmay arise from settlement of a pension liability. Such events may be largeenough to spoil attempts to fine-tune the bottom line.
Westinghouse Electric’s 1994 performance represented a case in point.Management cut 1,200 jobs as part of a corporate restructuring. As a re-sult, the company was obliged to distribute pension benefits in lump sumsto the employees eliminated in the program. Under SFAS No. 88 (“Employ-ers’ Accounting for Settlements and Curtailments of Defined Benefit Pen-sion Plans and for Termination of Benefits”), management had no choicebut to recognize a $308 million loss. This was a highly material item, con-sidering that pretax income from continuing operations, before minority in-terest, came to only $157 million in 1994.
AN ADMONITION FROM THE SEC
Corporate reticence regarding dependence on pension-related earnings hasnot gone unnoticed by journalists and investors. Reacting to the amount ofsleuthing required to nail down IBM’s pension-related income, shareholder-employees of the company urged management to provide better informationon the matter. IBM’s senior counsel responded with a letter to the Securitiesand Exchange Commission emphasizing that the company’s disclosure ofpension income was consistent with the accounting rules.
The SEC, for its part, came down clearly on the side of more explicitdisclosure. In an October 13, 2000, letter to accountants, SEC accountingchief Lynn Turner focused on the impact on pension costs of large swings inthe market value of pension assets. He also noted that companies might re-duce their pension costs by converting from traditional defined benefitplans to cash balance plans. Like any other event materially affecting cur-rent or future operations and cash flows, wrote Turner, these pension-related events ought to be addressed in the management discussion andanalysis section of the financial statements. The chief accountant added thatthe SEC would order companies to redo their annual reports if they failedto provide adequate information. For good measure, Turner reminded

Profits in Pensions 207
companies to use the “best estimate” for any assumption underlying theirestimates of pension liabilities. This comment was taken to reflect analysts’concerns that companies were overly optimistic about future rates of returnon their pension portfolios.4
CONCLUSION
A corporation’s pension plan is not an obvious place to look for artificiallyinflated profits. In principle, the company does not derive benefits from theplan, which is administered by the trustees for the sole benefit of the em-ployees. Rather, the corporation’s chief role in the pension fund is to con-tribute money to it. By rights, the main reason that users of financialstatements should be concerned about the pension accounting is that if theplan is inadequately funded, the required contributions may strain the cor-poration’s finances. In the event of a bankruptcy, creditors might find them-selves waiting in line behind a huge claim on the company’s assets, in theform of unfunded liabilities.
That, at least, is how things ought to work. Clever corporate managers,however, have transformed pension plans into devices for smoothing earn-ings and shifting income from the nonoperating to the operating category.Analysts must be on the lookout for potential abuses, notwithstanding thearcane calculations that underlie the pension plans’ stated assets, liabilities,and investment returns.


PARTfourForecasts and
Security Analysis


211
CHAPTER 12Forecasting Financial Statements
Analysis of a company’s current financial statements, as described in theChapters 2 through 4, is enlightening, but not as enlightening as the
analysis of its future financial statements. After all, it is future earnings anddividends that determine the value of a company’s stock (see Chapter 14)and the relative likelihood of future timely payments of debt service that de-termines credit quality (see Chapter 13). To be sure, investors rely to someextent on the past as an indication of the future. Because already-reportedfinancials are available to everyone, however, studying them is unlikely toprovide any significant advantage over competing investors. To capture fun-damental value that is not already reflected in securities prices, the analystmust act on the earnings and credit quality measures that will appear on fu-ture statements.
Naturally, the analyst cannot know with certainty what a company’s fu-ture financial statements will look like. Neither are financial projectionsmere guesswork, however. The process is an extension of historical patternsand relationships, based on assumptions about future economic conditions,market behavior, and managerial actions.
Financial projections will correspond to actual future results only to theextent that the assumptions prove accurate. Analysts should therefore ener-getically gather information beyond the statements themselves. They mustconstantly seek to improve the quality of their assumptions by expandingtheir contacts among customers, suppliers, and competitors of the companiesthey analyze.
A TYPICAL ONE-YEAR PROJECTION
The following one-year projection works through the effects of the analyst’sassumptions on all three basic financial statements. There is probably nobetter way than following the numbers in this manner to appreciate the

212
EXHI
BIT
12.1
Fina
ncia
l Sta
tem
ents
of
Col
ossa
l Che
mic
al C
orpo
rati
on Y
ear
End
ed D
ecem
ber
31, 2
001
($00
0 om
itte
d)
Inco
me
Stat
emen
tSt
atem
ent
of C
ash
Flow
s
Sale
s$1
,991
Sour
ces
Cos
t of
goo
ds s
old
1,33
4N
et in
com
e$
85Se
lling
, gen
eral
, and
adm
inis
trat
ive
expe
nse
299
Dep
reci
atio
n11
9D
epre
ciat
ion
119
Def
erre
d in
com
e ta
xes
20R
esea
rch
and
deve
lopm
ent
80W
orki
ng c
apit
al c
hang
es, e
xclu
ding
ca
sh a
nd b
orro
win
gs(8
)
Tota
l cos
ts a
nd e
xpen
ses
1,83
2Fu
nds
prov
ided
by
oper
atio
ns21
6
Use
sO
pera
ting
Inc
ome
159
Add
itio
ns t
o pr
oper
ty, p
lant
, In
tere
st e
xpen
se36
and
equi
pmen
t12
5In
tere
st (
inco
me)
(6)
Div
iden
ds28
Ear
ning
s be
fore
inco
me
taxe
s12
9R
educ
tion
of
long
-ter
m d
ebt
60
Prov
isio
n fo
r in
com
e ta
xes
44Fu
nds
used
by
oper
atio
ns21
3
Net
inco
me
$85
Net
incr
ease
in f
unds
$3
Bal
ance
She
et
Cas
h an
d m
arke
tabl
e se
curi
ties
$69
Not
es p
ayab
le$
21A
ccou
nts
rece
ivab
le43
9A
ccou
nts
paya
ble
263
Cur
rent
por
tion
of
long
-ter
m d
ebt
32
Inve
ntor
ies
351
Tota
l cur
rent
liab
iliti
es31
6
Tota
l cur
rent
ass
ets
859
Lon
g-te
rm d
ebt
379
Prop
erty
, pla
nt, a
nd e
quip
men
t89
5D
efer
red
inco
me
taxe
s70
$1,7
54Sh
areh
olde
rs’ e
quit
y98
9
$1,7
54

Forecasting Financial Statements 213
interrelatedness of the income statement, the cash flow statement, and thebalance sheet.
Exhibit 12.1 displays the current financial statements of a fictitiouscompany, Colossal Chemical Corporation. The historical statements consti-tute a starting point for the projection by affirming the reasonableness ofassumptions about future financial performance. It will be assumedthroughout the commentary on the Colossal Chemical projection that theanalyst has studied the company’s results over not only the preceding yearbut also over the past several years.
Projected Income Statement
The financial projection begins with an earnings forecast (Exhibit 12.2). Twokey figures from the projected income statement, net income and deprecia-tion, will later be incorporated into a projected statement of cash flows. Thecash flow statement, in turn, will supply data for constructing a projectedbalance sheet. At each succeeding stage, the analyst will have to make addi-tional assumptions. The logical flow, however, begins with a forecast of earn-ings, which will significantly shape the appearance of all three statements.
EXHIBIT 12.2 Earnings Forecast
Colossal Chemical Corporation Projected Income Statement($000 omitted)
2002
Sales $2,110Cost of goods sold 1,393Selling, general, and administrative expense 317Depreciation 121Research and development 84
Total costs and expenses 1,915
Operating Income 195Interest expense 34Interest (income) (5)
Earnings before income taxes 166Provision for income taxes 56
Net income $ 110

214 FORECASTS AND SECURITY ANALYSIS
Immediately following is a discussion of the assumptions underlyingeach line in the income statement, presented in order from top (sales) tobottom (net income).
Sales The projected $2.110 billion for 2002 represents an assumed rise of6% over the actual figure for 2001 shown in Exhibit 12.1. Of this increase,higher shipments will account for 2% and higher prices for 4%.
To arrive at these figures, the analyst builds a forecast “from the groundup,” using the historical segment data shown in Exhibit 12.3. Sales projec-tions for the company’s business, basic chemicals, plastics, and industrialchemicals, can be developed with the help of such sources as trade publica-tions, trade associations, and firms that sell econometric forecasting models.
EXHIBIT 12.3 Sales Forecast
Colossal Chemical Corporation Results by Industry Segment($000 omitted)
2001 2002 2003 2004 2005
SalesBasic chemicals $ 975 $ 921 $ 878 $ 807 $ 786Plastics 433 422 399 370 373Industrial chemicals 583 546 531 475 461
Total $1,991 $1,889 $1,808 $1,652 $1,620
Operating IncomeBasic chemicals $ 94 $ 82 $ 65 $ 52 $ 59Plastics 24 16 25 41 26Industrial chemicals 41 35 28 31 28
Total $ 159 $ 133 $ 118 $ 124 $ 113
DepreciationBasic chemicals $ 55 $ 51 $ 50 $ 46 $ 46Plastics 27 25 22 20 19Industrial chemicals 37 36 35 31 31
Total $ 119 $ 112 $ 107 $ 97 $ 96
Identifiable AssetsBasic chemicals $ 813 $ 772 $ 741 $ 676 $ 674Plastics 390 369 352 314 309Industrial chemicals 551 530 510 457 456
Total $1,754 $1,671 $1,603 $1,447 $1,439

Forecasting Financial Statements 215
Certain assumptions about economic growth (increase in gross domesticproduct) in the coming year underlie all such forecasts. The analyst must becareful to ascertain the forecaster’s underlying assumptions and judgewhether they seem realistic.
If the analyst is expected to produce an earnings projection that is con-sistent with an in-house economic forecast, then it will be critical to estab-lish a historical relationship between key indicators and the shipments ofthe company’s various business segments. For example, a particular seg-ment’s shipments may have historically grown at 1.5 times the rate of indus-trial production or have fluctuated in essentially direct proportion tohousing starts. Similarly, price increases should be linked to the expected in-flation level. Depending on the product, this will be represented by eitherthe Consumer Price Index or the Producer Price Index.
Basic industries such as chemicals, paper, and capital goods tend tolend themselves best to the macroeconomic-based approach described here.In technology-driven industries and “hits-driven” businesses such as mo-tion pictures and toys, the connection between sales and the general eco-nomic trend will tend to be looser. Forecasting in such circumstancesdepends largely on developing contacts within the industry being studied.The objective is to make intelligent guesses about the probable success of acompany’s new products.
A history of sales by geographic area (Exhibit 12.4) provides anotherinput into the sales projection. An analyst can modify the figures derived
EXHIBIT 12.4 Colossal Chemical Corporation Results by Geographic Area ($000 omitted)
2001 2002 2003 2004 2005
SalesNorth America $1,077 $1,019 $ 968 $ 896 $ 873Europe 649 622 601 551 526Latin America 102 87 90 99 103Far East 163 161 149 106 118
$1,991 $1,889 $1,808 $1,652 $1,620
Operating IncomeNorth America $ 43 $ 36 $ 29 $ 32 $ 25Europe 77 62 61 47 52Latin America 26 16 17 24 17Far East 13 19 11 21 19
$ 159 $ 133 $ 118 $ 124 $ 113

216 FORECASTS AND SECURITY ANALYSIS
from industry segment forecasts to reflect expectations of unusually strongor unusually weak economic performance in a particular region of theglobe. Likewise, a company may be experiencing an unusual problem in acertain region, such as a dispute with a foreign government. The geographicsales breakdown can furnish some insight into the magnitude of the ex-pected impact of such occurrences.
Cost of Goods Sold The $1,393-billion cost-of-goods-sold figure in Exhibit12.2 represents 66% of projected sales. That corresponds to a gross marginof 34%, a slight improvement over the preceding year’s 33%. The projectedgross margin for a company in turn reflects expectations about changes incosts of labor and material. Also influencing the gross margin forecast is theexpected intensity of industry competition, which affects a company’s abil-ity to pass cost increases on to customers or to retain cost decreases.
In a capital-intensive business such as basic chemicals, the projected ca-pacity utilization percentage (for both the company and the industry) is akey variable. At full capacity, fixed costs are spread out over the largest pos-sible volume, so unit costs are minimized. Furthermore, if demand exceedscapacity so that all producers are running flat out, none will have an incen-tive to increase volume by cutting prices. When such conditions prevail, costincreases will be fully (or more than fully) passed on and gross margins willwiden. That will be the result, at least, until new industry capacity is built,bringing supply and demand back into balance. Conversely, if demand wereexpected to fall rather than rise in 2002, leading to a decline in capacity uti-lization, Exhibit 12.2’s projected gross margin would probably be lowerthan in 2001, rather than higher. (For further discussion of the interactionof fixed and variable costs, see Chapter 3.)
As with sales, the analyst can project cost of goods sold from the bot-tom up, segment by segment. Since the segment information in Exhibit 12.3shows only operating income, and not gross margin, the analyst must addsegment depreciation to operating income, then make assumptions aboutthe allocation of selling, general, and administrative expense and researchand development expense by segment. For example, operating income bysegment for 2001 works out as shown in Exhibit 12.5, if SG&A and R&Dexpenses are allocated in proportion to segment sales.
By compiling the requisite data for a period of several years, the analystcan devise models for forecasting gross margin percentage on a segment-by-segment basis.
Selling, General, and Administrative Expense The forecast in Exhibit 12.2 as-sumes continuation of a stable relationship in which SG&A expense has his-torically approximated 15% of sales. The analyst would vary this percentage
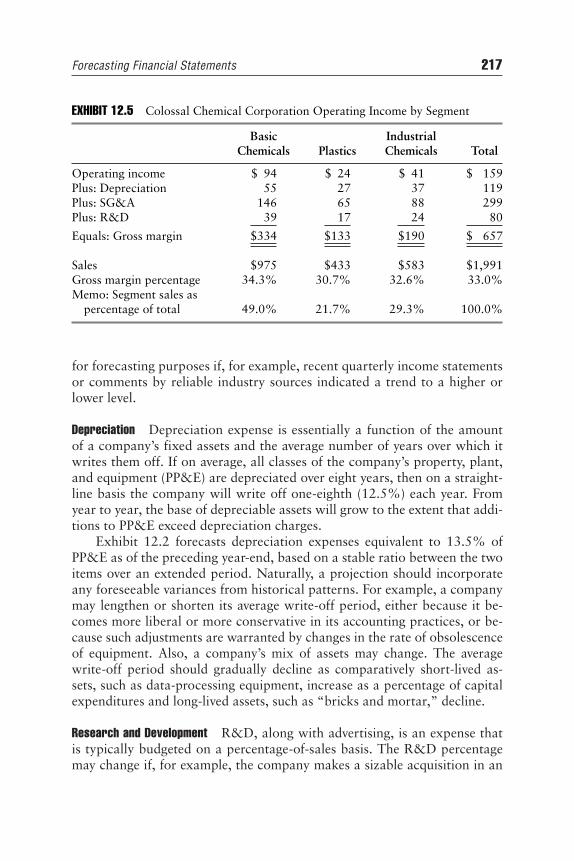
Forecasting Financial Statements 217
for forecasting purposes if, for example, recent quarterly income statementsor comments by reliable industry sources indicated a trend to a higher orlower level.
Depreciation Depreciation expense is essentially a function of the amountof a company’s fixed assets and the average number of years over which itwrites them off. If on average, all classes of the company’s property, plant,and equipment (PP&E) are depreciated over eight years, then on a straight-line basis the company will write off one-eighth (12.5%) each year. Fromyear to year, the base of depreciable assets will grow to the extent that addi-tions to PP&E exceed depreciation charges.
Exhibit 12.2 forecasts depreciation expenses equivalent to 13.5% ofPP&E as of the preceding year-end, based on a stable ratio between the twoitems over an extended period. Naturally, a projection should incorporateany foreseeable variances from historical patterns. For example, a companymay lengthen or shorten its average write-off period, either because it be-comes more liberal or more conservative in its accounting practices, or be-cause such adjustments are warranted by changes in the rate of obsolescenceof equipment. Also, a company’s mix of assets may change. The averagewrite-off period should gradually decline as comparatively short-lived as-sets, such as data-processing equipment, increase as a percentage of capitalexpenditures and long-lived assets, such as “bricks and mortar,” decline.
Research and Development R&D, along with advertising, is an expense thatis typically budgeted on a percentage-of-sales basis. The R&D percentagemay change if, for example, the company makes a sizable acquisition in an
EXHIBIT 12.5 Colossal Chemical Corporation Operating Income by Segment
Basic IndustrialChemicals Plastics Chemicals Total
Operating income $ 94 $ 24 $ 41 $ 159Plus: Depreciation 55 27 37 119Plus: SG&A 146 65 88 299Plus: R&D 39 17 24 80
Equals: Gross margin $334 $133 $190 $ 657
Sales $975 $433 $583 $1,991Gross margin percentage 34.3% 30.7% 32.6% 33.0%Memo: Segment sales as
percentage of total 49.0% 21.7% 29.3% 100.0%

218 FORECASTS AND SECURITY ANALYSIS
industry that is either significantly more, or significantly less, research-intensive than its existing operations. In addition, changing incentives forresearch, such as extended or reduced patent protection periods, may alterthe percentage of sales a company believes it must spend on research to re-main competitive. Barring developments of this sort, however, the analystcan feel fairly confident in expecting that the coming year’s R&D expensewill represent about the same percentage of sales as it did last year. Such anassumption (at 4% of sales) is built into Exhibit 12.2.
Operating Income The four projected expense lines are summed to derivetotal costs and expenses. The total ($1,915 million) is subtracted from pro-jected sales to calculate projected operating income of $195 million.
EXHIBIT 12.6 Details of Long-Term Debt, Short-Term Debt, and Interest Expense
Colossal Chemical Corporation($000 omitted)
Long-Term Debt(Excluding Current Maturities) 2001 2000
10.0% notes payable 2003 $ 52 $ 788.1% notes payable 2007 77 1119.5% debentures due 2010 75 758.875% debentures due 2014 125 1256.5% industrial development bonds due 2017 50 50
$379 $439
Long-Term Debt 2001
Average interest rate for year 8.50%Average annual amount outstanding $29Annual maturities of long-term debt for the next five years are as follows:
2002 $27 million2003 $13 million2004 $22 million2005 $18 million2006 $31 million
Interest Expense 2001
Interest incurred 41Capitalized interest 5Interest expense 36

Forecasting Financial Statements 219
Interest Expense Exhibit 12.6 displays information found in the Notes toFinancial Statements that can be used to estimate the coming year’s interestexpense. (Not every annual report provides the amount of detail shownhere. Greater reliance on assumptions is required when the information issketchier.)
The key to the forecasting method employed here is to estimate Colos-sal Chemical’s embedded cost of debt, that is, the weighted average interestrate on the company’s existing long-term debt. Using the details of individ-ual long-term issues shown in Exhibit 12.5, the calculation goes as follows:
Applying the embedded cost of 8.7% to Colossal’s 2001 year-end long-term debt (including current maturities, which are assumed to carry thesame average interest rate) produces projected interest charges of $35.8 mil-lion. As shown in Exhibit 12.6, the 2002 cash flow projection suggests nosubstantial reduction in debt outstanding during 2002. Accordingly, themethod employed here should not prove far off the mark, even though it ismerely an approximation.
($000 omitted)
Average EstimatedAmount Interest Charges on
(2000 Amount + 2001 Amount) ÷2= Outstanding @Rate = Long-Term Debt
(78 + 52) ÷2= 65 @ 10.0%= $ 6,500(111 + 77) ÷2= 94 @ 8.1%= 7,614(75 + 75) ÷2= 75 @ 9.5%= 7,125
(125 + 125) ÷2= 125 @ 8.875%= 11,094(50 + 50) ÷2= 50 @ 6.5%= 3,250
Average Amountof Total Long-Term Embedded Cost of
Interest Charges on Long-Term Debt Debt Outstanding Long-Term Debt
$35.58 ÷ ([$439 + $379]/2) = 8.70%
($000 omitted)
Interest charges on long-term debt $35.80Interest charges on short-term debt ($32 @ 9%) 2.9
Total interest charges $38.70
Interest incurred $39Capitalized interest 5
Interest expense $34

220 FORECASTS AND SECURITY ANALYSIS
To the $35.8-million figure, the forecaster must add interest charges re-lated to the short-term debt. These projections assume an average outstand-ing balance of $32 million, 10% higher than in 2001. The assumed averageinterest rate is 9%, based on an expectation of slightly higher rates in 2002:
The $38.7-million figure represents total interest that Colossal is ex-pected to incur in 2002. From this amount, the forecaster must subtract anassumed level of capitalized interest to obtain projected interest expense.Exhibit 12.2 simply projects capitalized interest at the same level in 2002 asin 2001:
Readers should bear in mind that the method described here for pro-jecting interest expense involves a certain amount of simplification. Appliedretroactively, it will not necessarily produce the precise interest expenseshown in the historical financial statements. For one thing, paydowns oflong-term debt will not come uniformly at midyear, as implicitly assumedby the estimation procedure for average amounts of long-term debt out-standing. Certainly, analysts should recognize and adjust for major, foresee-able changes in interest costs, such as refinancing of high-coupon bondswith cheaper borrowings. By the same token, forecasters should not gooverboard in seeking precision on this particular item. For conservativelycapitalized industrial corporations, interest expense typically runs in therange of 1% to 2% of sales, so a 10% error in estimating the item will havelittle impact on the net earnings forecast. Analysts should reserve their en-ergy in projecting interest expense for more highly leveraged companies.Their financial viability may depend on the size of the interest expense“nut” they must cover each quarter.
($000 omitted)
Interest charges on long-term debt $35.8Interest charges on short-term debt ($32 at 9%) 2.9
Total interest charges $38.7
($000 omitted)
Interest expenseInterest incurred $39Capitalized interest 5
$34

Forecasting Financial Statements 221
Interest Income Exhibit 12.2 incorporates a forecast of an unchanged cashbalance for 1995. Based on expectations of an average money market rateof return of 7.0% on corporate cash, the average balance of $69 million willgenerate (in round figures) $5 million of interest income.
Provision for Income Taxes Following the deduction of interest expense andthe addition of interest income, earnings before income taxes stand at $166million. The forecast reduces this figure by the statutory tax rate of 34%,based on Colossal’s effective rate having historically approximated thestatutory rate. For other companies, effective rates could vary widely as aresult of tax loss carryforwards and investment tax credits, among otheritems. Management will ordinarily be able to provide some guidance re-garding major changes in the effective rate, while changes in the statutoryrate are widely publicized by media coverage of federal tax legislation.
Projected Statement of Cash Flows
The completed income statement projection supplies the first two lines ofthe projected statement of cash flows (Exhibit 12.7). Net income of $110million and depreciation of $121 million come directly from Exhibit 12.2and largely determine the total sources (funds provided by operations) fig-ure. The other two items have only a small impact on the projections.
Deferred Income Taxes This figure can vary somewhat unpredictably fromyear to year, based on changes in the gap between tax and book deprecia-tion and miscellaneous factors such as leases, installment receivables, andunremitted earnings of foreign subsidiaries. Input from company manage-ment may help in the forecasting of this figure. The $25-million figureshown in Exhibit 12.7 is a trend-line projection.
Working Capital Changes (Excluding Cash and Borrowings) Details of the deriva-tion of the $43-million projection appear at the bottom of Exhibit 12.7.The forecast assumes that each working capital item remains at the samepercentage of sales shown in the historical statements in Exhibit 12.1. Ac-counts receivable, for example, at 22% of sales, rises from $439 million to$464 million (an increase of $25 million) as sales grow from $1,991 millionin 2001 to a projected $2,110 million in 2002. Before assuming a constant-percentage relationship, the analyst must verify that the most recent year’sratios are representative of experience over several years. Potential futuredeviations from historical norms must likewise be considered. For example,a sharp drop in sales may produce involuntary inventory accumulation or a

222 FORECASTS AND SECURITY ANALYSIS
rise in accounts receivable as the company attempts to stimulate its sales byoffering easier credit terms.
Additions to Property, Plant, and Equipment The first and largest of the uses onthis cash flow projection is capital expenditures. A company may provide aspecific capital spending projection in its annual report, then, as the yearprogresses, update its estimate in its quarterly statements or 10-Q reportsand in press releases. Even if the company does not publish a specific num-ber, its investor-relations officer will ordinarily respond to questions aboutthe range, or at least the direction (up, down, or flat) for the coming year.
Dividends The $37-million figure shown assumes that Colossal will continueits stated policy of paying out in dividends approximately one-third of itssustainable earnings (excluding extraordinary gains and losses). Typically,
EXHIBIT 12.7 Projected Statement of Cash Flows, 2002
Colossal Chemical Corporation($000 omitted)
SourcesNet income $110Depreciation 121Deferred income taxes 25Working capital changes, excluding
cash and borrowings (43)Cash provided by operations 213
UsesAdditions to property, plant,
and equipment 165Dividends 37Repayment of current maturities
of long-term debt 32Cash used by operations 234Net cash provided (used) by operations (21)Increase in notes payable $ 21
Changes in Working CapitalDecrease (increase) in accounts receivable $ (25)Decrease (increase) in inventories (29)Increase (decrease) in accounts payable 11
$ (43)

Forecasting Financial Statements 223
this sort of guideline is interpreted as an average payout over time, so thatthe dividend rate does not fluctuate over a normal business cycle to thesame extent that earnings do. A company may even avoid cutting its divi-dend through a year or more of losses, borrowing to maintain the payout ifnecessary. This practice often invites criticism and may stir debate withinthe board of directors, where the authority to declare dividends resides.
Until the board officially announces its decision, an analyst attemptingto project future dividends can make only an educated guess. In a difficultearnings environment, moreover, a decision to maintain the dividend in onequarter is no assurance that the board will decide the same way threemonths later.
Repayment of Current Maturities of Long-Term Debt The $32-million figureshown comes directly from the current liabilities section of the balancesheet in Exhibit 12.1.
Increase in Notes Payable Subtracting $234 million of cash used in opera-tions from the $213 million provided by operations produces a net use of$21 million. This projection assumes that any net cash generated will be ap-plied to debt retirement. A net cash use, on the other hand, will be made upthrough drawing down short-term bank lines. Underlying these assump-tions about the company’s actions are management’s stated objectives andsome knowledge of how faithfully management has stuck to its plans in thepast. Other assumptions might be more appropriate in other circumstances.For example, a net provision or use of cash might be offset by a reduction orincrease in cash and marketable securities. A sizable net cash provisionmight be presumed to be directed toward share repurchase, reducing share-holders’ equity, if management has indicated a desire to buy in stock and isauthorized to do so by its board of directors. Instead of making up a largecash shortfall with short-term debt, a company might instead fund the bor-rowings as quickly as possible (add to its long-term debt). Alternatively, acompany may have a practice of financing any large cash need with a com-bination of long-term debt and equity, using the proportions of each thatare required to keep its ratio of debt to equity at some constant level.
Projected Balance Sheet
Constructing the projected balance sheet (Exhibit 12.8) requires no additionalassumptions beyond those made in projecting the income statement and state-ment of cash flows. The analyst simply updates the historical balance sheet inExhibit 12.1 on the basis of information drawn from the other statements.

224 FORECASTS AND SECURITY ANALYSIS
Most of the required information appears in the projected statement ofcash flows (Exhibit 12.7). Accounts receivable, inventories, and accountspayable, for example, reflect the projected changes in working capital. Thecash flow projection would likewise show any increase or decrease in cashand marketable securities, an item that in this case remains flat. Property,plant, and equipment rises from the prior year’s level of $895 million by$165 million of additions, less $121 million of depreciation. The projectedcash flow statement also furnishes the increases in notes payable and de-ferred income taxes, as well as the change in shareholders’ equity (net in-come less dividends).
The details of long-term debt in the historical balance sheet (Exhibit12.6) provide the figures needed to complete the projection of long-termdebt. With the 2001 current maturities of long-term debt ($32 million) hav-ing been paid off, the 2002 current maturities ($27 million) take their placeon the balance sheet. The $27-million figure is also deducted from 2001’s(noncurrent) long-term debt of $379 million to produce the new figure of$352 million. (Any further adjustments to long-term debt, of which thereare none in these projections, would appear in the projected statement ofcash flows.)
SENSITIVITY ANALYSIS WITH PROJECTED FINANCIAL STATEMENTS
Preparing a set of projected financial statements provides a glimpse at acompany’s future financial condition, given certain assumptions. The ana-lyst can study the projected statements using the same techniques discussed
EXHIBIT 12.8 Colossal Chemical Corporation Projected Balance Sheet December 31, 2002 ($000 omitted)
Cash and marketable securities $ 69 Notes payable $ 42Accounts receivable 464 Accounts payable 274
Current portion ofInventories 380 long-term debt 27
Total current assets 913 Total current liabilities 343Long-term debt 352Deferred income taxes 95
Property, plant and equipment 939 Shareholders’ equity 1,062
$1,852 $1,852

Forecasting Financial Statements 225
in Chapters 2 through 4 for the historical statements and also use them tocalculate the ratios employed in credit analysis (Chapter 13) and equityanalysis (Chapter 14). Based on the historical and projected data in Ex-hibits 12.1 through 12.8, Colossal Chemical’s credit quality measures willimprove in 2002 (Exhibit 12.9). Total debt will decline, not only in absoluteterms, but also as a percentage of total capital—from 29.0% to 26.7%. Si-miliarly, total debt as a multiple of cash provided by operations will fallfrom 1.93x to 1.64x. As explained in Chapter 13, both of these trends indi-cate reduced financial risk. These projected ratios are only as reliable as theassumptions underlying the projected statements that generated them. Log-ical though they may seem, the assumptions rest heavily on macroeconomicforecasting, which is far from an exact science, to put it charitably. Typi-cally, the analyst must modify the underlying economic assumptions, andtherefore the projections, several times during the year as business activitydiverges from forecasted levels.
Knowing that conditions can, and in all likelihood will, change, wiseinvestors and lenders will not base their decisions entirely on a single set of
EXHIBIT 12.9 Trend of Credit Quality Measures—Base Case
Colossal Chemical Corporation($000 omitted)
2002 2001(Projected)* (Actual)†
Total DebtNotes payable $ 42 $ 21Current portion of long-term debt 27 32Long-term debt 352 379
421 432Deferred income taxes 95 70Shareholders’ equity 1,062 989
Total capital $1,578 $1,491
Total debt as a percentage of total capital 26.7% 29.0%
Cash provided by operations (before working capital charges) 256 224
Total debt 421 432
Total debt as a multiple of cash provided 1.64x 1.93x
*From Exhibit 12.8.† From Exhibit 12.1.

226 FORECASTS AND SECURITY ANALYSIS
EXHIBIT 12.10 Sensitivity Analysis Projected Financial Statements
Colossal Chemical CorporationYear Ended December 31, 2001
($000 omitted)Base Case (Exhibit 12.2) Sales Growth Assumption Reduced from 6% to 3%
(No improvement in gross margin over preceding year)
Income Statement Statement of Cash Flow
Sales $2,051Cost of goods sold 1,374Selling, general, and
administrative expense 308Depreciation 121Research and development 82
Total costs and expenses 1,885
Operating Income 166Interest expense 34Interest (income) (5)
Earnings before income taxes 137Provision for income taxes 47
Net income $ 90
Balance Sheet
Cash and marketable securities $ 69
Accounts receivable 451Inventories 369
Total current assets 889Property, plant, and
equipment 939
$1,828
SourcesNet income $ 90Depreciation 121Deferred income taxes 25Working capital changes, exclud-
ing cash and borrowings (26)
Cash provided by operations $ 210
UsesAdditions to property, plant,
and equipment 165Dividends 30Repayment of current
maturities of long-term debt 32Cash provided by operations 227
Net cash provided (used) byoperations (17)
Increase in long-term debt 17
Net change in cash $ 0
Notes payable $ 21Accounts payable 267Current portion of long-term debt 27
Total current liabilities $ 315Long-term debt 369Deferred income taxes 95Shareholders’ equity 1,049
$1,828

Forecasting Financial Statements 227
projections, or “point forecast.” Instead, they will assess the risks and po-tential rewards in light of a range of possible outcomes.
Exhibit 12.10 illustrates how the analyst can modify the underlying as-sumptions and then observe the extent to which projected ratios will be al-tered. This process is known as sensitivity analysis. In the example, theanalyst projects a sales increase over the preceding year of just 3%. That isone-half the growth rate assumed in the base case (the most probable sce-nario) represented by Exhibit 12.2. The less optimistic sales forecast impliesa less robust economy than assumed in the base case. For example, the ana-lyst may assume no real growth and a 3% inflation rate. In the revised sce-nario, the analyst assumes that chemical producers will have no opportunityto increase their gross margins over the preceding year. Keeping the other as-sumptions intact, the revised projections show smaller increases, relative tothe base case, in net income, shareholders’ equity, and funds provided by op-erations. Long-term debt declines more slowly under the new assumptions.
Using Exhibit 12.10’s revised statements, the analyst can recalculateExhibit 12.9’s credit quality measures as shown in Exhibit 12.11. Under the
EXHIBIT 12.11 Trend of Credit Quality Comparison
Colossal Chemical CorporationYear Ended December 31, 2002 (Projected)
($000 omitted)
Pessimistic Case* Base Case†
Total debtNotes payable $ 21 $ 42Current portion of long-term debt 27 27Long-term debt 369 352
417 421Deferred income taxes 95 95Shareholders’ equity 1,049 1,062
Total capital $1,541 $1,578
Total debt as a percentage of total capital 26.7% 26.7%Funds provided by operations (before working
capital changes) 236 256Total debt 417 421Cash provided as a percentage of total debt 56.6% 60.8%
*From Exhibit 12.10.† From Exhibit 12.9.

228 FORECASTS AND SECURITY ANALYSIS
new, more pessimistic sales growth and gross margin assumptions, pro-jected funds provided by operations represent 56.6% of total debt. The im-plied improvement over 2001 is smaller than indicated by the 60.8% ratioprojected in the base case. Interestingly, though, total debt as a percentageof total capital is unaffected by the changed assumptions, measuring 26.7%in both the base and the pessimistic cases. Although the addition to retainedearnings (and hence growth in shareholders’ equity) is smaller in the pes-simistic case, so is the need for new working capital to support increasedsales. The borrowing need is therefore reduced, offsetting the slower growthin equity.
To complete the analysis, an investor or lender will also want to projectfinancial statements on an optimistic, or best-case, scenario. Sample as-sumptions for a three-scenario sensitivity analysis might be:
Note that the assumptions need not be symmetrical. The optimisticcase in this instance assumes sales only two percentage points higher thanthe base case, whereas the pessimistic case reduces base case sales by threepercentage points. The analyst simply believes that the most likely scenarioembodies more downside than upside.
Other assumptions can be modified as well, recognizing the interactionamong the various accounts. Colossal Chemical may have considerable roomto cut its capital spending in the short run if it suffers a decline in funds pro-vided by operations. A projection that ignored this financial flexibility couldprove overly pessimistic. Conversely, the assumption that a company willapply any surplus funds generated to debt reduction may produce an unreal-istic projected capital structure. Particularly in a multiyear projection for astrong cash generator, the ratio of debt to capital may fall in the later years toa level that the company would consider excessively conservative. In suchcases, it may be appropriate to alter the assumption from debt retirement tomaintenance of a specified leverage ratio. Surplus cash will thus be applied tostock repurchase to the extent that not doing so would cause the debt com-ponent of capital to fall below a specified percentage.
In addition to creating a range of scenarios, sensitivity analysis can alsoenable the analyst to gauge the relative impact of changing the various as-sumptions in a projection. Contrast, for example, the impact of a I%
Assumed AssumedSales Growth Gross Margin
Optimistic case (best realistic scenario) 8% 36%Base case (most likely scenario) 6% 34%Pessimistic case (worst realistic scenario) 3% 33%

Forecasting Financial Statements 229
change in gross margins with the impact of a 1% change in the tax rate onColossal Chemical’s income statement. Exhibit 12.12 shows the effects ofthese two changes in assumptions on the projected income statement in Ex-hibit 12.2, holding all other assumptions constant. The sensitivity of net in-come to a 1% change in gross margins is $14 million ($110 million minus$96 million), all other things being equal. A 1% change in the tax rate, onthe other hand, affects net income by just $2 million, all other things againbeing equal.
This type of analysis is popular among investors. They may, for exam-ple, estimate the impact on a mining company’s earnings, and hence on itsstock price, of a 10-cent rise in the price of a pound of copper. Another ap-plication is to identify which companies will respond most dramatically tosome expected economic development such as a drop in interest rates. Arate decline will have limited impact on a company for which interest costsrepresent a small percentage of expenses. The impact will be greater on acompany with a large interest cost component and with much of its debt atfloating rates. (This assumes the return on the company’s assets is not simi-larly rate-sensitive.)
EXHIBIT 12.12 Sensitivity Analysis: Impact of Changes in Selected Assumptions onProjected Income Statement
Colossal Chemical CorporationYear Ended December 31, 2002
($000 omitted)
1% Decline in 1% Rise inBase Case Gross Margin Tax Rate
Sales $2,110 $2,110 $2,110Cost of goods sold 1,393 1,414 1,393Selling, general, and
administrative expense 317 317 317Depreciation 121 121 121Research and development 84 84 84
Total costs and expenses 1,915 1,936 1,915
Operating Income 195 174 195Interest expense 34 34 34Interest (income) (5) (5) (5)
Earnings before income taxes 166 145 166Provision for income taxes 56 49 58
Net income $ 110 $ 96 $ 108

230 FORECASTS AND SECURITY ANALYSIS
Alluring though it may be, sensitivity analysis is a technique that mustbe used with caution. As suggested, it generally isolates a single assumptionand proceeds on the basis that all other things remain equal. In the realworld, this is rarely the case. When sales fall, typically, so do gross margins.The reason is that declining capacity utilization puts downward pressure onprices. Similarly, rising interest rates do not affect only interest expense andinterest income. Higher rates depress the level of investment in the economy,which can eventually depress the company’s sales.
HOW ACCURATE ARE PROJECTIONS IN PRACTICE?
The Colossal Chemical example explains how to build a financial forecastfrom the bottom up, but because it is fictitious, readers cannot test the pro-jections against the company’s actual, subsequent performance. Exhibit12.13, however, provides a real-life illustration of the potential and limita-tions of financial forecasting. The middle column is an actual forecast forJostens, a provider of class rings, yearbooks, school photography, and grad-uation products, as well as employee achievement and sports awards, for thesecond quarter of 2001. It was created by George Chalhoub, a MerrillLynch high-yield bond analyst specializing in consumer goods. Actual fig-ures for the corresponding 2000 period appear in the left-hand column,while the right-hand column shows the actual outcome for 2001’s secondquarter. In Jostens’s highly seasonal business, the second quarter is thebiggest in terms of sales and earnings.
Even though sales were lower in the first quarter of 2001 than in the cor-responding period of 2000, Chalhoub expected strong orders for yearbooksand jewelry, along with improved profit margins, in the second quarter. Heprojected net sales of $350 million, up slightly from $344.7 million in theyear-earlier period, and a rise in gross profit to $196 million from $189.9million. (Observe that analysts are generally not arrogant enough to try toforecast the figures accurately to the first decimal place, that is, to the hun-dred-thousands for a company with revenues in the hundreds of millions.)
Evidently, the analyst had a good handle on how business was going inyearbooks and class rings. Actual sales came in at $351.0 million, just 0.3%above the projection. The accuracy of the forecast was likewise highly re-spectable at the EBITDA line, where the actual number, $100.2 million, wasjust 1.2% higher than the forecast.
As usually happens, changed circumstances caused the outcome to de-viate somewhat from the analyst’s forecast. In the course of the secondquarter, Jostens decided to postpone certain equipment upgrades until

231
EXHIBIT 12.13 Jostens (JOSEA) ($000 omitted)
Second Second SecondQuarter Quarter Quarter
Operating Data 6/30/00 6/30/01(P) 6/30/01
Net Sales 344.7 350 351.0Cost of sales 154.8 154 155.3Gross Profit 189.9 196 195.7Selling, general, and administrative 104.3 104 102.8Special one-time charge 45.7 0 0.6Operating Income 39.9 92 92.3Depreciation and amortization 6.6 7 7.4Nonrecurring expenses 46.0 0 0.6EBITDA 92.5 99 100.2Total interest 20.5 20 19.6Cash interest 20.5 20 19.6Capital expenditures 4.4 10 4.7
Margin DataSales growth NA 1.5% 1.8%EBITDA growth NA 7.0% 8.4%Gross margin 55.1% 56.0% 55.8%Selling, general, and administrative/sales 30.3% 29.7% 29.3%Operating margin 11.6% 26.3% 26.3%EBITDA margin 26.8% 28.3% 28.6%
CapitalizationRevolver 0 0 0Term loans 495.0 474 470.0123⁄4% Sr. Sub. notes due 2010 225.0 225 225.0Other long-term debt 0 0 0Total Debt 720.0 699 695.0Book equity (556.4) (556.4) (564.1)Total capitalization 163.6 142.6 130.9
Interest coverage and leverageEBITDA/cash interest 4.5 5.0 5.1EBITDA-C*/cash interest 4.3 4.5 4.9EBITDA/Total Interest 4.5 5.0 5.1EBITDA-C/total interest 4.3 4.5 4.9Total Debt/EBITDA NA NA NANet debt/EBITDA NA NA NA
LiquidityCash 35.9 30 43.1Availability ($150 MM) 150 144 144Debt maturities 2003 2004 2004As of Dec. 30, 2000 27.8 32.3 32.3
(P) = Projected.*EBITDA-C is EBITDA less Capital Expenditures.Source: Merrill Lynch & Co.

232 FORECASTS AND SECURITY ANALYSIS
2002. That caused Chalhoub’s $10 million capital spending projection toovershoot the actual figure by $5.3 million. The lower-than-projected capi-tal spending, in turn, helped to produce a higher end-of-period cash balance($43.1 million) than the forecasted $30 million. Also contributing to thevariance was higher-than-expected cash generation from reductions inworking capital.
Although the variances in capital spending and ending cash balancewere substantial in percentage terms, they did not cause key financial ratiosto vary greatly from their forecasted levels. The ratios, rather than the ab-solute amounts shown on individual lines of the financial statements, formthe basis of credit analysis, as explained in Chapter 13. As a practical mat-ter, fixed income portfolio managers were no less disposed to invest in theJostens bonds on the basis of Chalhoub’s projected 5.0x EBITDA coverageof total interest than they would have been if he had nailed it exactly byforecasting 5.1x.
Naturally, the variance was greater in the case of total interest coverageEBITDA minus capital expenditures (an actual 4.9x versus a projected4.5x), reflecting Jostens’s lower-than-projected capital spending. On an-other fine point, Chalhoub’s quarterly projection shows “NA” (not applica-ble) for the standard ratio of total debt to EBITDA. As explained in the“Combination Ratios” section of Chapter 13, it is generally inappropriateto compare a quarterly income statement item (EBITDA) with a balancesheet figure, especially in the case of a highly seasonal company such asJostens. Analysts can, however, calculate a meaningful ratio of total debt toEBITDA for the second quarter by using a denominator consisting of com-bined EBITDA for the second half of 2000 and the first half of 2001.
PROJECTING FINANCIAL FLEXIBILITY
Just as projected statements can reveal a company’s probable future finan-cial profile, they can also indicate the likely direction of its financial flexi-bility, a concept discussed in Chapter 4. For example, the projectedstatement of cash flows shows by how comfortable a margin the companywill be able to cover its dividend with internally generated funds. Likewise,the amount by which debt is projected to rise determines the extent towhich nondiscretionary costs (in the form of interest charges) will increasein future income statements.
There is one important aspect of financial flexibility, continuing com-pliance with loan covenants, for which projections are indispensable. AsExhibit 12.14 illustrates, debt covenants may require the borrower to main-tain a specified level of financial strength. Compliance may be measured

Forecasting Financial Statements 233
either by absolute dollar amounts of certain items or by ratios.1 Sanctionsagainst an issuer that commits a technical default (violation of a covenant,as opposed to the failure to pay interest or principal on schedule) can besevere. The issuer may be barred from paying further dividends or com-pelled to repay a huge loan at a time when refinancing may be difficult.
EXHIBIT 12.14 Sample Debt Restriction Disclosures
“The credit agreement contains various financial and operating covenants, which,among other things, require the maintenance of certain financial ratios, placelimitations on distributions to stockholders and restrict the Company’s ability toborrow funds from other sources. In July 1999, the Company obtained a waiverwhich, among other things, raised the existing limitations on stockholderdistributions.”
(World Wrestling Federation Entertainment, Inc. 2000 Annual Report)
“Each bank’s obligation to make loans under the Credit Facility is subject to, amongother things, compliance by the Corporation with various representations,warranties, and covenants, including, but not limited to, covenants limiting theability of the Corporation and certain of its subsidiaries to encumber their assets anda covenant not to exceed a maximum leverage ratio. . . . Certain of the Corporation’sother financing agreements contain restrictive covenants relating to debt, limitationson encumbrances and sale and leaseback transactions, and provisions which relateto certain changes in control.”
(Lockheed Martin Corporation 2000 Annual Report)
“The covenant restrictions for the Syndicated Facility and Credit Facility include,among others, interest coverage and debt capitalization ratios, limitations ondividends, additional indebtedness and liens. . . . Under the terms of the SyndicatedFacility and the Credit Facility, the Company is obligated to repay the borrowingsunder the facilities with the cash proceeds from the strategic plan divestitures. TheCompany was required to use all of the first $1,500 million of net proceeds from thedivestitures to repay indebtedness, which it has done. Additionally, the Company isrequired to use 50% of the additional cash proceeds greater than $1,500 million andup to $2,500 million from divestitures to repay the indebtedness under theSyndicated and Credit Facilities.”
(Waste Management, Inc. 2000 Annual Report)
“The May 15, 2000 refinancing agreements require the Company to maintain aminimum EBITDA on a quarterly basis, a minimum fixed charge coverage amounton a quarterly basis, and a positive quarterly EBITDA (beginning with the quarterending September 30, 2000) at the Cleveland SBQ facility. In addition, quarterlydividend and all other restricted payments, as defined, are limited to the lesser of$750,000 or 50% of income from continuing operations.”
(Birmingham Steel Corporation, 2000 Annual Report)

234 FORECASTS AND SECURITY ANALYSIS
Curing the default may necessitate unpleasant actions such as a dilution ofshareholders’ interests by the sale of new equity at less than book value. Al-ternatively, the borrower can request that its lenders waive their right to ac-celerate payment of the debt. The lenders, however, are likely to demandsome quid pro quo along the lines of reducing management’s freedom toact without consulting them.
Analysts can anticipate this sort of loss of financial flexibility by apply-ing covenanted tests of net worth, leverage, and fixed charge coverage toprojected balance sheets and income statements. General descriptions of thetests can be found in the Notes to Financial Statements. These descriptionsmay omit some subtleties involving definitions of terms, but since the pro-jections are by their nature also prone to imprecision, the objective is not inany case absolute certainty regarding a possible breach of covenants.Rather, the discovery that a company is likely to be bumping up againstcovenanted limits a year or two into the future means it is time to ask man-agement how it plans to preserve its financial flexibility. If the answers proveunsatisfactory, the effort of having made the projections and run the testsmay be rewarded by a warning, well in advance, of serious trouble ahead.
PRO FORMA FINANCIAL STATEMENTS
Another way that the analyst can look forward with financial statements isto construct pro forma statements that reflect significant developments,prior to reflection of those developments in subsequent published state-ments. It is unwise to base an investment decision on historical statementsthat antedate a major financial change such as a stock repurchase, write-off, acquisition, or divestment. By the same token, it can be important to de-termine quickly whether news that flashes across the screen will have amaterial effect on a company’s financial condition. For example, will a just-announced repurchase of 3.5 million shares materially increase financialleverage? To answer the question, the analyst must adjust the latest balancesheet available, reducing shareholders’ equity by the product of 3.5 millionand an assumed purchase price per share, then reduce cash or increase debtas the accounting offset.
Pro Forma Statements for Divestments
Exhibit 12.15 presents a pro forma income statement dealing with a morecomplex set of circumstances. As detailed in Exhibit 12.16, on September13, 2000, specialty chemical producer Cabot Corporation spun off its

235
EXHIBIT 12.15 Cabot Corporation
Unaudited Pro Forma Consolidated Statement of Income for the Year Ended September 30, 1999
(in millions, except per Share Data)(Unaudited)
Historical Pro Forma Adjustments
Cabot CabotCorporation LNG (A) CMC (A) Other Corporation
Revenues:Net sales and other
operating revenues $1,695 $(265) $(96) $20(B) $1,354Interest and dividend income 4 — — — 4
Total revenues 1,699 (265) (96) 20 1,358Costs and expenses:
Cost of sales 1,213 (248) (45) 20(B) 940Selling and administrative
expenses 208 (13) (16) 7(C) 186Research and technical service 73 — (15) — 58Interest expense 46 — — (7)(D) 39Special items(1) 26 — — — 26Gain on sale of equity securities (10) — — — (10)Other (income) expense, net 7 — (1) — 6
Total costs and expenses 1,563 (261) (77) 20 1,245Income before income taxes 136 (4) (19) — 113Provision for income taxes (49) 1 7 — (41)Equity in net income of affiliated
companies 13 — — — 13Minority interest (3) — — — (3)
Income from continuing operations 97 (3) (12) — 82Income from operations of
discontinued businesses, net of income tax — 3 12 — 15
Net income $ 97 $ — $ — $ — $ 97
Weighted average common shares outstanding:Basic 64 64Diluted 73 73
Income per common share:Basic:
Continuing operations 1.47 1.24Discontinued operations — 0.23
Net income $1.47 $1.47
DilutedContinuing operations 1.31 1.11Discontinued operations — 0.2
Net income $1.31 $1.31
Source: 8-K October 3, 2000.

236 FORECASTS AND SECURITY ANALYSIS
remaining 80.5% equity interest in Cabot Microelectronics (CMC), a pro-ducer of compounds used to polish semiconductors. Cabot implementedthe spin-off by distributing its equity interest as a special dividend to itsshareholders. Separately, on September 19, 2000, Cabot sold all outstand-ing shares of its liquefied natural gas (LNG) business to Tractebel, Inc. for$688 million in cash. By making pro forma adjustments to its fiscal 1999
EXHIBIT 12.16 Cabot Corporation Details of Divestments
Sale of Liquefied Natural Gas Business
On September 19, 2000, Cabot Corporation (“Cabot” or “registrant”), through asubsidiary, sold all of the outstanding shares of Cabot LNG Business Trust (“CabotLNG”) to Tractebel, Inc. (“Tractebel”). The agreement of sale was previouslyreported in Note C to the Consolidated Financial Statements and in theManagement’s Discussion and Analysis of Financial Condition and Results ofOperations in Cabot’s Form 10-Q for the quarter ended June 30, 2000. Cabot LNGis engaged in the liquefied natural gas (“LNG”) business. The assets of Cabot LNGincluded the LNG terminal in Everett, Massachusetts, the LNG tanker “Matthew,”Cabot’s equity interest in the Atlantic LNG liquefaction plant in Trinidad, and allrelated properties and equipment. The purchase price was $688 million in cash. Theprice was determined through a bidding process. There is no material relationshipbetween Tractebel and Cabot or any of its affiliates, directors and officers or anyassociate of any such director or officer. A copy of the registrant’s press release datedSeptember 19, 2000 relating to this sale is filed herewith as Exhibit 99.1. A copy ofthe Stock Purchase and Sale Agreement, dated as of July 13, 2000, by and amongCabot Business Trust, Cabot Corporation, Tractebel, Inc. and Tractebel, S.A. is filedherewith as Exhibit 2 and is made a part hereof. Registrant agrees to furnishsupplementally a copy of any omitted schedule to the Commission upon request.
Spin-Off of Cabot Microelectronics Corporation Stock
As previously reported in registrant’s Form 8-K dated September 14, 2000, on June25, 2000 a committee of the Board of Directors of Cabot voted to spin-off itsremaining 80.5% equity interest in Cabot Microelectronics Corporation (“CMC”)by distributing a special dividend of its equity interest in CMC to Cabot’sshareholders of record as of 5:00 P.M., Eastern time, on September 13, 2000. Cabotowned 18,989,744 shares of common stock of CMC on the September 13, 2000record date. The tax-free distribution took place on September 29, 2000. The basisfor the distribution to Cabot’s shareholders was approximately 0.280473721 sharesof CMC common stock for each share of Cabot common stock owned. Fractionalshares were not distributed, but were to be sold and the net proceeds distributed toCabot shareholders on a pro rata basis. A copy of the registrant’s press release datedOctober 2, 2000 relating to this spin-off is filed herewith as Exhibit 99.2.
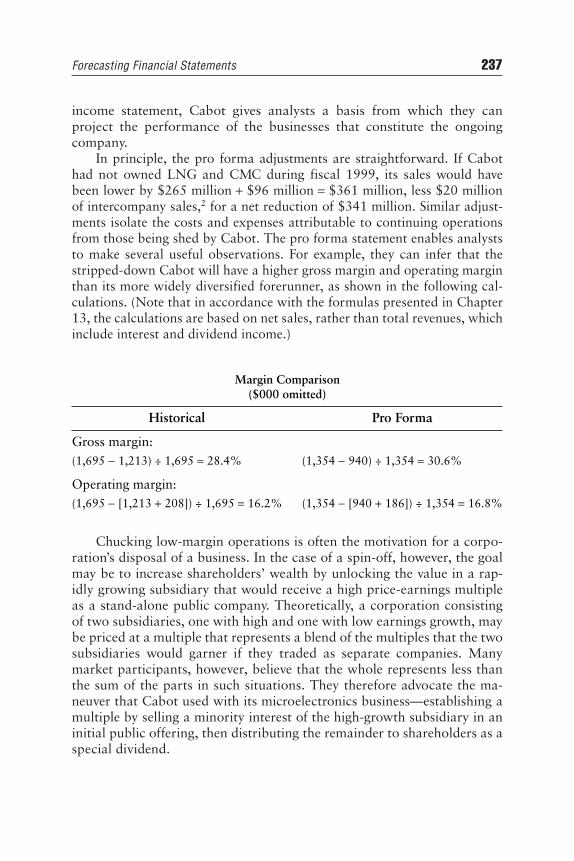
Forecasting Financial Statements 237
income statement, Cabot gives analysts a basis from which they can project the performance of the businesses that constitute the ongoingcompany.
In principle, the pro forma adjustments are straightforward. If Cabothad not owned LNG and CMC during fiscal 1999, its sales would havebeen lower by $265 million + $96 million = $361 million, less $20 millionof intercompany sales,2 for a net reduction of $341 million. Similar adjust-ments isolate the costs and expenses attributable to continuing operationsfrom those being shed by Cabot. The pro forma statement enables analyststo make several useful observations. For example, they can infer that thestripped-down Cabot will have a higher gross margin and operating marginthan its more widely diversified forerunner, as shown in the following cal-culations. (Note that in accordance with the formulas presented in Chapter13, the calculations are based on net sales, rather than total revenues, whichinclude interest and dividend income.)
Chucking low-margin operations is often the motivation for a corpo-ration’s disposal of a business. In the case of a spin-off, however, the goalmay be to increase shareholders’ wealth by unlocking the value in a rap-idly growing subsidiary that would receive a high price-earnings multipleas a stand-alone public company. Theoretically, a corporation consistingof two subsidiaries, one with high and one with low earnings growth, maybe priced at a multiple that represents a blend of the multiples that the twosubsidiaries would garner if they traded as separate companies. Manymarket participants, however, believe that the whole represents less thanthe sum of the parts in such situations. They therefore advocate the ma-neuver that Cabot used with its microelectronics business—establishing amultiple by selling a minority interest of the high-growth subsidiary in aninitial public offering, then distributing the remainder to shareholders as aspecial dividend.
Margin Comparison($000 omitted)
Historical Pro Forma
Gross margin:(1,695 − 1,213) ÷ 1,695 = 28.4% (1,354 − 940) ÷ 1,354 = 30.6%
Operating margin:(1,695 − [1,213 + 208]) ÷ 1,695 = 16.2% (1,354 − [940 + 186]) ÷ 1,354 = 16.8%

238 FORECASTS AND SECURITY ANALYSIS
In Cabot’s case, the subsequent stock performance vindicated the deci-sion to spin off CMC. Shortly before the transaction, Cabot had a marketcapitalization of around $2 billion. Six months later, the combined marketcapitalization of Cabot and Cabot Microelectronics was $4 billion.
To be sure, several factors affected both companies’ valuations follow-ing the spin-off. The essential point for analysts, though, is that a pro formaincome statement for a single year provides no information about the his-torical growth in sales and earnings of the subsidiary that is being spun off.To gauge the spin-off’s potential impact on aggregate market capitalization,it is important to examine as well the prospectus for the subsidiary’s initialpublic offering.
A pro forma income statement for one year likewise gives no informa-tion about year-to-year variability in the earnings of the operations beingsold or spun off. Although the business that is being discarded may havedragged down margins in the past few years, it also may have been morestable during recessions than the rest of the company’s operations. The new,trimmer corporation may therefore experience wider cyclical profit swingsthan in the past.
Finally, pro forma adjustments for a divestment do not capture the potential benefits of increased management focus on the company’s coreoperations. The entity being disposed of may be the remnant of a long-abandoned plan to expand aggressively in a particular region or a line ofbusiness tangential to the corporation’s primary activity. By eliminating thedistraction, the senior executives may be able to boost profits more sub-stantially than the pro forma statements suggest. The pro forma adjust-ments simply attribute to the discarded unit a share of corporate overheadproportional to its size.
Pro Forma Statements for Acquisit ions
Just as pro forma statements provide a useful basis for forecasting a company’sresults following a major divestment, subject to certain caveats, they are help-ful in the context of acquisitions when used judiciously. If anything, though,analysts must exercise greater care in extrapolating from an acquisition-related pro forma income statement. The effects of shedding a business arehighly predictable compared with the uncertainties inherent in combiningcompanies. Mergers of companies in the same industry often work outpoorly due to clashes of corporate culture. When a corporation acquires abusiness in the belief that it will be complementary to its existing opera-tions, it runs the risk of inappropriately applying its own management

Forecasting Financial Statements 239
style to an industry with very different requirements. Moreover, the ac-quired company’s owners may be shrewdly selling out at top dollar, antici-pating a deceleration in earnings growth that is foreseeable by industryinsiders, but not to the acquiring corporation’s management. For all of thesereasons, the earnings shown in a merger-related pro forma income state-ment may be higher than the company can sustain. On the other hand,GAAP does not allow management to make pro forma statements reflect allof the cost savings that might be achievable in a merger. In some instances,projections that merely extrapolate from the pro forma income statementwill prove too conservative.
Exhibits 12.17 and 12.18 are, respectively, semiconductor manufac-turer Broadcom’s balance sheet for June 30, 2000, and income statement forthe six months ended June 30, 2000, with pro forma adjustments for threeacquisitions completed during September-October 2000. The adjustmentsare explained in accompanying notes a through h.
As a result of using a combination of its own shares and stock optionsto acquire three companies with aggregate shareholders’ equity of $77.5million, the shareholders’ equity on Broadcom’s balance sheet swells by$1,8378.9 million to $2,681.7 million. At the same time, the company’slong-term debt (including current portion) rises only slightly, from $2.1 mil-lion to $14.6 million. Seemingly, a company can reduce its credit risk, mea-sured by the ratio of long-term debt to the sum of long-term debt andshareholders’ equity, by acquiring other companies for stock (see Chapter13). According to this logic, Broadcom’s credit quality would have improvedeven more if instead of shelling out $2,941.2 million worth of shares andoptions for Altima, Newport, and Silicon Spice (this figure appears in thepro forma adjustments column of Exhibit 12.17), the company had paid $4billion. Seemingly, a company can strengthen its balance sheet by drasticallyoverpaying for acquisitions.
The resolution of this paradox lies in the $1,891.6 million of goodwilladded to Broadcom’s balance sheet through the transactions. As discussedin Chapter 2, credit analysts take a skeptical view of the debt protection af-forded by intangible assets such as goodwill. Increasing the size of the in-tangibles by paying more than fair value in an acquisition does not, inpractice, raise a company’s perceived credit quality.
In fact, one aspect of the pro forma income statement (Exhibit 12.18)suggests that Broadcom has become a worse credit risk as a result of thethree acquisitions. On a historical basis, the company had $110.1 million ofoperating income during the first half of 2000. The pro forma adjustmentsproduce an operating loss of $200.9 million. Again, the effect of goodwill

240
EXHI
BIT
12.1
7B
road
com
Cor
pora
tion
Una
udit
ed P
ro F
orm
a C
onde
nsed
Com
bine
d B
alan
ce S
heet
June
30,
200
0(i
n th
ousa
nds)
His
tori
cal
Pro
Form
aPr
o Fo
rma
Silic
onA
djus
tmen
tsC
ombi
ned
Bro
adco
mA
ltim
aN
ewpo
rtSp
ice
(Res
tate
d)(R
esta
ted)
Ass
ets
Cur
rent
ass
ets:
Cas
h an
d ca
sh e
quiv
alen
ts$2
80,8
80$
5,04
5$1
8,12
0$4
9,71
6$
—$
353,
761
Shor
t-te
rm in
vest
men
ts98
,982
——
3,14
5—
102,
127
Acc
ount
s re
ceiv
able
, net
117,
075
5,75
354
——
122,
882
Inve
ntor
y38
,617
2,41
3—
——
41,0
30D
efer
red
taxe
s8,
380
520
——
—8,
900
Prep
aid
expe
nses
and
oth
er c
urre
nt a
sset
s26
,317
190
205
1,03
7—
27,7
49
Tota
l cur
rent
ass
ets
570,
251
13,9
2118
,379
53,8
98—
656,
449
Prop
erty
and
equ
ipm
ent,
net
62,7
8693
93,
696
9,36
8—
76,7
89D
efer
red
taxe
s29
3,16
0—
——
(116
,460
)(a)
176,
700
Goo
dwill
and
pur
chas
ed in
tang
ible
s, n
et—
940
——
1,89
0,64
6(a
)1,
891,
586
Oth
er a
sset
s15
,309
742
585
—15
,970
Tota
l ass
ets
$941
,506
$15,
874
$22,
077
$63,
851
$1,7
74,1
86$2
,817
,494

241
Lia
bilit
ies
and
Shar
ehol
ders
’ Equ
ity
Cur
rent
liab
iliti
es:
Trad
e ac
coun
ts p
ayab
le$
62,4
00$
3,15
9$
699
$2,
864
$—$
69,1
22W
ages
and
rel
ated
ben
efit
s11
,025
——
449
—11
,474
Acc
rued
liab
iliti
es22
,139
4,32
440
1—
13,7
70(b
)40
,634
Cur
rent
por
tion
of
long
-ter
m d
ebt
1,16
793
988
94,
636
—7,
631
Tota
l cur
rent
liab
iliti
es96
,731
8,42
21,
989
7,94
913
,770
128,
861
Lon
g-te
rm d
ebt,
less
cur
rent
por
tion
966
—2,
451
3,51
8—
6,93
5Sh
areh
olde
rs’ e
quit
yC
omm
on s
tock
681,
092
23,9
0729
,050
96,8
02(1
49,7
59)(c
)3,
622,
243
2,94
1,15
1(d
)
Not
es r
ecei
vabl
e fr
om e
mpl
oyee
s(1
,426
)—
—(1
,025
)—
(2,4
51)
Def
erre
d st
ock
-bas
ed c
ompe
nsat
ion
(10,
414)
(12,
610)
——
(680
,717
)(a)
(691
,131
)12
,610
(c)
Ret
aine
d ea
rnin
gs (
accu
mul
ated
def
icit
)17
4,55
7(3
,845
)(1
1,41
3)(4
3,39
3)(4
21,5
20)(e
)(2
46,9
63)
58,6
51(c
)
Tota
l sha
reho
lder
s’ e
quit
y84
3,80
97,
452
17,6
3752
,384
1,76
0,41
62,
681,
698
Tota
l lia
bilit
ies
and
shar
ehol
ders
’ equ
ity
$941
,506
$15,
874
$22,
077
$63,
851
$1,7
74,1
86$2
,817
,494
(a)
To r
ecor
d th
e pr
elim
inar
y al
loca
tion
of
the
purc
hase
pri
ce t
o g o
odw
ill a
nd p
urch
ased
int
angi
bles
, de
ferr
ed t
ax l
iabi
litie
san
d de
ferr
ed s
tock
-bas
ed c
ompe
nsat
ion.
(b)
To a
ccru
e es
tim
ated
tra
nsac
tion
cos
ts.
(c)
To e
limin
ate
the
Acq
uire
d C
ompa
nies
’ com
mon
sto
ck a
nd r
etai
ned
earn
ings
acc
ount
s.(d
) To
rec
ord
the
acqu
isit
ions
of
the
Acq
uire
d C
ompa
nies
’ equ
ity
s ecu
riti
es b
y th
e is
suan
ce o
f th
e C
ompa
ny’s
com
mon
sto
ck,
rest
rict
ed c
omm
on s
tock
and
the
ass
umpt
ion
of e
mpl
oyee
sto
ck o
ptio
ns.
(e)
To r
ecor
d th
e al
loca
tion
of
purc
hase
pri
ce t
o in
-pro
cess
re s
earc
h an
d de
velo
pmen
t.So
urce
:8-
K/A
Mar
ch 3
0, 2
001.

242
EXHI
BIT
12.1
8B
road
com
Cor
pora
tion
Una
udit
ed P
ro F
orm
a C
onde
nsed
Com
bine
d St
atem
ent
of O
pera
tion
s fo
r th
e Si
x M
onth
s E
nded
Jun
e 30
, 200
0(i
n th
ousa
nds,
exc
ept
per
shar
e da
ta)
His
tori
cal
Pro
Form
aPr
o Fo
rma
Silic
onA
djus
tmen
tsC
ombi
ned
Bro
adco
mA
ltim
aN
ewpo
rtSp
ice
(Res
tate
d)(R
esta
ted)
Rev
enue
$436
,768
$14,
722
$50
7$
—$
—$
451,
997
Cos
t of
rev
enue
181,
597
6,62
7—
——
188,
224
Gro
ss p
rofi
t25
5,17
18,
095
507
——
263,
773
Ope
rati
ng e
xpen
se:
Res
earc
h an
d de
velo
pmen
t97
,558
3,84
64,
548
11,5
62—
117,
514
Selli
ng, g
ener
al a
nd a
dmin
istr
ativ
e42
,761
3,45
61,
883
3,85
8—
51,9
58St
ock
-bas
ed c
ompe
nsat
ion
expe
nse
——
——
98,3
80(a
)98
,380
Am
orti
zati
on o
f go
odw
ill a
nd p
urch
ased
inta
ngib
les
——
——
192,
059
(b)
192,
059
Mer
ger-
rela
ted
cost
s4,
745
——
——
4,74
5
Inco
me
(los
s) f
rom
ope
rati
ons
110,
107
793
(5,9
24)
(15,
420)
(290
,439
)(2
00,8
83)
Inte
rest
and
oth
er in
com
e, n
et8,
050
130
333
1,26
5—
9,77
8
Inco
me
(los
s) b
efor
e in
com
e ta
xes
118,
157
923
(5,5
91)
(14,
155)
(290
,439
)(1
91,1
05)
Prov
isio
n (b
enef
it)
for
inco
me
taxe
s23
,631
140
1—
(28,
810)
(c)
(5,0
38)
Net
inco
me
(los
s)$
94,5
26$
783
$(5,
592)
$(14
,155
)$(
261,
629)
$(18
6,06
7)

243
Bas
ic e
arni
ngs
(los
s) p
er s
hare
$0.4
4$(
0.84
)
Dilu
ted
earn
ings
(lo
ss)
per
shar
e$0
.37
$(0.
84)
Wei
ghte
d av
erag
e sh
ares
(ba
sic)
212,
911
222,
199
Wei
ghte
d av
erag
e sh
ares
(di
lute
d)25
3,26
122
2,19
9
(a)
To r
ecor
d am
orti
zati
on e
xpen
se fo
r go
odw
ill a
nd p
urch
ased
inta
ngib
les
over
an
expe
cted
est
imat
ed p
erio
d of
ben
efit
ran
g-in
g fr
om t
wo
to f
ive
year
s.(b
) To
rec
ord
sto
ck-b
ased
com
pens
atio
n ex
pens
e ge
nera
lly o
ver
a th
ree-
to
four
-yea
r pe
riod
.(c
) R
efle
cts
the
esti
mat
ed t
ax e
ffec
ts o
f th
e pr
o fo
rma
adju
stm
ents
. The
pro
for
ma
adju
stm
ents
for
the
am
orti
zati
on o
f go
od-
will
and
pur
chas
ed in
tang
ible
s, in
-pro
cess
res
earc
h an
d de
velo
pmen
t, a
nd c
erta
in s
tock
-bas
ed c
ompe
nsat
ion
are
excl
uded
from
suc
h co
mpu
tati
ons,
as
the
Com
pany
doe
s no
t ex
pect
to
real
ize
any
bene
fit
from
the
se it
ems.
Sour
ce:
8-K
/A M
arch
30,
200
1.

244 FORECASTS AND SECURITY ANALYSIS
creation modifies the analytical conclusion. Roughly two-thirds ($192.1million) of the pro forma adjustment to reported earnings is amortizationof goodwill, a noncash expense that credit analysts will downplay.
The remaining pro forma adjustment to operating income (a $98.4 mil-lion reduction) reflects the recording of stock-based compensation overthree to four years. Note that the recognition of the cost of employee stockoptions has been a contentious issue in the determination of financial re-porting principles. Corporations have lobbied hard and, so far, successfully,to avoid showing the cost of employee stock options on the income state-ment, even though it reduces income available to shareholders just as ordi-nary wages and salaries do. Understandably, corporations would prefer toreport higher net income by disclosing the impact of stock options only inthe Notes to Financial Statements. In October 2001, RepresentativeMichael Oxley, chairman of the House Committee on Financial Services,advocated that approach to the likes of Securities and Exchange Commis-sion Chairman Harvey Pitt and Paul Volcker, chairman of the board oftrustees of the International Accounting Standards Board.3
Notwithstanding a general reluctance to display the cost of employeestock options on its income statement, Broadcom had no choice about it. Inacquiring Altima, Newport, and Silicon Spice, Broadcom assumed the com-panies’ obligations under employee stock option plans. The accountingrules required Broadcom to begin recognizing the expense.
Incidentally, the acquisitions of Altima and Silicon Spice involved oneadditional stock-related instrument. Broadcom assumed the two companies’obligations under arrangements whereby customers earned warrants to buystock, generally for $0.01 a share, on fulfillment of requirements for mini-mum purchases of goods. Initially, Broadcom recorded the assumed agree-ments as purchased intangible assets and goodwill, which set in motionannual amortization charges. After reevaluating the accounting with its out-side auditor, the company switched to a method of recording no assets onits balance sheet and recognizing the warrants as reductions of revenue asthey are earned by customers.
MULTIYEAR PROJECTIONS
So far, this chapter has focused on one-year projections and pro forma ad-justments to current financial statements. Such exercises, however, repre-sent nothing more than the foundation of a complete projection. Afixed-income investor buying a 30-year bond is certainly interested in the

Forecasting Financial Statements 245
issuer’s financial prospects beyond a 12-month horizon. Similarly, a sub-stantial percentage of the present value of future dividends represented by astock’s price lies in years beyond the coming one. Even if particular in-vestors plan to hold the securities for one year or less, they have an interestin estimating longer-term projections. Their ability, 6 or 12 months hence,to sell at attractive prices will depend on other investors’ views at the timeof the issuer’s prospects.
The inherent volatility of economic conditions makes long-term projec-tions a perilous undertaking. In the late 1970s, prognosticators generallyexpected then-prevailing tightness in energy supplies to persist and toworsen, resulting in continued escalation of oil prices. The implications ofthis scenario included large profits for oil producers and boom conditionsfor manufacturers of oil exploration supplies, energy-conservation prod-ucts, and alternative-energy equipment. By the early 1980s, the energy pic-ture had changed from scarcity to glut, and many companies that hadexpected prosperity instead suffered bankruptcy. In subsequent years, nu-merous other discontinuities have forced companies to revise their long-range plans. They have included:
� A wave of sovereign debt defaults by less developed countries in LatinAmerica.
� A stock market crash on October 19, 1987.
� A huge wave of leveraged buyout bankruptcies.
� A war in the Persian Gulf.
� A boom-and-bust in Internet stocks.
� A financial crisis in Asia.
� The September 11, 2001, terrorist attacks on the Pentagon and WorldTrade Center.
The frequency of such shocks makes it difficult to have high confidence inprojections covering periods even as short as five years.
Notwithstanding their potential for badly missing the mark, multiyearprojections are essential to financial analysis in some situations. For exam-ple, certain capital-intensive companies such as paper manufacturers havelong construction cycles. They add to their capacity not in steady, annualincrements but through large, individual plants that take several years tobuild. While a plant is in construction, the company must pay interest onthe huge sums borrowed to finance it. This increased expense depressesearnings until the point, several years out, when the new plant comes on-stream and begins to generate revenues. To obtain a true picture of the

246 FORECASTS AND SECURITY ANALYSIS
company’s long-range financial condition, the analyst must somehow factorin the income statements for the fourth and fifth years of the constructionproject. These are far more difficult to forecast than first- or second-year re-sults, which reflect cyclical peak borrowings and interest costs.
Radical financial restructurings also necessitate multiyear projections.Examples include leveraged buyouts, megamergers, and massive stock buy-backs. The short-term impact of these transactions is to increase financialrisk sharply. Often, leverage rises to a level investors are comfortable withonly if they believe the company will be able to reduce debt to more cus-tomary levels within a few years. Sources of debt repayment may includeboth cash flow and proceeds of planned asset sales. Analysts must makeprojections to determine whether the plan for debt retirement rests on re-alistic assumptions. A lender cannot prudently enter into a highly lever-aged transaction without making some attempt to project results overseveral years, notwithstanding the uncertainties inherent in such long-range forecasts.
Fortunately for analysts, electronic spreadsheets make it feasible to runnumerous scenarios for proposed transactions. Analysts can vary the under-lying economic assumptions and deal terms as they change from day to day.Once the company’s financial structure becomes definitive, the analyst caninput the final numbers into the spreadsheet. From that point, the criticaltask is to monitor the restructured company’s quarter-by-quarter progress,comparing actual results with projections.
Electronic spreadsheets are helpful in analyzing conventionally capital-ized companies, as well as highly leveraged transactions. In projecting thefinancials of companies with already-strong balance sheets, however, ana-lysts should not assume that all excess cash flow will be directed towarddebt retirement. Conservatively capitalized companies generally do not seekto reduce their financial leverage below some specified level. Instead, theyuse surplus funds to repurchase stock or make acquisitions.
Essentially, multiyear projections involve the same sorts of assumptionsdescribed in the one-year Colossal Chemical projection (Exhibits 12.1through 12.12). When looking forward by as much as five years, though,the analyst must be especially cognizant of the impact of the business cycle.Many companies’ projected financial statements look fine as long as salesgrow “like a hockey stick” (sloping uninterruptedly upward). Their finan-cial strength dissipates quickly, however, when sales turn downward for ayear or two.
Notwithstanding the many uncertainties that confront the financial fore-caster, carefully constructed projections can prove fairly accurate. The results
Forecasting Financial Statements 247
can be satisfying even when the numbers are strongly influenced by hard-to-predict economic variables. The two detailed projections reproduced as Ex-hibits 12.19 through 12.31 were generated by Merrill Lynch high-yield healthcare analyst Susannah Gray. These exhibits show how the bottoms-up ap-proach illustrated in the fictitious Colossal Chemical example can be appliedin real life to companies outside the basic industry sphere.
Select Medical
Select Medical operates specialty acute care hospitals for long-term stay pa-tients with serious medical conditions such as cancer and cardiac disorders.The company also operates outpatient rehabilitation clinics that providephysical, speech, and occupational therapy.
Historical financials (Exhibits 12.19–12.22) provide a reality check forprojections. Helpfully, the company provides an inpatient versus outpatientbreakdown of revenues (Exhibit 12.20). The challenge of forecasting SelectMedical’s financial results is underscored by the variability of its historicalperformance. On a quarterly basis, the company’s EBITDA margin(EBITDA ÷ Total Net Revenue) ranged between 7.5% and 12.6% betweenthe beginning of 1999 and the middle of 2001 and was only 2.4% duringthe full year 1998 (Exhibit 12.21).
Gray’s forecast through the end of 2002 (Exhibits 12.23 and 12.24)show EBITDA margin stabilizing in a range of 11.3% to 11.8%. The ana-lyst projects a rise in EBITDA coverage of total interest expense, from 3.0×in the third quarter of 2001 to 3.6 × for the full year 2002. She also foreseesa favorable trend in financial leverage, with the ratio of total debt toEBITDA declining from 2.7 × on December 31, 2001 to 4.6× one year later.
Exhibit 12.24 goes a level deeper to show the expected margins thatproduce the projected income statement. Underlying those percentages, inturn, are the forecasted operating statistics of Exhibit 12.25. A key determi-nant of Select Medical’s revenue and earnings growth is the number of long-term acute care (LTAC) hospitals that it operates. Gray projects an increasefrom 58 in the second quarter of 2001, the last historical quarter precedingher forecast, to 76 in the fourth quarter of 2002. Revenues are also sensitiveto the occupancy rate, which is influenced in turn by admissions and lengthof stay. Similarly, revenue at the outpatient rehabilitation clinics is sensitiveto the number of clinics owned and operated, as well as the number of vis-its. Exhibits 12.26 through 12.28 indicate the fixed and working capital re-quirements implied by the growth projections and the resulting impact onoutstanding debt and interest expense.

EXHI
BIT
12.1
9Se
lect
Med
ical
: Qua
rter
ly I
ncom
e St
atem
ent
Sour
ce:
Mer
rill
Lync
h &
Co.
FY 9
81Q
99
2Q 9
93Q
99
4Q 9
9FY
99
1Q 0
02Q
00
6 M
os3Q
00
4Q 0
0FY
00
1Q 0
112
Mos
2Q 0
1In
com
e St
atem
ent
data
:12
/31/
983/
31/9
96/
30/9
99/
30/9
912
/31/
9912
/31/
993/
31/0
06/
30/0
06/
30/0
09/
30/0
012
/31/
0012
/31/
003/
31/0
13/
31/0
16/
30/0
1
Rev
enue
s(S
peci
alty
hos
pita
ls)
inpa
tien
t ne
t re
venu
e62
.770
.378
.077
.182
.130
7.5
87.4
91.0
178.
395
.510
5.1
378.
911
3.2
404.
711
9.0
Out
pati
ent
net
reve
nue
83.1
27.7
28.6
26.5
58.9
141.
710
6.9
107.
221
4.1
99.1
103.
641
6.8
108.
741
8.6
112.
0O
ther
rev
enue
3.3
1.6
1.9
1.7
1.6
6.8
2.5
2.5
5.0
2.3
2.9
10.2
3.3
11.0
3.2
Tota
l net
rev
enue
149.
099
.510
8.5
105.
214
2.7
456.
019
6.7
200.
739
7.4
196.
921
1.6
805.
922
5.1
834.
323
4.2
YO
Y %
cha
nge
205.
9%97
.6%
85.0
%27
7.6%
87.1
%48
.3%
76.7
%14
.4%
16.7
%
Cos
t of
ser
vice
128.
984
.790
.087
.012
1.8
383.
516
7.1
167.
933
5.1
169.
618
1.1
685.
818
9.6
708.
319
7.0
Gen
eral
and
adm
inis
trat
ive
12.5
4.3
5.0
5.9
6.3
21.4
7.3
7.4
14.8
6.8
6.9
28.4
8.4
29.5
8.6
Bad
deb
t ex
pens
e4.
01.
31.
71.
93.
98.
9—
——
——
——
Dep
reci
atio
n an
d am
orti
zati
on4.
93.
53.
33.
66.
316
.77.
07.
114
.17.
39.
030
.47.
831
.27.
9
Ope
rati
ng in
com
e(1
.3)
5.7
8.4
7.0
4.4
25.5
15.2
18.3
33.5
13.2
14.6
61.3
19.2
65.3
20.8
Inte
rest
inco
me
(0.4
)(0
.1)
(0.1
)(0
.1)
(0.0
)(0
.4)
——
——
——
Inte
rest
exp
ense
5.4
4.1
4.8
5.2
7.5
21.5
8.8
9.3
18.1
8.9
8.2
35.2
7.8
30.7
7.5
Net
inte
rest
exp
ense
(in
com
e)5.
04.
04.
75.
07.
421
.18.
89.
318
.18.
98.
235
.27.
830
.77.
5
Oth
er in
com
e/(c
harg
es)
(10.
2)—
——
(5.2
)(5
.2)
——
——
——
——
—
Inco
me
befo
re m
inor
ity
Iite
rest
(16.
5)1.
83.
72.
0(8
.3)
(0.8
)6.
59.
015
.44.
36.
426
.111
.434
.513
.3
Min
orit
y in
tere
st1.
71.
11.
10.
80.
83.
71.
11.
12.
20.
81.
14.
11.
44.
40.
9
Pret
ax in
com
e(1
8.2)
0.7
2.7
1.2
(9.0
)(4
.5)
5.3
7.9
13.3
3.4
5.3
21.9
10.0
30.1
12.5
Taxe
s(0
.2)
0.0
3.4
1.5
(2.1
)2.
82.
53.
76.
22.
41.
410
.03.
913
.24.
9
Net
Inc
ome,
bef
ore
extr
aord
inar
y it
ems
(18.
0)0.
7(0
.7)
(0.3
)(7
.0)
(7.3
)2.
84.
27.
01.
03.
912
.06.
116
.97.
6E
xtra
ordi
nary
item
——
——
5.8
5.8
——
—6.
2—
6.2
——
8.7
Net
inco
me
(18.
0)0.
7(0
.7)
(0.3
)(1
2.8)
(13.
1)2.
84.
27.
0(5
.2)
3.9
5.7
6.1
16.9
(1.1
)
Les
s: P
refe
rred
div
iden
ds—
1.1
1.1
1.1
2.0
5.2
2.1
2.2
4.3
2.2
2.3
8.8
2.3
——
Net
ava
ilabl
e to
com
mon
(18.
0)(0
.4)
(1.8
)(1
.3)
(14.
8)(1
8.3)
0.7
2.0
2.8
(7.4
)1.
6(3
.1)
3.8
16.9
(1.1
)
Net
ava
ilabl
e to
com
mon
, exc
ludi
ng e
xtra
item
s(1
8.0)
(0.4
)(1
.8)
(1.3
)(9
.0)
(12.
5)0.
72.
02.
8(1
.1)
1.6
3.2
3.8
16.9
7.6
Wtd
. ave
rage
sha
res
outs
tand
ing
Bas
ic21
.73
24.5
024
.49
24.4
724
.77
24.6
25.4
925
.45
25.4
825
.45
25.4
825
.535
.00
44.7
947
.21
Dilu
ted
21.7
324
.50
24.4
924
.47
24.7
724
.625
.50
25.5
125
.48
26.1
126
.86
25.9
36.0
846
.11
47.2
1
Ear
ning
s pe
r sh
are:
Bas
ic$(
0.83
)$(
0.02
)$(
0.07
)$(
0.05
)$(
0.36
)$(
0.51
)$0
.03
$0.0
8$0
.11
$(0.
04)
$0.0
6$0
.12
$0.1
1$0
.38
$0.1
6D
ilute
d, e
xclu
ding
one
-tim
e it
ems
$(0.
83)
$(0.
02)
$(0.
07)
$(0.
05)
$(0.
36)
$(0.
51)
$0.0
3$0
.08
$0.1
1$(
0.04
)$0
.06
$0.1
2$0
.11
$0.3
7$0
.16
Dilu
ted,
as
repo
rted
$(0.
83)
$(0.
02)
$(0.
07)
$(0.
05)
$(0.
60)
$(0.
74)
$0.0
3$0
.08
$0.1
1$(
0.28
)$0
.06
$(0.
12)
$0.1
1$0
.37
$(0.
03)

EXHI
BIT
12.2
0Se
lect
Med
ical
: Bal
ance
She
et D
ata
Sour
ce:
Mer
rill
Lync
h &
Co.FY
98
1Q 9
92Q
99
3Q 9
94Q
99
FY 9
91Q
00
2Q 0
06
Mos
3Q 0
04Q
00
FY 0
01Q
01
12 M
os2Q
01
12/3
1/98
3/31
/99
6/30
/99
9/30
/99
12/3
1/99
12/3
1/99
3/31
/00
6/30
/00
6/30
/00
9/30
/00
12/3
1/00
12/3
1/00
3/31
/01
3/31
/01
6/30
/01
Cas
h13
.04.
14.
13.
23.
22.
23.
414
.1To
tal d
ebt
156.
134
0.8
340.
830
2.8
302.
828
9.4
272.
529
4.2
Shar
ehol
ders
’ equ
ity
60.5
49.4
49.4
48.8
48.8
52.3
201.
220
4.7
Cre
dit
stat
istic
s:E
BIT
DA
/tot
al in
tere
st e
xpen
se(0
.3)x
1.4x
1.8x
1.4x
0.6x
1.2x
1.7x
2.0x
1.9x
1.5x
1.8x
1.7x
2.5x
2.1x
2.8x
EB
ITD
A-c
apit
al e
xpen
ditu
res/
tota
l int
eres
t ex
pens
e(1
.4)x
1.4x
1.8x
1.4x
0.6x
0.7x
1.1x
2.0x
1.9x
1.5x
1.8x
1.1x
1.8x
1.4x
2.8x
Tota
l deb
t/E
BIT
DA
(115
.7)x
0.0x
0.0x
0.0x
13.4
x2.
8xTo
tal a
djus
ted
debt
/EB
ITD
AR
Rev
enue
mix
:In
pati
ent
reve
nues
42.1
%70
.6%
71.9
%73
.2%
57.6
%67
.4%
44.4
%45
.3%
44.9
%48
.5%
49.7
%47
.0%
50.3
%48
.5%
50.8
%O
utpa
tien
t re
venu
es55
.8%
27.8
%26
.4%
25.2
%41
.3%
31.1
%54
.3%
53.4
%53
.9%
50.3
%49
.0%
51.7
%48
.3%
50.2
%47
.8%
Oth
er2.
2%1.
6%1.
7%1.
6%1.
1%1.
5%1.
3%1.
2%1.
3%1.
2%1.
4%1.
3%1.
5%1.
3%1.
4%
Tota
l10
0.0%
100.
0%10
0.0%
100.
0%10
0.0%
100.
0%10
0.0%
100.
0%10
0.0%
100.
0%10
0.0%
100.
0%10
0.0%
100.
0%10
0.0%
EB
ITD
A m
ix:
Inpa
tien
t E
BIT
DA
3.1
35.9
9.9
11.0
20.9
44.6
13.4
48.0
13.6
Out
pati
ent
EB
ITD
A12
.622
.717
.219
.336
.465
.419
.167
.320
.6O
ther
EB
ITD
A(1
2.2)
(16.
4)(4
.8)
(4.9
)(9
.8)
(18.
3)(5
.4)
(18.
9)(5
.5)
3.6
42.2
22.3
25.4
47.6
91.7
27.0
96.5
28.7
Inpa
tien
t m
argi
n5.
0%11
.7%
11.3
%12
.1%
11.7
%11
.8%
11.8
%11
.9%
11.4
%O
utpa
tien
t m
argi
n15
.2%
16.0
%16
.1%
18.0
%17
.0%
15.7
%17
.5%
16.1
%18
.4%
Tota
l mar
gin
2.4%
9.3%
11.3
%12
.6%
12.0
%11
.4%
12.0
%11
.6%
12.2
%
YO
Y%
cha
nge
Inpa
tien
t10
41.7
%24
.0%
35.2
%23
.3%
Out
pati
ent
80.2
%18
8.2%
11.0
%7.
0%O
ther
34.8
%11
.7%
12.1
%12
.3%
Tota
l10
75.7
%11
7.0%
21.5
%13
.0%
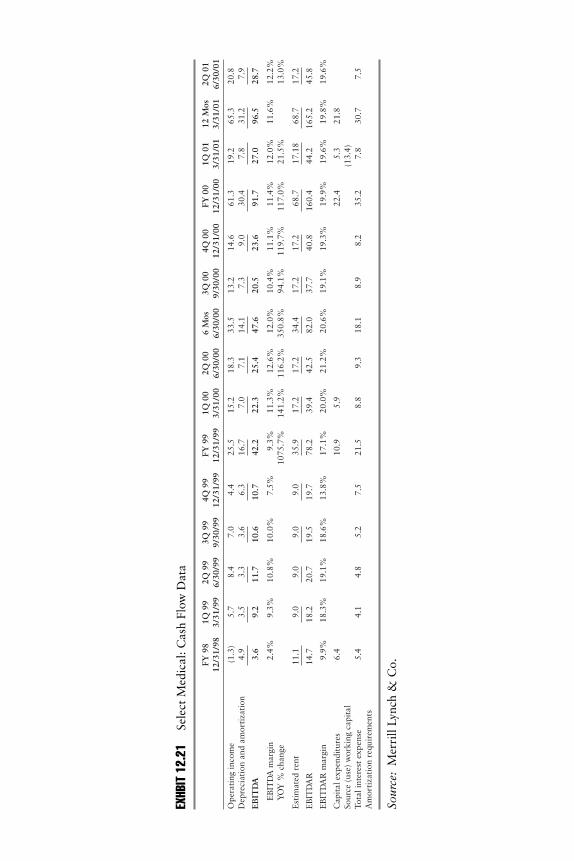
E XHB
IT 1
2.21
Sele
ct M
edic
al: C
ash
Flow
Dat
a
Sour
ce:
Mer
rill
Lync
h &
Co.FY
98
1Q 9
92Q
99
3Q 9
94Q
99
FY 9
91Q
00
2Q 0
06
Mos
3Q 0
04Q
00
FY 0
01Q
01
12 M
os2Q
01
12/3
1/98
3/31
/99
6/30
/99
9/30
/99
12/3
1/99
12/3
1/99
3/31
/00
6/30
/00
6/30
/00
9/30
/00
12/3
1/00
12/3
1/00
3/31
/01
3/31
/01
6/30
/01
Ope
rati
ng in
com
e(1
.3)
5.7
8.4
7.0
4.4
25.5
15.2
18.3
33.5
13.2
14.6
61.3
19.2
65.3
20.8
Dep
reci
atio
n an
d am
orti
zati
on4.
93.
53.
33.
66.
316
.77.
07.
114
.17.
39.
030
.47.
831
.27.
9
EB
ITD
A3.
69.
211
.710
.610
.742
.222
.325
.447
.620
.523
.691
.727
.096
.528
.7
EB
ITD
A m
argi
n2.
4%9.
3%10
.8%
10.0
%7.
5%9.
3%11
.3%
12.6
%12
.0%
10.4
%11
.1%
11.4
%12
.0%
11.6
%12
.2%
YO
Y %
cha
nge
1075
.7%
141.
2%11
6.2%
350.
8%94
.1%
119.
7%11
7.0%
21.5
%13
.0%
Est
imat
ed r
ent
11.1
9.0
9.0
9.0
9.0
35.9
17.2
17.2
34.4
17.2
17.2
68.7
17.1
868
.717
.2
EB
ITD
AR
14.7
18.2
20.7
19.5
19.7
78.2
39.4
42.5
82.0
37.7
40.8
160.
444
.216
5.2
45.8
EB
ITD
AR
mar
gin
9.9%
18.3
%19
.1%
18.6
%13
.8%
17.1
%20
.0%
21.2
%20
.6%
19.1
%19
.3%
19.9
%19
.6%
19.8
%19
.6%
Cap
ital
exp
endi
ture
s6.
410
.95.
922
.45.
321
.8So
urce
(us
e) w
orki
ng c
apit
al(1
3.4)
Tota
l int
eres
t ex
pens
e5.
44.
14.
85.
27.
521
.58.
89.
318
.18.
98.
235
.27.
830
.77.
5A
mor
tiza
tion
req
uire
men
ts

E XHI
BIT
12.2
2Se
lect
Med
ical
: Ope
rati
ng M
argi
ns
Sour
ce:
Mer
rill
Lync
h &
Co.FY
98
1Q 9
92Q
99
3Q 9
94Q
99
FY 9
91Q
00
2Q 0
06
Mos
3Q 0
04Q
00
FY 0
01Q
01
12 M
os2Q
01
12/3
1/98
3/31
/99
6/30
/99
9/30
/99
12/3
1/99
12/3
1/99
3/31
/00
6/30
/00
6/30
/00
9/30
/00
12/3
1/00
12/3
1/00
3/31
/01
3/31
/01
6/30
/01
Cos
t of
ser
vice
86.5
%85
.1%
83.0
%82
.6%
85.3
%84
.1%
85.0
%80
.3%
81.1
%86
.1%
85.6
%85
.1%
84.2
%84
.9%
80.6
%G
ener
al a
nd a
dmin
istr
ativ
e8.
44.
34.
65.
64.
44.
73.
73.
73.
73.
53.
23.
53.
73.
53.
7B
ad d
ebt
expe
nse
(inc
lude
d in
CO
S)2.
71.
31.
61.
82.
71.
90.
03.
43.
20.
00.
00.
00.
00.
03.
5D
epre
ciat
ion
and
amor
tiza
tion
3.3
3.5
3.1
3.4
4.4
3.7
3.6
3.5
3.5
3.7
4.2
3.8
3.5
3.7
3.4
EB
ITD
A2.
49.
310
.810
.07.
59.
311
.312
.612
.010
.411
.111
.412
.011
.612
.2O
pera
ting
inco
me
(0.9
)5.
87.
76.
63.
15.
67.
79.
18.
46.
76.
97.
68.
57.
88.
9M
inor
ity
inte
rest
1.2
1.1
1.0
0.7
0.5
0.8
0.6
0.5
0.5
0.4
0.5
0.5
0.6
0.5
0.4
Tax
rate
1.0
5.0
127.
612
1.6
23.0
(62.
7)47
.047
.047
.069
.226
.345
.539
.043
.939
.0

252
EXHI
BIT
12.2
3Se
lect
Med
ical
: Inc
ome
Stat
emen
t D
ata
3Q 0
1E4Q
01E
FY 0
1EQ
1 02
EQ
2 02
EQ
3 02
EQ
4 02
EFY
02
9/30
/01
12/3
1/01
12/3
1/01
3/31
/02
6/30
/02
9/30
/02
12/3
1/02
12/3
1/02
Rev
enue
s(S
peci
alty
hos
pita
ls)
inpa
tien
tne
t re
venu
e11
2.9
119.
046
4.1
138.
512
9.9
135.
414
3.9
547.
7O
utpa
tien
t ne
t re
venu
e10
3.1
103.
942
7.6
108.
210
9.1
105.
410
6.1
428.
8O
ther
rev
enue
3.5
4.5
14.5
5.0
5.0
5.0
5.0
20.0
Tota
l net
rev
enue
219.
522
7.4
906.
225
1.7
244.
024
5.8
255.
099
6.6
YO
Y %
Cha
nge
Cos
t of
ser
vice
186.
619
2.7
765.
921
3.0
206.
720
8.2
215.
784
3.6
Gen
eral
and
adm
inis
trat
ive
8.2
8.5
33.8
9.1
9.0
9.1
9.2
36.4
Bad
deb
t ex
pens
e—
——
—D
epre
ciat
ion
and
amor
tiza
tion
7.7
8.0
31.3
8.6
8.3
8.1
8.4
33.4
Ope
rati
ng in
com
e17
.018
.275
.221
.120
.020
.421
.783
.2
Inte
rest
inco
me
——
——
——
——
Inte
rest
exp
ense
8.3
8.2
31.7
8.1
8.1
8.0
7.9
32.0
Net
inte
rest
exp
ense
(in
com
e)8.
38.
232
.58.
18.
18.
07.
932
.0
Oth
er in
com
e/(c
harg
es)
——
——
——
——
Inco
me
befo
re m
inor
ity
inte
rest
8.8
10.0
40.5
13.0
12.0
12.4
13.8
51.2

253
Min
orit
y in
tere
st0.
20.
32.
91.
01.
01.
01.
04.
0
Pret
ax in
com
e8.
59.
638
.212
.011
.011
.412
.847
.2Ta
xes
3.3
3.8
15.8
4.7
4.3
4.5
5.0
18.4
Net
Inc
ome,
bef
ore
extr
aord
inar
y it
ems
5.2
5.9
23.3
7.3
6.7
7.0
7.8
28.8
Ext
raor
dina
ry it
em—
—8.
7—
——
——
Net
inco
me
5.2
5.9
23.3
7.3
6.7
7.0
7.8
28.8
Les
s: P
refe
rred
div
iden
ds—
—2.
3—
——
——
Net
ava
ilabl
e to
com
mon
5.2
5.9
21.0
7.3
6.7
7.0
7.8
21.5
Net
ava
ilabl
e to
com
mon
, ex
clud
ing
extr
a it
ems
5.2
5.9
21.0
7.3
6.7
7.0
7.8
28.8
Wtd
. ave
rage
sha
res
outs
tand
ing
Bas
ic47
.00
47.0
041
.20
47.2
047
.20
47.2
047
.20
47.2
Dilu
ted
46.4
046
.40
43.8
2
Ear
ning
s pe
r sh
are:
Bas
ic$0
.11
$0.1
3$0
.51
$0.1
6$0
.14
$0.1
5$0
.17
$0.6
1D
ilute
d, e
xclu
ding
one
-tim
e it
ems
$0.1
1$0
.13
$0.4
8D
ilute
d, a
s re
port
ed$0
.11
$0.1
3$0
.48
(con
tinu
ed)

254
EXHI
BIT
12.2
3C
onti
nued
Cas
h Fl
ow D
ata:
Ope
rati
ng in
com
e17
.018
.275
.221
.120
.020
.421
.783
.2D
epre
ciat
ion
and
amor
tiza
tion
7.7
8.0
31.3
8.6
8.3
8.1
8.4
33.4
EB
ITD
A24
.726
.210
6.5
29.7
28.3
28.5
30.1
116.
6
EB
ITD
A m
argi
n11
.3%
11.5
%11
.8%
11.8
%11
.6%
11.6
%11
.8%
11.7
%Y
OY
% c
hang
e
Est
imat
ed r
ent
17.9
18.3
71.0
18.7
19.1
19.5
19.9
77.3
EB
ITD
AR
42.6
44.5
177.
548
.447
.448
.050
.019
3.9
EB
ITD
AR
mar
gin
19.4
%19
.6%
19.6
%19
.2%
19.4
%19
.5%
19.6
%19
.5%
Cap
ital
exp
endi
ture
s(5
.1)
(5.1
)(2
1.9)
(5.7
5)(5
.75)
(5.7
5)(5
.75)
(23.
0)So
urce
(us
e) w
orki
ng c
apit
al(1
0.7)
(8.5
)(4
0.1)
(9.0
)(9
.3)
(11.
4)(1
1.7)
(41.
4)To
tal i
nter
est
expe
nse
(8.3
)(8
.2)
(32.
6)(8
.1)
(8.1
)(8
.0)
(7.9
)(3
2.0)
Am
orti
zati
on r
equi
rem
ents
(3.7
)(3
.7)
(11.
0)(5
.4)
(5.4
)(5
.4)
(5.4
)(2
1.7)
(3.0
)0.
81.
01.
3(0
.2)
(2.0
)(0
.6)
(1.6
)
Bal
ance
she
et d
ata:
Cas
h11
.111
.99.
510
.810
.68.
67.
97.
9To
tal d
ebt
291.
328
7.7
287.
728
2.2
276.
827
1.4
266.
026
6.0
Shar
ehol
ders
’ equ
ity
209.
821
5.7
215.
722
3.0
229.
723
6.7
244.
524
4.5
Cre
dit
stat
istic
s:E
BIT
DA
/tot
al in
tere
st e
xpen
se3.
0x3.
2x3.
4x3.
6x3.
5x3.
6x3.
8x3.
6xE
BIT
DA
-cap
ital
exp
endi
ture
s/to
tal i
nter
est
expe
nse
2.4x
2.6x
2.7x
2.9x
2.8x
2.9x
3.1x
2.9x
Tota
l deb
t/E
BIT
DA
2.7x
2.3x
Tota
l adj
uste
d de
bt/
EB
ITD
AR
4.8x
4.6x
Sour
ce:
Mer
rill
Lync
h &
Co.

255
EXHI
BIT
12.2
4Se
lect
Med
ical
: Ope
rati
ng M
argi
ns
3Q 0
1E4Q
01E
FY 0
1EQ
1 02
EQ
2 02
EQ
3 02
EQ
4 02
EFY
02
9/30
/01
12/3
1/01
12/3
1/01
3/31
/02
6/30
/02
9/30
/02
12/3
1/02
12/3
1/02
Ope
rati
ng m
argi
ns:
Cos
t of
ser
vice
81.5
%81
.3%
81.8
%81
.1%
81.2
%81
.2%
81.1
%81
.1%
Gen
eral
and
adm
inis
trat
ive
3.8%
3.8%
3.8%
3.6%
3.7%
3.7%
3.6%
3.6%
Bad
deb
t ex
pens
e (i
nclu
ded
in C
OS)
3.5%
3.5%
2.6%
3.5%
3.5%
3.5%
3.5%
3.5%
Dep
reci
atio
n an
d am
orti
zati
on3.
5%3.
5%3.
8%3.
4%3.
4%3.
3%3.
3%3.
3%E
BIT
DA
11.3
%11
.5%
11.8
%11
.8%
11.6
%11
.6%
11.8
%11
.7%
Ope
rati
ng in
com
e7.
8%8.
0%8.
3%8.
4%8.
2%8.
3%8.
5%8.
4%M
inor
ity
inte
rest
0.1%
0.2%
0.3%
0.4%
0.4%
0.4%
0.4%
0.4%
Tax
rate
39.0
%39
.0%
39.0
%39
.0%
39.0
%39
.0%
39.0
%39
.0%
Rev
enue
mix
:In
pati
ent
reve
nues
51.4
%52
.3%
51.2
%55
.0%
53.2
%55
.1%
56.4
%55
.0%
Out
pati
ent
reve
nues
47.0
%45
.7%
47.2
%43
.0%
44.7
%42
.9%
41.6
%43
.0%
Oth
er1.
6%2.
0%1.
6%2.
0%2.
0%2.
0%2.
0%2.
0%
Tota
l10
0.0%
100.
0%10
0.0%
100.
0%10
0.0%
100.
0%10
0.0%
100.
0%
EB
ITD
A m
ix:
Inpa
tien
t E
BIT
DA
13.1
15.9
55.4
918
.617
.418
.119
.373
.4
Out
pati
ent
EB
ITD
A16
.915
.371
.60
16.2
16.0
15.5
15.9
48.3
Oth
er E
BIT
DA
(5.3
)(5
.1)
(21.
67)
(5.1
)(5
.1)
(5.1
)(5
.1)
(5.1
)24
.726
.210
6.5
29.7
28.3
28.5
30.1
116.
6
Inpa
tien
t m
argi
n11
.6%
13.4
%12
.0%
13.4
%13
.4%
13.4
%13
.4%
13.4
%O
utpa
tien
t m
argi
n16
.4%
14.7
%16
.7%
15.0
%14
.7%
14.7
%15
.0%
11.3
%To
tal m
argi
n11
.3%
11.5
%11
.8%
11.8
%11
.6%
11.6
%11
.8%
11.7
%
Sour
ce:
Mer
rill
Lync
h &
Co.

E XHI
BIT
12.2
5Se
lect
Med
ical
: Rev
enue
Pro
ject
ions
Day
s in
Per
iod
9091
9091
9292
9091
9292
1Q 9
92Q
99
1Q 0
12Q
01Q
3 01
Q4
01Q
1 02
Q2
02Q
3 02
Q4
023/
31/9
96/
30/9
93/
31/0
16/
30/0
19/
30/0
112
/31/
013/
31/0
26/
30/0
29/
30/0
212
/31/
02
Lon
g-T
erm
Acu
te C
are
Num
ber
of lo
ng-t
erm
acu
te c
ares
4142
5658
6062
6770
7376
Tota
l lic
ense
d be
ds1,
529
1,57
02,
068
2,14
62,
220
2,29
42,
479
2,59
02,
701
2,81
2A
vera
ge t
otal
lice
nsed
bed
s1,
479
1,55
02,
025
2,10
72,
183
2,25
72,
424
2,53
52,
646
2,75
7A
vera
ge b
eds/
long
-ter
m a
cute
car
e—PE
3737
3737
3737
3737
3737
Adm
issi
ons
3,05
42,
952
4,19
14,
086
4,09
64,
293
5,01
64,
915
4,96
45,
244
Adm
issi
ons/
bed
2.1
1.9
2.1
1.9
1.9
1.9
2.1
1.9
1.9
1.9
Tota
l len
gth
of s
tay
30.0
30.0
31.0
30.0
31.5
31.5
30.5
30.0
31.5
31.5
Inpa
tien
t da
ys85
,206
89,1
5112
3,74
012
5,58
712
9,01
713
5,24
215
2,98
014
7,45
115
6,35
116
5,17
2D
aily
cen
sus
947
980
1,37
51,
380
1,40
21,
470
1,70
01,
620
1,69
91,
795
Occ
upan
cy r
ate
63.0
%0.
6368
.0%
65.5
%64
.2%
65.1
%70
.1%
63.9
%64
.2%
65.1
%R
even
ues
per
pati
ent
day
$825
.06
$947
.00
$914
.42
$890
.00
$875
.00
$880
.00
$905
.27
$881
.10
$866
.25
$871
.20
Tota
l inp
atie
nt r
even
ues
70.3
119.
011
3.2
119.
011
2.9
119.
013
8.5
129.
913
5.4
143.
9
For
proj
ecte
d pe
riod
sA
ddit
iona
l lon
g-te
rm a
cute
car
es o
pene
d2
42
23
33
3%
P-o
-P c
hang
e in
adm
issi
ons/
bed
0.5%
1.0%
2.0%
0.0%
0.0%
0.0%
0.0%
Cha
nge
in le
ngth
of
stay
(P-
o-P
)0.
0%50
.0%
50.0
%(5
0.0)
%0.
0%0.
0%0.
0%C
hang
e in
rev
enue
/pat
ient
day
(P-
o-P
)0.
9%(2
.1)%
(4.4
)%(1
.0)%
(1.0
)%(1
.0)%
(1.0
)%

Out
patie
nt r
ehab
ilita
tion
clin
ics
(exc
ludi
ng m
anag
ed f
acili
ties)
Tota
l num
ber
of c
linic
s42
4353
854
855
856
857
858
859
860
8A
vera
ge n
umbe
r of
clin
ics
4354
454
355
356
357
358
359
360
3To
tal v
isit
s94
6,18
095
8,44
390
7,98
792
2,89
499
6,60
81,
029,
035
973,
653
988,
452
Ave
rage
vis
its
per
aver
age
num
ber
of c
linic
s1,
739
1,76
51,
642
1,63
91,
739
1,76
51,
642
1,63
9A
vera
ge r
even
ue p
er v
isit
$81.
00$7
9.30
$79.
97$7
9.53
$81.
00$7
9.30
$79.
97$7
9.53
Tota
l clin
ic r
even
ue14
.616
.076
.676
.072
.673
.480
.781
.677
.978
.6M
anag
ed c
linic
rev
enue
2.5
2.7
5.0
5.5
5.5
5.5
5.5
5.5
5.5
5.5
Oth
er o
utpa
tien
t re
venu
e10
.69.
927
.025
.025
.025
.022
.022
.022
.022
.0To
tal o
utpa
tien
t re
venu
e27
.728
.610
8.6
106.
510
3.1
103.
910
8.2
109.
110
5.4
106.
1
For
proj
ecte
d pe
riod
sA
ddit
iona
l clin
ics
open
ed(1
2)10
1010
1010
1010
% P
-o-P
cha
nge
in a
vera
ge v
isit
s0.
5%0.
5%0.
5%(2
.0)%
(2.0
)%(2
.0)%
(2.0
)%C
hang
e in
ave
rage
rev
enue
per
vis
it2.
0%1.
5%2.
5%0.
0%0.
0%0.
0%0.
0%
Sour
ce:
Mer
rill
Lync
h &
Co.

258
EXHI
BIT
12.2
6Se
lect
Med
ical
: Deb
t Se
rvic
e Pr
ojec
tion
Pro
Form
a as
of
Mar
ch 3
1, 2
001
3/31
/01
6/30
/01
9/30
/01
12/3
1/01
3/31
/02
6/30
/02
9/30
/02
12/3
1/02
Rev
olve
r—
—3.
0(1
.0)
Term
loan
100.
010
0.0
100.
010
0.0
96.0
92.0
88.0
84.0
9.5%
Sr.
Sub
. not
es ’0
917
5.0
175.
017
5.0
175.
017
5.0
175.
017
5.0
175.
0Se
ller
note
s21
.417
.714
.010
.48.
97.
56.
14.
7O
ther
2.3
2.3
2.3
2.3
2.3
2.3
2.3
2.3
Tota
l deb
t29
8.7
295.
029
1.3
287.
728
2.2
276.
827
1.4
266.
0
Am
orti
zati
on R
equi
rem
ents
Term
loan
4.0
4.0
4.0
4.0
Selle
r no
tes
3.7
3.7
3.7
1.4
1.4
1.4
1.4
LIB
OR
=4
Inte
rest
rat
esR
evol
ver
L+
2.75
6.8%
6.8%
6.8%
6.8%
6.8%
6.8%
6.8%
Term
loan
L+
37.
0%7.
0%7.
0%7.
0%7.
0%7.
0%7.
0%Sr
. Sub
. not
es9.
5%9.
5%9.
5%9.
5%9.
5%9.
5%9.
5%Se
ller
note
s6.
0%6.
0%6.
0%6.
0%6.
0%6.
0%6.
0%O
ther
7.0%
7.0%
7.0%
7.0%
7.0%
7.0%
7.0%
Inte
rest
exp
ense
Rev
olve
r in
terp
erio
d1.
51.
51.
51.
51.
51.
51.
5R
evol
ver
L+
2.75
Term
Loa
n L
+3
1.8
1.8
1.8
1.7
1.6
1.6
1.5
Sr. S
ub. n
otes
4.2
4.2
4.2
4.2
4.2
4.2
4.2
Selle
r no
tes
0.3
0.2
0.2
0.1
0.1
0.1
0.1
Oth
er0.
60.
60.
60.
60.
60.
60.
6To
tal i
nter
est
expe
nse
8.3
8.3
8.2
8.1
8.1
8.0
7.9
Sour
ce:
Mer
rill
Lync
h &
Co.

259
EXHI
BIT
12.2
7Se
lect
Med
ical
: Cap
ital
Spe
ndin
g Pr
ojec
tion
Cas
h Fl
ow I
tem
s
6/30
/01
9/30
/01
12/3
1/01
3/31
/02
6/30
/02
9/30
/02
12/3
1/02
Cap
ital
exp
endi
ture
sM
aint
enan
ce3.
03.
03.
03.
03.
03.
03.
0D
evel
opm
ent
3.5
2.1
2.1
2.8
2.8
2.8
2.8
6.5
5.1
5.1
5.8
5.8
5.8
5.8
Wor
king
cap
ital
sou
rce
(use
)A
mor
tiza
tion
req
uire
men
ts3.
73.
73.
75.
45.
45.
45.
4
Dev
elop
men
t ca
pita
l exp
endi
ture
sN
umbe
r of
long
-ter
m a
cute
car
es a
dded
4.0
2.0
2.0
3.0
3.0
3.0
3.0
Cap
ex/lo
ng-t
erm
acu
te c
are
0.7
0.7
0.7
0.7
0.7
0.7
0.7
Tota
l lon
g-te
rm a
cute
car
e de
velo
pmen
t ca
pita
l exp
endi
ture
s2.
81.
41.
42.
12.
12.
12.
1W
orki
ng c
apit
al p
er lo
ng-t
erm
acu
te c
are
2.0
2.0
2.0
2.0
2.0
2.0
2.0
Wat
er f
all (
assu
min
g 2
Q b
uild
up)
Q2
014.
04.
0Q
3 01
2.0
2.0
Q4
012.
02.
0Q
1 02
3.0
3.0
Q2
023.
03.
0Q
3 02
3.0
3.0
Q4
023.
0To
tal l
ong-
term
acu
te c
are
wor
king
cap
ital
4.0
6.0
4.0
5.0
6.0
6.0
6.0
Num
ber
of r
ehab
ilita
tion
clin
ics
adde
d10
.010
.010
.010
.010
.010
.010
.0C
apit
al e
xpen
ditu
res/
clin
ic0.
10.
10.
10.
10.
10.
10.
1To
tal r
ehab
ilita
tion
dev
elop
men
t ca
pita
l ex
pend
itur
es0.
70.
70.
70.
70.
70.
70.
7W
orki
ng c
apit
al p
er c
linic
0.07
0.07
0.07
0.07
0.07
0.07
0.07
Tota
l wor
king
cap
ital
0.7
0.7
0.7
0.7
0.7
0.7
0.7
Sour
ce:
Mer
rill
Lync
h &
Co.

260
EXHI
BIT
12.2
8Se
lect
Med
ical
: Wor
king
Cap
ital
Pro
ject
ion
12/3
1/00
3/31
/01
6/30
/01
9/30
/01
12/3
1/01
3/31
/02
6/30
/02
9/30
/02
12/3
1/02
Wor
king
cap
ital
acc
ount
sR
ecei
vabl
es19
6.5
201.
620
9.1
214.
521
9.8
224.
822
8.6
235.
024
1.7
Paya
bles
38.8
28.9
33.0
33.7
34.5
35.5
36.0
36.9
38.0
Rec
eiva
bles
as
% o
f lo
ng-
term
man
agem
ent
reve
nue
24.4
%24
.2%
24.3
%24
.3%
24.3
%24
.3%
24.3
%24
.3%
24.3
%Pa
yabl
es a
s %
of
long
-ter
mm
anag
emen
t co
st o
f se
rvic
e5.
7%4.
1%4.
5%4.
5%4.
5%4.
5%4.
5%4.
5%4.
5%
Sour
ce (
use)
cas
hR
ecei
vabl
es(5
.1)
(7.5
)(5
.5)
(5.2
)(5
.1)
(3.8
)(6
.4)
(6.7
)Pa
yabl
es(9
.9)
4.0
0.8
0.7
1.1
0.4
1.0
1.0
New
bui
ld w
orki
ng c
apit
al(4
.0)
(6.0
)(4
.0)
(5.0
)(6
.0)
(6.0
)(6
.0)
Tota
l wor
king
cap
ital
(7.4
)(1
0.7)
(8.5
)(9
.0)
(9.3
)(1
1.4)
(11.
7)
Sour
ce:
Mer
rill
Lync
h &
Co.

261
EXHI
BIT
12.2
9A
dvan
cePC
S: H
isto
rica
l and
Pro
ject
ed F
inan
cial
Dat
a
Full
Yea
rFu
ll Y
ear
Q3
01Q
4 01
Q2
02E
Q3
02E
Q4
02E
02E
03E
12/3
1/00
3/31
/01
9/30
/01
12/3
1/01
3/31
/02
3/31
/02
3/31
/03
Inco
me
stat
emen
t da
ta:
Rev
enue
2,91
6.5
2,99
1.4
3,15
4.4
3,16
1.3
3,39
6.5
12,8
60.1
14,4
67.8
Cos
t of
rev
enue
2,82
4.6
2,89
6.9
3,04
5.9
3,05
0.1
3,28
3.7
12,4
20.5
14,0
03.0
Selli
ng, g
ener
al, a
nd a
dmin
istr
ativ
e55
.152
.247
.048
.050
.019
0.4
200.
0C
orpo
rate
res
truc
turi
ng—
——
——
——
Non
recu
rrin
g ch
arge
s0.
710
.4—
——
0.9
—W
rit e
- dow
n of
ass
ets
——
——
——
—
Ope
rati
ng in
com
e36
.131
.961
.563
.262
.824
9.2
264.
7
Inte
rest
inco
me
1.6
—0.
80.
80.
83.
03.
0In
tere
st e
xpen
se22
.119
.918
.018
.018
.073
.362
.1M
erge
r co
st—
——
——
——
Inco
me
befo
re t
axes
15.6
11.9
44.3
45.9
45.5
178.
920
5.6
Prov
isio
n fo
r in
com
e ta
xes
8.6
8.5
17.5
18.1
18.0
70.7
81.2
Net
inco
me
6.97
83.
405
26.8
27.8
27.5
108.
212
4.4
EPS
(ba
sic)
$0.2
3$0
.09
$0.7
2$0
.75
$0.7
4$2
.93
EPS
(di
lute
d)$0
.16
$0.0
8$0
.59
$0.6
1$0
.61
$2.3
8$2
.74
Ave
rage
sha
res
outs
tand
ing
(bas
ic)
29,9
1336
,490
37,0
00.0
37,0
00.0
37,0
00.0
37,0
00.0
Ave
rage
s sh
ares
out
stan
ding
(di
lute
d)44
,507
44,8
2745
,400
45,4
0045
,400
45,4
0045
,400
(con
tinu
ed)

262
EXHI
BIT
12.2
9C
onti
nued
Full
Yea
rFu
ll Y
ear
Q3
01Q
4 01
Q2
02E
Q3
02E
Q4
02E
02E
03E
12/3
1/00
3/31
/01
9/30
/01
12/3
1/01
3/31
/02
3/31
/02
3/31
/03
Cas
h fl
ow d
ata:
Ope
rati
ng in
com
e36
.842
.361
.563
.262
.824
9.2
264.
7D
epre
ciat
ion
and
amor
tiza
tion
21.8
19.4
9.5
9.5
10.2
38.3
43.4
EB
ITD
A58
.661
.771
.072
.773
.028
7.5
308.
1
EB
ITD
A m
argi
n2.
1%2.
3%2.
3%2.
1%2.
2%2.
1%
Cap
ital
exp
endi
ture
s9.
018
.012
.512
.512
.550
.060
Wor
king
cap
ital
——
——
——
—N
et in
tere
st e
xpen
se20
.519
.918
.018
.018
.070
.359
.1D
ebt
amor
tiza
tion
——
6.6
6.6
6.6
26.3
34.0
Rev
olve
r pa
ymen
t—
—15
.015
.015
.060
.0—
Cas
h ta
xes
——
8.7
9.1
9.0
35.3
40.6
Free
cas
h fl
ow29
.123
.810
.211
.511
.945
.611
4.4
Bal
ance
she
et d
ata:
Cas
h12
4.4
110.
010
0.0
100.
010
0.0
100.
010
0.0
Tota
l deb
t81
0.0
845.
081
8.3
805.
079
1.5
791.
575
7.5
Sto
ckho
lder
s’ e
quit
y39
3.2
405.
744
7.4
475.
250
2.7
502.
762
7.15
Cre
dit
stat
istic
sE
BIT
DA
/inte
rest
exp
ense
2.6x
3.1x
3.9x
4.0x
4.1x
3.9x
5.0x
EB
ITD
A-c
apit
al e
xpen
se/in
tere
st e
xpen
se2.
2x2.
2x3.
2x3.
3x3.
4x3.
2x4.
0xTo
tal d
ebt/
EB
ITD
A2.
8x2.
5x
Sour
ce:
Mer
rill
Lync
h &
Co.

EXHI
BIT
12.3
0A
dvan
cePC
S: F
orec
ast
Ass
umpt
ions
Full
Yea
rFu
ll Y
ear
Q2
02 E
Q3
02E
Q4
02E
02E
Q1
03E
Q2
03E
Q3
03E
Q4
03E
03E
9/30
/01
12/3
1/01
3/31
/02
3/31
/02
6/30
/02
9/30
/02
12/3
1/02
3/31
/03
3/31
/03
Rev
enue
Dri
vers
Phar
mac
y ne
twor
k cl
aim
s11
3.1
113.
111
3.3
452.
511
3.50
113.
7011
4.20
114.
4045
5.8
Mai
l pha
rmac
y sc
ript
s fi
lled
2.6
2.7
2.8
10.7
2.88
2.98
3.23
3.33
12.4
Tota
l adj
uste
d cl
aim
s12
1.0
121.
112
1.6
484.
412
2.1
122.
612
3.9
124.
449
3.0
Rev
enue
per
cla
im$2
6.08
$26.
10$2
7.93
$27.
93$2
7.93
$29.
32$2
9.32
$30.
79$3
0.79
EB
ITD
A/a
djus
ted
clai
m$
0.59
$0.
60$
0.60
$0.
59$
0.62
$0.
62$
0.63
$0.
63$
0.63
Sequ
enti
al c
laim
s gr
owth
Phar
mac
y0.
1%0.
0%0.
2%0.
2%0.
2%0.
4%0.
2%M
ail
1.9%
1.9%
3.7%
3.6%
3.5%
8.4%
3.1%
Tota
l0.
2%0.
1%0.
4%0.
4%0.
4%1.
0%0.
4%
Sequ
enti
al p
er c
laim
gro
wth
$—$0
.02
$1.8
3$
—$1
.40
$—
$1.4
7R
even
ue/c
laim
$—$0
.01
$—
$0.0
2$
—$0
.01
$—
Mar
gins
Cos
t of
rev
enue
/rev
enue
96.6
%96
.5%
96.7
%96
.6%
96.6
%96
.8%
96.8
%96
.9%
96.8
%S&
GA
/rev
enue
1.5%
1.5%
1.5%
1.5%
1.5%
1.4%
1.4%
1.3%
1.4%
Rev
enue
by
divi
sion
(pr
o fo
rma)
Rev
enue
Dat
a se
rvic
esM
ail s
ervi
ces
Clin
ical
and
oth
er s
ervi
ces
Tota
l rev
enue
Ope
rati
ng m
argi
n2.
0%2.
0%1.
8%1.
9%1.
9%1.
8%1.
8%1.
7%1.
8%D
&A
/rev
enue
0.3%
0.3%
0.3%
0.3%
0.3%
0.3%
0.3%
0.3%
0.3%
EB
ITD
A m
argi
n2.
3%2.
3%2.
1%2.
2%2.
2%2.
1%2.
1%2.
0%2.
1%Ta
x ra
te39
.5%
39.5
%39
.5%
39.5
%39
.5%
39.5
%39
.5%
39.5
%39
.5%
Sour
ce:
Mer
rill
Lync
h &
Co.

EXHI
BIT
12.3
1A
dvan
cePC
S: D
ebt
Serv
ice
Proj
ecti
on Q1
02Q
2 02
Q3
02Q
4 02
Full
Yea
r 02
Full
Yea
r 03
12/3
1/00
3/31
/01
6/30
/01
9/30
/01
12/3
1/01
3/31
/02
3/31
/02
3/31
/03
3/31
/04
3/31
/05
3/31
/06
Cas
h12
4.35
100
150
100
100
100
100
100
Rev
olvi
ng c
redi
t60
95.0
88.5
683
.47
77.7
071
.75
71.7
550
5050
50B
ank
debt
550
550.
054
2.4
534.
8852
7.31
519.
7551
9.75
485.
75Se
nior
not
es20
020
0.0
200
200
200
200
200
200
200
200
200
Tota
l deb
t81
084
5.0
831
818.
380
5.0
791.
579
1.49
5153
735.
7525
025
025
0
Tota
l equ
ity
393.
226
Term
A15
0Te
rm B
400
Am
orti
zati
onTe
rm A
6.56
256.
5625
6.56
256.
5625
26.3
30.3
37.5
45.0
Term
B1.
01.
01.
01.
04.
04.
04.
04.
0To
tal a
mor
tiza
tion
7.6
7.6
7.6
7.6
30.3
34.0
41.5
49.0
Inte
rest
rat
esR
/C (
L+
3)8.
25%
8.25
%8.
25%
8.25
%8.
25%
8.25
%8.
25%
8.25
%8.
25%
8.25
%8.
25%
Ban
k de
bt (
esti
mat
e bl
ende
d)8.
25%
8.25
%8.
25%
8.38
%8.
38%
8.38
%8.
38%
8.38
%8.
38%
8.38
%8.
38%
Seni
or n
otes
8.50
%8.
50%
8.50
%8.
50%
8.50
%8.
50%
8.50
%8.
50%
8.50
%8.
50%
8.50
%
Inte
rest
exp
ense
Rev
olvi
ng c
redi
t7.
8375
3.77
33
Ban
k de
bt11
.28
11.2
811
.12
10.9
644
.64
42.1
1Se
nior
not
es4.
254.
254.
254.
2517
17To
tal i
nter
est
expe
nse
19.2
9918
1818
64.6
3744
1462
.105
3125
Inte
rest
inco
me
0.03
3N
et in
tere
st e
xpen
se61
.637
4414
Sour
ce:
Mer
rill
Lync
h &
Co.

Forecasting Financial Statements 265
AdvancePCS
AdvancePCS provides a variety of health improvement services, includingintegrated mail service, retail pharmacy networks, clinical services, cus-tomized disease management programs, research on clinical trials andoutcomes, prescription drug service for the uninsured, and an Internetpharmacy. As a service provider, the company does not have substantialworking capital requirements, unlike manufacturers and retailers that mustcarry large inventories.
Analyst Gray’s forecasting task is consequently less complex than in thecase of Select Medical. The company’s historical and projected revenue (Ex-hibit 12.29) is largely a function of pharmacy network claims and prescrip-tions filled by mail (Exhibit 12.30). Gray projects rising revenue per claim,based largely on continued escalation in the price of prescription drugs.Also contributing to the expected rise in revenue per claim is growth in themail order business, which tends to fill larger orders (three-month, as op-posed to one-month prescriptions) than the other pharmacy operations.Again in contrast to Select Medical, AdvancePCS enjoys extremely stablemargins. Exhibit 12.31 rounds out the story with a projection of debt ser-vice requirements.
CONCLUSION
Of the various types of analysis of financial statements, projecting future re-sults and ratios requires the greatest skill and produces the most valuablefindings. Looking forward is also the riskiest form of analysis, since thereare no correct answers until the future statements appear. Totally unfore-seeable events may invalidate the assumptions underlying the forecast; eco-nomic shocks or unexpected changes in a company’s financial strategiesmay knock all calculations into a cocked hat.
The prominence of the chance element in the forecasting process meansthat analysts should not be disheartened if their predictions miss the mark,even widely on occasion. They should aim not for absolute prescience butrather for a sound probabilistic model of the future. The model should log-ically incorporate all significant evidence, both within, and external to, thehistorical statements. An analyst can then judge whether a company’s pre-vailing valuations (e.g., stock price, credit rating) are consistent with thepossible scenarios and their respective probabilities.
By tracking the after-the-fact accuracy of a number of projections, ananalyst can gauge the effectiveness of these methods. Invariably, there will

266 FORECASTS AND SECURITY ANALYSIS
be room for further refinement, particularly in the area of gathering infor-mation on industry conditions. No matter how refined the methods are,however, perfection will always elude the modeler since no business cycleprecisely recapitulates its predecessor. That is what ultimately makes look-ing forward with financial statements such a challenging task. The lack of apredictable, recurring pattern is also what makes financial forecasting sovaluable. When betting huge sums in the face of massive uncertainty, it is es-sential that investors understand the odds as fully as they possibly can.

267
CHAPTER 13Credit Analysis
C redit analysis is one of the most common uses of financial statements, re-flecting the many forms of debt that are essential to the operation of a
modern economy. Merchants who exchange goods for promises to pay needto evaluate the reliability of those promises. Commercial banks that lend themerchants the funds to finance their inventories likewise need to calculatethe probability of being repaid in full and on time. The banks must in turndemonstrate their creditworthiness to other financial institutions that lendto them by purchasing their certificates of deposit and bonds. In all of thesecases, financial statement analysis can significantly influence a decision toextend or not to extend credit.
As important as financial statements are to the evaluation of credit risk,however, the analyst must bear in mind that other procedures also play arole. Financial statements tell much about a borrower’s ability to repay a loan, but disclose little about the equally important willingness to repay.Accordingly, a thorough credit analysis may have to include a check of thesubject’s past record of repayment, which is not part of a standard financialstatement. Moreover, to assess the creditworthiness of the merchant in thisexample, the bank must consider along with his balance sheet and incomestatement the competitive environment and strength of the local economyin which the borrower operates. Lenders to the bank will in turn considernot only the bank’s financial position, but also public policy. Believing thata sound banking system benefits the economy as a whole, national govern-ments empower central banks to act as lenders of last resort. As a result,fewer bank failures occur than would be the case under pure, unrestrainedcompetition.
An even more basic reason why analyzing a company’s financial state-ments may not be sufficient for determining its credit quality is that the bor-rower’s credit may be supported, formally or informally, by another entity.Many municipalities obtain cost savings on their financings by having their

268 FORECASTS AND SECURITY ANALYSIS
debt payments guaranteed by bond insurers with premier credit ratings. Forholders of these municipal bonds, the insurer’s creditworthiness, not the mu-nicipality’s financial condition, is the basis for determining the likelihood ofrepayment. Corporations, too, sometimes guarantee the debt of weaker cred-its. Even when the stronger company does not take on a legal obligation topay if the weaker company fails on its debt, “implicit support” may affect thelatter’s credit quality. If a company is dependent on raw materials provided bya subsidiary, there may be a reasonable presumption that it will stand behindthe subsidiary’s debt, even in the absence of a formal guarantee.
Keeping in mind that the final judgment may be influenced by other in-formation as well, the analyst can begin to extract from the financial state-ments the data that bear on credit risk. Each of the basic statements—thebalance sheet, income statement, and statement of cash flows—yields valu-able insights when studied through ratio analysis techniques, as well aswhen used in the evaluation of fixed-income securities. In each case, the an-alyst must temper any enthusiasm generated by a review of historical state-ments with caution based on a consideration of financial ratios derivedfrom projected statements for future years.
BALANCE SHEET RATIOS
The most immediate danger faced by a lender is the risk that the borrowerwill suffer illiquidity—an inability to raise cash to pay its obligations. Thiscondition can arise for many reasons, one of which is a loss of ability toborrow new funds to pay off existing creditors. Whatever the underlyingcause, however, illiquidity manifests itself as an excess of current cash pay-ments due, over cash currently available. The current ratio gauges the risk ofthis occurring by comparing the claims against the company that will be-come payable during the current operating cycle (current liabilities) with theassets that are already in the form of cash or that will be converted to cashduring the current operating cycle (current assets). Referring to Johnson &Johnson’s balance sheet (Exhibit 13.1), the company’s current ratio as ofDecember 31, 2000, was 2.16 (dollar figures are in millions):
Analysts also apply a more stringent test of liquidity by calculating thequick ratio, or acid test, which considers only cash and current assets that
Current ratioCurrent assets
Current liabilities= = =
$ ,$ ,
.15 4507 140
2 16

269
EXHIBIT 13.1 Johnson & Johnson
Consolidated Balance Sheetsat December 31, 2000
($000 omitted)
AssetsCurrent assetsCash and cash equivalents $ 3,411Marketable securities 2,333Accounts receivable trade, less allowances $411 (1999, $389) 4,464Inventories 2,842Deferred taxes on income 1,151Prepaid expenses and other receivables 1,249
Total current assets 15,450
Marketable securities, noncurrent 269Property, plant and equipment, net 6,971Intangible assets, net 7,256Deferred taxes on income 54Other assets 1,321
Total assets $31,321
Liabilities and Shareowners’ EquityCurrent liabilitiesLoans and notes payable $ 1,479Accounts payable 2,083Accrued liabilities 2,776Accrued salaries, wages and commissions 488Taxes on income 314
Total current liabilities 7,140
Long-term debt 2,037Deferred tax liability 255Employee related obligations 1,753Other liabilities 1,328Shareowners’ equityPreferred stock—without par value (authorized and unissued
2,000,000 shares) —Common stock—par value $1.00 per share (authorized 2,160,000,000
shares; issued 1,534,921,000 and 1,534,916,000 shares) 1,535Note receivable from employee stock ownership plan (35)Accumulated other comprehensive income (470)Retained earnings 18,812
19,842Less: common stock held in treasury, at cost (143,984,000 and
145,233,000) 1,034Total shareowners’ equity 18,808
Total liabilities and shareowners’ equity $31,321
Source: 10-K405 March 30, 2001.

270 FORECASTS AND SECURITY ANALYSIS
can be most quickly converted to cash (marketable securities and receiv-ables). Johnson & Johnson’s quick ratio on December 31, 2000, was 1.43:
Besides looking at the ratio between current assets and current liabili-ties, it is also useful, when assessing a company’s ability to meet its near-term obligations, to consider the difference between the two, which istermed working capital. Referring once again to Exhibit 13.1, working cap-ital is $8.31 billion.
Working capital = Current assets − Current liabilities
$8,310 = $15,450 − $7,140
Analysis of current assets and current liabilities provides warningsabout impending illiquidity, but lenders nevertheless periodically find them-selves saddled with loans to borrowers who are unable to continue meetingtheir obligations and are therefore forced to file for bankruptcy. Recogniz-ing that they may one day find themselves holding defaulted obligations,creditors wish to know how much asset value will be available for liquida-tion to pay off their claims.1 The various ratios that address this issue can begrouped as measures of financial leverage.
A direct measure of asset protection is the ratio of total assets to totalliabilities, which in the example shown in Exhibit 13.1 comes to:
(Total liabilities can be derived quickly by subtracting stockholders’ equityfrom total assets.)
Put another way, Johnson & Johnson’s assets of $31,321 billion coulddecline in value by 60% before proceeds of a liquidation would be insuffi-cient to satisfy lenders’ $12,531 billion of claims. The greater the amountby which asset values could deteriorate, the greater the “equity cushion”(equity is by definition total assets minus total liabilities), and the greaterthe creditor’s sense of being protected.
Lenders also gauge the amount of equity “beneath” them (junior tothem in the event of liquidation) by comparing it with the amount of debt
Total assetsTotal liabilities
$31,321$12,513
= = 2 50.
Quick ratioQuick assets
Current liabilities= = =
$ ,$ ,
.10 2087 140
1 43

Credit Analysis 271
outstanding. For finance companies, where the ratio is typically greaterthan 1.0, it is convenient to express the relationship as a debt-equity ratio:
Conventionally capitalized industrial corporations (as opposed to com-panies that have undergone leveraged buyouts), generally have debt-equityratios of less than 1.0. The usual practice is to express their financial lever-age in terms of a total-debt-to-total-capital ratio:
Banks’ “capital adequacy” is commonly measured by the ratio of equity tototal assets:
Many pages of elaboration could follow on the last few ratios men-tioned. Their calculation is rather less simple than it might appear. The rea-son is that aggressive borrowers frequently try to satisfy the letter of amaximum leverage limit imposed by lenders, without fulfilling the conser-vative spirit behind it. The following discussion of definitions of leverage ra-tios addresses the major issues without laying down absolute rules about“correct” calculations. As explained later in the chapter, ratios are mostmeaningful when compared across time and across borrower. Conse-quently, the precise method of calculation is less important than the consis-tency of calculation throughout the sample being compared.
What Constitutes Total Debt?
At one time, it was appropriate to consider only long-term debt in leveragecalculations for industrial companies, since short-term debt was generallyused for seasonal purposes, such as financing Christmas-related inventory. Acompany might draw down bank lines or issue commercial paper to meetthese funding requirements, then completely pay off the interim borrowingswhen it sold the inventory. Even today, a firm that “zeros out” its short-term
Total equityTotal assets
Total debtTotal debt Minority interest Total equity+ +
Total debtTotal equity

272 FORECASTS AND SECURITY ANALYSIS
debt at some point in each operating cycle can legitimately argue that itstrue leverage is represented by the permanent (long-term) debt on its bal-ance sheet. Many borrowers have long since subverted this principle, how-ever, by relying heavily on short-term debt that they neither repay on aninterim basis nor fund (replace with long-term debt) when it grows to suffi-cient size to make a bond offering cost-effective. Such short-term debt mustbe viewed as permanent and included in the leverage calculation. (Currentmaturities of long-term debt should also enter into the calculation of totaldebt, based on a conservative assumption that the company will replace ma-turing debt with new long-term borrowings.)
As an aside, the just-described reliance on short-term debt is not neces-sarily as dangerous a practice as in years past, although it should still raisea caution flag for the credit analyst. Two risks are inherent in depending ondebt with maturities of less than one year. The first is potential illiquidity. Ifsubstantial debt comes due at a time when lenders are either unable torenew their loans (because credit is tight) or unwilling to renew (becausethey perceive the borrower as less creditworthy than formerly), the bor-rower may be unable to meet its near-term obligations. This risk may bemitigated, however, if the borrower has a revolving credit agreement, whichis a longer-term commitment by the lender to lend (subject to certain condi-tions such as maintaining prescribed financial ratios and refraining fromsignificant changes in the business). The second risk of relying on short-term borrowings is exposure to interest-rate fluctuations. If a substantialamount of debt is about to come due, and interest rates have risen sharplysince the debt was incurred, the borrower’s cost of staying in business mayskyrocket overnight.
Note that exposure to interest rate fluctuations can also arise fromlong-term floating-rate debt. Companies can limit this risk by using finan-cial derivatives. One approach is to cap the borrower’s interest rate; that is,set a maximum rate that will prevail, no matter how high the market rateagainst which it is pegged may rise. Alternatively, the borrower can convertthe floating-rate debt to fixed-rate debt through a derivative known as aninterest-rate swap. (The forces of supply and demand may make it moreeconomical for the company to issue floating-rate debt and incur the cost ofthe swap than to take the more direct route to the same net effect, that is, toissue floating-rate debt.) Public financial statements typically provide onlygeneral information about the extent to which the issuer has limited its ex-posure to interest rate fluctuations through derivatives.
Borrowers sometimes argue that the total debt calculation should ex-clude debt that is convertible, at the lender’s option, into common equity.Hardliners on the credit analysis side respond: “It’s equity when the holders

Credit Analysis 273
convert it to equity. Until then, it’s debt.” Realistically, though, if the con-version value of the bond rises sufficiently, most holders will in fact converttheir securities to common stock. This is particularly true if the issuer hasthe option of calling the bonds for early retirement, which results in a lossfor holders who fail to convert. Analysts should remember that the ultimateobjective is not to calculate ratios but to assess credit risk. Therefore, thebest practice is to count convertible debt in total debt, but to consider thepossibility of conversion when comparing the borrower’s leverage with thatof its peer group.
Preferred stock2 is a security that further complicates the leverage cal-culation. From a legal standpoint, preferred stock is clearly equity; in liq-uidation, it ranks junior to debt. Preferred stock pays a dividend ratherthan interest, and failure to pay the dividend does not constitute a default.On the other hand, preferred dividends, unlike common dividends, arecontractually fixed in amount. An issuer can omit its preferred dividend,but not without also omitting its common dividend. Furthermore, a pre-ferred dividend is typically cumulative, meaning that the issuer must repayall preferred dividend arrearages before resuming common stock divi-dends. Furthermore, not all preferred issues have the permanent characterof common stock. A preferred stock may have a sinking fund provision,much like the provision typically found in bonds, that requires redemptionof a substantial portion of the outstanding par amount prior to final ma-turity. Such a provision implies less financial flexibility than is the case fora perpetual preferred stock, which requires no principal repayment at anytime. Another preferred security, exchangeable preferred stock, can betransformed into debt at the issuer’s option. Treating it purely as equity forcredit analysis purposes would understate financial risk. In general, thecredit analyst must recognize the heightened level of risk implied by thepresence of preferred stock in the capital structure. A formal way to takethis risk into account is to calculate the ratio of total fixed obligations tototal capital:3
Off-balance-sheet lease obligations, like preferred stock, enable com-panies to obtain many of the benefits of debt financing without violatingcovenanted limitations on debt incurrence. Accounting standards have par-tially brought these debtlike obligations out of hiding by requiring capital
Total debt Preferred stock Preference stock
Total debt Minority interest Preferred stockPreference stock Common equity
+ ++ +
+ +

274 FORECASTS AND SECURITY ANALYSIS
leases to appear on the balance sheet, either separately or as part of long-term debt. Credit analysts should complete the job. In addition to includingcapital leases in the total debt calculation, they should also take into ac-count the off-balance-sheet liabilities represented by contractual paymentson operating leases, which are reported (as “rental expense”) in the Notesto Financial Statements. The rationale is that although the accounting rulesdistinguish between capital and operating leases, the two financing vehiclesfrequently differ little in economic terms. Indeed, borrowers have used con-siderable ingenuity in structuring capital leases to qualify as operating leasesunder GAAP, the benefit being that they will consequently be excluded fromthe balance sheet and, it is hoped, from credit analysts’ scrutiny. Analystsshould not fall for this ruse, but should instead capitalize the current yearrental payments shown in the Notes to Financial Statements. The most com-mon method is to multiply the payments by seven or eight, a calculation thathas been found to be reasonably accurate when actual figures on capitalizedvalue of leases have been available for comparison.
Other Off-Balance-Sheet L iabi l i t ies
In their quest for methods of obtaining the benefits of debt without suffer-ing the associated penalties imposed by credit analysts, corporations haveby no means limited themselves to the use of leases. Like leases, the otherpopular devices may provide genuine business benefits, as well as the cos-metic benefit of disguising debt. In all cases, the focus of credit-quality de-termination must be economic impact, which may or may not be reflectedin the accounting treatment.
A corporation can employ leverage yet avoid showing debt on its con-solidated balance sheet by entering joint ventures or forming partiallyowned subsidiaries. At a minimum, the analyst should attribute to the cor-poration its proportionate liability for the debt of such ventures, thereby“matching” the cash flow benefits derived from the affiliates. (Note thatcash flow is generally reduced by unremitted earnings—the portion not re-ceived in dividends—of non-fully-consolidated affiliates.) In some cases, theaffiliate’s operations are critical to the parent’s operations, as in the case ofa jointly owned pulp plant that supplies a paper plant wholly owned by theparent. There is a strong incentive, in such instances, for the parent to keepthe jointly owned operation running by picking up the debt service commit-ments of a partner that becomes financially incapacitated, even though itmay have no legal obligation to do so. (In legal parlance, this arrangement isknown as a several obligation, in contrast to a joint obligation in whicheach partner is compelled to back up the other’s commitment.) Depending

Credit Analysis 275
on the particular circumstances, it may be appropriate to attribute to theparent more than its proportionate share—up to 100%—of the debt of thejoint venture or unconsolidated subsidiary.
Surely one of the most ingenious devices for obtaining the benefits ofdebt without incurring balance sheet recognition was described by The In-dependent in 1992. According to the British newspaper, the Faisal IslamicBank of Cairo had provided $250 million of funding to a troubled real es-tate developer, Olympia & York. As an institution committed to Islamic re-ligious principles, however, the bank was not allowed to charge interest.Instead, claimed The Independent, Faisal Islamic Bank in effect had ac-quired a building from Olympia & York, along with an option to sell itback. The option was reportedly exercisable at $250 million plus anamount equivalent to the market rate of interest for the option period. Be-cause the excess was not officially classified as interest, said The Indepen-dent, the $250 million of funding did not show up as a loan on Olympia &York’s balance sheet.
The Independent noted a denial by an Olympia & York spokespersonthat “any such loan existed” (emphasis added). If, however, the account wassubstantially correct, then the religious-prohibition-of-interest gambit suc-ceeded spectacularly in diverting attention from a transaction that had allthe trappings of a loan. Barclays Bank, one of Olympia & York’s most im-portant lenders, commented that it had never heard of the Faisal IslamicBank transaction.4
Of a somewhat different character within the broad category of off-balance-sheet liabilities are employee benefit obligations. Under SFAS 87,balance sheet recognition is now given to pension liabilities related to em-ployees’ service to date. Similarly, SFAS 106 requires recognition of post-retirement health care benefits as an on-balance-sheet liability. Projectedfuture wage increases are still not recognized, however, although they af-fect the calculation of pension expense for income statement purposes.Unlike some other kinds of hidden liabilities, these items arise exclusivelyin furtherance of a business objective (attracting and retaining capableemployees), rather than as a surreptitious means of leveraging sharehold-ers’ equity.
Generally speaking, pension obligations that have been fully funded(provided for with investment assets set aside for the purpose) present fewcredit worries for a going concern. Likewise, a modest underfunding that isin the process of being remediated by an essentially sound company is nomore than a small qualitative factor on the negative side. On the other hand,a large or growing underfunded liability can be a significantly negative con-sideration—albeit one that is hard to quantify explicitly— in assessing a

276 FORECASTS AND SECURITY ANALYSIS
deteriorating credit. In bankruptcy, it becomes essential to monitor detailsof the Pension Benefit Guaranty Corporation’s efforts to assert its claim tothe company’s assets, which, if successful, reduce the settlement amountsavailable to other creditors.
Are Deferred Taxes Part of Capital?
Near the equity account on many companies’ balance sheets appears an ac-count labeled “Deferred Income Taxes.” This item represents the cumula-tive difference between taxes calculated at the statutory rate and taxesactually paid. The difference reflects the tax consequences, for future years,of the differences between the tax bases of assets and liabilities and theircarrying amounts for financial reporting purposes.
Many analysts argue that net worth is understated by the amount of thedeferred tax liability, since it will in all likelihood never come due and istherefore not really a liability at all. (As long as the company continues topay taxes at less than the statutory rate, the deferred tax account will con-tinue to grow.) Proponents of this view adjust for the alleged understate-ment of net worth by adding deferred taxes to the denominator in thetotal-debt-to-total-capital calculation, thus:
In general, this practice is sound. Analysts must, however, keep in mindthat the precise formula for calculating a ratio is less important than the as-surance that it is calculated consistently for all companies being evaluated.The caveat is that many factors can contribute to deferred taxes, and not allof them imply a permanent deferral. A defense contractor, for example, candefer payment of taxes related to a specific contract until the contract iscompleted. The analyst would not want to add to equity the taxes deferredon a contract that is about to be completed, although in such situations spe-cific figures may be hard to obtain.
The Importance of Management’s Att itude toward Debt
As the preceding discussion has established, companies use numerous gam-bits in their quest to enjoy the benefits of aggressive financial leverage with-out suffering the consequences of low credit ratings and high borrowingcosts. Analysts should note that corporations’ bag of tricks is not confined
Total debtTotal debt Deferred taxes Minority interest Total equity+ + +

Credit Analysis 277
to accounting gimmicks. Some management teams also rely on a bait-and-switch technique.
The ploy consists of announcing that management has learned the hardway that conservative financial policies serve shareholders best in the longrun. Never again, vows the chief executive officer, will the company un-dergo the financial strain that it recently endured as a result of excessiveborrowing a few years earlier. To demonstrate that they truly have gotten re-ligion, the managers institute new policies aimed at improving cash flow andpay down a slug of short-term borrowings. On the strength of the favorableimpression that these actions create among credit analysts who rely heavilyon trends in financial ratios, the company floats new long-term bonds at anattractive rate. Once the cash is in the coffers, management loses its motiva-tion to present a conservative face to lenders and reverts to the aggressive fi-nancial policies that so recently got the company into trouble.
Not everybody is taken in by this ruse. Moody’s and Standard & Poor’splace heavy emphasis on management’s attitude toward debt when assign-ing bond ratings (see “Relating Ratios to Credit Risk” later in this chapter).They strive to avoid upgrading companies in response to balance sheet im-provements that are unlikely to last much beyond the completion of the nextpublic offering. In reward for such vigilance, the agencies are routinely ac-cused of being backward-looking. The corporations complain that the bondraters are dwelling unduly on past, weaker financial ratios. In reality, theagencies are thinking ahead. Based on their experience with management,they are inferring that the recent reduction in financial leverage reflects ex-pediency, rather than a long-term shift in debt policy. As evidence that therating agencies have good reason to take corporate managers’ assuranceswith a grain of salt, consider Viacom International’s long-run record onstated objectives and actual financial practices.
Since 1987, Standard & Poor’s has raised and lowered the diversifiedmedia company’s rating several times (see Exhibit 13.2). The graph tracksthe company’s subordinated debt rating because for much of the period, thecompany had no public, rated senior debt outstanding. A leveraged buyoutprecipitated a downgrading from BB- to B- in early 1987. The rating re-bounded to B in 1989 on the strength of strong operating performance and,with the additional help of a stock offering, to B+ in 1991.
Viacom president and chief executive officer Frank J. Biondi enunciateda corporate drive toward further improvements in July 1992, when he com-mented on the company’s plans to redeem an issue of high-cost debentures:
The expense associated with the debt redemption represents a one-timeinvestment which will have a quick payback in subsequent quarters asViacom continues to achieve a lower cost of borrowing.5
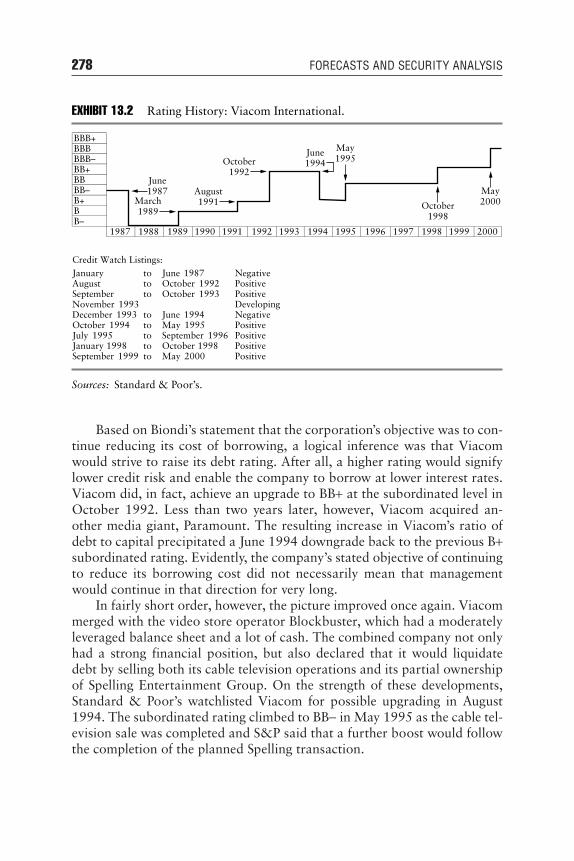
278 FORECASTS AND SECURITY ANALYSIS
Based on Biondi’s statement that the corporation’s objective was to con-tinue reducing its cost of borrowing, a logical inference was that Viacomwould strive to raise its debt rating. After all, a higher rating would signifylower credit risk and enable the company to borrow at lower interest rates.Viacom did, in fact, achieve an upgrade to BB+ at the subordinated level inOctober 1992. Less than two years later, however, Viacom acquired an-other media giant, Paramount. The resulting increase in Viacom’s ratio ofdebt to capital precipitated a June 1994 downgrade back to the previous B+subordinated rating. Evidently, the company’s stated objective of continuingto reduce its borrowing cost did not necessarily mean that managementwould continue in that direction for very long.
In fairly short order, however, the picture improved once again. Viacommerged with the video store operator Blockbuster, which had a moderatelyleveraged balance sheet and a lot of cash. The combined company not onlyhad a strong financial position, but also declared that it would liquidatedebt by selling both its cable television operations and its partial ownershipof Spelling Entertainment Group. On the strength of these developments,Standard & Poor’s watchlisted Viacom for possible upgrading in August1994. The subordinated rating climbed to BB− in May 1995 as the cable tel-evision sale was completed and S&P said that a further boost would followthe completion of the planned Spelling transaction.
EXHIBIT 13.2 Rating History: Viacom International.
Sources: Standard & Poor’s.
BBB+BBBBBB–
June1994
BB+October
1992
May1995
BBMay2000
BB–June1987
B+August1991 October
1998B
March1989
B–1987 1988 1989 1990 1991 1992 1993 1994 1995 1996 1997 1998 1999 2000
Credit Watch Listings:January to June 1987 NegativeAugust to October 1992 PositiveSeptember to October 1993 PositiveNovember 1993 DevelopingDecember 1993 to June 1994 NegativeOctober 1994 to May 1995 PositiveJuly 1995 to September 1996 PositiveJanuary 1998 to October 1998 PositiveSeptember 1999 to May 2000 Positive

Credit Analysis 279
Once again, though, Viacom’s upward progress was interrupted. Presi-dent Biondi, who had a reputation as a good financial manager, abruptlyresigned in January 1996. The trade press claimed that he was forced out.Chairman Sumner Redstone took over the chief executive officer duties andannounced that the company would adopt a more “entrepreneurial, aggres-sive” management style. To Moody’s, which had watchlisted Viacom forupgrading in July 1995, this suggested a possible sidetracking of the com-pany’s debt-reduction plans.
Redstone sought to allay such concerns, which were likely to cool in-vestors’ enthusiasm for Viacom’s bonds. “Viacom has been and will remainabsolutely committed to strengthening its capital structure,” he said, addingthat further upgrading would remain a major corporate priority. He re-peated that pledge on February 21, 1996, as speculation began to mountthat the company would repurchase shares, an action at variance with thegoal of reducing the debt-to-equity ratio.
Investors did not have an inordinately long wait to learn how Viacomwould reconcile management’s stated objective of boosting credit qualitywith the securities analysts’ claims that management was hinting at a stockbuyback. In May 1996, the company abandoned its plan to sell Spelling, thetransaction on which further upgrading by Standard & Poor’s hinged, say-ing that the offers it had received were inadequate. Then, in September1996, Viacom and Redstone’s investment firm announced plans to repur-chase 5.2% of the company’s shares. Even as the price of the company’sbond fell in the secondary market, the company once again insisted that itremained committed to achieving further upgrading. Standard & Poor’snevertheless removed Viacom from its upgrade watchlist.
Credit analysts were rewarded for being skeptical about Viacom’sdogged insistence, from late 1992 through 1996, that reduction of financialleverage was a top priority. Not until October 1998 did the company’s sub-ordinated debt rating recover to the BB+ perch from which it fell in June1994. The rating continued to rise thereafter, suggesting that at some level,management truly did see it as important to move in the direction of lowerdebt to capital. Along the way, however, Viacom was willing to take a fewsteps back, in the form of strategic acquisitions and share-boosting stock re-purchases, before moving forward.
In general, credit analysts should assume that the achievement of higherbond ratings is a secondary goal of corporate management. If a company’sstock has been languishing for a while, management will not ordinarily feelany urgency about eliminating debt from the capital structure, an actionthat reduces return on shareholders’ equity (see Chapter 14). Similarly, thetypical chief executive officer, being only human, finds it difficult to resist a

280 FORECASTS AND SECURITY ANALYSIS
chance to run a substantially bigger company. Therefore, if a mammoth ac-quisition opportunity comes along, the CEO is likely to pursue it, even if itmeans borrowing huge amounts of money and precipitating a rating down-grade, rather than the hoped-for upgrade.
Like other types of financial statement analysis, finding meaning in acompany’s balance sheet requires the analyst to look ahead. When manage-ment’s probable future actions are taken into account, the company’sprospects for repaying its debts on schedule may be better or worse than theratios imply. The credit analyst cannot afford to take management’s repre-sentations at face value, however. When a chief executive officer claims thatobtaining a higher bond rating is the corporation’s overriding objective, it isessential to ask for specifics: What are the elements of the company’s actionplan for achieving that goal? Which of the steps have been achieved so far?
Above all, the credit analyst must listen closely for an escape clause,typically uttered while the company is engaged in a debt offering. It can beheard when a prospective buyer asks whether management will stay oncourse for a rating upgrade come hell or high water. The CEO casuallyreplies, “Of course, if a once-in-a-lifetime major acquisition opportunitywere to come along, and it required us to borrow, we would have to delayour plans for debt reduction temporarily.” The credit analyst can generallyassume that shortly after the bond deal closes, the once-in-a-lifetime oppor-tunity will materialize.
INCOME STATEMENT RATIOS
Although an older approach to credit analysis places primary emphasis onliquidity and asset protection, both of which are measured by balance-sheetratios, the more contemporary view is that profits are ultimately what sus-tain liquidity and asset values. High profits keep plenty of cash flowingthrough the system and confirm the value of productive assets such as plantand equipment. In line with this latter view, the income statement is nolonger of interest mainly to the equity analyst, but is essential to creditanalysis as well.
A key income statement focus for credit analysis is the borrower’s profitmargin (profit as a percentage of sales). The narrower the margin, thegreater is the danger that a modest decline in selling prices or a modest in-crease in costs will produce losses, which will in turn begin to erode suchbalance sheet measures as total-debt-to-total-capital by reducing equity.
Profit can be measured at several levels of the income statement, eitherbefore or after deducting various expenses to get to the bottom line, net in-come. The most commonly used profit margins are the following:

Credit Analysis 281
Applying these definitions to Johnson & Johnson’s income statement (Ex-hibit 13.3), the company’s profit margins in 2000 were:
Johnson & Johnson’s profit margins are atypically high, relative to in-dustrial companies in general, but less exceptional compared with its peersin the pharmaceutical business. Observe also that in the operating margincalculation, the deduction of other income called for by the formula be-comes an addback of a negative figure, since other expenses exceeded otherincome. Finally, note that the formula does not call for adding back the $33million restructuring charge, which does not qualify for aftertax treatmentas an extraordinary item (see Chapter 3). Analysts should nevertheless becognizant of such nonrecurring charges when forming an impression of acompany’s bona fide profitability.
In some instances, an aftertax nonoperating item can produce a dispar-ity between the numerators in the pretax and operating margins, as calcu-lated from the bottom up in accordance with the formula, and the
Gross margin$29,139
Operating margin$4,800
$29,139
Pretax margin$4,800
29,139
Net margin$4,800$29,139
=−
=
=+ + − +
=
=+
=
= =
$ , ,. %
,. %
,. %
. %
29 139 8 86169 6
1 822 146 379 6722 2
1 82222 7
16 5
Gross marginSales Cost of goods sold
Sales
Operating marginOperating income
Sales
Net income Income taxesInterest expense
Interest income Other incomeSales
Pretax marginNet income Income taxes
Sales
Net marginNet income
Sales
=−
=
++ =
−
=+
=

282 FORECASTS AND SECURITY ANALYSIS
corresponding figure derived by working from the top down. For example,the cumulative effect of a change in accounting procedures will appearbelow the line, or after income taxes have already been deducted. The sumof net income and provision for income taxes will then differ from the pre-tax income figure that appears in the income statement. To ensure compa-rability across companies, analysts should take care to follow identicalprocedures in calculating each company’s margins, rather than adoptingshortcuts that may introduce distortion.
The various margin measures reflect different aspects of management’seffectiveness. Gross margin, which is particularly important in analyzingretailers, measures management’s skill in buying and selling at advanta-geous prices. Operating margin shows how well management has run thebusiness—buying and selling wisely, and controlling selling and adminis-trative expenses—before taking into account financial policies (whichlargely determine interest expense) and the tax rate (which is outside man-agement’s control).6 These last two factors are sequentially added to thepicture by calculating pretax margin and net margin, with the latter ratio
EXHIBIT 13.3 Johnson & Johnson
Income Statementat December 31, 2000
($000 omitted)
Sales to customers $29,139Cost of products sold (1998 includes $60 of
inventory write-offs for restructuring) 8,861Gross profit 20,278Selling, marketing, and administrative expenses 10,875Research expense 2,926Purchased in-process research and development 54Interest income (379)Interest expense, net of portion capitalized 146Other expense, net 67Restructuring charge (33)
13,656
Earnings before provision for taxes on income 6,622Provision for taxes on income 1,822
Net earnings $ 4,800
Basic net earnings per share $3.45Diluted net earnings per share $3.40
Source: 10-K405 March 30, 2001.

Credit Analysis 283
reflecting all factors, whether under management’s control or not, that in-fluence profitability.
In calculating profit margins, analysts should eliminate the effect of ex-traordinary gains and losses to determine the level of profitability that islikely to be sustainable in the future.
Fixed-charge coverage is the other income statement ratio of major in-terest to credit analysts. It measures the ability of a company’s earnings tomeet the interest payments on its debt, the lender’s most direct concern. Inits simplest form, the fixed-charge coverage ratio indicates the multiple bywhich operating earnings suffice to pay interest charges:
This basic formula requires several refinements, however. As with profitmargins, extraordinary items should be eliminated from the calculation toarrive at a sustainable level of coverage. The other main adjustments involvecapitalized interest and payments on operating leases.
Capital ized Interest
Under SFAS 34, companies may be required to capitalize, rather than ex-pense, a portion of their interest costs. The underlying notion is that like theactual bricks and mortar purchased to construct a plant, the cost of themoney borrowed to finance the purchase provides benefits in future periodsand therefore should not be entirely written off in the first year. Whether itis expensed or capitalized, however, all interest accrued must be covered byearnings and should therefore appear in the denominator of the fixed-charge coverage calculation. Accordingly, the basic formula can be rewrit-ten to include not only the interest expense shown on the income statement,but also capitalized interest, which may appear either on the income state-ment or else in the Note to Financial Statements. (If the amount is immate-rial, capitalized interest will not be shown at all, and the analyst can skipthis adjustment.) The numerator should not include capitalized interest,however, for the amount is a reduction to total expenses and consequentlyreflected in net income. Including capitalized interest in the numeratorwould therefore constitute double counting:
Fixed-charge coverageadjusted for capitalized interest
Net income Income taxesIncome expense
Interest expense Capitalized interest( ) =+
++
Fixed-charge coverageNet income Income taxes Interest expense
Interest expense=
+ +

284 FORECASTS AND SECURITY ANALYSIS
Lease Expense
As mentioned, off-balance-sheet operating leases have virtually the sameeconomic impact as on-balance-sheet debt. Just as credit analysts shouldtake into account the liabilities represented by these leases, they should alsofactor into coverage calculations the annual fixed charges associated withthem. One approach simply adds the total current-year rental expense fromNotes to Financial Statements to both the numerator and denominator ofthe fixed-charge coverage calculation. An alternate method includes one-third of rentals (as shown in the following calculation) on the theory thatone-third of a lease payment typically represents interest that would be paidif the assets had been purchased with borrowed money, and two-thirds isequivalent to principal repayment:
Two complications arise in connection with incorporating operating leasepayment into the fixed-charge coverage calculation. First, the SEC does notrequire companies to report rental expense in quarterly statements. The an-alyst can therefore only estimate where a company’s fully adjusted coveragestands, on an interim basis, in relation to its most recent full-year level.(Capitalized interest, by the way, presents the same problem, although a fewcompanies voluntarily report capitalized interest on an interim basis.) Sec-ond, retailers in particular often negotiate leases with rents that are semi-fixed, tied in part to revenues of the leased stores. Some argue that thevariable portion—contingent rentals—should be excluded from the fixed-charge coverage calculation. That approach, however, results in a numera-tor that includes income derived from revenues in excess of the thresholdlevel, while omitting from the denominator charges that were automaticallyincurred when the threshold was reached. A better way to recognize thepossible avoidance of contingent lease payments is by capitalizing only themandatory portion when calculating the balance sheet ratio of total-debt-to-total-capital.
Interest Income
A final issue related to fixed-charge coverage involves interest income. Com-panies sometimes argue that the denominator should include only net interest
Fixed-charge coverage(adjusted for capitalized interest
and operating leases)
Net income Income taxesIncome expense Rentals
Interest expense Capitalized interestRentals1
3
=
++ +
++
13

Credit Analysis 285
expense; the difference between interest expense and income derived frominterest-bearing assets, generally consisting of marketable securities. Theyportray the two items as offsetting, with operating earnings having to coveronly the portion of interest expense not “automatically” paid for by interestincome. Such treatment can be deceptive, however, when a company holdsa large but temporary portfolio of marketable securities. In this situation,fixed-charge coverage based on net interest expense in the current year cangreatly overstate the level of protection that may be expected in the suc-ceeding year, after the company has invested its funds in operating assets. If,however, a company’s strategy is to invest a substantial portion of its assetsindefinitely in marketable securities (as some pharmaceutical manufactur-ers do, to capture certain tax benefits), analysts should consider the associ-ated liquidity as a positive factor in their analysis.
STATEMENT OF CASH FLOWS RATIOS
Ratios related to sources and uses of funds measure credit quality at the mostelemental level—a company’s ability to generate sufficient cash to pay itsbills. These ratios also disclose a great deal about financial flexibility; a com-pany that does not have to rely on external financing can take greater operat-ing risks than one that would be forced to retrench if new capital suddenlybecame scarce or prohibitively expensive. In addition, trends in sources-and-uses ratios can anticipate changes in balance-sheet ratios. Given corpora-tions’ general reluctance to sell new equity, which may dilute existingshareholders’ interest, a recurrent cash shortfall is likely to be made up withdebt financing, leading to a rise in the total-debt-to-total-capital ratio.
For capital-intensive manufacturers and utilities, a key ratio is cash flowto capital expenditures:
The higher this ratio, the greater the financial flexibility implied. It is im-portant, though, to examine the reasons underlying a change in the rela-tionship between internal funds and capital outlays. It is normal for acapital-intensive industry to go through a capital-spending cycle, adding ca-pacity by constructing large-scale plants that require several years to com-plete. Once the new capacity is in place, capital expenditures ease for afew years until demand growth catches up and another round of spending
Cash flow from operations
Capital expenditures

286 FORECASTS AND SECURITY ANALYSIS
begins. Over the cycle, the industry’s ratio of cash falls. By definition, thedownleg of this cycle does not imply long-term deterioration in creditquality. In contrast, a company that suffers a prolonged downtrend in itsratio of cash flow to capital expenditures is likely to get more deeply intodebt, and therefore become financially riskier with each succeeding year.Likewise, a rising ratio may require interpretation. A company thatsharply reduces its capital budget will appear to increase its financial flex-ibility, based on the cash-flow-to-capital-expenditures ratio. Cutting backon outlays, however, may impair the company’s long-run competitivenessby sacrificing market share or by causing the company to fall behind intechnological terms.
Although the most recent period’s ratio of cash flow to capital expendi-tures is a useful measure, the credit analyst is always more interested in thefuture than in the past. One good way of assessing a company’s ability tosustain its existing level of cash adequacy is to calculate depreciation as apercentage of cash flow:
Unlike earnings, depreciation is essentially a programmed item, a cash flowassured by the accounting rules. The higher the percentage of cash flow de-rived from depreciation, the higher is the predictability of a company’s cashflow, and the less dependent its financial flexibility on the vagaries of themarketplace.
Finally, among the ratios derived from the statement of cash flows is theratio of capital expenditures to depreciation:
A ratio of less than 1.0 over a period of several years raises a red flag, sinceit suggests that the company is failing to replace its plant and equipment.Underspending on capital replacement amounts to gradual liquidation ofthe firm. By the same token, though, the analyst cannot necessarily assumethat all is well simply because capital expenditures consistently exceed de-preciation. For one thing, persistent inflation means that a nominal dollarspent on plant and equipment today will not buy as much capacity as it did
Capital expenditures
Depreciation
Depreciation
Cash flow from operations

Credit Analysis 287
when the depreciating asset was acquired. (Technological advances in pro-duction processes may mitigate this problem because the cost in real termsof producing one unit may have declined since the company purchased theequipment now being replaced.) A second reason to avoid complacencyover a seemingly strong ratio of capital expenditures to depreciation is thatthe depreciation may be understated with respect either to wear and tear orto obsolescence. If so, the adequacy of capital spending will be overstatedby the ratio of capital spending to depreciation. Finally, capital outlays maybe too low even if they match in every sense the depreciation of existingplant and equipment. In a growth industry, a company that fails to expandits capacity at roughly the same rate as its competitors may lose essentialeconomies of scale and fall victim to a shakeout.
COMBINATION RATIOS
Each of the financial ratios discussed so far in this chapter is derived fromnumbers collected from just one of the three basic financial statements. Infinancial analysis, these rudimentary tools are analogous to the simple ma-chines—the wedge, the lever, the wheel, and the screw—that greatly in-creased the productivity of their prehistoric inventors. How much moreremarkable an advance it was, however, when an anonymous Chinese com-bined two simple machines, a lever and a wheel, to create a wheelbarrow! Insimilar fashion, combining numbers from different financial statements un-leashes vast new analytical power.
Rate-of-Return Measures
One of the most valuable types of combination ratios combines earningswith balance sheet figures. Such ratios measure the profit that an enterpriseis generating relative to the assets employed or the capital invested in it. Thiskind of measure provides a link between credit analysis and the economicconcept of productivity of capital.
To illustrate, consider Companies A, B, and C, all of which are debt-free. If we look only at net margin, a ratio derived solely from the incomestatement, Company A is superior to both its direct competitor, CompanyB, and Company C, which is in a different business. Looking at the com-bination ratio of return on equity, however, we find that Company C rankshighest, notwithstanding that sales margins tend to be narrower in its industry:

288 FORECASTS AND SECURITY ANALYSIS
To an economist, this result suggests that investors earning 8% to 10%in Company A and Company B’s industry will seek to shift their capital toCompany C’s industry, where 12% returns are available. The credit impli-cation of this migration of capital is that Companies A and B will havegreater difficulty raising funds and therefore less financial flexibility. Thecredit impact on Company C, conversely, is favorable.
There are several variants of the rate-of-return combination ratio, eachwith a specific analytical application. Return on equity, which has alreadybeen alluded to, measures a firm’s productivity of equity and therefore pro-vides an indication of its ability to attract a form of capital that provides animportant cushion for the debtholders:
In calculating this ratio, analysts most commonly use as the denominatorequity as of the final day of the year in which the company earned the in-come shown in the numerator. This method may sometimes produce distor-tions. A company might raise a substantial amount of new equity near theend of the year. The denominator in the return-on-equity calculation wouldconsequently be increased, but the numerator would not reflect the benefitof a full year’s earnings on the new equity because it was employed in thebusiness for only a few days. Under these circumstances, return on equitywill compare unfavorably (and unfairly) with that of a company that didnot abruptly expand its equity base.
Return on equityNet income
Common equity Preferred equity=
+
Company A Company B Company C
Sales $1,000,000 $1,000,000 $2,000,000Net income 50,000 40,000 60,000Equity 500,000 500,000 500,000Net margin 5.0% 4.0% 3.0%
Return on equity 10.0% 8.0% 12.0%
Net IncomeEquity
Net IncomeNet Sales

Credit Analysis 289
The potential for distortion in the return-on-equity calculation can bereduced somewhat by substituting for end-of-year equity so-called averageequity:
(Some analysts prefer this method to the year-end-based calculation, evenwhen sudden changes in the equity account are not an issue.)
Another limitation of combination ratios that incorporate balance-sheet figures is that they have little meaning if calculated for portions ofyears. Suppose that in 2001 a company earns $6 million on year-end equityof $80 million, for a return on equity of 7.5%. During the first half of 2002,its net income is $4 million, of which it pays out $2 million in dividends,leaving it $82 million in equity at June 30, 2002. With the company havingearned in half a year two-thirds as much as it did during all of 2001, it is il-logical to conclude that its return on equity has fallen from 7.5% to 4.9%($4 million ÷ $82 million).
To derive a proper return on equity, it is necessary to annualize theearnings figure. Merely doubling the first half results can introduce somedistortion, though, since the company’s earnings may be seasonal. Even ifnot, there is no assurance that the first-half rate of profitability will be sus-tained in the second half. Accordingly, the best way to annualize earnings isto calculate a trailing 12-months’ figure:
If the analyst is working with the company’s 2001 annual report and 2002second-quarter statement, 2001 second-half earnings will not be availablewithout some backing out of numbers. For ease of calculation, the numera-tor in the preceding ratio can be derived as follows:
Net income for full year 2001
Less: Net income for first half of 2001
Plus: Net income for first half of 2002
Net income for second half of 2001Net income for first half of 2002
Equity at June 30, 2002+
Return onaverage equity
Net income
Equity at beginning of year Equity at end of year
2
=+( )

290 FORECASTS AND SECURITY ANALYSIS
For the credit analyst, return on equity alone may be an insufficient, oreven a misleading, measure. The reason is that a company can raise its re-turn on equity by increasing the proportion of debt in its capital structure, achange that reduces credit quality. In Exhibit 13.4, Company Y produces ahigher return on equity than the more conservatively capitalized CompanyX, even though both have equivalent operating margins.
Note that Company Y enjoys its edge despite having to pay a higher in-terest rate on account of its riskier financial structure.
Income statement ratios such as net margin and fixed-charge coverage,which point to higher credit quality at Company X, serve as a check againstreturn on equity, which ranks Company Y higher. A later section of this chap-ter explores systematic approaches to reconciling financial ratios that givecontradictory indications about the relative credit quality of two or more
EXHIBIT 13.4 Effect of Debt on Return on Equity ($000 omitted)
Company X Company Y
12/31/01 12/31/02 12/31/01 12/31/02
Total debt $25.0 25.0% $25.0 23.5% $50.0 50.0% $50.0 47.5%Total equity 75.0 75.0% 81.4 76.5% 50.0 50.0% 55.3 52.5%Total capital $100.0 100.0% $106.4 100.0% $100.0 100.0% $105.3 100.0%
2002 Results Company X Company Y
Sales $125 $125.0Operating expenses 108.5 108.5Operating income 16.5 16.5Interest expense 2.0* 4.5Pretax income 14.5 12.0†
Income taxes 4.9 4.1Net income 9.6 7.9Dividends 3.2 2.6Additions to retained earnings 6.4 5.3
Operating margin 16.5/125.0 = 13.2% 16.5/125.0 = 13.2%
Net margin 9.6/125.0 = 7.7% 7.9/125.0 = 6.3%
Return on equity 9.6/81.4 = 11.8% 7.9/55.3 = 14.3%
Fixed-charge coverage (9.6 + 4.9 + 2.0)/2.0 = 8.25 X (7.9 + 4.1 + 4.5)/4.5 = 3.7 X
*At 8%.† At 9%.

Credit Analysis 291
companies. The more immediately relevant point, however, is that other com-bination ratios can also be used as checks against an artificially heightenedreturn on equity. Using the same figures for Companies X and Y, the analystcan calculate return on total capital, which equalizes for differences in capitalstructure. On this basis, Company Y enjoys only a negligible advantage re-lated to its slower growth in retained earnings (and hence in capital):
Total debt in this calculation includes short-term debt, current maturi-ties of long-term debt, and long-term debt, for reasons described earlierunder “What Constitutes Total Debt?” Similarly, total equity includes bothpreferred and preference stock. If there is a minority interest, the associatedincome statement item should appear in the numerator, and the balancesheet amount in the denominator.
Turnover Measures
In addition to measuring return on investment, a particular type of combi-nation ratio known as a turnover ratio can provide valuable informationabout asset quality. The underlying notion of a turnover ratio is that a com-pany requires a certain level of receivables and inventory to support a givenvolume of sales. For example, if a manufacturer sells its goods on terms thatrequire payment within 30 days, and all customers pay exactly on time, ac-counts receivable on any given day (barring seasonality in sales) will be 30÷ 365 or 8.2% of annual sales. Coming at the question from the oppositedirection, the analyst can calculate the average length of time that a receiv-able remains outstanding before it is paid (the calculation uses the averageamount of receivables outstanding during the year):
Average days of receivables
A/R beginning of year A /R end of year
2 Annual sales
=
+( )
× 365
Return on total capitalNet income Income taxes Interest expense
Total debt Total equity
Company X Company Y
9.6
=+ +
+
+ ++
= =+ +
+= =
4 9 2 025 0 81 4
16 5106 4
15 57 9 4 1 4 5
50 0 55 316 5105 3
15 7. .
. ...
. % . . .
. ...
. %

292 FORECASTS AND SECURITY ANALYSIS
This ratio enables the analyst to learn the company’s true average collectionperiod, which may differ significantly from its stated collection period.
By inverting the first portion of the average days of receivables calcula-tion, one can determine how many times per year the company turns overits receivables:
where ARBY = Accounts receivable at beginning of yearAREY = Accounts receivable at the end of year
As long as a company continues to sell on the same terms, its required re-ceivables level will rise as its sales rise, but the ratio between the two shouldnot change. A decline in the ratio may signal that the company’s customersare paying more slowly because they are encountering financial difficulties.Alternatively, the company may be trying to increase its sales by liberalizingits credit standards, allowing its salespeople to do more business with lessfinancially capable customers. Either way, the ultimate collectibility of theaccounts receivable shown on the balance sheet has become less certain.Unless the company has reflected this fact by increasing its allowance fordoubtful receivables, it may have to write off a portion of receivablesagainst income at some point in the future. The analyst should therefore ad-just the company’s total-debt-to-total-capital ratio for the implicit over-statement of equity.
Another asset quality problem that can be detected with a combinationratio involves unsalable inventory. A fashion retailer’s leftover garmentsfrom the preceding season or an electronics manufacturer’s obsolete fin-ished goods can be worth far less than their balance sheet values (historicalcost). If the company is postponing an inevitable write-off, it may becomeapparent through a rise in inventory without a commensurate rise in sales,resulting in a decline in inventory turnover:
where IBY = Inventory at beginning of yearIEY = Inventory at end of year
Inventory turnoverAnnual sales
IBY IEY
2
=+( )
Receivables turnoverAnnual sales
ARBY AREY=
+( )2

Credit Analysis 293
A drop in sales is another possible explanation of declining inventoryturnover. In this case, the inventory may not have suffered a severe reduc-tion in value, but there are nevertheless unfavorable implications for creditquality. Until the inventory glut can be worked off by cutting back produc-tion to match the lower sales volume, the company may have to borrow tofinance its unusually high working capital, thereby increasing its financialleverage. Profitability may also suffer as the company cuts its selling prices,accepting a lower margin to eliminate excess inventory.
One objection to the preceding inventory-turnover calculation involvesthe variability of selling prices. Suppose that the price of a commoditychemical suddenly shoots up as the result of a temporary shortage. A chem-ical producer’s annual sales—and hence its inventory turnover—may rise,yet the company may not be physically moving its inventory any faster thanbefore. Conversely, a retailer may respond to a drop in consumer demandand cut its prices to avoid a buildup of inventory. The shelves and backroom have no more product than previously, yet the ratio based on annualsales indicates that turnover has declined.
To prevent such distortions, the analyst can use the following variantratio:
This version should more closely capture the reality of a company’s phys-ical turnover. Cost of goods sold and inventory are both based on historicalcost, whereas selling prices fluctuate with market conditions, causing a mis-match between the numerator and denominator of the turnover calculation.
Total-Debt-to-Cash-Flow Ratio
A final combination ratio that is invaluable in credit analysis is the ratio oftotal debt to cash flow:
This ratio expresses a company’s financial flexibility in a most interest-ing way. If, for the sake of illustration, a company has total debt of $60 mil-
Total debt to cash flow
Short-term debt Current maturitiesLong-term debt
Cash flow from operations=
++
Inventory turnoverAnnual cost of goods sold
IBY IEY
2
=+( )

294 FORECASTS AND SECURITY ANALYSIS
lion and cash flow from operations of $20 million, it has the ability to liqui-date all its debt in three years by dedicating 100% of its cash flow to thatpurpose. This company clearly has greater financial flexibility than a com-pany with $80 million of debt and a $10-million annual cash flow, for aneight-year debt-payback period. In the latter case, flexibility would be par-ticularly limited if the company’s debt had an average maturity of signifi-cantly less than eight years, implying the possibility of significantrefinancing pressure under tight credit conditions.
All very interesting, one might say, but in reality how many companiesdedicate 100% of their cash flow to debt retirement? The answer is “veryfew,” but total debt to cash flow is still a good ratio to monitor for creditquality. It enjoys distinct advantages over some of the more frequently in-voked credit-quality measures, which are derived from the balance sheet orincome statement alone. The total-debt-to-total-capital ratio has the inher-ent flaw that equity may be understated or overstated relative to its eco-nomic value. After all, the accounting rules do not permit a writeup ofassets unless they are sold, nor do the rules require a writedown until some-one makes the often subjective determination that the assets have fallen invalue. In comparison, total debt is an objective number, a dollar amountthat must contractually be repaid. Fixed-charge coverage, too, has a weak-ness, for it is based on earnings, which are subject to considerable manipu-lation. Cash flow eliminates one major opportunity for manipulation:underdepreciation. If a company inflates its reported earnings by writingdown its fixed assets more slowly than economic reality dictates, it is merelytaking money out of one cash flow pocket and putting it into the other.Cash flow, then, puts companies on equal footing, whatever their deprecia-tion policies.
Built from two comparatively hard numbers, the ratio of total debt tocash flow provides one of the best single measures of credit quality. Analystsshould not worry about whether its literal interpretation—the period re-quired for a total liquidation of debt—is realistic, but instead focus on itsanalytical value.
RELATING RATIOS TO CREDIT RISK
The discussion of financial ratios up to this point has sidestepped an obvi-ous and critical question: How does an analyst who has calculated a ratioknow whether it represents good, bad, or indifferent credit quality? Some-how, the analyst must relate the ratio to the likelihood that the borrowerwill satisfy all scheduled interest and principal payments in full and on

Credit Analysis 295
time. In practice, this is accomplished by testing financial ratios as predic-tors of the borrower’s propensity not to pay (to default). For example, acompany with high financial leverage is statistically more likely to defaultthan one with low leverage, all other things being equal. Similarly, highfixed-charge coverage implies less default risk than low coverage. Afteridentifying the factors that create high default risk, the analyst can use ra-tios to rank all borrowers on a relative scale of propensity to default.
Many credit analysts conduct their ratio analyses within ranking frame-works established by their employers. Individuals engaged in processingloan applications may use criteria derived from the lending institution’s ex-perience over many years in recognizing the financial characteristics thatlead to timely payment or to default. In the securities field, bond ratingsprovide a structure for analysis. Exhibits 13.5 and 13.6 show the rating def-initions of two leading bond rating agencies, Moody’s Investors Service andStandard & Poor’s. (The following discussion uses the rating notations andtheir corresponding “spoken equivalents” interchangeably—AAA andTriple-A, AA and Double-A, etc.)
Because much credit work is done in the context of established stan-dards, the next order of business is to explain how companies can be rankedby ratios on a relative scale of credit quality. Bond ratings are the standardon which the discussion focuses, but the principles are applicable to in-house credit-ranking schemes that analysts may encounter. Following ademonstration of the use of credit rating standards, the chapter concludeswith an examination of the methods underlying the construction of stan-dards to show readers how financial ratios are linked to default risk.
The analysis in this section focuses primarily on determining the prob-ability that a borrower will pay interest and principal in full and on time. Itdoes not address the percentage of principal that the lender is likely to re-cover in the event of default. Certainly, expected recoveries have an impor-tant bearing on the decision to extend or deny credit, as well as on thevaluation of debt securities. Bankruptcy analysis, however, is a huge topic inits own right. Its proper practice depends on a detailed knowledge of the rel-evant legislation and a thorough understanding of the dynamics of the nego-tiations between creditors and the management of a company in Chapter 11reorganization proceedings. Such matters are beyond the scope of the pres-ent work. For the securities of highly rated companies, moreover, the poten-tial percentage recovery of principal tends to be a comparatively minorvaluation factor. Over the short to intermediate term, the probability of abankruptcy filing by such a company is small.
Although the reader will not find a complete guide to bankruptcy analy-sis in these pages, Chapter 14 is relevant from the standpoint of determining

296 FORECASTS AND SECURITY ANALYSIS
EXHIBIT 13.5 Moody’s Bond Ratings (Definitions) Debt Ratings
AaaBonds and preferred stock which are rated Aaa are judged to be of the best quality.They carry the smallest degree of investment risk and are generally referred to as“gilt edged.” Interest payments are protected by a large or by an exceptionallystable margin and principal is secure. While the various protective elements arelikely to change, such changes as can be visualized are most unlikely to impair thefundamentally strong position of such issues.
AaBonds and preferred stock which are rated Aa are judged to be of high quality by allstandards. Together with the Aaa group they comprise what are generally known ashigh-grade bonds. They are rated lower than the best bonds because margins ofprotection may not be as large as in Aaa securities or fluctuation of protectiveelements may be of greater amplitude or there may be other elements present whichmake the long-term risk appear somewhat larger than the Aaa securities.
ABonds and preferred stock which are rated A possess many favorable investmentattributes and are to be considered as upper-medium-grade obligations. Factorsgiving security to principal and interest are considered adequate, but elements maybe present which suggest a susceptibility to impairment some time in the future.
BaaBonds and preferred stock which are rated Baa are considered as medium-gradeobligations (i.e., they are neither highly protected nor poorly secured). Interestpayments and principal security appear adequate for the present but certainprotective elements may be lacking or may be characteristically unreliable over anygreat length of time. Such bonds lack outstanding investment characteristics and infact have speculative characteristics as well.
BaBonds and preferred stock which are rated Ba are judged to have speculativeelements; their future cannot be considered as well-assured. Often the protection ofinterest and principal payments may be very moderate, and thereby not wellsafeguarded during both good and bad times over the future. Uncertainty of positioncharacterizes bonds in this class.
BBonds and preferred stock which are rated B generally lack characteristics of thedesirable investment. Assurance of interest and principal payments or of maintenanceof other terms of the contract over any long period of time may be small.
CaaBonds and preferred stock which are rated Caa are of poor standing. Such issuesmay be in default or there may be present elements of danger with respect toprincipal or interest.

Credit Analysis 297
EXHIBIT 13.5 Continued
CaBonds and preferred stock which are rated Ca represent obligations which arespeculative in a high degree. Such issues are often in default or have other markedshortcomings.
CBonds and preferred stock which are rated C are the lowest rated class of bonds,and issues so rated can be regarded as having extremely poor prospects of everattaining any real investment standing.
Moody’s assigns ratings to individual debt securities issued from medium-term note(MTN) programs, in addition to indicating ratings to MTN programs themselves.Notes issued under MTN programs with such indicated ratings are rated atissuance at the rating applicable to all pari passu notes issued under the sameprogram, at the program’s relevant indicated rating, provided such notes do notexhibit any of the characteristics listed below. For notes with any of the followingcharacteristics, the rating of the individual note may differ from the indicatedrating of the program:
1) Notes containing features which link the cash flow and/or market value tothe credit performance of any third party or parties.
2) Notes allowing for negative coupons, or negative principal.3) Notes containing any provision which could obligate the investor to make
any additional payments.
Market participants must determine whether any particular note is rated, and if so,at what rating level. Moody’s encourages market participants to contact Moody’sRatings Desks directly if they have questions regarding ratings for specific notesissued under a medium-term note program.
Note: Moody’s applies numerical modifiers 1, 2, and 3 in each generic ratingclassification from Aa through Caa. The modifier 1 indicates that the obligationranks in the higher end of its generic rating category; the modifier 2 indicates amid-range ranking; and the modifier 3 indicates a ranking in the lower end of thatgeneric rating category.
Source: Reprinted with permission from Moody’s Investors Service.

298 FORECASTS AND SECURITY ANALYSIS
EXHIBIT 13.6 Standard & Poor’s Bond Ratings (definitions)
Issue Credit Rating DefinitionsA Standard & Poor’s issue credit rating is a current opinion of the creditworthinessof an obligor with respect to a specific financial obligation, a specific class offinancial obligations, or a specific financial program (including ratings on mediumterm note programs and commercial paper programs). It takes into considerationthe creditworthiness of guarantors, insurers, or other forms of credit enhancementon the obligation and takes into account the currency in which the obligation isdenominated. The issue credit rating is not a recommendation to purchase, sell, orhold a financial obligation, inasmuch as it does not comment as to market price orsuitability for a particular investor. Issue credit ratings are based on currentinformation furnished by the obligors or obtained by Standard & Poor’s from othersources it considers reliable. Standard & Poor’s does not perform an audit inconnection with any credit rating and may, on occasion, rely on unaudited financialinformation. Credit ratings may be changed, suspended, or withdrawn as a resultof changes in, or unavailability of, such information, or based on othercircumstances. Issue credit ratings can be either long-term or short-term. Short-termratings are generally assigned to those obligations considered short-term in therelevant market. In the U.S., for example, that means obligations with an originalmaturity of no more than 365 days—including commercial paper. Short-term ratingsare also used to indicate the creditworthiness of an obligor with respect to putfeatures on long-term obligations. The result is a dual rating, in which the short-termrating addresses the put feature, in addition to the usual long-term rating. Medium-term notes are assigned long-term ratings.
Long-term issue credit ratingsIssue credit ratings are based, in varying degrees, on the following considerations:
• Likelihood of payment-capacity and willingness of the obligor to meet itsfinancial commitment on an obligation in accordance with the terms of theobligation;
• Nature of and provisions of the obligation;• Protection afforded by, and relative position of, the obligation in the event
of bankruptcy, reorganization, or other arrangement under the laws ofbankruptcy and other laws affecting creditors’ rights.
The issue rating definitions are expressed in terms of default risk. As such,they pertain to senior obligations of an entity. Junior obligations are typically ratedlower than senior obligations, to reflect the lower priority in bankruptcy, as notedabove. (Such differentiation applies when an entity has both senior andsubordinated obligations, secured and unsecured obligations, or operatingcompany and holding company obligations.) Accordingly, in the case of juniordebt, the rating may not conform exactly with the category definition.
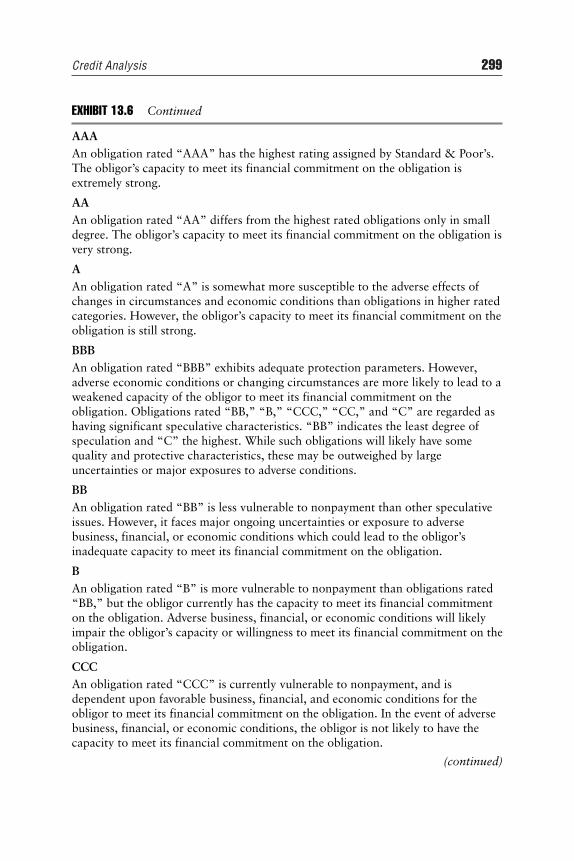
Credit Analysis 299
EXHIBIT 13.6 Continued
AAAAn obligation rated “AAA” has the highest rating assigned by Standard & Poor’s.The obligor’s capacity to meet its financial commitment on the obligation isextremely strong.
AAAn obligation rated “AA” differs from the highest rated obligations only in smalldegree. The obligor’s capacity to meet its financial commitment on the obligation isvery strong.
AAn obligation rated “A” is somewhat more susceptible to the adverse effects ofchanges in circumstances and economic conditions than obligations in higher ratedcategories. However, the obligor’s capacity to meet its financial commitment on theobligation is still strong.
BBBAn obligation rated “BBB” exhibits adequate protection parameters. However,adverse economic conditions or changing circumstances are more likely to lead to aweakened capacity of the obligor to meet its financial commitment on theobligation. Obligations rated “BB,” “B,” “CCC,” “CC,” and “C” are regarded ashaving significant speculative characteristics. “BB” indicates the least degree ofspeculation and “C” the highest. While such obligations will likely have somequality and protective characteristics, these may be outweighed by largeuncertainties or major exposures to adverse conditions.
BB An obligation rated “BB” is less vulnerable to nonpayment than other speculativeissues. However, it faces major ongoing uncertainties or exposure to adversebusiness, financial, or economic conditions which could lead to the obligor’sinadequate capacity to meet its financial commitment on the obligation.
BAn obligation rated “B” is more vulnerable to nonpayment than obligations rated“BB,” but the obligor currently has the capacity to meet its financial commitmenton the obligation. Adverse business, financial, or economic conditions will likelyimpair the obligor’s capacity or willingness to meet its financial commitment on theobligation.
CCCAn obligation rated “CCC” is currently vulnerable to nonpayment, and isdependent upon favorable business, financial, and economic conditions for theobligor to meet its financial commitment on the obligation. In the event of adversebusiness, financial, or economic conditions, the obligor is not likely to have thecapacity to meet its financial commitment on the obligation.
(continued)

300 FORECASTS AND SECURITY ANALYSIS
EXHIBIT 13.6 Continued
CCAn obligation rated “CC” is currently highly vulnerable to nonpayment.
CA subordinated debt or preferred stock obligation rated “C” is CURRENTLYHIGHLY VULNERABLE to nonpayment. The “C” rating may be used to cover asituation where a bankruptcy petition has been filed or similar action taken, butpayments on this obligation are being continued. A “C” also will be assigned to apreferred stock issue in arrears on dividends or sinking fund payments, but that iscurrently paying.
DAn obligation rated “D” is in payment default. The “D” rating category is usedwhen payments on an obligation are not made on the date due even if theapplicable grace period has not expired, unless Standard & Poor’s believes thatsuch payments will be made during such grace period. The “D” rating also will beused upon the filing of a bankruptcy petition or the taking of a similar action ifpayments on an obligation are jeopardized.
Plus (+) or minus (−)The ratings from “AA” to “CCC” may be modified by the addition of a plus orminus sign to show relative standing within the major rating categories.
rThis symbol is attached to the ratings of instruments with significant noncreditrisks. It highlights risks to principal or volatility of expected returns which are notaddressed in the credit rating.
N.R.This indicates that no rating has been requested, that there is insufficientinformation on which to base a rating, or that Standard & Poor’s does not rate aparticular obligation as a matter of policy.
Short-term issue credit ratingsA-1A short-term obligation rated “A-1” is rated in the highest category by Standard &Poor’s. The obligor’s capacity to meet its financial commitment on the obligation isstrong. Within this category, certain obligations are designated with a plus sign (+).This indicates that the obligor’s capacity to meet its financial commitment on theseobligations is extremely strong.
A-2A short-term obligation rated “A-2” is somewhat more susceptible to the adverseeffects of changes in circumstances and economic conditions than obligations inhigher rating categories. However, the obligor’s capacity to meet its financialcommitment on the obligation is satisfactory.

Credit Analysis 301
EXHIBIT 13.6 Continued
A-3A short-term obligation rated “A-3” exhibits adequate protection parameters.However, adverse economic conditions or changing circumstances are more likelyto lead to a weakened capacity of the obligor to meet its financial commitment onthe obligation.
BA short-term obligation rated “B” is regarded as having significant speculativecharacteristics. The obligor currently has the capacity to meet its financialcommitment on the obligation; however, it faces major ongoing uncertaintieswhich could lead to the obligor’s inadequate capacity to meet its financialcommitment on the obligation.
CA short-term obligation rated “C” is currently vulnerable to nonpayment and isdependent upon favorable business, financial, and economic conditions for theobligor to meet its financial commitment on the obligation.
DA short-term obligation rated “D” is in payment default. The “D” rating categoryis used when payments on an obligation are not made on the date due even if theapplicable grace period has not expired, unless Standard & Poor’s believes thatsuch payments will be made during such grace period. The “D” rating also will beused upon the filing of a bankruptcy petition or the taking of a similar action ifpayments on an obligation are jeopardized.
Local currency and foreign currency risksCountry risk considerations are a standard part of Standard & Poor’s analysis forcredit ratings on any issuer or issue. Currency of repayment is a key factor in thisanalysis. An obligor’s capacity to repay foreign currency obligations may be lowerthan its capacity to repay obligations in its local currency due to the sovereigngovernment’s own relatively lower capacity to repay external versus domestic debt.These sovereign risk considerations are incorporated in the debt ratings assigned tospecific issues. Foreign currency issuer ratings are also distinguished from localcurrency issuer ratings to identify those instances where sovereign risks make themdifferent for the same issuer.
Source: Used with permission from sandp.com, a website from Standard & Poor’s(www.standardpoor.com/ResourceCenter/RatingsDefinitions.html).

302 FORECASTS AND SECURITY ANALYSIS
the failed firm’s equity value, a key step in the reorganization or liquidationof the company. In addition, the Bibliography includes books that discussbankruptcy in extensive detail.
Comparative Ratio Analysis
The basic technique in assigning a relative credit ranking is to compare acompany’s ratio with those of a peer group. Size and line of business are thekey criteria for identifying a company’s peers.
On the matter of size, a manufacturer with $5 billion in annual saleswill ordinarily be a better credit risk than one with similar financial ratiosbut only $5 million in sales. As a generalization, bigger companies enjoyeconomies of scale and have greater leverage with suppliers by virtue oftheir larger purchasing power. A big company can spread the risks of obso-lescence and competitive challenges over a wide range of products and cus-tomers, whereas a smaller competitor’s sales are likely to be concentratedon a few products and customers. Particularly vulnerable is a company withjust a single manufacturing facility. An unexpected loss of production couldprove fatal to such an enterprise. Lack of depth in management is anotherproblem commonly associated with smaller companies.
Unquestionably, some very large companies have failed in the past.There is ample evidence, as well, of inefficiency in many large, bureaucraticorganizations. The point, however, is not to debate whether big corpora-tions are invincible or nimble, but to determine whether they meet their ob-ligations with greater regularity, on average, than their pint-sized peers.Statistical models of default risk confirm that they do. Therefore, the bondrating agencies are following sound methodology when they create size-based peer groups.
A survey of Standard & Poor’s Compustat database in 2001 identified452 companies with ratings on their senior debt and shareholders’ equity ofless than $200 million. Of that total, only 40 were rated in the investmentgrade category, defined as BBB- or higher and just 11 were rated A- orhigher. The concentration of smaller companies in the speculative grade cat-egory, defined as BB+ or lower, supports a strong presumption on S&P’spart that size is inversely correlated with propensity to default.
Line of business is another basis for defining a peer group. Because dif-ferent industries have different financial characteristics, ratio comparisonsacross industry lines may not be valid. A machinery manufacturer’s salesmay fluctuate substantially over the capital goods cycle. In contrast, a pack-aged food company derives its revenues from essential products that are indemand year in and year out. The food processor therefore has greater

Credit Analysis 303
predictability of earnings and cash flow. It can tolerate a higher level offixed charges, implying a larger proportion of debt in its capital structure,than the machinery manufacturer. The rating agencies may assign Double-Aratings to a food company with a 35% ratio of total debt to total capital,whereas a machinery maker with a similar ratio might be rated no higherthan Single-A.
A ratio comparison between a packaged food producer and a machin-ery manufacturer sheds little light. The latter company can look good incomparison with the former, yet still be too highly leveraged in view of theoperating risks in its industry. Comparability problems become even morepronounced when ratio analysis crosses boundaries of broadly defined sec-tors of the economy (e.g., industrial, financial, utility, and transportation).
Carrying this principle to its logical conclusion, however, requires apeer group consisting of companies with virtually identical product lines.Operating risk varies to some extent even among closely allied businesses.Strictly speaking, a producer of coated white paper is not comparable to aproducer of kraft linerboard, nor a producer of facial tissue to a producer offine writing paper.
Too zealous an effort to create homogeneous peer groups, though, nar-rows the field to such an extent that ratio comparisons begin to suffer fromhaving too few data points. At the extreme, a comparison with only oneother peer company is not terribly informative. The company being evalu-ated may rank above its lone peer, but the analyst does not know whetherthe peer is strong or weak.
Suppose, on the other hand, that with respect to a particular financialratio a company ranks fourth among a peer group of ten companies, witheight in the group tightly distributed around the median and with one outlier each at the high and low ends. It is valid to say that the com-pany has average risk within its peer group, at least in terms of one par-ticular ratio.
There are two techniques for resolving the trade-off between strict com-parability and adequate sample size. By employing both, the analyst canachieve a satisfactory assessment of relative credit risk.
The first technique is to compare the company against a narrowly de-fined industry peer group, as in Exhibit 13.7. The credit analyst can use thistype of analysis to “slot” a company within its industry. The ratios in thesample comparison are averages, computed over three years. Averagingminimizes the impact of unrepresentative results that any company may re-port in a single year. Observe as well that the eight-member peer group in-cludes only oil companies and is further restricted to the integratedcompetitors. (An integrated company produces, transports, refines, and

304 FORECASTS AND SECURITY ANALYSIS
markets petroleum. An independent company, on the other hand, typicallyperforms only one of those functions.)
ExxonMobil ranks well ahead of all its competitors on each of the threefinancial ratios. It deserves to carry the peer group’s highest rating, which isalso the highest on Standard & Poor’s scale, AAA. Similarly, Occidental Pe-troleum ranks eighth on each financial measure and carries the group’s low-est rating, BBB−.
Among the remaining members of the integrated oil peer group, thecorrespondence between ranking and rating is less exact. The companies in
EXHIBIT 13.7 Comparative Ratio Analysis of Integrated Oil and Gas CompaniesAnnual Average 1998–2000
Rank Standard & Poor’s Rating Company Times
Pretax Interest Coverage1 AAA Exxon Mobil 12.02 AA Chevron 9.83 AAA Shell Oil 6.44 A+ Texaco 5.35 A− Conoco 4.96 BBB Phillips Petroleum 4.47 BBB+ Amerada Hess 3.28 BBB− Occidental Petroleum 3.1
Funds Flow as a Percentage of Total Debt1 AAA Exxon Mobil 108.72 AA Chevron 69.83 AAA Shell Oil 64.34 BBB+ Amerada Hess 55.95 A+ Texaco 46.36 A− Conoco 46.07 BBB Phillips Petroleum 36.38 BBB− Occidental Petroleum 23.6
Total Debt as a Percentage of Capital1 AAA Exxon Mobil 21.72 AA Chevron 31.53 AAA Shell Oil 32.24 A+ Texaco 38.15 BBB+ Amerada Hess 48.96 A− Conoco 52.47 BBB Phillips Petroleum 52.78 BBB− Occidental Petroleum 61.3

Credit Analysis 305
slots 4 through 7 trade places from one ratio to the next. Other considera-tions by which the rating agencies establish a pecking order under suchcircumstances include subjective assessments of competitive position,management quality, and the like. Observe also that Chevron outranksShell Oil by every measure shown, yet is rated lower (AA versus AAA). Thisseeming anomaly is explained by Shell Oil’s position as a key subsidiary ofa vast multinational enterprise, Royal Dutch/Shell Group of Companies. Al-though the parent company does not formally guarantee the subsidiary’sdebt, Standard & Poor’s awards Shell Oil the AAA rating of RoyalDutch/Shell on the basis of implicit credit support.
Exhibit 13.7 also brings out an important characteristic of financial ra-tios—their interrelatedness. Except for Amerada Hess, no company ranksfurther than one slot away from where it ranks on the other measures. Thisis not a chance result. It would be difficult for a company to have (as an ex-ample), both a comparatively high ratio of debt to capital and compara-tively high interest coverage. A combination of unusually low-interest-ratedebt and exceptionally high return on capital could produce such a result,but it is hardly a common occurrence.
An important implication of this observation is that beyond a certainpoint, calculating and comparing companies on the basis of additional fi-nancial ratios contributes little incremental insight. Each additional ratiomerely represents a new way of expressing information already contained inthe analysis. Accordingly, analysts rely on a limited number of ratios to ex-tract the bulk of the information obtainable through this mode of analysis.They can put their remaining time and energy to best use by searching forother pertinent facts, both inside and outside the financial statements.
The second technique of comparative ratio analysis is to rank a com-pany within a rating peer group. As noted, it is not appropriate to comparecompanies in disparate sectors of the economy, such as industrials and util-ities. A rating peer group can, however, legitimately include a variety of in-dustries within a broadly defined economic sector. The expanded sampleavailable under this approach enables the analyst to fine-tune the slottingachieved via the industry peer group comparisons.
Instead of displaying ratios for all 151 industrial companies rated Single-A by Standard & Poor’s, Exhibit 13.8 lists the medians for the Sin-gle-A group. As a further aid in slotting companies, the table includes thecutoff points for the upper and lower quartiles in the rankings of Single-Acompanies.
Texaco’s rating at the high end (A+) of the Single-A peer group appearsgenerous, relative to its ranking within the rating peer group. The company’sstatistics approximately match the medians for funds flow as a percentage of

306 FORECASTS AND SECURITY ANALYSIS
total debt and total debt as a percentage of capital. As for pretax interest cov-erage, Texaco’s ratio is closer to the worst quartile than the median.
Does Texaco’s overall showing, as of 2000, imply an overrating of thecompany by Standard & Poor’s? Based solely on the financial ratios, thatwould be a reasonable inference. Far from being in imminent danger of arating reduction, however, Texaco was on S&P’s watchlist for possible up-grading as it reported its year-end results.
Several factors explained this seeming paradox. To begin with, S&P at-tributed great significance to Texaco’s strong competitive position. In addi-tion to its strong brand names, the company boasted an excellent record ofreplacing its oil production with new discoveries at a comparatively low cost.Financial flexibility was another of the company’s strong suits. Texaco couldfund its exploration and production budget from internally generated funds,precluding any need to borrow. The final factor that supported a rating some-what higher than the company’s financial ratios implied was management’scredibility with S&P’s analysts. Having committed themselves to capping thecompany’s total debt at 40% of capital, Texaco’s senior managers kept theirword. In one instance, that required the funding of a major acquisition withequity, a financing strategy ordinarily not calculated to win the applause ofshareholders. As for S&P’s watchlisting of the company for an even higherrating, there was another critical factor not visible in Exhibit 13.7. Chevron,a more highly rated peer, had made an offer to acquire Texaco.
The lesson is that although comparative ratio analysis plays a large rolein the bond rating process, Moody’s and Standard & Poor’s also considerfactors outside the financial statements. Therefore, analysts working out-side the rating agencies must be cautious about concluding that a companyis rated incorrectly. If they make such an inference without exploring thepossibility of extenuating circumstances, they may recommend buying orselling a bond in expectation of an upgrade or downgrade that has littlechance of materializing.
With that proviso, analysts can derive considerable value from compar-ative ratio analysis. It is helpful to determine that a company not rated by
EXHIBIT 13.8 Average Ratios for Standard & Poor’s Single-A Industrials 1998–2000
Pretax Interest Funds Flow as a Total Debt as aCoverage Percentage of Total Debt Percentage of Capital
Best quartile 9.1 63.6 30.6Median 6.8 46.1 40.1Worst quartile 4.9 34.3 50.4
Source: Standard & Poor’s.

Credit Analysis 307
Moody’s or Standard & Poor’s most closely resembles the companies in aparticular rating category. In assigning a nonrated company to a rating cat-egory based on ratio comparisons, analysts should keep in mind the size cri-terion, previously discussed, for creation of peer groups.
Comparative ratio analysis is also useful in assessing the credit impactof a major transaction, such as a debt-financed acquisition or a major stockrepurchase. The analyst can calculate ratios based on pro forma financialstatements (see Chapter 12) and slot the company in a grid of median ratiosby rating category (see Exhibit 13.9). In view of changes in the peer groupratios that arise from fluctuations in business conditions, it is important touse data that is as up-to-date as possible for the exercise.
Analysts should also bear in mind that a company can potentially averta downgrade implied by the pro forma ratios, provided management’s cred-ibility with the rating agencies is high. The key is to present a plausible planfor restoring financial leverage to its pretransaction level within a few years.Note, however, that the company will merely delay the downgrade if it doesnot begin fairly quickly to make palpable progress toward the long-rangetarget. The rating agencies tend to be skeptical about a company’s ability toimplement a three-year plan entirely in the third year.
Ratio Trend Analysis
Comparative ratio analysis is an effective technique for assessing relativecredit risk, yet it leaves the analyst exposed to a major source of error. Sup-pose two companies in the same industry posted an identical fixed-chargecoverage of 3.5 times last year. On a ratio comparison, the two appear to beequally risky. Suppose, however, that one company had coverage of 5.0times five years ago and has steadily declined to 3.5 times. Imagine, as well,
EXHIBIT 13.9 Median Ratios by Bond Rating Category (Industrials, 1997–1999)
AAA AA A BBB BB B CCC
EBIT interest coverage (x) 17.5 10.8 6.8 3.9 2.1 1.0 0.2EBITDA interest coverage (x) 21.8 14.6 9.6 6.1 3.5 2.0 1.4Funds flow/total debt (%) 105.8 55.8 46.1 30.5 18.4 9.4 5.8Free operating cash flow/
total debt (%) 55.4 24.6 15.6 6.6 3.1 (4.5) (14.0)Return on capital (%) 28.2 22.9 19.9 14.0 11.7 7.2 0.5Operating income/sales (%) 29.2 21.3 18.3 15.3 15.6 11.2 13.6Long-term debt/total capital (%) 15.2 26.4 32.5 41.0 59.0 70.7 80.3Total debt/capital (%) 26.9 35.6 40.1 47.4 63.9 74.6 89.4

308 FORECASTS AND SECURITY ANALYSIS
that the other company’s coverage has improved over the same period from2.0 times to 3.5 times. If the two companies’ trends appear likely to con-tinue, based on analysis, then the happenstance that both covered their in-terest by 3.5 times last year should have little bearing on the creditassessment. The company that will have stronger coverage in the future isthe better risk.
A further complication is that improving or deteriorating financial ra-tios can have different implications for different companies. In some cases,a declining trend over several years signals that a company has genuinelyfallen to a new, lower level of credit quality. For other companies, negativeyear-over-year comparisons merely represent the downlegs of their normaloperating cycles.
Certain industries enjoy fairly stable demand, year in and year out.Small-ticket nondurables such as food, beverages, and beauty aids are notitems that consumers cease to buy during recessions. At worst, people tradedown to cheaper products within the same categories. In contrast, con-sumers tend to postpone purchases of big-ticket durable goods when creditis tight or when they have misgivings about economic conditions. Producersof automobiles, houses, and major appliances are among the businesses thatexperience wide swings in demand between peaks and troughs in the econ-omy. Profits typically fluctuate even more dramatically in these industries,due to the high fixed costs entailed in capital-intensive production methods.
In evaluating the long-range creditworthiness of cyclical companies, thebond rating agencies historically focused on cycle-to-cycle, rather thanyear-to-year trends. Their notion was that a cycle-to-cycle pattern of similarhighs and similar lows (Exhibit 13.10) did not imply a true impairment offinancial strength. Deterioration was indicated only when a company dis-played a trend of successively lower highs and lower lows (Exhibit 13.11).
Moody’s and Standard & Poor’s label this traditional approach “ratingthrough the cycle.” Although it still influences the agencies’ analysis, theyhave deemphasized the concept somewhat in recent years. The evolution re-flects, in part, a perception that although business activity still fluctuatesfrom year to year, the United States economy no longer undergoes the clas-sic business cycles of former decades. By implication, an extended upturn ordowntrend in a company’s ratios is more likely than in bygone times to rep-resent a longer-lived shift.
Even in years past, when the agencies adhered more closely to the doc-trine of rating through the cycle, it was often difficult to distinguish a nor-mal, cyclical decline from more permanent deterioration, without thebenefit of hindsight. There was always a danger that a company’s manage-ment was portraying a permanent reduction in profitability as a routine

Credit Analysis 309
cyclical slump. Then, as now, an analyst had to look beyond the financialstatements to make an informed judgment about the likely persistence of animprovement or deterioration in financial measures.
Default Risk Models
As noted, comparative ratio analysis and ratio trend analysis are techniquesfor placing companies on a relative scale of credit quality. Many analystshave no need to look more deeply into the matter, but it is impossible to
EXHIBIT 13.10 Cycle-to-Cycle Stability(Similar highs and lows)
*Examples: Operating margin, fixed charge cover-age, ratio of cash flow to total debt.
Time0
Mea
sure
of
Fina
ncia
l Str
engt
h*
EXHIBIT 13.11 Cycle-to-Cycle Deterioration(Successively lower highs and lower lows)
Time0
Mea
sure
of
Fina
ncia
l Str
engt
h

310 FORECASTS AND SECURITY ANALYSIS
cover the topic of credit analysis satisfactorily without discussing two morefundamental issues. First, there is the question of how to set up a rankingscheme such as bond ratings in the first place. Second, there is the problemof conflicting indicators. How, for example, should an analyst evaluate acompany that ranks well on fixed-charge coverage but poorly on financialleverage? A rigorous approach demands something more scientific than anindividual analyst’s subjective opinion that coverage should be weightedtwice as heavily as leverage, or vice versa.
The solution to both of these problems lies in establishing a statisticalrelationship between financial ratios and default. This requires, first of all,collecting data on the default experience in a given population. Next, statis-tical methods are employed to determine which financial ratios have histor-ically predicted defaults most reliably. Using a model derived from the bestpredictors, the analyst can then rank companies on the basis of how closelytheir financial profiles resemble the profiles of companies that defaulted.
One example of the various models that have been devised to predictdefaults is Edward I. Altman’s Z-Score model, which takes the followingform:
Z = 1.2x1 + 1.4x2 + 3.3x3 + 0.6x4 + 1.0x5
where: x1 = Working capital/Total assets (%, e.g., .20, or 20%)x2 = Retained earnings/Total assets (%)x3 = Earnings before interest and taxes/Total assets (%)x4 = Market value of equity/Total liabilities (%)x5 = Sales/Total assets (number of times, e.g., 2.0 times)
In this model, scores below 1.81 signify serious credit problems, whereas ascore above 3.0 indicates a healthy firm.
A refinement of the Z-Score model, the Zeta model developed by Alt-man and his colleagues,7 achieved greater predictive accuracy by using thefollowing variables:
x1 = Earnings before interest and taxes (EBIT)/Total assetsx2 = Standard error of estimate of EBIT/Total assets (normalized) for
10 yearsx3 = EBIT/interest chargesx4 = Retained earnings/Total assetsx5 = Current assets/Current liabilitiesx6 = Five-year average market value of equity/Total capitalizationx7 = Total tangible assets, normalized
Credit Analysis 311
Quantitative models such as Zeta, as well as others that have been de-vised using various mathematical techniques, have several distinct benefits.First, they are developed by objectively correlating financial variables withdefaults. They consequently avoid guesswork in assigning relative weightsto the variables. Second, the record of quantitative models is excellent fromthe standpoint of classifying as troubled credits most companies that subse-quently defaulted. In addition, the scores assigned to nondefaulted com-panies by these models correlate fairly well with bond ratings. This suggeststhat although Moody’s and Standard & Poor’s originally developed theirrating methods along more subjective lines, their conclusions are at leastpartially vindicated by statistical measures of default risk. Therefore, thecredit analyst can feel comfortable about using methods such as ratio trendanalysis to slot companies within the ratings framework. Although one canquarrel with the rating agencies’ assessments of particular companies orparticular industries, there is strong statistical support for the notion that inthe aggregate, ratings provide a valid, if rough, assessment of default risk.The lower a company’s present rating, the higher is its probability of de-faulting over the next year, next 2 years, and so on up to 20 years.8
Useful as they are, though, quantitative default models cannot entirelyreplace human judgment in credit analysis.
For one thing, quantitative models tend to classify as troubled creditsnot only most of the companies that eventually default, but also many thatdo not default.9 Often, firms that fall into financial peril bring in new man-agement and are revitalized without ever failing in their debt service. Iffaced with a huge capital loss on the bonds of a financially distressed com-pany, an institutional investor might wish to assess the probability of a turn-around—an inherently difficult-to-quantify prospect—instead of sellingpurely on the basis of a default model.
The credit analyst must also bear in mind that companies can defaultfor reasons that a model based solely on reported financial data cannotpick up. For example, U.S. Brass entered Chapter 11 proceedings in 1994in an effort to resolve litigation involving defective plastic-plumbing sys-tems that it had manufactured. Dow Corning’s 1995 bankruptcy filing of-fered a possible means of resolving massive litigation arising from siliconegel breast implants sold by the company, which were alleged to cause auto-immune disease and other maladies. In 1999, Gulf States Steel, Inc. of Al-abama filed for bankruptcy to address, among other matters, pendinglitigation with the Environmental Protection Agency and other potentialenvironmentally related claims.10 Typically, in such cases, neither the com-pany’s balance sheet nor its income statement signals an impending col-lapse. U.S. Brass’s parent company, Eljer Industries, specifically indicated

312 FORECASTS AND SECURITY ANALYSIS
that the bankruptcy filing did not result from a cash flow shortfall. Theproblems were apparent in the company’s Notes to Financial Statements,but default models based entirely on financial statement data do not dealwith contingent liabilities.
In the case of the Zeta model, the default hazard posed by a company’senvironmental or product liability litigation may be picked up, at least inpart, by the ratio of market value of equity to total capitalization. Stockmarket investors consider such risks in determining share prices.
Some default risk models dispense with statement data altogether infavor of complete reliance on the equity market’s wisdom. The best-knownare marketed by KMV and Helix Investment Partners, L.P. Underlying thesemodels is the observation that a company’s debt and equity both derive theirvalue from the same assets. Equity holders have only a residual claim afterbondholders have been paid. Therefore, if the market value of a company’sassets falls below the value of its liabilities, the stock becomes worthless. Atthe same time, the company becomes bankrupt; its liabilities exceed its as-sets. Extending the logic, a declining stock price indicates that the companyis getting closer to bankruptcy. In theory, then, credit analysts can skip thefinancial statement work and monitor companies’ default risk simply bywatching their stock prices.
Like the quantitative models consisting of financial ratios, the defaultrisk models based on stock prices provide useful, but not infallible, signals.For example, when a company dramatically increases its total-debt-to-total-capital ratio by borrowing money to repurchase stock, its default riskclearly rises. At the same time, its stock price may also rise, reflecting thepositive impact on earnings per share of increased financial leverage and areduction in the number of shares outstanding. According to the theory un-derlying the stock-based default risk models, however, a rising share priceindicates declining default risk. This is one of several caveats typically ac-companying credit opinions derived from stock-based models.
Even if share prices were perfect indicators of credit risk, credit ana-lysts would not escape the rigors of tearing apart financial statements. Tobegin with, not every company’s shares trade in the public market. Theproducers of stock-based models attempt to get around this problem byusing share prices of industry peers to create surrogates for private com-panies’ unobservable equity values. This method, however, cannot capturethe sort of company-specific risks that led to the bankruptcies of U.S.Brass, Dow Corning, and Gulf States Steel Inc. of Alabama. Neither canstock-based default risk models relieve the analyst of such tasks as creatingpro forma financial statements to gauge the impact of a potential merger ormajor asset sale. At most, incorporating stock prices into credit analysis is

Credit Analysis 313
a useful complement to plumbing the financial statements for meaningwith time-tested ratio calculations.
CONCLUSION
Default risk models can provide a solid foundation for credit analysis butmust be complemented by the analyst’s judgment on matters too complexto be modeled. Much the same applies to all of the quantitative techniquesdiscussed in this chapter. A lender should not provide credit before first“running the numbers.” By the same token, it is a mistake to rely solely onthe numbers in order to sidestep a difficult decision. This can take the formeither of rejecting a reasonable risk by inflexibly applying quantitative crite-ria, or of approving a credit against one’s better judgment while counting onfinancial ratios that are technically satisfactory as a defense against criti-cism if the loan goes bad.
As other chapters in this book demonstrate, financial statements arevulnerable to manipulation, much of which is perfectly legal. Often, thespecific aim of the manipulators is to outfox credit analysts who mechani-cally calculate ratios without pausing to consider whether accounting ruseshave defeated the purpose. Another danger in relying too heavily on quanti-tative analysis is that a company may unexpectedly and radically alter itscapital structure to finance an acquisition or to defend itself against a hos-tile takeover. Such action can render ratio analysis on even the most recentfinancial statements largely irrelevant. In the end, credit analysts must equipthemselves with all the tools described in this chapter, yet not be made com-placent by them.


315
CHAPTER 14Equity Analysis
Countless books have been written on the subject of “picking stocks.”The approaches represented in their pages cover a vast range. Some focus
on technical analysis, which seeks to establish the value of a common equityby studying its past price behavior. Others take as their starting point theEfficient Market Hypothesis, which in its purest form implies that no sortanalysis can identify values not already recognized and properly discountedby the market.
This chapter does not attempt to summarize or criticize all the methodsemployed by the legions who “play the market.” Rather, the discussion fo-cuses primarily on the use of financial statements in fundamental analysis.This term refers to the attempt to determine whether a company’s stock isfairly valued, based on its financial characteristics.
Certain elements of fundamental analysis do not use information foundin the financial statements. For example, a company may seem like a goodcandidate for a “bust-up,” or hostile takeover, premised on selling portionsof the company to realize value not reflected in its stock price. As discussedlater in this chapter, the analyst can estimate the firm’s ostensible breakupvalue by studying its annual report. The feasibility of a hostile raid, how-ever, may hinge on the pattern of share ownership, the availability of fi-nancing for a takeover, or laws applicable to tender offers. All these factorslie outside the realm of financial statement analysis, but may have a majorbearing on the valuation process.
A final point regarding the following material is that it should be readin conjunction with Chapter 12 (“Forecasting Financial Statements”). Acompany’s equity value lies wholly in its future performance, with historicalfinancial statements aiding the analysis only to the extent that they providea basis for projecting future results. Into the formulas detailed in this chap-ter, the analyst must plug earnings and cash flow forecasts derived by thetechniques described in Chapter 12.

316 FORECASTS AND SECURITY ANALYSIS
THE DIVIDEND DISCOUNT MODEL
Several methods of fundamental common stock analysis have been devisedover the years, but few match the intuitive appeal of regarding the stockprice as the discounted value of expected future dividends. This approach isanalogous to the yield-to-maturity calculation for a bond and therefore fa-cilitates the comparison of different securities of a single issuer. Addition-ally, the method permits the analyst to address the uncertainty inherent inforecasting a noncontractual flow1 by varying the applicable discount rate.
To understand the relationship between future dividends and presentstock price, consider the following fictitious example: Tarheel Tobacco’s an-nual common dividend rate is currently $2.10 a share. Because the com-pany’s share of a nonexpanding market is neither increasing nor decreasing,it will probably generate flat sales and earnings for the indefinite future andcontinue the dividend at its current level. Tarheel’s long-term debt currentlyoffers a yield of 10%, reflecting the company’s credit rating and the prevail-ing level of interest rates. Based on the greater uncertainty of the dividendstream relative to the contractual payments on Tarheel’s debt, investors de-mand a risk premium of four percentage points—a return of 10% + 4% =14%—to own the company’s common stock rather than its bonds.
The stock price that should logically be observed in the market, giventhese facts, is the price at which Tarheel’s annual $2.10 payout equates to a14% yield, or algebraically:
where P = Current stock priceD = Current dividend rateK = Required rate of return
If the analyst agrees that 14% is an appropriate discount rate, based ona financial comparison between Tarheel and other companies with similarimplicit discount rates, then any price less than $15 a share indicates thatthe stock is undervalued. Alternatively, suppose the analyst concludes that
PD
K
P
P
=
=
=
$ ..
$ .
2 1014
15 00

Equity Analysis 317
Tarheel’s future dividend stream is less secure than the dividend streams ofother companies to which a 14% discount rate is being applied. The analystmight then discount Tarheel’s stream at a higher rate, say 15%, and recal-culate the appropriate share price as follows:
A market price of $15 a share would then indicate an overvaluation ofTarheel Tobacco.
Dividends and Future Appreciat ion
When initially introduced to the dividend-discount model, many individu-als respond by saying, “Dividends are not the only potential source of gainto the stockholder. The share price may rise as well. Shouldn’t any evalua-tion reflect the potential for appreciation?” It is in responding to this objec-tion that the dividend-discount model displays its elegance most fully. Theanswer is that there is no reason for the stock price to rise in the future un-less the dividend rises. In a no-growth situation such as Tarheel Tobacco,the valuation will look the same five years hence (assuming no change in in-terest rates and risk premiums) as today. There is consequently no funda-mental reason for a buyer to pay more for the stock at that point. If, on theother hand, the dividend payout rises over time (the case that immediatelyfollows), the stock will be worth more in the future than it is today. The an-alyst can, however, incorporate the expected dividend increases directlyinto the present-value calculation to derive the current stock price, withoutbothering to determine and discount back the associated future price ap-preciation. By thinking through the logic of the discounting method, the an-alyst will find that value always comes back to dividends.
Valuing a Growing Company
No-growth companies are simple to analyze, but in practice most publiccorporations strive for growth in earnings per share, which, as the ensuingdiscussion demonstrates, will lead to gains for shareholders. In analyzinggrowing companies, a somewhat more complex formula must be used toequate future dividends to the present stock price:
P
P
=
=
$ ..
$ .
2 1015
14 00

318 FORECASTS AND SECURITY ANALYSIS
where P = Current stock priceD = Current dividend rateK = Required rate of returng = Growth rate
A number of dollars equivalent to P, if invested at an interest rate equiv-alent to K, will be equal, after n periods, to the cumulative value of dividendspaid over the same interval, assuming the payout is initially an amountequivalent to D and increases in each period at a rate equivalent to g.
Fortunately, from the standpoint of ease of calculation, if n, the numberof periods considered, is infinite, the preceding formula reduces to the sim-pler form:
In practice, this is the form ordinarily used in analysis, since companies arepresumed to continue to operate as going concerns, rather than to liquidateat some arbitrary future date.
Figures projected from the financial statements of the fictitious WolfeFood Company (Exhibit 14.1) illustrate the application of the dividend-discount model. Observe that the company is expected to pay out 33 1/3%of its earnings to shareholders in the current year:
If Wolfe maintains a constant dividend-payout ratio, it follows that thegrowth rate of dividends will equal the growth rate of earnings, which is
Dividend payout ratioDividends to common shareholders
Net income available to common shareholders− =
=
=
$ , ,$ , ,
%
15 000 00045 000 000
33 13
PD
K g=
−
PD g
K
D g
K
D g
K
n
n=
+( )+( )
++( )
+( )+
+( )+( )
1
1
1
1
1
1
1
1
2
2L

Equity Analysis 319
expected to be 10% annually. On a per share basis, the initial dividendcomes to $1.50:
With these numbers, the analyst can now use the valuation formula to de-rive a share price of $50 for Wolfe:
The execution of this model rests heavily on the assumptions underlying thecompany’s projected financial statements. To estimate the future growthrate of earnings, the analyst must make informed judgments both about thegrowth of the company’s markets and about the company’s ability to main-tain or increase its share of those markets. Furthermore, the company’searnings growth rate may diverge from its sales growth due to changes in itsoperating margins that may or may not reflect industrywide trends.
Because of the uncertainties affecting such projections, the analyst shouldapply to equity valuation the same sort of sensitivity analysis discussed in
PD
K g
P
P
P
=−
=−
=
=
$ .. .
$ ..
$
1 5013 10
1 5003
50
Dividend rateDividends to common shareholders
Common shares outstanding
per share
=
=
=
$ , ,, ,
$ .
15 000 00010 000 000
1 50
EXHIBIT 14.1 Selected Financial Data for Wolfe Food Company
Net income available to common shareholders $45,000,000Dividends to common shareholders $15,000,000Common shares outstanding 10,000,000Expected annual growth in earnings 10%Investors’ required rate of return, given predictability of Wolfe’s earnings 13%

320 FORECASTS AND SECURITY ANALYSIS
connection with financial forecasting (see Chapter 12). For instance, ifWolfe Foods ultimately falls short of the 10% growth rate previously pro-jected, then the $50 valuation will prove in retrospect to have been $12.50too high:
Therefore, an analyst whose forecast of earnings growth has a margin oferror of one percentage point should not put a strong “Buy” recommenda-tion on Wolfe when it is trading at $45 a share. By the same token, a priceof $25, which implies a 7% growth rate, can safely be regarded as an un-dervaluation, provided the other assumptions are valid.
Earnings or Cash Flow?
Intuitively appealing though it may be, the relating of share price to futuredividends through projected earnings growth does not jibe perfectly withreality. In particular, highly cyclical companies do not produce steady earn-ings increases year in and year out, yet the formula P = D/K−g demands aconstant rate of growth. If, as assumed previously, the company’s dividend-payout ratio remains constant, the pattern of its dividends will plainly failto fit neatly into the formula.
What saves the dividend-discounting approach from irrelevance is thatcompanies generally do not strive for a constant dividend-payout ratio at allcosts. More typically, they attempt to avoid cutting the amount of the payout,notwithstanding declines in earnings. For example, a company that aims topay out 25% of its earnings over a complete business cycle might record apayout ratio of 15% in a peak year and 90% or 100% in a trough year. In-deed, a company that records net losses may maintain its dividend at the es-tablished level, at least for a few years, resulting in a meaningless payout-ratiocalculation. (If losses persist, financial prudence will usually dictate cuttingor eliminating the dividend to conserve cash.) As a rule, a cyclical companywill not increase its dividend on a regular, annual basis. Nevertheless, theboard will ordinarily endeavor to raise the payout over the longer term. Inall of these cases, the P = D/K−g formula will work reasonably well as a
PD
K g
P
P
=−
=−
=
$ .. .
$ .
1 5013 09
37 50

Equity Analysis 321
valuation tool, with the irregular pattern of dividend increases recognizedthrough adjustments to the discount rate (K).
Although the dividend-discount model can accommodate earnings’cyclicality, the analyst must pay close attention to the method by which acompany finances the continuation of its dividend at the established rate. Achronically money-losing company that borrows to pay dividends is simplyundergoing slow liquidation. (It is replacing its equity, 100% of it in time,with liabilities.) In such circumstances, the key assumption that dividendswill continue for an infinite number of periods becomes unsustainable.
On the other hand, a cyclical company may sustain losses at the bottomof a business cycle but never reach the point at which its funds from opera-tions, net of capital expenditures required to maintain long-term competi-tiveness, fail to cover the dividend. Maintaining the dividend under thesecircumstances poses no financial threat. Accordingly, many analysts arguethat cash flow, rather than earnings, is the true determinant of dividend-paying capability. By extension, they contend that projected cash flow,rather than earnings-per-share forecasts, should be the main focus of equityanalysis.
Certainly, analysts need to be acutely conscious of changes in a com-pany’s cash-generating capability that are not paralleled by changes in earn-ings. For example, a company may for a time maintain a given level ofprofitability even though its business is becoming more capital-intensive.Rising plant and equipment requirements might transform the companyfrom a self-financing entity into one that is dependent on external financ-ing. Return on equity will not reflect the change until, after several years,either the resulting escalation in borrowing costs or the increase in the eq-uity base required to support a given level of operating earnings becomesmaterial. Furthermore, as detailed in Chapters 6 and 7, reported earningsare subject to considerable manipulation. In fact, that is the flaw thathelped to popularize the use of cash flow analysis in the first place. Cashgenerated from operations, which is generally more difficult for companiesto manipulate than earnings, can legitimately be viewed as the preferredmeasure of future dividend-paying capability.
Notwithstanding these arguments, earnings per share forecasts remainthe focal point of equity research on Wall Street and elsewhere. (As ex-plained in Chapter 3, some companies have managed to shift analysts’ focusfrom GAAP earnings to so-called pro forma earnings.) For many com-panies, the components of cash flow other than net income, especially de-preciation, are highly predictable over the near term. By accuratelyforecasting the more variable component, earnings, an investor can get afairly good handle on cash flow as well. To some extent, too, the unflagging

322 FORECASTS AND SECURITY ANALYSIS
focus on earnings probably reflects institutional inertia. Portfolio managersmeasure the accuracy of brokerage houses’ equity analysis in terms of earn-ings per share forecasts and investment strategists rely on aggregate earn-ings per share forecasts to gauge the attractiveness of the stock market as awhole. Analysts who lack an EPS forecast simply have a hard time gettinginto the discussion. Despite the stranglehold of earnings forecasts, however,a mechanism is available for adjusting a stock evaluation when the qualityof the forecasted earnings is questionable. Investors can reduce the earningsmultiple, as explained in the following section.
THE PRICE-EARNINGS RATIO
Although the dividend-discount model is an intuitively satisfying approachto valuing a common stock, it is not the most convenient method of com-paring one stock’s value with another’s. Better suited to that task is the price-earnings ratio, alternately known as the P/E ratio or earnings multiple:
Based on this formula, Wolfe Food Company (see preceding section) has aprice-earnings ratio of:
To understand how the price-earnings ratio may be used to compare com-panies with one another, consider a competitor of Wolfe Food Company,
Stock price $50
Net income available to common shareholders $45,000,000
Common shares $10,000,000
Earnings per share
Price-earnings ratio
X
=
=
=
=
=
=
=
$ , ,, ,
$ .
$$ .
.
45 000 00010 000 000
4 50
504 50
11 1
Price-earnings ratioStock price
Earnings per share=

Equity Analysis 323
Grubb & Chao (Exhibit 14.2). Grubb & Chao has the same expected earn-ings growth rate as Wolfe (10%) and is assigned the same required rate ofreturn (13%). Its price-earnings ratio, however, is higher than Wolfe’s(13.5X vs. 11.1X ):
Based on the information provided, an investor would regard Wolfe as abetter value than Grubb & Chao. This conclusion proceeds from applyingthe dividend-discount model to the latter’s numbers:
PD
K g
P
P
P
=−
=
−
=
=
$ , ,, ,
. .
$ ..
$
18 000 00015 000 000
13 10
1 2003
40
Price-earnings ratioStock price
Earnings per share
X
=
=
=
=
$ .
$ , ,, ,
$ .$ .
.
48 75
54 000 00015 000 000
48 753 60
13 5
EXHIBIT 14.2 Selected Financial Data for Grubb & Chao
Net income available to common shareholders $54,000,000Dividends to common shareholders $18,000,000Common shares outstanding 15,000,000Expected annual growth in earnings 10%Investors’ required rate of return, given predictability of company’s
earnings 13%Current stock price $48.75

324 FORECASTS AND SECURITY ANALYSIS
The price thus derived is lower than the actual price of $48.75, implying anovervaluation by the market. Observe as well that the “correct” price forGrubb & Chao produces the same price-earnings ratio as calculated forWolfe Food Company:
P/E-based value comparisons can go well beyond this sort of company-to-company matchup. The analyst can rank all the companies within an indus-try (Exhibit 14.3), then judge whether the variations in price-earnings ratiosappear justified, or whether certain companies seem misranked. Note thatthe table ranks companies on the basis of actual earnings over the precedingfour quarters, rather than estimated earnings for the coming year, another
Price-earnings ratio
X
=
=
$$ .
.
403 60
11 1
EXHIBIT 14.3 Companies within an Industry Ranked byPrice-Earnings Ratio: Cosmetics and Personal CareIndustry—September 2001
Share Price Divided byCompany Estimated 2001 Earnings per Share
Colgate-Palmolive 29.06Gillette 25.00Estee Lauder 24.71Avon Products 22.58Chattem 19.37Inter Parfums 18.75Alberto-Culver A 17.47Del Laboratories 16.27DSG International 15.31Paragon Trade 9.36CCA Industrie 5.42Parlux Fragrance 5.38Oralabs Holding 4.35
Source: Bloomberg.

Equity Analysis 325
typical format employed in P/E ratio comparisons. Earnings exclude bothextraordinary and nonrecurring items (see Chapter 3). Earnings per shareare calculated on a diluted basis by taking into account the possibility thatnew shares will be created through conversion of outstanding convertiblesecurities.
WHY P/E MULTIPLES VARY
Justifications for differences in earnings multiples derive from the variablesof the preceding valuation formulas. Consider the following two equations:
where P = Current stock priceD = Current dividend rateK = Required rate of returng = Growth rate
P/E = Price-earnings ratioEPS = Current earnings per share (annual)
Substituting D/K − g, which equals P, for the P in the other equation, pro-duces the following expanded form:
Using this expanded equation permits the analyst to see quickly that an in-crease in the expected growth rate of earnings produces a premium multi-ple. For example, both Wolfe Food Company and Grubb & Chao have 10%growth factors, and both stocks currently trade at 11.1 times earnings. Sup-pose another competitor, Eatmore & Co., can be expected to enjoy 11%growth, by virtue of concentration in faster-growing segments of the foodbusiness. A substantially higher multiple results from this modest edge inearnings growth:
P/EEPS
=
( )−( )
D
K g
PD
K g
P=
−= and P/E
EPS

326 FORECASTS AND SECURITY ANALYSIS
Eatmore & Co.’s earnings will not, however, command as big a premium(16.7X vs. 1.1X for its competitors) if the basis for its higher projectedgrowth is subject to unusually high risks. For example, Eatmore’s strategymay emphasize expansion in developing countries, where the rate of growthin personal income is higher than in the more mature economy of theUnited States. If so, Eatmore may be considerably more exposed than Wolfeor Grubb & Chao to the risks of nationalization, new restrictions on repa-triation of earnings, protectionist trade policies, and adverse fluctuations inexchange rates. If so, the market will raise its discount rate (K) on Eatmore’searnings. An increase of just one-half percentage point (from 13.0% to13.5%) wipes out more than half the premium in Eatmore’s multiple, drop-ping it from 16.7X to 13.3X:
In effect, the ability to vary the discount rate, and therefore to assign alower or higher multiple to a company’s earnings, is the equity analyst’s de-fense against the sort of earnings manipulation by management describedin Chapter 3. A company may use liberal accounting practices and skimpon long-term investment spending, yet expect the resulting artificially
P/EEPS
P/E
P/E X
=−( )
=−( )
=
D
K g
$ .
. .
$ .
.
1 60
135 11
4 80
13 3
P/EEPS
P/E
P/E X
=−( )
=−( )
=
D
K g
$ .
. .
$ .
.
1 60
13 11
4 80
16 7

Equity Analysis 327
inflated earnings per share to be valued at the same multiple as its competi-tor’s more legitimately derived profits. Indeed, the heart of many manage-ment presentations to analysts is a table showing that the presentingcompany’s multiple is low by comparison with its peers. Typically, the chiefexecutive officer cites this table as proof that the company is undervalued.The natural corollary is that in time investors will become aware of the dis-crepancy and raise the multiple, and therefore the price of shares owned bythose who are astute enough to buy in at today’s dirt-cheap level.
These stories are sometimes persuasive, yet one must wonder whethersuch “discrepancies” in earnings multiples are truly the result of inattentionby analysts. In the case of a large-capitalization company, hundreds of WallStreet and institutional analysts probably are making the comparison ontheir own. If so, they are fully aware of the below-average multiple but con-sider it justified for one or more reasons, including the following:
� The company’s earnings are more cyclical than those of its peer group.
� The company has historically been prone to earnings “surprises,”which raise suspicions that the reported results reflect an exceptionallylarge amount of “earnings management.”
� Management has a reputation for erratic behavior (e.g., abrupt changesin strategy, ill-conceived acquisitions) that makes future results difficultto forecast.
Analysts may be mistaken in these perceptions, and may genuinely beundervaluing the stock. The low multiple is a conscious judgment, however,not a function of neglect. Even a small-capitalization company, which canmore credibly claim that its stock is underfollowed by Wall Street, may havethe multiple it deserves, although its competitors sport higher P/E ratios. Itis appropriate to assign an above-average discount factor to the earnings ofa company that competes against larger, better-capitalized firms. A smallcompany may also suffer the disadvantages of lack of depth in managementand concentration of its production in one or two plants.
Recognizing that qualitative factors may depress their multiples, com-panies often respond in kind, arguing that their low valuations are based onmisperceptions. For example, a company in a notoriously cyclical industrymay argue that it is an exception to the general pattern of its peer group.Thus, a manufacturer of automotive components may claim that its earn-ings are protected from fluctuations in new car sales by a heavy emphasison selling replacement parts. Whether or not consumers are buying newcars, the reasoning goes, they must keep their existing vehicles in good re-pair. In fact, sales of replacement parts should rise if the existing fleet ages

328 FORECASTS AND SECURITY ANALYSIS
because fewer individuals buy new autos. Similarly, a building-materialsmanufacturer may claim to be cushioned against fluctuations in housingstarts because of a strong emphasis in its product line on the remodelingand repair markets.
These arguments may contain a kernel of truth, but investors shouldnot accept them on faith. Instead of latching on to the “concept” as a justi-fication for immediately pronouncing the company’s multiple too low, ananalyst should independently establish whether an allegedly countercyclicalbusiness has in fact fit that description in past cycles. It is also important todetermine whether the supposed source of earnings stability is truly largeenough to offset a downturn of the magnitude that can realistically be ex-pected in the other areas of the company’s operations.
A good rule to remember is that a company can more easily create anew image than it can recast its operations. Analysts should be especiallywary of companies that have tended to jump on the bandwagon of “con-cepts” associated with the hot stocks of the moment. During the late 1970s,skyrocketing oil prices led directly to higher expected earnings growth (g),and hence higher P/E multiples and stock prices for oil producers. Suddenly,chemical companies, capital-goods producers, and others began presentingthemselves as “energy plays.” Some did so by acquiring oil properties, butothers simply began publicizing their existing, albeit tangential, links to theoil business in markets that might conceivably have benefited from risingpetroleum prices. A few years later, when oil prices collapsed, these samecompanies deleted from their annual reports the glowing references andphotographs playing up their energy-relatedness. Around the same time, asthe economic boom ended in Houston and other cities that had benefitedfrom surging oil prices, national retailing chains became less vocal abouttheir concentration in the Sunbelt, which had for several years been synony-mous with high growth and therefore high P/E ratios.
Normal iz ing Earnings
Companies have strong incentives to gain increases, however modest, in theirearnings multiples, even at the cost of stretching the facts to the breakingpoint (or beyond). Accordingly, it is prudent to maintain a conservative biasin calculating appropriate multiples. In addition to upping the discount rate(K) when any question about the quality of earnings arises, the analyst shouldnormalize the earnings per share trend when its sustainability is doubtful.
Suppose, for example, that the fictitious PPE Manufacturing Corpora-tion’s earnings per share over the past five years are as shown in Exhibit 14.4.PPE has customarily commanded a multiple in line with the overall market,

Equity Analysis 329
which is at present trading at 12 times estimated current-year earnings. Bythis logic, a price of 12 times $2.67, or approximately 32, seems warrantedfor PPE stock.
Exhibit 14.5 shows, however, that the current-year earnings estimateis well above PPE’s historical trend line, making the sustainability of the
EXHIBIT 14.4 PPE ManufacturingCorporation Earnings History Table
Year Earnings per Share
2002 $1.522003 1.632004 1.862005 2.042006 2.67 (Estimated)
EXHIBIT 14.5 PPE Manufacturing Corporation EarningsHistory Graph
3.00
2.50
2.00
1.50
1.00
0.50
0.00
Ear
ning
s pe
r Sh
are
($)
Years1996 1997 1998 1999 2000

330 FORECASTS AND SECURITY ANALYSIS
current level somewhat suspect. As it turns out, the $2.67 estimate isbloated by special conditions that will probably not recur in the near future.Specifically, the customers for PPE’s major product are stepping up theirpurchases in anticipation of an industrywide strike later in the year. A tem-porary shortage has resulted, causing buyers to raise their bids. With itsplants running flat out (reducing unit costs to the minimum) and its pricerealizations climbing, PPE is enjoying profit margins that it has neverachieved before—and probably never will again.
It hardly seems appropriate to boost PPE’s valuation from 241⁄2 (12times last year’s earnings per share) to 32, a 31% increase, solely on thebasis of an EPS hiccup that reflects no change in PPE’s long-term earningspower. Accordingly, the analyst should normalize PPE’s earnings by project-ing the trend line established in preceding years. Exhibit 14.6 shows such a
EXHIBIT 14.6 PPE Manufacturing Corporation EarningsTrend—Least-Squares Method
Years1996
3.00
2.50
2.00
1.50
1.00
0.50
0.001997 1998 1999 2000
Ear
ning
s pe
r Sh
are
($)

Equity Analysis 331
projection, using the least-squares method. The formula for this method isas follows:
Solving for x = 4, we derive a current-year trend-line value of $2.21.Applying the market multiple of 12 produces an indicated stock price of261⁄2. Some modest upward revision from this point may be warranted, forif nothing else the company can reinvest its windfall profit in its businessand generate a small, incremental earnings stream. By no means, though,should the company be evaluated on the basis of an earnings level that isnot sustainable.
Sustainable Growth Rate
Sustainability is an issue not only in connection with unusual surges inearnings, but also when it comes to determining whether a company’s his-torical rate of growth in earnings per share is likely to continue. The answer
y a m x x
a y
mxy nxy
x nx
x
y
xy
nxy
= + −( )=
=−−
=+ + +
=
=+ + +
=
= ×( ) + ×( ) + ×( ) + ×( ) =
= × ×
ΣΣ
Σ
2 2
0 1 2 34
1 5
1 52 1 63 1 86 2 044
1 7625
0 1 52 1 1 63 2 1 86 3 2 04 11 47
4 1 5 1 7625
.
. . . ..
. . . . .
. . ==
= + + + =
= ( ) × ( ) =
=−
−=
= + −( )
10 575
0 1 2 3 14
4 1 5 9
11 47 10 57514 9
0 179
1 7625 0 179 1 5
2 2 2 2
2
.
.
. ..
. . .
Σx
nx
m
y x
2
2

332 FORECASTS AND SECURITY ANALYSIS
is probably “no” if the growth has been fueled by anything other than addi-tions to retained earnings per share.
Consider the following derivation of earnings per share:
Or:
Earnings per share will not grow merely because sales increase. Any suchincrease will be canceled out in the preceding formula, since sales appearsin the denominator of return on sales as well as in the numerator of assetturnover. Only by an increase in one of the four terms on the left side of theequation, or by a reduction in the number of shares outstanding, will theproduct (earnings per share) rise. Aggressive management may boost assetturnover, but eventually the assets will reach the limits of their productivecapacity. Return on sales, likewise, cannot expand indefinitely because too-fat margins will invite competition. Leverage also reaches a limit becauselenders will not continue advancing funds beyond a certain point as finan-cial risk increases. This leaves only book value per share, which can rise un-ceasingly through additions to retained earnings, as a source of sustainablegrowth in earnings per share. As long as the amount of equity capital in-vested per share continues to rise, more income can be earned on that eq-uity, and (as the reader can demonstrate by working through the precedingformula) earnings per share can increase.
A company’s book value per share will not rise at all, however, if itdistributes 100% of its earnings in dividends to shareholders. (This, by theway, is why an immediate increase in the dividend-payout ratio will not or-dinarily cause a direct, proportionate rise in the stock price, as might ap-pear to be the implication of the equation P = D/K−g.) Assuming thecompany can earn its customary return on equity on whatever profits itreinvests internally, raising its dividend-payout ratio reduces its growth inearnings per share (g). Such a move proves to be self-defeating as both thenumerator and the denominator (D and K−g, respectively) rise and P re-mains unchanged.
To achieve sustainable growth in earnings per share, then, a companymust retain a portion of its earnings. The higher the portion retained, the
SalesAssets
Net incomeSales
AssetsNet worth
Net worthShares outstanding
Net incomeShares outstanding
× × × =
Assetturnover
Return onsales Leverage Book value
per share Earnings per share× × × =

Equity Analysis 333
more book value is accumulated per share and the higher can be the EPSgrowth rate. By this reasoning, the following formula is derived:
where Income reinvestment rate = 1 − Dividend payout ratio
As mentioned, the one remaining way to increase earnings per share, afterexhausting the possibilities already discussed, is to reduce the number ofshares outstanding. During the 1990s, a number of companies used stockbuybacks to maintain EPS growth in the face of constrained opportunitiesfor revenue growth. Between 1995 and 1999, International Business Ma-chines spent $34.1 billion to repurchase shares, more than its cumulativenet income for the period of $31.3 billion. By reducing its shareholders’ eq-uity through stock purchases, IBM increased its leverage and, therefore, itsfinancial risk. Moreover, the company intensified this effect by adding to itsdebt. Financial commentator James Grant quipped that if IBM continued tobuy in shares, it would undergo a slow-motion leveraged buyout.2 SuchEPS-boosting plans tend to be self-limiting, for as already noted, lenders re-fuse at some point to countenance increased indebtedness.
Analysts should note one subtlety in calculating the impact of stock re-purchases on earnings per share. To the extent that the company funds thebuybacks with idle cash, the increase in EPS is offset by a reduction arisingfrom forgone income on investments. If a company has far more cash on itsbalance sheet than it can employ profitably in its operations, it is unfair toaccuse management of deceitfully inflating its per share income by buyingin stock.
THE DU PONT FORMULA
The preceding discussion of sustainable growth introduced a formula thatprovided insight into earnings per share by disaggregating it into severalsimple financial ratios. Disaggregation can be applied in other beneficialways in equity analysis, most notably in a technique known as the Du PontFormula. (The idea is generally credited to Donaldson Brown, who devel-oped the formula while at E. I. du Pont de Nemours, then applied it duringthe 1920s as vice president of finance at General Motors.) With the aid ofthe Du Pont Formula, the analyst can more readily perceive the sources of afirm’s return on assets:
Substainable growth rate Return on equity Income reinvestment rate= ( ) × ( )

334 FORECASTS AND SECURITY ANALYSIS
Like most ratio analysis, the Du Pont Formula is valuable not only for thequestions it answers but also for the new ones it raises. If a company raisesits return on assets by finding ways to reduce working capital without im-pairing competitiveness (thereby improving asset turnover), then it is likelyto be able to perform at the higher level. On the other hand, cutting back onnecessary capital expenditures will also have a positive effect—in the shortrun—on return on assets. Not only will the denominator decline in the assetturnover factor as a result of depreciation, but return on sales will rise as fu-ture depreciation charges are reduced by lower capital outlays in the currentyear. Underspending will eventually hurt competitiveness, and therefore thecompany’s long-run return on assets, so analysts must probe to determinethe true nature of shifts in these ratios.
A Du Pont analysis of the food processing industry (Exhibit 14.7) con-firms the value of examining the components of return on equity. Based onROE alone, Conagra (13.93%) and Kraft Foods (14.24%) look very similar.They achieved those numbers by very different methods, however. Conagra, amore commodity-oriented company, worked on a narrower sales margin(1.63% vs. 7.54% for Kraft), but turned over its assets much more frequently
Asset turnover Return on sales Return on assets
SalesAssets
IncomeSales
IncomeAssets
× =
× =
EXHIBIT 14.7 Du Pont Analysis of Food Processing Industry’s 2000 Results*
Asset Return Return FinancialCompany Turnover on Sales on Assets Leverage Return onName (x) × (%) = (%) × (x) = Equity
Conagra 2.06 1.63% 3.36% 4.15 13.93%Dole Food 1.67 1.42 2.38 5.13 12.19Heinz (H J) 1.06 9.47 10.06 5.55 55.80Hershey Foods 1.22 7.93 9.70 2.93 28.47Hormel Foods 2.24 4.63 10.37 1.88 19.48Kellogg 1.42 8.45 12.00 5.46 65.48Kraft Foods 0.51 7.54 3.84 3.71 14.24McCormick 1.28 6.48 8.28 4.62 38.27Ralston Purina 0.94 19.19 18.02 6.71 120.93Sara Lee 1.51 6.98 10.52 9.22 97.06
*Calculations are subject to rounding error.

Equity Analysis 335
(2.06 X vs. 1.28 X). McCormick appears to be far more profitable than Her-shey Foods, based on the companies’ respective returns on equity of 38.27%and 28.47%. That advantage resulted entirely from more aggressive financialleverage (4.62X for McCormick vs. Hershey’s 2.93X, the second most con-servative ratio in the industry). Hershey’s return on sales and, consequently,its return on assets were substantially higher than McCormick’s correspon-ding figures. The analysis shows investors that to benefit from McCormick’shigher return on equity, they must assume more financial risk than theywould expose themselves to by owning the stock of Hershey Foods.
Some of the companies in Exhibit 14.7 achieved returns on equity thatseem absurdly high, with Sara Lee at 97.06% and Ralston Purina at120.93%. In part, those results reflected the two companies’ employment ofthe highest financial leverage within the industry. In addition, the extremelyhigh ROEs derived from the companies’ very low levels of book value. Asproducers of branded food products, Sara Lee and Ralston Purina derivetheir equity value primarily from the consumer acceptance of well-knownbrands, rather than the physical plants in which they produce their goods.On June 30, 2001, Ralston Purina’s stock closed at $30.02 a share, yet itsbook value was only $2.36 a share. The company’s return on equity looksless stratospheric when equity is viewed in terms of market capitalizationrather than historical cost (see “Pros and Cons of a Market-Based EquityFigure” in Chapter 2).
The Modif ied Du Pont Formula
Carrying the disaggregation technique a step further, the Modified Du PontFormula analyzes the sources of return on shareholders’ investment:
As noted, the stock market will ordinarily value earnings at lower mul-tiples than they would otherwise command if the earnings were subject tounusual risks. Financial risk, as signified by financial leverage, is one con-sideration that may penalize a company’s P/E ratio. Generally speaking, ananalyst will respond more favorably to a firm that raises its return on equityby increasing its return on assets than one that does so by leveraging its eq-uity more aggressively. Besides introducing greater volatility into the rate of
Return on assets Financial leverage Return on equity
IncomeEquity
AssetsEquity
IncomeEquity
× =
× =

336 FORECASTS AND SECURITY ANALYSIS
return, adding debt to the balance sheet demonstrates no management skillin improving operations. Furthermore, a company that has already fully uti-lized its debt capacity has no additional potential for increasing its returnon equity by the same means. A somewhat underborrowed company, on theother hand, has hidden profitability potential that may be exploited (withconcomitant benefits to shareholders) at a later point. The Modified DuPont Formula enables investors to judge the quality of a company’s returnon equity in much the same way that other financial tests can be applied tothe quality of earnings.
VALUATION THROUGH RESTRUCTURING POTENTIAL
A more subtle benefit of the Du Pont analysis is the insight it can provideinto companies’ potential for enhancing value through corporate restructur-ing. Whether initiated internally or imposed from outside, major revisionsin operating and financial strategies can dramatically increase the price of acorporation’s common shares. The analysis illustrated in Exhibit 14.7 helpsto identify the type of restructuring that can unlock hidden value in a par-ticular instance. Some companies have the potential to raise their shareprices by utilizing their assets more efficiently, whereas others can increasetheir value by increasing their financial leverage.3
By way of background, corporate managers frequently find themselvesat odds with stock market investors and speculators over issues of corporatepolicy. In general, managers prefer to maintain a certain amount of slack intheir organizations, that is, a reserve capacity to deal with crises and oppor-tunities. They tend to be less troubled than investors if their companies gen-erate excess cash that remains on the balance sheet earning the modestreturns available on low-risk, short-dated financial instruments. That cashmay come in handy, they argue, if earnings and cash flow unexpectedly turndown or if an outstanding acquisition opportunity suddenly presents itself.Investors and speculators, in contrast, prefer to see the cash used to repur-chase stock or else returned to shareholders. Managers also tend to be moreinclined than shareholders to believe that underperforming units can be re-habilitated. Their judgment is sometimes influenced by reluctance to admitthat acquisitions in which they had a hand have worked out poorly.
Over the years, management-shareholder disputes over such operating-and financial-policy issues have featured a variety of tactics. As far back as1927 and 1928, pioneer securities analyst Benjamin Graham waged a success-ful campaign to persuade the management of Northern Pipeline to liquidatecertain assets that were not essential to the company’s crude oil transportation

Equity Analysis 337
business and distribute the proceeds to shareholders. Graham enlisted pivotalsupport for his effort from a major institutional holder, the Rockefeller Foun-dation. The outcome was unusual, as institutional investors generally sidedwith management, both at the time and for many years afterward. At most, in-stitutions sold their shares if they became thoroughly dissatisfied with the waya company was being run. Trying to bring about change was not a widespreadinstitutional practice, even in the 1980s. Therefore, management’s main ad-versaries in battles over corporate governance were aggressive financial opera-tors. During the 1950s, these swashbucklers attracted considerable attentionby pushing for strategic redirection through proxy battles. Their modusoperandi consisted of striving to obtain majority control of the board throughthe election of directors at the annual meeting of shareholders.
The 1970s brought the tactical shift to hostile takeovers, a type oftransaction previously regarded as unsavory by the investment banks thatacted as intermediaries in mergers and acquisitions. Hostile takeovers be-came especially prominent in the 1980s, fueled in part by the greatly in-creased availability of high-yield debt (informally referred to as “junkbond”) financing. High-yield bonds also financed scores of leveraged buy-outs. LBO sponsors defended these controversial transactions in part by ar-guing that corporations could improve their long-run performance if theywere taken private and thereby shielded from the public market’s insatiabledemand for short-run profit increases.
In the 1990s, institutional investors finally began to understand the in-fluence they could wield in corporate boardrooms by virtue of their vastshare holdings. Large institutional shareholders began to prod corporationsto increase their share prices by such measures as streamlining operations, di-vesting unprofitable units, and using excess cash to repurchase shares. Insome instances, where merely making their collective voice heard had no dis-cernible effect, the institutions precipitated the ouster of senior management.
The shareholder activism of the 1990s flourished in an environment ofcomparatively high price-earnings ratios. Additionally, the period was char-acterized by a backlash against the previous decade’s trend toward in-creased financial leverage. Conditions were not conducive to the sort ofborrow-and-acquire transactions that drove much of the corporate restruc-turings of the 1980s.
In that era, the prototypical deal consisted of gaining control of a com-pany by buying its stock at a depressed price, then adding a large amount ofdebt to the capital structure. Opportunities of this sort were abundant, notonly because of low prevailing price-earnings ratios, but also because manycorporations carried far less debt than their cash flows could support. Atleast in the early stages, before some raiders became overly aggressive in

338 FORECASTS AND SECURITY ANALYSIS
their financial forecast assumptions, it was feasible to extract value withoutcreating undue bankruptcy risk, simply by increasing the ratio of debt to eq-uity. The hostile takeover artists focused on the second factor in the Modi-fied Du Pont Formula—financial leverage.
By releasing the potential embedded in a relatively debt-free balancesheet, the corporate raiders of the 1980s did more than pursue large profits.More important to the subject at hand (although not to the raiders), theiractivities seriously undermined the earnings multiple as a basis for valuingcompanies.
Consider the fictitious Sitting Duck Corporation (Exhibit 14.8). Underconventional assumptions, and given a prevailing earnings multiple of 11 onsimilar companies, Sitting Duck’s equity will be valued at $715 million,about 1.7 times its book value of $413 million.
EXHIBIT 14.8 Sitting Duck Corporation
Year Ended December 31, 2001($000,000 omitted)
Balance Sheet Statement of Cash Flows
Current assets $ 594Property, plant, and equipment 406
Total assets $1,000
Current liabilities $ 350Long-term debt 237Shareholders’ equity 413
Total liabilities and equity $1,000
Income StatementSales $1,253Cost of goods sold 972Selling, general, and
administrative expense 95
Operating income 186Interest expense 19
Pretax income 167Income taxes 102
Net income $ 65
Net income $ 65Depreciation 38
Cash generated by operations 103
Dividends 22Capital expenditures 41Increase in working capital 10
Cash used in operations 73
Net cash available 30
Reduction of long-term debt 25Increase in cash and equivalents $ 5

Equity Analysis 339
Corporate raiders, however, would approach the valuation much differ-ently. Their focus would not be on earnings, but on cash flow. After payingout approximately one-third of its earnings in dividends and more than off-setting depreciation through new expenditures for plant and equipment,Sitting Duck generated $30 million of cash in 2001. The incumbent man-agement group used this cash to reduce an already conservative (36%)total-debt-to-total-capital ratio and to add to the company’s existing port-folio of marketable securities. To a takeover artist, a more appropriate usewould be to finance a premium bid for the company.
The arithmetic goes as follows: Assume commercial banks are currentlywilling to lend to sound leveraged buyout projects that can demonstrateEBITDA coverage of 1.5 times. (The lenders do not care about the company’sbook profits, but rather about its ability to repay debt. Cash generation is akey determinant of that ability.) Sitting Duck’s operating income of $186 mil-lion, with $38 million of depreciation added back, produces EBITDA of $224million. The amount of interest that $224 million can cover by 1.5 times is$149 million, an increase of $130 million over Sitting Duck’s present interestexpense. Assuming a blended borrowing cost of 13% on the LBO financing,a raider can add $1 billion of debt to the existing balance sheet. If prevailinglending standards require equity of at least 10% in the transaction, theraider must put up an additional $111 million, for a total capitalization of$1.1 billion. By this arithmetic, the takeover artist can pay a premium of55% ($1.111 billion ÷ $715 million = 1.55) over Sitting Duck’s presentmarket capitalization. The purchase price equates to a multiple of 17 timesearnings, rather than the 11X figure currently assigned by the market. Theraider got to this number, however, through a measure of cash flow, ratherthan earnings. The EBITDA multiple of the bid is 5.0 times, a moderatelevel by the standards of LBO specialists. (As explained in Chapter 8,EBITDA is by no means the best measure of cash flow, but it can be fairlydescribed as the standard in leveraged finance circles.)
Stepping back from these calculations, one is bound to wonder whetherthe raider can truly expect to earn a high return on investment after paying55% above the prevailing price for Sitting Duck’s shares. In actuality, manycomparably high-priced takeovers of the 1980s proved quite remunerativefor the equity investors. Some of the cycle’s early deals benefited from assetvalues that could not be discerned from even a thorough review of the fi-nancial statements. For example, companies owned real estate boughtdecades earlier and carried at historical cost. These assets were salable atsubstantially higher prices than their balance sheet values. Armed with suchinformation, managers led buyouts of their own companies, knowing thatthey were not taking on inordinately large debt relative to the market value

340 FORECASTS AND SECURITY ANALYSIS
of the acquired assets. Naturally, transactions in which the managers had aninformational advantage over the shareholders, who were in principle theirultimate employers, prompted complaints of conflicts of interest. As theLBO cycle of the 1980s progressed, boards of directors took greater care toarrange competitive auctions for their companies, lest they be accused of ob-taining inadequate value for selling shareholders through “sweetheart” dealswith management. The opportunities for LBO sponsors and managementteams to buy companies on the cheap consequently diminished. Purchaserscould no longer be confident that the economic value of the acquired assetsexceeded the amount of debt they were taking on. Many bonds connectedwith these late-cycle LBOs went into default in 1990 and 1991.
Leveraged buyouts became a less prominent feature of the financiallandscape during the 1990s. Transactions continued to occur, although withless highly leveraged capital structures than investors countenanced in thelate 1980s. In future bear markets, when stocks again sell at depressed price-earnings multiples, investors will probably renew their focus on companies’values as LBO candidates. Equity analysts will need to understand howthose values are determined to assess the upside potential in stocks. In addi-tion, lenders, bondholders, and purchasers of LBO equity can be expected tocall on analysts of financial statements to judge the likelihood that particulardeals will prove profitable. The answers will lie partly in ability of the com-panies to emulate the strategies employed by leveraged buyouts of the pastthat succeeded in paying off their debts and providing satisfactory risk-adjusted returns to their equity investors. Typically, the LBO world’s winnershave achieved their gains through one or both of the following means:
1. Profit Margin Improvement. A leveraged buyout can bring aboutimproved profitability for either of two reasons. First, a change in owner-ship results in a fresh look at the company’s operations. The newcomerstypically have less sentimental attachment to product lines that are long ontradition but are no longer profitable. In addition, they can more easily takethe emotionally difficult, but necessary, steps to restore competitiveness,such as reducing the work force and outsourcing production. Second, man-agement may obtain a significantly enlarged stake in the firm’s success asthe result of a buyout. In lieu of stock options that could leave them com-fortably provided for in their retirement, senior and even middle-level exec-utives may receive equity interests that can potentially make themimmensely wealthy within a few years. The change in incentives can reducemanagers’ zeal for maintaining slack in their operations and cause them in-stead to squeeze every possible dollar of profit out of their company’s assets.With an enhanced opportunity to participate in the benefits, the managers

Equity Analysis 341
may crack down on unnecessary costs that they formerly tolerated and pur-sue potential new markets more aggressively than in the past. Regardless ofhow it comes about, however, improvement in profit margins means higherEBITDA. That, in turn, leads to a higher valuation and generates a profit forthe LBO’s equity investors.
As a caveat, analysts must watch out for improvements in reportedprofit margins that represent nothing more than reductions in investmentspending. Following an LBO, a company can report an immediate improve-ment in earnings by cutting back expenditures on advertising and researchand development. Even though the accounting rules do not permit theseitems to be capitalized, the outlays provide benefits in future periods.Sharply reducing such outlays, or delaying capital expenditures to conservecash, can impair a company’s future competitiveness, making the increase incurrent-period earnings illusory. Invariably, LBO organizers either deny thatsuch cutbacks will occur or maintain that before the buyout, the companywas plowing more into these categories than the associated benefits justified.In light of the high LBO failure rate of 1980s-vintage LBOs in 1990 and1991, however, a prudent analyst will be skeptical about such arguments.Today’s profit improvement may be a precursor of tomorrow’s bankruptcyby a company that has economized its way to an uncompetitive state.
Regrettably, the income statement may provide too little detail to deter-mine whether specific kinds of investment spending have been curtailed.Analysts must therefore query industry sources for evidence regarding theadequacy of the company’s investment spending. If the company’s cus-tomers report a drop in the quality of service following a leveraged buyout,it may indicate that important sales support functions have been eviscer-ated. Earnings may rise in the short run, but suffer in the only slightly longterm as customers switch to other providers.
2. Asset Sales. As a function of the stock market’s primary focus onearnings, a company’s market capitalization may be far less than the aggre-gate value of its assets. For example, a subsidiary that contributes little tonet income, but generates substantial cash flow from depreciation, has po-tentially large value in the private market. In that realm, the unit would bepriced on a multiple of EBITDA. Alternatively, a subsidiary might be un-profitable only because its scale is insufficient. A competitor might be will-ing to buy the unit and consolidate it with its own operations. The resultwould be higher combined earnings than the two operations were able togenerate independently. An LBO sponsor who spies this sort of opportunitywithin a company may invest a small amount of equity and borrow thegreater part of the purchase price, then liquidate the low-net-income opera-tions to repay the borrowings. If carried out as planned, the asset sales will

342 FORECASTS AND SECURITY ANALYSIS
leave the acquirer debt-free and in possession of the remainder of the com-pany, that is, the operations that previously contributed almost all of the netincome. In the P/E-multiple-oriented stock market, that portion of the com-pany will be worth as much as the entire company was previously. The LBOsponsor may then cash out by taking it public again. After all the dust hassettled, the sponsor should have cleared more than enough to cover the pre-mium paid to original shareholders who sold into the buyout.
Unrealized earnings potential and EBITDA multiples are by no meansthe only valuation factors that come into play in corporate governance con-troversies. Proponents of policy changes in pursuit of enhanced share-holder value sometimes focus on the values of specific assets identified inthe financial statements. For example, oil companies disclose the size oftheir reserves in their annual reports. Because energy companies frequentlybuy and sell reserves, and because the prices of larger transactions arewidely reported, current market valuations are always readily at hand. Ifrecent sales of reserves in the ground have occurred at prices that equate to$10 a barrel, then a company with 25 million barrels of reserves could the-oretically liquidate those assets for $250 million.4 It may be that the sum of$250 million and a P/E-multiple-based price for the company’s refining,marketing, and transportation assets substantially exceeds the company’scurrent market capitalization. If so, the “unrecognized” value of the oil re-serves can be the basis of an alternative method of evaluating the com-pany’s stock.
Would-be corporate restructurers also seek unrecognized value in othertypes of minerals, real estate, and long-term investments unrelated to a com-pany’s core business. Methods of realizing the value of such an asset include:
� Selling the asset for cash.
� Placing it in a separate subsidiary, then taking a portion of the subsidiarypublic to establish a market value for the company’s residual interest.
� Placing the asset in a master limited partnership, interests in which aredistributed to shareholders.
The key message to take away from this overview of valuation via re-structuring potential is that a focus on price-earnings multiples, the best-known form of fundamental analysis, is not the investor’s sole alternative torelying on technicians’ stock charts. There are in fact several approaches tofundamental analysis. A solid understanding of financial statements is es-sential to all of them, even though factors outside the financial statementsalso play a role in fundamental valuation.

Equity Analysis 343
CONCLUSION
As noted at the outset of this chapter, valuations derived from financialstatements represent only a portion of the analyses being conducted by mil-lions of stock buyers and sellers during each trading session. Indeed, thesplit-second decision making of traders on the exchange floors can scarcelybe described as analysis of any kind. Rather, it amounts to a highly intuitiveresponse to momentary shifts in the balance of supply and demand.
For the investor who takes a longer view, however, financial statementanalysis provides an invaluable reference point for valuation. A stock maytemporarily soar or plummet in frenzied reaction to a development of littleultimate consequence. Eventually, however, rationality usually reasserts itself.The share price then returns to a level that is justifiable on the basis of thecompany’s long-range capacity to generate earnings and cash. Focusing onbreakup values, as well as P/E and EBITDA multiples, is consistent with thisthesis. Ultimately, the value of previously “unrecognized” assets likewise restson their potential to generate cash, which must be measured in the context ofprevious performance. By studying the company’s historical financial state-ments to forecast its future results, the analyst can derive an intrinsic valuefor a stock that is unaffected by the market’s transitory mood.


345
bibliography
BOOKS
Browne, Lynn E., and Eric S. Rosengren (Editors), The Merger Boom: Pro-ceedings of a Conference Held in October 1987 (Boston: Federal Re-serve Bank of Boston, 1988).
Fabozzi, Frank J., and T. Dessa Fabozzi (Editors), The Handbook of FixedIncome Securities, Fourth Edition (Burr Ridge, Illinois: Irwin Profes-sional Publishing, 1995).
Fridson, Martin S., High Yield Bonds: Identifying Value and Assessing Riskof Speculative-Grade Securities (Chicago: Probus Publishing, 1989).
Gitman, Lawrence J., Principles of Managerial Finance, Seventh Edition(New York: HarperCollins Financial Publishers, 1994).
Hale, Roger H., Credit Analysis: A Complete Guide (New York: John Wiley& Sons, 1983).
Levine, Sumner N. (Editor), Handbook of Turnaround & Bankruptcy In-vesting (New York: Harper & Row Publishers, 1991).
Maginn, John L., and Donald L. Tuttle (Editors), Managing InvestmentPortfolios: A Dynamic Process, Second Edition (Boston: Warren,Gorham & Lamont, 1989).
Malonis, Jane A. (Editor), Encyclopedia of Business, Second Edition (De-troit: Gale Group, 1999).
McConnell, Campbell R., Economics: Principles, Problems and Policies,Tenth Edition (New York: McGraw-Hill Book Company, 1987).
Mosteller, Frederick, Robert K. E. Rourke, and George B. Thomas, Jr.,Probability with Statistical Applications, Second Edition (Reading,Mass.: Addison-Wesley Publishing Company, 1970).
Pass, Christopher, Bryan Lowes, Leslie Davis, and Sidney J. Kronish (Edi-tors), The HarperCollins Dictionary of Economics (New York: Harper-Collins Publishers, 1991).
Prochnow, Herbert V. (Editor), Bank Credit (New York: Harper & RowPublishers, 1981).
Reilly, Frank K., Investment Analysis and Portfolio Management, ThirdEdition (Orlando, Florida: The Dryden Press, 1989).

346 BIBLIOGRAPHY
Siegel, Joel G. and Jae K. Shim, Dictionary of Accounting Terms (New York:Barron’s Educational Series, 1987).
Standard & Poor’s Municipal Finance Criteria (New York: Standard &Poor’s Corporation, 1989).
White, Gerald I., and Ashwinpaul C. Sondhi (Editors), CFA Readings in Fi-nancial Statement Analysis (Charlottesville, Virginia: The Institute ofChartered Financial Analysts, 1985).
PERIODICALS
CreditWeek (New York: Standard & Poor’s, Weekly).Moody’s Bond Record (New York: Moody’s Investors Service, Monthly).Moody’s Bond Survey (New York: Moody’s Investors Service, Weekly).Schilit’s Shenanigan Busters (Rockville, Maryland: Center for Financial Re-
search and Analysis).Standard & Poor’s Bond Guide (New York: Standard & Poor’s, Monthly).

347
glossary
accelerate To demand immediate repayment of debt in default, exercisingthereby a right specified in the loan contract.
Accounting Principles Board (APB) Formerly, a rule-making body of theAmerican Institute of Certified Public Accountants. Predecessor of theFinancial Accounting Standards Board (see).
accrual accounting An accounting system in which revenue is recognizedduring the period in which it is earned and expenses are recognizedduring the period in which they are incurred, whether or not cash is re-ceived or disbursed.
actuarial assumptions Forecasts of the rates of phenomena such as mor-tality and retirements, used to determine funding requirements for pen-sion funds and insurance policies.
APB Accounting Principles Board (see).book value The amount at which an asset is carried on the balance sheet.
Book value consists of the asset’s construction or acquisition cost, lessdepreciation (see) and subsequent impairment of value, if applicable.An asset’s book value does not rise as a function of an increase in itsmarket value or inflation. (See also historical cost accounting.)
breakeven rate The production volume at which contribution (see) isequivalent to fixed costs (see), resulting in a pretax profit of zero.
Example:
Price per unit $2.50
Variable cost per unit
Fixed costs
To calculate breakeven: $2.50
units
=
==
−( ) ×[ ] − =
×( ) =
=
$ .
$
$ . $
$ . $
1 00
600
1 00 600 0
1 50 600
400
B
B
B
Definitions of cash balance plan and defined benefit plan are adapted from descriptions pro-vided by the Pension Benefit Guaranty Corporation.

348 GLOSSARY
bridge loan A temporary loan made in the expectation that it will subse-quently be repaid with the proceeds of permanent financing.
business cycle Periodic fluctuations in economic growth, employment, andprice levels. Phases of the classic cycle, in sequence, are peak, recession,trough, and recovery.
CAGR Compound annual growth rate (see).capital-intensive Characterized by a comparatively large proportion of
plant and equipment in asset base. The heavy depreciation charges thatarise from capital intensity create a high level of fixed costs and volatileearnings.
capitalization (of an expenditure) The recording of an expenditure as anasset, to be written off over future periods, on the grounds that the out-lay produces benefits beyond the current accounting cycle.
cash balance plan In the field of pensions, a type of defined benefit plan(see) in which each participant’s benefit is defined in terms of a hypo-thetical account balance. Each year, the account is credited with a paycredit and an interest credit specified by the plan. The interest creditmay be fixed or based on a variable index such as the yield on 30-yearTreasury bonds.
cash-on-cash profit In real estate, the cash flow from a property dividedby the cash equity invested. Unlike conventional rate-of-return mea-sures calculated in accordance with accrual accounting (see), cash-on-cash profit is not reduced by noncash charges such as depreciation(see). This reflects a presumption that land and buildings tend to in-crease in value over time, rather than lose value through wear-and-tear,as in the case of plant and equipment.
Chapter 11 Under the 1978 Bankruptcy Reform Act, a method of resolv-ing bankruptcy that provides for reorganization of the failed firm as analternative to liquidating it.
class-action suit A type of lawsuit filed under Federal Rule of Civil Pro-cedure 23, which allows one member of a large group of plaintiffswith similar claims to sue on behalf of the entire class, provided cer-tain conditions are met. Damages awarded in certain class-action suitshave been large enough to compromise the solvency of corporate defendants.
comparability In accounting, the objective of facilitating financial com-parisons of a group of companies, achieved by requiring them to usesimilar reporting practices.
compound annual growth rate (CAGR) The level, annual rate of increasethat results in a stated beginning value rising to a stated terminal value.

Glossary 349
Example:
Year Value of Asset ($)
0 3771 4212 4143 4874 5415 596
The year-to-year increase in the asset’s value has been uneven, rangingfrom −1.7% in Year 2 to 17.6% in Year 4. If the increase had been9.6% in each year, however, the value would have grown from the be-ginning figure of $377 to the terminal figure of $596. Computation ofthe compound annual growth rate is a standard function on sophisti-cated hand-held calculators. CAGRs can also be derived from com-pound interest tables.
consolidation (of an industry) A reduction in the number of competitorsin an industry through business combinations.
contribution Revenue per unit minus variable cost (see) per unit.convertible With reference to bonds or preferred stock, redeemable at the
holder’s option for common stock of the issuer, based on a specified ratioof bonds or preferred shares to common shares. (See also exchangeable.)
cost of capital The rate of return that investors require for providing capi-tal to a company. A company’s cost of capital consists of the cost of cap-ital for a risk-free borrower, a premium for business risk (the risk ofbecoming unable to continue to cover operating costs), and a premiumfor financial risk (the risk of becoming unable to continue covering fi-nancial costs, such as interest). The risk-free cost of capital is commonlyequated with the prevailing interest rate on U.S. Treasury obligations.
cumulative dividend A characteristic of most preferred stocks wherebyany preferred dividends in arrears must be paid before dividends maybe paid to common shareholders.
default The failure of a debt obligor to make a scheduled interest or prin-cipal payment on time. A defaulting issuer becomes subject to claimsagainst its assets, possibly including a demand by creditors for full andimmediate repayment of principal.
defined benefit plan A type of pension plan in which the level of benefici-aries’ retirement income is established contractually, generally based onsuch factors as age, earnings, and years of service. The pension plansponsor bears the risk of earning a return on investment assets sufficient

350 GLOSSARY
to meet the contractual payments. (See also cash balance plan, definedcontribution plan.)
defined contribution plan A type of pension plan in which the amountscontributed to the plan by its sponsor are established contractually.The retirement income paid to the beneficiaries is determined by theinvestment returns on the pension assets. (See also defined benefitplan.)
depreciation A noncash expense meant to represent the amount of capitalequipment consumed through wear and tear during the period.
dilution A reduction in present shareholders’ proportional claim on earn-ings. Dilution can occur through the issuance of new shares in an ac-quisition if the earnings generated by the acquired assets are insufficientto maintain the level of earnings per share previously recorded by theacquiring company. Existing shareholders’ interest is likewise diluted ifthe company issues new stock at a price below book value. In this cir-cumstance, a dollar invested by a new shareholder purchases a largerpercentage of the company than is represented by a dollar of net worthheld by an old shareholder.
discount rate The interest rate used to equate future value (see) with pres-ent value (see). Also referred to as cost of capital (see).
discounted cash flow A technique for equating future cash flows to a pres-ent sum of money, based on an assumed interest rate. For example,$100 compounded annually at 8% over three years will cumulate to asum of $125.97, ignoring the effect of taxes. This figure can be calcu-lated via the equation
P × (l + r)n = F
where P = Principal value at beginning of period (Present value)r = Interest raten = Number of periodsF = Principal value at end of period (Future value)
In this case, $100 × (1.08)3 = $125.97. (Note that this formula implic-itly assumes reinvestment of cash interest received at the original rate ofinterest throughout the period.)
If $125.97 three years hence is equivalent to $100 today—giventhe assumed discount rate (see) of 8% per annum—then the ratio$100.00/$125.97, or 0.794, can be used to determine the present value

Glossary 351
(see) of any other amount discounted back from the same date and atthe same rate.
By using the same general formula, it is possible to assign a value toan asset, based on a series of cash flows it is expected to generate. Byway of illustration, suppose the right to distribute a particular productis expected to generate cash flow of $5,000 a year for four years, thenexpire, leaving no terminal value. At a discount rate of 15%, the distri-bution rights would be valued at $14,820, derived as follows:
discretionary cash flow Cash flow that remains available to a companyafter it has funded its basic operating requirements. There is no univer-sally accepted, precise definition of discretionary cash flow, but concep-tually it includes funds from operations less required new investment inworking capital and nondiscretionary capital expenditures. The latterfigure is difficult to quantify with precision, but it exceeds the required“maintenance” level required to keep existing plant and equipment ingood working order. Ordinarily, some additional expenditures, whichmay be designated “semidiscretionary,” are necessary to keep a com-pany competitive with respect to capacity, costs, and technology. Onlya portion of the total capital budget, including expansion-oriented out-lays that can be deferred in the event of slower-than-expected growth indemand, can truly be considered discretionary. In a similar vein,mandatory principal repayments of debt, by definition, cannot be re-garded as discretionary. Still, a company with strong cash flow and theassurance, as a practical matter, of being able to refinance its maturingdebt, has considerable freedom in the disposition even of amounts thatwould appear to be earmarked for debt retirement.
diversification In portfolio management, the technique of reducing risk bydividing one’s assets among a number of different securities or types ofinvestments. Applied to corporate strategy, the term refers to participa-tion in several unrelated businesses. The underlying premise is often
Year Expected Cash Flow Discount Factor Present Value
1 $5,000 .870 $ 4,3502 5,000 .756 3,7803 5,000 .658 3,2904 5,000 .572 2,860
Total: $14, 280

352 GLOSSARY
countercyclicality, or the stabilization of earnings over time through thetendency of profits in certain business segments to be rising at timeswhen they are falling in others.
double-entry bookkeeping A system of keeping accounts in which eachentry requires an offsetting entry. For example, a payment to a tradecreditor causes both cash and accounts payable to decline.
Dow Jones Industrial Average A widely followed index of the U.S. stockmarket composed of the common stocks of 30 major industrialcorporations.
EBIT Earnings before deduction of interest expense and income taxes.EBITDA Earnings before deduction of interest expense, income taxes, de-
preciation, and amortization. (Also referred to as EBDIT, an acronymfor “earnings before depreciation, interest, and taxes.”)
economies of scale Reductions in per unit cost that arise from large-volume production. The reductions result in large measure from thespreading of fixed costs (i.e., those that do not vary directly with pro-duction volume) over a larger number of units than is possible for asmaller producer.
economies of scope Reductions in per unit cost that arise from applyingknowledge or technology to related products.
exchangeable In reference to a security, subject to mandatory replacementby another type of security, at the issuer’s option. (See also convertible.)
external growth Revenue growth achieved by a company through acquisi-tion of other companies.
externally generated funds Cash obtained through financing activitiessuch as borrowing or the flotation of equity. (See also internally gener-ated funds.)
factor A financial institution that provides financing to companies by buy-ing accounts receivable at a discount.
FASB Financial Accounting Standards Board (see).Financial Accounting Standards Board (FASB) A rule-making body for the
accounting profession. Its members are appointed by a foundation, themembers of which are selected by the directors of the American Insti-tute of Certified Public Accountants.
financial derivative A financial instrument with a return linked to the per-formance of an underlying asset, such as a bond or a currency.
financial flexibility The ability, achieved through such means as a strongcapital structure and a high degree of liquidity, to continue to invest inmaintaining growth and competitiveness despite business downturnsand other financial strains.

Glossary 353
financial leverage (See leverage (financial).)fixed costs Costs that do not vary with the volume of production. Exam-
ples include rent, interest expense, senior management salaries and, un-less calculated by the units-of-production method, depreciation (see).
fixed-rate debt A debt obligation on which the interest rate remains at astated level until the loan has been liquidated. (Compare floating-ratedebt.)
floating-rate debt A debt obligation on which the interest rate fluctuateswith changes in market rates of interest, according to a specified for-mula. (Compare fixed-rate debt.)
fundamental analysis A form of security analysis aimed at determining astock or bond’s intrinsic value, based on such factors as the issuer’s ex-pected earnings and financial risk. In contrast, technical analysis aimsto predict a security’s future value based on its past price changes.
funding Replacement of short-term debt with long-term debt. Funding in-creases a company’s financial flexibility by reducing the near-term riskof insolvency through inability to roll over or replace maturing debt.
future value The amount to which a known sum of money will accumulateby a specified future date, given a stated rate of interest. For example,$100 compounded annually at 8% over three years will cumulate to asum of $125.97, ignoring the effect of taxes. This figure can be calcu-lated via the formula
P × (1 + r)n
where P = Principal at beginning of periodr = Interest raten = Number of periods
In this case, $100 × (1.08)3 = $125.97. (This formula implicitly as-sumes that cash interest received will be reinvested at the original rateof interest throughout the period.)
(See also discounted cash flow, net present value, and present value.)GAAP Generally Accepted Accounting Principles (see).GDP Gross Domestic Product (see).Generally Accepted Accounting Principles Rules that govern the prepara-
tion of financial statements, based on pronouncements of authoritativeaccounting organizations such as the Financial Accounting StandardsBoard, industry practice, and the accounting literature (including booksand articles).

354 GLOSSARY
goodwill A balance sheet item arising from purchase method (see) ac-counting for a business combination, representing the excess of the pur-chase price over the acquired company’s tangible asset value.
Gross Domestic Product The value of all goods and services that residentsand nonresidents provide in a country.
historical cost accounting An accounting system in which assets arerecorded at their original value (less any applicable depreciation orother impairment of value), notwithstanding that the nominal dollarvalue of the assets may rise through some cause such as inflation or in-creased scarcity. (See also book value.)
hostile takeover An acquisition of a corporation by another corporationor by a group of investors, typically through a tender for outstandingshares, in the face of initial opposition by the acquired corporation’sboard of directors.
internal growth Revenue growth achieved by a company through capitalinvestment in its existing business.
internally generated funds Cash obtained through operations, includingnet income, depreciation, deferred taxes, and reductions in workingcapital. (See also externally generated funds.)
investor-relations officer An individual designated by a corporation tohandle communications with securities analysts.
involuntary inventory accumulation An unintended increase in a com-pany’s inventory levels, resulting from a slowdown in sales that is notoffset by a reduced rate of production.
LBO Leveraged buyout (see).leverage (financial) The use of debt financing in hopes of increasing the
rate of return on equity. In the following example, the unleveragedcompany, with no debt in its capital structure, generates operating in-come of $30.0 million, pays taxes of $10.2 million, and nets $19.8 mil-lion for a return on equity (net income divided by shareholders’ equity)of 13.2%. The leveraged company, with an equivalent amount of oper-ating income, relies on long-term debt (at an interest rate of 12%) forone-third of its capital. Interest expense causes its net income beforetaxes to be lower ($24 million) than the unleveraged company’s ($30million). After taxes, the leveraged company earns less (15.8 million)than the unleveraged company ($19.8 million), but on a smaller equitybase ($100 million vs. $150 million) provides shareholders a higher rateof return ($15.8% vs. 13.2%).
Note, however, that leverage works in reverse as well. In the follow-ing scenario operating income declines by two-thirds (to $10 million) atboth companies. With no interest expense, the unleveraged company

Glossary 355
manages to net $6.6 million for a 4.4% return on equity. The leveragedcompany, obliged to pay out 60% of its operating income in interest ex-pense, suffers a sharper decline in return on equity (to 2.6%). Incurringfinancial leverage increases the risk to equity holders, whose returns be-come more subject to fluctuations. The greater the percentage of thecapital structure that consists of debt, the greater is the potential forsuch fluctuations.
($ Million)
Unleveraged LeveragedCompany Company
Operating income $ 30.0 $ 30.0Interest expense 0.0 6.0
Net income before taxes 30.0 24.0Taxes 10.2 8.2
Net income $ 19.8 $ 15.8
Long-term debt 0 $ 50Shareholders’ equity 150 100
Total capital $150 $150
13.2% 15.8%Net IncomeShareholders’ Equity
($ Million)
Unleveraged LeveragedCompany Company
Operating income $ 10.0 $ 10.0Interest expense 0.0 6.0
Net income before taxes 10.0 4.0Taxes 3.4 1.4
Net income $ 6.6 $ 2.6
Long-term debt $150 $ 50Shareholders’ equity 150 100
Total capital $150 $150
4.4% 2.6%Net IncomeShareholders’ Equity

356 GLOSSARY
leverage (operating) The substitution of fixed costs (see) for variable costs(see) in hopes of increasing return on equity. In the following example,Company A’s cost structure is dominated by variable expenses, ofwhich labor represents a substantial portion. A 5% increase in salesvolume (from 500,000 to 525,000 units) raises the rate of return onshareholders’ equity from 11.0% to 13.7%. Company B, on the otherhand, has installed labor-saving equipment that sharply reduces man-hours per unit of production. Its variable costs are lower than CompanyA’s ($50.00 versus $30.00 per unit), but as a function of its greater de-preciation (see) charges, its fixed costs are higher ($30 million versus$25 million per annum). The benefit of Company B’s higher operatingleverage is that a 5% increase in its unit sales raises its return on share-holders’ equity from 11.0% to 14.7%, a larger boost than Company Areceives from a comparable rise in volume. By the same token, Com-pany B’s return on shareholders’ equity will fall more sharply thanCompany A’s if unit volume at both companies subsequently recedesfrom 525,000 to 500,000 units.
leveraged buyout (LBO) An acquisition of a company or a division, fi-nanced primarily with borrowed funds. Equity investors typically hopeto profit by repaying debt through cash generated by operations (and
Company A Company B
Sales (units) 500,000 525,000 500,000 525,000Price per unit $100.00 $100.00 $100.00 $100.00Fixed costs ($ million) $25.0 $25.0 $30.0 $30.0Variable cost per unit $50.0 $50.0 $30.0 $30.0
($ Million)
Sales $50.0 $52.5 $50.0 $52.5Fixed costs 25.0 25.0 30.0 30.0Variable costs 25.0 26.3 15.0 15.8
Income before taxes 5.0 6.2 5.0 6.7Taxes 1.7 2.1 1.7 2.3
Net income $ 3.3 $ 4.1 $ 3.3 $ 4.4
Shareholders’ equity $30.0 $30.0 $30.0 $30.0
11.0% 13.7% 11.0% 14.7%Net IncomeShareholders’ Equity

Glossary 357
possibly from proceeds of asset sales), thereby increasing the net valueof their stake.
leveraged recapitalization A corporate strategy involving the payment of alarge, debt-financed cash dividend. The strategy is often employed as adefense against an attempted hostile takeover, for two reasons. First, byincreasing the company’s financial leverage (see), the transaction re-duces the potential for a raider to use borrowed funds, lest the post-takeover company become excessively debt-laden. Second, therecapitalization increases the concentration of ownership in the handsof those attempting to retain control.
liquidity The ability of a company to meet its near-term obligations whendue.
macroeconomic Pertaining to the economy as a whole or its major subdi-visions, e.g., the manufacturing sector, the agricultural sector, the gov-ernment. (See also microeconomic.)
market capitalization The aggregate market value of all of a company’soutstanding equity and debt securities. Also used loosely to representthe product of a company’s share price and number of shares outstand-ing. (See also total enterprise value.)
mature With respect to a product, firm, or industry, at a stage of develop-ment at which the rate of sales growth remains positive but no longerexceeds the general growth rate of the economy.
microeconomic Pertaining to a small segment of the economy, e.g., an in-dividual industry, a particular firm. (See also macroeconomic.)
multiple With respect to a common stock, the ratio of the share price toearnings per share. Similarly, the price paid in an acquisition can beviewed as a multiple of the acquired company’s earnings, cash flow, orEBITDA (see).
multivariate In the field of quantitative modeling, having the characteristicof employing more than one explanatory factor.
mutual fund An investment vehicle consisting of a portfolio of securities,shares of which are sold to investors. The firm that organizes the fundcollects a fee for managing the portfolio, while shareholders enjoy a di-versification (see) benefit that would be more costly to obtain via directpurchase of individual securities.
net present value The present value (see) of a stream of future cash in-flows, less the present value of an associated stream of current or futurecash outflows. This calculation is useful for comparing the attractive-ness of alternative investments, as shown in the following example.Both proposed capital projects require an expenditure of $60 millionduring the first year. Project A generates a higher cash flow, without
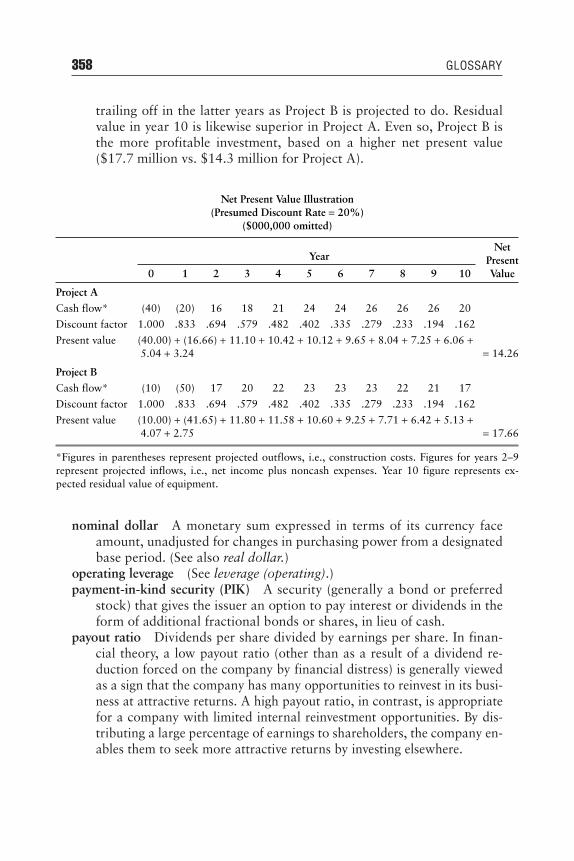
358 GLOSSARY
trailing off in the latter years as Project B is projected to do. Residualvalue in year 10 is likewise superior in Project A. Even so, Project B isthe more profitable investment, based on a higher net present value($17.7 million vs. $14.3 million for Project A).
nominal dollar A monetary sum expressed in terms of its currency faceamount, unadjusted for changes in purchasing power from a designatedbase period. (See also real dollar.)
operating leverage (See leverage (operating).)payment-in-kind security (PIK) A security (generally a bond or preferred
stock) that gives the issuer an option to pay interest or dividends in theform of additional fractional bonds or shares, in lieu of cash.
payout ratio Dividends per share divided by earnings per share. In finan-cial theory, a low payout ratio (other than as a result of a dividend re-duction forced on the company by financial distress) is generally viewedas a sign that the company has many opportunities to reinvest in its busi-ness at attractive returns. A high payout ratio, in contrast, is appropriatefor a company with limited internal reinvestment opportunities. By dis-tributing a large percentage of earnings to shareholders, the company en-ables them to seek more attractive returns by investing elsewhere.
Net Present Value Illustration(Presumed Discount Rate = 20%)
($000,000 omitted)
YearNet
Present0 1 2 3 4 5 6 7 8 9 10 Value
Project A
Cash flow* (40) (20) 16 18 21 24 24 26 26 26 20
Discount factor 1.000 .833 .694 .579 .482 .402 .335 .279 .233 .194 .162
Present value (40.00) + (16.66) + 11.10 + 10.42 + 10.12 + 9.65 + 8.04 + 7.25 + 6.06 +5.04 + 3.24 = 14.26
Project B
Cash flow* (10) (50) 17 20 22 23 23 23 22 21 17
Discount factor 1.000 .833 .694 .579 .482 .402 .335 .279 .233 .194 .162
Present value (10.00) + (41.65) + 11.80 + 11.58 + 10.60 + 9.25 + 7.71 + 6.42 + 5.13 +4.07 + 2.75 = 17.66
*Figures in parentheses represent projected outflows, i.e., construction costs. Figures for years 2–9represent projected inflows, i.e., net income plus noncash expenses. Year 10 figure represents ex-pected residual value of equipment.

Glossary 359
PIK Payment-in-kind security (see).pooling-of-interests method A method of accounting for a business combi-
nation accomplished through an exchange of stock. No goodwill (see)is created in accounting for the transaction, even if the price paid forone of the parties exceeds its tangible asset value. In 2001, the FinancialAccounting Standards Board forbade the further use of pooling-of-interests accounting, leaving the purchase method (see) as the only ac-ceptable approach to business combinations.
portfolio A group of securities. Barring the unlikely circumstance that allsecurities contained in a portfolio produce identical returns in all peri-ods, it generally produces a steadier return than a single security. Thecomparative stability arises from the tendency of declines in the pricesof certain securities to be offset by rises in the prices of others duringthe same period. (See diversification.)
present value The sum that, if compounded at a specified rate of interest,or discount rate (see), will accumulate to a particular value at a statedfuture date. For example: To calculate the present value of $500, fiveyears hence at a discount rate of 7%, solve the equation.
where F = Future valuer = Interest raten = Number of periodsp = Present value
In this case $500/(1.07)5 = $356.49.(See also discounted cash flow, future value, and net present value.)
pro forma Describes a financial statement constructed on the basis ofspecified assumptions. For example, if a company made an acquisitionhalfway through its fiscal year, it might present an income statement in-tended to show what the combined companies’ full-year sales, costs,and net income would have been, assuming that the acquisition hadbeen in effect when the year began.
purchase method A method of accounting for business combinations inwhich goodwill (see) is created if the acquisition price exceeds the tan-gible asset value of the acquired company.
rationalization In reference to a business or an industry, the process ofeliminating excess capacity and other inefficiencies in production.
F
rn
1 +( )

360 GLOSSARY
real dollar A monetary sum expressed in terms of its purchasing-powerequivalent, relative to a designated base period. For example, at the endof the third quarter of 2001, $500 (face amount) had only 56.1% of thepurchasing power that $500 had in the base period 1982–1984. Theerosion reflected price inflation during the intervening years. The realvalue of $500 in September 2001 was therefore $280.50 in 1982–1984dollars. This calculation employs a series of the purchasing power of theconsumer dollar, published by the United States Bureau of Labor Statis-tics. See the Bureau’s Web site, www.bls.gov. (See also nominal dollar.)
reinsurance A transaction whereby one insurance company takes over therisk of a policy originally issued by another company.
reorganization proceedings A procedure under Chapter 11 of the Bank-ruptcy Reform Act that permits a bankrupt company to continue in op-eration, instead of liquidating, while restructuring its liabilities with anaim toward ensuring its future financial viability.
reported earnings A company’s profit or loss for a specified period, asstated in its income statement. The figure may differ from the com-pany’s true economic gain or loss for the period for such reasons as de-layed recognition of items affecting income, changes in accountingpractices, and discrepancies between accruals and actual changes inasset values.
Disparities between reported and economic earnings can also arisefrom certain nuances of inventory accounting. For example, under thelast-in, first-out (LIFO) method, a company’s inventory account may in-clude the historical acquisition costs of goods purchased several yearsearlier and unaffected (for book purposes) by inflation in the interimperiod. To the extent that a surge in sales causes a company to recog-nize the liquidation of older inventories during the current period, rev-enues will reflect post-inflation (i.e., higher) values but expenses willnot. The mismatch will produce unusually wide reported profit marginsin the current period, even though the nominal dollar (see) gains arisingfrom inflation are in reality benefits that accumulated over several pre-ceding periods.
sale-leaseback A transaction in which a company sells an asset and imme-diately leases it back. The lessee thereby obtains cash while retaininguse of the asset. An additional motivation for the transaction may be adifference in the marginal tax rates of the lessee and lessor. The taxshelter provided by depreciation charges on the asset are more valuableto the party paying the higher tax rate.
scale economies (See economies of scale.)SEC Securities and Exchange Commission (see).

Glossary 361
Securities and Exchange Commission (SEC) An agency of the federal gov-ernment that regulates the issuance and trading of securities, the activi-ties of investment companies and investment advisers, and standards forfinancial reporting by securities issuers.
senior debt Borrowings that have preference in liquidation over subordi-nated debt (see). In the event of a bankruptcy, senior lenders’ claimsmust be satisfied before consideration can be given to subordinatedlenders or equity investors.
sensitivity analysis The testing of “what-if” scenarios in financial state-ment analysis. Typically, sensitivity analysis measures the potential im-pact (on earnings, cash flow, etc.) of a change of a stated amount inanother variable (sales, profit margins, etc.). In connection with finan-cial forecasting, sensitivity analysis may be used to gauge the variationin projected figures that will occur if a particular assumption proveseither too optimistic or too pessimistic by a given amount.
SFAS Statement of Financial Accounting Standards. Designation for anumbered series of statements of accounting rules promulgated by theFinancial Accounting Standards Board (see).
shakeout A reduction in the number of competitors (through failures orthrough mergers) that typically occurs as a rapidly growing industry be-gins to mature. Factors that may contribute to a firm’s survival during ashakeout include advantages in raising new capital, economies of scale(see), and superior management.
short interest ratio The ratio between the number of a company’s sharesthat are sold short and remain uncovered and the stock’s average dailytrading volume. A high ratio indicates a widespread expectation thatthe stock’s price will decline.
slack Unutilized productive capability within a company. Although theterm ordinarily connotes inefficiency, management may have a con-scious strategy of maintaining a certain amount of slack. For example,a company may benefit from keeping skilled employees on the payrollduring recessions, when demand can be met with a reduced workforce.The cost savings entailed in laying off the workers may be offset by thecosts of replacing them with equally skilled employees during the nextboom. Another example is a backup trading floor maintained by acompany engaged in trading securities or commodities. The associatedcost may be justified by the potentially devastating loss of business thatcould result in a shutdown of the primary trading floor because of anatural disaster or civil disturbance.
standard error of estimate A measure of the scatter of the observations ina regression analysis. In statistical terms, the standard error of the

362 GLOSSARY
estimate is equivalent to the standard deviation of the vertical devia-tions from the least-squares line.
statement of stockholders’ equity A financial statement that detailschanges in components of stockholders’ equity, including capital stock,paid-in capital, retained earnings, treasury stock, unrealized loss onlong-term investments, and gains and losses on foreign-currency trans-lation. The basic problem addressed by the statement of stockholders’equity is that it may not be possible to reconcile one year’s equity ac-count with the next year’s using only the income statement and state-ment of cash flows. Certain adjustments to equity are included neitherin earnings nor in cash flows from financing activities.
statutory tax rate The percentage of pretax income that would berecorded as income tax if all of a company’s reported income were sub-ject to the corporate tax rate specified by federal law. Disparities be-tween the statutory rate and the effective rate (that which is actuallyrecorded) arise from such reasons as tax credits and differences be-tween U.S. and foreign tax rates.
straight-line method A depreciation method that charges off an equivalentportion of the asset in each period. During inflationary periods,straight-line depreciation may understate the true economic impact ofcapital consumption. That is, as the replacement cost of the asset risesin nominal terms, the dollar amount required to offset wear and tearduring a period grows to exceed a pro rata write-off based on the orig-inal acquisition cost. In these circumstances, accelerated methods of de-preciation, which result in larger amounts being written off in earlierthan in later years, represent more conservative reporting of expenses.
subordinated debt Borrowings that have a lesser preference in liquidationvis-à-vis other, senior, debt (see). In the event of a bankruptcy, subordi-nated lenders’ claims cannot be provided for until senior claims havebeen satisfied.
synergy An increase in profitability arising from a merger or acquisition,relative to the stand-alone profitability of the companies involved.Synergy may result from economies of scale (see) or economies ofscope (see).
total enterprise value The value that a business would fetch if put up forsale, commonly estimated as a multiple of its sales, earnings, orEBITDA (see). (See also market capitalization.)
units-of-production method A depreciation method that is based on theestimated total output of an asset over its entire life. The asset’s cost isdivided by the estimated number of units to be produced. Depreciationfor the period is then calculated by multiplying the cost per unit by the

Glossary 363
number of units produced during the period. The units-of-productionmethod appears, on its face, to match revenues and expenses ratherprecisely. While a piece of equipment sits idle, however, it generates nodepreciation expense—even though its value may be decreasing as aresult of the introduction of technologically more advanced, lower-costequipment by competing firms. In this light, adoption of the units-of-production method by a firm that formerly employed a straight-line oraccelerated method should generally be viewed as a switch to a moreliberal accounting practice.
variable costs Costs that increase as the volume of production rises. Ex-amples include materials, fuel, power, and wages.
working capital Current assets minus current liabilities. Working capital iscommonly employed as an indicator of liquidity, but care must be takenin interpreting the number. The balance sheets of some corporationsthat are strong credits by all other methods ordinarily have little (or evennegative) working capital. These companies manage inventories closelyand extract generous terms from creditors, including long payment peri-ods, which result in chronically high trade payable balances. In suchcases, no threat of illiquidity is implied by the fact that more liabilitiesthan assets will be liquidated during the current operating cycle.


365
notes
Chapter 1 The Adversial Nature of F inancial Reporting
1. Howard M. Schilit, Financial Shenanigans: How to Detect Accounting Gim-micks and Fraud in Financial Reports (New York: McGraw Hill, 1993), p. 153.
2. Although this book focuses on for-profit companies, nonprofit companies andgovernmental entities also produce financial statements. Readers should notpresume that those entities invariably eschew reporting trickery. Like their for-profit counterparts, nonprofit organizations seek to raise capital. They have in-centives to portray their financial positions in as favorable a light as possible,when trying to borrow or to demonstrate their financial viability to providers ofgrants. On the other hand, nonprofits sometimes strive to make themselves ap-pear less flush than they really are, to impress on donors the urgency of theirappeal for funds. Governmental units sometimes resort to disingenuous report-ing to avoid political fallout from the consequences of unsound fiscal policies.Anticapitalist ideologues cannot truthfully contend that the profit motive aloneleads to devious financial reporting.
3. Floyd Norris, “Auto Lender’s Finance Chief Disappears; Profits Are Cut,” NewYork Times, January 30, 1997, pp. D1, D5.
4. “Mercury Finance Company Announces Discovery of Accounting Irregulari-ties,” PRNewswire, January 29, 1997.
5. Jeff Bailey, “Mercury Finance’s Controller Denies He Inflated Firm’s ProfitStatements,” Wall Street Journal, January 31, 1997, pp. A3, A6.
6. Norris, “Auto Lender’s Finance Chief,” p. D5.7. Arthur Goldgaber, “Life after Mercury,” Financial World, May 20, 1997,
pp. 40–44.8. Nick Wingfield and Paul Beckett, “MicroStrategy, Results Restated, Is Macro-
Loser,” Wall Street Journal, March 21, 2000, pp. B1, B4.9. Floyd Norris, “A Hard Fall as Highflier Revises Figures,” New York Times,
March 21, 2000, pp. C1, C16.10. Floyd Norris, “Failed Audit: The Humiliation of Pricewaterhouse Coopers,”
New York Times, March 24, 2000, p. C1.11. Alan Abelson, “Up & Down Wall Street: Way to Go,” Barron’s, July 19, 1999,
p. 5. The $59 million purchase price that Lernout & Hauspie paid for BrusselsTranslation Group was neither a revenue nor an expense, but an exchange ofone asset (cash) for another (BTG’s stock).

366 NOTES
12. John Carreyrou and Mark Maremont, “Lernout Files for Bankruptcy Protec-tion,” Wall Street Journal, November 30, 2000, pp. A3, A6.
13. Randall Smith, Steven Lipin, and Amal Kumar Naj, “Managing Profits: HowGeneral Electric Damps Fluctuations in Its Annual Earnings,” Wall Street Jour-nal, November 3, 1994, pp. A1, A6.
14. In financial statements prepared for tax purposes, the corporation minimizes itstaxable income by writing off fixed assets over the shortest allowable period.This is both a lawful and a customary practice. Companies are permitted toprepare separate sets of accounts for tax and financial reporting purposes. Inthe latter, they can make choices on discretionary accounting items that resultin lower profits than shown in the former.
15. Senior executives typically own stock in their corporations, so to some extentthey penalize their wealth by undercutting quality of earnings. Unless theirstock holdings are very large, however, the direct benefits of increased bonusesmore than fully offset the impact of reduced valuations on their shares.
16. Richard Zeckhauser, Jayendu Patel, Francois Degeorge, and John Pratt, “Re-ported and Predicted Earnings: An Empirical Investigation Using Prospect The-ory.” Project for David Dreman Foundation (1994).
17. Ibid.18. As December 31, 1999, approached, economic pundits warned of massive dis-
locations arising from a programming quirk whereby many computer systemswould interpret the following date to be January 1, 1900. Many corporationsattributed sluggish sales during the latter part of 1999 to customers’ unwilling-ness to make major commitments in advance of impending chaos, fears ofwhich proved to be greatly overstated.
19. See, for example, Michael C. Jensen and William H. Meckling, “Theory of theFirm: Managerial Behavior, Agency Costs and Ownership Structure,” Journalof Financial Economics (1976:3), pp. 305–60.
Chapter 2 The Balance Sheet1. For the record, the accounting profession defines assets as “probable future
economic benefits obtained or controlled by a particular entity as a result ofpast transactions or events” (Statement of Financial Accounting Concepts No.6, Financial Accounting Standards Board, Stamford, Connecticut, December1985, p. 10).
2. Barry Libert and Barbara Sayre Casey, “Accounting for Value” (letter to editor),Barron’s, December 11, 2000, p. 65.
3. Jonathan R. Laing, “The New Math: Why an Accounting Guru Wants to ShakeUp Some Basic Tenets of His Profession,” Barron’s, November 20, 2000,pp. 31–36.
4. Barnaby J. Feder, “JDS Uniphase Will Write Down $44.8 Billion in Assets,”New York Times, July 27, 2001, pp. C1–C2.

Notes 367
5. Advances in Behavioral Finance, Richard H. Thaler, ed. (New York, RussellSage Foundation, 1993).
Chapter 3 The Income Statement1. Strictly speaking, Boston Beer has no direct exposure to interest rate fluctua-
tions. Like any other company, the brewer’s earnings are sensitive to swings inthe general level of economic activity, which are in turn sensitive to changes inthe level of interest rates. As it happens, demand for beer (and for consumernondurables generally) is less sensitive to variations in the level of economic ac-tivity than demand for many other types of goods.
2. There are a few exceptions to this generalization. Tax collectors, for example,examine a company’s income statement to determine its tax liability. For them,next year is irrelevant because they can assess a tax only on what has alreadybeen earned.
3. Financial Accounting Standards: Original Pronouncements, as of June 1, 1980,Financial Accounting Standards Board, Stamford, Connecticut, pp. 371–373.The APB opinion covering the issue became effective on October 1, 1973.
4. Floyd Norris, “No Special Accounting Breaks for Recent Corporate Setbacks,”New York Times, October 2, 2001, p. C9.
5. Source: J. Douglas Hanna, University of Chicago. Cited in Nelson, “P&G” (n. 6).6. Emily Nelson, “P&G’s One-Time Charges Make Critics Look Twice at Earn-
ings,” Wall Street Journal, April 4, 2001, pp. C1–C2.7. Roger Lowenstein, “Sipping the Fizz in Coca-Cola’s Profit,” Wall Street Journal,
May 1, 1997, p. C1.8. Patrick McGeehan, “Gabelli Asset Management Earnings Release Accentuates
the Positive, Bottom Line Aside,” Wall Street Journal, May 25, 1999, p. C4.9. Bill Alpert, “The Numbers Game: Reporting of Pro Forma Earnings Is Rising,
and So Is the Debate about It,” Barron’s, September 11, 2000, pp. 22, 24.10. Edward Wyatt, “Putting on a Happier Profit Face,” New York Times, May 16,
1999, Sec.3, p. 6.11. Elizabeth MacDonald, “Varied Profit Reports by Firms Create Confusion,”
Wall Street Journal, August 24, 1999, p. C1.12. Randall Smith, with Henry Sender, Gasten Ceron, and Greg Ip, “Bids and Of-
fers,” Wall Street Journal, November 2, 2001, p. C13.13. McGeehan, “Gabelli Asset Management,” p. C4.14. Steve Liesman and Jonathan Weil, “Two Profit Calculations for S&P 500 Dif-
fer,” Wall Street Journal, August 24, 2001, pp. A2, A4. As the authors explain,the year-over-year declines were preliminary figures, subject to adjustment dur-ing the third quarter.
15. Alpert, “The Numbers Game,” p. 24.16. Gretchen Morgenson, “In an Effort to Placate Investors, Some Results too
Good to Be True,” New York Times, December 21, 1999, p. A1.

368 NOTES
17. Messod D. Beneish, “The Detection of Earnings Manipulation,” Financial An-alysts Journal, September/October 1999, pp. 24–36.
Chapter 4 The Statement of Cash Flows1. Exhibit 4.2 and the accompanying narrative simplify the concept of cash flow
to introduce it to the reader. Only the two major sources of cash, net incomeand depreciation, appear here, leaving to subsequent exhibits refinements suchas deferred taxes, which arise from timing differences between the recognitionand payment of taxes. Similarly, the uses of cash exclude a working capital fac-tor, which is discussed in connection with Exhibit 4.9.
2. For a detailed rationale for the use of the EBITDA multiple to evaluate a firm,see “Valuation via Restructuring Potential” in Chapter 14. See also “The Ap-plications and Limitations of EBITDA” in Chapter 8.
3. In large measure, the high failure rate of the late-1990s dot-com public com-panies is attributable to premature IPOs. During less exuberant stock markets,new ventures go through longer gestation periods before going public. A largeproportion of them fail while still in the hands of the venture capitalists, ratherthan under the glare of the financial media.
4. Amortization of debt discount arises from bonds issued at a discount to facevalue. Buyers of such a security receive a portion of their interest (all of it, in thecase of zero-coupon bonds) through price appreciation over the life of thebond, rather than in the form of semiannual cash payments. The issuer recog-nizes the noncash interest expense in annual installments between issuance andmaturity, rather than in a lump sum at maturity.
5. James Bandler and Mitchell Pacelle, “Polaroid Is Using Chapter 11 to Seek aBuyer,” Wall Street Journal, October 15, 2001, p. B9.
6. Claudia H. Deutsch, “Market Place: For Polaroid, the Bad News Seems to Bethe Only News,” New York Times, October 4, 2001, p. C7.
7. Michael C. Jensen, “The Free Cash Flow Theory of Takeovers: A Financial Per-spective on Mergers and Acquisitions and the Economy,” in The Merger Boom,Proceedings of a Conference Held in October 1978, edited by Lynn E. Browneand Eric S. Rosengren, Federal Reserve Bank of Boston, pp. 102–37. This arti-cle provides the basis for the synopsis of the free cash flow argument describedhere, as well as the definition quoted.
8. Ibid.
Chapter 5 What Is Prof it?1. John Francis Fowler, Jr., Introduction to Wall Street: A Practical Guide Book for
the Investor or Speculator (New York: Harper & Brothers Publishers, 1930),p. 76.
2. This was probably even truer in 1930 than today, for it was only with the pas-sage of the Securities Act of 1933 that it became a requirement for most United

Notes 369
States public companies to have their financial statements audited by indepen-dent public accountants. Even then, financial reporting rules remained fairlyloose while the federal government and accounting profession wrestled with thequestion of how best to establish standards.
3. Ninotchka: The MGM Library of Film Scripts (New York: Viking Press, 1972),p. 13.
Chapter 6 Revenue Recognit ion1. David Bank, “Informix Reveals More Severe Accounting Errors,” Wall Street
Journal, September 23, 1997, p. B10.2. Don Clark, “Informix Hurt by Results, Resignation; Accounting, Sales Strategy
Play Rose,” Wall Street Journal Europe, May 5, 1997, p. 12.3. Mark Boslet, “Revenue Recognition Violations behind Informix Restatement,”
Dow Jones News Service, August 7, 1997.4. Bank, “Informix Reveals,” p. B10.5. Informix Corporation, Form 10-K: Annual Report for the Fiscal Year Ended
December 13, 1997, Disclosure, p. 110.6. Michael Schroeder, “Informix Settles Allegations by SEC of Accounting Fraud
Tied to Deficits,” Wall Street Journal, January 12, 2000, p. B6.7. Informix Corporation, Form 10-K: Annual Report for the Fiscal Year Ended
December 31, 1999, Disclosure, p. 58.8. Tom Steinert-Threlkeld, “KnowledgeWare Stock Decline Imperils Sale to Ster-
ling,” The Dallas Morning News, August 2, 1994, p. 1D.9. Melinda-Carol Ballou, “Sterling Attempts KnowledgeWare Rescue,” Computer-
world, August 8, 1994, p. 32.10. Alison Eastwood, “KnowledgeWare Acquisition Could Benefit Canadian User
Base; Company to Be Bought by Sterling Software, Inc.,” Computing Canada,August 17, 1994, p. 1.
11. Mary Welch, “KnowledgeWare Retries: Sterling Reduces Offer for StrugglingSoftware Business,” Advertising Age, September 26, 1994, p. 28.
12. Bill Husted, “KnowledgeWare Okays Merger with Sterling,” Atlanta Constitu-tion, December 1, 1994, sec. F, p. 3.
13. Floyd Norris, “SEC Charges 68 Companies and Individuals with AccountingFraud,” New York Times, September 29, 1999, p. C2.
14. Liz Skinner, “Former NFL Star Tarkenton among 68 Charged by SEC,”Bloomberg News, September 28, 1999.
15. Steinert-Threlkeld, “KnowledgeWare Stock Decline,” p. 1D.16. The account of Kendall Square’s revenue recognition controversies draws on the
following articles: Dorfman, John R., and William M. Bulkeley, “Supercom-puter Maker Kendall Square’s Effort to Crack Business Market Has Some Skep-tics,” Wall Street Journal (October 11, 1993), p. C2; Gallese, Liz Roman,“Kendall Square Fires Founder Burkhardt, Two Demoted Executives,”Bloomberg News (October 26, 1993); “Kendall Square Closes Down 32%,”

370 NOTES
Bloomberg Business News (October 29, 1993); Zielenziger, David, “KendallSquare Drops 21% after Auditors Withdraw Backing,” Bloomberg News, (No-vember 29, 1993).
17. Chip Cummins, “Wal-Mart’s Net Income Increases 28%, but AccountingChange Worries Investors,” Wall Street Journal, August 10, 2000, p. A6.
18. Heather Landy, “Wal-Mart 2nd-Quarter Net to Miss Forecasts,” Bloomberg,August 9, 2000.
19. Linda Sandler, “Bally Total Fitness’s Accounting Procedures Are Getting SomeSkeptical Investors Exercised,” Wall Street Journal, August 26, 1998, p. C2.
20. Eric Matejevich, “Bally Total Fitness: Flexing Its Muscles; Buy Reiterated,”Merrill Lynch HYLights, September 2, 1999, pp. 18–24.
21. Sandler, “Bally,” p. C2.22. “BJ’s Wholesale Club, Inc. Says Membership Income Accounting Complies
with All Applicable Standards,” Business Wire, September 3, 1998.23. Elizabeth MacDonald, Laura Johannes, and Emily Nelson, “Discount-Club Re-
tailers Shift Accounting,” Wall Street Journal, October 28, 1998, p. B4.24. “MemberWorks Reports Record Fiscal 2000 Fourth Quarter Financial Re-
sults,” Business Wire, July 28, 2000.25. Elizabeth MacDonald, “Are Those Revenues for Real?” Forbes, May 29, 2000,
pp. 108–110. The author credits Bear Stearns & Co. with identifying 120 com-panies that announced they had changed or would change their revenue recog-nition policies in recent months.
26. “Sequoia, Ex-Officials Settle SEC Charges of Inflating Results,” Wall StreetJournal, February 17, 1996, p. B6.
27. Mark Maremont, “Numbers Game at Bausch & Lomb?” Business Week, De-cember 19, 1994, pp. 108–110.
28. Maremont, “Numbers Game,” p. 109.29. “Bausch & Lomb Responds to Article in Business Week Magazine,” Business
Wire, December 9, 1994. Note that the issue of Business Week in which MarkMaremont’s Bausch & Lomb article appeared was published several days be-fore the newsstand date of December 19, 1994.
30. “Bausch & Lomb Announces Results for 1994 Fourth Quarter and Full YearEarnings Impacted by Charge to Write Off Goodwill in Oral Care Business,”Business Wire, January 25, 1995.
31. Ben Dobbin, “Bausch & Lomb Posts $3.36 Million Loss, Restates Past Earn-ings,” Associated Press, January 24, 1996.
32. Louis Hau, “Bausch & Lomb CEO Resignation Blamed on Poor Earnings,”Dow Jones News, December 13, 1995.
33. “Panel at Bausch & Lomb Releases Results of Probe,” Wall Street Journal, April24, 1996, p. B5.
34. Reed Abelson, “Not Quite the Last Word: Gary Lynch, Defender of Com-panies, Has His Critics,” New York Times, September 3, 1996, p. D1.
35. “Bausch & Lomb Responds.”36. Joseph B. White, “GM Shifts to Reverse on December Data for Cadillac Sales,”
Wall Street Journal, May 6, 1999, pp. A3, A6.

Notes 371
37. Melody Peterson, “S.E.C. Charges Grace and 6 Former Executives with Fraud,”New York Times, December 23, 1998, pp. C1, C6.
38. Ann Davis, “SEC Claims Profit ‘Management’ by Grace,” Wall Street Journal,April 7, 1999, p. C1, C20.
39. Davis, “SEC Case,” p. C20.40. Ibid.41. Peter Ramjug, “W.R. Grace Settles SEC Income Manipulation Case,” Reuters,
June 30, 1999.42. Michael C. Jensen, “Why Pay People to Lie?” Wall Street Journal, January 8,
2001, p. A32.43. Elizabeth MacDonald and Daniel Kruger, “Aiding and Abetting,” Forbes,
April 2, 2001, pp. 82–84.44. MacDonald and Kruger, “Aiding,” p. 84.45. Davis, “SEC Case,” p. C1.46. Lipin, Steven, “Citicorp Unit’s Top Officials Are Dismissed.” Wall Street Jour-
nal (November 11, 1991), p. A4.47. “Cincinnati Milacron Overstated Earnings by $300,000 for Half,” Wall Street
Journal (August 4, 1993), p. C9.48. “Net of First Financial Management Corp. Restated for 3 Periods,” Wall Street
Journal (December 30, 1991), p. B7.49. The account of T2 Medical is drawn from the following articles: Krensavage, Mike,
“T2 Medical 3rd-Quarter Net Falls 40%; Company Restates 1st Half,”Bloomberg News (August 23, 1993); Pauly, David, “Ways of Wall Street: T2 Med-ical’s Numbers Aren’t Right,” Bloomberg News (August 13, 1993); Quinson, Tim,“T2 Medical Says Management Group May Make Buyout Offer,” BloombergNews (May 25, 1993); “T2 Medical Net Fell 40% in 3rd Period: Company Re-states Profit for First Half,” New York Times (August 24, 1993), p. B4.
Chapter 7 Expense Recognit ion1. Gary Samuels, “What Profits?” Forbes, October 24, 1994, p. 74.2. “Prodigy Management to Unveil Buyout Plan,” Financial Post, May 9, 1996,
p. 14. (Originally reported by Bloomberg News.)3. Roger Lowenstein, “Did AOL Succeed in Spinning the Street?” Wall Street Jour-
nal, November 7, 1996, p. C1.4. Floyd Norris, “AOL Pays Fine to Settle a Charge That It Inflated Profits,” New
York Times, May 16, 2000, p. C6.5. David S. Hilzenrath and Jill Dutt, “Looking for the AOL Numbers That
Count,” Washington Post, February 23, 1997, pp. H1, H7.6. Linda Sandler, “America Online’s Fancy Accounting Methods Once Again Are
Raising Red Flags for Some,” Wall Street Journal, June 3, 1998, p. C4.7. Jon G. Auerbach, “IBM’s Accounting Method Faces Scrutiny,” Wall Street Jour-
nal, November 24, 1999, pp. C1-C2.8. Auerbach, “IBM’s Accounting,” p. C2.9. Ibid.

372 NOTES
10. “Wickes PLC Discovers Accounting Problems; ’95 Profit Overstated,” DowJones and Company, June 25, 1996.
11. Nigel Cope, “Accounting Problems Ravage Wickes,” The Independent (Lon-don), June 26, 1996, p. 17.
12. Paul Farrelly, “ ‘Dirty Tricks’ at Wickes; Internal Inquiry Looks at Sweetbaum’sManagement,” The Independent (London), August 4, 1996, p. B3.
13. Andrew Sawers, “SFO Puts FDS in the Dock over Wickes ‘Pyramid Buying’Scandal,” Financial Director, August 1, 1999, p. 8.
14. Edward Orlebar, “Wickes Says Profit Overstated by 51 Million Pounds,”Bloomberg, October 16, 2001.
15. Nigel Cope, “Senior Wickes Management Was Aware of Bogus Profits 6Months before Disclosure,” The Independent (London), October 17, 1996,p. 22.
16. “Wickes PLC Discovers Accounting Problems; ’95 Profit Overstated,” DowJones and Company, June 25, 1996.
17. Ron Winslow and Scot J. Paltrow, “At Oxford Health, Financial ‘Controls’Were out of Control,” Wall Street Journal, April 29, 1998, pp. A1, A14.
18. Ron Winslow, “A Few Securities Analysts Spotted Problems at Oxford HealthPlans,” Wall Street Journal, April 29, 1998, p. A14.
Chapter 8 The Appl icat ions and Limitat ions of EBITDA
1. Failures by leveraged buyouts largely accounted for the escalation in the defaultrate on speculative grade bond issuers, as reported by Moody’s Investors Ser-vice, from 3.5% in 1988 to a peak of 10.5% in 1991.
2. William H. Beaver, “Financial Ratios as Predictors of Failure,” Journal of Ac-counting Research (Supplement 1966), pp. 71–111.
3. The development of this tradition is more fully explored in Martin S. Fridson,“EBITDA Is Not King,” Journal of Financial Statement Analysis, Spring 1998,pp. 59–62.
4. Edward I. Altman, “Financial Ratios, Discriminant Analysis, and the Predictionof Corporate Bankruptcy,” Journal of Finance, September 1968, pp. 589–609.
5. Richard Bernstein, “An Analysis of Low EV/EBITDA,” Merrill Lynch & Co.,September 4, 2001.
6. Defined as Equity Market Capitalization + Long-Term Debt + Short-TermDebt + Preferred Stock + Minority Interest − (Cash + Cash Equivalents).
Chapter 9 The Rel iabi l i ty of Disclosure and Audits1. James Bandler, “Computer Associates Says Error Boosted Annual Earnings,”
Wall Street Journal, May 7, 2001, p. B9.2. Jacqueline Doherty, “Fuzzy Numbers from Mr. Trump,” Barron’s, November 1,
1999, p. MW16.

Notes 373
3. “Trump Hotels & Casino Resorts Third Quarter Results,” Business Wire, Oc-tober 25, 1999.
4. Christina Binkley, “Trump Hotels Failed to Disclose Gain, So Firm Appeared toBeat Estimates,” Wall Street Journal, November 8, 1999, p. B12.
5. Binkley, “Trump Hotels,” p. B12.6. Doherty, “Fuzzy Numbers,” p. MW16.7. Steve Lohr, “Trump Hotels Settles Case Accusing It of Misleading Investors,”
New York Times, January 17, 2002, p. C4.8. Adam Steinhauer, “Park Place CEO Goldberg Is out of Hospital,” Bloomberg
News, July 7, 2001.9. Jeannine DeFoe, “Park Place Taps Hilton Exec to Succeed Goldberg,” Bloom-
berg News, October 23, 2000.10. Shawn Tully, “The New King of Casinos,” Fortune, September 18, 2000, p. 156.11. Judy DeHaven, “What Now for Park Place?” The Star-Ledger, October 20,
2000, p. 53.12. John A. Byrne, “Chainsaw,” Business Week, October 18, 1999, pp. 128–149.13. John A. Byrne, “How Al Dunlap Self-Destructed,” Business Week, July 6,
1998, pp. 58–65.14. Jonathan R. Laing, “SEC vs. Chainsaw Al,” Barron’s, May 21, 2001, p. 13.15. “. . . And Take the Chainsaw with You!” Barron’s, June 22, 1998, p. 13.16. Jonathan R. Laing, “Dangerous Games: Did ‘Chainsaw Al’ Manufacture Sun-
beam’s Earnings Last Year?” Barron’s, June 8, 1998, p. 17.17. Laing, “Dangerous Games,” p. 17.18. Martha Brannigan, “Sunbeam Slashes Its 1997 Earnings in Restatement,” Wall
Street Journal, October 21, 1998, p. B6.19. Byrne, “Chainsaw,” p. 142.20. Jonathan R. Laing, “High Noon at Sunbeam,” Barron’s, June 16, 1997, p. 29.21. Floyd Norris, “They Noticed the Fraud but Figured It Was Not Important,”
New York Times, May 18, 2001, p. C1.22. Floyd Norris, “An Executive’s Missing Years: Papering Over Past Problems,”
New York Times, July 16, 2001, p. A1.23. Stephanie Strom, “Woolworth’s Treasurer Blew Whistle,” New York Times,
May 20, 1994, p. D4.24. Patrick M. Reilly, “Woolworth Executives Faulted in Probe, but Lavin Rein-
stated as Chief Executive,” Wall Street Journal, May 19, 1994, pp. A3, A6.25. Floyd Norris, “Sometimes, Safeguards Protect Nobody,” New York Times,
March 22, 1998, Sec. 3, p. 1.26. Elizabeth MacDonald, “Auditors Miss a Fraud and SEC Tries to Put Them out
of Business,” Wall Street Journal, November 6, 2000, pp. A1, A8.27. Jeanne Patterson and Nell Minow, “Blame Directors for Accounting Practices,
Managing Earnings,” Pensions & Investments, May 28, 2001, p. 12.
Chapter 10 Mergers-and-Acquisit ions Accounting1. Reed Abelson, “Market Place: A Candidate Weighs in on an Accounting Rule
Change,” New York Times, October 17, 2000, p. C16.

374 NOTES
2. See Abraham J. Briloff, “Pooling and Fooling: A Critic Draws a Bead on Cisco’sAccounting Policies,” Barron’s, October 23, 2000, pp. 26–29.
3. Greg Hitt, “Cisco’s Chambers Revs Up Political-Contribution Engine,” WallStreet Journal, June 8, 2000, p. A26.
4. Jonathan Weil, “FASB Backs Down on Goodwill-Accounting Rules,” WallStreet Journal, December 7, 2000, pp. A1, A6.
5. Jonathan Weil, “Goodwill Hunting: Accounting Change May Lift Profits, butStock Prices May Not Follow Suit,” Wall Street Journal, January 25, 2001,pp. C1–C2.
6. Michael Davis, “Roiling the Waters: Why the Case for Pooling-of-Interests Ac-counting Is All Wet,” Barron’s, October 23, 2000, p. 73.
7. Bill Alpert, “The Numbers Game,” Barron’s, September 11, 2000, pp. 22, 24.8. Floyd Norris, “At Tyco, Accounting ‘Baths’ Begin before the Deals Close,” New
York Times, October 29, 1999, p. C1.9. Thatcher Thompson, “Navigant: Downgrading NCI Shares,” Merrill Lynch &
Co. Research Comment, November 5, 1999.10. Barry Henderson, “Number Theory: Navigant’s Growth Rate May Not Be
What It Seems,” Barron’s, October 25, 1999, p. 24.11. Barry Henderson, “Follow the Money,” Barron’s, November 29, 1999, pp. 15–17.12. James P. Miller, “Navigant CEO Resigns, Two Officials Are Fired over Stock-
Purchase Deals,” Wall Street Journal, November 23, 1999, p. A4.13. A month later, when Navigant announced that it was not for sale, the stock re-
ceded to $41.44.
Chapter 11 Profits in Pensions1. Gretchen Morgenson noted this contrast between the 1999 IBM and GE annual
reports in “What’s Hiding in Big Blue’s Small Print,” New York Times, June 4,2000, sec. 3, p. 1.
2. General Electric 1999 Annual Report, p. 42.3. Pat McConnell, Janet Pegg, and David Zion, “Retirement Benefits Impact Op-
erating Income,” Bear Stearns & Co. September 17, 1999, p. 55.4. Vineeta Anand, “SEC Tells Companies to Explain Earnings’ Origin,” Pensions
& Investments, December 25, 2000, pp. 4, 43.
Chapter 12 Forecasting F inancial Statements1. A less restrictive type of covenant merely prohibits incurrence of new debt or
payment of dividends that would cause financial measures to deteriorate belowa targeted level. No violation occurs if, for example, net worth declines as a re-sult of operating losses.
2. Cabot’s chemical operations sold $20 million of products to the LNG andCMC units during fiscal 1999. In preparing a consolidated statement for

Notes 375
Cabot, these intercompany sales were eliminated, in accordance with GAAP. Ifthe accounting rules did not require such elimination, a multidivisional com-pany could create the illusion of dramatic increases in sales and earnings bytrading goods back and forth among its various business units. Taking moneyout of one pocket and putting it into another would not represent a wealth in-crease (income) for the combined enterprise.
3. Gretchen Morgenson, “Time to Look at Stock Options’ Real Cost,” New YorkTimes, October 21, 2001, Sec. 3, p. 1.
Chapter 13 Credit Analysis1. In practice, the United States Bankruptcy Code encourages companies to reor-
ganize, rather than simply liquidate, if they become insolvent. Typically, a reor-ganization results in settlement of creditors’ claims via distribution of securitiesof a firm that has been rehabilitated through forgiveness of a portion of its debt.Determination of the value of securities awarded to each class of creditor is re-lated to asset protection, however, so the analysis that follows applies equally toreorganization and liquidation.
2. The comments on preferred stock in this paragraph also apply generally to pref-erence stock, which is similar to preferred stock in form but junior to it in thecapital structure.
3. In this and subsequent definitions of total capital, minority interest is included.This item should be viewed as equity in leverage calculations because it involvesno contractual payment and ranks junior to debt.
4. Nick Fielding, Richard Thomson, and Larry Black, “Undisclosed Debt WorriesHang over O&Y,” The Independent, May 10, 1992, Business on Sunday Sec-tion, p. 1.
5. All quotations in the discussion of Viacom, except where otherwise noted,are from Martin S. Fridson, “Crossover Dreams versus Crossover Reality,”This Week in High Yield, published by Merrill Lynch & Co., October 4,1996, pp. 1–8.
6. Technically speaking, the effective tax rate is somewhat manageable, eventhough the statutory rate is not. It is nevertheless useful to calculate the operat-ing margin separately from the pretax margin, to measure management’s oper-ating prowess separately from its financial acumen.
7. See Edward I. Altman, Robert G. Haldeman, and Paul Narayanan, “ZetaAnalysis: A New Model to Identify Bankruptcy Risk of Corporations,” Journalof Banking and Finance, June 1977, pp. 29–54.
8. See, for example, David T. Hamilton, Greg Gupton, and Alexandra Berthault,Default and Recovery Rates of Corporate Bond Issuers: 2000, Moody’s In-vestors Service, February 2001. The tables in this report relating ratings to mul-tiyear, cumulative default rates show just one small discrepancy. According tothe statistics, companies rated AA are more prone to default within one yearthan companies rated A, an aberration undoubtedly attributable to the tiny

376 NOTES
sample of companies that have ever fallen from such high ratings to defaultwithin the space of a year.
9. Altman, Haldeman, and Narayanan set the Zeta model’s cutoff score (the levelat which a loan request is rejected on grounds of excessive default risk) with anexplicit goal of achieving the optimal tradeoff between the costs of makingloans that default and rejecting loans that do not default.
10. The 2000 Bankruptcy Yearbook & Almanac, Christopher M. McHugh, ed.(Boston: New Generation Research, Inc., 2000), pp. 187–190.
Chapter 14 Equity Analysis1. Dividends, unlike interest payments on debt, are payable at the discretion of the
board of directors, rather than in fulfillment of a contractual obligation. Theyare consequently subject to greater variability—through reduction, increase, orsuspension—than bond coupons or scheduled principal repayments.
2. Bethany McLean, “Hocus-Pocus: How IBM Grew 27% a Year,” Fortune, June26, 2000, p. 165.
3. The notion that a company can increase its market capitalization by boostingits financial leverage appears to fly in the face of a fundamental tenet of modernfinance. Nobel economics laureates Franco Modigliani and Merton Millerdemonstrated that under certain critical assumptions, a company’s stock mar-ket value was insensitive to the proportions of debt and equity in its capitalstructure. Modigliani and Miller followed up on this pioneering work, however,by exploring what happened when the assumptions were relaxed to reflect real-world conditions. In particular, they and subsequent researchers found that thecompany’s stock market value could in fact rise as a result of boosting financialleverage to take fuller advantage of the tax shield provided by debt. Interest onborrowings is a tax-deductible expense, whereas dividends on stock are not.
4. Note, however, the uncertainties associated with reserve valuations, discussedin Chapter 2 under the heading “The Value Problem.”

377
Accelerate (definition), 347Accounting, 193–200
in mergers and acquisitions,193–200
pooling-of-interests, 193,194–197, 200
profits, 117–118purchase, 194–195, 197, 200
Accounting Principle Board (APB)extraordinary item rules, 60
Accounting Principle Board (APB)(definition), 347
Accounting profits, 117–118Accounting rules gimmicks
aggressive revenue recognition,56
diseretionary accountingdecisions, 56
Accrual accounting (definition),347
Acquisition dates, 198Acquisitions, 238–244
goodwill, 239–244reporting employee stock
options, 244Advance PCS, 261–265
debt service projection, 264forecast assumptions, 263historical and projected financial
data, 261–262services provided, 265
Advertisingnew rules for direct mailers,
153–156Air Products & Chemicals, 46Alberto-Culver A, 324All Star Café, 183–185Altima, 239–244Altman, Edward I., 175Altman’s Z-Score, 175Amazon.com, 65Amerada Hess, 305America Online (AOL), 153–156
investor skepticism of, 154new accounting method of,
153–154and reduced information flow,
155settlement of SEC charges by,
155American Can, 186American Greetings, 102American Institute of Certified
Public Accountants, 7, 153SOP 91–1, 128SOP 97–2, 128SOP 98–4, 128
Amortization, 57of goodwill, 194, 197, 200of net deferred gains and losses
on pension portfolios, 204
index

378 INDEX
Amortization (Continued)of prior employee service costs,
204of the transition amount in
pension funds, 204Anderson, Anne, 162Anderson & Strudwick, 7Anheuser-Busch, 52, 53, 54Annual earnings formula, 289ANS Communications, 156Armstrong World Industries, 19Arthur Andersen, 29, 188Asset protection, 270Atlantic City casino, 182
bonds, 185Atlantis Investment Company, 1
62AT&T, 156Auditor-certified compliance with
GAAP, 127Average days of receivables, 291Avon Products, 324
Bait-and-switch technique, 277Balance sheet, 29–48
drawing conclusions, 48effects of stock price on net
worth, 34intangible assets, 34projected, 223–224shortcomings, 29
Balance sheet ratios, 268–271asset protection, 270capital adequacy, 271current ratio, 268debt-equity ratio, 271quick ratio, 270total-debt to total-capital ratio,
271working capital, 270
Balderston, William III, 145
Bally Total Fitness, 137–138accounting, 138fee reserves, 138
Bankruptcy Reform Act of 1978,348
Barron’s, 187–188, 199Baruch Lev, 30Basis Information Technologies,
152Baush & Lomb (B&L), 142–145
channel-loading by, 142–143revenue revisions, 144SEC staff inquiry, 144
Bear, Stearns & Co., 183, 203Beaver, William H., 174Behavioral finance, 44Bell Atlantic, 61BellSouth, 61Beneish, Messod Daniel, 89Bernstein, Richard, 179, 180“Big bath” technique, 11–12Big Time Corp. (fictitious), 70,
84–86price-earnings multiple, 84–86
Bill-and-hold transactions, 188Birmingham Steel Corporation,
233BJ’s Wholesale Club, 139
recognition of annual fees, 139Bliley, Thomas, 193Bloomberg, 136, 137Boeing, 205Bolduc, J. P., 147Bona FIDE profits, 117–118Bond ratings
Moody’s, 296–297Standard & Poor’s, 298–301
Book value (definition), 347Bosak, Barry, 135Boston Beer, 49–55Boston Brewery, 53

Breakeven rate (definition), 347Breakeven level, 77Bridge loan (definition), 348Brincat, John, 6Broadcast cash flow, 122Broadcom, 239–244Brooke Group, 63Brooke’s, 63Brown, Donaldson, 333Brussels Translation Group (BTG),
8Business cycle (definition), 348Business life cycle, 99–107
cash flow and, 99–107declining industry companies,
104emerging growth companies,
100–102established growth companies,
102start-up companies, 100venture capitalists, 100
Business Week, 142, 145Burry, Roy, 63
Cabot Corporation, 234–238Cabot LNG Business Trust, 236Cabot Microelectronics
Corporation, 236California Micro Devices, 190–191Canin, Jeffry, 135Capital adequacy, 271Capital expenditures, 222Capital-intensive (definition),
348Capitalization (of an expenditure)
(definition), 348Capitalization of selected
expenditurescautions, 69use, 69
Capitalized interestfixed-charge coverage adjusted
for, 283Caradon PLC, 157Cash balance plans, 206
definition, 348Cash flow
analysis, 161, 174–179definition, 174measuring with EBITDA,
174–179and working capital, 177–179
Cash flow ratio, 285–287Cash flow statements
advantages of, 91mandatory under SFAS 95, 91projected, 221–223
Cash-on-cash profit principle, 122
Caterpillar, 205CCA Industries Inc., 324Center for Financial Research &
Analysis, 162Central Widget (fictitious), 74–76,
77Chainsaw Al, 186–189Chalhoub, George, 230, 232Chambers, John, 193Chanos, James, 198Chapter 11, (definition), 348Chattem Inc., 324Chicago Board Options Exchange
Gaming Index, 185Chevron, 305Cincinnati Milacron, 151Cisco Systems, 65, 193, 196Citicorp, 151Class-action suit, (definition), 348Coca-Cola, 63–64Cohen, Marc, 63Colgate-Palmolive, 324
Index 379

380 INDEX
Colossal Chemical Corporation(fictitious), 308–323
Columbia Business School, 197Combination ratios, 287–302
and credit risk, 294–302Common form balance sheet, 46,
48Comparability (definition), 348Comparative ratio analysis,
302–307and line of business, 302–307and business volume, 302
Compound Annual Growth Rate(CAGR), 203
definition, 348–349CompuServe, 154, 155, 156Computer Associates International,
182Conagra, 334Consolidation (of an industry)
(definition), 349Contribution (definition), 349Contribution per unit, 80Convertible (definition), 349Corporate governance, 337Corporate growth
limits to, 14–15rationalizing decline in, 15–18
Cost assessment, 120–122alternative earnings measures,
120–121depreciation, 120–121pitfalls, 120–121real estate and, 121–122
Cost of capitaldefinition, 349determination of, 43
Cost of goods sold (COGS), 80–81fixed, 77projected capacity utilization
percentage, 216
projected gross margin, 216variable, 77
Credit analysis, 267–313bait-and-switch technique, 277criteria, 267–268financial derivatives, 272floating-rate debt, 272long-term debt, 271–272potential liquidity, 272preferred stock, 273short-term debt, 271–272
Credit approval process, 22Credit Facility, 233Credit quality, 34
economic reality and, 36stock-for-stock acquisition, 36value of goodwill in balance
sheet-based analysis of,36–37
Crown Zellerbach, 186Cumulative dividend (definition),
349Currency exchange rates, 86Current ratio, 268Current stock price
equation, 316equation for a growing company,
318Cyclical company, 320–321
Davies, Ronald, 150Davis, Michael, 197Davis, Tom, 193Debt
affecting return on equity, 290covenants, 110embedded cost of, 219fixed-rate, 353floating-rate, 272, 353long-term, 271–272short-term, 271–272

Index 381
Default, 309–313definition, 349
Deferred taxes and calculating risk,276
Defined benefit plans, 206, see alsocash balance plans, Definedcontribution plan
definition, 349–350Defined contribution plan
(definition), 350, see alsoDefined benefit plan
Del Laboratories, 205, 324Dell Computers, 46Denari, Stephen, 199DenDanto, Deidra, 188Department of Health and Human
Services, 152Depreciation
accessing, 122–123accounting methods for, 58–59changing assumptions, 58definition, 350industry peer comparisons,
57–58schedules, 91–93straight-line basis, 217and true economic value, 32units-of-production method,
362–363write-off period, 217
Depreciation schedulesfor publicly owned companies,
91–93Desaigoudar, Chan, 191Dilution (definition), 350Direct mail, 153Disclosure
derivatives, 45–46equity values, 45FASB, 46pension plans, 203
SFAS 133, 46time and, 46
Discount rate, 43definition, 350
Discount value, see Cost of capitalDiscounted cash flow
definition, 350equation, 350
Disney Internet Group, 65Discretionary cash flow
definition, 351and financial flexibility, 109
Diversificationconglomerate discount and, 17“cross-selling” and, 17definition, 351–352
Dividend-discount model, 316–322and cash flow, 320–322and cyclical companies, 320–322future appreciation, 317example, 316–317example of a growing company,
318–320valuing a growing company,
317–320Dividend-payoff ratio, 318Dividend rate, 319Dividend safety margin, 109Dole Food Co. Inc., 334Double-entry bookkeeping, 42
definition, 352Dow Jones Industrial Average,
43–44definition, 352
Downplaying contingencies ploys,18–20
bankruptcy scenario, 19contingent liability assessment,
18lawsuits and public disclosures,
19

382 INDEX
Doyle, James A., 6DSG International, 324Du Pont, 333Du Pont Formula, 333–342Dunlap, Albert, 186–189
Earningsbefore interest and taxes, see
EBITbefore interest, taxes,
depreciation, amortization,see EBITDA
core net earnings, 64forecast of, 213maximizing following
acquisition, 197–198per share, 332pro forma, 64–68smoothed versus actual, 8–9
Easdaq (European) stock market, 8Eastman Kodak, 107Eatmore & Co. (fictitious),
325–326EBIT
definition, 352and total enterprise value,
164–179EBIT-based coverage ratio, 169EBITDA
abuse of, 172–174calculation of multiple, 167–168coverage of interest, 171definition, 352vs. EBIT, 168–172fixed charge coverage, 169for measuring cash flow,
174–179total-debt-to-total-capital ratio,
170and total enterprise value,
164–179
EBITDA multiple, 167Econometric forecasting models,
214Economies of scale, 102
acquisitions and, 74definition, 352opportunities, 76
Economies of scope, 73–74cultural barriers, 74definition, 352
Edward I. Altman’s Z-Score model,310
Edwards, Albert J., 189Efficient market hypothesis, 315Embedded cost of debt (definition),
219EPI Printers, 188Equity
economic versus accountingdefinition, 39
leveraged recapitalization, 39negative, 39return on, 288–290
Equity investing, see Leveragedbuyouts
Ernst & Young, see InformixEstée Lauder, 324E.W. Scripps, 205Examples
acquisitions, 239–244acquisitions and revenues, 70–72adjusting shareholders’ equity,
38Air Products & Chemicals, 46Altima, 239–244American Greetings Corporation,
105Anheuser-Busch, 52, 54average Ratios for Standard &
Poor’s Single-A Industrials1988–2000

Index 383
backing out fixed and variablecosts, 79
Big Time Corporation (fictitious),70–72, 84–86
Boston Beer, 50, 51, 52breakeven analysis, 77–81Breathing Room, Inc. (fictitious),
164, 167Broadcom, 239–244Cabot Corporation, 234–238capital spending projection, 259Central Widget (fictitious), 74,
77–81Colossal Chemical Corporation
(fictitious), 212–229common form balance sheet, 47companies within an industry
ranked by price-earningsratio: cosmetics andpersonal care industry, 350
comparative ratio analysis ofintegrated oil and gascompanies annualaverage1998–2000, 304
consolidated balance sheet,Johnson & Johnson, 268
corporate pension plans, 201cost of sales as a percentage of
sales, 82, 83cycle-to-cycle stability, 309debt service projection pro
forma, 258dividend-discount model,
316–317, 318–320diverting earnings from non-
operating to operating, 203
debt service projection, 264Deep Hock Corporation
(fictitious), 164Dell Computers, 46
Du Pont analysis of foodprocessing industry’s 2000results, 334
earnings forecast, 213EBITDA calculation, 96economies of scale, 74–76economies of scope, 73–74embedded cost of debt, 219Excelsior Widget (fictitious),
74–76exploiting a difference in price-
earnings multiples, 85financial derivatives disclosure,
45–46Focal Communications
Corporation, 101forecast assumptions, 263General Electric, 201generic LBO, 94–95generic LBO income statement,
97goodwill, 31historical and projected financial
data, 261–262Holowman, Inc. (fictitious), 169I.D.T., 68–69Intel, 43–44International Business Machines
(IBM), 201–203JDS Uniphase, 33Johnson & Johnson, 282Jostens, 230–232Knowledge Ware Inc., 132leveraged recapitalization,
40–42link between goodwill and stock
prices, 34–36Lowe’s Companies Inc., 47median ratios by bond rating
category (Industrials,1997–1999), 307

384 INDEX
Examples (Continued)mergers-and acquisitions
accounting, 195multiyear balance sheet, 249multiyear cash flow statement,
250multiyear income statement,
252–254multiyear operating margins,
251, 255Newport, 239–244Nortel Networks, 31operating income by segment,
217operating leverage, 78Oxford Health Plans, 161Polaroid Corporation, 106potential and limitations of
financial forecasting,230–232
PPE manufacturing corporationearnings history graph, 329
PPE manufacturing corporationearnings history table, 329
PPE manufacturing corporationearnings trend—leastsquares method, 330
problems with exploiting adifference in price-earningsmultiples, 86
Procter & Gamble, 46pro forma combined balance
sheet, 240–241pro forma combined statement of
operations, 242–243projected balance sheet, 224projected statement of cash
flows, 222quarterly income statement, 248rate-of-return measures, 288
rating history: ViacomInternational, 278
Rayovac Corporation, 92revenue projections, 256–257Rock Solid Corporation
(fictitious), 169Rock Solid and Hollowman
statements of income, 170sales forecast, 214sales forecast by geographic area,
215Salsa Meister (fictitious), 119selected financial data Grubb &
Chao (fictitious), 323selected financial data Wolfe
Food Company (fictitious),319
Selected medical, 247sensitivity analysis of projected
financial statements,226–227
settlement of pension liabilities,206
Sherwin-Williams, 33Silicon Spice, 239–244Sitting Duck Corporation
(fictitious), 338–339Six Flags, 82Small Change (fictitious), 70–72,
84–86Solectron Corporation, 103–104trend of credit quality, 225,
227–228Trump Taj Mahal, 184unaudited pro forma
consolidation incomestatement, 235
Wal-Mart Stores Inc., 108Washington Group International,
82–84

Index 385
West Coast Whatsit (fictitious),77–81
Westinghouse Electric, 206working capital projection, 260
Excelsior Widget (fictitious), 74–76Exchangeable (definition), 352Expense recognition, 153–162Expenses
reduction of, 156–157External growth
definition, 352economies of scope, 73–74gross margin, 73synergy, 73volume discounts, 73
Externally generated funds(definition), 352
Extraordinary itemsaliases for, 61“below-the line” treatment of,
59–61non-recurring nature of, 60prevalence of, 61prohibited expenses, 60qualifying for, 59–60as special charges, 61
Exxon Mobil, 304
Factor (definition), 352Fannie Mae, 61FAS 101, 136Federal Reserve, 43Federal Rule of Civil Procedure 23,
see Class-action suitFinancial Accounting Standards
Board (FASB), 9–10, 11, 46,60, 66, 67, 193, 196
and elimination of the poolingmethod, 196
Congress and, 9
theoretical versus negotiated rule-making by, 9
Financial derivatives, 45, 272definition, 352
Financial flexibility, 107–110adjusted working capital, 110compliance with loan covenants,
232–233curing the default, 234and debt covenants, 110definition, 352disadvantages of, 111and discretionary cash flow,
109and dividends, 109dividend safety margin, 109and hostile takeovers, 111loss of, 234maintenance-level capital
spending, 110and overinvestment, 111–112reducing discretionary
expenditures, 111self-finance, 108–109slack, 111
Financial leverage (definition),354–355
Financial position statementsrequired under APB 19, 91
Financial reporting analysiserror tradeoff versus sound
financial analysis, 23gamesmanship of, 21mitigating circumstances in,
23–24routine versus proactive, 3skepticism important, 20–24stories versus sound financial
analysis, 21–22types of investors, 21

386 INDEX
Financial flexibility (Continued)vendor bias versus sound
financial analysis, 22–24Financial reporting for large losses
“big bath” technique, 11–12and corporate self-interest, 5–6and cost of capital, 5corporations and, 4–5credit ratings and, 5hidden assumptions, 8–10inaccuracies, 5as means to an end, 5price-earnings multiples and, 5purpose of (defined), 5small profits misinformation, 11
Financial Statement Alert, 134Financial statement, 56–58
accounting rules manipulation,56
analysis of, 56–58detecting artificial revenue
inflation in, 57executive bonuses linked to
earnings per share, 56forecasting, 211–266revenue inflation in, 57unrealistic depreciations in,
57–58Finocchio, Robert, 127First American Financial, 140First Call, 66, 67First Call/Thompson Financial,
136First Financial Management, 152Fixed-charge coverage ratio
formula for, 283and interest income, 284–285lease expense calculations, 284
Fixed costs, 74, 80definition, 353
Fixed-rate debt (definition), 353
Fixed versus variable costs, 76–84cautions, 81contribution per unit, 80costs of goods sold (COGS), 80difficulties in quantifying, 80financial performance and,
81–82fixed costs, 80operating margin, 81selling, general and
administrative expenses(SG&A), 80
Six Flags, 82unit price, 80
Floating-rate debt, 272definition, 353
Focal communications, 100, 102Forbes, 199Forbes ASAP, 7Ford’s Lincoln, 145, 146Forecasting, 211–266
additions to property, plant, andequipment, 222
cost of goods sold, 216dividends, 222–223deferred income taxes, 221drawing conclusions from,
265–266earnings, 213economic growth, 215interest income, 221interest expense, 219–38operating income, 218provision for income taxes, 221repayment of current maturities
of long-term debt, 223research and development
(R&D), 217–218selling, general, and
administrative expenses,216–217

Index 387
starting point, 213working capital changes, 221–222
Form 10-Q, 133Fort Howard, 58Fortune, 152Fraud, 88–90
audits, 89earnings manipulation, 89outright misrepresentation, 89
Fundamental analysis (definition),315, 353
Funding (definition), 353Future value (definition), 353
formula, 353
Gabelli Asset Management, 66Gabelli, Mario, 66Gaughan, Eugene, 148General Electric, 201General Motors, 333General Motors’ Cadillac, 145–147Generally Accepted Accounting
Principles (GAAP), 4, 5, 66,157, 199, 205
as best predictor of cash flow, 67definition, 353dynamic industries and, 34fraud and, 8fee recognition requirements of,
139inaccurate reporting not illegal, 8intangible assets and, 34percentage-of-completion
method, 140and traditional accounting
systems, 30Gerstner, Louis, 156Gibson Greetings, 102Gill, Daniel, 144Gillette Company, 324Goldberg, Arthur, 185
Goldman Sachs, 63Goodwill, 30–31
amortization of, 194, 197, 200assets-to-liabilities ratio versus
tangible assets-to-liabilityratio, 33
definition, 354and stock prices, 34–36as a write-off, 33
Graham, Benjamin, 336Grant, James, 333Grant, W. T., 175–177Gray, Susannah, 247, 265Gross Domestic Product (GDP)
(definition), 354Gross margin, 52, 73Grubb & Chao (fictitious),
323–324GTE, 61
Harris, Trevor J., 197Harvard Business School, 149Heinz (HJ) Co., 334Henderson, Barry, 199Henke, Steven J., 190–191Henricks, Alan, 126Hershey Foods, 334, 335Hidden assumptions of financial
reportingbonuses based on stock price, 10CEO self-interest, 9–10depreciation schedules and, 10price-earnings multiples and, 8reporting gimmicks, 8–11smoothed versus actual earnings,
8–9volatility, 9
Historical cost accounting, 29–32as basis, 30definition, 354disadvantages of, 30

388 INDEX
Historical cost accounting(Continued)
and goodwill, 30–31liability distortion with, 31true economic value, 32
Hopkins, Patrick E., 65, 197Hormel Foods Co., 334Hostile takeovers, 111, 337
definition, 354Hybrid Networks, 150
I.D.T., 68–69Ikon Office Solutions, 150IMC Global, 205Income
deferred taxes on, 221from interest, 284–285net, 196reduction through goodwill
amortization, 194Income statement analysis
corporate commentary, 51–52cost of goods sold, 77drawing conclusions, 90extraordinary items, 59fixed versus variable costs, 76–84fraud, 88–90as future performance indicators,
59interest rates, 50intimidation, 55percent income, 50–51price-earnings multiples, 84–88projected, 213–221revenues, 69–72
Income statement ratios, 280Infinity Broadcasting Corporation,
191Informix, 125
class action suit against, 129dispute with Ernst & Young, 129
independent audit of, 129revenue costs, 127revenue recognition problems,
126revenue reduction, 127
Intel, 43–44Intellectual capital, 29Inter Parfums, 324Interest income, 284–285Internal growth
compared to industry average, 73definition, 73, 354versus external growth, 72–74intrinsic value of, 73
Internal Revenue Service, 93, 203Internally generated funds
(definition), 354International Accounting Standards
Board, 244International Business Machines
(IBM), 56–57, 154, 156–157,201, 202, 206, 333
pension plan investmentportfolio, 203
pension-related income, 206Inventory turnover, 292, 293Investment returns
on corporate pension plans, 201Investor-relations officer, 354Involuntary inventory
accumulation, 354
JDS Uniphase, 33, 34, 37Jenkins, Edmund L., 67, 193Jensen, Michael C., 149, 150Jepson, Franklin T., 143–144John Hancock Financial Industries
Fund, 66Johnson & Johnson, 268, 270, 281Johnson, Harold O., 142Jostens, 230–232

Index 389
Kelley School of Business (IndianaUniversity), 65, 89, 197
Kellogg Co., 334Kellogg, Loren, 134Kendall Square Research, 134–135
revenue loss on, 135revenue recognition
controversies, 135revenue recognition reform, 135
KnowledgeWare, 130–134amended financial reporting
practices of, 132diverging trends of revenues and
receivables, 133–134financial reporting problems of,
131MD&A analysis, 133–134merger with Sterling Software,
130–131Kraft Foods, 334
Laclede Steel, 205Laing, Jonathan, 187–188Lease expense
fixed-charge coveragecalculation, 284
Least-squares methodfor corporate earnings
projection, 330–331Lernout & Hauspie Speech
Products (L & H), 7–8Levenson, Carol, 66Leveraged buyouts (LBO), 340–342
asset sales in, 341–342average annual return on equity
from, 96cash flow and, 93–98definition, 356–357dividends not taken, 95funds generated by, 93and income statements, 98
profit margin improvement in,340–341
risks of, 97–98Leverage, operating, 54, 77
definition, 356Leveraged recapitalization, 39–42
definition, 39, 357double-entry bookkeeping in, 42financial analysts’ perceptions of,
42uses of, 40
Lieberman, Joseph, 193, 196Lilly Tulip, 186Liquidity (definition), 357Llewellyn, Trefor, 157, 158, 159Lockheed Martin Corporation,
233Loews Corporation, 66Long-term debt, 223, 271–272Long-term issue credit ratings, 298Low-cost debt
asset versus liability, 31balance sheet, 31
Lowe’s Companies Inc., 47, 48Lucas, Timothy S., 60Lynch, Gary, 145
Macroeconomic (definition), 357Maher, Robert P., 199Manville Corporation, 18–19Market capitalization, 29, 43–44
advantages of, 43and book value, 43definition, 357drawbacks of, 43of Intel, 43–44
Mature (definition), 357Maximizing growth expectations
actual versus management-projected growth, 14
competition, 14

390 INDEX
Maximizing growth expectations(Continued)
confronting falling growthexpectations, 13
corporate credibility gap, 14corporate ploys for, 12–18distorted comparisons, 15–16diversifying away from mature
markets, 17–18increasing base, 15limits to continued growth,
14–15management optimism, 13market saturation, 14market share constraints, 15new product expectations,
16–17rationalizations for declining
growth, 15–18shipment delays, 16Y2K problem, 16
Maytag, 61McCormick, 334, 335MemberWorks, 139Mercury Finance, 6–7Mergers, 238–239Mergers and acquisitions
accounting, 193–200disclosure in, 88in same industry, 238–239price-earnings multiple in, 76problems with, 88
Mergers and acquisitionsaccounting, 193–200
Merrill Lynch, 198, 230, 247Metzler Group, 198Meyercord, Wade, 191Microeconomics (definition), 357Microstrategy, 7Mills, Charles, 7Minkin, Gustave, 186
Modified Du Pont Formula,335–342
valuation through restructuringpotential, 336–342
Moody’s Investor Service, 33, 34,37, 311
bond ratings (definitions),296–297
debt ratings, 297Moog, 205Morgan Stanley, 197Morgenson, Gretchen, 68Morison Knudsen, see Washington
Group InternationalMorrison, Helane L., 150Multiple (definition), 357Multivariate (definition), 357Multiyear projections, 244–265
for capital-intensive companies,245–246
electronic spreadsheets for, 246present value of future dividends,
245in radical financial restructuring,
246for Select Medical, 247–260and volatility of economic
conditions, 245Murphy, Michael, 65Mutual fund (definition), 357
National Auto Credit, 190National Data Corporation, 140National Gypsum, 19National Medical Care (NMC),
147Navigant Consulting, 196,
198–200Navigant International, 198Net income, 196Net margins, 52

Index 391
Net pension cost (benefit)components, 204
amortization of net deferredgains and losses, 204
amortization of prior servicecost, 204
amortization of the transitionamount, 204
expected return on plan assets,204
gain or loss from settlement orcurtailment, 204
interest cost on benefitobligation, 204
service cost, 204Net present value, 357–358Net2Phone, 68New Jersey Casino Control
Commission, 183Newport, 239–244New Valley Corporation, 64New York Times, 68, 189Nitec, 189Nominal dollar, 358Norris, Floyd, 189, 198Nortel Networks, 33Northeast Utilities, 205Northern Pipeline, 336
Occidental Petroleum, 304Off-balance sheet liabilities, 274–276Olympia & York, 275Online services
lack of profitability in, 154Operating cash flow (definition),
177Operating leverage, see Leverage,
operatingOperating margins, 52, 81Oralabs Holding, 324Owens Corning, 19
Oxford Health Plans, 159–162Oxley, Michael, 244
Paragon Trade, 324Park Place Entertainment, 185Parlux Fragrance, 324Payment-in-kind security (PIK)
(definition), 358Payout ratio (definition), 358Pension plans
bankruptcy and, 207drawing conclusions about, 207investment returns in, 201net cost of, 201net benefit of, 201profits in, 201–207SFAS No. 87, 203
Penta Advisory Services, 198Pentagon, 60Pepperdine University, 197Percentage balance sheet, see
Common form balance sheetpercentage-of-completion method,
140Perquisites, 86Physician & Hospital Systems &
Services, 140Pitt, Harvey, 244Planet Hollywood, 183Polaroid, 104, 107Pooling-of-interests accounting, 67,
193, 200definition, 359GAAP and expected return,
205–206potential for abuse of, 196twilight of, 194–197
Portfolio (definition), 359Powell, Dennis, 196PPE Manufacturing Corporation,
328–330

392 INDEX
Preferred stock, 273Present value
definition, 359formula, 359of future income, 39
Price-earnings multiples, 84–88,237
exaggerated, 87–88exploiting difference in, 85, 86low, reasons for, 327normalizing earnings, 328–331sustainable growth rate,
331–333variation in, 325–333
Price-earnings ratio, 322–325definition, 322
Price Waterhouse, 135, 144, 148Privately held companies
tax minimization and, 93Procter & Gamble (P&G), 46,
62–63, 64Prodigy Services, 154Professional Detailing, 140Profit, 117–123
accounting profits, 117–118bona fide profits, 117–118definition, 117measuring margin of, 280–283overstatement of, 157–159in pensions, 201–207
Profit margin, 280–283Pro forma (definition), 359Pro forma earnings
and core net earnings, 64as de facto GAAP, 65divergent computational
methods, 66–67EBITDAM, 65operating earnings versus
operating income, 66purpose of, 64
Pro forma financial statementsin acquisitions, 238–244disadvantages of, 238for divestments, 234–238and spin-offs, 237–238uses of, 234, 237
Projected balance sheet, 223–224assumptions, 223vs. historical balance sheet,
224and projected statement of
cash flows, 224Projected income statement,
213–221cost of goods sold, 216depreciation, 213, 217interest expense, 219–220interest income, 221net income, 213operating income, 218provision for income taxes, 221research and development
(R&D), 217–218sales, 214–216selling, general, and
administrative expense(SG&A), 216–217
Projected statement of cash flows,221–223
additions to property, plant, andequipment, 222
deferred income taxes, 221dividends, 222–223increase in notes payable, 223projected income statement use
in, 221repayment of current maturities
of long-term debt, 223working capital changes
(excluding cash andborrowings), 221–222

Index 393
Property, plant, and equipment(PP&E), 69
additions to, 222Publicly owned companies
depreciation schedules for, 91–93
Purchase accounting, 194–195,197, 200
definition, 359strategies, 198–200
Quest CommunicationsInternational, 66
Ralston Purina Co., 61, 334, 335Rate-of-return measures, 287–291
annual earnings formula, 289return on average equity formula,
289return on equity formula, 288
Ratio trend analysis, 307–309Rationalization (definition), 359Ratios, 232Raymond, David, 7Rayovac Corporation, 91Raytheon Engineers &
Constructors (RE&C), 84Real dollar (definition), 360Receivables turnover, 292Reinsurance (definition), 360Reorganization proceedings
(definition), 360Reported earnings (definition), 360Research and development (R&D)
forecasting, 217–218write-offs of, 197
Restatements, 198Restructuring, 61–64
as a catchall term, 61–62Return on average equity, formula,
289
Return on equityeffect of debt on, 290formula for, 288
Revaluation of debtand historical cost, 31
Revenue, 118–120defined, 118
Revenue recognition, 125–152of annual fees, 139danger signals, 130, 151evidence of flawed, 130financed membership fees, 137GM exaggeration, 145–146by Informix, 125layaway sales, 136loading the distribution channels,
141patterns of behavior for
noncompliant companies, 149percentage-of-completion
method, 140reporting, 130revenue adjustment case histories,
151–152scope of the problem, 149stratagems, 149–150and understating short-run
profits, 147Revenue, 69–72
from mergers and acquisitions,70–72
from sales, 70–72from stock market proceeds,
69–72Ribis, Nicholas, 182–185R. L. Polk, 146, 147Rockefeller Foundation, 337Rocker, David, 7Rosenberg, Norman, 68Royal Dutch/Shell Group of
Companies, 305

394 INDEX
Sale-leaseback, 37accounting method, 156definition, 360
Sales forecast, 214to generate revenue, 70
Salomon Brothers, 135Samuel Adams Brewery Company,
Ltd., 53Samuels, Gary, 154Sano, 151–152Sara Lee Corp., 334, 335Saylor, Michael, 7Scale economics, see Economies of
scaleScanlon, Thomas, 148Schilit, Howard, 7, 157Schmidt, James K., 66Scott Paper, 186Shell Oil, 305Short-term debt, 271–272Shweppes Bottlers, 63Sears, Roebuck & Co., 61, 154Securities and Exchange
Commission (SEC), 7, 11, 61,62, 64, 89, 131, 138, 157,187, 191, 197, 199, 206
and AOL, 155definition, 361inaccurate filings with, 68–69Lernout & Hauspie investigation
by, 8material value criterion, 148
Select Medical (fictitious), 247–260capital spending projection, 259debt service projection pro
forma, 258multiyear balance sheet, 249multiyear cash flow statement,
250
multiyear income statement,252–254
multiyear operating margins,251, 255
multiyear projections, 247quarterly income statement, 248revenue projections, 256–257working capital projection, 260
Selling, general and administrativeexpenses (SG&A), 80,216–217
Senior debt, 277definition, 361
Sensitivity analysisapplications of, 228–229caution regarding, 230definition, 227, 361with projected financial
statements, 224–230September 11 terrorist attacks, 60Sequoia Systems
SEC allegations against, 141Serious Fraud Office (SFO),
158–159Shakeout (definition), 361Shandell, Tom, 183Shareholder activism, 337Sherwin-Williams, 33Silicon Spice (fictitious), 239–244Sitting Duck Corporation
(fictitious), 338–339Six Flags, 83
cost of sales, 82seasonality of, 82
Slack (definition), 361Small Change (fictitious), 70, 84,
86price-earnings multiple, 84
Smith Barney Shearson, 135Smith, Brian J., 148

Index 395
Solectron, 102Sony Corporation, 64Software and Information Industry
Association, 66Spin-offs, 237–238
price-earnings multiple, 237valuation after, 238
Staff Accounting Bulletin No. 101,139
Standard & Poor’s, 33, 34, 37, 66,67, 295, 298–309, 311
bond ratings (definitions),298–301
Compustat database, 61500 index, 66, 67, 203400 index of industrial
corporations, 38Standard error of estimate
(definition), 361Statement of Financial Accounting
Standards (SFAS)definition, 361SFAS 87, 201, 203, 205SFAS 88, 206SFAS 141, 31SFAS 133, 46
Statement of stockholder’s equity(definition), 361–362
Statutory tax rate (definition), 362Sterling Software, 130–131Stier, Edwin H., 145Stradling, Stuart, 157, 159Straight-line method of
depreciation (definition), 362Subordinated debt, 277
definition, 362Substainable growth rate, 333Sunbeam, 186–189
bankruptcy of, 188Sun City Industries, 186
Sunoco, 61Sweetbaum, Henry, 158, 159Syndicated Facility, 233Synergy, 73
definition, 362Sysco, 205
Taj Mahal casino, 183Tarheel Tobacco (fictitious),
316–317Tarkenton, Fran, 130Teeters, Christopher, 162Texaco, 305, 306TheStreet.com, 68Thompson, Thatcher, 198Thomson Financial/First Call, 62,
66Time Warner, 61Total debt, 271–274Total-debt-to-total capital ratio,
170Total-debt-to-cash-flow ratio,
293–294Total enterprise value
definition, 362and EBIT 178–179and EBITDA 178–179relating to net income,
164–168Tractebel, Inc., 236True economic value
and depreciation, 32estimation difficulty, 32
Trump Hotels & Casino Resorts,182–185
press releases by, 184quarterly report on form 10-Q,
183T2Medical, 152Turner, Lynn, 206

396 INDEX
Turnover measures, 291–293average days of receivables, 291inventory turnover formula, 292,
293receivables formula, 292
Tyco International, 197
Understatement of costs, 159–162Unit price, 80United States Surgical, 197, 198United States Tax Code, 122Units-of-production depreciation
method (definition), 362–363Unrecognized values, 342U.S. West, 61USG Corporation, 19UST, 205
Valuehistorical cost, calculation of, 30“instantaneous” wipeout of, 33intrinsic, 30long-run erosion in profitability,
37overstated, 38rate of return on fixed assets, 37of real property, 30reduction in, 37–39true equity value, 38–40
Variable costs definition, 363versus fixed costs, 76–84
Veritas Software, 66Viacom International, 277–279Volcker, Paul, 244Volume discounts, 73
Wall Street Journal, 62–63, 66, 135,136, 137, 183, 187
Wal-Mart, 108–110, 136, 187accounting method changes by,
136stock problems of, 136
Walter Industries, 19Washington Group International,
82–84Waste Management, Inc., 233Weirton Steel, 58West Coast Whatsit (fictitious), 77Western Union, 64Westinghouse Electric, 206White, Phillip E., 126, 127Whitworth, Ralph, 145Wickes PLC, 157–159
SFO investigation of, 158–159Wiggins, Stephen F., 159, 160Wolfe Food Company, 318–320,
322–323Woolworth, 190Working capital
in cash flow analysis, 177–179definition, 363requirements formula, 178
World Trade Center, 60World Wrestling Federation
Entertainment, Inc., 233World’s Fair casino, 183W.R. Grace, 147–149
SEC allegations against, 147Write-offs
for goodwill, 33and ratings, 37
Yahoo!, 65
Zacks Investment Research, 135Zeckhauser, Richard, 11, 12