
Aswath Damodaran1 The Value of Intangibles Aswath Damodaran.
Upload
tobias-douglasCategory
view
232download
0
Financial Statement Analysis
Aswath Damodaran

2
Questions we would like answered…

3
Basic Financial Statements
The balance sheet, which summarizes what a firm owns and owes at a point in time.
The income statement, which reports on how much a firm earned in the period of analysis
The statement of cash flows, which reports on cash inflows and outflows to the firm during the period of analysis

4
The Balance Sheet

5
A Financial Balance Sheet

6
The Income Statement

7
Modifications to Income Statement
There are a few expenses that consistently are miscategorized in financial statements.In particular, Operating leases are considered as operating expenses by
accountants but they are really financial expenses R &D expenses are considered as operating expenses by
accountants but they are really capital expenses. The degree of discretion granted to firms on revenue
recognition and extraordinary items is used to manage earnings and provide misleading pictures of profitability.

8
Dealing with Operating Lease Expenses
Debt Value of Operating Leases = PV of Operating Lease Expenses at the pre-tax cost of debt
This now creates an asset - the value of which is equal to the debt value of operating leases. This asset now has to be depreciated over time.
Finally, the operating earnings has to be adjusted to reflect these changes: Adjusted Operating Earnings = Operating Earnings + Operating
Lease Expense - Depreciation on the leased asset If we assume that depreciation = principal payment on the debt
value of operating leases, we can use a short cut: Adjusted Operating Earnings = Operating Earnings + Debt value
of Operating leases * Cost of debt

9
Operating Leases at The Gap in 2003
The Gap has conventional debt of about $ 1.97 billion on its balance sheet and its pre-tax cost of debt is about 6%. Its operating lease payments in the 2003 were $978 million and its commitments for the future are below:
Year Commitment (millions) Present Value (at 6%)1 $899.00 $848.11 2 $846.00 $752.94 3 $738.00 $619.64 4 $598.00 $473.67 5 $477.00 $356.44 6&7 $982.50 each year $1,346.04 Debt Value of leases = $4,396.85 (Also value of leased asset) Debt outstanding at The Gap = $1,970 m + $4,397 m = $6,367 m Adjusted Operating Income = Stated OI + OL exp this year - Deprec’n
= $1,012 m + 978 m - 4397 m /7 = $1,362 million (7 year life for assets) Approximate OI = $1,012 m + $ 4397 m (.06) = $1,276 m
Aswath Damodaran
9

10
The Collateral Effects of Treating Operating Leases as Debt
Aswath Damodaran
10

11
R&D Expenses: Operating or Capital Expenses
Accounting standards require us to consider R&D as an operating expense even though it is designed to generate future growth. It is more logical to treat it as capital expenditures.
To capitalize R&D, Specify an amortizable life for R&D (2 - 10 years) Collect past R&D expenses for as long as the amortizable life Sum up the unamortized R&D over the period. (Thus, if the
amortizable life is 5 years, the research asset can be obtained by adding up 1/5th of the R&D expense from five years ago, 2/5th of the R&D expense from four years ago and so on.

12
Capitalizing R&D Expenses: SAP
R & D was assumed to have a 5-year life. Year R&D Expense Unamortized Amortization this
yearCurrent 1020.02 1.00 1020.02-1 993.99 0.80 795.19 € 198.80 -2 909.39 0.60 545.63 € 181.88 -3 898.25 0.40 359.30 € 179.65 -4 969.38 0.20 193.88 € 193.88 -5 744.67 0.00 0.00 € 148.93 Value of research asset = € 2,914 millionAmortization of research asset in 2004 = € 903 millionIncrease in Operating Income = 1020 - 903 = € 117 million
Aswath Damodaran
12
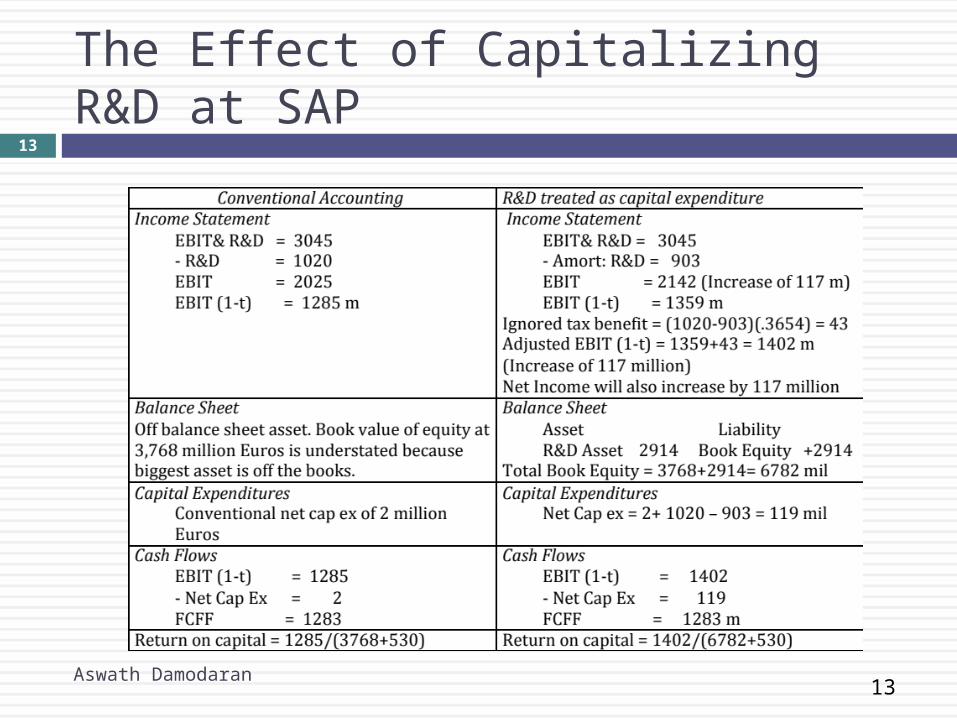
13
The Effect of Capitalizing R&D at SAP
Aswath Damodaran
13

14
The Statement of Cash Flows

15
The Financial perspective on cash flows
In financial analysis, we are much more concerned about Cash flows to the firm or operating cash flows, which are
before cash flows to debt and equity) Cash flows to equity, which are after cash flows to debt but
prior to cash flows to equity. You can estimate both from the statement of cash
flows.

16
Measures of profitability: Return on assets
The return on assets (ROA) of a firm measures its operating efficiency in generating profits from its assets, prior to the effects of financing.
By separating the financing effects from the operating effects, the ROA provides a cleaner measure of the true return on these assets.
This measure is useful if the firm or division is being evaluated for purchase by an acquirer with a different tax rate or structure.

17
A better measure? Return on capital (or Return on Invested capital)
A more useful measure of return relates the operating income to the capital invested in the firm, where capital is defined as the sum of the book value of debt and equity, net of cash and marketable securities.
When a substantial portion of the liabilities is either current (such as accounts payable) or non–interest-bearing, this approach provides a better measure of the true return earned on capital employed in the business.

18
Decomposing the Return on Capital
The ROC of a firm can be written as a function of its operating profit margin and its capital turnover ratio:
Thus, a firm can arrive at a high ROC by either increasing its profit margin or more efficiently using its capital to increase sales.

19
Return on equity
The return on equity (ROE) examines profitability from the perspective of the equity investor by relating profits to the equity investor (net profit after taxes and interest expenses) to the book value of the equity investment.

20
Non-cash Return on Equity
When a company has a significant portion of its value invested in cash and marketable securities, the return on equity becomes a composite measure of both the return on its operating assets and cash. Consequently, you can modify the return on equity to look at only operating assets (or at least non-cash assets):
This non-cash ROE can be viewed as a measure of the return generated by the equity invested in just operating assets.

21
Profit Margins
The profits of a firm can also be scaled to the revenues of a firm to deliver a measure of profit margins.
From equity investors’ perspective, this usually takes the form of scaling net profits to sales:
For the entire firm’s perspective, you look at operating income (or after-tax operating income) as a percent of sales:


