Financial Inclusion, Financial Education, and Financial Regulation ...
Upload
truongkienCategory
view
218download
0
Fundamentals, Techniques & Theory FINANCIAL STATEMENT ANALYSIS
© 1995–2015 by National Association of Certified Valuators and Analysts (NACVA). All rights reserved. Chapter Two – 1 Used by Institute of Business Appraisers with permission of NACVA for limited purpose of collaborative training. 2015.v1
CHAPTER TWO
FINANCIAL STATEMENT
ANALYSIS AND CALCULATION
OF FINANCIAL RATIOS “Patience is the best remedy for every trouble.”
Plantus, Titus Maccius (c. 254- 184 B.C.)
“Be not afraid of going slowly; be only afraid of standing still.”
Chinese Proverb
I. FINANCIAL RATIO (TREND) ANALYSIS SUMMARY
In general, a thorough financial analysis of any business would include a study of the following
financial information:
1. A summary of both the historical and the adjusted economic/normalized balance sheets over the period
being analyzed, detailing each balance sheet line item.1 2. A summary of both the historical and the economic/normalized adjusted income statements over the
period being analyzed, detailing each income statement line item. 3. A summary of both the historical and the economic/normalized adjusted income statements over the
period being analyzed, where each income statement line item is reported as a percentage of net sales (often referred to as a common-size income statement).
4. A summary of both the historical and the economic/normalized adjusted balance sheets for the period being analyzed, where each balance sheet line item is reported as a percentage of total assets (often referred to as a common-size balance sheet).
5. A summary of both the historical and the economic/normalized adjusted cash flows from operating activities (on the basis of operations and adjusted for owner/manager discretionary items such as compensation and perquisites) over the period being analyzed.
1Economic or normalized financial statements have been adjusted to better reflect the economic reality underlying measures of assets, liabilities, revenues, expenses, etc. Preparation of normalized financial statements is covered in detail in Chapter 3.
Observation
Financial statement analysis is one of the most important steps in gaining an understanding of the
historical, current, and potential profitability of a company. Financial analysis is also critical in
evaluating the relative stability of revenues and earnings, the levels of operating and financial risk, and
the performance of management.
Common size financial statements are an important tool in financial statement analysis. This Chapter
explains the calculation and interpretation of common size balance sheets as well as common size income
statements.
This Chapter also defines a wide variety of ratios derived from financial statement information. The
ability to calculate, compare, and interpret these financial ratios is a key learning objective of this
chapter.

FINANCIAL STATEMENT ANALYSIS Fundamentals, Techniques & Theory
2 – Chapter Two © 1995–2015 by National Association of Certified Valuators and Analysts (NACVA). All rights reserved. 2015.v1 Used by Institute of Business Appraisers with permission of NACVA for limited purpose of collaborative training.
6. A summary of the five main categories of selected financial ratios over the period being analyzed are:
a. Internal liquidity ratios b. Operating efficiency ratios c. Operating profitability ratios d. Business risk (operating) analysis ratios e. Financial risk (leverage) analysis ratios
7. The valuation analyst should then compare the aforementioned ratios for the subject company to those
for other specific businesses or to an appropriate industry average.
II. COMMON-SIZE ANALYSIS
The conversion of balance sheet and income statement line items to percentages of a total is often
referred to as placing the statements on a “common-size” basis. For purposes of common- size
statements, balance sheet line items are presented as a percentage of total assets and income
statement line items are presented as a percentage of total net sales or gross revenue.
Converting the subject company’s balance sheets and income statements to a common-size basis
assists the analyst by identifying internal trends. Common-size statements also facilitate comparison
with other companies in the same industry. A comparison with the data of one or more other
companies if done on the basis of absolute dollar amounts would be very confusing and time
consuming without common-size analysis. Further, comparisons with industry averages are
facilitated and made more efficient by using common-size analysis.
Because common-size financial statement analysis is based on relative size, it removes the confusion
that prevails when exact dollar amounts are used. It is also a fundamental step in developing ratio
(trend) and comparative analyses.
III. RATIO (TREND) ANALYSIS
A. OVERVIEW
Financial ratios are measures of the relative health, or sometimes the relative sickness of a
business. A physician, when evaluating a person’s health, will measure the heart rate, blood
pressure and temperature; whereas, a financial analyst will take readings on a company’s
growth, cost control, turnover, profitability, and risk. Like the physician, the financial analyst
will then compare these readings with generally accepted guidelines. Ratio analysis is an
effective tool to assist the analyst in answering some basic questions, such as:
1. How well is the company doing?
2. What are its strengths and weaknesses?
3. What are the relative business and operating risks to the company?
Please note that although an analysis of financial ratios will help identify a company’s strengths
and weaknesses, it has its limitations and will not necessarily identify all strengths and
weaknesses, nor will it provide the solutions or cures for the problems it identifies. For
instance, off balance sheet financing techniques are not included or reflected in the balance
sheet. Typical off- balance sheet items include:

Fundamentals, Techniques & Theory FINANCIAL STATEMENT ANALYSIS
© 1995–2015 by National Association of Certified Valuators and Analysts (NACVA). All rights reserved. Chapter Two – 3 Used by Institute of Business Appraisers with permission of NACVA for limited purpose of collaborative training. 2015.v1
1. The use of operating leases (vis-à-vis- capitalized lease)
2. Use of finance affiliates
3. Sales or factoring of receivables
4. Use of securitization
5. Take-or-pay and throughput contracts
6. Use of joint ventures
7. Guaranteeing the debt of affiliates
In addition, historical financial data has limitations since the subject firm can:
1. Record questionable revenue
2. Record revenue too soon
3. Record sham revenue
4. Record one-time gains to boost income
5. Shift expenses either to an earlier or later period
6. Under-report or improperly reduce liabilities
7. Shift revenues to the future
8. Take current charges to shift future expenses
To make the most effective use of financial ratios, the ratios should be calculated and compared
over a period of several years. This allows the valuation analyst to identify trends in these
measurements over time. These ratios can also be compared to specific other companies or to
industry averages or norms in order to see how the subject company is performing relative to
other businesses in its industry during the same period of time.
Once the analyst has obtained the GAAP basis and/or tax basis balance sheets and income
statements and has prepared a summary of the historical economic/normalized balance sheets
and income statements, then an analysis of the key financial statement ratios can be undertaken.
B. APPLICATION OF RATIO ANALYSIS
1. An Analysis of Financial Ratios is a Useful Tool for Business Valuations
a) Integral tool in trend analysis
(1) Compares the company’s own ratios to itself over time
(2) Identifies the company’s strengths and weaknesses
(3) Assists in establishing appropriate capitalization rates (helps to identify risk
factors particular to the subject company) (See Chapter Five)
b) Integral tool in comparative analysis
(1) Assists in making comparisons with other companies’ or industry averages
(2) Assists in selecting appropriate price/earnings ratios or price/asset multiples
relative to the company’s indicated performance to compare to comparable
companies or industry averages

FINANCIAL STATEMENT ANALYSIS Fundamentals, Techniques & Theory
4 – Chapter Two © 1995–2015 by National Association of Certified Valuators and Analysts (NACVA). All rights reserved. 2015.v1 Used by Institute of Business Appraisers with permission of NACVA for limited purpose of collaborative training.
2. Uses Historical Data
a) Preferably for five years or alternatively, the length of the natural business cycle of the
subject company and industry
b) More than five years when the analyst deems appropriate
c) Less than five years when the analyst uncovers unavailability of information, unusual
fluctuations or a specific valuation purpose
3. Steps in Trend Analysis
a) Obtain and analyze GAAP basis or tax basis financial data
b) List and prepare summaries by year for key financial statement accounts (both balance
sheet and income statement items)
c) Select, compute and compare the relevant financial ratios for each year
d) Analyze and develop conclusions. This analysis will highlight questionable or
unusual items to be discussed with management for clarification or potential
adjustment
4. Observation
The most effective way to compare and analyze several years of financial data is to prepare
a spreadsheet, either standalone or by using a valuation software program that lists the
description of the financial data and the respective years. The majority of software
programs list the descriptions vertically and the years (or other timing) horizontally,
allowing easy side-by-side comparisons of financial information.
IV. KEY FINANCIAL RATIOS
The thorough valuation analyst will consider and compute five categories of ratios:
1. Internal liquidity ratios 2. Operating efficiency ratios 3. Operating profitability ratios 4. Business risk (operating) analysis ratios 5. Financial risk (leverage) analysis ratios
The following section provides a summary of the five categories of financial ratios, along with
descriptions of how each ratio is calculated and its relevance to financial analysis. Remember, the
ratios themselves may not be entirely meaningful unless used in trend analysis or comparative
analysis.
Fundamentals, Techniques & Theory FINANCIAL STATEMENT ANALYSIS
© 1995–2015 by National Association of Certified Valuators and Analysts (NACVA). All rights reserved. Chapter Two – 5 Used by Institute of Business Appraisers with permission of NACVA for limited purpose of collaborative training. 2015.v1
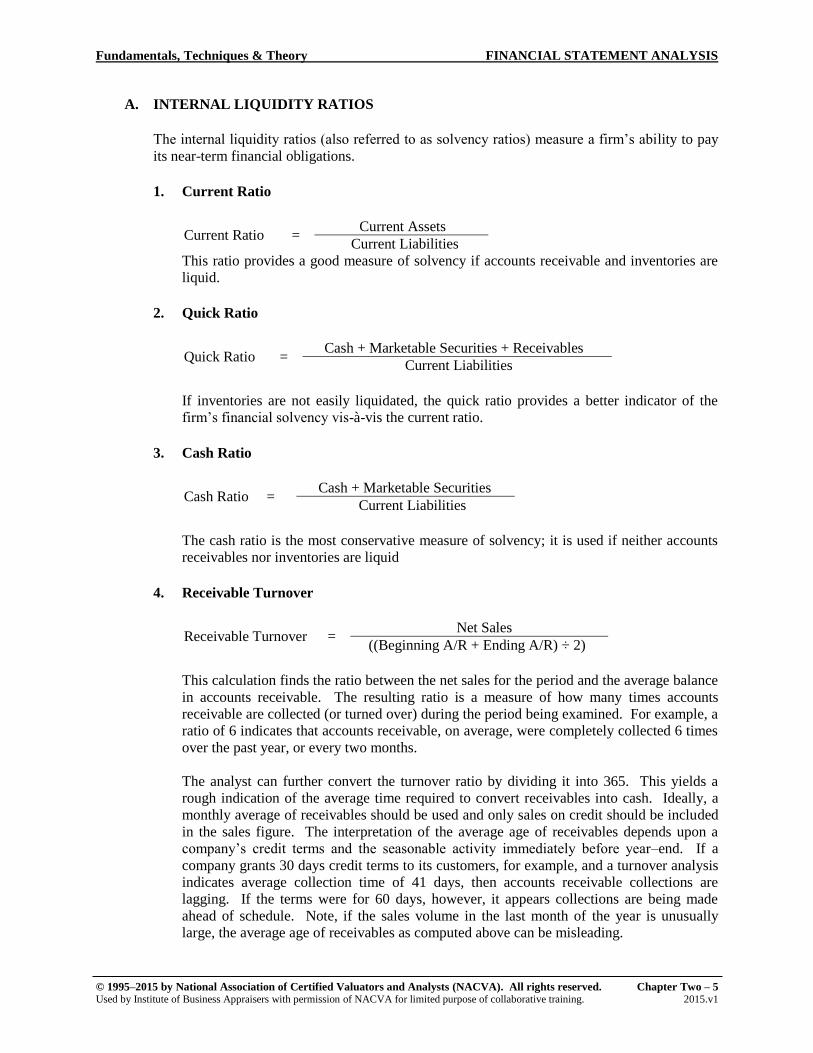
A. INTERNAL LIQUIDITY RATIOS
The internal liquidity ratios (also referred to as solvency ratios) measure a firm’s ability to pay
its near-term financial obligations.
1. Current Ratio
Current Ratio = Current Assets
Current Liabilities
This ratio provides a good measure of solvency if accounts receivable and inventories are
liquid.
2. Quick Ratio
Quick Ratio = Cash + Marketable Securities + Receivables
Current Liabilities
If inventories are not easily liquidated, the quick ratio provides a better indicator of the
firm’s financial solvency vis-à-vis the current ratio.
3. Cash Ratio
Cash Ratio = Cash + Marketable Securities
Current Liabilities
The cash ratio is the most conservative measure of solvency; it is used if neither accounts
receivables nor inventories are liquid
4. Receivable Turnover
Receivable Turnover = Net Sales
((Beginning A/R + Ending A/R) ÷ 2)
This calculation finds the ratio between the net sales for the period and the average balance
in accounts receivable. The resulting ratio is a measure of how many times accounts
receivable are collected (or turned over) during the period being examined. For example, a
ratio of 6 indicates that accounts receivable, on average, were completely collected 6 times
over the past year, or every two months.
The analyst can further convert the turnover ratio by dividing it into 365. This yields a
rough indication of the average time required to convert receivables into cash. Ideally, a
monthly average of receivables should be used and only sales on credit should be included
in the sales figure. The interpretation of the average age of receivables depends upon a
company’s credit terms and the seasonable activity immediately before year–end. If a
company grants 30 days credit terms to its customers, for example, and a turnover analysis
indicates average collection time of 41 days, then accounts receivable collections are
lagging. If the terms were for 60 days, however, it appears collections are being made
ahead of schedule. Note, if the sales volume in the last month of the year is unusually
large, the average age of receivables as computed above can be misleading.
FINANCIAL STATEMENT ANALYSIS Fundamentals, Techniques & Theory
6 – Chapter Two © 1995–2015 by National Association of Certified Valuators and Analysts (NACVA). All rights reserved. 2015.v1 Used by Institute of Business Appraisers with permission of NACVA for limited purpose of collaborative training.
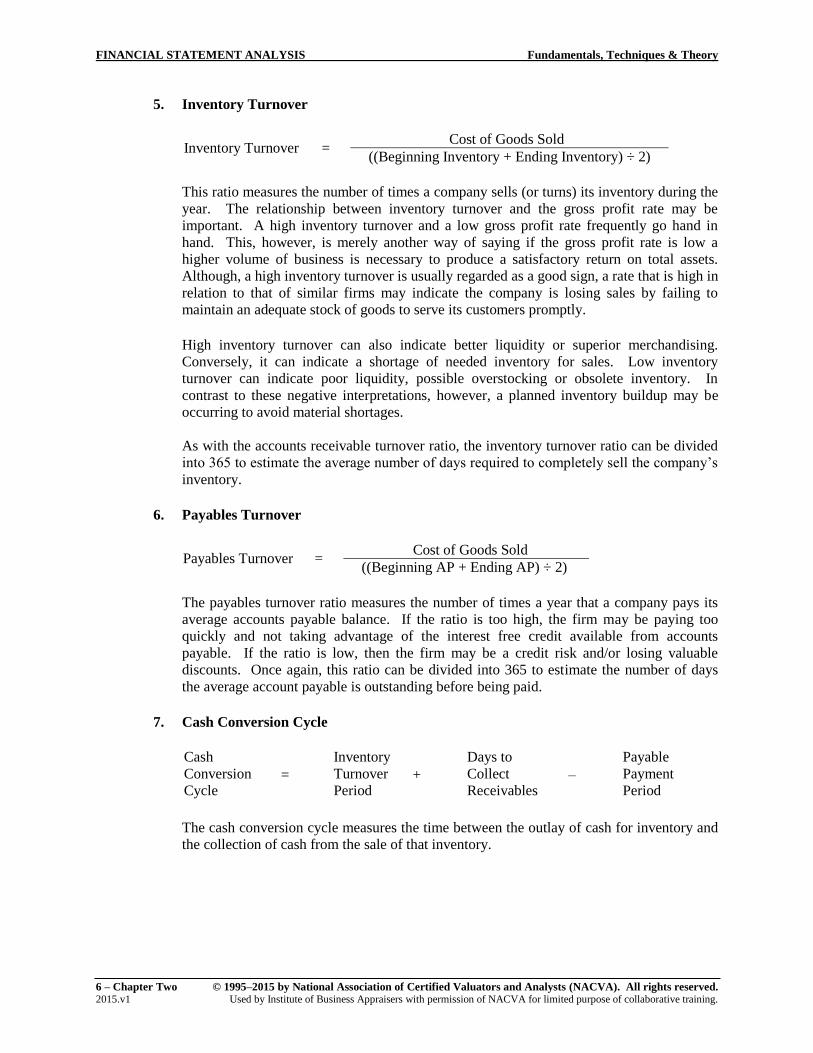
5. Inventory Turnover
Inventory Turnover = Cost of Goods Sold
((Beginning Inventory + Ending Inventory) ÷ 2)
This ratio measures the number of times a company sells (or turns) its inventory during the
year. The relationship between inventory turnover and the gross profit rate may be
important. A high inventory turnover and a low gross profit rate frequently go hand in
hand. This, however, is merely another way of saying if the gross profit rate is low a
higher volume of business is necessary to produce a satisfactory return on total assets.
Although, a high inventory turnover is usually regarded as a good sign, a rate that is high in
relation to that of similar firms may indicate the company is losing sales by failing to
maintain an adequate stock of goods to serve its customers promptly.
High inventory turnover can also indicate better liquidity or superior merchandising.
Conversely, it can indicate a shortage of needed inventory for sales. Low inventory
turnover can indicate poor liquidity, possible overstocking or obsolete inventory. In
contrast to these negative interpretations, however, a planned inventory buildup may be
occurring to avoid material shortages.
As with the accounts receivable turnover ratio, the inventory turnover ratio can be divided
into 365 to estimate the average number of days required to completely sell the company’s
inventory.
6. Payables Turnover
Payables Turnover = Cost of Goods Sold
((Beginning AP + Ending AP) ÷ 2)
The payables turnover ratio measures the number of times a year that a company pays its
average accounts payable balance. If the ratio is too high, the firm may be paying too
quickly and not taking advantage of the interest free credit available from accounts
payable. If the ratio is low, then the firm may be a credit risk and/or losing valuable
discounts. Once again, this ratio can be divided into 365 to estimate the number of days
the average account payable is outstanding before being paid.
7. Cash Conversion Cycle
Cash
Conversion
Cycle =
Inventory
Turnover
Period +
Days to
Collect
Receivables –
Payable
Payment
Period
The cash conversion cycle measures the time between the outlay of cash for inventory and
the collection of cash from the sale of that inventory.

Fundamentals, Techniques & Theory FINANCIAL STATEMENT ANALYSIS
© 1995–2015 by National Association of Certified Valuators and Analysts (NACVA). All rights reserved. Chapter Two – 7 Used by Institute of Business Appraisers with permission of NACVA for limited purpose of collaborative training. 2015.v1
B. OPERATING EFFICIENCY RATIOS
1. Net Fixed Asset Turnover
Net Fixed Asset Turnover = Net Sales
((Beginning F/A + Ending F/A) ÷ 2)
This ratio can be an indication of management’s ability to effectively utilize fixed assets.
Additionally, a low ratio can often be an indication of obsolete or impaired fixed assets.
2. Total Asset Turnover
Total Asset Turnover = Net Sales
((Beginning Total Assets + Ending Total Assets) ÷ 2)
This ratio is an indication of management’s ability to effectively utilize total assets;
however, it is important to note the asset turnover ratio can be affected by factors other
than a firm’s efficiency. A firm with newer and less depreciated assets will cause the ratio
to fall relative to the firms with older or more depreciated assets. Additionally, a low ratio
can often be an indication of obsolete or impaired assets.
C. OPERATING PROFITABILITY RATIOS
Operating ratios are used in the evaluation of management performance.
1. Cost of Sales/Sales (%)
Cost of Sales = Cost of Sales
Net Sales
This ratio is an indication of the subject company’s operating environment and operating
efficiency. For example, if the company’s cost of sales/sales ratio is increasing, it may
indicate competition is forcing the company to cut profit margins or it may indicate the
company is unable to pass its increasing costs to its customers.
2. Gross Margin (%)
Gross Margin = Net Sales - Cost of Sales
Net Sales
This ratio expands on the issues found by analyzing the cost of sales ratio. Note that the
sum of the two ratios (cost of sales and gross margin) equals 100%.

FINANCIAL STATEMENT ANALYSIS Fundamentals, Techniques & Theory
8 – Chapter Two © 1995–2015 by National Association of Certified Valuators and Analysts (NACVA). All rights reserved. 2015.v1 Used by Institute of Business Appraisers with permission of NACVA for limited purpose of collaborative training.
3. Operating Expenses/Sales (%)
Operating Expenses = Operating Expenses
Net Sales
Management generally has greater control over operating expenses than it has over
revenue. This ratio is often used as a measure of management’s ability to control its
operating expenses.
4. Operating Margin (%)
Operating Margin = Income from Operations
Net Sales
This ratio expands on the issues identified by analyzing the operating expense ratio.
5. Return on Assets (%) (ROA)
ROA = Net Income
((Beg. Total Assets + Ending Total Assets) ÷2)
This ratio is an important test of management’s ability to earn a return on assets funded
from all sources (debt and equity). The income figure used in computing this ratio should
be income before deducting interest expense, since interest is a payment to creditors for
funds used to acquire assets. Income before interest reflects earnings throughout the year;
therefore it should be related to the average investment in assets during the year.
6. Return on Equity (%) (ROE)
ROE = Net Income
((Beg. Common Equity + Ending Common Equity) ÷ 2)
Because interest and dividends paid to creditors and preferred stockholders are fixed in
amount, a company may earn a greater or lesser return on the common stockholders’ equity
than on its total assets.
Financing with fixed-return securities is often called trading on the equity. Results may be
favorable or unfavorable to holders of common stock. For example, if the rate of return on
total assets is greater than the average rate of payment to creditors and preferred
stockholders, the common stockholders will gain from trading on the equity and return on
common equity will increase.
D. BUSINESS RISK (OPERATING) ANALYSIS
Business risk refers to the volatility of earnings over time. (See the formal definition in the
International Glossary of Business Valuation Terms in Chapter Eight.) There are three ratios
(two of these require knowledge of basic statistics to derive) used to assess the business risk.
Fundamentals, Techniques & Theory FINANCIAL STATEMENT ANALYSIS
© 1995–2015 by National Association of Certified Valuators and Analysts (NACVA). All rights reserved. Chapter Two – 9 Used by Institute of Business Appraisers with permission of NACVA for limited purpose of collaborative training. 2015.v1
σEBIT
μEBIT
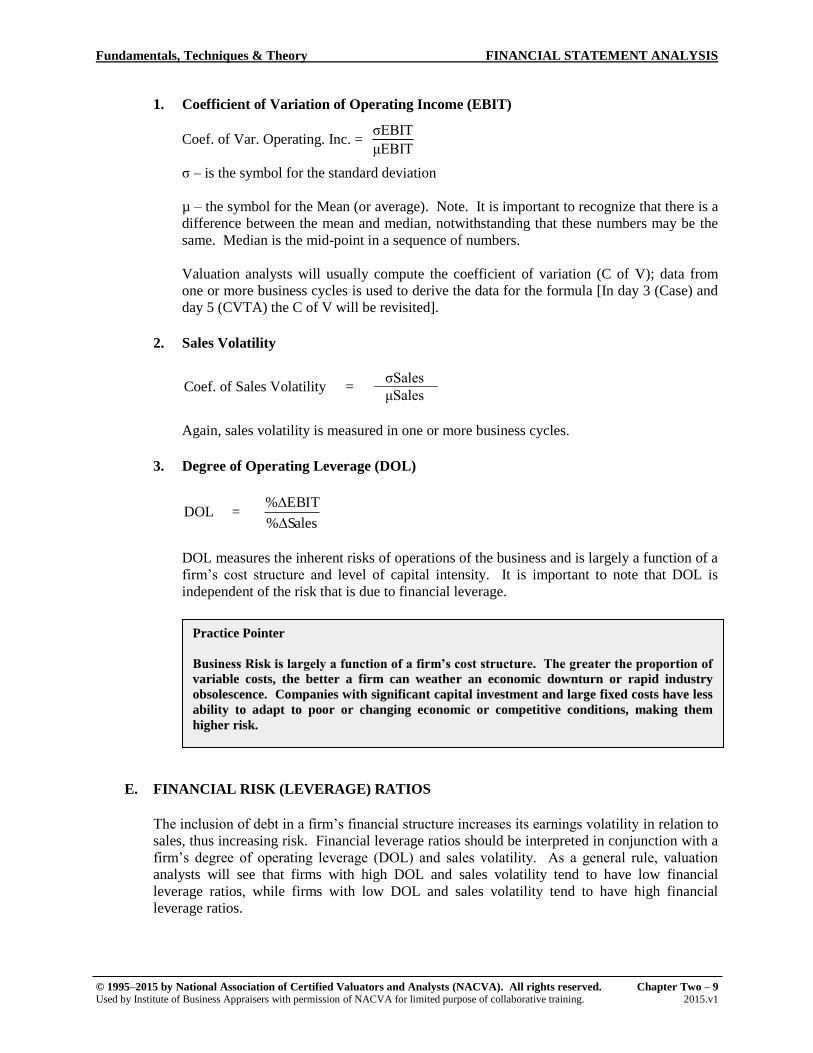
1. Coefficient of Variation of Operating Income (EBIT)
Coef. of Var. Operating. Inc. =
σ – is the symbol for the standard deviation
µ – the symbol for the Mean (or average). Note. It is important to recognize that there is a
difference between the mean and median, notwithstanding that these numbers may be the
same. Median is the mid-point in a sequence of numbers.
Valuation analysts will usually compute the coefficient of variation (C of V); data from
one or more business cycles is used to derive the data for the formula [In day 3 (Case) and
day 5 (CVTA) the C of V will be revisited].
2. Sales Volatility
Coef. of Sales Volatility = σSales
μSales
Again, sales volatility is measured in one or more business cycles.
3. Degree of Operating Leverage (DOL)
DOL = Sales%
EBIT%
DOL measures the inherent risks of operations of the business and is largely a function of a
firm’s cost structure and level of capital intensity. It is important to note that DOL is
independent of the risk that is due to financial leverage.
E. FINANCIAL RISK (LEVERAGE) RATIOS
The inclusion of debt in a firm’s financial structure increases its earnings volatility in relation to
sales, thus increasing risk. Financial leverage ratios should be interpreted in conjunction with a
firm’s degree of operating leverage (DOL) and sales volatility. As a general rule, valuation
analysts will see that firms with high DOL and sales volatility tend to have low financial
leverage ratios, while firms with low DOL and sales volatility tend to have high financial
leverage ratios.
Practice Pointer
Business Risk is largely a function of a firm’s cost structure. The greater the proportion of
variable costs, the better a firm can weather an economic downturn or rapid industry
obsolescence. Companies with significant capital investment and large fixed costs have less
ability to adapt to poor or changing economic or competitive conditions, making them
higher risk.

FINANCIAL STATEMENT ANALYSIS Fundamentals, Techniques & Theory
10 – Chapter Two © 1995–2015 by National Association of Certified Valuators and Analysts (NACVA). All rights reserved. 2015.v1 Used by Institute of Business Appraisers with permission of NACVA for limited purpose of collaborative training.
1. Long-Term Debt-to-Equity Ratio (or Debt/ Equity Ratio)
Debt/Equity = Long-Term Debt + Deferred Tax Liabilities
Total Equity
This ratio is controversial. Some valuation analysts will exclude deferred tax liabilities if
they believe these liabilities will not eventually be paid. Some analysts will include the
effect of operating leases, especially if the lease should have been capitalized.
2. Total Debt-to-Total Invested Capital Ratio
Debt/Capital = Current Liabilities + Long-Term Debt
Total Liabilities + Total Capital
This ratio measures what percentage of a firm’s assets is financed with debt.
3. Total Debt-to-Total Assets Ratio
Current Liabilities + Long-Term Debt
Total Assets
The debt/asset ratio shows the proportion of a company’s assets which are financed
through debt. If the ratio is less than one, most of the company’s assets are financed
through equity. If the ratio is greater than one, most of the company’s assets are financed
through debt. Companies with high debt/asset ratios are said to be “highly leveraged.”
4. Interest Coverage Ratio
Interest Coverage = Earnings Before Interest and Taxes (EBIT)
Interest Expense
This ratio is a measure of a firm’s ability to meet its interest payments. A high ratio may
indicate a borrower would have little difficulty in meeting the interest obligations of a loan.
This ratio also serves as an indicator of a firm’s capacity to take on additional debt.
5. Operating Cash Flow Ratio (OCF Ratio or CFO Ratio)
OCF Ratio = OCF
Current Liabilities
This ratio measures a firm’s ability to generate the resources required to meet its current
liabilities.
Fundamentals, Techniques & Theory FINANCIAL STATEMENT ANALYSIS
© 1995–2015 by National Association of Certified Valuators and Analysts (NACVA). All rights reserved. Chapter Two – 11 Used by Institute of Business Appraisers with permission of NACVA for limited purpose of collaborative training. 2015.v1
6. Operating Cash Flow to Long-Term Debt (OCF/ LTD)
OCF/LTD = OCF
Book Value of Long-Term Debt + PV of Lease Obligations
This ratio measures the ability to service total long-term debt, including lease obligations.
Since operating cash flows already reflect interest expense, payment of interest expense is
reflected in the ratio.
7. Operating Cash Flow to Total Debt Ratio (OCF/ TD)
OCF/TD = OCF
Total Long-Term Debt + Current Interest Bearing Liabilities
This ratio measures the ability to service total interest bearing debt. Since operating cash
flows already reflect interest expense, payment of interest expense is reflected in the ratio.
V. COMPARATIVE ANALYSIS
Comparative analysis uses information gleaned from the two previous sources, common-size
analysis and ratio “trend” analysis. As indicated by its title, comparative analysis involves
comparison of the subject company’s status and performance with those of specific other companies
or industry averages. Comparative analysis can involve either a comparison over a historical period
of more than one year or over the latest complete 12-month period.
A. SOURCES OF INFORMATION
In many cases, specific company data for comparison is not available, and the analyst will need
to use general industry information. Some of the most common sources for general industry
information are:
1. Risk Management Association (RMA) ANNUAL STATEMENT STUDIES®2
a) The Standard Edition is the only source of financial ratio benchmarks derived directly
from more than 200,000 statements of financial institution borrowers and prospects
and includes over 700 industries. The data includes income statement and balance
sheet common size comparisons as well as 19 operating ratios.
b) The Valuation Edition features not only the national data contained in the standard
RMA Annual Statement Studies® database, but enhanced financial ratios, national and
regional data, percentages and real dollar values, and industry growth rates.
c) The Valuation Edition Unlimited Edition includes the current year data and features
contained in both the standard and valuation editions of the RMA Annual Statement
Studies® database, plus Standard Edition data from 2003 through 2005 and Valuation
Edition data from 2006 through current RMA year.
2 Risk Management Association (RMA) Annual Statement Studies® is available from NACVA (800-677-2009) and ValuSource (800-825-8763).
ANNUAL STATEMENT STUDIES®, RMA THE RISK MANAGEMENT ASSOCIATION®, and the RMA Logo are trademarks of the Risk
Management Association. RMA owns the copyright in the ANNUAL STATEMENT STUDIES® data. The data is used under license from RMA.

FINANCIAL STATEMENT ANALYSIS Fundamentals, Techniques & Theory
12 – Chapter Two © 1995–2015 by National Association of Certified Valuators and Analysts (NACVA). All rights reserved. 2015.v1 Used by Institute of Business Appraisers with permission of NACVA for limited purpose of collaborative training.
2. IRS Corporate Ratios3
a) This database—compiled from over five million corporate tax returns—displays,
analyzes, and customizes financial statement information, as well as calculated
percentages and ratios. It provides industry standard financial statement
benchmarking data for over 250 industries.
3. Almanac of Business and Industry Ratios from Prentice Hall, Inc.
4. Integra statistics by industry
5. Key Business Ratios from Dun & Bradstreet, Inc.
6. Specific industry statistics from industry associations
B. QUALITY OF INFORMATION
In constructing a comparative analysis, the method of accounting for both the subject company
and the comparison company or companies should be consistent. This is often very difficult to
establish, unless the provider of the information adequately discloses the method of accounting
for the comparison. In addition, the following considerations have become generally accepted
as important checklist components to ensure that a specific company comparison is meaningful:
1. Companies must be of similar size, relative to sales volume and total assets
2. Companies must have similar historical and current levels of profitability
3. Companies must have similar competitive positions within the industry
4. Companies must be in the same or similar line of business
5. Companies must have similar historical rates of growth
6. Companies must have similar capital structures
7. Companies must offer a similar product line
C. STEPS IN COMPARATIVE ANALYSIS
The following steps outline a typical comparative company analysis. (For illustrative purposes
this section will assume that the analyst is relying on RMA data; the use of RMA should not be
construed as a preference of RMA over Integra or other alternative data sources.)
1. Prepare common-size income statements and common-size balance sheets
2. Determine results of selected key financial ratios of the subject company for the latest 12-
month period
3. Determine the appropriate SIC# (Standard Industrial Classification) or NAICS# (North
American Industrial Classification System) of the subject company
4. Obtain RMA “Financial Statement Studies” for appropriate SIC number and prepare a
worksheet that lists subject company financial ratios, RMA financial ratios, and the
differences between the two. NOTE: RMA data is gathered from financial information
submitted to banking and other financial institutions to secure credit
3 IRS Corporate Ratios is available from NACVA (800-677-2009) and ValuSource (800-825-8763).
Practice Pointer
The practitioner should be aware of the pros and cons in the utilization of different data
sources.
Fundamentals, Techniques & Theory FINANCIAL STATEMENT ANALYSIS
© 1995–2015 by National Association of Certified Valuators and Analysts (NACVA). All rights reserved. Chapter Two – 13 Used by Institute of Business Appraisers with permission of NACVA for limited purpose of collaborative training. 2015.v1
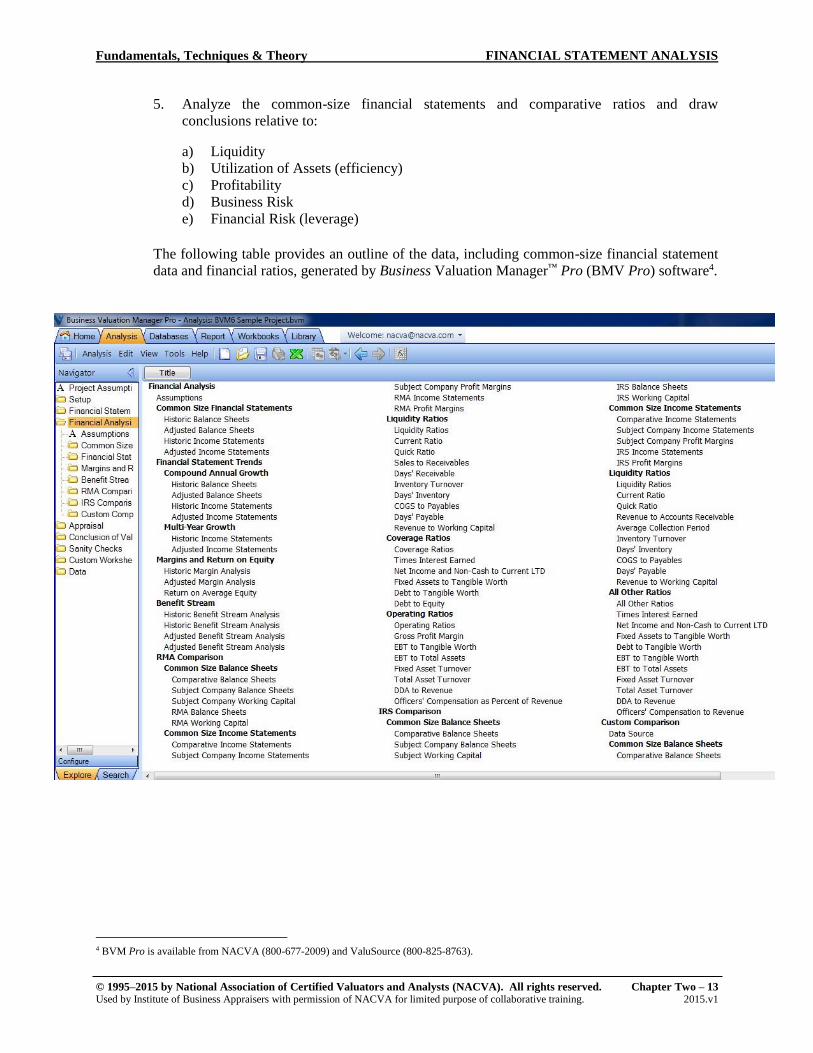
5. Analyze the common-size financial statements and comparative ratios and draw
conclusions relative to:
a) Liquidity
b) Utilization of Assets (efficiency)
c) Profitability
d) Business Risk
e) Financial Risk (leverage)
The following table provides an outline of the data, including common-size financial statement
data and financial ratios, generated by Business Valuation Manager™ Pro (BMV Pro) software4.
4 BVM Pro is available from NACVA (800-677-2009) and ValuSource (800-825-8763).

FINANCIAL STATEMENT ANALYSIS Fundamentals, Techniques & Theory
14 – Chapter Two © 1995–2015 by National Association of Certified Valuators and Analysts (NACVA). All rights reserved. 2015.v1 Used by Institute of Business Appraisers with permission of NACVA for limited purpose of collaborative training.
In addition to the foregoing chapter of Fundamentals, Techniques and Theory, there are other
sources of information which many professionals in the valuation business have read and/or
added to their library. The valuation analyst, progressing through the steps in a valuation, should
be generally familiar with the body of knowledge represented by this text and other publications.
These can include books, papers, articles, seminars, classes, and the experience of a valuation
mentor or other business mentors the valuation analyst may know. Those at the top of the field
continue to learn and grow. Recommended reading includes, but is not limited to:
Blackman, Irving L., Valuing Your Privately Held Business, The Art & Science of
Establishing Your Company/s Worth.
Campbell, Ian R., and Howard E. Johnson, The Valuation of Business Interests, Chapter
3 (Business Analysis).
Copeland, Tom, Tim Koller, and Jack Murrin, Valuation: Measuring and Managing the
Value of Companies.
Damodaran, Aswath, Damodaran on Valuation, Security Analysis for Investment and
Corporate Finance, Chapter 5 (Estimation of Growth Rates) and Chapters 10 through 12
(Ratios).
Dun & Bradstreet, Inc. Industry Norms and Key Business Ratios, select by appropriate
year.
Fridson, Martin and Fernando Alvarez, Financial Statement Analysis: A Practitioner’s
Guide.
Green, Robert, “Using Correlation Analysis in Determining Proper Method to Project
Earnings”, The Valuation Examiner, 1st qtr, 1994.
Helfert, Erich A., Techniques of Financial Analysis, Chapter 1, Part III (The Nature of
Financial Statements), and Chapter 3 (Assessment of Business Performance – Ratio
Analysis and Performance).
Hitchner, James R., Financial Valuation Applications and Models, Chapter 3 (Financial
Statement and Company Risk Analysis).
Pratt, Shannon P., R. F. Reilly and R. P. Schweihs, Valuing a Business, The Analysis and
Appraisal of Closely Held Companies, Chapter 8 (Financial Statement Analysis).
Risk Management Associates, Annual Statement Studies, select by appropriate year.
Rufus, Robert, “Financial Ratios: Use, Predictive Power and the Z-Score”, The
Valuation Examiner, M/J 2003.
Rutter, Grover, “A Matter of Equity: The Old Safe-Rate Method Yard Stick for
Measurement”, The Valuation Examiner, F/M 1999.
Statistical Abstract of the United States, select by appropriate year.
Troy, Leo, Almanac of Business and Industry Ratios, select by appropriate year.