Financial State of Irish Farms and Future Investment Requirements
110
Financial Status of Irish Farms and Future Investment Requirements 2015 Fiona Thorne, Emma Dillon, Trevor Donnellan, Kevin Hanrahan, Thia Hennessy, Anne Kinsella, Doris Lapple and Michael McKeon
-
Upload
allaboutbusiness -
Category
Environment
-
view
165 -
download
2
Transcript of Financial State of Irish Farms and Future Investment Requirements
Financial Status of Irish Farms and Future Investment
Requirements
2015 Fiona Thorne, Emma Dillon, Trevor Donnellan, Kevin Hanrahan, Thia Hennessy, Anne Kinsella, Doris Lapple and Michael McKeon

A Review of the Financial Status of Irish
Farms and Future Investment
Requirements

i
Foreword It is generally recognised that growth in agriculture is fuelled by investment. This investment
can come in numerous forms. It can arise in the form of additional human capital, improved
genetic merit of animals, improved crop varieties and better quality machinery and
buildings. Finally investment can also come in the form of additional investments. In this
study we will focus on the latter category of farm investment.
It is evident from numerous international literature sources that farmers’ ability to access
scarce farm assets and to access financing has a major role in agricultural development.
Hence, it is interesting to note that much of the focus of recent research and agricultural
policy development concerning the Food Harvest 2020 expansion targets have not
addressed the ability of farm units to balance net income flows and investment requirements.
In addition to income flow considerations, financing possibilities are bound by the leverage
rates and collateral requirements of farms, which are often outside of farmers’ control.
Therefore, the current capital endowments, capital structures and financial leverage of farms
are the critical underlying factors that finally determine the potential for future development
patterns and the performance of the agricultural sector.
It was against this background that Teagasc initiated a research project to review the
financial status of Irish farms and identify future investment requirements. Bank of Ireland
generously agreed to part fund this initiative and the study was conducted in 2014.
Teagasc and Bank of Ireland would like to acknowledge the active involvement of a wide
range of stakeholders who participated in the advisory group which was established at the
outset of this study. Their helpful suggestions and critical comment during the course of the
study were greatly appreciated. All errors and omissions remain the responsibility of the
authors.
______________ __________________ Professor Gerry Boyle Mr. Mark Cunningham Director, Director of Business Banking, Teagasc Bank of Ireland

ii
Acknowledgements
The authors of the report would like to acknowledge the data provided by the farmers
participating in the Teagasc National Farm Survey and also the Teagasc farm recording staff
who carry out the surrey. In particular, Brian Moran, Anne Curley and Marian Moloney
deserve a special mention for their contribution to the compilation of data for the purpose of
this report. Any errors or omissions remain the sole responsibility of the authors.
iii
Advisory Group Membership Teagasc:
Agricultural Economics and Farm Surveys Dept., Teagasc
Fiona Thorne
Trevor Donnellan
Kevin Hanrahan
Anne Kinsella
Brian Moran
Emma Dillon
Thia Hennessy
Pig Development Department, Teagasc
Michal Mc Keon
Farm Management Dept., Teagasc
Kevin Connolly
Other
Bank of Ireland
Sean Farrell
Agricultural Consultants Association
Martin O’Sullivan
Irish Farmers Association
Rowena Dwyer
Irish Cattle and Sheep Association
Eddie Punch
Irish Creamery Milk Suppliers Association
John Enright
Irish Cooperative Organisations Society
TJ Flanagan
Macra na Feirme
Derry Dillon
Department of Agriculture Food and Marine
Sinead McPhillips
University College Cork
Michael Keane
UCD, School of Agriculture and Food Science
Doris Laepple

iv
v
Table of Contents Foreword i Advisory Group Membership iii Index of Figures – Main Text vi Index of Tables – Main Text vi Index of Figures – Appendices vii Index of Tables – Appendices vii Executive Summary viii Chapter 1 Introduction
1.1 Background 1.2 Short-term economic outlook for Irish agriculture
Chapter 2 A review of the Financial Status of Irish Farms 2002 to 2013: An Analysis of Teagasc National Farm Survey (NFS) Data 2.1 Introduction 2.2 Level of indebtedness 2.3 Level of farm assets 2.4 Solvency levels 2.5 Liquidity levels 2.6 Financial efficiency levels 2.7 Concluding comments Chapter 3 A Comparison of the Financial Structure of Farming in the EU: An Analysis of Data from the Farm Accountancy Data Network (FADN) 3.1 Introduction 3.2 Total asset value 3.3 Total liability value 3.4 Farm financial indicators 3.5 Concluding remarks
vi
Chapter 4 The Dynamic of Investment 4.1 Introduction 4.2 Background 4.3 Empirical model 4.4 Data and descriptive analysis 4.5 Econometric analysis of the determinants of investment 4.6 Conclusion Chapter 5 Investment Requirements of the Dairy Farm Sector to 2020 5.1 Introduction 5.2 Dairy farm sector investment requirements to 2020 5.3 Short-term expansion plans 5.4 Access to credit in the farm sector Chapter 6 Current Financial Situation and Investment requirements of the Pig Sector by 2020 6.1 Introduction 6.2 Food harvest 2020 6.3 Industry structure 6.4 Current pig sector profitability 6.5 Financial investment requirements until 2020 6.6 Conclusion Chapter 7 Scenario Analysis 7.1 Introduction 7.2 FAPRI-Ireland aggregate sector scenario analysis 7.3 FAPRI-Ireland farm sector scenario analysis Chapter 8 Caveats and Conclusion 8.1 Summary remarks 8.2 Caveats 8.3 Conclusion References Appendices

vii
Index of Figures – Main Text Figure 1.1 Teagasc NFS average farm income, with estimate for 2014 and forecast for 2015 Figure 2.1 Average farm debt in real and nominal terms (2002-2013) Figure 2.2 Investment purposes per loan category (2002-2013) Figure 2.3 Gross debt in nominal and real terms (2002-2013) Figure 2.4 Average total farm assets values compared to price indices for key asset items (2002-2013) Figure 2.5 Debt/Asset ratio by system (2002-2013) Figure 2.6 Times interest ratio by system (2002-2013) Figure 2.7 Financial efficiency ratio by system (2002-2013) Figure 2.8 Financial efficiency – economic viability assessment by system (2013) Figure 3.1 Average total asset value € per farm by MS in 2012 Figure 3.2 Average total liability value € per farm by MS in 2012 Figure 3.3 Average liabilities-to-assets ratio per farm by FADN region in 2012 Figure 3.4 Liquidity (Times Interest ratio) per farm by FADN region in 2012 Figure 3.5 Financial efficiency per farm by FADN region in 2012 Figure 4.1 Level of investment grouped by farm system5 Figure 5.1 Irish milk deliveries (fat adjusted) on a quota year basis Figure 5.2 Average net new investment on Irish dairy farms Figure 5.3 Existing dairy farmers’ production plans to 2017 Figure 5.4 Planned milk production increase to 2017 for expanding dairy farmers Figure 5.5 Existing dairy farmers’ intended funding investment sources Figure 5.6 Success of obtaining loan finance from banks (percent of farms) Figure 6.1 European pig density Figure 6.2 World wheat and maize demand: closing stock percent Figure 6.3 Prices of feed ingredients (€/tonne) Figure 6.4 Margin over feed required and received (c/kg dwt) Figure 6.5 Irish sow population 1975-2014 (000’s)

viii
Index of Tables – Main Text Table 2.1 Average farm debt from commercial farms represented in the Teagasc, National Farm Survey (2002-2013) Table 2.2 Proportion of farms with outstanding debt at year end (2002-2013) Table 2.3 Average total farm assets from commercial farms represented in the Teagasc, National Farm Survey (2002-2013) Table 4.1 Average net new investment – by farm system – 2013 Table 4.2 Descriptive statistics and variable description Table 4.3 Comparison of farms grouped by level of investment Table 4.4 Probit model results of the decision to invest Table 4.5 Summary of factors affecting investment Table 5.1 Investment requirements for existing dairy farms Table 5.2 Short-term investment plans of dairy and new entrant farms 2015-2017 Table 6.1 Irish compound pig feed price (€/tonne) Table 6.2 Feed cost (cent/kg deadweight) Table 6.3 Common cost (cent/kg dwt) Table 6.4 Financial repayments (principle and interest) Table 6.5 Capital investment funding under Welfare Housing Grant schemes Table 6.6 Irish farm pigmeat prices (c/kg) Table 6.7 Comparison of compound pig feed prices (€/tonne) Table 6.8 Finance required for feed credit elimination – assumptions Table 6.9 Finance for feed credit elimination

ix
Index of Figures – Appendices Appendix 2.1 Average farm liabilities per loan purpose category, by farm system (2002-2013) Average liability per farm for loan purpose: Other (2002-2013) Average liability per farm for loan purpose: Working capital (2002-2013) Average liability per farm for loan purpose: Machinery (2002-2013) Average liability per farm for loan purpose: Buildings (2002-2013) Average liability per farm for loan purpose: Land improvements (2002-2013) Average liability per farm for loan purpose: Land purchase (2002-2013) Average liability per farm for loan purpose: Livestock (2002-2013) Appendix 2.2 - Solvency Ratios Average equity/asset and debt/equity ratios per loan purpose category, by farm system (2002-2013) Equity/asset ratio (2002-2013) Debt/equity ratio (2002-2013)
Index of Tables – Appendices Appendix 2.1 Average farm liabilities per loan purpose category, by farm system (2002-2013) Appendix 3.1 Asset value by farm system and by member state (2012) Appendix 3.2 Liabilities by farm system and by member state (2012) Appendix 3.3 Solvency levels by farm system and by member state (2012) Appendix 3.4 Liquidity levels by farm system and by member state (2012) Appendix 3.5 Financial efficiency levels by farm system and by member state (2012) Appendix 6.1 Selected EU member state sow populations (000’s) Appendix 6.2 Assumptions for increased sow herd output Appendix 6.3 Financial implication from increased sow herd output

x
Executive Summary
Background
x It is generally recognised that growth in agriculture is fuelled by investment.
x It is evident from numerous international literature sources that farmers’ ability to
access scarce farm assets and to access financing can play a major role in agricultural
development.
x Hence, it is interesting to note that most interest in recent research and agricultural
policymaking, concerning growth potential based on the recommendations from the
Food Harvest 2020 document, have failed to document the ability of farm units to
balance net income flows and investment requirements.
x It was against this background that Teagasc initiated a research project to review the
financial status of Irish farms and identify future investment requirements. Bank of
Ireland generously agreed to part fund this initiative and the study was conducted in
2014.
Summary of financial status of Irish farms
x Teagasc National Farm Survey (NFS) data has shown that the average level of debt
on dairy and tillage farms was significantly higher than on livestock farms over the
time period examined (2002-2012).
x The average level of debt on all farms (farms with and without debt) in 2013 was
€24,000, with dairy farms recording the highest level of debt at an average of
approximately €62,000 for all dairy farms, and an average of approximately
€94,000 for the sub sample of dairy farms that have debt.
x With regard to farm loans in recent years, the majority of loans were used for
buildings, land purchase and working capital.
x The closing balance of debt on all farms in 2013, as recorded by the Teagasc National
Farm Survey, for the 80,000 commercial farms represented by the sample, was
approx. €1.9 billion.
x The analysis of Teagasc NFS data indicates that despite the increase in liabilities
recorded on farms in nominal terms in recent years, the historically low level of debt
relative to assets and equity reaffirms the farm sector’s strong financial position.
x In financial terms (and ensuing repayment capacity) the sector has remained
relatively well insulated from the negative risks associated with commodity
production (such as adverse weather), changing macroeconomic conditions in the
world economy, as well as any fluctuations in farm asset values that may have
occurred due to changing demand for agricultural assets.

xi
Summary of the comparison of the financial structure of farming in the EU
x Given that Irish agriculture is now competing in an increasingly globalised market
place, the financial stability from an inter country perspective (i.e. between
competing countries) is very important.
x The financial indicators examined in the report using data from the European
Commission Farm Accountancy Data Network (FADN) indicated that on average
Irish farms have relatively low debt and high asset values relative to the EU average
for all farms.
x Furthermore, looking at solvency, liquidity and financial efficiency indicators it is
evident that Irish farms are in a healthy position in EU terms.
x While previous work by Teagasc has shown that Ireland continues to exhibit a
healthy position in terms of the competitiveness of its dairy sector (in EU and
international markets), in a market which is increasingly exposed to market price
volatility, the ability to demonstrate resilience will be equally important in the future.
Given that this research has indicated that not only does Irish dairy farming enjoy a
competitive advantage in cost terms within the EU, the level of debt and financial
status of Irish dairy farms should also provide Irish farms with a relative advantage
in resilience terms given that they are not servicing high debt levels in years of
extreme market volatility.
Summary of the dynamics of investment
x Investment levels, typical characteristics and determinants of investment decisions
are described and analysed using 2013 Teagasc NFS data.
x The analysis showed that Irish farms on average had net new investments of
approximately €8,000 per farm in 2013, but this figure varied considerably between
farm systems.
x Large dairy farms managed by farmers with higher family farm income and an off-
farm income earned by the spouse demonstrated a higher probability of investment.
Summary of projected investment needs towards 2020 – Dairy
x Teagasc NFS data show that €2.4 billion has been invested by dairy farms in the
2007 to 2013 period. In 2013, 40 percent of dairy farmers reported that they had
sought bank finance credit. The vast majority (80 percent) of farmers, dairy and
others, reported that they were successful in their bank loan applications indicating
that there is not a major problem with access to credit in the farm sector.
x It is estimated that a further €1.47 billion will be invested on dairy farms in the 2014
to 2020 period in order to achieve the Food Harvest 50 percent expansion target.
x At a milk price scenario of 31 cent per litre the current population of dairy farms
could profitably increase milk production by 43 percent over the Food Harvest

xii
baseline of 2007 to 2009. This expansion would require an investment of €1.24
billion. About €400 million of this is for the acquisition of cows which may be
funded out of internal resources rather than bank credit.
x To reach the Food Harvest 2020 target, approximately 500 new entrants would be
required with a total start-up cost of €230 million.
x The results of a recent survey of farmers participating in the Teagasc National Farm
Survey support these results. Up to 60 percent of dairy farmers plan to expand milk
production in the first 2 years following milk quota removal and almost 400 non-
dairy farmers have engaged in some conversion to dairy planning. In aggregate it is
expected that the national milk pool will increase by approximately 17 percent in the
initial years following milk quota removal. Up to 70 percent of dairy farmers plan to
use bank finance to fund this investment with the remaining 30 percent using
internal sources of finance.
x It is important to note that farmers’ expansion plans will be significantly influenced
by the economic environment. Milk price volatility will be an inevitable feature of
dairy markets in the coming years but the general trend in milk prices is upwards.
While an expansion of the sector is most likely to occur, the pace and magnitude of
that expansion will be dictated by the returns to milk production at the farm-level.
Summary of the financials and investment needs towards 2020 - Pigs
x The Irish pig industry continues to improve its efficiency levels despite tight financial
margins. The national average output has now increased to 25 pigs per sow per year and
the sale weight has continued to rise to 105 kilograms (2013 figures).
x Under the Food Harvest 2020 report ambitious targets were set for the Irish pig sector
to further expand and increase efficiency. If these targets are to be met then further
capital investment will be required from financial institutions.
x The most immediate significant investment requirement identified by the industry is a
reduction in the merchant feed credit which currently inflates feed prices and the cost of
pig production. An elimination of merchant credit would decrease the cost of
production and allow the Irish pig industry to become more internationally competitive.
x Investment in farm buildings is also a priority for the pig industry. An estimated
€27.7million has been invested by the industry to comply with loose dry sow housing
regulations. While this investment has ensured compliance with new welfare standards,
it has not generated increased productivity but has increased the debt burden of units,
and has been to the detriment of investment in other housing e.g. weaner/finisher
housing that now requires refurbishment.
x An expansion of the Irish sow herd size to 200,000 sows was a key target of Food
Harvest 2020. The additional 56,000 sows required to meet this target would require
an investment of €280 million at current prices.
xiii
x A more likely and prudent scenario is for pig farms to maximise the output potential of
their existing herd through an increase in the number of pigs produced per sow (to
reach 27.2 pigs per sow per annum) and the achievement of higher sale weights (to
reach 110 kilograms per finished pig where possible). The cost of this extra investment
would equate to €539,000 for the average sized pig unit, but would lower the cost of
production per kilogram by having the effect of diluting fixed costs across a larger
output volume. In addition the national pigmeat output generated from this
development would exceed the original forecasted Food Harvest 2020 output.
Scenario analysis
x In the context of milk quota elimination and the FH2020 target of expanding Irish
milk production by 50 percent relative to the 2007-09 base period, the volatility of
milk prices assumes greater importance and. The scenario analysis carried out using
the FAPRI-Ireland model highlighted the sensitivity of the profitability of milk
production to the price of milk.
x Three milk price scenarios were used to assess the differing levels of profitability
associated with milk production. It was found that the dairy farm level investment
requirement could range from just over €1.5 billion euro to €2 billion euro
depending on the price scenario.
x These findings illustrates the importance of market prospects in framing the extent
to which Irish milk production might expand over the next 5 years and the associated
investment that might be sought to bring this expansion about. Given that it is
impossible to be certain about how international dairy markets will develop, it is
reasonable to adopt a pragmatic approach in assessing the likely level of investment
requirement that will emerge. In this context the investment figure of just under €1.5
billion estimated in the Steady scenario represents a reasonable estimate for
planning purposes.
x It is important to note that total investment figures estimated in the report does not
necessarily equate to credit demand. For example, over €400 million of this
investment is for the acquisition of cows and it is probable that in many cases this
would be funded out of the farmers’ own resources.
x In conclusion while the total investment figure is close to €1.5 billion the demand for
bank credit is likely to be lower.

14
Chapter 1
Introduction
1.1 Background It is generally recognised that growth in agriculture is fuelled by investment. This
investment can come in numerous forms. It can comein the form of human capital
embodied in the farm operator, which can be acquired through education, training,
experience and extension. It can also come in the form of improved genetic merit of
animals, improved crop varieties and better quality machinery and buildings. Finally
investment can also come in the form of additional buildings, machines, livestock and
land, commonly referred to as fixed investment. In this study we will focus on the
latter category of farm investment.
It is evident from numerous international literature sources that farmers’ ability to
access scarce farm assets, and their ability to access attractive terms of financing plays
a major role in agricultural development. Hence, it is interesting to note that most of
the recent research and associated agricultural policy development , concerning the
Food Harvest 2020 targets, has not considered the ability of farm units to balance net
income flows and investment requirements.
In addition to income flow considerations, financing possibilities are bound from
above by the leverage rates and collateral requirements of farms, which are often
exogenously fixed. Therefore, the current capital endowments, capital structures and
financial leverage of farms are the critical underlying factors that finally determine the
potential for future development patterns and the performance of the agricultural
sector.
In order to address the aforementioned factors, the remainding sections of this report
are divided into 7 further chapters.
Chapter 2 provides a context for the study by reviewing the financial status of Irish
farms over the past decade using Irish Teagasc National Farm Survey (NFS) data.
Chapter 3 examines how the financial status of Irish farms has evolved through time,
relative to competitor countries in the EU, with a particular focus on the period 2002
to 2012.
Chapter 4 examines the dynamics of investment within Irish agriculture. The analysis
uses Teagasc National Farm Survey data to examine the determinants of investment

15
on all farms with a view to isolating the characteristics of potential investors as well as
determination of the types of farms most likely to be able to fund future investment.
Chapter 5 outlines the investment required at the farm level if the Irish dairy sector is
to meet the target of expanding milk production by 50 percent by 2020.
Chapter 6 summarizes the financial status of Irish pig farms and discusses their
demand for external finance in the medium term. Although the sector is relatively
small in terms of the number of herds, the scale and commercial nature of pig farmers
makes this sector quite unique in Irish farming.
Chapter 7 examines a number of financial ratios which measure farmers’ repayment
capacities. These ratios are projected forward under different market assumptions.
The objective of this chapter is to demonstrate the effect of input and output price
volatility on farmers’ repayment capacity.
Chapter 8 details some caveats that need to be considered and summarises the report’s
conclusions.
1.2 Short term economic outlook for Irish agriculture Before the critical underlying factors that determine the potential for future
development and investment patterns are evaluated in the following chapters, it is
important that the current economic environment of the main sectors of agriculture
are understood along with the short term economic environment that is likely to
prevail.
To understand the current and short term outlook for agriculture, at the end of each
year Teagasc economists estimate the economic outturn for each of the principal
sectors of Irish agriculture in order to arrive at an overall estimate of agricultural
income analogous to that measured in the Teagasc NFS. At the same time they assess
likely developments in each sector over the short term, to arrive at a forecast average
income level for the year ahead (Teagasc, 2014). Invariably there will be some
unanticipated shocks to the system which mean that the forecast is imperfect, but in
general these forecasts are a valuable tool for farmers, the food industry, policy makers
and the banking sector.
Review of 2014
In terms of weather 2014 was one of the best years for grass growing conditions in
Ireland in living memory and marked a contrast to the difficult operating environment
16
of 2012 and 2013. Lower grassland input expenditure in 2014 was driven by lower
levels of feed and fertiliser usage and lower prices.
Market conditions for milk producers and beef finishers took a downturn in 2014 and
the decrease in prices eroded the benefit of lower feed, fertiliser and fuel bills.
Nevertheless, at 12 cent per litre the average dairy net margin in 2014 was unchanged
on the previous year, as milk prices and production costs are estimated to both have
fallen by 2 cent per litre. Beef finishers also experienced lower production costs, but
the impact of lower costs did not fully offset the impact of lower finished cattle prices
and gross margins declined by 9 percent in 2014.
While suckler farmers saw their average output prices fall, the estimated decrease in
input expenditure meant that 2014 margins improved on levels earned in 2013. Sheep
farmers saw their margins improve in 2014, as their production costs decreased, while
lamb prices on average were higher than in 2013.
Irish cereal yields for major crops were above normal in 2014, but a large global
harvest triggered a steep drop in international cereal prices. While cereal direct costs
were down slightly, this was insufficient to negate the drop in output value.
Consequently, cereal margins in Ireland were down for nearly all crops in 2014.
Irish pig producers experienced a decrease in pig prices in 2014, which was mainly due
to the Russian embargo, but benefitted from declining feed prices through most of the
year. Overall, their margins increased in 2014.
The overall level of subsidy payments to Irish agriculture decreased by9 percent in
2014, which had a negative impact on incomes.Overall, these changes in margin and
subsidy payments at the sector level are indicative of a 3 percent drop in farm income
in 2014, relative to 2013.
Outlook for 2015
In 2014 we saw a demand shock with the imposition of the Russian embargo and a
supply shock due to a surge in global milk output, neither of which were anticipated in
advance. Uncertainties of this kind may again emerge in 2015, making it challenging to
forecast income in the year ahead.
Weather conditions can play a significant role in determining grassland and tillage
sector incomes given the impact it can have on yields and production costs. Since it is
not possible to forecast weather for the year ahead, we must assume that weather
conditions reflect a long term average.

17
Figure 1.1 Teagasc NFS average farm income, with estimate for 2014 and
forecast for 2015
Source: Teagasc (2014)
On this basis, feed usage levels in 2015 should be similar to those of 2014. Feed prices
are likely to be lower in the first half of 2015 and higher in the second half, but on
average feed bills for grassland systems in 2015 are forecast to be little changed on the
2014 level. Pig producers may experience a slight increase in their feed prices.
The euro is expected to be weaker against the US dollar in 2015 than it was in 2014.
Allied with concern regarding the security of international fertiliser supplies, this
means that fertiliser prices should be higher in 2015. With no anticipated change in
fertiliser use in 2015, fertiliser expenditure will rise due to the effect of higher prices.
If the sudden and dramatic drop in oil prices in the latter stages of 2014 persists, then
there will be considerable savings in fuel bills in 2015. Electricity prices reflect a mix of
energy prices (coal, gas and oil) and significant capital costs, so the fall in oil prices
may have little impact.
A substantial fall in farm gate milk prices in forecast for 2015. Global milk production
growth in 2014 has outpaced the growth in demand for dairy products and a surplus
has emerged which will depress prices for much of 2015. In Ireland the forecast
reduction in milk prices for 2015 is 28 percent. This would take the annual average
Irish milk price down to 27 cent per litre, a ten cent per litre drop on the estimated
average figure for 2014.
0
5,000
10,000
15,000
20,000
25,000
30,000
35,000
2008 2009 2010 2011 2012 2013 2014 2015
Euro
per
farm

18
Irish beef prices should improve in 2015 and with costs of production relatively
unchanged, margins should be up for all systems. Sheep prices are expected to remain
stable in 2015. A change to the Sheep Grassland payment will impact on margins, but
will not affect incomes.
Stock levels on international grain markets remain at relatively low levels in spite of
the large global harvest in 2014. Cereal prices in 2015 will therefore be highly
dependent on growing conditions globally. For harvest 2015, Irish cereal prices are
forecast to rise by 10 percent. If Irish yields revert to normal levels, then cereal
margins in 2015 will be only very slightly improved on 2014 levels.
Pig meat prices are set to fall slightly in 2015 due to increased EU supplies, and
marginally higher feed prices will also negatively impact on margins in 2015.
The inter-annual variation in Irish agricultural income is heavily associated with any
changes in dairy margins. Much of the rest of Irish farm income is derived from the
subsidy system and hence remains relatively stable. For the Irish dairy sector, 2015 is
shaping up to be very much like 2009, with dairy incomes set to be more than halved.
This will have a strong negative impact on income for the agriculture sector as a whole.
Averaging across all of Irish agriculture, a decline in income of 25 percent is forecast in
2015. Using the narrower Teagasc NFS farm income definition, which excludes some
enterprises and smaller farms, the forecast decrease is steeper, with an average decline
of 30 percent in prospect.

19
Chapter 2
A Review of the Financial Status of Irish
Farms 2002 to 2013: An Analysis of Teagasc
National Farm Survey (NFS) Data
2.1 Introduction
This chapter provides some background context on a range of issues that create a focus
for this study. A review of the performance of Irish farms in terms of key financial
indicators since the year 2002 is provided. Based on a review of the literature the
most often used indicators of farm financial performance are grouped into three broad
categories: liquidity, solvency, and financial efficiency. It is important to keep in mind
that monitoring these measures as a group is more important than focusing on only
one measure at the exclusion of others. Before these frequently used indicators of
financial performance are evaluated it is interesting to observe the historic and current
situation regarding total liabilities and assets based on the balance sheets of Irish farm
data.
2.2 Level of Indebtedness
Given the changes which occurred over the analysis period, in relation to the
prevailing economic and political climate, it is interesting to observe average debt
levels across time and system of production, to see if any discernible trends are
evident. A review of total liabilities on farms is presented in Table 2.1 since the year
2002. Total debt include all current (<1 year, to include bank overdrafts and
short term loans) and non-current liabilities (medium and long term loans,
other debt).

20
Table 2.1: Average Farm Debt From Commercial1 farms represented in the
Teagasc, National Farm Survey (2002-2013)
Year Dairy and
Dairy Other2
Livestock Tillage Total
€ per farm
2002 33,500 7,343 26,767 16,942
2003 31,064 7,672 25,413 16,248
2004 31,954 7,733 21,906 16,391
2005 33,011 8,530 17,728 16,491
2006 32,546 12,463 16,436 18,742
2007 39,462 10,784 23,323 19,792
2008 54,490 11,919 30,201 24,264
2009 50,184 11,634 23,521 22,868
2010 54,014 9,595 41,175 23,277
2011 56,391 9,262 30,500 22,269
2012 63,052 10,061 27,257 23,843
2013 61,672 10,975 30,268 24,398
Source: Authors own analysis of Teagasc, National Farm Survey data.
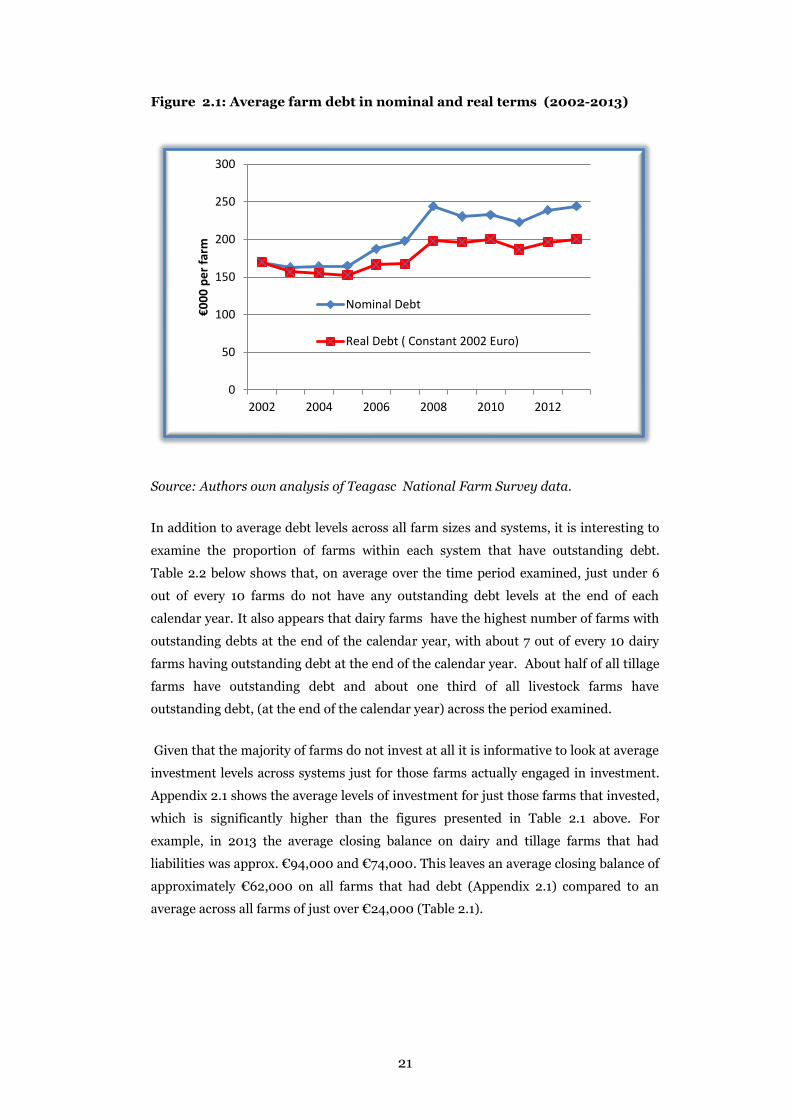
Table 2.1 shows that the level of debt on has been highest on dairy farms over the
recent past, followed by tillage farms. On the other hand the level of debt on beef and
sheep farms was significantly less than that experienced on dairy and tillage farms.
There also appears to have been a marked increase in average investment levels over
the time period examined. While the data presented in Table 2.1 above is in nominal
terms, Figure 2.1 below shows the average investment levels across all sectors in real
terms. These data shows that in real terms, the average investment level per farm does
increase but not at the same rate as indicated by the value in nominal terms.
1 All commercial farms as represented in this chapter refer to all farms within the Teagasc, National Farm Survey with a Standard Output of greater than €8,000. 2 Dairy and Dairy Other farms refer to Specialist Dairy farms in the Teagasc National Farm Survey in addition to ‘Dairy and Other farms’ s defined pre 2011 and ‘Mixed Livestock farms’ as defined post 2011. See www.teagasc.ie/NFS for further detail on system classifications.
21
Figure 2.1: Average farm debt in nominal and real terms (2002-2013)
Source: Authors own analysis of Teagasc National Farm Survey data.
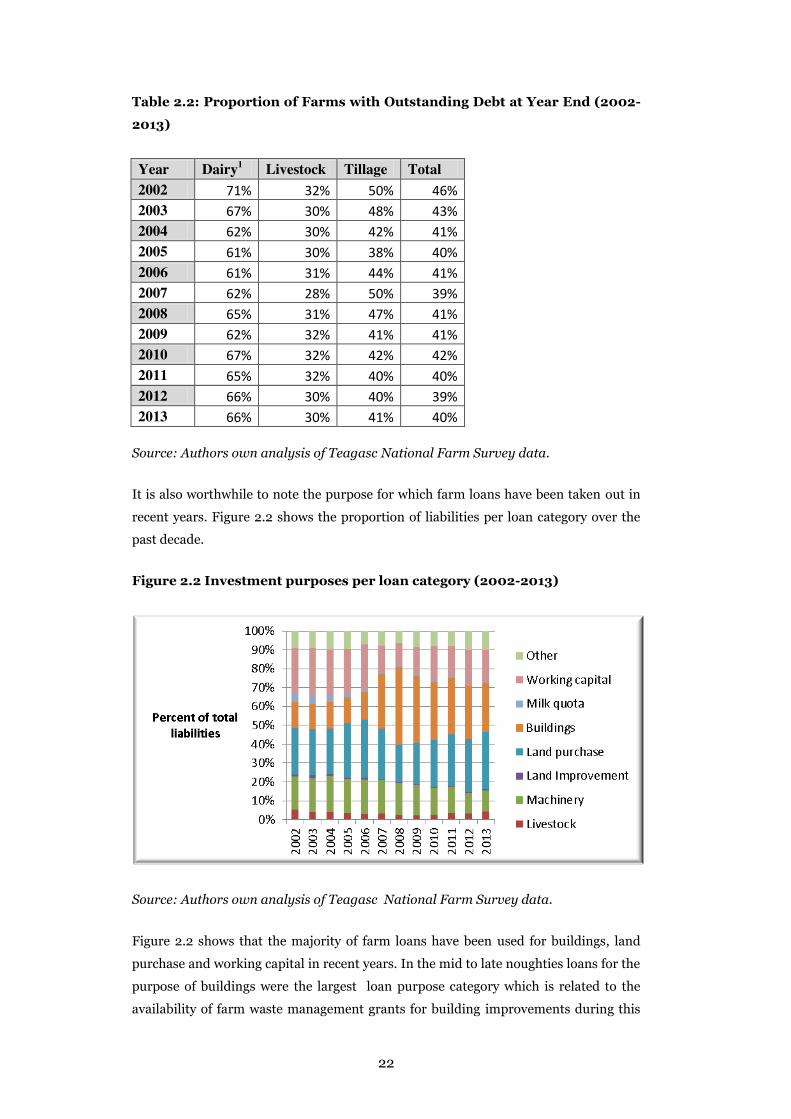
In addition to average debt levels across all farm sizes and systems, it is interesting to
examine the proportion of farms within each system that have outstanding debt.
Table 2.2 below shows that, on average over the time period examined, just under 6
out of every 10 farms do not have any outstanding debt levels at the end of each
calendar year. It also appears that dairy farms have the highest number of farms with
outstanding debts at the end of the calendar year, with about 7 out of every 10 dairy
farms having outstanding debt at the end of the calendar year. About half of all tillage
farms have outstanding debt and about one third of all livestock farms have
outstanding debt, (at the end of the calendar year) across the period examined.
Given that the majority of farms do not invest at all it is informative to look at average
investment levels across systems just for those farms actually engaged in investment.
Appendix 2.1 shows the average levels of investment for just those farms that invested,
which is significantly higher than the figures presented in Table 2.1 above. For
example, in 2013 the average closing balance on dairy and tillage farms that had
liabilities was approx. €94,000 and €74,000. This leaves an average closing balance of
approximately €62,000 on all farms that had debt (Appendix 2.1) compared to an
average across all farms of just over €24,000 (Table 2.1).
0
50
100
150
200
250
300
2002 2004 2006 2008 2010 2012
€000
per
farm
Nominal Debt
Real Debt ( Constant 2002 Euro)
22
Table 2.2: Proportion of Farms with Outstanding Debt at Year End (2002-
2013)
Year Dairy1 Livestock Tillage Total 2002 71% 32% 50% 46% 2003 67% 30% 48% 43% 2004 62% 30% 42% 41% 2005 61% 30% 38% 40% 2006 61% 31% 44% 41% 2007 62% 28% 50% 39% 2008 65% 31% 47% 41% 2009 62% 32% 41% 41% 2010 67% 32% 42% 42% 2011 65% 32% 40% 40% 2012 66% 30% 40% 39% 2013 66% 30% 41% 40%
Source: Authors own analysis of Teagasc National Farm Survey data.
It is also worthwhile to note the purpose for which farm loans have been taken out in
recent years. Figure 2.2 shows the proportion of liabilities per loan category over the
past decade.
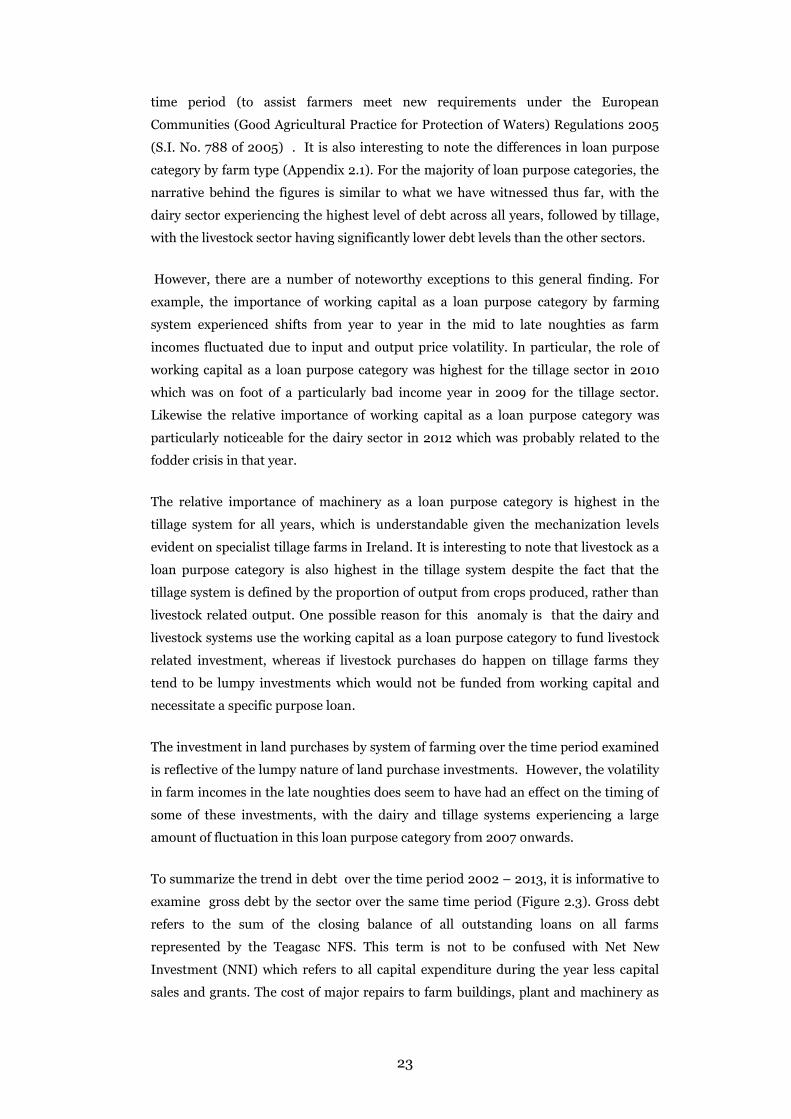
Figure 2.2 Investment purposes per loan category (2002-2013)
Source: Authors own analysis of Teagasc National Farm Survey data.
Figure 2.2 shows that the majority of farm loans have been used for buildings, land
purchase and working capital in recent years. In the mid to late noughties loans for the
purpose of buildings were the largest loan purpose category which is related to the
availability of farm waste management grants for building improvements during this
23
time period (to assist farmers meet new requirements under the European
Communities (Good Agricultural Practice for Protection of Waters) Regulations 2005
(S.I. No. 788 of 2005) . It is also interesting to note the differences in loan purpose
category by farm type (Appendix 2.1). For the majority of loan purpose categories, the
narrative behind the figures is similar to what we have witnessed thus far, with the
dairy sector experiencing the highest level of debt across all years, followed by tillage,
with the livestock sector having significantly lower debt levels than the other sectors.
However, there are a number of noteworthy exceptions to this general finding. For
example, the importance of working capital as a loan purpose category by farming
system experienced shifts from year to year in the mid to late noughties as farm
incomes fluctuated due to input and output price volatility. In particular, the role of
working capital as a loan purpose category was highest for the tillage sector in 2010
which was on foot of a particularly bad income year in 2009 for the tillage sector.
Likewise the relative importance of working capital as a loan purpose category was
particularly noticeable for the dairy sector in 2012 which was probably related to the
fodder crisis in that year.
The relative importance of machinery as a loan purpose category is highest in the
tillage system for all years, which is understandable given the mechanization levels
evident on specialist tillage farms in Ireland. It is interesting to note that livestock as a
loan purpose category is also highest in the tillage system despite the fact that the
tillage system is defined by the proportion of output from crops produced, rather than
livestock related output. One possible reason for this anomaly is that the dairy and
livestock systems use the working capital as a loan purpose category to fund livestock
related investment, whereas if livestock purchases do happen on tillage farms they
tend to be lumpy investments which would not be funded from working capital and
necessitate a specific purpose loan.
The investment in land purchases by system of farming over the time period examined
is reflective of the lumpy nature of land purchase investments. However, the volatility
in farm incomes in the late noughties does seem to have had an effect on the timing of
some of these investments, with the dairy and tillage systems experiencing a large
amount of fluctuation in this loan purpose category from 2007 onwards.
To summarize the trend in debt over the time period 2002 – 2013, it is informative to
examine gross debt by the sector over the same time period (Figure 2.3). Gross debt
refers to the sum of the closing balance of all outstanding loans on all farms
represented by the Teagasc NFS. This term is not to be confused with Net New
Investment (NNI) which refers to all capital expenditure during the year less capital
sales and grants. The cost of major repairs to farm buildings, plant and machinery as
24
well as land improvements is also included. It does not include investments in land
purchases.
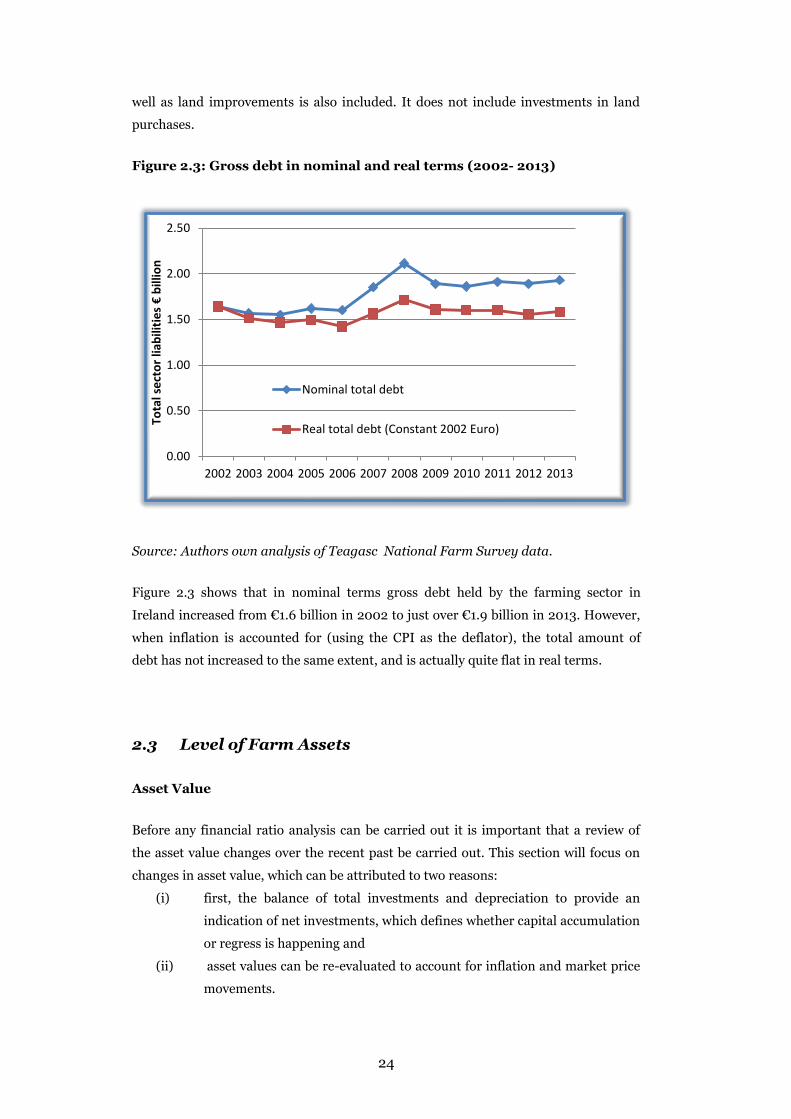
Figure 2.3: Gross debt in nominal and real terms (2002- 2013)
Source: Authors own analysis of Teagasc National Farm Survey data.
Figure 2.3 shows that in nominal terms gross debt held by the farming sector in
Ireland increased from €1.6 billion in 2002 to just over €1.9 billion in 2013. However,
when inflation is accounted for (using the CPI as the deflator), the total amount of
debt has not increased to the same extent, and is actually quite flat in real terms.
2.3 Level of Farm Assets
Asset Value
Before any financial ratio analysis can be carried out it is important that a review of
the asset value changes over the recent past be carried out. This section will focus on
changes in asset value, which can be attributed to two reasons:
(i) first, the balance of total investments and depreciation to provide an
indication of net investments, which defines whether capital accumulation
or regress is happening and
(ii) asset values can be re-evaluated to account for inflation and market price
movements.
0.00
0.50
1.00
1.50
2.00
2.50
2002 2003 2004 2005 2006 2007 2008 2009 2010 2011 2012 2013
Tota
l sec
tor l
iabi
litie
s €
billi
on
Nominal total debt
Real total debt (Constant 2002 Euro)
25
Both of these sources of asset value change over time and will be examined in the
following section.
Total assets are the property of the agricultural holding and are calculated as the sum
of current and fixed assets. Current assets in the NFS include non-breeding livestock,
the stock of agricultural products and other circulating capital, holdings of agricultural
shares, and amounts receivable in the short term or cash balances in hand or in the
bank. Fixed assets are agricultural land, permanent crops, farm and other buildings,
forest capital, machinery and equipment, and breeding livestock.
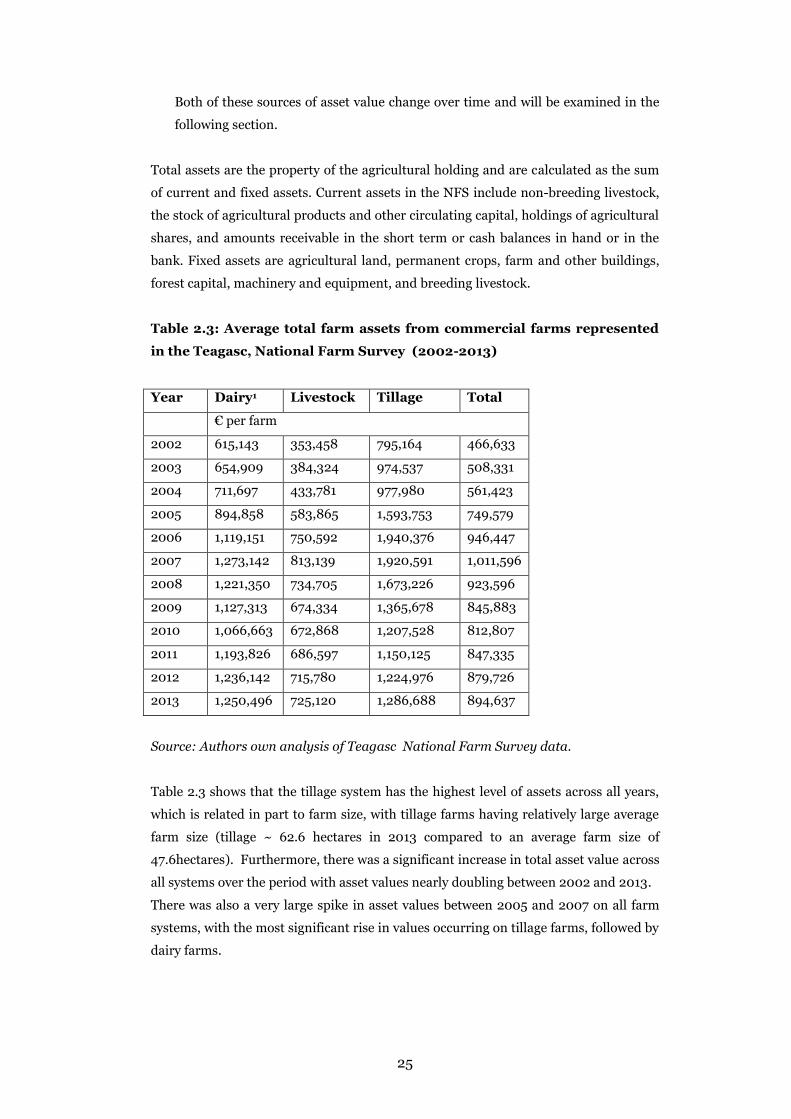
Table 2.3: Average total farm assets from commercial farms represented
in the Teagasc, National Farm Survey (2002-2013)
Year Dairy1 Livestock Tillage Total
€ per farm
2002 615,143 353,458 795,164 466,633
2003 654,909 384,324 974,537 508,331
2004 711,697 433,781 977,980 561,423
2005 894,858 583,865 1,593,753 749,579
2006 1,119,151 750,592 1,940,376 946,447
2007 1,273,142 813,139 1,920,591 1,011,596
2008 1,221,350 734,705 1,673,226 923,596
2009 1,127,313 674,334 1,365,678 845,883
2010 1,066,663 672,868 1,207,528 812,807
2011 1,193,826 686,597 1,150,125 847,335
2012 1,236,142 715,780 1,224,976 879,726
2013 1,250,496 725,120 1,286,688 894,637
Source: Authors own analysis of Teagasc National Farm Survey data.
Table 2.3 shows that the tillage system has the highest level of assets across all years,
which is related in part to farm size, with tillage farms having relatively large average
farm size (tillage ~ 62.6 hectares in 2013 compared to an average farm size of
47.6hectares). Furthermore, there was a significant increase in total asset value across
all systems over the period with asset values nearly doubling between 2002 and 2013.
There was also a very large spike in asset values between 2005 and 2007 on all farm
systems, with the most significant rise in values occurring on tillage farms, followed by
dairy farms.

26
To determine if this increase in value was associated with an increase in (i) capital
formation or (ii) increases in inflation or market price movements, the trend in total
asset value is compared to the trend in prices of key asset items (Figure 2.4).
Figure 2.4: Average total farm assets values compared to price indices for
key asset items (2002-2013)
Source: Authors own analysis of Teagasc National Farm Survey data; Donnellan,
Hanrahan and O’Donovan (2014); C SO (various years)
Given that land values appreciated significantly during the Celtic Tiger period in
Ireland it is reasonable to assume that the spike in the average asset value of farms in
the mid to late nougties was related to land price movements. The land price index
provides evidence that the spike in total assets in 2005 – 2007 does relate closely to
land price movements. However what is interesting is that the subsequent decline in
land prices shown in Figure 2.4 above shows that the subsequent fall in land prices
was not mirrored as closely in total asset value. Hence, it appears reasonable to
conclude that other price movements (as seen in the CSO agricultural input price
index above) and volume movements have contributed to movements in the asset
value over the recent past.
2.4 Solvency Levels
Reflecting on the trends shown in liabilities and assets above it is worthwhile to
examine the trend in Solvency measures over the recent past on Irish farms. Solvency
reflects on the amount of borrowed capital used by the business relative to the amount
of owner’s equity capital invested in the business. In other words, solvency measures
0
0.5
1
1.5
2
2.5
3
3.5
0
200000
400000
600000
800000
1000000
1200000
Inde
x (P
rices
and
net
New
Inve
sem
ent)
Aver
age
asse
t val
ue (€
per
farm
)
Average asset value Ag. Input priceLand price index Net New Investment Index

27
provide an indication of the business’ ability to repay all indebtedness if all of the
assets were sold. Solvency measures also provide an indication of the business’ ability
to withstand risks by providing information about the farm’s ability to continue
operating after a major financial adversity. Unlike liquidity (which will be examined in
further detail later in the report), solvency is concerned with long-term, as well as
short-term, assets and liabilities.
Three widely used financial ratios to measure solvency are the debt-to-asset ratio, the
equity-to-asset ratio and the debt-to-equity ratio. These three solvency ratios provide
equivalent information, so the best choice is strictly a matter of personal preference.
The debt-to-asset ratio expresses total farm liabilities as a proportion of total farm
assets. The higher the ratio, the greater the risk exposure of the farm. The equity-to-
asset ratio expresses the proportion of total assets financed by the owner’s equity. The
debt-to-equity ratio reflects the capital structure of the farm and the extent to which
farm debt capital is being combined with farm equity capital. It is a measure of the
degree to which a farmer is leveraging his equity.
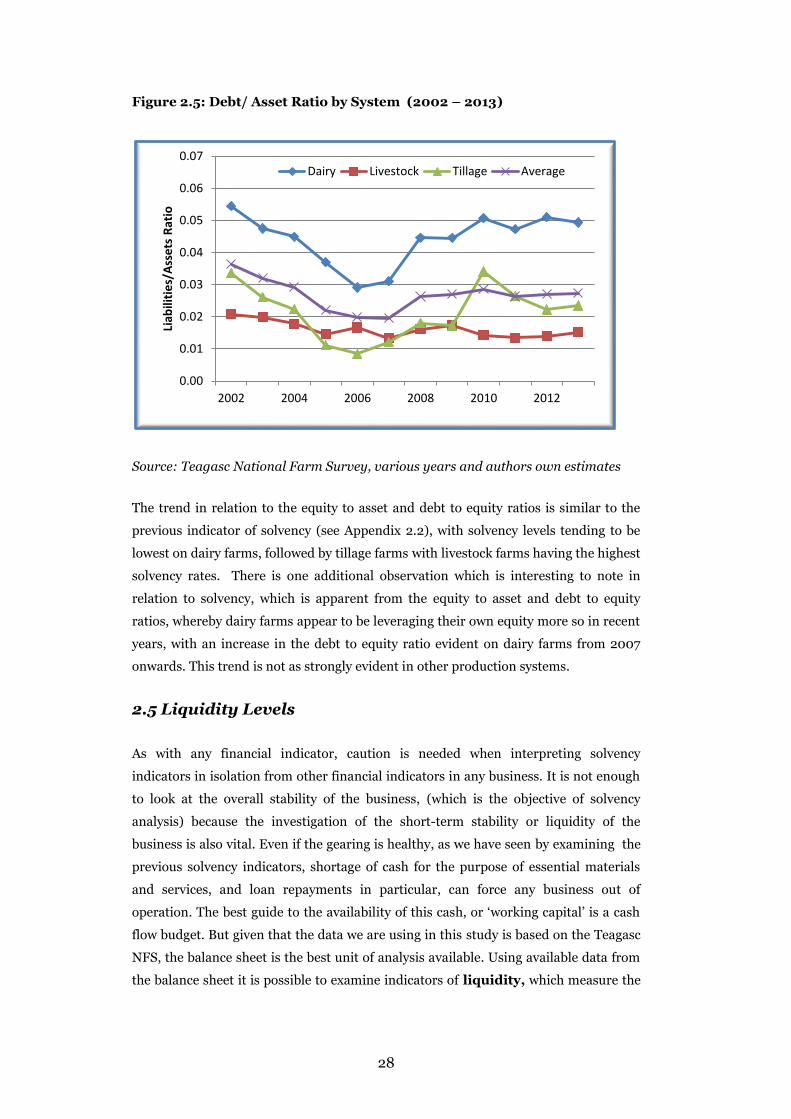
The debt-to-asset ratio in Figure 2.5, provides a picture of the relative dependence
of farm businesses on debt and their ability to use additional credit without impairing
their risk-bearing ability. The lower the debt to asset ratio, the greater the overall
financial solvency of the farm sector. The ratio shows that over the period 2002 to
2007, as assets increased in value quicker than debt levels, there was a decline in the
debt to asset ratio across all systems, indicating an increasing rate of solvency.
Subsequently, in the 2008 – 2010/2011 period, solvency levels decreased (apparent as
an increase in the debt to asset ratio) as debt levels increased and asset values
declined. In the later period, post 2011, solvency levels have reverted to the pre Celtic
tiger levels for the majority of sectors, apart from the dairy sector where the solvency
level is still lower than was historically the case (apparent as a higher debt to asset
ratio). This trend is reflective of the trend in overall liabilities and also asset values to a
lesser extent over the period, with liabilities in the dairy sector in particular increasing
at a faster pace than other sectors.
28
Figure 2.5: Debt/ Asset Ratio by System (2002 – 2013)
Source: Teagasc National Farm Survey, various years and authors own estimates
The trend in relation to the equity to asset and debt to equity ratios is similar to the
previous indicator of solvency (see Appendix 2.2), with solvency levels tending to be
lowest on dairy farms, followed by tillage farms with livestock farms having the highest
solvency rates. There is one additional observation which is interesting to note in
relation to solvency, which is apparent from the equity to asset and debt to equity
ratios, whereby dairy farms appear to be leveraging their own equity more so in recent
years, with an increase in the debt to equity ratio evident on dairy farms from 2007
onwards. This trend is not as strongly evident in other production systems.
2.5 Liquidity Levels
As with any financial indicator, caution is needed when interpreting solvency
indicators in isolation from other financial indicators in any business. It is not enough
to look at the overall stability of the business, (which is the objective of solvency
analysis) because the investigation of the short-term stability or liquidity of the
business is also vital. Even if the gearing is healthy, as we have seen by examining the
previous solvency indicators, shortage of cash for the purpose of essential materials
and services, and loan repayments in particular, can force any business out of
operation. The best guide to the availability of this cash, or ‘working capital’ is a cash
flow budget. But given that the data we are using in this study is based on the Teagasc
NFS, the balance sheet is the best unit of analysis available. Using available data from
the balance sheet it is possible to examine indicators of liquidity, which measure the
0.00
0.01
0.02
0.03
0.04
0.05
0.06
0.07
2002 2004 2006 2008 2010 2012
Liab
ilitie
s/As
sets
Rat
io
Dairy Livestock Tillage Average
29
ability of the farm business to meet financial obligations as they arise, without
disrupting the normal, ongoing operations of the business.
A common indicator used in farm management literature to measure the liquidity of
the farm business is the times interest ratio which measures the share of the farm
business’s net cash income before interest to service interest payments. Some other
common indicators of liquidity are based on gross income relative to repayments,
which are adequate in times of stable costs of production. But given that current
financial pressure on Irish farms is based on pressures from the costs of production in
addition to pressures on the value of output, it is worthwhile to examine an indicator
which takes net income into account. Hence, the time interest ratio examined here is
calculated as net cash farm income before interest divided by interest payments due.
The lower the ratio the less liquidity there is on the farm.
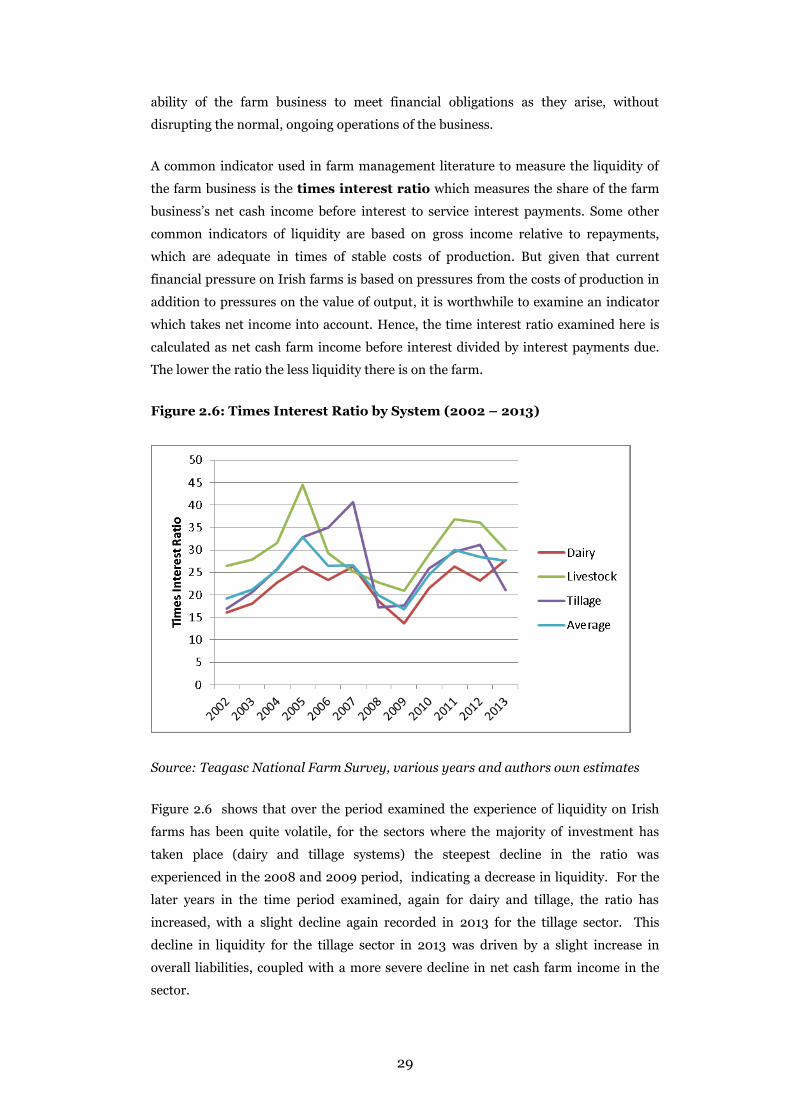
Figure 2.6: Times Interest Ratio by System (2002 – 2013)
Source: Teagasc National Farm Survey, various years and authors own estimates
Figure 2.6 shows that over the period examined the experience of liquidity on Irish
farms has been quite volatile, for the sectors where the majority of investment has
taken place (dairy and tillage systems) the steepest decline in the ratio was
experienced in the 2008 and 2009 period, indicating a decrease in liquidity. For the
later years in the time period examined, again for dairy and tillage, the ratio has
increased, with a slight decline again recorded in 2013 for the tillage sector. This
decline in liquidity for the tillage sector in 2013 was driven by a slight increase in
overall liabilities, coupled with a more severe decline in net cash farm income in the
sector.
30
2.6 Financial Efficiency Levels
Another financial health check indicator often used in financial farm assessment is
related to Financial Efficiency. Financial efficiency measures the degree of
efficiency in using labor, management and capital. Efficiency analysis deals with the
relationships between inputs and outputs. Because inputs can be measured in both
physical and financial terms, a large number of efficiency measures in addition to
financial measures can be derived. An interesting, and often used, indicator of
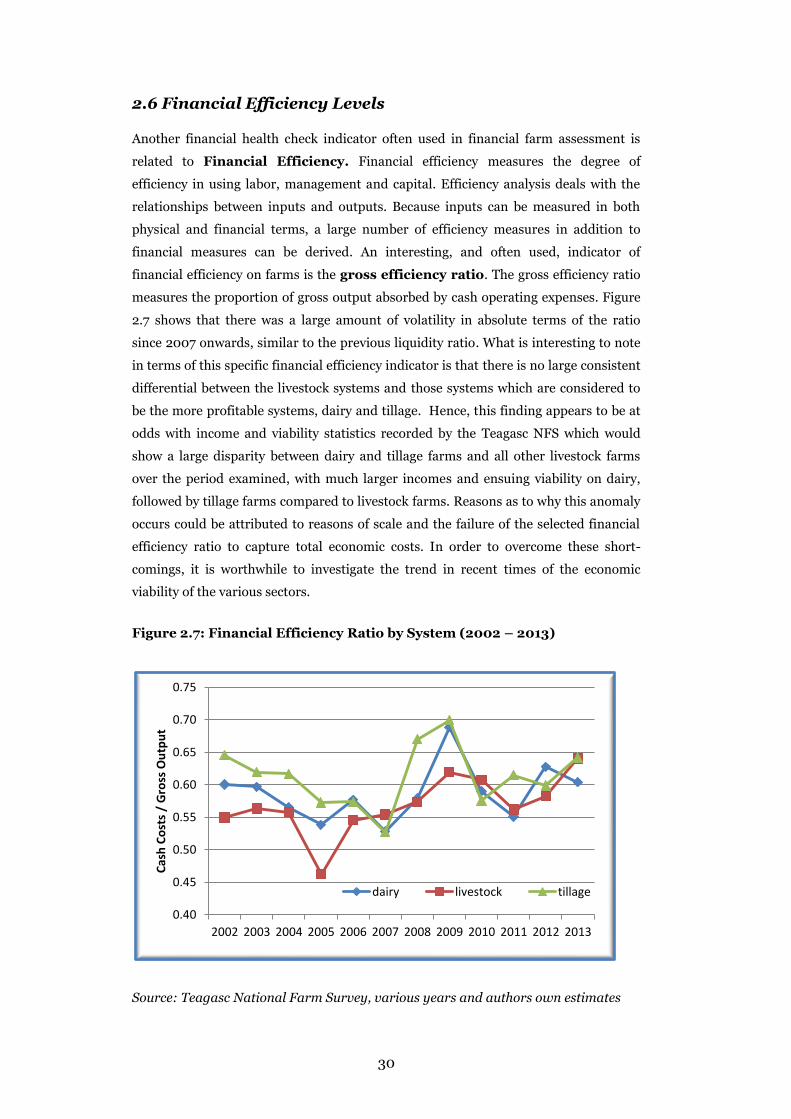
financial efficiency on farms is the gross efficiency ratio. The gross efficiency ratio
measures the proportion of gross output absorbed by cash operating expenses. Figure
2.7 shows that there was a large amount of volatility in absolute terms of the ratio
since 2007 onwards, similar to the previous liquidity ratio. What is interesting to note
in terms of this specific financial efficiency indicator is that there is no large consistent
differential between the livestock systems and those systems which are considered to
be the more profitable systems, dairy and tillage. Hence, this finding appears to be at
odds with income and viability statistics recorded by the Teagasc NFS which would
show a large disparity between dairy and tillage farms and all other livestock farms
over the period examined, with much larger incomes and ensuing viability on dairy,
followed by tillage farms compared to livestock farms. Reasons as to why this anomaly
occurs could be attributed to reasons of scale and the failure of the selected financial
efficiency ratio to capture total economic costs. In order to overcome these short-
comings, it is worthwhile to investigate the trend in recent times of the economic
viability of the various sectors.
Figure 2.7: Financial Efficiency Ratio by System (2002 – 2013)
Source: Teagasc National Farm Survey, various years and authors own estimates
0.40
0.45
0.50
0.55
0.60
0.65
0.70
0.75
2002 2003 2004 2005 2006 2007 2008 2009 2010 2011 2012 2013
Cash
Cos
ts /
Gro
ss O
utpu
t
dairy livestock tillage
31
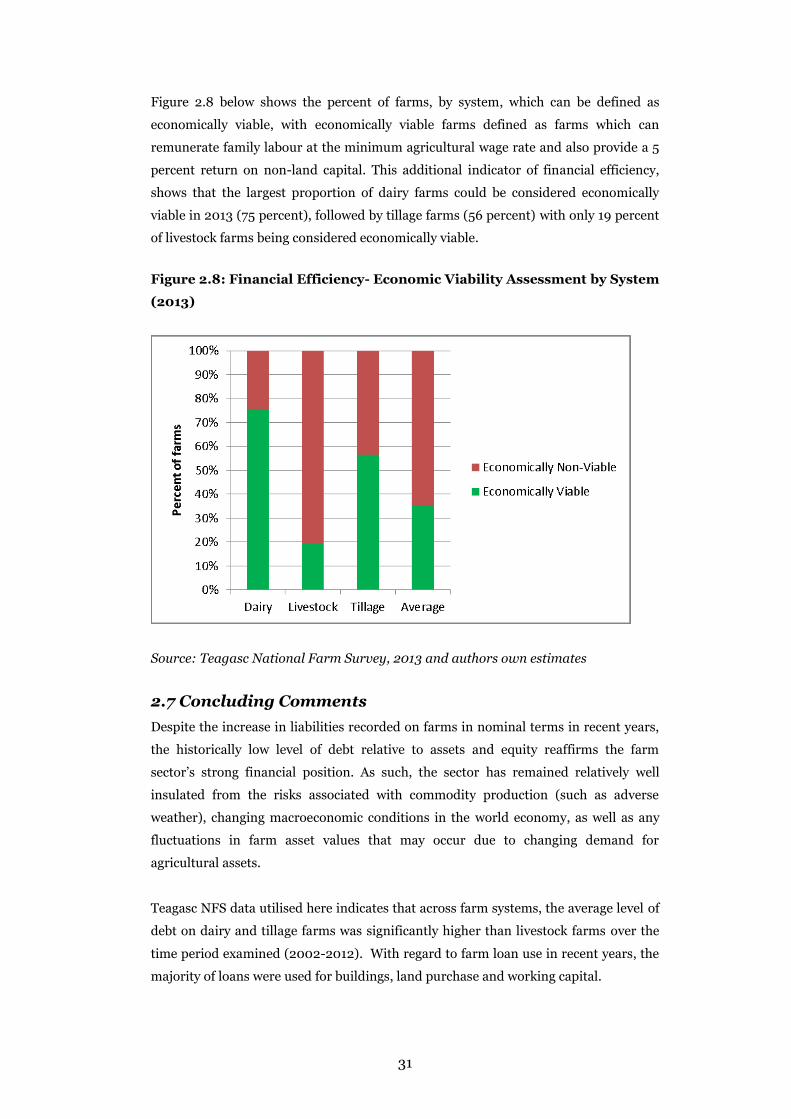
Figure 2.8 below shows the percent of farms, by system, which can be defined as
economically viable, with economically viable farms defined as farms which can
remunerate family labour at the minimum agricultural wage rate and also provide a 5
percent return on non-land capital. This additional indicator of financial efficiency,
shows that the largest proportion of dairy farms could be considered economically
viable in 2013 (75 percent), followed by tillage farms (56 percent) with only 19 percent
of livestock farms being considered economically viable.
Figure 2.8: Financial Efficiency- Economic Viability Assessment by System
(2013)
Source: Teagasc National Farm Survey, 2013 and authors own estimates
2.7 Concluding Comments Despite the increase in liabilities recorded on farms in nominal terms in recent years,
the historically low level of debt relative to assets and equity reaffirms the farm
sector’s strong financial position. As such, the sector has remained relatively well
insulated from the risks associated with commodity production (such as adverse
weather), changing macroeconomic conditions in the world economy, as well as any
fluctuations in farm asset values that may occur due to changing demand for
agricultural assets.
Teagasc NFS data utilised here indicates that across farm systems, the average level of
debt on dairy and tillage farms was significantly higher than livestock farms over the
time period examined (2002-2012). With regard to farm loan use in recent years, the
majority of loans were used for buildings, land purchase and working capital.

32
A number of important farm financial indicators relating to the broad category areas
of liquidity, solvency, and financial efficiency were reported on here. Taking each of
these in turn, this analysis indicates that solvency levels in the dairy sector appear
lower in recent years compared to historic levels, which could be attributed to higher
leverage in the sub sector. In taking account of farm-level liquidity the data reveals a
large degree of volatility in the relevant ratios across all sectors in recent years, with
the livestock sector performing relatively better in this regard. Similarly, with regard
to financial efficiency, for a number of years the livestock system could be
considered to be relatively superior on first reflection, however it is important to take
account of scale and total economic costs in any measurement. To this end it is
worthwhile to examine economic viability across sectors. This additional indicator
of financial efficiency shows that a larger proportion of dairy and tillage farms are
considered viable compared to livestock farms, the majority of which are considered
economically unviable.

33
Chapter 3
A Comparison of the Financial Structure of
Farming in the EU: An Analysis of Data from
the Farm Accountancy Data Network (FADN)
3. 1 Introduction
This chapter analyses the financial structure of agricultural holdings within the EU
using data from the European Commission’s Farm Accountancy Data Network
(FADN) with reference to two main dimensions (country and farming type) using a
number of financial indicators derived from farms’ balance sheets. A narrative on the
differences in the structure of farming across the respective countries is also provided
by way of understanding the differences in financial indicators that are evident. For
the most part data in this section is based on the latest available FADN data which
relates to the accounting year 2012. The data is presented for the aggregate of the EU
plus sub sets of regions which are typically different in both structure and longevity of
EU membership. Where data is presented for additional years from the FADN dataset
it is explicitly stated.
3.2 Total asset value
Total assets presented in this section relate to the property of the agricultural holding
and are calculated as the sum of both current and fixed assets. Current assets in the
FADN dataset include non-breeding livestock, stock of agricultural products and other
circulating capital, holdings of agricultural shares, and amounts receivable in the short
term or cash balances in hand or in the bank. Fixed assets are agricultural land,
permanent crops, farm and other buildings, forest capital, machinery and equipment,
and breeding livestock.
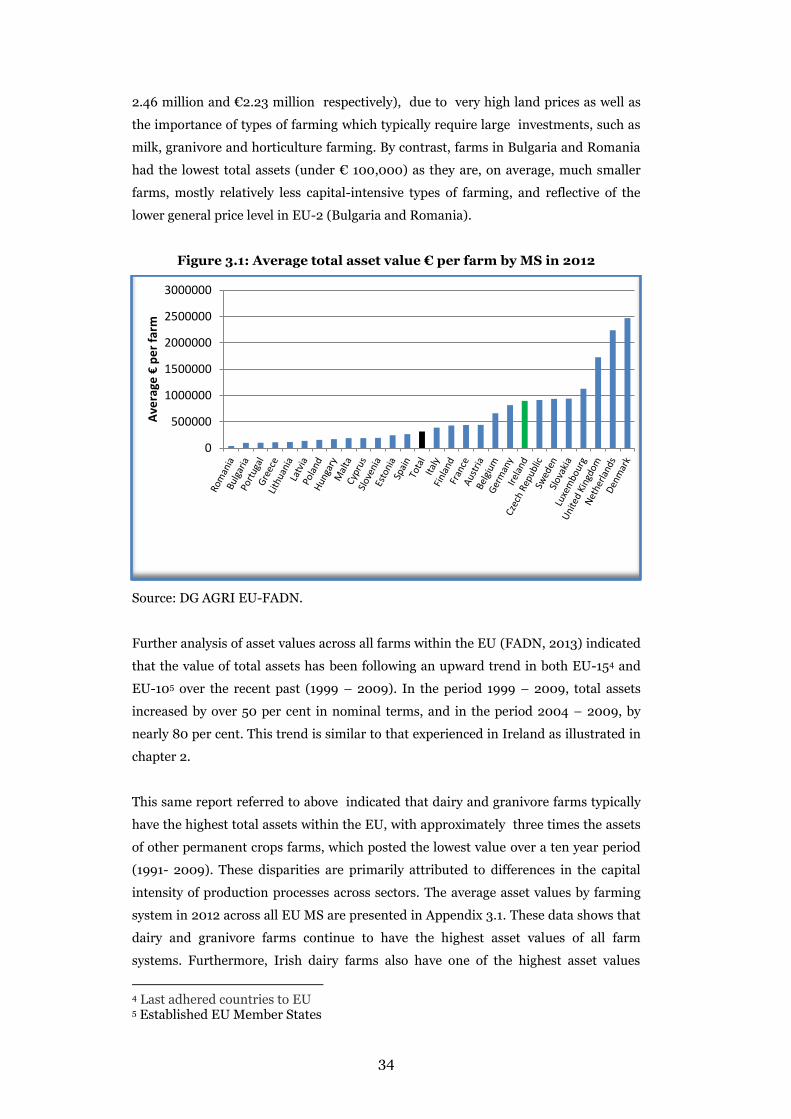
Figure 3.1 shows that the total value of assets of an average EU-27 farm was
approximately € 316,792 in 20123, with average assets values for Irish farms almost
three times this figure at €890,000. However, this average figure for EU farms masks
sizeable variations across Member States (MS) due to differences in the structure of
farming in individual countries. For example, total assets in Denmark and the
Netherlands were on average much higher than other EU countries, (approximately €
3 Average figure represents a weighted average of all farms in the EU.
34
2.46 million and €2.23 million respectively), due to very high land prices as well as
the importance of types of farming which typically require large investments, such as
milk, granivore and horticulture farming. By contrast, farms in Bulgaria and Romania
had the lowest total assets (under € 100,000) as they are, on average, much smaller
farms, mostly relatively less capital-intensive types of farming, and reflective of the
lower general price level in EU-2 (Bulgaria and Romania).
Figure 3.1: Average total asset value € per farm by MS in 2012
Source: DG AGRI EU-FADN.
Further analysis of asset values across all farms within the EU (FADN, 2013) indicated
that the value of total assets has been following an upward trend in both EU-154 and
EU-105 over the recent past (1999 – 2009). In the period 1999 – 2009, total assets
increased by over 50 per cent in nominal terms, and in the period 2004 – 2009, by
nearly 80 per cent. This trend is similar to that experienced in Ireland as illustrated in
chapter 2.
This same report referred to above indicated that dairy and granivore farms typically
have the highest total assets within the EU, with approximately three times the assets
of other permanent crops farms, which posted the lowest value over a ten year period
(1991- 2009). These disparities are primarily attributed to differences in the capital
intensity of production processes across sectors. The average asset values by farming
system in 2012 across all EU MS are presented in Appendix 3.1. These data shows that
dairy and granivore farms continue to have the highest asset values of all farm
systems. Furthermore, Irish dairy farms also have one of the highest asset values
4 Last adhered countries to EU 5 Established EU Member States
0
500000
1000000
1500000
2000000
2500000
3000000
Aver
age €
per f
arm
35
amongst all EU MS dairy farms examined, with only five MS’s dairy farms reporting
higher asset values.
3.3 Total liability value
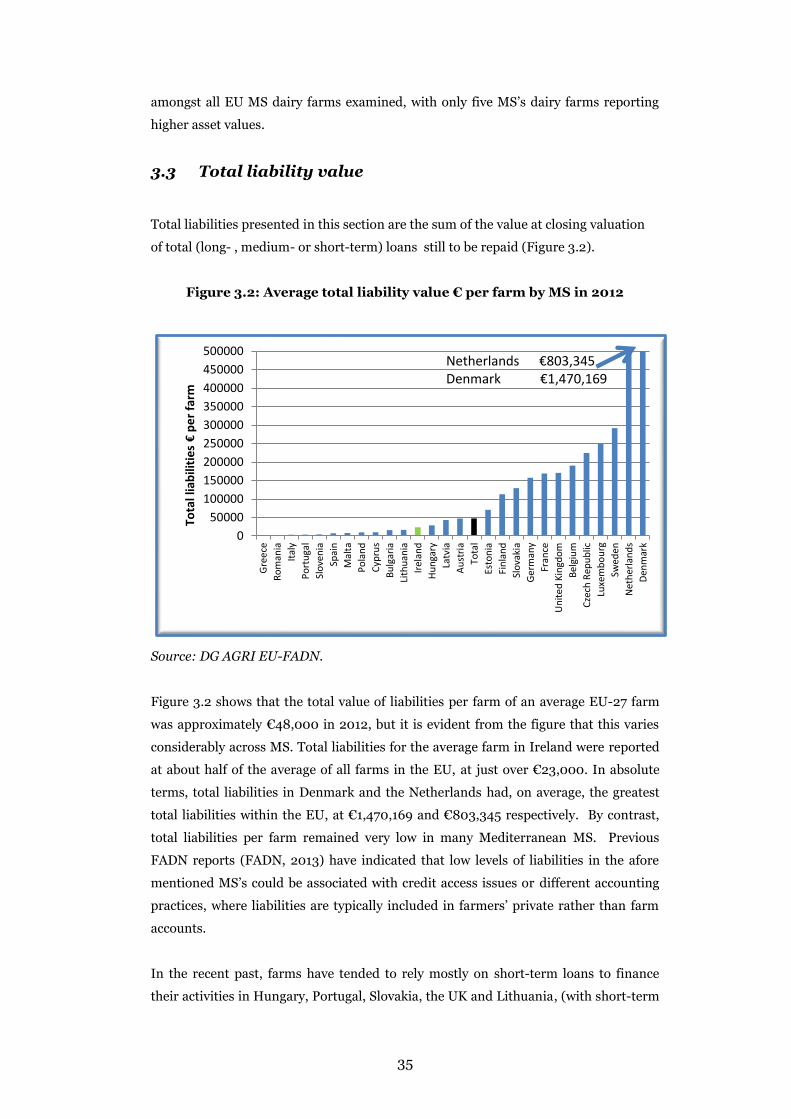
Total liabilities presented in this section are the sum of the value at closing valuation
of total (long- , medium- or short-term) loans still to be repaid (Figure 3.2).
Figure 3.2: Average total liability value € per farm by MS in 2012
Source: DG AGRI EU-FADN.
Figure 3.2 shows that the total value of liabilities per farm of an average EU-27 farm
was approximately €48,000 in 2012, but it is evident from the figure that this varies
considerably across MS. Total liabilities for the average farm in Ireland were reported
at about half of the average of all farms in the EU, at just over €23,000. In absolute
terms, total liabilities in Denmark and the Netherlands had, on average, the greatest
total liabilities within the EU, at €1,470,169 and €803,345 respectively. By contrast,
total liabilities per farm remained very low in many Mediterranean MS. Previous
FADN reports (FADN, 2013) have indicated that low levels of liabilities in the afore
mentioned MS’s could be associated with credit access issues or different accounting
practices, where liabilities are typically included in farmers’ private rather than farm
accounts.
In the recent past, farms have tended to rely mostly on short-term loans to finance
their activities in Hungary, Portugal, Slovakia, the UK and Lithuania, (with short-term
050000
100000150000200000250000300000350000400000450000500000
Gree
ceRo
man
ia It
aly
Por
tuga
lSl
oven
iaSp
ain
Mal
ta P
olan
dCy
prus
Bulg
aria
Lith
uani
a Ir
elan
dHu
ngar
y L
atvi
aAu
stria
Tota
lEs
toni
aFi
nlan
dSl
ovak
iaGe
rman
y F
ranc
eU
nite
d Ki
ngdo
m B
elgi
umCz
ech
Repu
blic
Luxe
mbo
urg
Swed
enN
ethe
rland
s D
enm
ark
Tota
l lia
bilit
ies €
per f
arm
Netherlands €803,345 Denmark €1,470,169
36
loans accounting, on average, for approximately half of total liabilities). By contrast,
medium- and long-term loans represented more than 90 % of total liabilities in
Belgium, Italy, Slovenia, Cyprus, Denmark and Finland (FADN, 2013). Medium and
long-term loans represented on average approx. 85% of total liabilities in Ireland in
2012.
FADN (2013) examined the differences in total liabilities across systems of production
for the period 1999 – 2009. Granivore, horticulture and specialised dairy farms had,
on average, the highest total liabilities (€ 139,500, € 117,700 and € 101,500
respectively), which is similar to the high total asset values observed in these farm
types. Permanent crops, other than wine holdings, recorded the lowest liabilities in
2009 (€ 6,700). Regarding the composition of liabilities, wine holdings relied most on
short-term loans to finance their activities, while the specialised dairy farms did so
least.
The average liabilities by farming system in 2012 across all EU MS are presented in
Appendix 3.2. These data shows that dairy and granivore farms continue to have the
highest liability values of all farm systems. Furthermore, liabilities on Irish dairy farms
are well below the average of all dairy farms examined in the EU, with total liabilities
amounting to two thirds of the EU average (Ireland: €62,925 and EU average:
€96,670).
In terms of how liabilities have evolved over the past for the average EU farm, FADN
(2013) showed that in line with the general trend for total asset values, total liabilities
have also increased over time in both EU-15 and EU-10, albeit at a slower pace than
that witnessed for total assets. Furthermore, it is interesting to note that, on average,
liabilities have tended to account for a small proportion of farms’ funding sources. In
this respect, while the 2004 and 2007 enlargements within the EU have affected the
average level of total liabilities per farm, the impact has been substantially smaller
than on total assets per farm.
3.4 Farm financial indicators
Solvency In the analysis presented in this section, solvency is measured by the liabilities-to-
assets ratio. This gives an indication of a farm’s ability to meet its obligations in the
long-term (or its capacity to repay liabilities if all of the assets were sold). The results
should be interpreted with caution as a high liabilities-to-assets ratio is not necessarily
a sign of a financially vulnerable position. In fact, a high ratio could also be an
indication of a farm’s economic viability (i.e. its ability to access outside financing),
37
though there is certainly a threshold beyond which indebtedness will compromise a
farm’s financial health.
A high liabilities-to-assets ratio typically reflects a heavy recourse to outside financing
(i.e. taking out loans). While the higher leverage (the amount of debt used to finance
assets) helps a farm to invest and typically increase its profitability, it comes at greater
risk as leveraging magnifies both gains (when investment generates the expected
return) and losses (when investment moves against the investor).
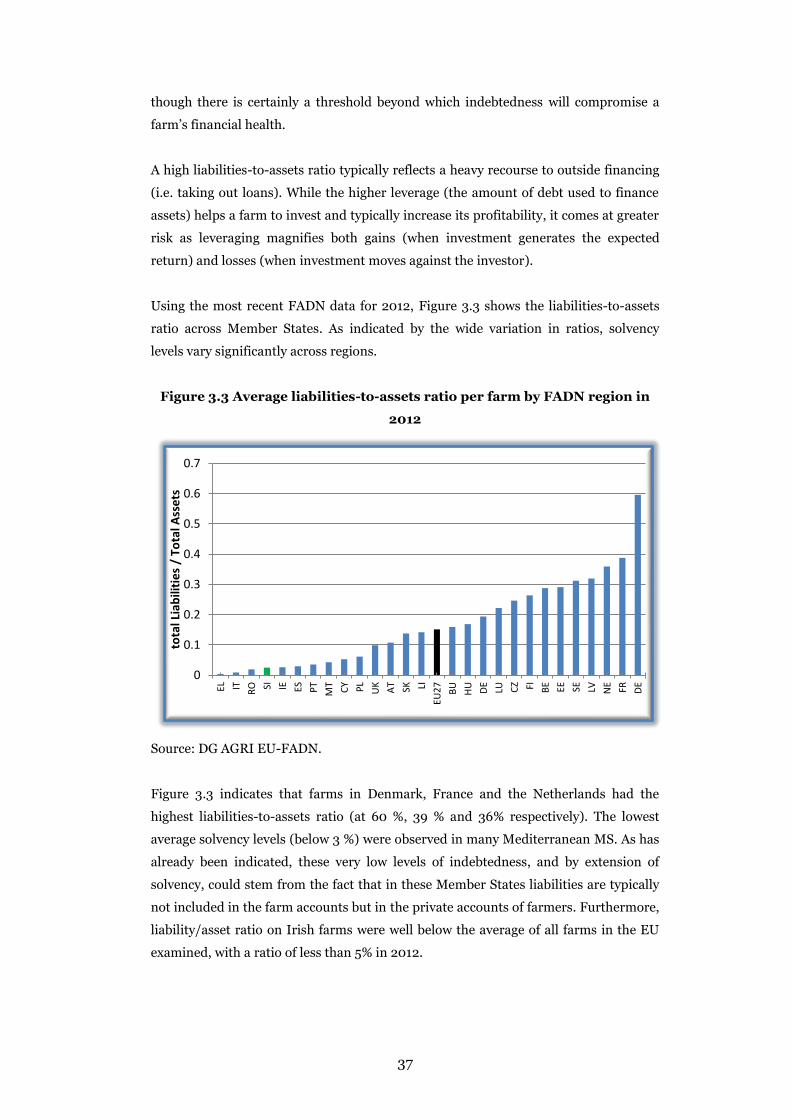
Using the most recent FADN data for 2012, Figure 3.3 shows the liabilities-to-assets
ratio across Member States. As indicated by the wide variation in ratios, solvency
levels vary significantly across regions.
Figure 3.3 Average liabilities-to-assets ratio per farm by FADN region in
2012
Source: DG AGRI EU-FADN.
Figure 3.3 indicates that farms in Denmark, France and the Netherlands had the
highest liabilities-to-assets ratio (at 60 %, 39 % and 36% respectively). The lowest
average solvency levels (below 3 %) were observed in many Mediterranean MS. As has
already been indicated, these very low levels of indebtedness, and by extension of
solvency, could stem from the fact that in these Member States liabilities are typically
not included in the farm accounts but in the private accounts of farmers. Furthermore,
liability/asset ratio on Irish farms were well below the average of all farms in the EU
examined, with a ratio of less than 5% in 2012.
0
0.1
0.2
0.3
0.4
0.5
0.6
0.7
EL IT RO SI IE ES PT MT CY PL UK
AT SK LI
EU27 BU HU DE LU CZ FI BE EE SE LV N
E FR DE
tota
l Lia
bilit
ies
/ To
tal A
sset
s

38
As depicted by Appendix 3.3 the level of solvency also varies across farm types, with
granivore, horticulture and specialised dairy farms recording the highest liabilities-to-
assets ratios, though in general the ratio remained at relatively low levels overall
(below 50 %, which means that most farms’ assets were financed through owners’
equity). In terms of how Irish farms compared on a European basis in terms of
solvency, it is not surprising that the liabilities to asset ratio was generally lower in
Ireland than other EU countries, given the position in relation to assets and liabilities
outlined previously. For example, Irish dairy farms had a solvency ratio of 5% while
the EU average was 21%.
Liquidity
Using FADN data for the year 2012, liquidity is measured by the Times Interest ratio.
This gives an indication of a farm’s ability to meet its obligations in the short term. As
was the case with the solvency ratio outlined previously, the results should be
interpreted with caution as a low ratio is not necessarily a sign of a financially
vulnerable position. In fact, a low ratio could also be an indication of a farm’s
economic viability (i.e. its ability to access outside financing).
A low liquidity ratio typically reflects heavy recourse to outside financing (i.e. taking
out loans). While the higher leverage (the amount of debt used to finance assets) helps
a farm to invest and typically increase its profitability, it comes at greater risk as
leveraging magnifies both gains (when investment generates the expected return) and
losses (when investment moves against the investor). Using the most recent FADN
data for 2012, Figure 3.4 shows the liquidity ratio (Times Interest Ratio) across MS,
which varies significantly across regions.
39
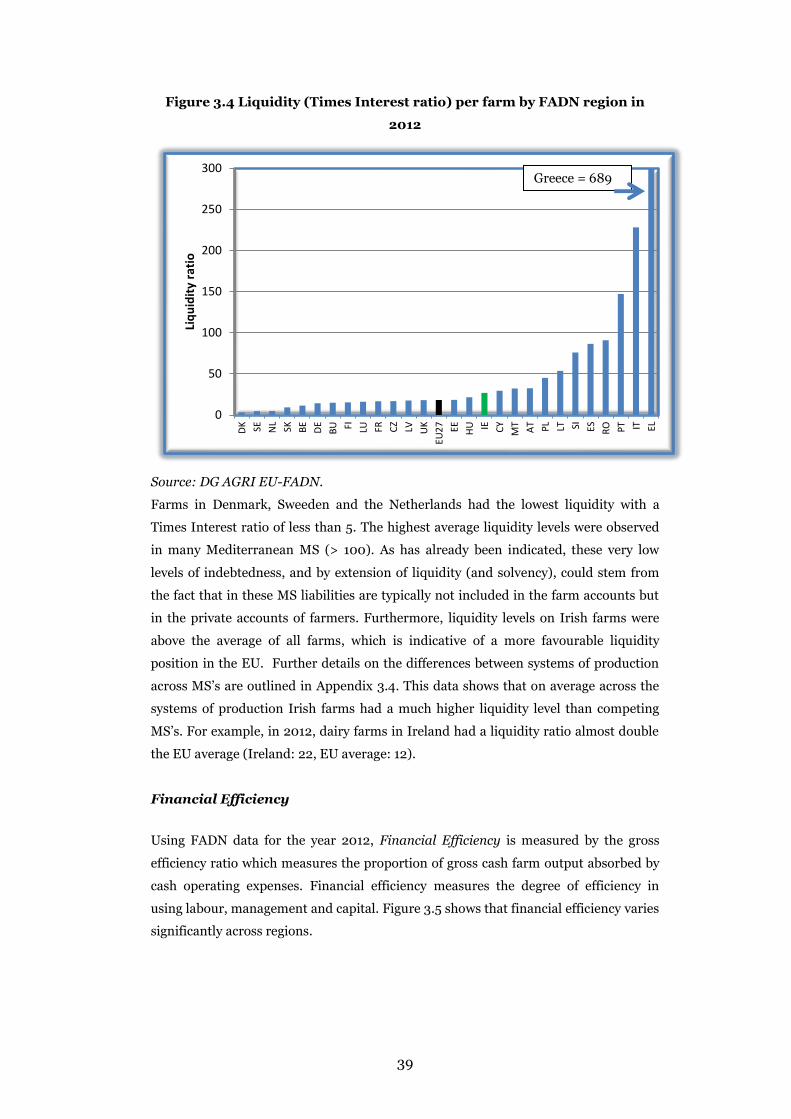
Figure 3.4 Liquidity (Times Interest ratio) per farm by FADN region in
2012
Source: DG AGRI EU-FADN.
Farms in Denmark, Sweeden and the Netherlands had the lowest liquidity with a
Times Interest ratio of less than 5. The highest average liquidity levels were observed
in many Mediterranean MS (> 100). As has already been indicated, these very low
levels of indebtedness, and by extension of liquidity (and solvency), could stem from
the fact that in these MS liabilities are typically not included in the farm accounts but
in the private accounts of farmers. Furthermore, liquidity levels on Irish farms were
above the average of all farms, which is indicative of a more favourable liquidity
position in the EU. Further details on the differences between systems of production
across MS’s are outlined in Appendix 3.4. This data shows that on average across the
systems of production Irish farms had a much higher liquidity level than competing
MS’s. For example, in 2012, dairy farms in Ireland had a liquidity ratio almost double
the EU average (Ireland: 22, EU average: 12).
Financial Efficiency
Using FADN data for the year 2012, Financial Efficiency is measured by the gross
efficiency ratio which measures the proportion of gross cash farm output absorbed by
cash operating expenses. Financial efficiency measures the degree of efficiency in
using labour, management and capital. Figure 3.5 shows that financial efficiency varies
significantly across regions.
0
50
100
150
200
250
300
DK SE NL SK BE DE BU FI LU FR CZ LV UK
EU27 EE HU IE CY M
T AT PL LT SI ES RO PT IT EL
Liqu
idity
ratio
Greece = 689
40
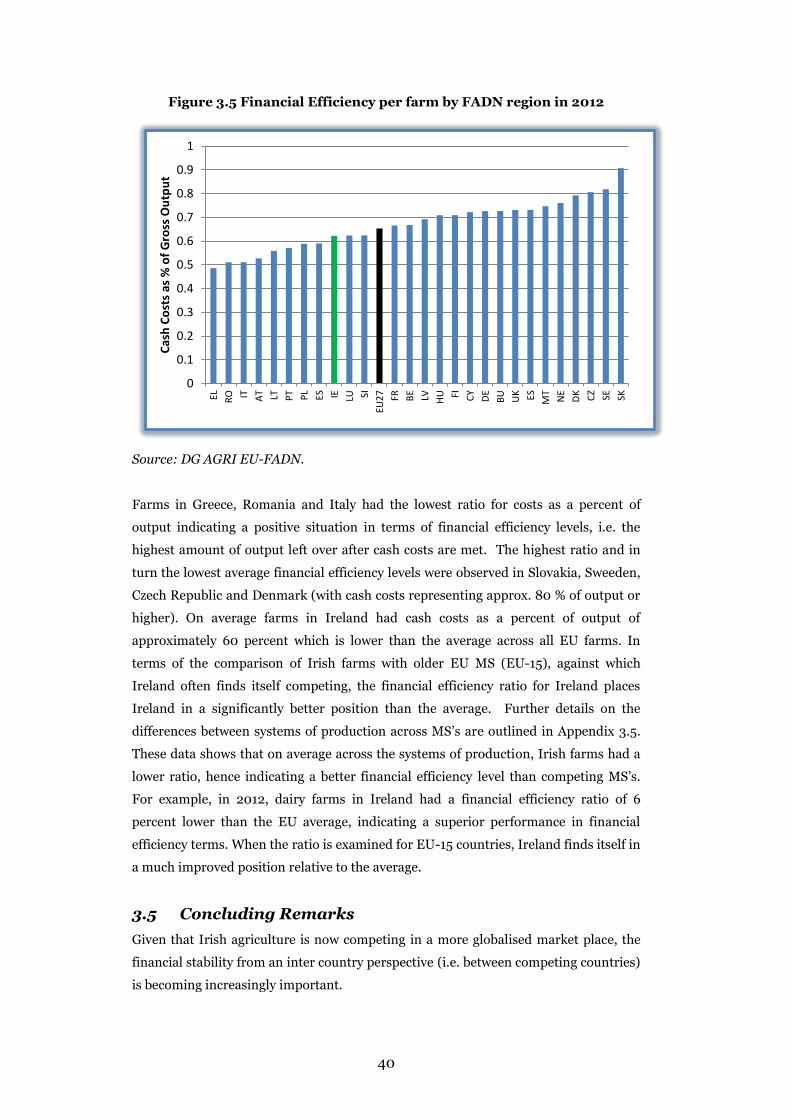
Figure 3.5 Financial Efficiency per farm by FADN region in 2012
Source: DG AGRI EU-FADN.
Farms in Greece, Romania and Italy had the lowest ratio for costs as a percent of
output indicating a positive situation in terms of financial efficiency levels, i.e. the
highest amount of output left over after cash costs are met. The highest ratio and in
turn the lowest average financial efficiency levels were observed in Slovakia, Sweeden,
Czech Republic and Denmark (with cash costs representing approx. 80 % of output or
higher). On average farms in Ireland had cash costs as a percent of output of
approximately 60 percent which is lower than the average across all EU farms. In
terms of the comparison of Irish farms with older EU MS (EU-15), against which
Ireland often finds itself competing, the financial efficiency ratio for Ireland places
Ireland in a significantly better position than the average. Further details on the
differences between systems of production across MS’s are outlined in Appendix 3.5.
These data shows that on average across the systems of production, Irish farms had a
lower ratio, hence indicating a better financial efficiency level than competing MS’s.
For example, in 2012, dairy farms in Ireland had a financial efficiency ratio of 6
percent lower than the EU average, indicating a superior performance in financial
efficiency terms. When the ratio is examined for EU-15 countries, Ireland finds itself in
a much improved position relative to the average.
3.5 Concluding Remarks Given that Irish agriculture is now competing in a more globalised market place, the
financial stability from an inter country perspective (i.e. between competing countries)
is becoming increasingly important.
0
0.1
0.2
0.3
0.4
0.5
0.6
0.7
0.8
0.9
1
EL RO IT AT LT PT PL ES IE LU SI
EU27 F
R BE LV HU FI CY DE BU UK ES MT
NE
DK CZ SE SK
Cash
Cos
ts a
s % o
f Gro
ss O
utpu
t

41
The financial indicators described in this chapter indicate that on average Irish farms
have relatively low debt and high asset values relative to the EU average for all farms.
Furthermore, solvency, liquidity and financial efficiency indicators also displayed Irish
farms in a healthy position in EU terms. While previous work by Teagasc has shown
that Ireland continues to exhibit a healthy position in terms of the competitiveness of
our agricultural sector (in EU and international markets), in a market which is
increasingly exposed to market price volatility, the ability to demonstrate resilience
will be equally important in the future. Given that the findings from this chapter have
indicated that not only does Ireland enjoy a competitive advantage in cost terms
within the EU, the level of debt and financial status of Irish farms should also provide
Irish farms with a relative advantage in resilience terms given that they are not
servicing high debt levels in years of extreme market volatility.
42
Chapter 4 The Dynamics of Investment
4.1 Introduction
This chapter provides an overview of investments within Irish agriculture. The
analysis uses Teagasc National Farm Survey (NFS) data to analyse the determinants of
investment on all farms with a view to identifying the characteristics of investors and
determining the types of farms most likely to invest in the years ahead. To answer
these research questions the analysis is outlined as follows: first, a descriptive analysis
of the types of farms investing is conducted, followed by results of an econometric
model that reveals what characterises the investment behaviour of Irish farmers.
4.2 Background
The factors affecting farm investment decisions have attracted considerable research
interest and have previously been investigated using Teagasc NFS data. While this
analysis provides a new and updated analysis based on 2013 data, the findings are set
in context with previous results. Investment decisions were previously analysed by
Hennessy and O’Brien (2007) using NFS data from 2004, and by Thorne et al., (2009)
using NFS data from 2008. Hennessy and O’Brien showed that larger, more profitable
dairy farms, with both a successor and a spouse with off-farm income present, had an
increased probability of investment on the farm. When the issue was revisited using
data from 2008 by Thorne et al., (2009) it was interesting to note that while size,
system and identification of a successor remained significant in the investment
decision, the presence of an off-farm job and the income level of the farm were not
found to be statistically important in explaining farm investment decisions. Given that
significant grant aid was available to farmers in the period following 2004 via the
Farm Waste Management Scheme (FWMS) it is posited that that the availability of
grant aid was likely to have been very important in explaining the investment
decisions in the 2008 period, which possibly resulted in income (both on-farm and
off-farm) not playing as important a role in the investment decision.
4.3 Empirical Model
The investment decision model used in this paper is similar to that used by Hennessy
and O’Brien (2007) and Thorne et al., (2009). It is a binary choice probit model which
estimates the probability of a farmer investing in farming activities given farm and
demographic characteristics. The dependent variable is equal to one if the farmer

43
invests in farming activities and zero otherwise. Further details on the specification of
the model can be found in Appendix 4.1.
4.4 Data and Descriptive Analysis
NFS data for 2013, based on 911 observations representing a national population of
79,103 farms, were used for this analysis. While NFS farms are classified into six
farming systems (dairy, cattle rearing, cattle other, sheep, tillage and mixed livestock),
the categories dairy and mixed livestock6 as well as both cattle systems are merged for
the purpose of this analysis. This dataset is used to estimate the empirical model
outlined that is used to investigate the factors influencing the on-farm investment
decision. Table 4.1 of descriptive statistics provides a general overview of the
investment levels of farms included in the 2013 NFS.
Table 4.1: Average Net New Investment – by Farm System – 2013
Net New Investment Dairy other Cattle Sheep Tillage All farms
Average (€) 18,010 4,652 3,295 11,810 8,141
Average of investing farms (€)
23,514 8,849 6,899 20,663 18,406
Note: Net New Investment is equal to gross new investment in machinery, buildings, quota and land improvements (including forestry) minus sales and capital grants received during the year. Source: Teagasc National Farm Survey, 2013
It can be seen that in 2013, average net new investment per farm was highest on dairy
farms, followed by tillage farms. Average investment levels of beef and sheep farms
were considerably lower.
Next, Table 4.2 provides variable descriptions and summary statistics of important
characteristics that are used in the empirical analysis, based on the sample data on 911
farms when combined with the population weights associated with these farms means
that the data reported is representative of 79,903 farms nationally. In 2013, almost 60
percent of all farms had positive net new investments. On average, Irish farms had 47
hectares of utilisable agricultural area with the farm holder being on average 57 years
of age. Almost half of all farms had an off-farm income that was either gained by the
farm holder (28 percent) and/or the spouse (35 percent). Access to credit is often cited
in the literature as a variable that can have a significant impact on investment levels.
However, for the current analysis, access to credit was not included in the model given
that results from a recent Teagasc National Farm Survey analysis (reported in Chapter
5) indicates that access to credit has not been an issue for the farm sector in the recent
past.
6Mixed livestock farms generally have a significant dairy enterprise, but not as the dominant farm enterprise.
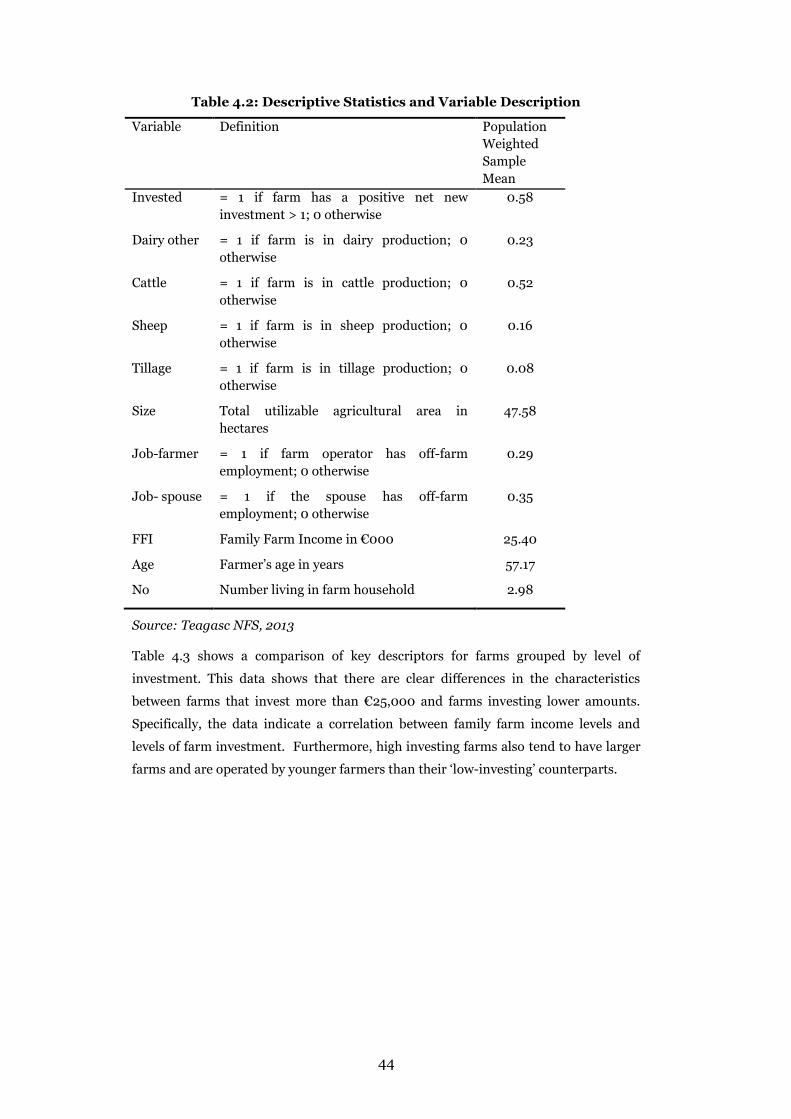
44
Table 4.2: Descriptive Statistics and Variable Description
Variable Definition Population Weighted Sample Mean
Invested = 1 if farm has a positive net new investment > 1; 0 otherwise
0.58
Dairy other = 1 if farm is in dairy production; 0 otherwise
0.23
Cattle = 1 if farm is in cattle production; 0 otherwise
0.52
Sheep = 1 if farm is in sheep production; 0 otherwise
0.16
Tillage = 1 if farm is in tillage production; 0 otherwise
0.08
Size Total utilizable agricultural area in hectares
47.58
Job-farmer = 1 if farm operator has off-farm employment; 0 otherwise
0.29
Job- spouse = 1 if the spouse has off-farm employment; 0 otherwise
0.35
FFI Family Farm Income in €000 25.40
Age Farmer’s age in years 57.17
No Number living in farm household 2.98
Source: Teagasc NFS, 2013
Table 4.3 shows a comparison of key descriptors for farms grouped by level of
investment. This data shows that there are clear differences in the characteristics
between farms that invest more than €25,000 and farms investing lower amounts.
Specifically, the data indicate a correlation between family farm income levels and
levels of farm investment. Furthermore, high investing farms also tend to have larger
farms and are operated by younger farmers than their ‘low-investing’ counterparts.

45
Table 4.3 Comparison of Farms Grouped by Level of Investment Average level of investment (€)
Family farm income (€)
Market income (€)
Farm size (ha)
Farmer Age
(years)
% of Total population
0 16,704 733 41.82 58.80 42.03
1-2,500 17,551 598 39.68 57.58 17.11
2,501-7,500 30,174 8,727 53.29 55.60 15.92
7,501-25,000 34,754 12,483 50.04 55.81 14.58
25,001 + 53,224 23,126 71.83 54.21 10.36
All 25,437 5,963 47.58 57.17 100
Source: Teagasc National Farm Survey, 2013
Detailed analysis of the individual investment level groups in Table 4.3 reveals that
almost 80 percent of farms with no investments are cattle or sheep farmers, while the
majority of ‘high investing’ farms are dairy farmers, see Figure 4.1.
Figure 4.1 Different Investment Levels grouped by Farm System7
Source: Teagasc National Farm Survey, 2013
4.5 Econometric Analysis of the Determinants of Investment
In the remainder of this chapter the results from an econometric model are presented
to determine the factors affecting investment decisions.
7 Please note that cattle and sheep farms are merged into one category for this analysis, due to small number of sheep farmers that invested more than €25,000 in 2013.
13%
79%
8%
No Investment
Dairy other Cattle&Sheep Tillage
52% 28%
20%
Large Investment > €25,000
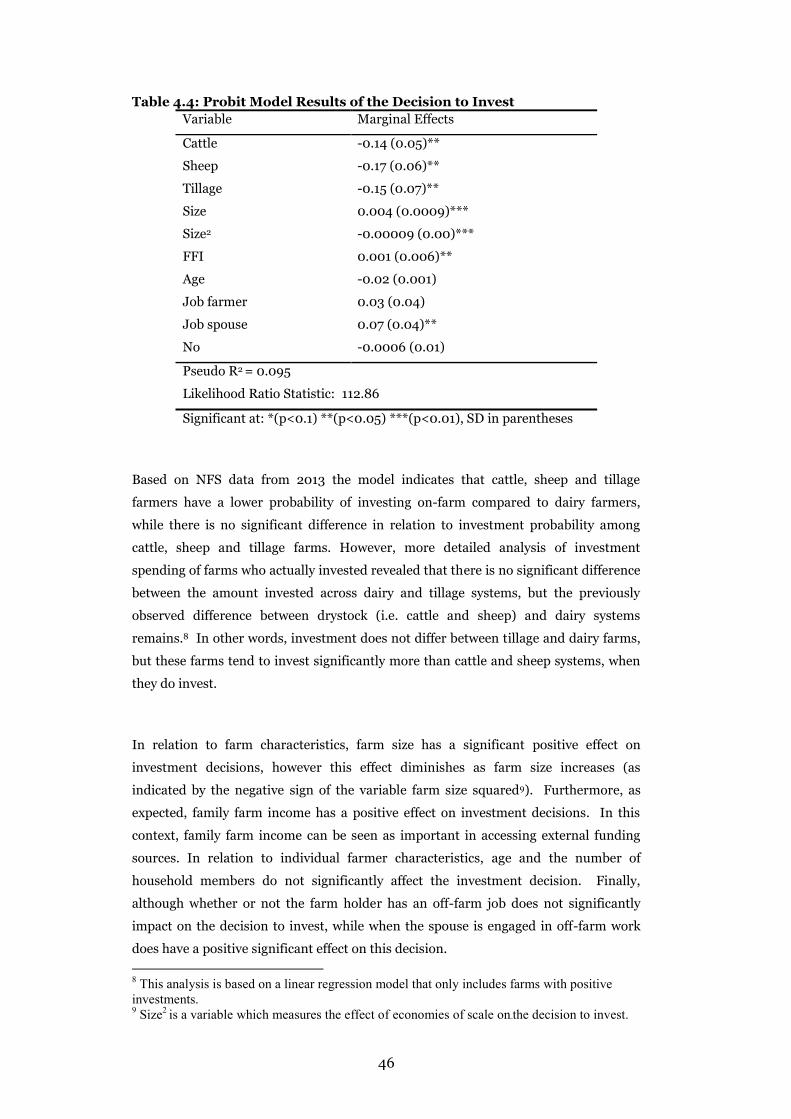
46
Table 4.4: Probit Model Results of the Decision to Invest Variable Marginal Effects
Cattle -0.14 (0.05)**
Sheep -0.17 (0.06)**
Tillage -0.15 (0.07)**
Size 0.004 (0.0009)***
Size2 -0.00009 (0.00)***
FFI 0.001 (0.006)**
Age -0.02 (0.001)
Job farmer 0.03 (0.04)
Job spouse 0.07 (0.04)**
No -0.0006 (0.01)
Pseudo R2 = 0.095
Likelihood Ratio Statistic: 112.86
Significant at: *(p<0.1) **(p<0.05) ***(p<0.01), SD in parentheses
Based on NFS data from 2013 the model indicates that cattle, sheep and tillage
farmers have a lower probability of investing on-farm compared to dairy farmers,
while there is no significant difference in relation to investment probability among
cattle, sheep and tillage farms. However, more detailed analysis of investment
spending of farms who actually invested revealed that there is no significant difference
between the amount invested across dairy and tillage systems, but the previously
observed difference between drystock (i.e. cattle and sheep) and dairy systems
remains.8 In other words, investment does not differ between tillage and dairy farms,
but these farms tend to invest significantly more than cattle and sheep systems, when
they do invest.
In relation to farm characteristics, farm size has a significant positive effect on
investment decisions, however this effect diminishes as farm size increases (as
indicated by the negative sign of the variable farm size squared9). Furthermore, as
expected, family farm income has a positive effect on investment decisions. In this
context, family farm income can be seen as important in accessing external funding
sources. In relation to individual farmer characteristics, age and the number of
household members do not significantly affect the investment decision. Finally,
although whether or not the farm holder has an off-farm job does not significantly
impact on the decision to invest, while when the spouse is engaged in off-farm work
does have a positive significant effect on this decision. 8 This analysis is based on a linear regression model that only includes farms with positive investments. 9 Size2 is a variable which measures the effect of economies of scale on the decision to invest.
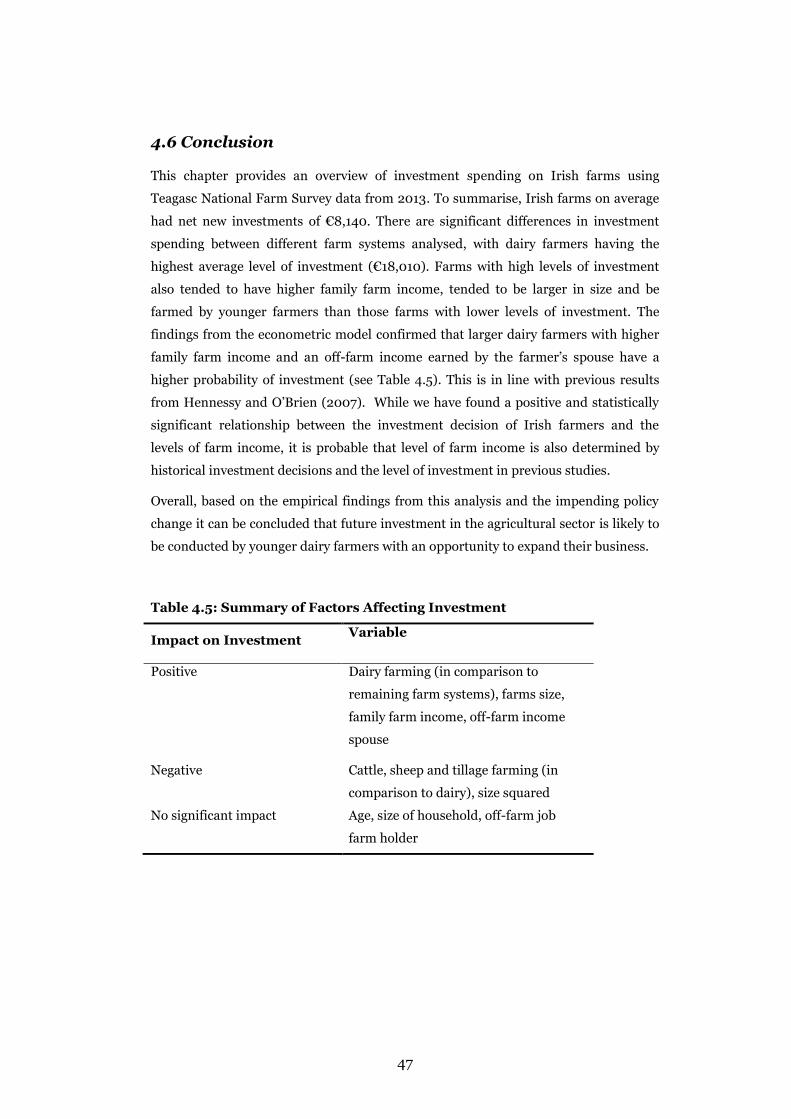
47
4.6 Conclusion
This chapter provides an overview of investment spending on Irish farms using
Teagasc National Farm Survey data from 2013. To summarise, Irish farms on average
had net new investments of €8,140. There are significant differences in investment
spending between different farm systems analysed, with dairy farmers having the
highest average level of investment (€18,010). Farms with high levels of investment
also tended to have higher family farm income, tended to be larger in size and be
farmed by younger farmers than those farms with lower levels of investment. The
findings from the econometric model confirmed that larger dairy farmers with higher
family farm income and an off-farm income earned by the farmer’s spouse have a
higher probability of investment (see Table 4.5). This is in line with previous results
from Hennessy and O’Brien (2007). While we have found a positive and statistically
significant relationship between the investment decision of Irish farmers and the
levels of farm income, it is probable that level of farm income is also determined by
historical investment decisions and the level of investment in previous studies.
Overall, based on the empirical findings from this analysis and the impending policy
change it can be concluded that future investment in the agricultural sector is likely to
be conducted by younger dairy farmers with an opportunity to expand their business.
Table 4.5: Summary of Factors Affecting Investment
Impact on Investment Variable
Positive Dairy farming (in comparison to
remaining farm systems), farms size,
family farm income, off-farm income
spouse
Negative Cattle, sheep and tillage farming (in
comparison to dairy), size squared
No significant impact Age, size of household, off-farm job
farm holder

48
Chapter 5 Investment Requirements of the Dairy Farm Sector to 2020
5.1 Introduction The removal of the milk quota regime in April of 2015 will present the first substantive
opportunity in over 30 years to expand Irish milk production at the national level.
While it is difficult to predict with accuracy the extent to which milk production may
increase in Ireland, there seems to be a broad consensus that the increase will be
substantial. The target of a 50 percent expansion in milk output (by 2020 from the
2007 to 2009 base) that was set by the Food Harvest 2020 report now seems to be
accepted as not only achievable but highly likely to be achieved. This ambitious
expansion plan has been matched by private industry investment. Both Glanbia and
Dairygold have embarked on major investment projects with a view to increasing their
milk processing capacity. Glanbia are investing up to €150 million in a new processing
plant in the Southeast which will increase the company’s processing capacity by more
than 50 percent. While Dairygold plan to invest over €100 million in additional
processing capacity in Cork. These significant investment plans give real grounds for
optimism and provide commercial support for the Government’s ambitious expansion
plan.
The objective of this Chapter is to consider how Irish farmers are likely to react to milk
quota removal, what expansion in production is likely to occur and most importantly,
in the context of this study, what investment will be required at the farm level to
facilitate this expansion. Some previous studies have considered the investment
required to achieve the Food Harvest targets. The IFA for example have predicted that
€1.5 billion will be invested at farm level by 2020, Kiersey and Bryan (2014). A study
by Keane (2010) estimated that with an assumed 20 percent increase in yields by 2020
and a strong movement towards fewer and larger herds, an investment of €1.9 billion
by 2020 would be required. A subsequent study assuming a more gradual movement
towards larger herds resulted in an estimate of €1.3 billion to achieve the national
target of 50% milk output growth by 2020, Keane (2011).
Here Teagasc National Farm Survey data are used to estimate the likely investment
requirements of the dairy farm sector to 2020. Two approaches are adopted. First, a
medium term (next five years) estimate of dairy farm level investment is presented. In
an era of considerable milk price volatility, it is difficult to forecast to what extent
national milk production will increase following the removal of milk quotas. This
difficulty is compounded at the farm-level by farm specific factors such as age, the
presence of a successor and current farm infrastructure which are likely to have a
significant influence on individual farm expansion plans. This Chapter does not

49
attempt to forecast the future development of milk production in Ireland. Instead the
analysis considers the investment that would be required to achieve the Food Harvest
target of a 50 percent increase in milk output.
A model developed by Laepple and Hennessy (2012) is applied to Teagasc National
Farm Survey data on existing dairy farms to estimate each farm’s likely expansion path
post quota removal and the associated required investment. Additionally, the
investment required for a new start-up dairy business is also considered. Following
this, a shorter term (next two years) estimate of investment requirements is produced
by examining recent survey Teagasc National Farm Survey (NFS) data on farmers’
short term milk expansion and farm investment plans.
5.2 Dairy Farm Sector Investment Requirements to 2020 The Food Harvest 2020 report set a target to increase milk production by 50 percent
by 2020 from the 2007 to 2009 base. This represents an approximate 2.6 billion litres
of additional milk production. It is important to note however, that some of this
expansion in milk output has already occurred (Figure 5.1). In the 2013/2014 milk
quota year, total milk deliveries had already increased by 480 million litres or a 9
percent increase over the 2007 to 2009 base. It is estimated that on the back of very
good milk prices and excellent production conditions that milk deliveries increased
further in the 2014/2015 quota year to 5.96 billion litres of milk or 14.6 percent above
the Food Harvest Committee report base of 2007 to 2009.
Figure 5.1: Irish Milk Deliveries (fat adjusted) on a quota year basis
Source: Donnellan and Hanrahan. (2014)
Approximately 30 percent of the Food Harvest 2020 growthtarget of 50 percent has
already occurred and over this period Irish dairy farmers have been investing. Figure
5.2 presents the average net new farm investment for dairy farmers from 2007 to
2013. This average includes both investors and non-investors. As can be seen, farm
investment peaked in 2008 at an average of €40,965, with this peak level of
0
1000
2000
3000
4000
5000
6000
7000
2007/08 2008/09 2009/10 2011/12 2012/13 2013/14 2014/15
Mill
ions
of l
itre
s

50
investment coinciding with high milk prices and high farm incomes. Farm investment
on dairy farms collapsed in 2009 again coinciding with very low milk prices and farm
incomes. Investment has recovered since 2009, with the lowest levels of investment
coinciding with very low milk prices and farm incomes. Investment has recovered
since 2009, but has not returned to the 2008 level. In aggregate, net new investment
in the Irish dairy farm sector totalled approx. €2.4 billion in the 2007 to 2013 period.
Figure 5.2: Average Net New Investment on Irish Dairy Farms
Source: Teagasc National Farm Survey
Although aggregate milk production has increased since the publication of the Food
Harvest 2020 report, another 1.8 billion litres of milk is required to fully achieve the
50 percent target by 2020. Donnellan and Hanrahan (2014) used the FAPRI-Ireland
model to simulate a scenario where the Irish dairy sector achieves the Food Harvest
target of expanding milk production by 50 percent by 2020. In this simulation it is
estimated that deliveries per cow increase by 18 percent from 2007-2009 to 2020.
When considering expansion, many equate additional milk with cows, while this is
true to a certain extent; the relationship between the two is not linear. Much of the
additional milk that is expected to be delivered over the next five years is expected to
come from productivity gains and greater deliveries per cow. Such expansion would
come at a lower cost, requiring only additional operating capital due to higher feed
costs and possibly some capital expenditure for investment in additional bulk tank
capacity.
Based on productivity gains per cow of 18 percent, Donnellan and Hanrahan (2014)
estimate that 1.499 million cows will be required to achieve the 50 percent expansion
target and this would represent an increase of 450,000 cows in addition to the dairy
cow population over the Food Harvest base period of 2007-2009.
05000
1000015000200002500030000350004000045000
2007 2008 2009 2010 2011 2012 2013
€ p
er fa
rm
51
A simple approach to estimating the investment required at the farm level would be to
apply an investment per cow estimate, based perhaps on a land, housing and milking
facility cost, to each additional cow to arrive at an aggregate investment figure.
However, this approach would ignore many of the complexities of how dairy
expansion is likely to occur at the farm level. First, the existing population of dairy
farms is likely to continue to decline over the next 5 years thus leading to further
consolidation in Irish milk production. This suggests that even in the absence of
expansion in Irish milk output investment will be required to facilitate the normal on-
going farm level restructuring that occurs in the sector. Second, some of the additional
cows used to achieve the expansion target will be stocked on existing dairy farms, they
will use the existing land and facilities and therefore the additional production
associated with these cows will likely require very little capital investment. Third,
some cows stocked on existing dairy farms may require more significant investment
in, this more significant investment will occur where growth in the farm’s cow
numbers is such that additional investment in farm buildings and milking facilities is
required. Finally, a proportion of these additional cows are likely to be stocked on new
start-up dairy farms, either green-field sites and/or conversions of existing cattle
farms. In both of these new business set-up environments, substantial capital
investment will be required.
5.2.1 Phased expansion model
Laepple and Hennessy (2012) developed a simulation model of Irish dairy farming to
estimate changes in national milk production in 2020 under three varying milk price
scenarios. They used this model to estimate the extent to which the existing
population of dairy farms could expand production. They also simulated structural
change in the industry with a number of farms projected to exit production over the
next 5 years. This means that many individual farms are expanding milk production
even when the national milk pool is remaining static. Laepple and Hennessy estimated
that despite the falling population of farmers, cow numbers and milk output are
expected to expand over the period to 2020. They estimated that milk output would
increase by between 20 and 40 percent relative to 2008 levels depending on the milk
price considered, with a 32 percent increase in milk production being considered the
most likely scenario. Under this scenario 850 new dairy business start-ups with an
average herd size of 62 cows would be required to achieve the 50 percent expansion
target.
For the purposes of this report, the Laepple and Hennessy analysis has been updated
using more recent National Farm Survey data and also more up to date estimates of
the investment costs associated with each expansion phase. The details of each
52
expansion phase and the assumed investment requirements for each stage are outlined
below.
Phase 1: the initial additional milk comes from the low cost approach of increasing
deliveries per cow, an increase of 12 percent between 2013 and 2020 is assumed (little
to no investment required)
Phase 2: the next phase is the medium cost approach of purchasing/rearing
additional dairy cows on the existing land base, converting cattle housing and partially
upgrading the existing milking parlour. According to Ryan et al. (2013) the guideline
costs for constructing a cubicle bed in an existing straw bedded or slatted shed is €250
to €350 per cubicle, taken here as €300 per cow housing cost. The upgrading of dairy
facilities is assumed to cost €400 per cow for the first additional 40 percent of cows,
Hennessy et al. (2009). Although the vast majority of farmers are likely to breed their
own replacements as well those required to expand their herd, in this case a cost of
€1,300 for an in-calf heifer is assumed.10 The replacement of a beef livestock unit with
a dairy cow is assumed to result in a net increase in labour of 23 hours per cow,
Hennessy et al. (2009). The cost of extra labour is €10 per hour.
Phase 3: is a higher cost approach where existing dairy farms purchase or rear
additional dairy cows, stock them on the existing land but must extend cattle housing
and build a new milking parlour if the total herd size is increasing by more than 40
percent. It is assumed that a new milking parlour is constructed at a cost of €9,500 per
unit or €1,520 per cow for the full herd11 (Ryan et al., 2013). All additional cows are
housed in a new cubicle shed that is added to an existing slatted shed at a cost of €550
/cow place (Ryan et al., 2013). Again in-calf heifer costs are assumed to be €1,300 per
animal and labour is assumed at 23 additional hours at €10 per hour.
Phase 4: the very high cost approach is where cattle and/or tillage farms convert to
dairy farming and significant investment is required in housing, milking facilities,
roadways etc. The investment associated with this stage of expansion is discussed
below.
For all on-farm investment it is assumed that capital investment in housing and
milking facilities is financed using a 10-year term loan at an interest rate of 5 per cent,
with the investment in cows written off over a five year period. Labour costs are
covered from working capital. In order to arrive at an estimate of the investment
required to fund dairy expansion, it is necessary to consider the amount of additional
milk that can be delivered in each of the four expansion phases outlined above and the
associated investment required. The investment costs are annualised and only farms
that can expand profitably at each expansion stage are expected to do so.
10 This is based on the average price paid for in-calf heifers by farmers in the NFS in the 2008 to 2013 period. 11 This is based on a 16 unit parlour used to milk 100 cows.

53
The analysis first considers the normal process of structural change in the dairy farm
sector. Dairy farm numbers are estimated to decrease by approximately 1.75 percent
per year between 2013 and 2020 leading to a reduction in total farms number of
approximately 2,400 farms. These exiting farms account for 14 percent of the 2013
national milk pool. The first phase of expansion considered involves increasing
deliveries per cow. It is assumed that deliveries per cow increase by 1.5 percent per
year, with a 2 percent increase in 2015 and 2016 following the removal of milk quota.
This amounts to a cumulative 12 percent increase in deliveries per cow between 2013
and 2020. It is assumed that this increase in output per cow will incur only minimal
additional production costs as it will be achieved through improved breeding, herd
and grassland management (Dillon et al., 2010). The 12 percent increase in deliveries
per cow is just sufficient to offset the milk production lost through the exit of farms
from dairying, thus leaving aggregate milk production more or less unchanged.
The next stage of expansion involves increasing cow numbers on the existing land
base. As in Laepple and Hennessy (2012) it is assumed that the stocking density on the
dairy platform is increased in line with the objectives set out in the Teagasc roadmap
for farms of varying soil type. A milk price scenario of 31 cent per litre is assumed as
per the “Steady” scenario described in Chapter 7. At a price of 31 cent per litre,
approximately 9,200 farms find it profitable to expand under Phase 2 (as described
above) and another 2,900 find it profitable to expand under the more costly Phase 3. It
is estimated that the combined expansion achieved under Phases 1, 2 and 3 on the
remaining 15,700 farms is 37 percent over and above the 2013 national milk pool, or
43 percent over the Food Harvest 2007 to 2009 base. The total number of dairy cows
in this scenario is 1.316 million, a 12 percent increase on the 2013 level. However given
that the number of dairy farms has reduced, the total number of new cows requiring
new housing, milking facilities and labour is 282,000.
The total investment required to achieve this expansion is presented in Table 5.1. The
cost of acquiring the additional 282,000 cows is estimated to be €401 million. This is
based on a cost of €1,300 per cow borrowed and repaid over 5 years. It is estimated
that approximately 2,900 farms will expand cow numbers by 40 percent or more and
therefore will require a new milking parlour. Up to 350,000 cows will be milked in
new parlours at an investment cost of €649 million. The remaining investment is
associated with converting and extending existing animal housing and upgrading of
milking facilities on farms that are not erecting new milking parlours.

54
Table 5.1: Investment requirements for existing dairy farms
Total Investment
€million
Acquisition of dairy cows 401 New Milking Parlour (on 2,900 farms) 649 Conversion of beef housing to dairy (for 176,ooo cows) 76 Upgrading of existing milking facilities (on 8,000 farms) 63 Extension to existing housing (for 60,000 cows) 53 Total Investment 1241
The total investment required by existing dairy farms to increase the national milk
pool by 43 percent from the 2007 to 2009 base up to 2020 is €1,241 million.
The remaining 383 million litres of milk (i.e. the additional milk required to achieve
the Food Harvest 2020 production target) will be supplied by new entrants. Assuming
an average delivery of 5,750 per cow in 2020, then approximately 66,500 additional
dairy cows will be required to further expand the milk pool to a level 50 percent above
the 2007-2009 base. It is difficult to predict how many new dairy farm businesses will
be established over the next 5 years, but in order to achieve the Food Harvest target
(and assuming an average herd size for new entrants of 130 cows) it is estimated that
approximately 500 new entrants are required. This milk will be delivered under the
most expensive stage, i.e. Phase 4 and again it is difficult to predict the costs
associated with a new business start-up or conversion to dairying as it will very much
depend on the existing infrastructure on the farm. The Teagasc Greenfield dairy
project provides some insights. Shalloo et al. (2011) have provided an estimate of start-
up costs for this 295 cow operation. They estimate stock acquisition costs to be €1,300
per cow, infrastructure costs including stand-off pads, roadways, yarding, etc. to be
€1,105 per cow, parlour costs €772 per cow, fencing and water provision €160 per cow,
reseeding and land preparation €166 per cow. For the purpose of this analysis any
other operating costs, such as the normal direct costs of production, are not
considered. This brings the total start-up costs to €3,500 per cow or an approximate
€233 million to produce the additional 383 million litres of milk.
Combining the investment requirements of existing dairy farms with those starting a
dairy new business brings the total investment requirement of the dairy farm sector to
€1.47 billion between 2013 and 2020.
It is important to note that this figure cannot be strictly interpreted as an estimate of
the demand for additional credit from banking institutions, since some of the €1.47
billion is likely to be financed out of working capital. Further detail on how farmers
intend to fund future investment is presented in section 5.4 below.
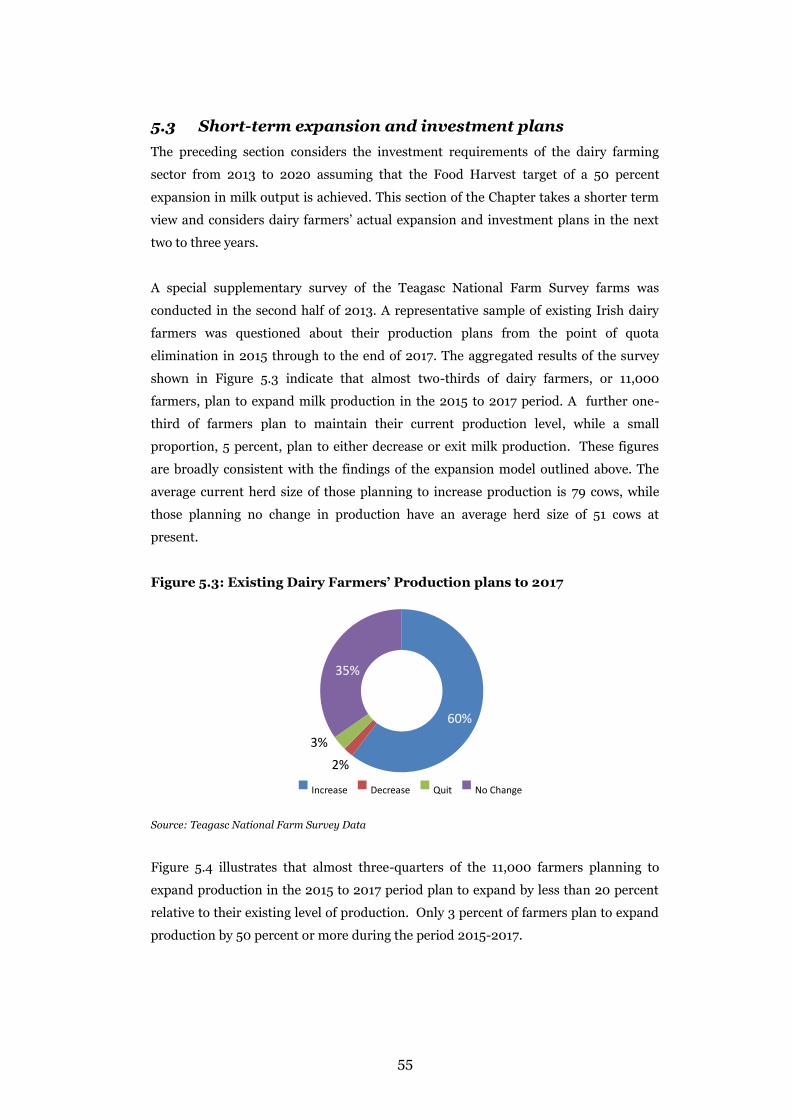
55
5.3 Short-term expansion and investment plans The preceding section considers the investment requirements of the dairy farming
sector from 2013 to 2020 assuming that the Food Harvest target of a 50 percent
expansion in milk output is achieved. This section of the Chapter takes a shorter term
view and considers dairy farmers’ actual expansion and investment plans in the next
two to three years.
A special supplementary survey of the Teagasc National Farm Survey farms was
conducted in the second half of 2013. A representative sample of existing Irish dairy
farmers was questioned about their production plans from the point of quota
elimination in 2015 through to the end of 2017. The aggregated results of the survey
shown in Figure 5.3 indicate that almost two-thirds of dairy farmers, or 11,000
farmers, plan to expand milk production in the 2015 to 2017 period. A further one-
third of farmers plan to maintain their current production level, while a small
proportion, 5 percent, plan to either decrease or exit milk production. These figures
are broadly consistent with the findings of the expansion model outlined above. The
average current herd size of those planning to increase production is 79 cows, while
those planning no change in production have an average herd size of 51 cows at
present.
Figure 5.3: Existing Dairy Farmers’ Production plans to 2017
Source: Teagasc National Farm Survey Data
Figure 5.4 illustrates that almost three-quarters of the 11,000 farmers planning to
expand production in the 2015 to 2017 period plan to expand by less than 20 percent
relative to their existing level of production. Only 3 percent of farmers plan to expand
production by 50 percent or more during the period 2015-2017.
60%
2% 3%
35%
Increase Decrease Quit No Change
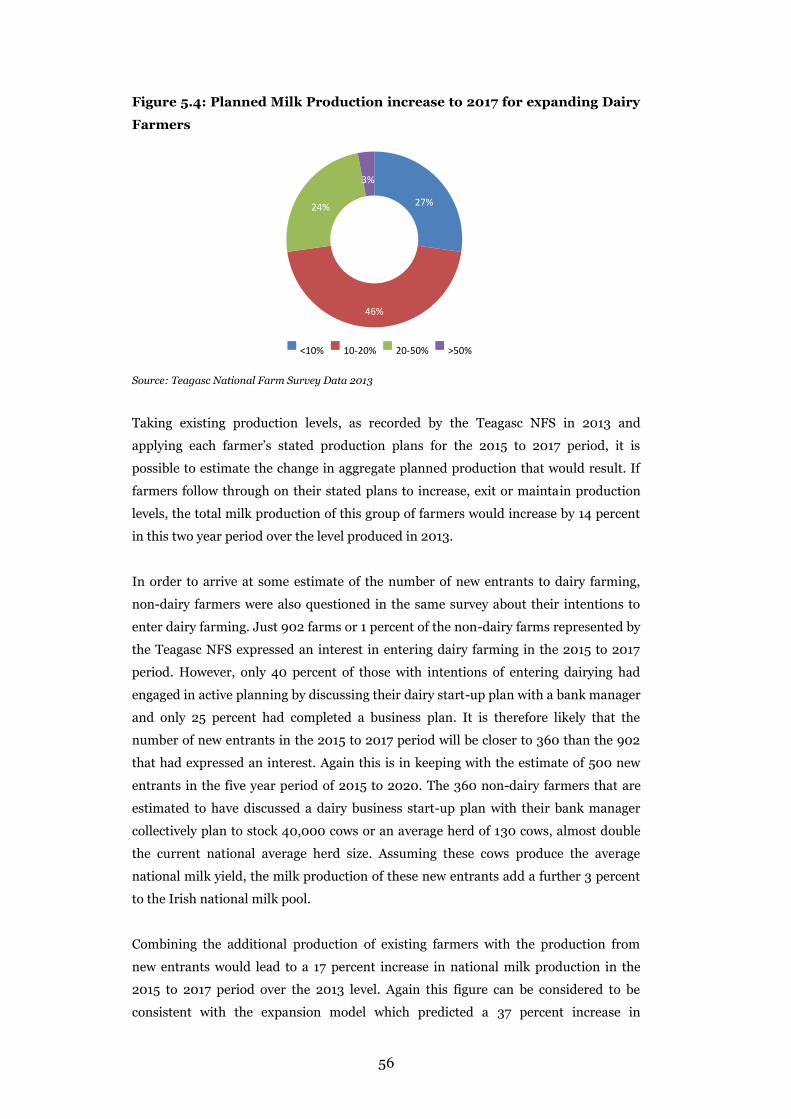
56
Figure 5.4: Planned Milk Production increase to 2017 for expanding Dairy
Farmers
Source: Teagasc National Farm Survey Data 2013
Taking existing production levels, as recorded by the Teagasc NFS in 2013 and
applying each farmer’s stated production plans for the 2015 to 2017 period, it is
possible to estimate the change in aggregate planned production that would result. If
farmers follow through on their stated plans to increase, exit or maintain production
levels, the total milk production of this group of farmers would increase by 14 percent
in this two year period over the level produced in 2013.
In order to arrive at some estimate of the number of new entrants to dairy farming,
non-dairy farmers were also questioned in the same survey about their intentions to
enter dairy farming. Just 902 farms or 1 percent of the non-dairy farms represented by
the Teagasc NFS expressed an interest in entering dairy farming in the 2015 to 2017
period. However, only 40 percent of those with intentions of entering dairying had
engaged in active planning by discussing their dairy start-up plan with a bank manager
and only 25 percent had completed a business plan. It is therefore likely that the
number of new entrants in the 2015 to 2017 period will be closer to 360 than the 902
that had expressed an interest. Again this is in keeping with the estimate of 500 new
entrants in the five year period of 2015 to 2020. The 360 non-dairy farmers that are
estimated to have discussed a dairy business start-up plan with their bank manager
collectively plan to stock 40,000 cows or an average herd of 130 cows, almost double
the current national average herd size. Assuming these cows produce the average
national milk yield, the milk production of these new entrants add a further 3 percent
to the Irish national milk pool.
Combining the additional production of existing farmers with the production from
new entrants would lead to a 17 percent increase in national milk production in the
2015 to 2017 period over the 2013 level. Again this figure can be considered to be
consistent with the expansion model which predicted a 37 percent increase in
27%
46%
24%
3%
<10% 10-20% 20-50% >50%
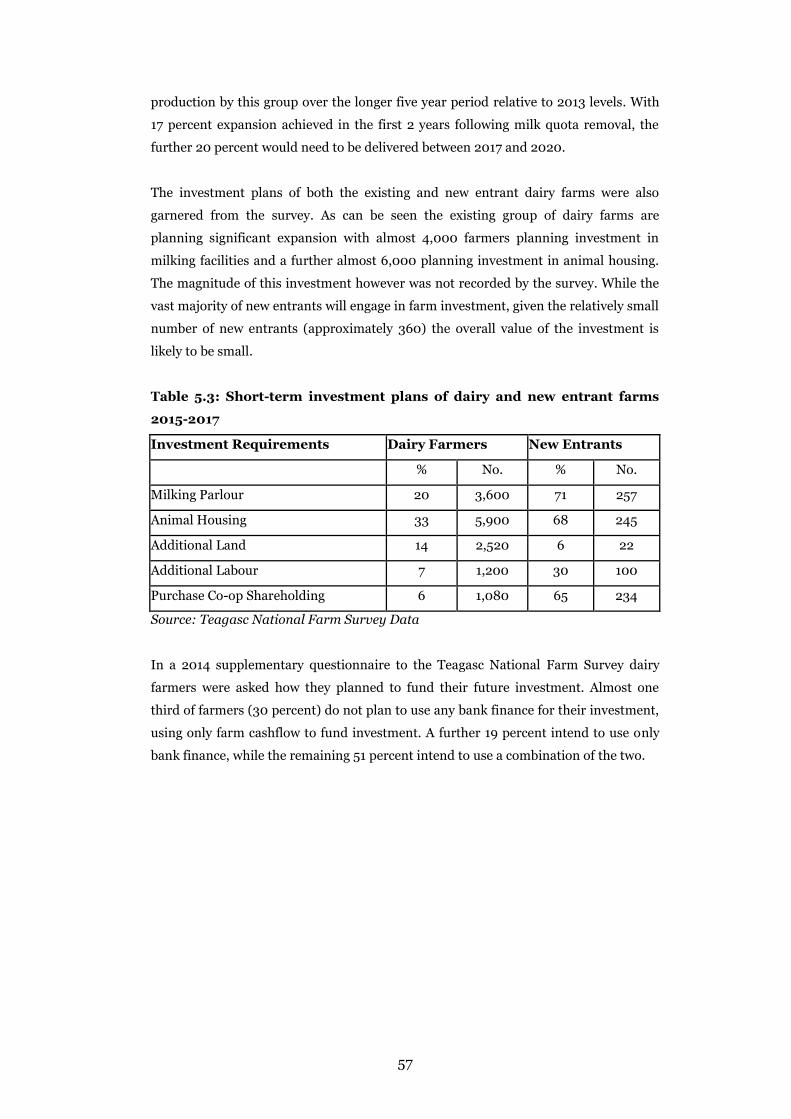
57
production by this group over the longer five year period relative to 2013 levels. With
17 percent expansion achieved in the first 2 years following milk quota removal, the
further 20 percent would need to be delivered between 2017 and 2020.
The investment plans of both the existing and new entrant dairy farms were also
garnered from the survey. As can be seen the existing group of dairy farms are
planning significant expansion with almost 4,000 farmers planning investment in
milking facilities and a further almost 6,000 planning investment in animal housing.
The magnitude of this investment however was not recorded by the survey. While the
vast majority of new entrants will engage in farm investment, given the relatively small
number of new entrants (approximately 360) the overall value of the investment is
likely to be small.
Table 5.3: Short-term investment plans of dairy and new entrant farms
2015-2017
Investment Requirements Dairy Farmers New Entrants
% No. % No.
Milking Parlour 20 3,600 71 257
Animal Housing 33 5,900 68 245
Additional Land 14 2,520 6 22
Additional Labour 7 1,200 30 100
Purchase Co-op Shareholding 6 1,080 65 234
Source: Teagasc National Farm Survey Data
In a 2014 supplementary questionnaire to the Teagasc National Farm Survey dairy
farmers were asked how they planned to fund their future investment. Almost one
third of farmers (30 percent) do not plan to use any bank finance for their investment,
using only farm cashflow to fund investment. A further 19 percent intend to use only
bank finance, while the remaining 51 percent intend to use a combination of the two.
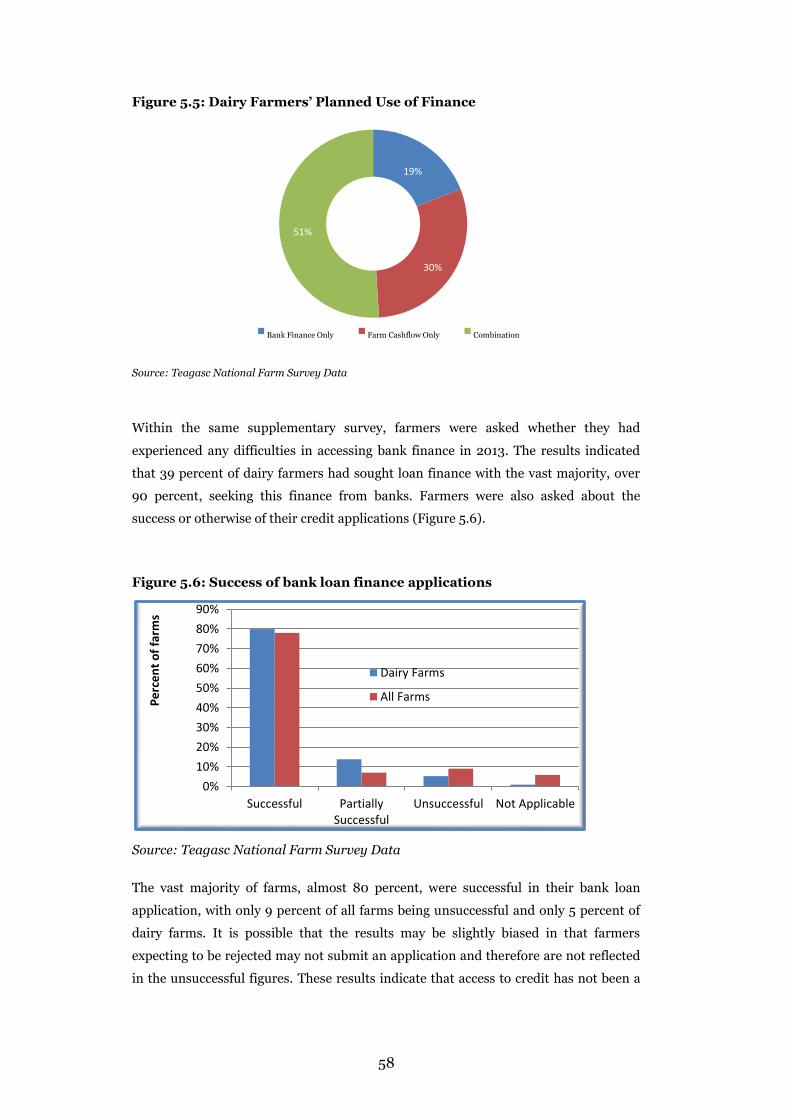
58
Figure 5.5: Dairy Farmers’ Planned Use of Finance
Source: Teagasc National Farm Survey Data
Within the same supplementary survey, farmers were asked whether they had
experienced any difficulties in accessing bank finance in 2013. The results indicated
that 39 percent of dairy farmers had sought loan finance with the vast majority, over
90 percent, seeking this finance from banks. Farmers were also asked about the
success or otherwise of their credit applications (Figure 5.6).
Figure 5.6: Success of bank loan finance applications
Source: Teagasc National Farm Survey Data
The vast majority of farms, almost 80 percent, were successful in their bank loan
application, with only 9 percent of all farms being unsuccessful and only 5 percent of
dairy farms. It is possible that the results may be slightly biased in that farmers
expecting to be rejected may not submit an application and therefore are not reflected
in the unsuccessful figures. These results indicate that access to credit has not been a
19%
30%
51%
Bank Finance Only Farm Cashflow Only Combination
0%10%20%30%40%50%60%70%80%90%
Successful PartiallySuccessful
Unsuccessful Not Applicable
Perc
ent o
f far
ms
Dairy Farms
All Farms
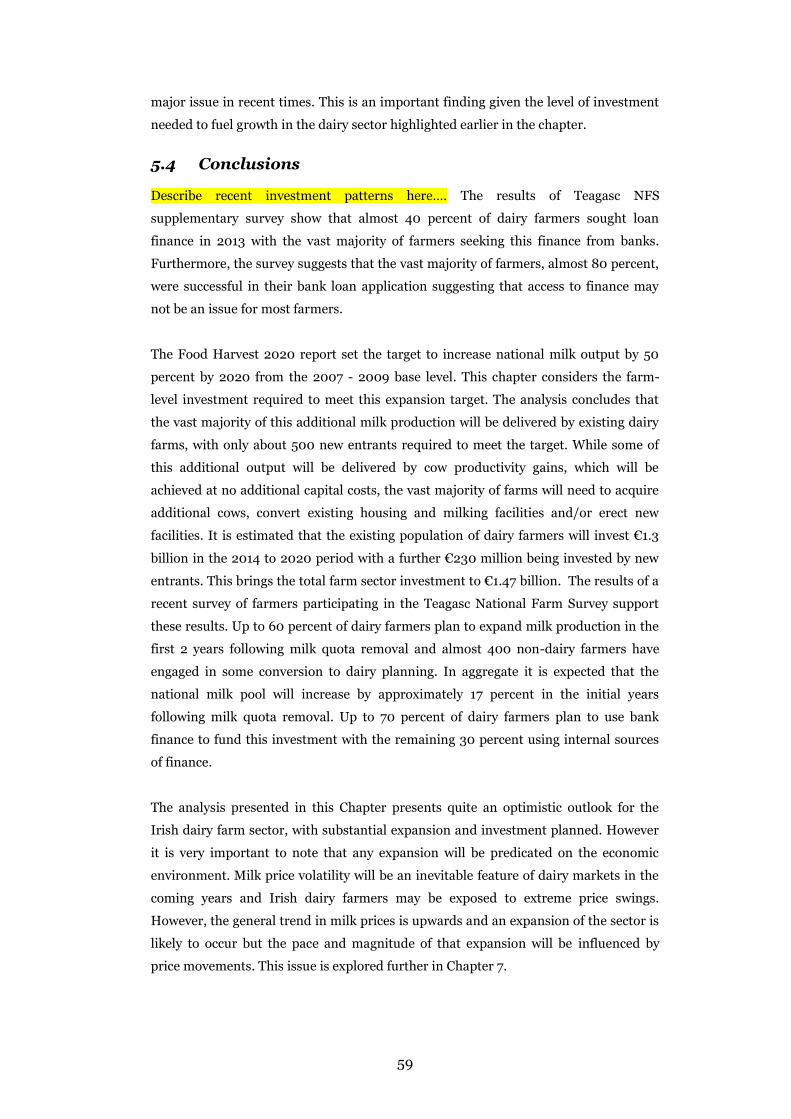
59
major issue in recent times. This is an important finding given the level of investment
needed to fuel growth in the dairy sector highlighted earlier in the chapter.
5.4 Conclusions Describe recent investment patterns here…. The results of Teagasc NFS
supplementary survey show that almost 40 percent of dairy farmers sought loan
finance in 2013 with the vast majority of farmers seeking this finance from banks.
Furthermore, the survey suggests that the vast majority of farmers, almost 80 percent,
were successful in their bank loan application suggesting that access to finance may
not be an issue for most farmers.
The Food Harvest 2020 report set the target to increase national milk output by 50
percent by 2020 from the 2007 - 2009 base level. This chapter considers the farm-
level investment required to meet this expansion target. The analysis concludes that
the vast majority of this additional milk production will be delivered by existing dairy
farms, with only about 500 new entrants required to meet the target. While some of
this additional output will be delivered by cow productivity gains, which will be
achieved at no additional capital costs, the vast majority of farms will need to acquire
additional cows, convert existing housing and milking facilities and/or erect new
facilities. It is estimated that the existing population of dairy farmers will invest €1.3
billion in the 2014 to 2020 period with a further €230 million being invested by new
entrants. This brings the total farm sector investment to €1.47 billion. The results of a
recent survey of farmers participating in the Teagasc National Farm Survey support
these results. Up to 60 percent of dairy farmers plan to expand milk production in the
first 2 years following milk quota removal and almost 400 non-dairy farmers have
engaged in some conversion to dairy planning. In aggregate it is expected that the
national milk pool will increase by approximately 17 percent in the initial years
following milk quota removal. Up to 70 percent of dairy farmers plan to use bank
finance to fund this investment with the remaining 30 percent using internal sources
of finance.
The analysis presented in this Chapter presents quite an optimistic outlook for the
Irish dairy farm sector, with substantial expansion and investment planned. However
it is very important to note that any expansion will be predicated on the economic
environment. Milk price volatility will be an inevitable feature of dairy markets in the
coming years and Irish dairy farmers may be exposed to extreme price swings.
However, the general trend in milk prices is upwards and an expansion of the sector is
likely to occur but the pace and magnitude of that expansion will be influenced by
price movements. This issue is explored further in Chapter 7.
60
Chapter 6
Current Financial Situation and Investment
requirements of the Pig Sector by 2020
6.1 Introduction Pig production constitutes a significant segment of the agricultural economy of
Ireland. Ranking third in importance after milk and beef, pigmeat amounts to 7% of
Gross Agricultural Output (GAO). The value of pigmeat exports in 2014 was estimated
at €476m. Despite a number of setbacks for European exports (including the Russian
ban on EU imports) Irish pigmeat exports to third countries increased by 9% for
January-October 2014 (. The pig sector is a significant employer, accounting for at
least 1,300 labour units on farms and a further 7,000 employed in associated sectors
such as pigmeat processing, feed manufacture, haulage and services. It is a sector
which survives on tight margins, without the aid of any form of subsidy or protection
from market forces, by achieving improved efficiencies at farm level.
6.2 Food Harvest 2020 Food Harvest 2020 (DAFM 2010) sets out formidable targets for Irish pigmeat
production, which can be summarised as follows:
1. Address the profitability gap: Reduce costs of production and maximise pig
price.
2. Increase the output value of the sector by 50%
3. Increase the average number of pigs produced per sow per year from 21.0
(average 2005-09) to 24.
4. Increase the national sow herd by 56,000 sows to 200,000 sows.
Food Harvest 2020 identifies the need to address the profitability gap in the sector as
a prelude to further expansion in the national sow herd. Specifically, a reduction in
feed costs per kg of pigmeat has to be achieved thereby reducing the gap between
Ireland and many of the main pigmeat producing countries in the European Union.
The profitability and credit crisis in Irish pig production since the 2010 Irish cereal
harvest continues to place many pig producers under substantial financial pressure.
The accumulated debt from this period, profitability in the medium term and future
access to bank finance will dictate whether the industry can achieve its expansion
target of 200,000 sows by 2020.

61
6.3 Industry Structure The Irish sow herd size is small by EU comparison at 1.2% of EU total with a low
density. The overall density of pig production, expressed as the agricultural area used
(AAU) per sow, in Ireland (25.7ha/sow) is low when compared to the Netherlands
(1.9ha), Denmark (2.0ha) and Belgium (2.2ha), Figure 6.1.
Figure 6.1: European Pig Density
Source: Eurostat 2013.
Although the Irish industry is small by total sow population, the average Irish farm
size (600 sows) is among the highest in Europe. Since Ireland is a net importer of feed
ingredients and a net exporter of product, located on the periphery of Europe, the
scale of production is important. The large farm size and resultant ‘economies of scale’,
in conjunction with the support of the Irish feed mills have been critical in maintaining
the national sow herd numbers despite the lower sector profitability over the last 5
years. The EU28 sow herd has fallen by 19.8% since 2005 with the Irish herd decrease
marginally lower at 17.4% (See Appendix 6.1 for further details).
6.4 Current Pig Sector Profitability The pig sector profitability is largely determined by input and output prices.
6.4.1 Input Costs
The largest single input cost in pig production is the cost of pig feed which constitutes
70-73% of the total cost of production. The profitability of the industry is therefore
significantly influenced by the fluctuations in world cereal prices. The industry is
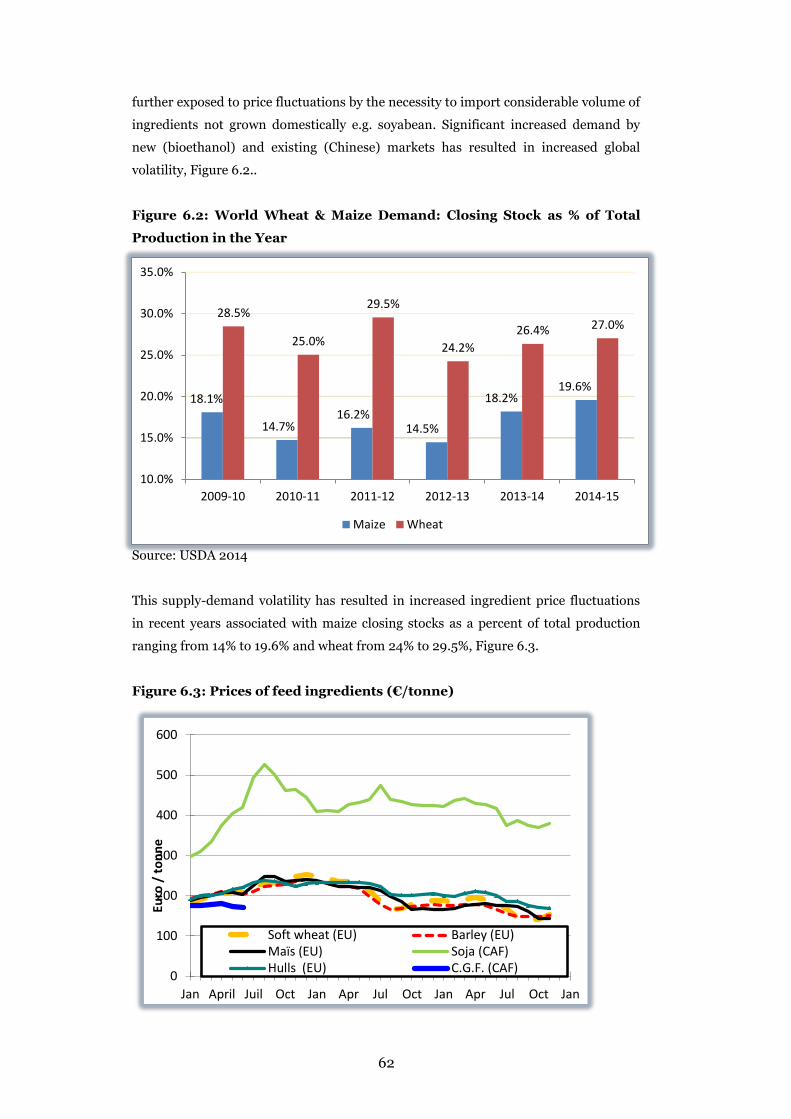
62
18.1%
14.7% 16.2%
14.5%
18.2% 19.6%
28.5%
25.0%
29.5%
24.2% 26.4% 27.0%
10.0%
15.0%
20.0%
25.0%
30.0%
35.0%
2009-10 2010-11 2011-12 2012-13 2013-14 2014-15
Maize Wheat
further exposed to price fluctuations by the necessity to import considerable volume of
ingredients not grown domestically e.g. soyabean. Significant increased demand by
new (bioethanol) and existing (Chinese) markets has resulted in increased global
volatility, Figure 6.2..
Figure 6.2: World Wheat & Maize Demand: Closing Stock as % of Total
Production in the Year
Source: USDA 2014
This supply-demand volatility has resulted in increased ingredient price fluctuations
in recent years associated with maize closing stocks as a percent of total production
ranging from 14% to 19.6% and wheat from 24% to 29.5%, Figure 6.3.
Figure 6.3: Prices of feed ingredients (€/tonne)
0
100
200
300
400
500
600
Jan April Juil Oct Jan Apr Jul Oct Jan Apr Jul Oct Jan
Euro
/ to
nne
Soft wheat (EU) Barley (EU)Maïs (EU) Soja (CAF)Hulls (EU) C.G.F. (CAF)

63
Source: DG AGRI 2014
These feed ingredient price variations has translated into the Irish compound pig feed
price ranging from a low €208 / tonne in 2005 to a high of €356 in 2013, an increase
of 71%.
Table 6.1: Irish Compound Pig Feed Price (€/tonne)
2004 2005 2006 2007 2008 2009 2010 2011 2012 2013
226 208 214 254 293 252 247 305 332 356
Source: Teagasc 2014a
When the compound feed cost increase is translated into a pigmeat ‘Cost per kg
deadweight’, using the average Teagasc ePM National Herd Performance (Teagasc,
2014b) for each respective year, the variation is reduced to 61%. This is due to the
effect of increased production efficiencies and output defraying some of the increased
feed cost per tonne.
Table 6.2: Feed Cost (cent / kg deadweight)
2004 2005 2006 2007 2008 2009 2010 2011 2012 2013
86 80 84 97 113 94 93 112.3 123 132
Source: Teagasc 2014a
Non-Feed Costs
The non –feed costs excluding financials have been relatively steady over the last
number of years reflecting the emphasis on cost control by farmers due to the recent
tight profit margins.
Table 6.3: Common Cost (cent/kg dwt)
2004 2005 2006 2007 2008 2009 2010 2011 2012 2013
32.8 38.4 36.8 37.8 37 33.2 34.5 33.9 29.8 34.6
Source: Teagasc 2014b
Financial Costs
The pig industry is a high capital intensive industry which requires high on-going
capital re-investment due to the significant level of depreciation in internal building
fixtures and fittings. The advantage of the industry in comparison to some other
farming enterprises eg beef and tillage, is that it has a relatively constant incoming
revenue stream each week throughout the year.

64
The repayment ‘Cost Per Kg dead weight’ has remained relatively constant over the
last five years. This masks the actual increased repayments per herd during this period
as a result of structural changes required by welfare legislation. The variation within
the ePM Pig database is quite large reflecting some pig units with small repayments
(3-4 cent/kg dwt) as a result of a stable herd size or minimal re-investment and other
units with larger repayments (12-14 cent/kg dwt) reflecting rapid herd expansion in
recent years or poor performance due to health issues etc.
Table 6.4: Financial Repayments (Principle & Interest)
Repayments 2010 2011 2012 2013 2013
Repayments (c/kg dwt) 8.4 8 8.6 7.5 7.9
Repayments Per Sow € 153 151 162 146 160
Repayments Per Herd € 84,241 98,660 113,582 104,622 113,284
Source: Teagasc ePM
On the basis of these calculations the net repayments of the entire Irish pig farming
sector can be estimated at €23 million in 2013. The low profitability in the industry in
recent years has resulted in the true capital re-investment required by the industry
been underestimated. The investment that has taken place, primarily under grant aid,
has been in the form of new/refurbished loose sow housing to the detriment of other
housing eg weaner/finisher that now requires refurbishment. While this investment
has ensured compliance with new welfare standards it has not generated increased
productivity but has increased the debt burden of units.
Capital Investment
A significant amount of capital investment in recent years has been grant aided
primarily for new sow welfare housing under TAMS funding which has resulted in 126
applicants receiving funding since 2006. On the basis of applicants receiving the full
40% grant funding allocation this indicates that the industry has invested €27.7
million in sow housing grant aid since 2006.
Table 6.5: Capital investment funding under Welfare Housing Grant
schemes
2006 2007 2008 2009 2010 2011 2012 2013 2014*
2006-
2014
€0.47 €0.69 €2.27 €1.58 €0.68 €0.55 €0.71 €4.53 €6.40 €11.09
Source: DAFM 2014 *Jan-Sept.
6.4.2 Output Prices
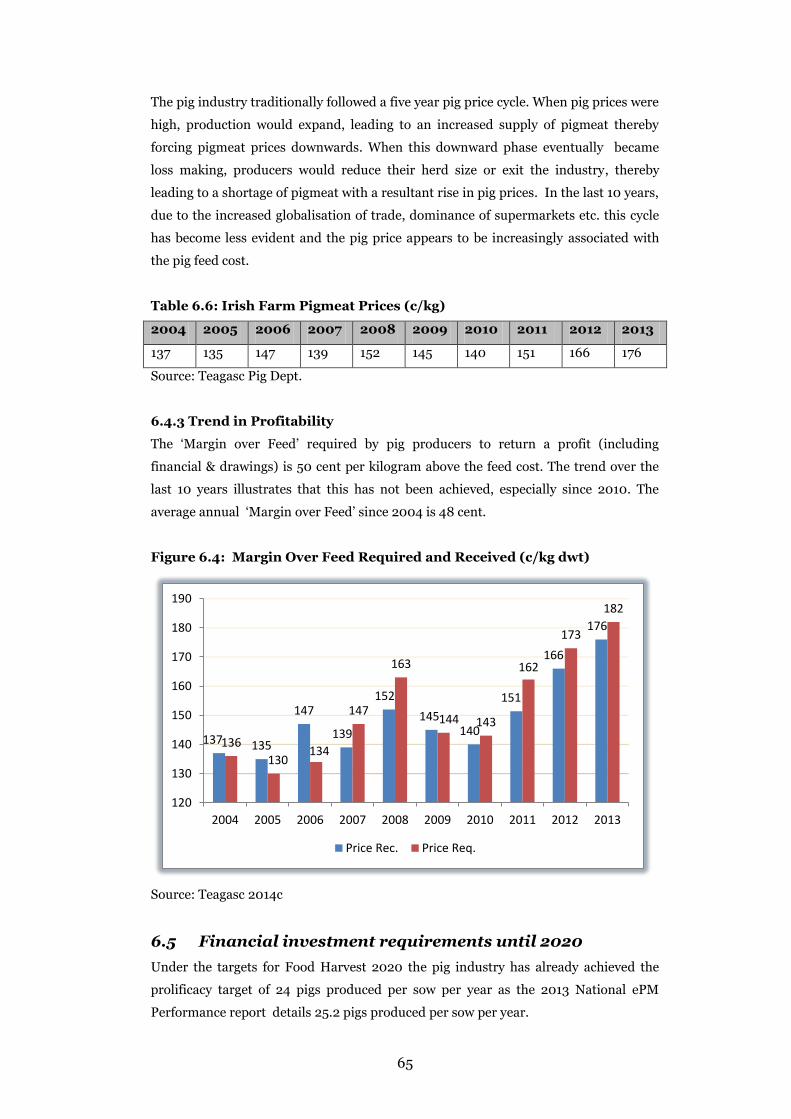
65
The pig industry traditionally followed a five year pig price cycle. When pig prices were
high, production would expand, leading to an increased supply of pigmeat thereby
forcing pigmeat prices downwards. When this downward phase eventually became
loss making, producers would reduce their herd size or exit the industry, thereby
leading to a shortage of pigmeat with a resultant rise in pig prices. In the last 10 years,
due to the increased globalisation of trade, dominance of supermarkets etc. this cycle
has become less evident and the pig price appears to be increasingly associated with
the pig feed cost.
Table 6.6: Irish Farm Pigmeat Prices (c/kg)
2004 2005 2006 2007 2008 2009 2010 2011 2012 2013
137 135 147 139 152 145 140 151 166 176
Source: Teagasc Pig Dept.
6.4.3 Trend in Profitability
The ‘Margin over Feed’ required by pig producers to return a profit (including
financial & drawings) is 50 cent per kilogram above the feed cost. The trend over the
last 10 years illustrates that this has not been achieved, especially since 2010. The
average annual ‘Margin over Feed’ since 2004 is 48 cent.
Figure 6.4: Margin Over Feed Required and Received (c/kg dwt)
Source: Teagasc 2014c
6.5 Financial investment requirements until 2020 Under the targets for Food Harvest 2020 the pig industry has already achieved the
prolificacy target of 24 pigs produced per sow per year as the 2013 National ePM
Performance report details 25.2 pigs produced per sow per year.
137 135
147
139
152 145
140
151
166
176
136 130
134
147
163
144 143
162
173
182
120
130
140
150
160
170
180
190
2004 2005 2006 2007 2008 2009 2010 2011 2012 2013
Price Rec. Price Req.
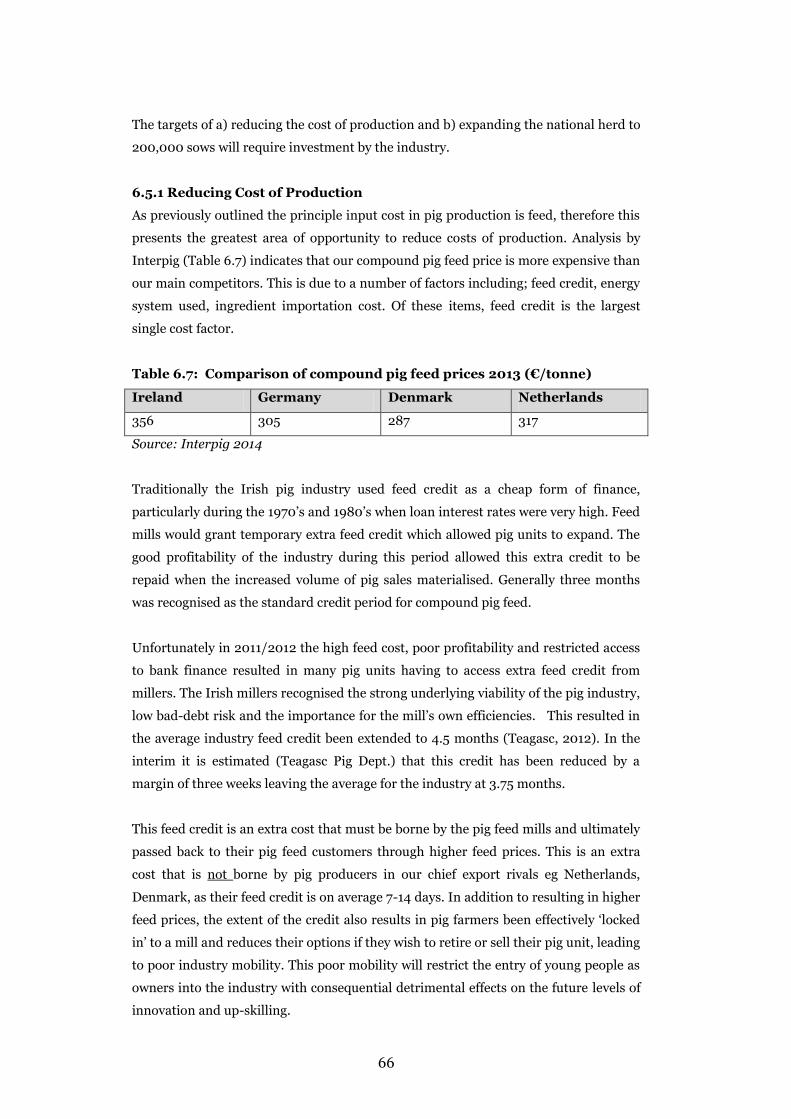
66
The targets of a) reducing the cost of production and b) expanding the national herd to
200,000 sows will require investment by the industry.
6.5.1 Reducing Cost of Production
As previously outlined the principle input cost in pig production is feed, therefore this
presents the greatest area of opportunity to reduce costs of production. Analysis by
Interpig (Table 6.7) indicates that our compound pig feed price is more expensive than
our main competitors. This is due to a number of factors including; feed credit, energy
system used, ingredient importation cost. Of these items, feed credit is the largest
single cost factor.
Table 6.7: Comparison of compound pig feed prices 2013 (€/tonne)
Ireland Germany Denmark Netherlands
356 305 287 317
Source: Interpig 2014
Traditionally the Irish pig industry used feed credit as a cheap form of finance,
particularly during the 1970’s and 1980’s when loan interest rates were very high. Feed
mills would grant temporary extra feed credit which allowed pig units to expand. The
good profitability of the industry during this period allowed this extra credit to be
repaid when the increased volume of pig sales materialised. Generally three months
was recognised as the standard credit period for compound pig feed.
Unfortunately in 2011/2012 the high feed cost, poor profitability and restricted access
to bank finance resulted in many pig units having to access extra feed credit from
millers. The Irish millers recognised the strong underlying viability of the pig industry,
low bad-debt risk and the importance for the mill’s own efficiencies. This resulted in
the average industry feed credit been extended to 4.5 months (Teagasc, 2012). In the
interim it is estimated (Teagasc Pig Dept.) that this credit has been reduced by a
margin of three weeks leaving the average for the industry at 3.75 months.
This feed credit is an extra cost that must be borne by the pig feed mills and ultimately
passed back to their pig feed customers through higher feed prices. This is an extra
cost that is not borne by pig producers in our chief export rivals eg Netherlands,
Denmark, as their feed credit is on average 7-14 days. In addition to resulting in higher
feed prices, the extent of the credit also results in pig farmers been effectively ‘locked
in’ to a mill and reduces their options if they wish to retire or sell their pig unit, leading
to poor industry mobility. This poor mobility will restrict the entry of young people as
owners into the industry with consequential detrimental effects on the future levels of
innovation and up-skilling.

67
6.5.1.1 Feed Credit Elimination
Dialogue at pig producer discussion groups has highlighted the reduction in feed
credit as the most pressing financial investment required by the Irish pig sector in the
short term. A previous study (Teagasc, 2011) highlighted how bank finance utilised to
reduce feed credit terms could result in the process being self-financing through lower
compound feed prices, Table 6.8 and 6.9.
The current cost of merchant credit for 3.75 months at an annual charge of 18%
equates to an extra feed cost per kg deadweight of six cent, which places the Irish pig
industry at a serious international competitive disadvantage. An elimination of this
debt using a five year term loan at 5.5 % interest combined with a €5 per tonne
compound feed price reduction would ensure that this process was a) cost neutral for
pig producers and b) reduce the risk burden for feed mills. If the pig sector does not
tackle the feed credit reduction in an industry structured format then the time frame
required for this debt elimination will be much longer. This will place continued
financial pressure on producers, millers and a longer term loss of our international
competitive position.
The net cost of the introduction of this term loan is based on the following
assumptions in Table 6.8.
Table 6.8: Finance Required For Feed Credit Elimination- Assumptions
Variable Assumption
National Average herd size (sows) 550
Average Number Pigs Produced / Sow (head) 25
Carcass Weight(kg) 79.8
Kill Out % 0.76
Live weight (kg) 105
Monthly Feed Usage (tonnes) 320.8
Total Annual Feed Usage (tonnes) 3,850
Annual Feed Usage Per Sow (tonnes) 1.37
Weaner - Sale FCE 2.55
Composite feed price/ tonne (€) 320
Monthly Finisher sales (head) 1146
Cost of Annual Feed (€) 102,656
Merchant Credit Annual Interest Rate % 18

68
Table 6
.9: F
inan
ce for Feed
Cred
it Elim
inatio
n
Calcu
lation:
Months
Feed Credit
Annual
merchant
credit at 18%
Annual R
epayments R
equired to clear feed
credit at 5.5% over 5 year s
Difference
per
year
Feed price reduction required to
cover differential
Merchant
credit
Cent Per K
g dwt
(A)
(B)
(B-A
)
C
1 €
102,656 €
18,478 €
23,508 €
5,030 €
1.31 1.6
2 €
205,312 €
36,956 €
47,016 €
10,060
€2.61
3.3
3 €
307,968 €
55,434 €
70,524 €
15,090
€3.92
4.9
4 €
410,624 €
73,912 €
94,033 €
20,121 €
5.23 6.6
5 €
513,280 €
92,390
€117,541
€25,151
€6.53
8.2
6 €
615,936 €
110,868 €
141,049 €
30,181 €
7.84 9.82
Estim
ate of fun
din
g need
ed for sch
eme
Sow H
erd Size
Total Pigs
Produced
Annual Total feed
tonnage
One
month
Tonnage
One
M
onth feed
credit
Ave.
3.75 m
th feed
credit
National H
erd 144,000
3,600,000 1,008,000
84,000 €
26,880,000
-
Hom
e compounders
43,200 1,080,000
302,400 25,200
€8,064,000
-
Com
pound Buyers
100,800 2,520,000
705,600 58,800
€18,816,000
€70,560,000
At a 50
% u
ptake of sch
eme an
d 3.75 m
onth
s credit red
uction
the fu
nd
ing requ
ired is
€35,28
0,0
00
A
t a 75% u
ptake of sch
eme an
d 3.75 m
onth
s credit red
uction
the fu
nd
ing requ
ired is
€52,9
20,0
00
The calculation illustrates the average feed credit owed by pig producers purchasing com
pound feed – hom
e compounders purchasing ingredients are
excluded as these have 14 days feed credit
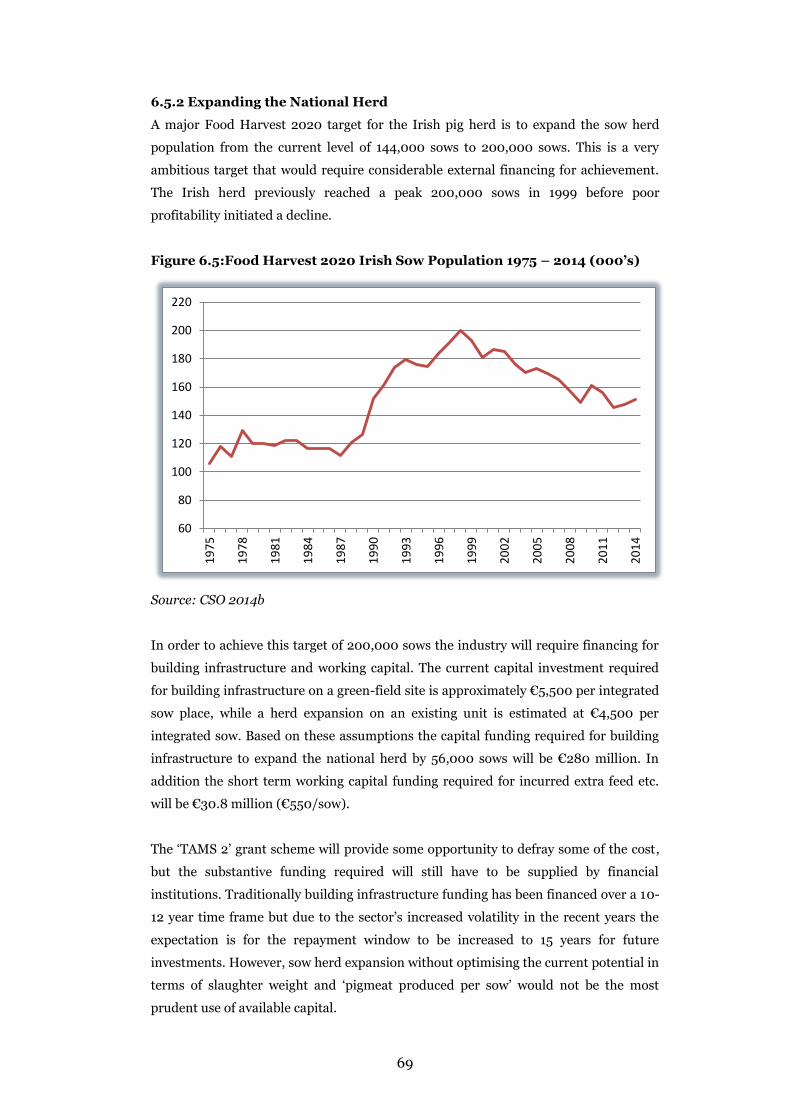
69
6.5.2 Expanding the National Herd
A major Food Harvest 2020 target for the Irish pig herd is to expand the sow herd
population from the current level of 144,000 sows to 200,000 sows. This is a very
ambitious target that would require considerable external financing for achievement.
The Irish herd previously reached a peak 200,000 sows in 1999 before poor
profitability initiated a decline.
Figure 6.5:Food Harvest 2020 Irish Sow Population 1975 – 2014 (000’s)
Source: CSO 2014b
In order to achieve this target of 200,000 sows the industry will require financing for
building infrastructure and working capital. The current capital investment required
for building infrastructure on a green-field site is approximately €5,500 per integrated
sow place, while a herd expansion on an existing unit is estimated at €4,500 per
integrated sow. Based on these assumptions the capital funding required for building
infrastructure to expand the national herd by 56,000 sows will be €280 million. In
addition the short term working capital funding required for incurred extra feed etc.
will be €30.8 million (€550/sow).
The ‘TAMS 2’ grant scheme will provide some opportunity to defray some of the cost,
but the substantive funding required will still have to be supplied by financial
institutions. Traditionally building infrastructure funding has been financed over a 10-
12 year time frame but due to the sector’s increased volatility in the recent years the
expectation is for the repayment window to be increased to 15 years for future
investments. However, sow herd expansion without optimising the current potential in
terms of slaughter weight and ‘pigmeat produced per sow’ would not be the most
prudent use of available capital.
60
80
100
120
140
160
180
200
220
1975
1978
1981
1984
1987
1990
1993
1996
1999
2002
2005
2008
2011
2014
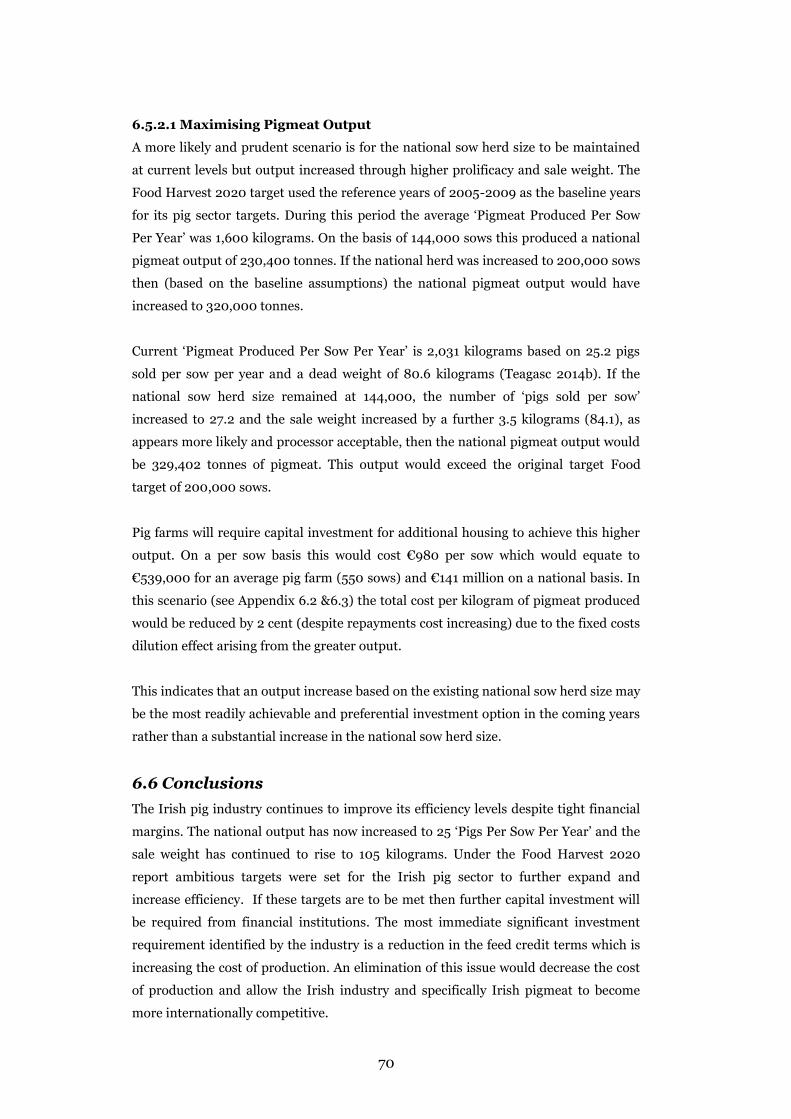
70
6.5.2.1 Maximising Pigmeat Output
A more likely and prudent scenario is for the national sow herd size to be maintained
at current levels but output increased through higher prolificacy and sale weight. The
Food Harvest 2020 target used the reference years of 2005-2009 as the baseline years
for its pig sector targets. During this period the average ‘Pigmeat Produced Per Sow
Per Year’ was 1,600 kilograms. On the basis of 144,000 sows this produced a national
pigmeat output of 230,400 tonnes. If the national herd was increased to 200,000 sows
then (based on the baseline assumptions) the national pigmeat output would have
increased to 320,000 tonnes.
Current ‘Pigmeat Produced Per Sow Per Year’ is 2,031 kilograms based on 25.2 pigs
sold per sow per year and a dead weight of 80.6 kilograms (Teagasc 2014b). If the
national sow herd size remained at 144,000, the number of ‘pigs sold per sow’
increased to 27.2 and the sale weight increased by a further 3.5 kilograms (84.1), as
appears more likely and processor acceptable, then the national pigmeat output would
be 329,402 tonnes of pigmeat. This output would exceed the original target Food
target of 200,000 sows.
Pig farms will require capital investment for additional housing to achieve this higher
output. On a per sow basis this would cost €980 per sow which would equate to
€539,000 for an average pig farm (550 sows) and €141 million on a national basis. In
this scenario (see Appendix 6.2 &6.3) the total cost per kilogram of pigmeat produced
would be reduced by 2 cent (despite repayments cost increasing) due to the fixed costs
dilution effect arising from the greater output.
This indicates that an output increase based on the existing national sow herd size may
be the most readily achievable and preferential investment option in the coming years
rather than a substantial increase in the national sow herd size.
6.6 Conclusions The Irish pig industry continues to improve its efficiency levels despite tight financial
margins. The national output has now increased to 25 ‘Pigs Per Sow Per Year’ and the
sale weight has continued to rise to 105 kilograms. Under the Food Harvest 2020
report ambitious targets were set for the Irish pig sector to further expand and
increase efficiency. If these targets are to be met then further capital investment will
be required from financial institutions. The most immediate significant investment
requirement identified by the industry is a reduction in the feed credit terms which is
increasing the cost of production. An elimination of this issue would decrease the cost
of production and allow the Irish industry and specifically Irish pigmeat to become
more internationally competitive.
71
An expansion of the Irish sow herd size to 200,000 sows was another key target of
‘Harvest 2020’. The additional 56,000 sows required to meet this target would require
an investment of €280 million at current prices. A more likely and prudent scenario
is for pig farms to maximise the output potential of their existing herd through an
increase in pigs produced (27.2) and higher sale weights to 110 kilograms. The cost of
this extra investment would equate to €539,000 per average pig unit but would lower
the ‘Cost of Production Per Kilogram’ through a dilution effect of fixed costs. In
addition the national pigmeat output generated from this development would exceed
the original forecasted Food Harvest 2020 output.
The future of Irish pig production is bright but the sector must continue to increase its
level of efficiency and output, thereby improving the competitiveness of Irish pigmeat
in the global market.
72
Chapter 7 Scenario Analysis
7.1 Introduction Earlier chapters in this report have shown that over the short to medium term that the
majority of new net investment in Irish agriculture is likely to occur on Irish dairy
farms. Since 1984 the presence of the milk quota has limited the growth of Irish milk
output. From April 2015, with the ending of the EU milk quota regime, Irish farmers
will be able to produce milk on the basis of the economic signals they receive from the
market place. Where farmers expect that additional production will be profitable they
will be free, in the post-quota era, to expand their volume of production in line with
their expectations with regard to future output prices, input costs and margins.
On many farms the expansion of milk production will require additional investment in
animals, buildings, milking parlours and storage facilities, farm infrastructure, and
agricultural land. The magnitude of the investment needs will vary from farm to farm
reflecting the level of existing facilities and resources and the planned level of
production expansion. In planning investment, Irish dairy farmers face uncertainty
with regard to the future level of input and output prices and consequently with
respect to margin per litre of milk produced. The experience of the last 10 years, with
both historically high (2013) and historically low levels of profit (2009), has taught the
Irish dairy industry that volatility in prices and incomes will be a feature of the new
dairy industry that Irish farmers will need to have the capacity to manage and
withstand.
No one can predict with perfect foresight when price and income shocks will occur,
how severe such shocks will be, or how long these shocks will persist. To assess the
vulnerability of Irish dairy farm incomes to price and income shocks in this chapter we
use the FAPRI-Ireland aggregate sector and farm level models to examine three
scenarios that are based on contrasting visions of how international demand for dairy
products could evolve over the near to medium term.
x Under the first scenario international demand for dairy commodities grows
steadily and underpins relatively stable Irish milk prices over the period
2015 to 2020.
x Under the second scenario analysed, stronger growth in the international
economy leads to strong growth in the demand for dairy commodities. Strong
growth in the global demand for dairy commodities leads to an increase in
the milk prices received by Irish farmers (effectively a positive output
price shock).

73
x Under the third scenario analysed weak growth in the global economy leads to
weak growth in the demand for dairy commodities from the global dairy
market place. This weaker growth in demand is reflected in low dairy prices
over the period 2015 to 2020.
The FAPRI-Ireland aggregate sector model is used to analyse the impact of these three
contrasting output price paths on the aggregate supply of milk by the Irish dairy
sector. The output and input price projections associated with the three contrasting
international dairy demand scenarios are used by the FAPRI-Ireland farm level
models to analyse the impact of the positive and negative output price shocks on farm
level incomes and repayment capacity from milk production.
The volatility in dairy output prices, input prices and incomes over the last 10 years
has occurred within a market environment where supply within the EU has been
controlled by the milk quota. With the ending of the milk quota regime it is probable
that volatility that has characterised EU dairy markets will persist and that the
influence of international dairy market developments on Irish and EU dairy prices will
persist and in all likelihood may increase. Already we have a situation where
production from some of the main milk exporting regions (Oceania and the USA) is
subject to considerable annual variability (due to market or production shocks).
Heretofore the dairy export capacity of the EU has been comparatively stable, given
that milk production continued to be bound by milk quotas in the more competitive
EU member states. The presence of the EU milk quota therefore limited the EU dairy
market’s supply response to variations in global dairy market conditions. With the
removal of the EU milk quota that stabilising influence will come to an end. This
means that EU milk production will potentially be subject to greater inter-annual
variability, contributing to the overall volatility in global dairy export volumes and
associated world dairy prices.
The three scenarios set out in this chapter are not predictive in the sense of forecasting
when an output price shock will occur or how severe it will be or how long it will
persist. Instead the purpose of the three scenarios examined is to examine the
sensitivity of Irish milk production and dairy farm incomes to output price volatility
and to use this information to assess the risks faced by those Irish dairy farmers who
will over the next 5 years invest resources in expanding their milk production at the
farm level.
In the next section we provide the detail on the projected paths of milk prices and milk
production in Ireland under the Steady Growth, Strong Growth, and Weak Growth in
international dairy demand generated using the FAPRI-Ireland aggregate sector
model. In the subsequent sections the impact of these projected price and output

74
developments on farm level profitability are assessed using the FAPRI-Ireland farm
level model.
7.2 FAPRI-Ireland Aggregate Sector Scenario Analysis As outlined in the previous section, three price paths for milk prices are examined for
the period to 2020. As is always the case with economic projections we can be more
certain about short term developments than about medium and long term
developments. All three milk price scenarios reflect uniform short term developments,
with milk prices in 2015 sharply below the prices levels of 2013 or 2014. The basis for
this short term outlook has already been outlined in Chapter 1.
Beyond 2015, milk prices recover from the low of 2015, but the milk price path for the
three scenarios differs in subsequent years so that by 2020 the milk price ranges from
about 30 cent per litre in the low scenario to over 36 cent per litre in the high scenario.
The low scenario would see projected milk prices below the medium term historical
average. The Steady scenario would see projected milk prices similar to the medium
term historical average and the strong Scenarios would see prices surpass the medium
term historical average.
Figure 7.1: Historical Irish Milk Prices and three projected milk price
scenarios to 2020
Source: FAPRI Ireland Model
Recent experience has demonstrated that production costs such as feed, fertiliser and
energy prices can vary considerably. However, for simplicity in all three scenarios
developments in production costs are uniform. Little change on overall production
0
5
10
15
20
25
30
35
40
45
2009 2010 2011 2012 2013 2014 2015 2016 2017 2018 2019 2020
cent
per
litr
e
History Weak Steady High
75
costs in projected in the period to 2020. Therefore the three scenarios have significant
implications of the projected margin achieved from milk production for the average
milk producer.
Under the Weak and Steady Scenarios, the FH2020 production is not achieved,
whereas under the Strong Scenario the Fh2020 expansion target is achieved. In the
next section the implications of the three scenarios for farm level expansion and the
associated investment requirement are explored.
7.3 FAPRI-Ireland Farm Sector Scenario Analysis The impact of the three milk price scenarios on milk production levels, farm
investment and farm income in Ireland is examined using the farm model outlined in
Chapter 5. Table 7.x presents data on milk production levels and investment under the
three scenarios. The total milk supplied by existing dairy farms is higher in the Steady
Scenario in comparison with the Weak Scenario as the milk price in the Steady
Scenario is higher. Likewise in the Strong Scenario the milk price is higher than in the
Steady Scenario and consequently the Strong Scenario results in a higher level of milk
production. Therefore the number of new entrants required to meet the Food Harvest
target is highest in the Weak Scenario.
Under the Weak Scenario, it is estimated that the pre-existing population of dairy
farms could increase milk production by 31 percent relative to the 2007-2009 base
against which FH 2020 expansion in measured. It is estimated that an investment of
just over €1 billion at the farm level would be required to achieve this level of milk
expansion. However, under this scenario, up to 1,300 new entrants would also be
required to achieve the Food Harvest expansion target, bringing the estimated total
farm investment requirement to €1.67 billion.
Under the Steady Scenario the higher milk price means that more of the additional
milk is supplied from pre-existing farms (43 percent) at a lower investment
requirement and hence less is supplied from the more capital intensive business start-
ups in order to reach the 50 percent expansion target. Existing farms require an
investment of just over €1.2 billion with a further €232 million in investment required
by new entrants to reach the 50% target bringing total investment to €1.47 billion.
It is expected that at a milk price scenario of 36 cent per litre in 2020, the Strong
Scenario, the Food Harvest targets would be exceeded by the existing farms alone and
total milk production would increase by 65 percent before any new entrants are
considered. The total investment associated with this level of expansion is almost €2
billion. However, it is important to note that this investment figure is not directly

76
comparable with the investment required in the other two scenarios since it results in
a level of production beyond the FH2020 target.
Table 7.1: Milk production and investment under the three price scenarios
Weak
Scenario
Steady
Scenario
Strong
Scenario
Pre-Existing Dairy Farms
Production increase on existing farms in
2020 relative to 2007-09 level (%) 31 43 65
Investment Required ( €million) 1,066 1,241 1,942
Food Harvest 2020 shortfall (%) 19 7 -
Food Harvest excess (%) - - 15
New Entrants
Number Required 1,346 511 n/a
Investment Required (€million) 612 232 n/a
Increase in National Milk
Production in 2020 relative to the
2007-09 base (%)
50 50 65
Total Investment (pre-existing +
new entrants) 1,678 1,474 1,942
Figure 7.2 presents the number of farms expanding milk production under the three
milk price scenarios. As expected the number of farmers exiting milk production
declines in the higher milk price scenarios. Furthermore, the number of farms that can
expand profitably increases in scenarios where the milk price is projected to be higher.
About 5,500 farms could expand milk production by 50 percent or more, relative to
the 2013 level, under the Weak scenario. This number increases to almost 7,500 under
the Strong scenario.
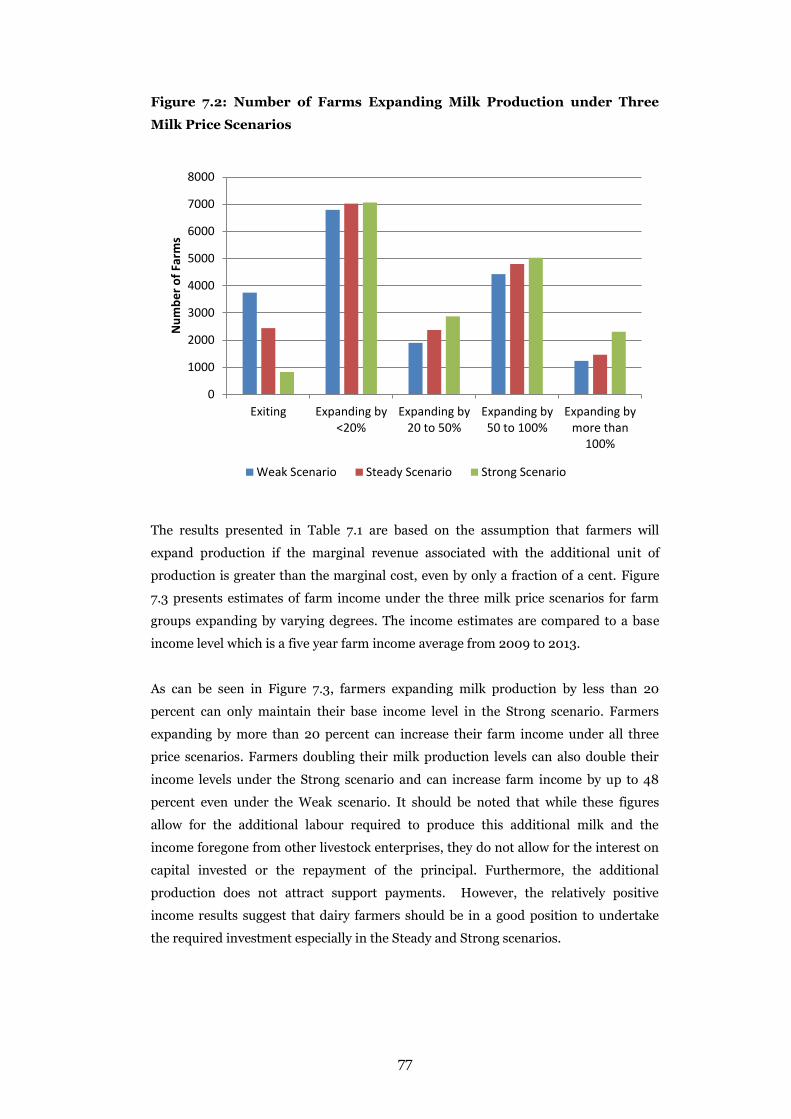
77
Figure 7.2: Number of Farms Expanding Milk Production under Three
Milk Price Scenarios
The results presented in Table 7.1 are based on the assumption that farmers will
expand production if the marginal revenue associated with the additional unit of
production is greater than the marginal cost, even by only a fraction of a cent. Figure
7.3 presents estimates of farm income under the three milk price scenarios for farm
groups expanding by varying degrees. The income estimates are compared to a base
income level which is a five year farm income average from 2009 to 2013.
As can be seen in Figure 7.3, farmers expanding milk production by less than 20
percent can only maintain their base income level in the Strong scenario. Farmers
expanding by more than 20 percent can increase their farm income under all three
price scenarios. Farmers doubling their milk production levels can also double their
income levels under the Strong scenario and can increase farm income by up to 48
percent even under the Weak scenario. It should be noted that while these figures
allow for the additional labour required to produce this additional milk and the
income foregone from other livestock enterprises, they do not allow for the interest on
capital invested or the repayment of the principal. Furthermore, the additional
production does not attract support payments. However, the relatively positive
income results suggest that dairy farmers should be in a good position to undertake
the required investment especially in the Steady and Strong scenarios.
0
1000
2000
3000
4000
5000
6000
7000
8000
Exiting Expanding by<20%
Expanding by20 to 50%
Expanding by50 to 100%
Expanding bymore than
100%
Num
ber o
f Far
ms
Weak Scenario Steady Scenario Strong Scenario
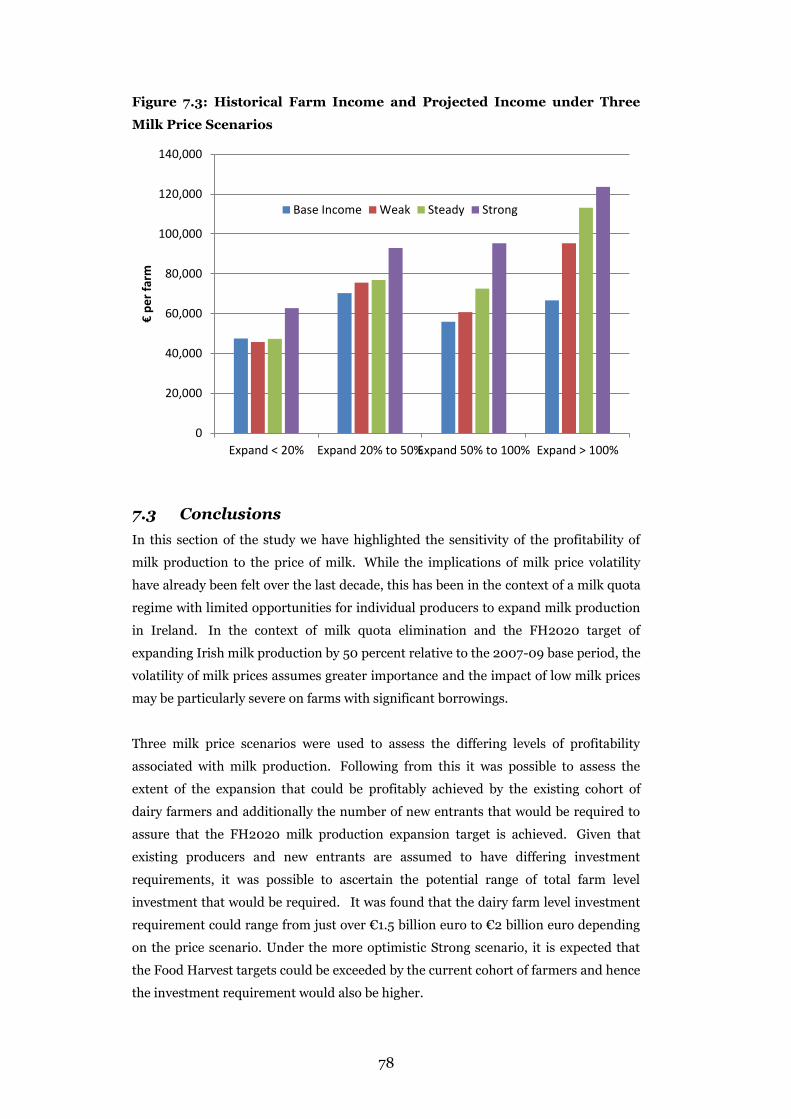
78
Figure 7.3: Historical Farm Income and Projected Income under Three
Milk Price Scenarios
7.3 Conclusions In this section of the study we have highlighted the sensitivity of the profitability of
milk production to the price of milk. While the implications of milk price volatility
have already been felt over the last decade, this has been in the context of a milk quota
regime with limited opportunities for individual producers to expand milk production
in Ireland. In the context of milk quota elimination and the FH2020 target of
expanding Irish milk production by 50 percent relative to the 2007-09 base period, the
volatility of milk prices assumes greater importance and the impact of low milk prices
may be particularly severe on farms with significant borrowings.
Three milk price scenarios were used to assess the differing levels of profitability
associated with milk production. Following from this it was possible to assess the
extent of the expansion that could be profitably achieved by the existing cohort of
dairy farmers and additionally the number of new entrants that would be required to
assure that the FH2020 milk production expansion target is achieved. Given that
existing producers and new entrants are assumed to have differing investment
requirements, it was possible to ascertain the potential range of total farm level
investment that would be required. It was found that the dairy farm level investment
requirement could range from just over €1.5 billion euro to €2 billion euro depending
on the price scenario. Under the more optimistic Strong scenario, it is expected that
the Food Harvest targets could be exceeded by the current cohort of farmers and hence
the investment requirement would also be higher.
0
20,000
40,000
60,000
80,000
100,000
120,000
140,000
Expand < 20% Expand 20% to 50%Expand 50% to 100% Expand > 100%
€ pe
r far
m
Base Income Weak Steady Strong
79
These findings illustrates the importance of market prospects in framing the extent to
which Irish milk production might expand over the next 5 years and the associated
investment that might be sought to bring this expansion about. Given that it is
impossible to be certain about how international dairy markets will develop, it is
reasonable to adopt a pragmatic approach in assessing the likely level of investment
requirement that will emerge. In this context the investment figure of just under €1.5
billion estimated in the Steady scenario represents a reasonable estimate for planning
purposes. It is important to note that this is a total investment figure and does not
necessarily equate to credit demand. For example, over €400 million of this
investment is for the acquisition of cows and it is probable that in many cases this
would be funded out of the farmers’ own resources. Furthermore, farmer intentions
survey data presented in Chapter 5 suggest that 30 percent of farmers plan to fund
investment out of own resources. In conclusion while the total investment figure is
close to €1.5 billion the demand for bank credit is likely to be lower.
80
Chapter 8
Caveats and Conclusions
8.1 Summary Remarks In terms of the financial situation and investment requirements of Irish agriculture,
2015 is likely to be the dawn of a new era for dairy farmers in particular. It is evident
from numerous international literature sources that farmers’ access to scarce farm
assets, and access to attractive terms of financing for the preferred strategies plays a
major role in agricultural development. Hence, it is interesting to note that most
analysis in recent research and agricultural policymaking, concerning growth potential
based on the recommendations from the Food Harvest 2020 document, has failed to
document the ability of farm units to balance net income flows and investment
requirements. The results of this report are therefore considered very timely and will
likely provide very useful information for the industry as a whole as future plans are
being put in place.
However, in the context of projecting how investment requirements might change in
the future, there are very many issues which could each individually merit a separate
study. While it has not been possible to give these issues detailed consideration in this
report, it is important that they are kept in mind in assessing the investment
requirements of the sector. In this chapter issues which are likely to affect the sector’s
future investment requirements are explored. The chapter concludes with some
conclusions on the report’s findings.
8.2 Caveats Milk Quota Removal
Based on the findings from chapter 5 it is evident that the removal of the milk quota
will present new opportunities for expansion of the dairy sector in Ireland at farm level
and for the dairy sector in aggregate. At the farm level and at the processing level this
will present opportunities to increase scale and exploit cost efficiencies.
Studies (FAPRI, IRNA) have concluded that expansion in production is less likely to
occur elsewhere in the EU following quota elimination, so it is conceivable that milk
quota removal could improve the competitive position of the dairy sector in Ireland
relative to competitors elsewhere in the EU.
However, the removal of milk quotas does not mean that the sector in Ireland will not
face other constraints. A particular concern is the high proportion of GHG emissions
in Ireland that come from agriculture, which, dependent on political decision making,
81
could present a greater constraining influence on agriculture in Ireland than in EU MS
where agriculture’s share of emissions is smaller.
CAP Reform post 2015
While we are only now entering a new era of direct payments in 2015, the future
direction of payments, in the next mid term review and beyond, is an uncertainty.
However, if recent changes in the way in which the payments are structured continue
into the future, this could result in reductions in the total budget for the SFP and a
further move away from the historical payments system towards a flatter payments
system. This would involve a redistribution of the SFP between farms. While the SFP
is categorised as a decoupled payment it may affect producers’ attitudes to risk, their
production decisions , volatility of their farm income and investment decisions. At this
point it is not possible to draw any firm conclusions as to the impact of potential
changes to the SFP would have on the investment potential of the individual sectors in
Irish agriculture.
WTO and Bilateral Trade Agreements
Progress in the WTO negotiations has been very slow in recent years. However, this
does not mean that negotiations aimed at liberalised trade have been abandoned. Lack
of progress through the WTO mechanism has seen an increase in bilateral negotiations
concerning trade. In the content of the next 5 to ten years it is not possible to rule out
reductions in trade barrier between the EU and third countries which could open up
the EU dairy sector in particular to greater competition in its home markets.
The Irish dairy sector is highly exported focused. In some product areas this export
focus places the Irish dairy sector in the position of being a residual supplier to dairy
deficit markets. These characteristics distinguish the Irish dairy sector from some of
our competitors in the EU who are much less reliant on export markets.
Increased Irish milk production would mean that the mature Irish market for dairy
products would further decrease in importance and the export orientation of the Irish
dairy sector would further increase. In such circumstances, trade agreements could
have a negative impact on Irish dairy product markets and Irish producer milk prices,
with adverse consequences for the repayment ability of the Irish dairy sector.
Biofuels
The growing requirement to use renewable energy sources in the EU will generate an
increased demand for biofuels in this decade. This will increase competition for crops
as an energy feedstock rather than as an animal feed. The result may be a permanent
increase in feed prices and a relative increase in the prices of animal feed relative to
grass. The dairy sector in Ireland may be better placed than many competitor

82
countries to deal with such an increase in feed prices, given that the dairy system in
Ireland is mainly pasture based. The Irish dairy sector would be relatively insulated
from the impact of rising feed prices. This would have a positive impact on the
competitiveness of the Irish dairy sector relative to countries where intensive
confinement systems are the norm. Hence, this could be viewed as a positive in terms
of economics and investment requirements.
Input and Output Price Volatility
In planning investment Irish farmers face uncertainty with regard to the future level of
input and output prices and consequently with respect to margin per per hectare. The
experience of the last 10 years, with both historically high (2013) and historically low
levels of profit (2009), has taught the Irish dairy industry in particular that volatility in
prices and incomes will be a feature of the new industry that Irish farmers will have to
have the capacity to manage and withstand. Hence, income volatility and the capacity
to manage income flow considerations will be a key factor in determining investment
levels in the medium term.
8.3 Conclusions The results of this study indicate that despite the increase in liabilities recorded on
farms in nominal terms in recent years, the historically low level of debt relative to
assets and equity reaffirms the farm sector’s strong financial position (Chapter 2). As
such, the sector has remained relatively well insulated from the risks associated with
commodity production (such as adverse weather), changing macroeconomic
conditions in the world economy, as well as any fluctuations in farm asset values that
may occur due to changing demand for agricultural assets. Furthermore, Teagasc NFS
data has shown that the average level of debt on dairy and tillage farms was
significantly higher than livestock farms over the time period examined (2002-2012).
With regard to farm loan use in recent years, the majority of loans were used for
buildings, land purchase and working capital.
Given that Irish agriculture is now competing in an ever increasing global market
place the financial stability from an inter country perspective (i.e. between competing
countries) is as important as the intra country perspective (i.e. within the country).
The financial indicators described in chapter 3 indicated that on average Irish farms
have relatively low debt and high asset values relative to the EU average for all farms.
Furthermore, solvency, liquidity and financial efficiency indicators also displayed Irish
farms in a healthy position in EU terms. While previous work by Teagasc has shown
that Ireland continues to exhibit a healthy position in terms of the competitiveness of
our agricultural sector (in EU and international markets), in a market which is
increasingly exposed to market price volatility, the ability to demonstrate resilience
will be equally important in the future. Given that this research has indicated that not
83
only does Ireland enjoy a competitive advantage in cost terms within the EU, the level
of debt and financial status of Irish farms should also provide Irish farms with a
relative advantage in resilience terms given that they are not servicing high debt levels
in years of extreme market volatility.
Chapter 4 of the report set the scene for identifying the determinants of investment on
all farms with a view to isolating the characteristics of investors and determining the
types of farms most likely to invest in the years ahead. This analysis showed that Irish
farms on average had net new investments of approximately €8,000 in 2013, with
larger, younger, dairy farmers with higher family farm income and an off-farm income
earned by the spouse having a higher probability of investment.
Chapter 5 considered how dairy farmers are likely to react to milk quota removal, what
expansion in production is likely to occur and most importantly, what investment will
required at the farm level to facilitate expansion. The results indicate that total
investment required to meet FH2020 targets between 2014 and 2020 is likely to be in
the region of €1.47 billion. It is important to note however that this investment figure
is not directly akin to a demand for credit figure given that some of the investment is
likely to be funded from own resources. This fact was highlighted by the
supplementary survey from the Teagasc National Farm Survey in late 2014 when
approximately 30% of farmers said that they planned to use non loan finance to fund
investment in 2015 alone.
Chapter 6 considered the recent financial situation of pig farms in Ireland which
showed that the Irish pig industry continues to improve its efficiency levels despite
tight financial margins. Under the Food Harvest 2020 report ambitious targets were
set for the Irish pig sector to further expand and increase efficiency. If these targets
are to be met then further capital investment will be required from financial
institutions. The most immediate significant investment requirement identified by the
industry is a reduction in the merchant feed credit which currently inflates feed prices
and the cost of pig production. An expansion of the Irish sow herd size to 200,000
sows was also a key target of Food Harvest 2020. The additional sows required to
meet this target would require an investment of €280 million at current
prices. However, a more likely and prudent scenario is for pig farms to maximise the
output potential of their existing herd through an increase in the number of pigs
produced per sow and the achievement of higher sale weights. The cost of this extra
investment would equate to €539,000 for the average sized pig unit, but would lower
the cost of production per kilogram by having the effect of diluting fixed costs across a
larger output volume. In addition the national pigmeat output generated from this
development would exceed the original forecasted Food Harvest 2020 output.
84
Given that earlier chapters in the report have shown that over the short to medium
term that the majority of new net investment in Irish agriculture is likely to occur on
Irish dairy farms, chapter 7 focused on identifying milk price scenarios to illustrate the
vulnerability of Irish dairy farm incomes to price and income shocks. Three milk price
scenarios were used and it was found that the dairy farm level investment requirement
could range from just over €1.5 billion euro to €2 billion euro depending on the price
scenario. These findings illustrates the importance of market prospects in framing the
extent to which Irish milk production might expand over the next 5 years and the
associated investment that might be sought to bring this expansion about.
I was going to include one additional summary paragraph but might come back to it later.
85
References
CSO 2014a. Output, Input and Income In Agriculture. http://www.cso.ie/en/releasesandpublications/er/oiiaa/outputinputandincomeinagriculture-advanceestimate2014/ CSO 2014b. Irish Pig Population Survey. http://www.cso.ie/en/releasesandpublications/er/ps/pigsurveyjune2014/ DAFM 2010. Harvest 2020 Report. http://www.agriculture.gov.ie/media/migration/agri-foodindustry/foodharvest2020/2020FoodHarvestEng240810.pdf DAFM 2014. Capital funding awarded to the Irish Pigs Sector through DAFM Sow Welfare Grant aid 2004-2013. Personal communication. DG AGRI 2014. Presentation to the E.U. Pigmeat Commodity Group. https://circabc.europa.eu/sd/a/0594609b-c09b-42ae-89a7-57f63c621537/0%20Circa%20no%20links%202013%20Pigs.pdf Dillon, P., O Brien, B. and Shalloo, L. (2010) Irish Milk Production 2008 to 2020. Teagasc, Fermoy, Ireland. Donnellan, T., and Hanrahan. K (2014) Greenhouse Gas Emissions from Irish Agriculture: Projections to 2030. January 2014. EUROSTAT, 2013. European Pig Density. http://ec.europa.eu/eurostat/statistics-explained/index.php/Agri-environmental_indicator_-_livestock_patterns Hennessy T, Shrestha, S. Shalloo L and Wallace, M (2009). The Inefficiencies of Regionalised Trade of Milk Quota. Journal of Agricultural Economics. Vol. 60. No. 2. 334-347 Hennessy, T. and O’Brien, M. (Eds.) (2007). An Examination of the contribution of off-farm income to the viability and sustainability of farm households and the productivity of farm businesses. Teagasc Research Report. Available online at: http://www.teagasc.ie/research/reports/ruraldevelopment/5490/eopr-5490.pdf Interpig 2014. Economic Analysis of European Pig Producing Countries. http://www.farmersjournal.ie/pig-production-cost-comparisons-gerard-mccutcheon-teagasc-oak-park-166637/ Keane M. (2010) Potential Investment Costs in Milk Processing and Transport to 2020. ICMSA Keane M. (2011) Capital Investment in Dairy Farming. Cork Kiersey K., Bryan, J. (2013) Exciting Times Ahead: In AIB (2013) Outlook Dairy. Dublin Laepple, D. and Hennessy, T. (2012). The Capacity to Expand Milk Production in Ireland Following the Removal of Milk Quotas. Irish Journal of Agriculture and Food Research. Vol 51 (1), 1-11. Ryan, T., Clarke, P., and Ramsbottom, G. (2013). Infrastructure for an expanding dairy farm. Moorepark Open Day 2013. Proceedings. http://www.teagasc.ie/publications/2013/2788/Moorepark2013.pdf

86
Shalloo, L., O Loughlin, J. and Long, M (2011). The Greenfield Business Plan. Moorepark Dairy Levy Research Update, Series 15. http://www.agresearch.teagasc.ie/moorepark/Publications/pdfs/MPK%20Dairy%20Levy%20Update%20Series%2015.pdf
Teagasc (2014) Annual Review and Outlook 2015. Rural Economy Development
Programme Teagasc. Available online:
http://www.teagasc.ie/publications/2014/3414/Outlook_2015.pdf
Teagasc 2011, Financial Effects of Reducing Feed Credit. http://www.teagasc.ie/pigs/ Teagasc 2012. Teagasc National Irish Pig Unit Survey. http://www.teagasc.ie/pigs/ Teagasc, 2014a. Teagasc Monthly Pig Price Monitor. http://www.teagasc.ie/pigs/ Teagasc, 2014b. Teagasc National ePM Report. http://www.teagasc.ie/pigs/ Teagasc, 2014c. Teagasc Outlook Conference: Economic Prospects For Agriculture 2015 Thorne, F., Connolly, L., Hennessy, T., Kelly, T. and Moran, B. (2009). Investment and Debt on Irish Farms, paper presented at the Teagasc, National Rural Development Conference, October 2009, http://www.teagasc.ie/publications/2009/20091012/FionaThorne.pdf USDA 2014. World Agricultural Supply and Demand Estimates. http://www.usda.gov/oce/commodity/wasde/latest.pdf Wooldridge, J. (2012). Introductory Econometrics: A Modern Approach, 5th Ed.
Cengage Learning, US.
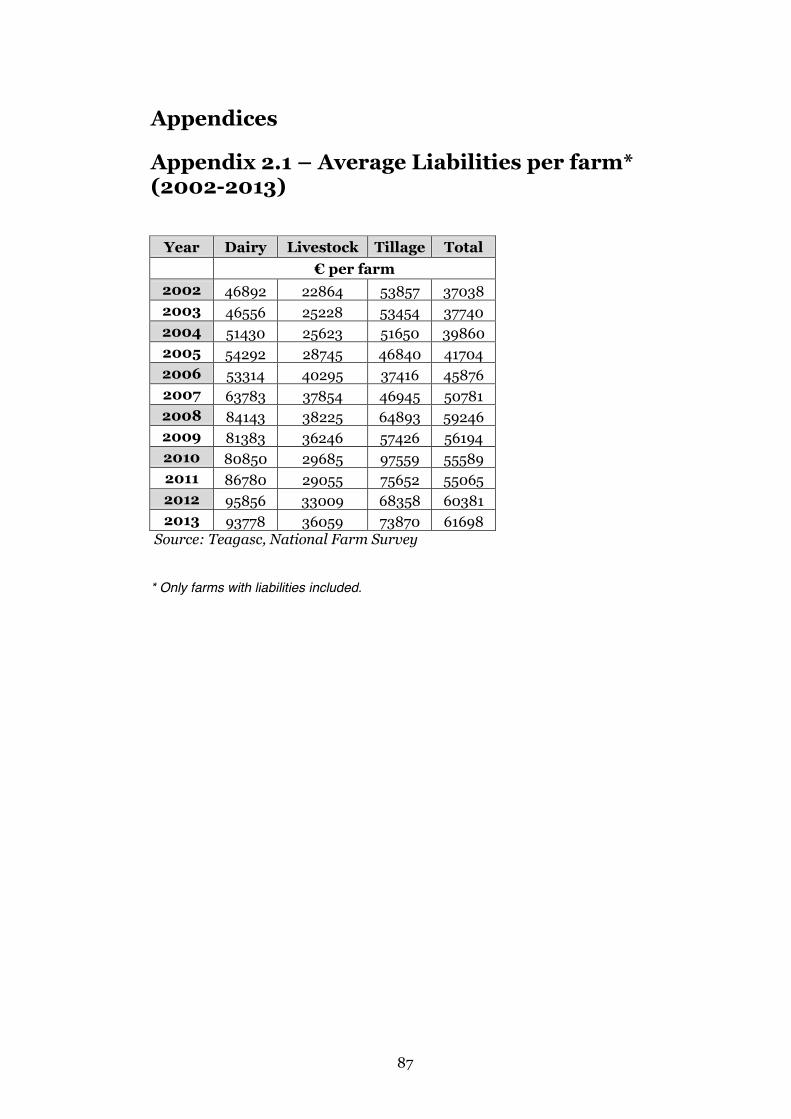
87
Appendices
Appendix 2.1 – Average Liabilities per farm* (2002-2013)
Year Dairy Livestock Tillage Total
€ per farm
2002 46892 22864 53857 37038 2003 46556 25228 53454 37740 2004 51430 25623 51650 39860 2005 54292 28745 46840 41704 2006 53314 40295 37416 45876 2007 63783 37854 46945 50781 2008 84143 38225 64893 59246 2009 81383 36246 57426 56194 2010 80850 29685 97559 55589 2011 86780 29055 75652 55065 2012 95856 33009 68358 60381 2013 93778 36059 73870 61698
Source: Teagasc, National Farm Survey
* Only farms with liabilities included.
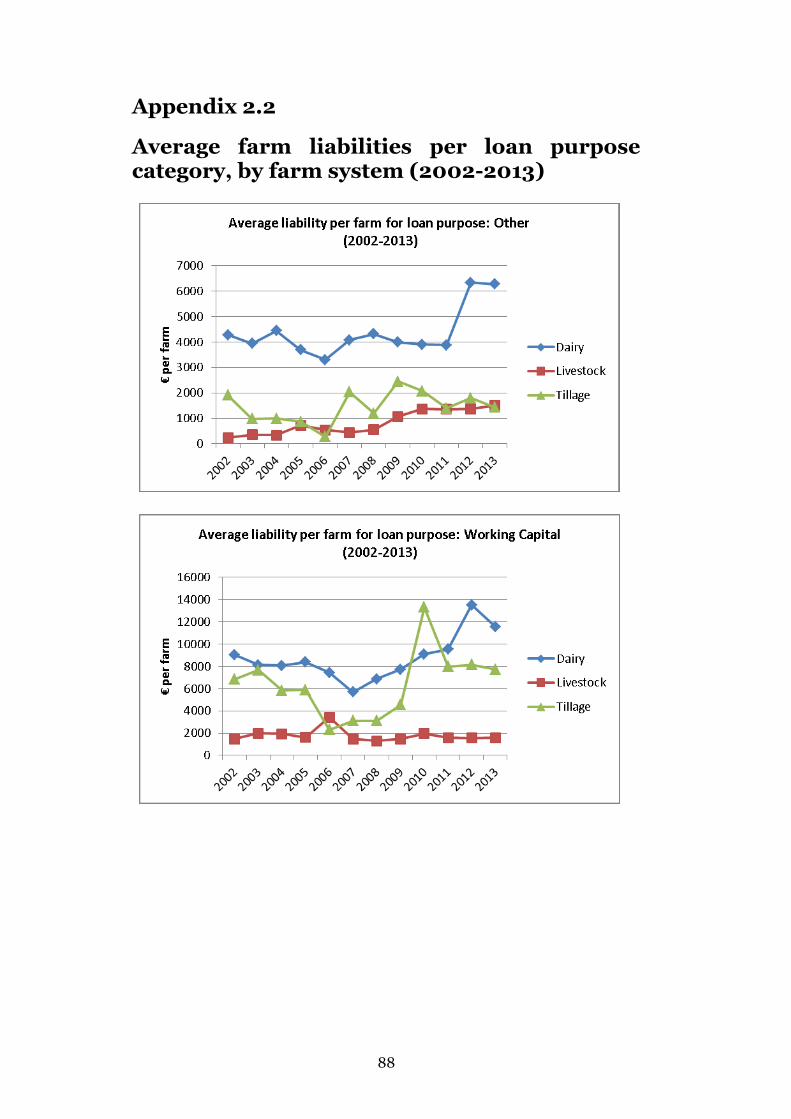
88
Appendix 2.2
Average farm liabilities per loan purpose category, by farm system (2002-2013)
0
5000
10000
15000
20000
25000
30000
€ pe
r far
m
Average liability per farm for loan purpose: Buildings (2002-2013)
Dairy
Livestock
Tillage
02000400060008000
1000012000140001600018000
€ pe
r far
m
Average liability per farm for loan purpose: Land Purchase (2002-2013)
Dairy
Livestock
Tillage
0100200300400500600700800900
€ pe
r far
m
Average liability per farm for loan purpose: Land improvements (2002-2013)
Dairy
Livestock
Tillage
0
500
1000
1500
2000
2500
3000
3500
€ pe
r far
m
Avergae liability per farm for loan purpose: Livestock (2002-2013)
Dairy
Livestock
Tillage
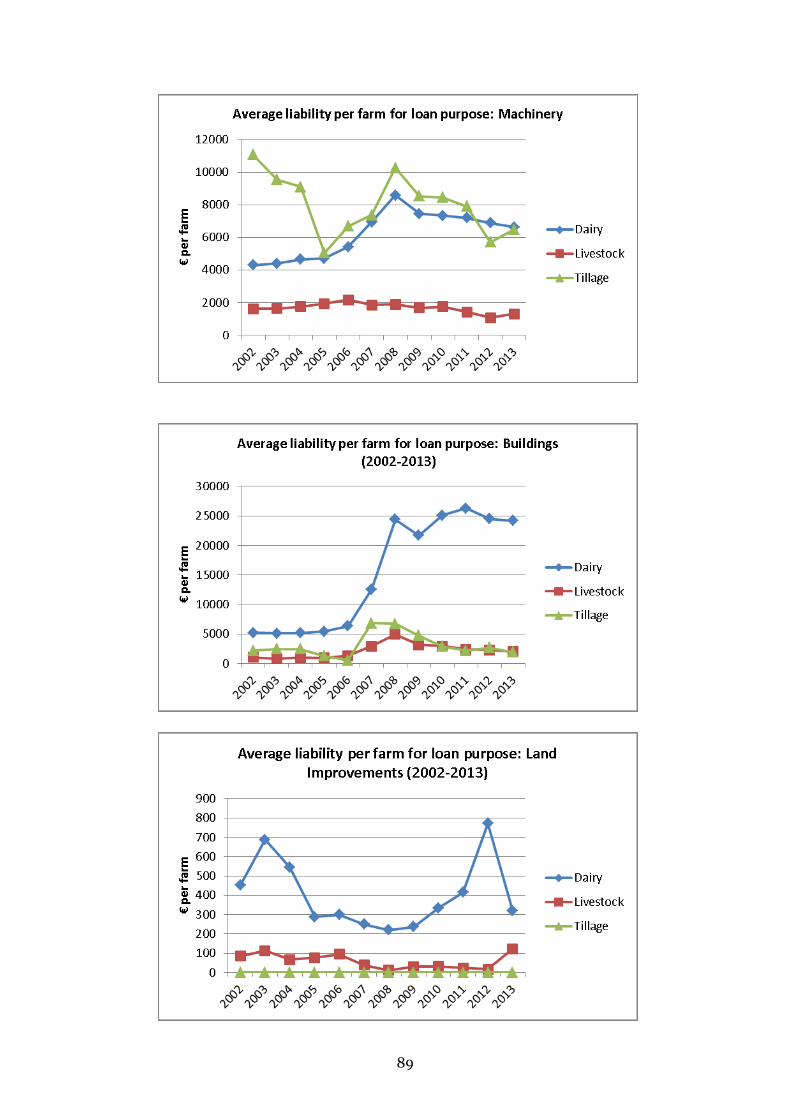
89
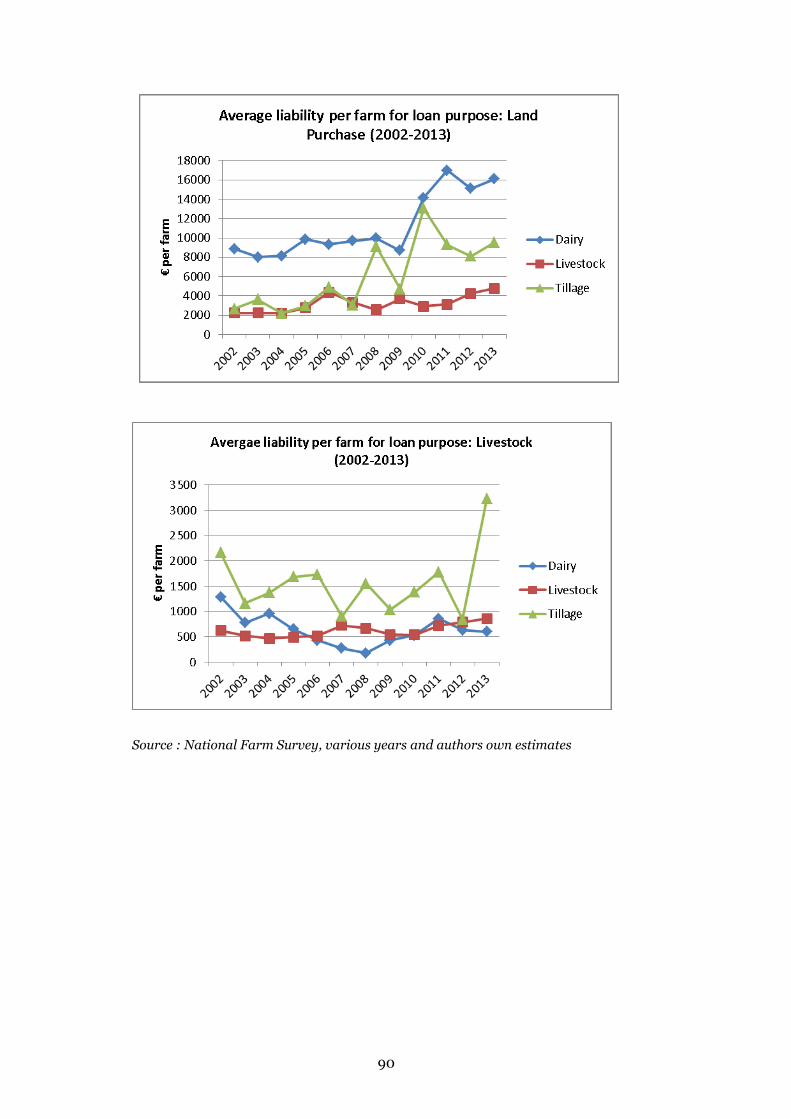
90
Source : National Farm Survey, various years and authors own estimates
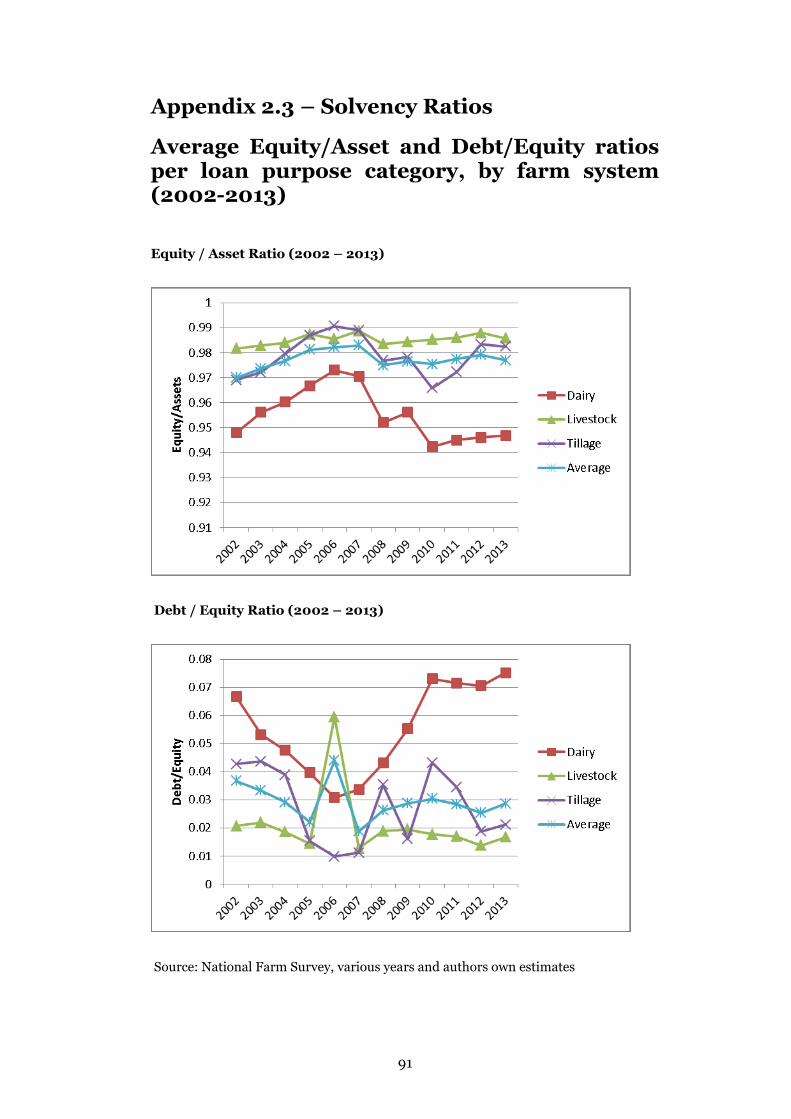
91
Appendix 2.3 – Solvency Ratios
Average Equity/Asset and Debt/Equity ratios per loan purpose category, by farm system (2002-2013)
Equity / Asset Ratio (2002 – 2013)
Debt / Equity Ratio (2002 – 2013)
Source: National Farm Survey, various years and authors own estimates

92
Ap
pen
dix 3.1 –
Asset V
alu
e by F
arm
Sy
stem a
nd
By
Mem
ber S
tate (20
12)
System
of Prod
uctio
n
Field
crops
Horticu
lture
Win
e O
ther p
erman
ent
crops
Milk
Oth
er grazing
livestock G
ranivo
res M
ixed
Average A
sses Valu
e per farm
€
2012 B
elgium
531648 626665
- 669143
626258 554491
899885 8250
92 2012
Bulgaria
161963 288544
325683 59280
38732
28889 192590
29633
2012 C
yprus 218831
- 105898
108640
- 205851
- 73202
2012 C
zech Republic
616102 243895
224711 211595
1388798 401871
1428486 2006512
2012 D
enmark
2068239 1379429
- 1367490
3754704 866801
5283379 2199727
2012 G
ermany
926609 390853
544405 614120
804791
631333 1005960
888609
2012 G
reece 110494
117401 92946
107725 -
105213 -
101319 2012
Spain 283130
305273
233272 210378
444494 275986
383764 292955
2012 E
stonia 236792
86139 -
- 477699
120548 1007741
159268 2012
France 400053
241934 594522
314051 425294
378022 469564
502915 2012
Hungary
193424 132305
253268 99558
289734 150085
154280
137100 2012
Ireland 1253372
- -
- 1271406
753372 -
1258116
2012 Italy
412473 410674
350010 236862
1013688 406744
1572644 435869
2012 Lithuania
186671 122047
- 105514
90269 93406
766203 89997
2012 Luxem
bourg -
- 835292
- 1252134
1043159 -
1238895 2012
Latvia 207750
254728
- 70664
83080
139269
1348865 82914
2012 M
alta 132168
98580
- -
1071044 148649
596537 169597

93
System
of Prod
uctio
n
Field
crops
Horticu
lture
Win
e O
ther
perm
anen
t crops
Milk
Oth
er grazing
livestock G
ranivo
res M
ixed
Average A
sses Valu
e per farm
€
2012 N
etherlands 3081010
1816155
- 1285818
2720904 1231653
1713649 2656886
2012 A
ustria 387828
- 286415
325500
468524 445765
602095 436137
2012 Poland
171331 130395
- 161608
199388 133007
274184 125273
2012 Portugal
91196 77147
155093 86244
126339 80930
222004
90000
2012 R
omania
76706 114339
93678 61671
27378 36558
113727 29120
2012
Finland 310876
615245 -
- 516751
459274 844672
615870
2012 Sw
eden 1090206
463198 -
- 1175032
521620 1641368
1402277
2012 Slovakia
653610 -
- -
1640383 544832
- 2215767
2012 Slovenia
155895 -
207305 112310
276629 198431
413254 150756
2012 U
nited Kingdom
2561185
919353 -
1521558 1711794
1207998 1278687
2086146 2012
Total 390102
347867 346187
196667 468837
302322 629675
178405
Source: European Com
mission, FA
DN
(2013)
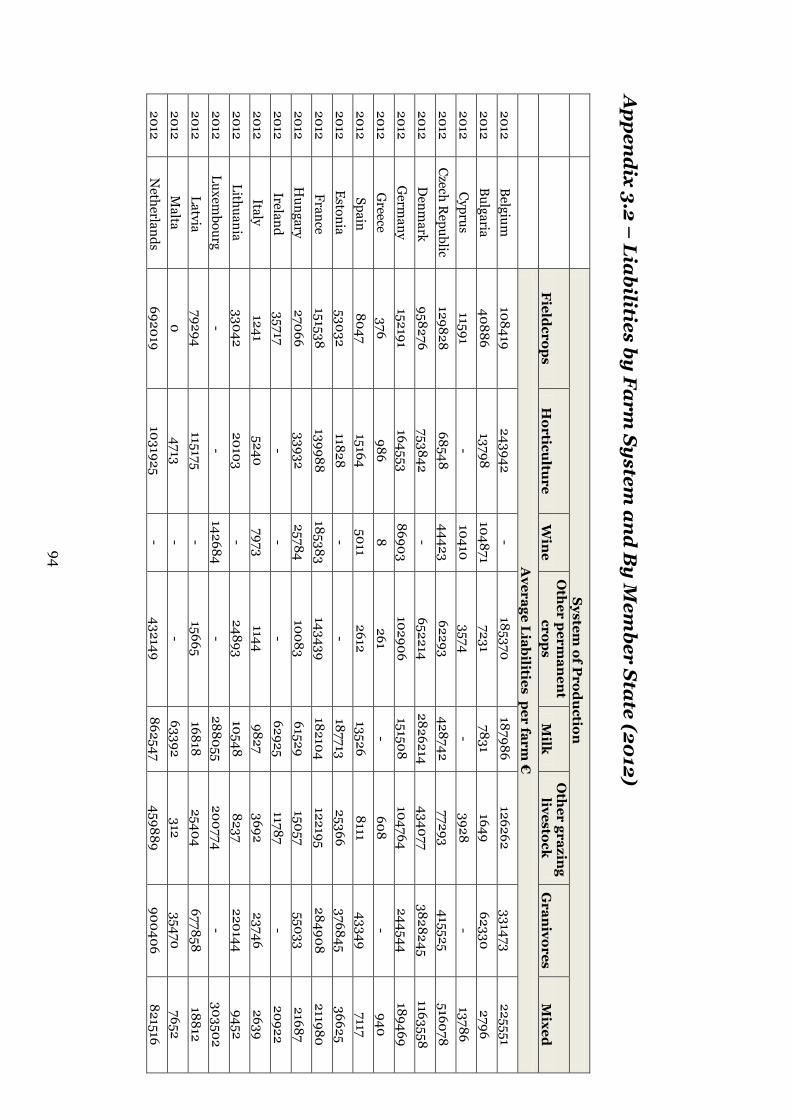
94
Ap
pen
dix 3.2 –
Lia
bilities by F
arm
Sy
stem a
nd
By
Mem
ber S
tate (20
12)
System
of Prod
uctio
n
Field
crops
Horticu
lture
Win
e O
ther p
erman
ent
crops
Milk
Oth
er grazing
livestock G
ranivo
res M
ixed
Average L
iabilities p
er farm €
2012
Belgium
108419
243942 -
185370
187986 126262
331473 225551
2012 B
ulgaria 40886
13798 104871
7231 7831
1649 62330
2796
2012 C
yprus 11591
- 10410
3574 -
3928 -
13786 2012
Czech R
epublic 129828
68548 44423
62293 428742
77293 415525
516078
2012 D
enmark
958276 753842
- 652214
2826214 434077
3828245 1163558
2012 G
ermany
152191 164553
86903 102906
151508 104764
244544 189469
2012 G
reece 376
986 8
261 -
608 -
940 2012
Spain 8047
15164 5011
2612 13526
8111 43349
7117 2012
Estonia
53032 11828
- -
187713 25366
376845 36625
2012 France
151538 139988
185383 143439
182104 122195
284908 211980
2012 H
ungary 27066
33932 25784
10083 61529
15057 55033
21687 2012
Ireland 35717
- -
- 62925
11787 -
20922 2012
Italy 1241
5240 7973
1144 9827
3692 23746
2639 2012
Lithuania 33042
20103 -
24893 10548
8237 220144
9452 2012
Luxembourg
- -
142684 -
288055 200774
- 303502
2012 Latvia
79294 115175
- 15665
16818 25404
677858 18812
2012 M
alta 0
4713 -
- 63392
312 35470
7652 2012
Netherlands
692019 1031925
- 432149
862547 459889
900406 821516

95
System
of Prod
uctio
n
Field
crops
Horticu
lture
Win
e
Oth
er p
erman
ent
crops
Milk
Oth
er grazing
livestock G
ranivo
res M
ixed
Average L
iabilities V
alue p
er farm €
2012
Austria
32867 -
53919 47840
48447
46648 68428
42502 2012
Poland 13635
17424 -
7302 10958
5272 27299
4719 2012
Portugal 2682
4220
4312 1559
8556 1586
44980 455
2012 R
omania
4265 160
3116 411
94 84
9195 30
2012 Finland
51707 378237
- -
149300 130895
262189 135741
2012 Sw
eden 276745
174834 -
- 471253
102786 926852
514040 2012
Slovakia 81844
- -
- 293923
84466 -
258228 2012
Slovenia 5415
- 9812
1908 7748
3071 12681
3869
2012 U
nited K
ingdom
216121 212970
-
214181 257126
84152 356283
202309
2012 Total
48250
91146 39379
7505 96670
30379
206021 28346
Source: European Com
mission, FA
DN
(2013)

96
Ap
pen
dix 3.3 –
Solvency
Levels by
Fa
rm S
ystem
an
d B
y M
ember S
tate (20
12)
System
of Prod
uctio
n
Field
crops
Horticu
lture
Win
e O
ther
perm
anen
t crops
Milk
Oth
er grazing
livestock G
ranivo
res M
ixed
Liab
ilities / Assets
2012 B
elgium
0.20 0.39
- 0.28
0.30
0.23 0.37
0.27 2012
Bulgaria
0.25 0.05
0.32 0.12
0.20 0.06
0.32 0.09
2012 C
yprus 0.05
- 0.10
0.03
- 0.02
- 0.19
2012 C
zech Republic
0.21 0.28
0.20 0.29
0.31 0.19
0.29 0.26
2012 D
enmark
0.46 0.55
- 0.48
0.75 0.50
0.72
0.53 2012
Germ
any 0.16
0.42 0.16
0.17 0.19
0.17 0.24
0.21 2012
Greece
0.00 0.01
0.00 0.00
- 0.01
- 0.01
2012 Spain
0.03 0.05
0.02 0.01
0.03 0.03
0.11 0.02
2012 E
stonia 0.22
0.14 -
- 0.39
0.21 0.37
0.23 2012
France 0.38
0.58 0.31
0.46 0.43
0.32 0.61
0.42
2012 H
ungary 0.14
0.26 0.10
0.10
0.21
0.10
0.36 0.16
2012 Ireland
0.03 -
- -
0.05 0.02
- 0.02
2012 Italy
0.00 0.01
0.02 0.00
0.01 0.01
0.02 0.01
2012 Lithuania
0.18 0.16
- 0.24
0.12 0.09
0.29 0.11
2012 Luxem
bourg -
- 0.17
- 0.23
0.19 -
0.24 2012
Latvia 0.38
0.45 -
0.22 0.20
0.18 0.50
0.23
2012 M
alta -
0.05 -
- 0.06
0.00 0.06
0.05 2012
Netherlands
0.22 0.57
- 0.34
0.32 0.37
0.53 0.31

97
System
of Prod
uctio
n
Field
crops
Horticu
lture
Win
e O
ther
perm
anen
t crops
Milk
Oth
er grazing
livestock G
ranivo
res M
ixed
Liab
ilities/Assets
2012 A
ustria 0.08
- 0.19
0.15 0.10
0.10
0.11
0.10
2012 Poland
0.08 0.13
- 0.05
0.05 0.04
0.10
0.04 2012
Portugal 0.03
0.05 0.03
0.02 0.07
0.02 0.20
0.01 2012
Rom
ania 0.06
0.00 0.03
0.01 0.00
0.00 0.08
0.00 2012
Finland 0.17
0.61 -
- 0.29
0.29 0.31
0.22 2012
Sweden
0.25 0.38
- -
0.40
0.20 0.56
0.37 2012
Slovakia 0.13
- -
- 0.18
0.16 -
0.12
2012 Slovenia
0.03 -
0.05 0.02
0.03 0.02
0.03 0.03
2012 U
nited K
ingdom
0.08 0.23
- 0.14
0.15 0.07
0.28 0.10
2012
Total 0.12
0.26 0.11
0.04 0.21
0.10
0.33 0.16
Source: European Com
mission, FA
DN
(2013)
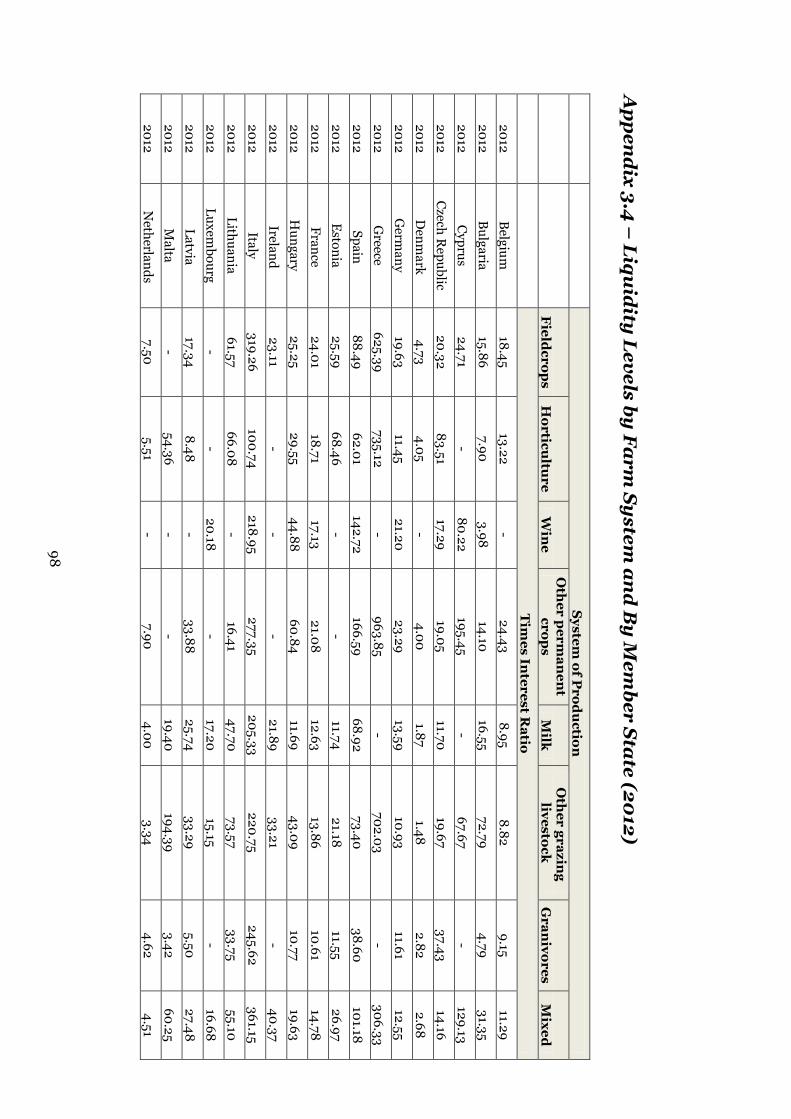
98
Ap
pen
dix 3.4
– L
iqu
idity
Levels by
Fa
rm S
ystem
an
d B
y M
ember S
tate (20
12)
System
of Prod
uctio
n
Field
crops
Horticu
lture
Win
e O
ther p
erman
ent
crops
Milk
Oth
er grazing
livestock G
ranivo
res M
ixed
Tim
es Interest R
atio 2012
Belgium
18.45
13.22 -
24.43 8.95
8.82 9.15
11.29
2012 B
ulgaria 15.86
7.90
3.98 14.10
16.55 72.79
4.79 31.35
2012 C
yprus 24.71
- 80.22
195.45 -
67.67 -
129.13
2012 C
zech Republic
20.32 83.51
17.29 19.05
11.70 19.67
37.43 14.16
2012 D
enmark
4.73 4.05
- 4.00
1.87
1.48 2.82
2.68
2012 G
ermany
19.63 11.45
21.20
23.29 13.59
10.93 11.61
12.55
2012 G
reece 625.39
735.12 -
963.85 -
702.03 -
306.33
2012 Spain
88.49 62.01
142.72 166.59
68.92 73.40
38.60 101.18
2012 E
stonia 25.59
68.46 -
- 11.74
21.18 11.55
26.97
2012 France
24.01 18.71
17.13 21.08
12.63 13.86
10.61 14.78
2012 H
ungary 25.25
29.55 44.88
60.84 11.69
43.09 10.77
19.63
2012 Ireland
23.11 -
- -
21.89 33.21
- 40.37
2012 Italy
319.26 100.74
218.95 277.35
205.33 220.75
245.62 361.15
2012 Lithuania
61.57 66.08
- 16.41
47.70 73.57
33.75 55.10
2012 Luxem
bourg -
- 20.18
- 17.20
15.15
- 16.68
2012 Latvia
17.34 8.48
- 33.88
25.74 33.29
5.50 27.48
2012 M
alta -
54.36 -
- 19.40
194.39
3.42 60.25
2012 N
etherlands 7.50
5.51
- 7.90
4.00
3.34
4.62 4.51

99
System
of Prod
uctio
n
Field
crops
Horticu
lture
Win
e O
ther p
erman
ent
crops
Milk
Oth
er grazing
livestock G
ranivo
res M
ixed
Tim
es Interest R
atio
2012 A
ustria 57.53
- 21.69
31.42 34.90
22.00
40.19
37.53
2012 Poland
41.07 29.21
- 70.57
44.32 46.31
38.15 57.88
2012 Portugal
319.23 80.50
329.77
381.24 72.15
415.43 13.00
476.92
2012 R
omania
69.59 4.16
87.71 371.00
447.82 710.60
25.51
300.29
2012 Finland
16.46 11.13
- -
19.81 10.98
12.17 15.25
2012 Sw
eden 5.48
10.52 -
- 4.33
6.40
3.25 3.05
2012 Slovakia
18.18 -
- -
2.33 6.38
- 5.55
2012 Slovenia
97.94 -
86.84 147.95
71.02 105.03
26.12 82.07
2012 U
nited K
ingdom
22.73 28.58
- 8.33
13.99 18.55
11.43 17.22
2012 Total
23.51 13.33
34.79 68.36
11.90 20.70
10.26
17.86
Source: European C
omm
ission, FAD
N (2013)

100
Ap
pen
dix 3.5 –
Fin
an
cial E
fficiency
Levels b
y F
arm
Sy
stem a
nd
By
Mem
ber Sta
te (2012)
System
of Prod
uctio
n
Field
crops
Horticu
lture
Win
e O
ther p
erman
ent
crops
Milk
Oth
er grazing
livestock G
ranivo
res M
ixed
Cash
Costs / O
utp
ut
2012 B
elgium
0.52 0.68
- 0.49
0.64 0.68
0.78 0.65
2012 B
ulgaria 0.72
0.79 0.72
0.62 0.73
0.56 0.92
0.61 2012
Cyprus
0.67 -
0.55 0.55
- 0.74
- 0.63
2012 C
zech Republic
0.75 0.77
0.63 0.69
0.83 0.70
0.92
0.84 2012
Denm
ark 0.63
0.89 -
0.65 0.89
0.93 0.84
0.82
2012 G
ermany
0.65 0.80
0.57 0.60
0.71
0.74 0.80
0.78
2012 G
reece 0.55
0.51 0.32
0.36 -
0.52 -
0.48 2012
Spain 0.57
0.63 0.40
0.48
0.73 0.63
0.74 0.63
2012 E
stonia 0.61
0.64 -
- 0.83
0.65 0.89
0.71 2012
France 0.58
0.77 0.67
0.71 0.68
0.68 0.80
0.67
2012 H
ungary 0.64
0.67 0.56
0.57 0.79
0.60 0.88
0.75
2012 Ireland
0.65 -
- -
0.64 0.60
- 0.60
2012 Italy
0.52 0.58
0.42 0.43
0.57 0.49
0.60 0.51
2012 Lithuania
0.50
0.50
- 0.35
0.56 0.51
0.79 0.64
2012 Luxem
bourg -
- 0.59
- 0.61
0.62 -
0.64
2012 Latvia
0.64 0.89
- 0.61
0.72 0.64
0.82 0.69
2012 M
alta 0.48
0.59 -
- 0.84
0.76 0.99
0.73
2012 N
etherlands 0.59
0.81 -
0.64 0.70
0.80
0.84 0.76
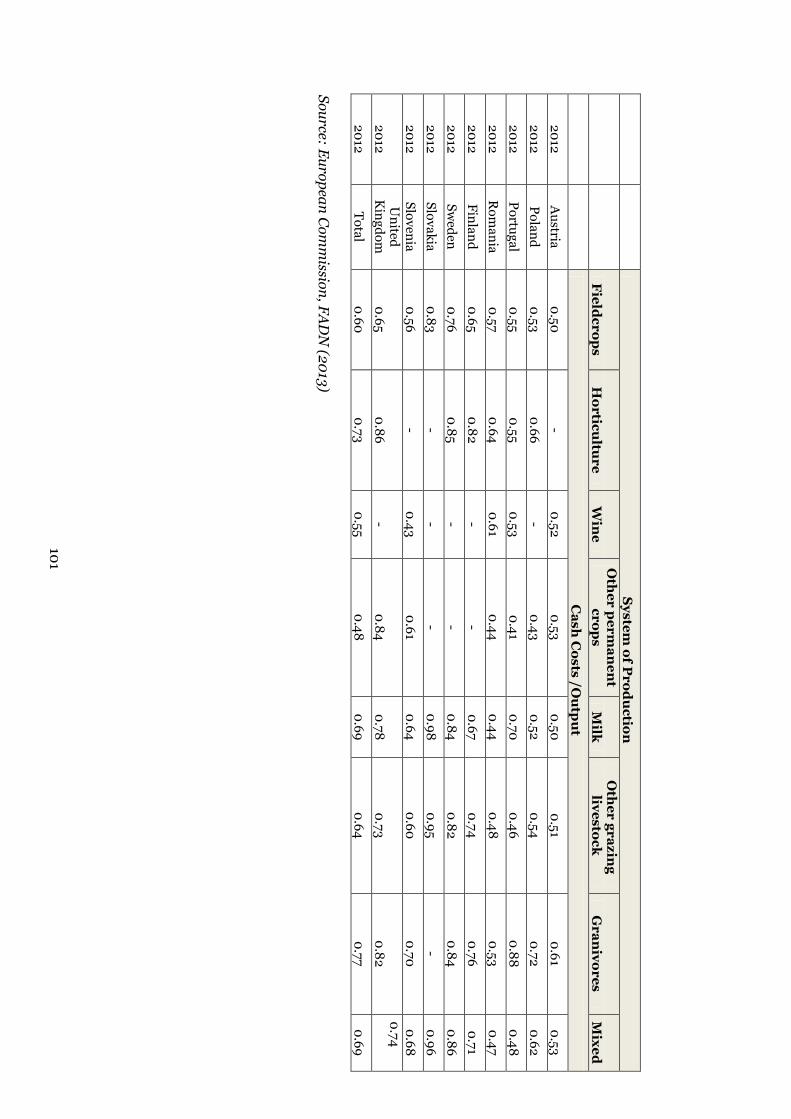
101
System
of Prod
uctio
n
Field
crops
Horticu
lture
Win
e O
ther p
erman
ent
crops
Milk
Oth
er grazing
livestock G
ranivo
res M
ixed
Cash
Costs /O
utp
ut
2012 A
ustria 0.50
-
0.52 0.53
0.50
0.51 0.61
0.53 2012
Poland 0.53
0.66 -
0.43 0.52
0.54 0.72
0.62
2012 Portugal
0.55 0.55
0.53 0.41
0.70
0.46 0.88
0.48 2012
Rom
ania 0.57
0.64 0.61
0.44 0.44
0.48 0.53
0.47
2012 Finland
0.65 0.82
- -
0.67 0.74
0.76 0.71
2012 Sw
eden 0.76
0.85 -
- 0.84
0.82 0.84
0.86 2012
Slovakia 0.83
- -
- 0.98
0.95 -
0.96
2012 Slovenia
0.56 -
0.43 0.61
0.64 0.60
0.70
0.68
2012 U
nited K
ingdom
0.65 0.86
- 0.84
0.78 0.73
0.82 0.74
2012 Total
0.60 0.73
0.55 0.48
0.69 0.64
0.77 0.69
Source: European C
omm
ission, FAD
N (2013)
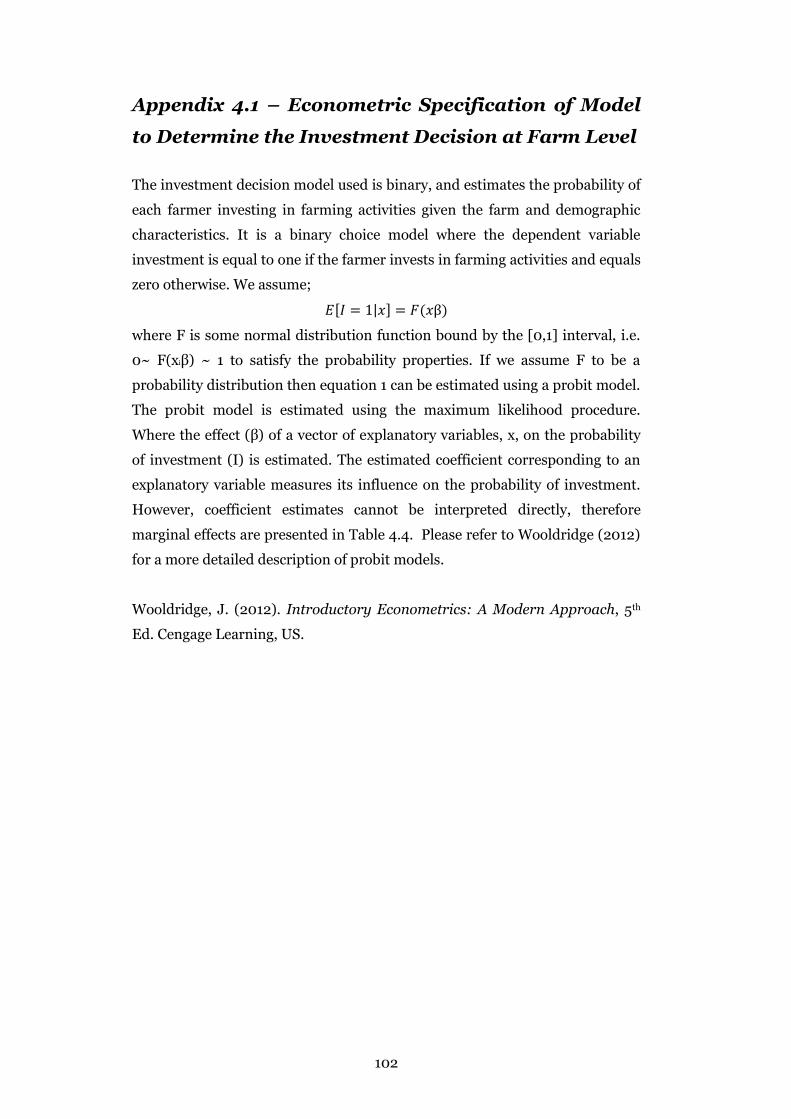
102
Appendix 4.1 – Econometric Specification of Model
to Determine the Investment Decision at Farm Level
The investment decision model used is binary, and estimates the probability of
each farmer investing in farming activities given the farm and demographic
characteristics. It is a binary choice model where the dependent variable
investment is equal to one if the farmer invests in farming activities and equals
zero otherwise. We assume;
[ | ] where F is some normal distribution function bound by the [0,1] interval, i.e.
0~ F(xiβ) ~ 1 to satisfy the probability properties. If we assume F to be a
probability distribution then equation 1 can be estimated using a probit model.
The probit model is estimated using the maximum likelihood procedure.
Where the effect (β) of a vector of explanatory variables, x, on the probability
of investment (I) is estimated. The estimated coefficient corresponding to an
explanatory variable measures its influence on the probability of investment.
However, coefficient estimates cannot be interpreted directly, therefore
marginal effects are presented in Table 4.4. Please refer to Wooldridge (2012)
for a more detailed description of probit models.
Wooldridge, J. (2012). Introductory Econometrics: A Modern Approach, 5th
Ed. Cengage Learning, US.

103
A
pp
end
ix 6.1: Selected
EU
Mem
ber Sta
te Sow
Pop
ula
tions (0
00
’s)
Source E
urostat 2014
Cou
ntry
200
5 20
06
20
07
200
8
200
9
2010
20
11 20
12 20
13 20
05-13
EU
28
15,591 15,708
15,049 14,050
14,005
13,682 13,255
12,737 12,503
-19.8%
Den
mark
1,340 1,414
1,353 1,289
1,346 1,286
1,239 1,229
1,258 -6.1%
Germ
any
2,504 2,467
2,418 2,296
2,236 2,233
2,194 2,118
2,054 -18.0%
Ireland
175
167 159
151 158
149 146
144 144
-17.4%
Sp
ain
2,593 2,689
2,663 2,542
2,440
2,408
2,404 2,250
2,253
-13.1%
Fran
ce 1,274
1,264 1,234
1,200
1,185 1,116
1,103 1,076
1,043 -18.1%
Italy 722
772 754
756 746
717 709
621 590
-18.2%
Neth
erland
s 1,100
1,050
1,060
1,025 1,100
1,098 1,106
1,081 1,095
-0.5%
Polan
d
1,808 1,786
1,587 1,279
1,361 1,328
1,125 1,012
955 -47.2%
UK
505
524 498
487 481
491 484
494 482
-4.5%

104
Appendix 6.2 Assumptions for Increased Sow Herd Output
CURRENT HERD EXPANDED HERD NO.SOWS 550 550
NO.GILTS 60 60
NO.BOARS 3 3
NO.PIGS PRODUCED/SOW/YEAR. 25 27.2
AVERAGE WEANING AGE Days 26 26
AVERAGE WEANING WEIGHT Kg 7 7
FEED PER SOW PER YEAR Tonnes 1.35 1.35
CREEP FEED/WEANER Kg 3.5 3.5
LINK FEED/WEANER Kg 5.5 5.5
WEANER FEED CONVERSION. 1.92 1.92
WEANER WEIGHT TRANSFER . Kg 35 35
WEANER WEIGHT AT SALE Kg 35 35
WEANER AVERAGE DAILY GAIN g 460 460
FINISHER SALE LIVEWEIGHT Kg 105 110
KILL OUT % 76 76
LEAN MEAT % 54 54
FINISHER FEED CONVERSION 2.8 2.8
FINISHER AVERAGE DAILY GAIN g 820 820
SOW CULLING RATE PER YEAR % 45 45
SOW MORTALITY PER YEAR % 6 6
BOAR REPLACEMNT RATE/YEAR % 33 33
PURCHASED GILTS SERVED % 95 95
FEED PRICE DRY SOW €/tonne 274 274
LACTATING SOW €/tonne 319 319
CREEP €/tonne 930 930
LINK €/tonne 650 650
WEANER €/tonne 360 360
FINISHER €/tonne 301 301
COST OF GILTS PER HEAD € 105 105
COST OF BOARS PER HEAD € 105 105
HEALTHCARE COSTS PER PIG € 5.19 5.19
HEAT/POWER/LIGHT PER PIG € 3.51 3.51
TRANSPORT COST PER PIG € 1.2 1.2
AI COST PER DOUBLE DOSE € 16 16
A.I.COSTS PER WEEK € 457 457
MANURE HANDLING PER YEAR € 7681 7681
MISCELLANEOUS COSTS/YEAR € 17556 17556
GROSS ANNUAL LABOUR COSTS € 127281 127281
REPAIRS+MAINTENANCE/YEAR € 26334 26334
ADMIN/ACCOUNTANCY PER YEAR 6584 6584
LOAN REPAYMENTS / MONTH € 7200 11458
AVERAGE INTEREST PAID / MONTH € 1700 2700

105
INSURANCE COSTS/YEAR € € 8778 8778
BUILDING DEPRECIATION / YEAR € 0 0
FINISHERS- PIG SALES(W+F) % 100 100
FINISHER BASE PRICE c /Kg 150 150
WEANER PRICE/HEAD € 55 55
CULL SOW PRICE € 80 80
CULL BOAR PRICE € 80 80
CULL GILT PRICE € 80 80

106
Appendix 6.3 Financial implication from Increased Sow Herd
Output
PERFORMANCE SUMMARY Current Herd Expanded Herd
NO PIGS PRODUCED 13750 14960
TOTAL FINISHER LIVEWEIGHT SOLD KG
1443750 1645600
TOTAL FEED USED TONNES 4177.25 4688.95
AVERAGE FEED PRICE PER TONNE €
320.82 320.4
WEANING TO SALE FCE 2.55 2.56
ADG g 670 676
DAYS 146 152
COST PER KG DEADWEIGHT cent
AVERAGE DEADWEIGHT Kg 79.8 83.6
FEED c 122.2 120.1
NON-FEED
HEALTHCARE 6.5 6.2
HEAT/POWER/LIGHT 4.4 4.2
TRANSPORT 1.5 1.4
A.I. 2.2 1.9
MANURE HANDLING 0.7 0.6
MISCELLANEOUS 1.6 1.4
LABOUR 11.6 10.2
REPAIRS/MAINTENANCE 2.4 2.1
ADMIN / ACCOUNTANCY 0.6 0.5
LOAN REPAYMENTS 7.9 11
LEASE CHARGES 0 0
INTEREST PAID 1.9 2.6
ENVIRONMENT COSTS 0 0
PERS. DRAWINGS/MANAGEMENT
0 0
INSURANCE 0.8 0.7
BUILDING DEPRECIATION 0 0
STOCK DEPRECIATION 0.9 0.8
TOTAL 35.1 32.7
CASH PAYMENT PER KG DEADWEIGHT
163.2 161.2
(including full bank repayments but excluding building depreciation)