
FINANCIAL STABILITY REPORT Autumn 2021
120
FINANCIAL STABILITY REPORT Autumn 2021
Transcript of FINANCIAL STABILITY REPORT Autumn 2021
FINANCIAL STABILITY REPORT Autumn
2021


FINANCIAL STABILITY REPORT AUTUMN 2021

21RISKS TO THE FINANCIAL SECTOR
AND ITS RESILIENCE
RISKS LINKED TO THE MACRO-FINANCIAL
ENVIRONMENT
1.1 Macroeconomic environment 25
1.1.1 Systemicandmateriallysignificantcountries 25
1.1.2 Spain 29
1.2 Financial markets and the real estate sector 31
1.2.1 Financial markets 31
1.2.2 Spanish real estate market 34
1.3 Non-financialsectors 37
1.3.1 Non-financialcorporationsandhouseholds 37
1.3.2 General government in Spain 41
1.3.3 Financialflowsvis-à-vistherestoftheworldand the international investment position 43
2.1 Deposit institutions 51
2.1.1 Balance sheet structure, risks and vulnerabilities 51
2.1.2 Profitabilityandsolvency 60
2.1.3 Forward-lookingassessmentoftheSpanish banking system’s resilience 66
2.1.4 Deposit institutions’ operational risks 75
2.2 Non-bankfinancialsectorandsystemicinterconnections 76
2.2.1 Non-bankfinancialsector 76
2.2.2 Systemic interconnections 79
THE STABILITY OF THE SPANISH FINANCIAL SYSTEM: MAIN RISKS AND VULNERABILITIES 11

3SYSTEMIC RISK AND PRUDENTIAL POLICY
3.1 Analysisofriskindicatorsandsystemicvulnerabilities 95
3.2 Regulatorydevelopmentsrelevanttofinancialstability 102
Banco de España Publications 119
Symbols and abbreviations 120
ISO country codes 120
Annexes
1 Consolidated balance sheet 117
2 Consolidated income statement 118

1 Business turnover by sector 14
2 Cumulativechangeinbankcredittonon-financialbusinessactivitybetweenDecember2019andJune2021 14
3 Simulatedpathsofpublicdebt 15
4 Abreakdownofthechangeinprofitofthebankingsector 15
5 FLESB stress tests. Impact on the CET1 ratio in the baseline scenario and adverse scenario 17
6 Cyclically adjusted PER 17
7 Deviationoftermriskpremiumintheinterestrateon10-yearpublicdebtfromitshistoricalaverageand10-year real interest rate 18
8 ManufacturingPMI: speed in supplier’s delivery times 18
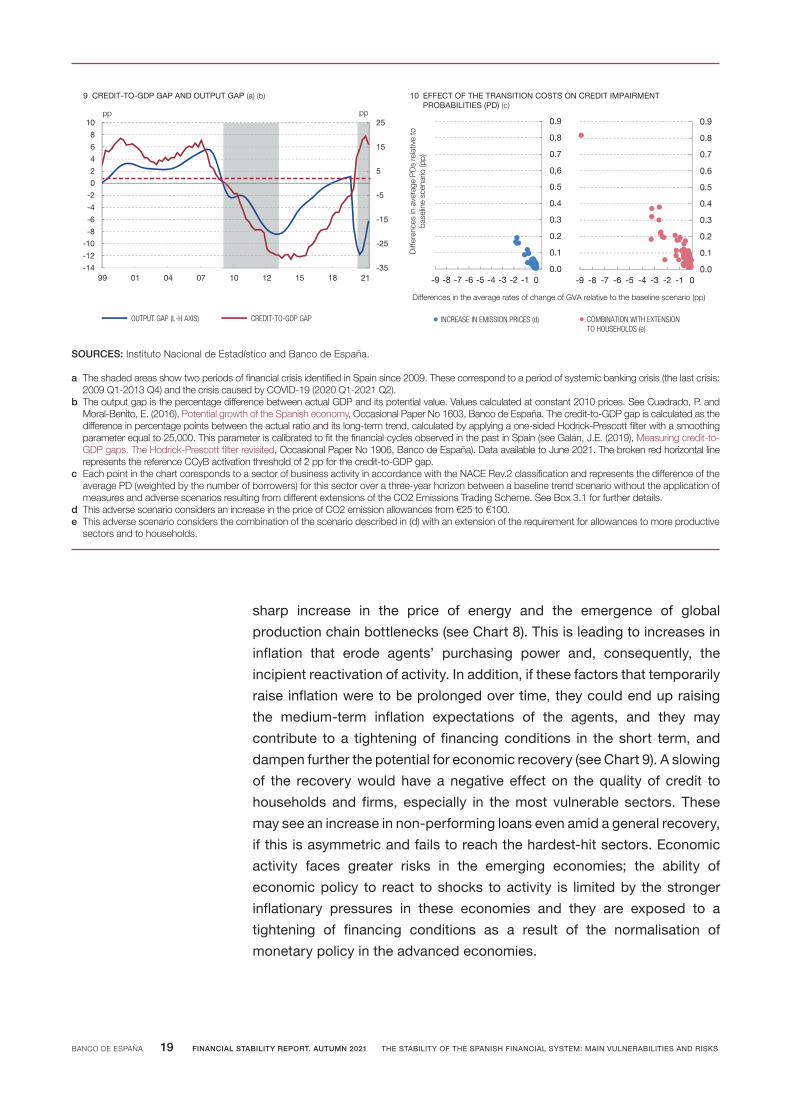
9 Credit-to-GDPgapandOutputgap 19
10 Effectofthetransitioncostsoncreditimpairmentprobabilities (PD) 19
1.1 The global economy continues to recover in 2021, butwithdownsiderisksderivingfromuncertaintyovertheunfoldingofthepandemic,thepersistenceofbottlenecksandapossibletighteningoffinancialconditions 26
1.2 Higherinflationexpectationsexertupwardpressureon interest rates in the emerging market economies, whilecreditlosesmomentum 28
1.3 ThebaselineforecastsfortheSpanisheconomyenvisage high dynamism at short term, although certain economic and health risks persist 30
1.4 Stock market indices have risen, sovereign debt yieldshavereboundedfromAugustandsovereignandcorporateriskpremiahaveremainedatlowlevels 32
1.5 Pricesofrisk-bearingfinancialassetsarestillhighcomparedwithsomeoftheirdeterminants 34
1.6 Housesalesandpriceshaveacceleratedsignificantlyin2021todate,whileaveragepricesofcommercialrealestateshowedsomesignsofrecoveryinQ2 36
1.7 Firms’salesandprofitabilityhaveimproved,albeitvery unevenly across economic sectors 38
1.8 Theeconomicsituationofhouseholdsalsorecovered in 2021 H1,withincome,employmentandexpectationsallimproving,albeitunevenlybyemploymentsectorandincomelevel,whichalsoconditionhouseholds’borrowingdecisions 40
1.9 TheSpanishbudgetdeficithasdeclinedin2021,but it remains above its pre-pandemic level and the projected debt reduction up to 2023 is very limited 42
1.10 In 2021 H1, international investors returned to the Spanish government debt market and Spain’s negative net international investment position declined 44
2.1 Thevolumeoflendingtotheresidentprivatesectorremained stable over the last 12 months, largely duetothemoderationinnewloanswithICO guarantees 52
2.2 Lending to the corporate sector declined in 2021 H1, withdifferentsectorsshowingmoreevenbehaviourthanin2020.Incontrast,lendingtohouseholdsgrewin the same period 53
2.3 ThevolumeofNPLscontinuedtodecline,althoughsomesignsofcreditqualityimpairmentandunevenbehaviouracrosssectorswereobserved 55
2.4 ThesignsofdeteriorationinthecreditqualityofloanswithexpiredmoratoriaremainandhaveintensifiedinthecaseofICO-backed loans 56
2.5 ThevolumeofassetsheldabroadbySpanishbankshasfallensincetheonsetofthepandemic,partlyasaresultoftheacross-the-boardappreciationoftheeuro and the divestment in the United States 57
2.6 In2021,thestabilisationofmonetarypolicyhascontinued to contribute, albeit less so than in 2020, towardsimprovinginterbankandwholesalefundingconditions 59
2.7 TheSpanishbankingsector’sprofitabilityimprovedsignificantlyinJune2021comparedwithayearearlier.Thiswaslargelybecauseofextraordinaryitemsandlowerimpairmentprovisioning 61
2.8 ThegeographicaldistributionofSpanishbanks’profitis approaching its pre-crisis level and composition. Meanwhile,theprofitabilityoftheEuropeanbankingsectorasawholehasimproved,underpinnedbythelowercostofrisk 62
2.9 Provisioningchargesin2021H1felltohalftheamountrecognisedinthesameperiodof2020.ThedeclinewaslesssteepinoperationsinSpain 63
2.10 Spanish banks maintain the cost-to-income ratio advantage over their European peers 64
2.11 TheaggregatecapitalratiosoftheSpanishbankingsector increased slightly in 2021 H1 65
INDEX OF CHARTS

3.2 Indicators such as the credit-to-GDP ratio and credit intensityhaveundergonecorrectionsasaresultofthereboundineconomicgrowth,whichisbeginningto move closer to its potential, but has not yet reached its pre-pandemic level 98
3.3 In 2021 H1,supplyanddemand-sidefactorshavesignificantlyboostednewlendingtohouseholds,whilecontractingnewlendingtofirms 99
3.4 Countries that had room to ease macroprudential measuresduringthepandemichadalowerriskofseverecreditcontraction,withthispatterncontinuingin 2021 101
2.12 CET1increasedacrosstheboard,whilethedeclineinRWAsmostlyaffectedsomesignificantinstitutions 66
2.13 InthegeographicalareaswhereSpanishbankshavesignificantpresence,thebaselinescenarioenvisagesawidespreadrecovery,whereastheadversescenarioreflectsaprolongationofthecontractiontriggered by the COVID-19 pandemic 69
2.14 Thebankswiththelargestinternationalpresenceremainfirmlyresilient,eventothecontinuedglobaldownturnenvisagedundertheadversescenario 70
2.15 Other SSMbankswouldrecordrelativelylargeimpairments relative to their loss-absorbing capital. Nonetheless, the ending CET1 ratio is sound, partly owingtothefavourablestartingpositionand RWA reduction 71
2.16 Institutions supervised directly by the Banco de España,whichstartwithahighcapitallevelandexposuretolower-riskassets,experiencesignificantimpairment.However,thisisoffsetbyprovisions,capital generation and deleveraging under both scenarios 72
2.17 ICOguaranteeslimittheimpactoncapitalofloanlosses. This is particularly true under the adverse scenario,whichpresentsanunevencreditqualityimpairment relative to the baseline scenario across firmsofdifferentsizeandsector 73
2.18 EuropeanbanksshowstrongresilienceundertheadversescenariooftheEBAstresstest,withbetter-than-averageresilienceforSpanishbanks 75
2.19 Operationalrisklosseshavedeclinedinrecentyears,butthereisgrowingconcernoverthefuturecostsofcyber risks 76
2.20 EuroareainvestmentfundcapitalinflowspersistedinH1,withthematurityoftheirfixed-incomeportfoliosrisingslightlysincetheonsetofthecrisis 78
2.21 Thelevelandstructureofbanks’directinterconnectionswithothersectorsthroughtheirassetsandliabilitieshavenotbeensignificantlyaltered by the crisis 80
2.22 Aslightdeclineisobservedinthefinancialsectors’common holdings, especially investment andpensionfunds 81
3.1 The systemic risk indicator (SRI) has risen since August 2021 and the improvement in bank systemic riskhasslowedsomewhat.However,bothmetricsremainveryfarfromthe2020stresslevels 96

1 Financial stability risks and vulnerabilities – Autumn 2021 13
INDEX OF FIGURES INDEX OF TABLES
2.1 MacroeconomicscenariosforSpaininthestresstest 68
3.1 Capitalbuffersforsystemicallyimportantinstitutions 102

1.1 ThedeterminantsofinterestratesintheUnitedStates and Europe 45
2.1 Impactofthepublicguaranteeschemeonlendingrelationshipsbetweenfirmsandbanks 82
2.2 Recourse to maturity and payment holiday extensionsunderthepublicguaranteeprogrammeforloanstofirms 85
2.3 Thesovereign-banknexus 87
3.1 Impactofclimatechangerisksonthebankingsector 107
3.2 Thevalueofhousingandecologicaldegradation:thecaseoftheMarMenor 112
INDEX OF BOXES


THE STABILITY OF THE SPANISH FINANCIAL SYSTEM: MAIN RISKS AND VULNERABILITIES


BANCO DE ESPAÑA 13 FINANCIAL STABILITY REPORT. AUTUMN 2021 THE STABILITY OF THE SPANISH FINANCIAL SYSTEM: MAIN VULNERABILITIES AND RISKS
Themacro-financial situationof theSpanisheconomyhas improvedsince
the publication of the last Financial Stability Report (FSR); however,
vulnerabilities and risks are still at heightened levels. The progress in the
vaccination of the population and the effectiveness of the measures implemented
by the authorities to mitigate the impact of the pandemic have allowed activity to
recover progressively, in line with the central scenario of forecasts, although the
sectors most affected by the health crisis are still clearly below the level of 2019.
These factors explain why there has been no increase in doubtful loans in the bank
credit portfolio as a whole, although there are latent impairments whose
materialisation will depend on the evolution of the economy and the pace of
withdrawal of the measures. In this context, bank profitability has recovered to pre-
pandemic levels, although this was low compared to other sectors and geographies.
In any case, it is necessary to continue to maintain a close surveillance of the
financial system, since, as detailed below, vulnerabilities remain high in relation to
levels prior to the onset of the crisis, and there are risks whose materialisation could
hinder the process of economic and financial normalisation (see Figure 1).
THE STABILITY OF THE SPANISH FINANCIAL SYSTEM: MAIN VULNERABILITIES AND RISKS
FINANCIAL STABILITY RISKS AND VULNERABILITIES – AUTUMN 2021 (a)Figure 1
R1. Deterioration of financial conditions and correction of financial asset values
R2. Downward adjustments or delay to the recovery of economic growth
V1. Financial weaknessof certain segments offirms and households
VULNERABILITIES
MAIN FINANCIALSTABILITY RISKS
POLICIES
V2. Level of public debt
P1. Fiscal policy
P2. Monetary policy
P3. Prudential policy
V3. Weak profitabilityof financialintermediaries
SOURCE: Banco de España.
a In this report, vulnerabilities are defined as economic and financial conditions that increase the impact or probability of materialisation of risks to financial stability. The latter are in turn identified as adverse changes in economic and financial conditions, with an uncertain probability of occurrence, which hamper or impede financial intermediation, with negative consequences for real economic activity.

BANCO DE ESPAÑA 14 FINANCIAL STABILITY REPORT. AUTUMN 2021 THE STABILITY OF THE SPANISH FINANCIAL SYSTEM: MAIN VULNERABILITIES AND RISKS
The main vulnerabilities1 of the Spanish economy and financial system include:
— V1.Theweakfinancialpositionofcertainsegmentsofhouseholds
andfirms. By the end of the first half of 2021, most sectors of activity had
regained their pre-crisis turnover levels (see Chart 1). This has allowed
profitability to recover, while favourable financing conditions have
moderated liquidity risks, and average debt and financial burden ratios
decreased. However, the recovery remains incomplete in the hardest-hit
sectors (e.g. hospitality, transport and car manufacturing), which have
recorded the largest increases in bank debt, and also non-performing
loans (see Chart 2). These sectors also account for the bulk of the latent
impairment of bank loans. For now, scenarios of significant increases in
business failures appear to have been avoided, but it should be noted that
extraordinary measures continue to provide very significant support. In
the case of households, the overall trends of recovering income and
employment (which is now close to its pre-crisis levels), and rising saving
1 Inthisreport,vulnerabilitiesaredefinedaseconomicandfinancialconditionsthatincreasetheimpactorprobabilityofmaterialisationofriskstofinancialstability.
SOURCES: Agencia Estatal de Administración Tributaria and Banco de España.
a The severely affected sectors are those whose turnover fell by more than 15% in 2020.b The moderately affected sectors are those whose turnover fell by more than 8%, but less than 15% in 2020.c The least affected sectors are those whose turnover fell by less than 8% in 2020.d Credit to sectors affected to a differing degree by the COVID-19 crisis is measured on the assumption that the NACE sectors identified in Chart 1 correspond
approximately to the sectors reported in template FI-130.
-20
-10
0
10
20
30
40
50
Severely affectedsectors
Moderately affectedsectors
Least affectedsectors
TOTAL CREDIT NPLs
2 CUMULATIVE CHANGE IN BANK CREDIT TO NON-FINANCIAL BUSINESS ACTIVITY BETWEEN DECEMBER 2019 AND JUNE 2021 (d)
%
-60
-50
-40
-30
-20
-10
0
10
20
Acc
omm
. & fo
od s
erv.
act
iv.
Man
u. o
f refi
ned
pet.
prod
.S
ocia
l & c
ultu
ral s
erv.
.Tr
ansp
orta
tion
& s
tora
geM
anuf
actu
re o
f tex
tiles
Man
u. o
f tra
nspo
rt e
quip
.M
anu.
of m
etal
pro
duct
sO
ther
ser
v. fo
r pro
duct
ion
Woo
d &
furn
iture
Pap
er &
prin
ting
Man
u. o
f mac
hine
ryW
hole
sale
trad
eO
ther
man
ufac
turin
gM
inin
g &
qua
rryi
ngC
onst
ruct
ion
Sup
plie
sR
etai
l tra
deIn
form
atio
n &
com
mun
icat
ion
Rea
l est
ate
activ
ities
Man
u. o
f che
m. &
che
m. p
rod.
Food
Agr
icul
ture
Severelyaffected
sectors (a)
Moderatelyaffected
sectors (b)
Leastaffected
sectors (c)
CHANGE IN ANNUAL TURNOVER: 2019-2020CHANGE IN SIX-MONTHLY TURNOVER: 2019 H1-2021 H1
%
1 BUSINESS TURNOVER BY SECTORRate of change relative to the same period of 2019

BANCO DE ESPAÑA 15 FINANCIAL STABILITY REPORT. AUTUMN 2021 THE STABILITY OF THE SPANISH FINANCIAL SYSTEM: MAIN VULNERABILITIES AND RISKS
SOURCES: Intervención General de la Administración del Estado (IGAE) and Banco de España.
a The pre-Covid-19 scenario replicates the simulations of public debt over GDP ratio produced with data and projections with the cut-off date December 2019. The neutral fiscal policy scenario simulates the projections of debt using the last Banco de España’s forecasts, see Macroeconomic Projections for the Spanish Economy (2021-2023), with no additional restrictions on the structural balance variation. The fulfilment of the SGP scenario assumes a consolidation plan for public debt with a reduction in the structural deficit, up to the budged balance, of 0.5 pp of GDP every year. The last scenario adds structural reforms that would lead to an increase of potential GDP in 0.6 pp in the long term.
b The red (green) colour of the bars indicates a negative (positive) contribution of the item concerned to the change in consolidated profit for June 2021 with respect to June 2020. The black diamonds show ROA excluding extraordinary items. In particular, in June 2020: goodwill adjustments (-€12.2 billion), deferred tax asset adjustment (-€2.5 billion) and asset management business sale (€0.3 billion); and in June 2021: extraordinary income as a result of a merger (€2.9 billion) in particular, negative goodwill; segregation of an insurer (€0.9 billion) and extraordinary restructuring costs (-€1.2 billion).
c Includes, inter alia, the extraordinary items mentioned in the previous note.
-0.8
-0.6
-0.4
-0.2
0.0
0.2
0.4
0.6
0.8
ROAJun-20
Netinterestincome
Fees &commi-ssions
Net gainson fin.ass. &liab.
Ope-ratingexp.
Pro-visions
Otheritems
(c)
ROAJun-21
4 A BREAKDOWN OF THE CHANGE IN PROFIT OF THE BANKING SECTOR Consolidated net profit as a percentage of ATA (b)
%
60
70
80
90
100
110
120
130
2014 2018 2022 2026 2030 2034
PRE-COVID-19 NEUTRAL FISCAL POLICY
FULFILMENT OF SGP FULFILMENT OF SGP + REFORMS
% of GDP
3 SIMULATED PATHS OF PUBLIC DEBT (a)
are firming. However, households with close links to employment in the
sectors hardest hit by the health crisis and those with low incomes have
benefited less from the recovery and are especially vulnerable. Moreover,
their borrowing behaviour differs from that of other households. A slower
than expected recovery in activity or an increase in financing costs may
lead to significant increases in non-performing loans in these more
vulnerable segments of households and firms.
— V2. The increase in government debt. As noted in the FSRs published
since spring 2020, a corollary of the necessary and decisive economic
policy response has been an increase in public debt. In Spain, the
expected reduction in the budget deficit in the coming years is notable,
as a result of the improvement in the cyclical situation. However, a
significant reduction in public debt in the medium term will require the
elimination of the structural component of the budget deficit, in line with
European regulations and, in the absence of an adequate fiscal
consolidation plan, the level of debt may remain high for an extended
period (see Chart 3). During this process, the high level of public debt
makes the Spanish economy vulnerable to any deterioration in financing
BANCO DE ESPAÑA 16 FINANCIAL STABILITY REPORT. AUTUMN 2021 THE STABILITY OF THE SPANISH FINANCIAL SYSTEM: MAIN VULNERABILITIES AND RISKS
conditions and reduces its capacity to respond to a potential risks that
materialise. The cost of the increase in public debt has, so far, been
limited by the expansionary monetary policy and this effect will last
some time longer, given that the debt that is currently maturing was
issued at higher interest rates. In this context, the recent increase in
inflation stems from temporary factors, so that the monetary policy
stance can be expected to remain accommodative; indeed, if monetary
policy is normalised more rapidly than expected, the potential impact of
this vulnerability will increase. The yield on long-term sovereign debt
would probably be that most affected by the uncertainty that could arise
in the financial markets in the event of a premature withdrawal of the
central bank purchase programmes launched to mitigate the impact of
the pandemic. In Spain, the relatively long sovereign debt maturities
would reduce the immediate impact of these shocks to the interest
burden.
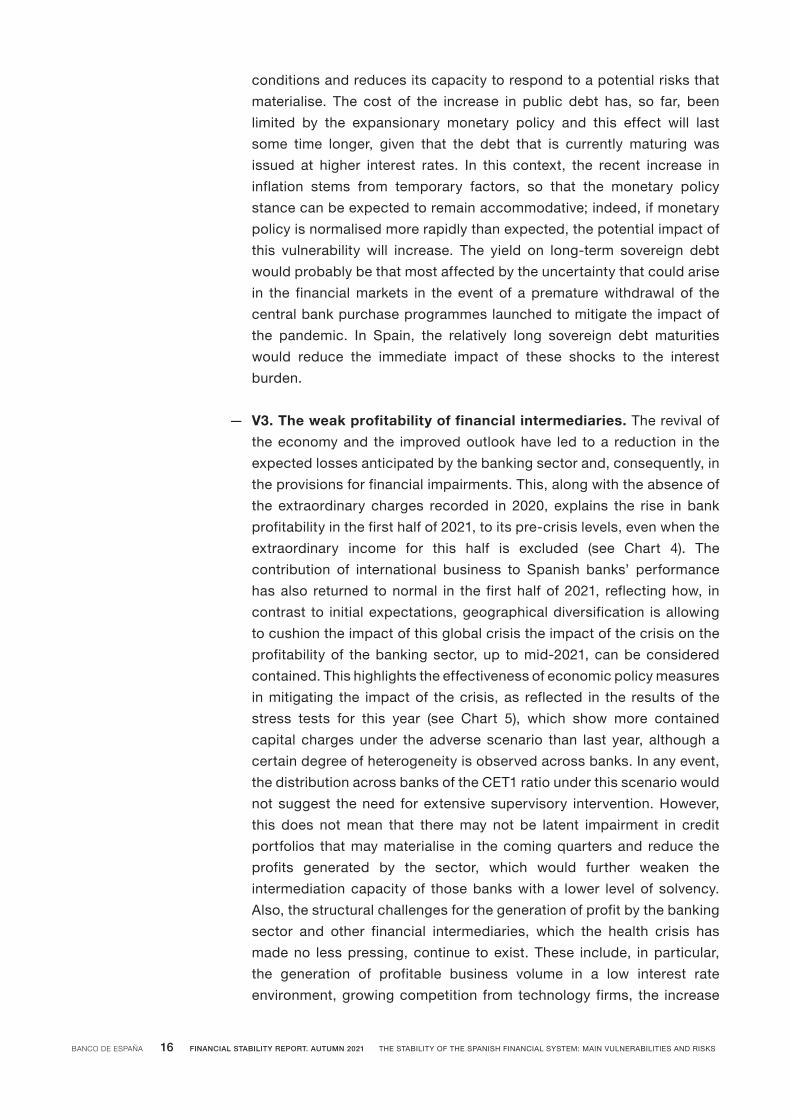
— V3.Theweakprofitabilityoffinancialintermediaries. The revival of
the economy and the improved outlook have led to a reduction in the
expected losses anticipated by the banking sector and, consequently, in
the provisions for financial impairments. This, along with the absence of
the extraordinary charges recorded in 2020, explains the rise in bank
profitability in the first half of 2021, to its pre-crisis levels, even when the
extraordinary income for this half is excluded (see Chart 4). The
contribution of international business to Spanish banks’ performance
has also returned to normal in the first half of 2021, reflecting how, in
contrast to initial expectations, geographical diversification is allowing
to cushion the impact of this global crisis the impact of the crisis on the
profitability of the banking sector, up to mid-2021, can be considered
contained. This highlights the effectiveness of economic policy measures
in mitigating the impact of the crisis, as reflected in the results of the
stress tests for this year (see Chart 5), which show more contained
capital charges under the adverse scenario than last year, although a
certain degree of heterogeneity is observed across banks. In any event,
the distribution across banks of the CET1 ratio under this scenario would
not suggest the need for extensive supervisory intervention. However,
this does not mean that there may not be latent impairment in credit
portfolios that may materialise in the coming quarters and reduce the
profits generated by the sector, which would further weaken the
intermediation capacity of those banks with a lower level of solvency.
Also, the structural challenges for the generation of profit by the banking
sector and other financial intermediaries, which the health crisis has
made no less pressing, continue to exist. These include, in particular,
the generation of profitable business volume in a low interest rate
environment, growing competition from technology firms, the increase

BANCO DE ESPAÑA 17 FINANCIAL STABILITY REPORT. AUTUMN 2021 THE STABILITY OF THE SPANISH FINANCIAL SYSTEM: MAIN VULNERABILITIES AND RISKS
in cyber risks and the potentially negative effects associated with climate
risks.
There follows a discussion of the main risks2 to the stability of the Spanish financial
system:
— R1.Possibledeteriorationoffinancingconditionsandthecorrection
offinancialassetvalues. Despite some temporary correction episodes
in the first half of the year, the prices of risk-bearing assets on international
financial markets remain high (see Chart 6). The low equilibrium level of
long-term real interest rates, as a result of structural factors, such as
demographic and productivity trends in developed countries and the
demand for safe assets, which monetary policy attempts to accommodate
through significant central bank bond purchase programmes, is an
important factor supporting these valuations (see Chart 7). In this respect,
2 In this report, risksare identifiedasadversechanges ineconomicand financial conditions,withanuncertainprobabilityofoccurrence,whichhamperorimpedefinancialintermediation,withnegativeconsequencesforrealeconomic activity.
SOURCES: Refinitiv Datastream and Banco de España.
a The net effect of positive (negative) flows is indicated by the figure above (below) the bar in question. The initial and final CET1 ratios are presented as "fully-loaded". Other impacts include, the change in RWAs between 2020 and 2023 and the effect of ICO guarantees. Aggregate results, including both institutions directly supervised by the SSM and the Banco de España.
b This variable includes net operating income in Spain and net income attributable to business abroad. Thus, the possible funds generated by the banking group as a whole are compared with the impairment losses in Spain (the focus of these tests).
c This variable shows the projection over the three years of the exercise of gross losses due to credit portfolio impairment for exposures in Spain and other types of losses (associated with the fixed-income portfolio, the management of foreclosures and the sovereign portfolio).
d The cyclically adjusted PER is calculated as the ratio between the price of the shares and the 10-year moving average of profits. The historical averages are calculated for the period 1997-2021.
USE OF PROVISIONS IN SPAIN GENERATION OF FUNDS (b)
IMPAIRMENTS IN SPAIN (c) OTHER IMPACTS
5 FLESB STRESS TESTS. IMPACT ON THE CET1 RATIO IN THE BASELINE SCENARIO (L-H CHART) AND ADVERSE SCENARIO (R-H CHART) (a)
EURO AREA EURO AREA. HISTORICAL AVERAGE
UNITED STATES UNITED STATES: HISTORICAL AVERAGE
SPAIN SPAIN. HISTORICAL AVERAGE
6 CYCLICALLY ADJUSTED PER (d)
12.713.8
6.4
7.5
0
5
10
15
20
25
CET12020
CET12023
Baseline
12.7 10.4
8.5
6.2
0
5
10
15
20
25
CET12020
CET12023
Adverse
% %
5
10
15
20
25
30
35
40
Jan-20 Jun-20 Nov-20 Apr-21 Sep-21

BANCO DE ESPAÑA 18 FINANCIAL STABILITY REPORT. AUTUMN 2021 THE STABILITY OF THE SPANISH FINANCIAL SYSTEM: MAIN VULNERABILITIES AND RISKS
a fall in asset prices and a tightening of financial conditions (with an
increase in the currently very low maturity premia, in particular) may be
triggered if monetary stimulus is withdrawn at a faster rate than the financial
markets expect. These adverse developments could also occur if investors’
expectations of future economic developments or the solvency of certain
segments of the corporate sector deteriorate. This process may spread to
other assets and geographical areas given the close interconnections
between markets and financial intermediaries.
— R2. Downside risks to economic growth continue to be present,
althoughthebaselinescenario ismorefavourablethan inprevious
quarters. The progress made with vaccination programmes in 2021 has
strengthened the confidence of economic agents. At the same time,
economic policy measures have continued to prove their effectiveness in
averting the less favourable growth scenarios that the pandemic could
have given rise to. That said, downside risks - albeit more contained -
remain. These are linked to adverse developments in the health situation,
which might require the introduction of restrictions on certain activities.
Also, the risks to activity are now skewed downwards as a result of the
SOURCES: IHS Markit, Refinitiv Datastream and Banco de España.
a Risk premia are obtained from a decomposition of 10-year interest rates into term risk premia and expectations about short-term interest rates. Expectations are obtained by predicting the instantaneous short-term interest rates using an ARFIMA model on each of the components of the yield curve (long-term level, slope and curvature) estimated daily. Once the short-term rate expectations are obtained, the premia can be had taking the difference between 10-year rates and short rate expectations. The historical averages of the term premia are calculated for the period 2003-2021.
b The historical average real 10-year interest rate in the euro area and the United States is calculated for the period 2004-2021. Until July 2008 in the euro area and June 2007 in the United States data are used for indexed bonds in France and the United States. After those dates, the real interest rates are calculated in the euro area as the difference between the 10-year overnight indexed swap rate and the compensation for inflation with the same term and in the Uinited States as the difference between the 10-year government bond and the compensation for inflation with the same term.
GERMANY UNITED STATES
7 DEVIATION OF THE TERM RISK PREMIUM IN THE INTEREST RATE ON 10-YEAR PUBLIC DEBT FROM ITS HISTORICAL AVERAGE (L-H PANEL) (a) AND 10-YEAR REAL INTEREST RATE (R-H PANEL) (b)
pp
EURO AREA
EURO AREA. HISTORICAL AVERAGE
UNITED STATES
UNITED STATES. HISTORICAL AVERAGE
%
EURO AREA UNITED STATES UNITED KINGDOM
JAPAN
Index
8 MANUFACTURING PMI: SPEED IN SUPPLIER DELIVERY TIMES
FUENTES: Bloomberg,
-3.0
-2.5
-2.0
-1.5
-1.0
-0.5
0.0
Jan-20Jun-20Nov-20Apr-21Sep-21-2.0
-1.5
-1.0
-0.5
0.0
0.5
1.0
Jan-20Jun-20Nov-20Apr-21Sep-2115
20
25
30
35
40
45
50
55
Jun-19 Sep-19Dec-19 Mar-20 Jun-20 Sep-20Dec-20 Mar-21 Jun-21 Sep-21
Longerdelivery times
BANCO DE ESPAÑA 19 FINANCIAL STABILITY REPORT. AUTUMN 2021 THE STABILITY OF THE SPANISH FINANCIAL SYSTEM: MAIN VULNERABILITIES AND RISKS
sharp increase in the price of energy and the emergence of global
production chain bottlenecks (see Chart 8). This is leading to increases in
inflation that erode agents’ purchasing power and, consequently, the
incipient reactivation of activity. In addition, if these factors that temporarily
raise inflation were to be prolonged over time, they could end up raising
the medium-term inflation expectations of the agents, and they may
contribute to a tightening of financing conditions in the short term, and
dampen further the potential for economic recovery (see Chart 9). A slowing
of the recovery would have a negative effect on the quality of credit to
households and firms, especially in the most vulnerable sectors. These
may see an increase in non-performing loans even amid a general recovery,
if this is asymmetric and fails to reach the hardest-hit sectors. Economic
activity faces greater risks in the emerging economies; the ability of
economic policy to react to shocks to activity is limited by the stronger
inflationary pressures in these economies and they are exposed to a
tightening of financing conditions as a result of the normalisation of
monetary policy in the advanced economies.
SOURCES: Instituto Nacional de Estadístico and Banco de España.
a The shaded areas show two periods of financial crisis identified in Spain since 2009. These correspond to a period of systemic banking crisis (the last crisis: 2009 Q1-2013 Q4) and the crisis caused by COVID-19 (2020 Q1-2021 Q2).
b The output gap is the percentage difference between actual GDP and its potential value. Values calculated at constant 2010 prices. See Cuadrado, P. and Moral-Benito, E. (2016), Potential growth of the Spanish economy, Occasional Paper No 1603, Banco de España. The credit-to-GDP gap is calculated as the difference in percentage points between the actual ratio and its long-term trend, calculated by applying a one-sided Hodrick-Prescott filter with a smoothing parameter equal to 25,000. This parameter is calibrated to fit the financial cycles observed in the past in Spain (see Galán, J.E. (2019), Measuring credit-to- GDP gaps. The Hodrick-Prescott filter revisited, Occasional Paper No 1906, Banco de España). Data available to June 2021. The broken red horizontal line represents the reference CCyB activation threshold of 2 pp for the credit-to-GDP gap.
c Each point in the chart coresponds to a sector of business activity in accordance with the NACE Rev.2 classification and represents the difference of the average PD (weighted by the number of borrowers) for this sector over a three-year horizon between a baseline trend scenario without the application of measures and adverse scenarios resulting from different extensions of the CO2 Emissions Trading Scheme. See Box 3.1 for further details.
d This adverse scenario considers an increase in the price of CO2 emission allowances from €25 to €100.e This adverse scenario considers the combination of the scenario described in (d) with an extension of the requirement for allowances to more productive
sectors and to households.
0.0
0.1
0.2
0.3
0.4
0.5
0,6
0.7
0.8
0.9
-9 -8 -7 -6 -5 -4 -3 -2 -1 0
INCREASE IN EMISSION PRICES (d)
10 EFFECT OF THE TRANSITION COSTS ON CREDIT IMPAIRMENT PROBABILITIES (PD) (c)
Diff
eren
ces
in a
vera
ge P
Ds
rela
tive
toba
selin
e sc
enar
io (p
p)
0.0
0.1
0.2
0.3
0.4
0.5
0.6
0.7
0.8
0.9
-9 -8 -7 -6 -5 -4 -3 -2 -1 0
COMBINATION WITH EXTENSIONTO HOUSEHOLDS (e)
Differences in the average rates of change of GVA relative to the baseline scenario (pp)
-35
-25
-15
-5
5
15
25
-14
-12
-10
-8
-6
-4
-2
0
2
4
6
8
10
99 01 04 07 10 12 15 18 21
9 CREDIT-TO-GDP GAP AND OUTPUT GAP (a) (b)
OUTPUT GAP (L-H AXIS) CREDIT-TO-GDP GAP
pp pp
BANCO DE ESPAÑA 20 FINANCIAL STABILITY REPORT. AUTUMN 2021 THE STABILITY OF THE SPANISH FINANCIAL SYSTEM: MAIN VULNERABILITIES AND RISKS
Precisely tunedmonetary and fiscal policies continue to be essential for the
recoveryineconomicgrowthtofirm. The expansionary stance of these policies still
needs to be maintained in the short term since, although financial stability risks and
vulnerabilities stemming from the pandemic have moderated in recent months, they
continue to be high. A flexible approach adapted to changes in the economic situation
and risk profile also needs to be maintained, avoiding a premature withdrawal of the
stimulus before the recovery firms.
Developmentsininflationexpectationsandtherateofrecoveryofactivitywill
bedecisiveinthepositioningofmonetarypolicy. Monetary policy is expected to
be less accommodative in the coming months, in particular as a result of the winding
down of asset purchase programmes in Europe and the United States. However, the
baseline scenario continues to assume that the increase in inflation will be temporary,
so that the rate of policy tightening is not expected to accelerate.
Fiscalpolicymustremainexpansionaryintheshort-term,butamedium-term
fiscal consolidation programme to contain and reduce the vulnerabilities
associated with high public debt needs to be drawn up. The fiscal policy
measures deployed during the crisis need to be increasingly selective and focused
on the economic sectors and population segments for which the recovery is proving
to be slowest. In addition, an ambitious structural reform programme to boost the
potential growth of the Spanish economy would also contribute to this objective and
mitigate the other risks considered. Effective application of the Next Generation EU
(NGEU) funds would help to reconcile these two aims.
IntheabsenceofsignsofsystemicfinancialimbalancesbuildingupinSpain,
alooseprudentialpolicy,withouttheactivationofmacroprudentialtools, is
also advisable. It should be noted that, in spite of the support measures adopted,
the pre-pandemic levels of activity have still not been recovered. Key indicators of
financial imbalances, such as the credit-to-GDP gap, are still dominated by the
sudden fall in output in Spain in 2020 and their high level should not be interpreted
as signalling a build-up of risk (see Chart 9). The negative output gap has begun to
close and, in line with the expectations for recovery, a significant reduction is
expected by the end of next year. In any event, the reduction of output and credit
gaps is subject to downside activity risks and also to the vulnerability of certain
segments of households and firms, so that continuous monitoring is needed for
early detection of signs of risk.
In someEuropean countriesmacroprudential policy tightening has already
begun,mainlyasaresultofwarningsignalsintheirpropertymarkets. In Spain,
the real estate cycle does not appear to be as advanced. At aggregate level, housing
is not showing signs of overvaluation; new mortgage credit is growing strongly in
2021, but from very low levels, without a significant increase in the stock or any
loosening of credit standards. However, if the expansionary trend in real estate

BANCO DE ESPAÑA 21 FINANCIAL STABILITY REPORT. AUTUMN 2021 THE STABILITY OF THE SPANISH FINANCIAL SYSTEM: MAIN VULNERABILITIES AND RISKS
intensifies, this risk diagnosis will need to be reassessed. In this respect, the reform
of Circular 2/2016 will provide new macroprudential tools to address with a more
effective and focused approach the potential build-up of risks in the future.
Other more long-term risks must also continue to be taken into account,
includingthoseoffinancialdigitalisationandclimatechange. Digitalisation is
not only generating new financial products and changing the way in which the
markets that trade them are organised, but also making the financial system more
vulnerable to cybernetic risks. Climate change may also have important financial
stability effects, through the materialisation of both physical and transition risks. In
the case of the latter, the estimated impact on bank solvency is still moderate, but
adds to the pressure of the low bank profitability. At the same time, the materialisation
of physical risks would potentially have a very significant long-term economic impact,
which would exceed the impact of the transition costs. Thus, according to this
analysis, the action required to achieve an environmentally sustainable productive
model that does not contribute to the materialisation of climate change should be
taken without delay.

BANCO DE ESPAÑA 22 FINANCIAL STABILITY REPORT. AUTUMN 2021 THE STABILITY OF THE SPANISH FINANCIAL SYSTEM: MAIN VULNERABILITIES AND RISKS

1RISKS LINKED TO THE MACRO-FINANCIAL ENVIRONMENT

BANCO DE ESPAÑA 24 FINANCIAL STABILITY REPORT. AUTUMN 2021 1. RISKS LINKED TO THE MACRO-FINANCIAL ENVIRONMENT

BANCO DE ESPAÑA 25 FINANCIAL STABILITY REPORT. AUTUMN 2021 1. RISKS LINKED TO THE MACRO-FINANCIAL ENVIRONMENT
The headway made in global vaccination is helping to reduce restrictions on
activity, despite some heterogeneity by geographical area. This has translated into
a relatively widespread economic recovery. It is also reflecting in lower uncertainty,
a favourable macroeconomic outlook in the medium and long term and an
improvement in the non-financial sectors’ financial position. However, certain
segments continue to show greater financial vulnerability than before the COVID-19
crisis. At the same time, risks linked to the adverse unfolding of the pandemic, to
the recent disruptions in the global production chains and to a sharper and more
persistent than expected increase in inflation, which could lead to a faster
withdrawal of monetary stimuli than anticipated by the financial markets, persist.
The materialisation of these risks might trigger abrupt asset price corrections in
the international markets, adversely impacting economic growth and financial
intermediaries’ credit risk. Greater buoyancy in demand and prices has also been
observed in the Spanish real estate market, but the risks to financial stability
appear to be contained for the time being.
1.1 Macroeconomic environment
1.1.1 Systemic and materially significant countries
Globaleconomicactivityhascontinuedtorecover in2021,albeitatamore
moderate pace in recent months. Against a backdrop of the spread of the
COVID-19 Delta variant, activity patterns in advanced and emerging market
economies have tended to diverge (see Chart 1.1.1), in good measure owing to the
uneven levels of vaccination and to the differences in economic policy support.1
Also, the appearance of bottlenecks in the global supply chains, prompted among
other factors by the rapid recovery in demand in advanced countries and by rising
commodity and transport prices, is affecting production, particularly in the
manufacturing sector (see Chart 1.1.2).2
The recovery of activity has been accompanied globally by considerable
inflation rate hikes (see Chart 1.1.3). These increases arise from various
idiosyncratic factors which are, in principle, temporary. They include the base effects
1 See QuarterlyreportontheSpanisheconomy2021Q3, Economic Bulletin.
2 See Box 3 “Euro area manufacturing bottlenecks”, Quarterly report on the Spanish economy 2021 Q3,Economic Bulletin.
1 RISKS LINKED TO THE MACRO-FINANCIAL ENVIRONMENT
BANCO DE ESPAÑA 26 FINANCIAL STABILITY REPORT. AUTUMN 2021 1. RISKS LINKED TO THE MACRO-FINANCIAL ENVIRONMENT
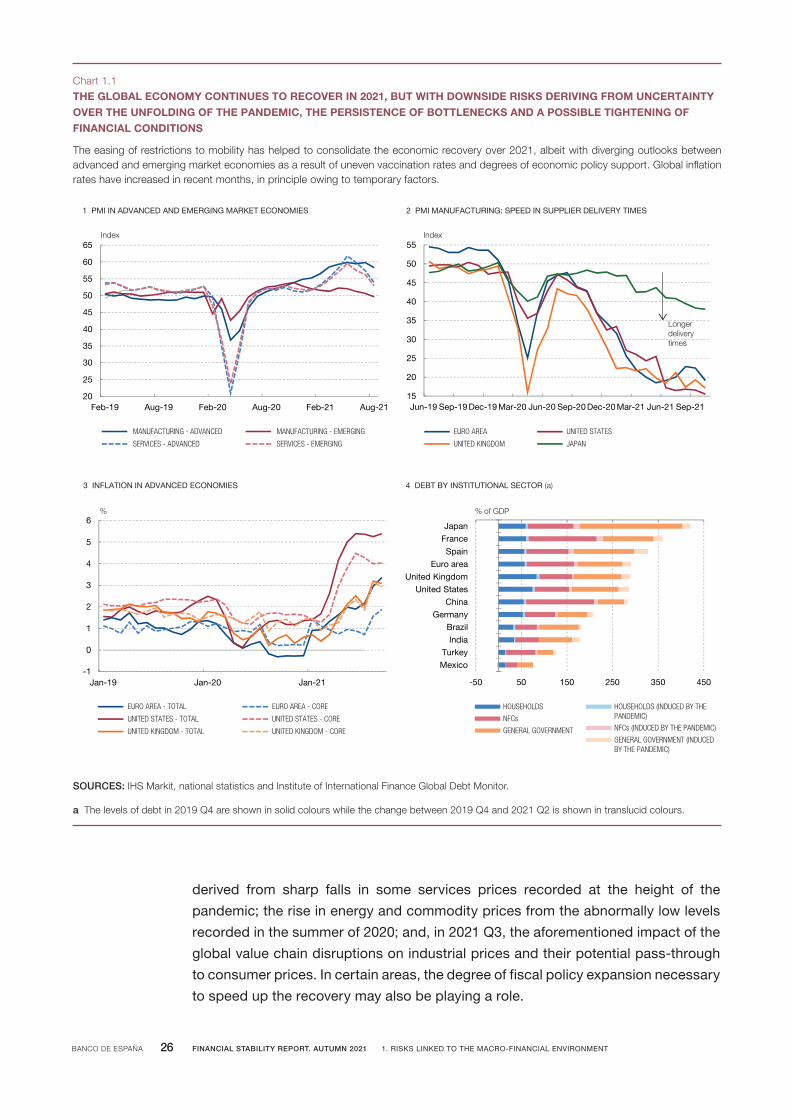
derived from sharp falls in some services prices recorded at the height of the
pandemic; the rise in energy and commodity prices from the abnormally low levels
recorded in the summer of 2020; and, in 2021 Q3, the aforementioned impact of the
global value chain disruptions on industrial prices and their potential pass-through
to consumer prices. In certain areas, the degree of fiscal policy expansion necessary
to speed up the recovery may also be playing a role.
The easing of restrictions to mobility has helped to consolidate the economic recovery over 2021, albeit with diverging outlooks between advanced and emerging market economies as a result of uneven vaccination rates and degrees of economic policy support. Global inflation rates have increased in recent months, in principle owing to temporary factors.
THE GLOBAL ECONOMY CONTINUES TO RECOVER IN 2021, BUT WITH DOWNSIDE RISKS DERIVING FROM UNCERTAINTYOVER THE UNFOLDING OF THE PANDEMIC, THE PERSISTENCE OF BOTTLENECKS AND A POSSIBLE TIGHTENING OFFINANCIAL CONDITIONS
Chart 1.1
SOURCES: IHS Markit, national statistics and Institute of International Finance Global Debt Monitor.
a The levels of debt in 2019 Q4 are shown in solid colours while the change between 2019 Q4 and 2021 Q2 is shown in translucid colours.
20
25
30
35
40
45
50
55
60
65
Feb-19 Aug-19 Feb-20 Aug-20 Feb-21 Aug-21
MANUFACTURING - ADVANCED MANUFACTURING - EMERGING
SERVICES - ADVANCED SERVICES - EMERGING
1 PMI IN ADVANCED AND EMERGING MARKET ECONOMIES
Index
15
20
25
30
35
40
45
50
55
Jun-19 Sep-19 Dec-19 Mar-20 Jun-20 Sep-20 Dec-20 Mar-21 Jun-21 Sep-21
EURO AREA UNITED STATES
UNITED KINGDOM JAPAN
Index
2 PMI MANUFACTURING: SPEED IN SUPPLIER DELIVERY TIMES
Longerdelivery times
JapanFranceSpain
Euro areaUnited Kingdom
United StatesChina
GermanyBrazilIndia
TurkeyMexico
-50 50 150 250 350 450
HOUSEHOLDS HOUSEHOLDS (INDUCED BY THE PANDEMIC)NFCsNFCs (INDUCED BY THE PANDEMIC)GENERAL GOVERNMENTGENERAL GOVERNMENT (INDUCED BY THE PANDEMIC)
4 DEBT BY INSTITUTIONAL SECTOR (a)
% of GDP
-1
0
1
2
3
4
5
6
Jan-19 Jan-20 Jan-21
EURO AREA - TOTAL EURO AREA - CORE
UNITED STATES - TOTAL UNITED STATES - CORE
UNITED KINGDOM - TOTAL UNITED KINGDOM - CORE
3 INFLATION IN ADVANCED ECONOMIES
%
BANCO DE ESPAÑA 27 FINANCIAL STABILITY REPORT. AUTUMN 2021 1. RISKS LINKED TO THE MACRO-FINANCIAL ENVIRONMENT
Thecurrentmedium-termprospectsofconsolidationoftheglobaleconomic
recoveryanda return tomoderate inflation ratesare subject to significant
uncertainties. The progressive resolution of the global health crisis, on which the
outlook of ongoing improvement in activity is based, is not guaranteed. The main
risks include the slow pace of vaccination outside the main advanced economies
and the possible spread of new, more resistant and infectious variants of the virus.
Despite the prevalence of negative output gaps, the sectoral mismatches that are
arising between a buoyant demand and a supply that is slower to respond to the
recovery, owing to the appearance of bottlenecks causing recent increases in certain
prices, may be more persistent than expected. This could lead to second-round
effects and to core inflationary pressures as a result of the de-anchoring of inflation
expectations, particularly in economies with a low level of monetary policy credibility.
Despite the favourable expectations for internal demand, especially in the
advanced economies, the recovery continues to depend on the adequate
calibrationofmonetaryandfiscalpolicystimuli. A premature withdrawal of such
support may have highly adverse consequences. Thus, a faster and more intense
normalisation of monetary policy than expected, particularly in the United States,
might lead to abrupt corrections in asset prices. These corrections would bring
about adverse effects on global financial conditions and activity in a setting of high
vulnerability owing to the significant increase in public and private debt in many
countries (see Chart 1.1.4). Likewise, an early withdrawal of fiscal stimuli in other
areas, owing to possible political or market pressures, could lead to a reassessment
of expectations regarding the repayment capacity of the most heavily indebted
private agents, particularly non-financial corporations. The recent liquidity difficulties
and the possible insolvency of China’s main real estate company, Evergrande, which
had resorted heavily to external financing over the last five years, illustrates the types
of risks generated by the above-mentioned increase in indebtedness. In the
hypothetical case that these problems were to extend to the rest of the real estate
sector or to the Chinese financial system, there would be severe consequences for
growth in China, with contagion effects for the rest of the world.
Financial conditions have tightened somewhat in the emerging market
economies,althoughtheycontinuetobegloballyfavourable.The increase in
inflation has led to the start of a cycle of policy interest rate hikes in many countries
in Latin America3 and Eastern Europe, to avoid possible second-round effects and a
de-anchoring of inflation expectations (see Chart 1.2.1). Also, economies with greater
fiscal vulnerabilities, or those recording episodes of social and political tension, have
observed an increase in local-currency long-term interest rates, a depreciation of
their currencies against the dollar and an increase in the external sovereign debt
3 See the ReportontheLatinAmericaneconomy.Secondhalfof2021.Outlook,vulnerabilitiesandpolicyspace, October 2021.

BANCO DE ESPAÑA 28 FINANCIAL STABILITY REPORT. AUTUMN 2021 1. RISKS LINKED TO THE MACRO-FINANCIAL ENVIRONMENT
yield spreads. Also, the total or partial withdrawal of credit support plans in most of
these economies has prompted a marked slowdown in bank lending, with possible
adverse effects on the activity of these material countries for the Spanish banking
system (see Chart 1.2.2).
A potential deterioration of the growth outlook in light of an unfavourable
unfoldingofthehealthsituationmightnegativelyaffectthefinancialmarkets
oftheseeconomiesandtightentheirfinancialconditions,aseconomicpolicies
wouldhavelessroomformanoeuvre.They might also be particularly affected in
the event that the monetary policy stance in the advanced economies tightened
more than expected or if national monetary policies had to face persistent inflationary
or exchange rate pressures. The following can be noted in regard to the main
emerging market countries with Spanish banking exposures:
In Mexico, the economy continued to recover during 2021 H1. However, there is a
high degree of unevenness between the performance of services, supported by the
progress made in the vaccination process, and the manufacturing sector, affected
by global supply chain problems. The Mexican economy is exposed to risks similar
to those of other emerging market economies, although it is more closely linked to
the performance of the US economy. On the positive side, it has buffers against
shocks, such as the swap line with the Federal Reserve and the flexible credit line
Emerging market economies' central banks have started to tighten their monetary policies and are expected to continue doing so over the next twelve months, as credit growth moderates in light of the total or partial withdrawal of public credit support plans in most of these economies.
HIGHER INFLATION EXPECTATIONS EXERT UPWARD PRESSURE ON INTEREST RATES IN THE EMERGING MARKET ECONOMIES, WHILE CREDIT LOSES MOMENTUM
Chart 1.2
SOURCES: Refinitiv and national statistics.
0
1
2
3
4
5
6
7
8
9
10
RU
S
BR
A
ME
X
IND
ZA
F
IDN
CH
L
PH
L
CO
L
MY
S
HU
N
RO
U
PE
R
CZ
E
KO
R
PO
L
THA
ISR
JANUARY 2021 OCTOBER 2021
LEVEL EXPECTED AT 12 MONTHS
Index
1 POLICY INTEREST RATES IN EMERGING MARKET ECONOMIES
-20
-15-10
-5
05
10
1520
25
3035
Jan-15 Jan-16 Jan-17 Jan-18 Jan-19 Jan-20 Jan-21
BRAZIL MEXICO TURKEY
2 RATE OF CHANGE IN CREDIT TO THE PRIVATE SECTOR
% y-o-y
BANCO DE ESPAÑA 29 FINANCIAL STABILITY REPORT. AUTUMN 2021 1. RISKS LINKED TO THE MACRO-FINANCIAL ENVIRONMENT
with the International Monetary Fund. However, political uncertainty in the domestic
and international fronts might negatively affect investment, which has been sluggish
in recent years.4
In Brazil GDP growth stagnated in Q2, after a surprising rise in Q1. The country
continues to accumulate imbalances in fiscal territory. Public debt is close to 90% of
GDP and largely financed at interest rates linked to inflation or to the policy interest
rate, which share a very pronounced upward trend. In addition, this debt is mostly
acquired by domestic banks or their investment funds, which raises the sovereign-
bank nexus risk. Against this backdrop, the fiscal adjustment envisaged is subject to
significant uncertainties. Political tensions have also increased significantly, and
they are not expected to weaken in the short term in view of next year’s presidential
elections. Indeed, Brazil’s financial markets have performed relatively worse, feeding
back into fiscal vulnerabilities.
In Turkey, in 2021 H1 the economy continued to show significant buoyancy and
notable imbalances which, however, have moderated with the gradual withdrawal
of some stimulus measures such as the credit support. Bank lending slowed
notably, with the exception of consumer loans, which maintained a strong growth
rate. Although still significant, the current account deficit has decreased.
Nonetheless, inflation has rebounded, standing at 19.6% year-on-year in
September. Against a backdrop of sizeable external financing needs and very low
international reserves, the Turkish economy’s biggest risk is the loss of confidence
from the financial markets. This could be the result of reductions in policy interest
rates, as occurred in September and October, that may prove to be early or greater
than that discounted by investors.
1.1.2 Spain
The baseline projections for the Spanish economy envisage, for the short
term,acontinuedrecovery,favouredbytheheadwaymadeinthevaccination
campaign,theconsequentliftingofthepandemiccontainmentmeasuresand
theeconomicpolicysupport. This would help to recover the pre-health crisis level
of activity over the horizon considered in the Banco de España’s most recent
projections, which cover up to 20235 (see Chart 1.3.1). Activity would grow more
during the first half of the projection period, boosted by the epidemiological
improvement and by the implementation of NGEU programme projects.
4 An example of external tensions in the case of Mexico is the application of the U.S.-Mexico-Canada tradeagreement(USMCA)rules,whichwerewordedambiguouslyandleaveroomfordifferentinterpretations.Inrecentmonths,divergenceshavearisenbetweentheUnitedStatesandtheothertreatymemberswhichmightparticularlyaffecttheMexicanautomotivesector.
5 SeeBox1“MacroeconomicprojectionsfortheSpanisheconomy(2021-2023)”,QuarterlyreportontheSpanisheconomy, September 2021.

BANCO DE ESPAÑA 30 FINANCIAL STABILITY REPORT. AUTUMN 2021 1. RISKS LINKED TO THE MACRO-FINANCIAL ENVIRONMENT
Uncertainty regarding theSpanisheconomy’sgrowthpathhasdeclined, in
line with the recent improvements in the health and economic situation. Recent
favourable epidemiological and economic developments in Spain have helped to
reduce uncertainty over economic growth in the short and medium terms, in line
with the behaviour observed in other advanced economies (see Chart 1.3.2).
YetdevelopmentsintheSpanisheconomyareinfluencedbyseveralfactors,
includingthepossibilityofgreaterpersistenceofdisruptionstoglobalvalue
chainsandincreasinginflation. First, if the supply problems recently observed in
the global production chains ultimately weigh down on economic activity worldwide
markedly and persistently, certain industrial sectors in Spain will be affected more
durably. Another downside risk to activity, which has recently grown stronger, is the
possibility of an increase in commodities and intermediate goods prices that is less
temporary than currently assumed, with the consequent compression of households’
and firms’ income in real terms. This greater persistence could lead to the transfer of
cost increases to final prices and wage demands, resulting in a more pronounced
and long-lasting rise in inflation than that anticipated at this point in time.
The projections for the Spanish economy envisage high buoyancy in activity in 2021 and 2022, underpinned by the normalisation of economic relations and the maintenance of economic policy support. The pre-COVID-19 level of activity would recover over the forecast horizon, which covers up to 2023. The most significant downside risks include the potential negative effect of bottlenecks in the global production chains and a more persistent inflation increase than currently expected. Some uncertainty persists, although less than in previous quarters, over the health situation, which affects certain sectors in particular (e.g. accommodation and food service activities).
THE BASELINE FORECASTS FOR THE SPANISH ECONOMY ENVISAGE HIGH DYNAMISM AT SHORT TERM, ALTHOUGHCERTAIN ECONOMIC AND HEALTH RISKS PERSIST
Chart 1.3
SOURCES: Instituto Nacional de Estadistico and Banco de España.
a The Banco de España’s September 2021 macroeconomic projections are shown. Their cut-off date was 14 September 2021 and they included the data available to that date, specifically the GDP flash estimate for 2021 Q2. Subsequently, the INE has published new data, which include the revision of Q2 and previous quarters and the flash estimate for 2021 Q3.
b See C. Ghirelli et al. (2021), "Measuring economic and economic policy uncertainty and their macroeconomic effects: the case of Spain", Empirical Economics. A decline in this indicator, constructed on the basis of the standard deviation of forecasters' projections of changes in GDP for 2021 and 2022, reflects greater certainty over the behaviour of this macroeconomic aggregate over this period.
0.0
0.1
0.2
0.3
0.4
0.5
0.6
0.7
0.8
0.9
1.0
Jan-19 May-19 Sep-19 Jan-20 May-20 Sep-20 Jan-21 May-21 Sep-21
2 INDICATOR OF DISAGREEMENT OVER GDP EXPERT FORECASTS FOR 2021 AND 2022 (b)
75
80
85
90
95
100
105
Q4 Q1 Q2 Q3 Q4 Q1 Q2 Q3 Q4 Q1 Q2 Q3 Q4 Q1 Q2 Q3 Q4
2019 2020 2021 2022 2023
SEPTEMBER FORECAST REVISED
1 REAL GDP IN SPAIN. LEVEL (a)(100 = 2019 Q4)

BANCO DE ESPAÑA 31 FINANCIAL STABILITY REPORT. AUTUMN 2021 1. RISKS LINKED TO THE MACRO-FINANCIAL ENVIRONMENT
Certaindownsiderisksrelatedtotheunfoldingofthepandemicanditsimpact
oneconomicactivityalsopersist.These downside risks are related to the spread
of new COVID-19 variants potentially more resistant to vaccines, which could lead to
reinstating restrictions to mobility. They may also be related to the more persistent
effects of the crisis on the business sector and employment. By contrast, if the
health situation improves faster than forecast, economic growth might also gain
momentum, mainly owing to a more pronounced freeing up by households of the
stock of savings generated during the pandemic or to an early reactivation of
spending by foreign tourists.
1.2 Financial markets and the real estate sector
1.2.1 Financial markets
The stock market indices in the main developed economies have tended to
appreciateoverthelastfewmonths.This was underpinned by the progress made
in the vaccination campaign, the maintenance of an accommodative monetary policy
stance and better corporate earnings than anticipated by the markets. However,
some episodes of stock market price corrections have also been observed, mainly
linked to fears regarding the impact of the spread of the COVID-19 Delta variant on
economic growth, to the fear of a contagion effect of the Chinese Evergrande real
estate crisis and to investor concerns about inflationary pressures possibly leading
to the withdrawal of monetary stimuli earlier than envisaged. The S&P 500 index
reached new all-time highs, accumulating a gain of 8.7% at the cut-off date for this
report with respect to the levels at end-April. In the same period the EURO STOXX 50
appreciated by 5.4%, while the IBEX 35 rose less (1.0%), affected by the negative
impact of the spread of the pandemic in Spain over the summer in the sectors most
exposed to it, such as leisure and tourism (see Chart 1.4.1).
Thelong-termyieldsofhigher-ratedsovereignbondsfellbetweenApriland
end-August and have rebounded since then, while sovereign and corporate
risk premia have remained at low levels. The increase in long-term risk-free
interest rates in recent months is linked to the rise in the upside medium-term
inflation risks perceived by the financial markets. Following these movements, the
long-term yields of higher-rated sovereign bonds stand at levels close to or even
above (in the case of the UK and German benchmarks) those seen in Spring and
much higher than posted at the start of the year (see Chart 1.4.2). The estimates
available also point to an increase in term premia in recent months, although they
currently remain well below their historical averages (see Chart 1.4.3). Also, since
August long-term real interest rates have risen less than nominal interest rates
(United States) or have even continued to fall in certain areas (the euro area), reaching
highly negative levels (close to their all-time lows). This very low level of long-term

BANCO DE ESPAÑA 32 FINANCIAL STABILITY REPORT. AUTUMN 2021 1. RISKS LINKED TO THE MACRO-FINANCIAL ENVIRONMENT
Positive corporate earnings and an accomodative monetary policy stance have supported the rise in stock market indices in international markets, although they have also been affected by one-off corrections. Long-term sovereign bond yields decreased between April and August and have rebounded thereafter, conditioned by the increase in the upside medium-term inflation risks perceived by the financial markets. Following these movements, these yields stand at levels much higher than at the beginning of the year. Despite these developments, term premia and long-term real interest rates remain at very low levels from a historical perspective. Euro area sovereign risk premia and non-financial corporations' bond premia have remained at low levels, supported by the continuation of accommodative monetary conditions and lower concern for credit risks.
STOCK MARKET INDICES HAVE RISEN, SOVEREIGN DEBT YIELDS HAVE INCREASED SINCE AUGUST AND SOVEREIGNAND CORPORATE RISK PREMIA HAVE REMAINED AT LOW LEVELS
Chart 1.4
SOURCES: Refinitiv Datastream and Banco de España.
a Term risk premia are obtained from a decomposition of 10-year interest rates into risk premia by term and expectations of short-term interest rate changes. The expectations are obtained by forecasting the future short-term instantaneous interest rate using an ARFIMA model on each of the interest rate curve components (long-term level, slope and curvature) estimated daily. Once the short-term interest rate change expectations are obtained, the premium is obtained as the difference between the 10-year rates and the short-term rate expectations. The historical averages of the term premia are calculated between 2003 and 2021.
b The historical average of the 10-year real interest rate in the euro area and the United States is calculated between 2004 and 2021. Until July 2008 in the euro area and June 2007 in the United States the data on French and US inflation-linked bonds are used. Thereafter, real interest rates are calculated in the euro area as the difference between the 10-year overnight indexed swap and the 10-year inflation compensation and in the United States as the difference between the 10-year government bond and the 10-year inflation compensation.
c High yield: ICE Bank of America Merrill Lynch Non-Financial High Yield Index. Investment grade: ICE Bank of America Merrill Lynch Non-Financial Index. Deviations are calculated relative to the historical average between 1998 and 2021.
-3.0
-2.5
-2.0
-1.5
-1.0
-0.5
0.0
Jan-20 Jun-20 Nov-20 Apr-21 Sep-21
GERMANY
UNITED STATES
3 DEVIATION FROM THE HISTORICAL AVERAGE OF THE TERM RISK PREMIUM IN THE 10-YEAR GOVERNMENT BOND INTEREST RATE (LEFT) (a) AND THE 10-YEAR REAL INTEREST RATE (RIGHT) (b)
pp
40
60
80
100
120
140
160
Jan-20 Jun-20 Nov-20 Apr-21 Sep-21
EUROSTOXX 50 S&P 500 IBEX 35 FTSE 250
1 STOCK MARKET INDICES
31/12/2019 = 100
-2.0
-1.5
-1.0
-0.5
0.0
0.5
1.0
Jan-20 Jun-20 Nov-20 Apr-21 Sep-21
%
-1.0
-0.5
0.0
0.5
1.0
1.5
2.0
Jan-20 Jun-20 Nov-20 Apr-21 Sep-21
UNITED STATES GERMANY UNITED KINGDOM
JAPAN
2 10-YEAR SOVEREIGN BOND YIELDS
%
-50
50
150
250
350
450
550
650
-250
-150
-50
50
150
250
350
450
Jan-20Jun-20Nov-20Apr-21Sep-21
4 DEVIATIONS FROM THE HISTORICAL AVERAGE OF NON-FINANCIALCORPORATIONS' BOND SPREADS RELATIVE TO THE SWAP CURVE (LEFT) (c) AND THE 10-YEAR GOVERNMENT BOND SPREAD AGAINST GERMANY (RIGHT)
pbpb
0
50
100
150
200
250
300
Jan-20 Jun-20Nov-20Apr-21 Sep-21
ITALY
FRANCE
PORTUGAL
SPAIN
bp
EURO AREA
EURO AREA HISTORICAL AVERAGE
UNITED STATES
US HISTORICAL AVERAGE
EURO AREA HIGH YIELD
US HIGH YIELD
EURO AREA INVESTMENT GRADE(right-hand scale)
US INVESTMENT GRADE(right-hand scale)

BANCO DE ESPAÑA 33 FINANCIAL STABILITY REPORT. AUTUMN 2021 1. RISKS LINKED TO THE MACRO-FINANCIAL ENVIRONMENT
risk-free real interest rates appears to be linked to various structural factors
(demographic factors, low productivity growth, greater inequality, high demand for
safe assets, etc.) and to other more conjunctural factors, such as, in particular,
central banks’ asset purchase programmes. This factor has continued contributing
to euro area sovereign risk and non-financial corporations bond premia remaining at
low levels (see Chart 1.4.4). The latter, except in the high yield segment in the euro
area, have even declined in recent months, currently standing below their historical
average. This might be due to lower market concern for non-financial corporations’
credit risks, which would be in line with the more favourable performance of defaults
and the positive balance between upward and downward credit rating revisions in
recent months. However, around one third of the outstanding balance of debt
issuances in the euro area with BBB rating continues to have a negative outlook. Box
1.1 analyses in depth the factors determining sovereign debt long-term interest rates
in Europe and the United States.
Apotentialearlierthanexpectedwithdrawalbythemarketsofcentralbanks’
monetary stimuli might raise long-term risk-free interest rates further and
trigger corrections in asset prices. This scenario could materialise, for example,
if the rise in inflation observed in the advanced economies were more persistent
than anticipated. The possible increase in yields could be transferred more intensely
to corporate bonds, since their risk premia are abnormally low according to their
historical relationship with their usual determinants, such as enterprise value and
uncertainty over enterprise value, leveraging and risk aversion (see Chart 1.5.1). This
seems to be related to the persistence of very accommodative monetary conditions.6
In the stock markets, although risk premia do not appear to have been so influenced
by expansionary monetary policies and are currently above their historical average,
these developments could lead to a fall in share prices. In fact, their current high
level, compared with firms’ earnings, seems to be largely due to low long-term real
interest rates (see Chart 1.5.2). In any event, the impact of an increase in long-term
interest rates on the price of risk-bearing assets would probably be cushioned if this
movement were accompanied by an improvement in the macroeconomic outlook,
given the beneficial effect this would have on the economic and financial position of
the issuers of these assets.
Underthishypotheticalcorrectionscenario,therewouldalsobeatightening
offinancingconditionswithpossibleadverseimplicationsforcreditrisk.First,
this shock could reduce economic agents’ spending, negatively affecting economic
growth. Second, in this scenario, indebted agents’ financial burden would tend to
increase, although the speed and intensity of this effect would depend on the structure
of their liabilities and on how interest rates evolve over the different maturities.
6 Forfurtherdetails,seeBox1.1oftheFinancial Stability Report Spring 2021 andJ.M.GálvezandI.Roibás(2021),“Assetpricemisalignmentsinfinancialmarkets:anempiricalanalysis”,WorkingPaper,BancodeEspaña(forthcoming).

BANCO DE ESPAÑA 34 FINANCIAL STABILITY REPORT. AUTUMN 2021 1. RISKS LINKED TO THE MACRO-FINANCIAL ENVIRONMENT
Apotentialworseningof themacroeconomicoutlookoran increase in the
uncertaintysurrounding itmightalso triggerpricecorrections incorporate
bonds and shares in the international markets. This scenario might arise, for
instance, if the risks described in the previous section were to materialise. This
would translate into a reduction in the expected future path of firms’ earnings or
greater uncertainty about said path, which would adversely affect the value of shares
through its negative impact on shareholder remuneration. Corporate bond prices
would be affected to the extent that this situation causes risk premia to rise through
an increase in perceived credit risks or lower investor tolerance thereto.
1.2.2 Spanish real estate market
Housesalesrosesharplyinthefirsteightmonthsof2021,byalmost14%over
the same period of 2019, in contrast to housing supply which was more
Corporate credit risk premia are below the level warranted by their historical relationship with determinants such as enterprise value and uncertainty over enterprise value, leveraging or risk aversion. For their part, stock prices in the United States and the euro area are high compared with the cyclically-adjusted earnings of listed firms. This appears to be explained not by low stock market risk premia (which are above their historical average) but rather by low long-term real interest rates.
PRICES OF RISK-BEARING FINANCIAL ASSETS ARE STILL HIGH COMPARED WITH SOME OF THEIR DETERMINANTSChart 1.5
SOURCES: Refinitiv Datastream and Banco de España.
a The difference between the corporate credit risk premium observed and that predicted by a corporate bond valuation model based on four factors: expected enterprise value (EV), uncertainty over expected EV, corporate sector leverage, and investor risk aversion. For more details, see Galvez and Roibás, “Asset price misalignments: an empirical analysis”, Working Paper (forthcoming), Banco de España.
b The cyclically-adjusted PER is calculated as the ratio of the share price to the 10-year moving average of earnings. The historical averages are calculated for the period 1997-2021.
c The stock market risk premium is calculated using a 2-stage dividend discount model. For more details, see Fuller and Hsia (1984), “A simplified common stock valuation model”, Financial Analysts Journal. The historical averages are calculated for the period 2006-2021.
5
10
15
20
25
30
35
40
Jan-20 Jun-20Nov-20Apr-21 Sep-21
2 CYCLICALLY-ADJUSTED PER (LEFT-HAND PANEL) (b).STOCK MARKET RISK PREMIUM (RIGHT-HAND PANEL) (c)
4.5
5.5
6.5
7.5
8.5
9.5
10.5
11.5
Jan-20Jun-20Nov-20Apr-21Sep-21
pp
-300
-250
-200
-150
-100
-50
0
50
Mar-20 Jun-20 Sep-20 Dec-20 Mar-21 Jun-21 Sep-21
1 CORPORATE CREDIT RISK PREMIA, DEVIATIONS FROM HISTORICALDETERMINANTS (a)
bp
EURO AREA
EURO AREA HISTORICAL AVERAGE
UNITED STATES
US HISTORICAL AVERAGE
SPAIN
SPAIN HISTORICAL AVERAGE
EURO STOXX 50
EURO STOXX HISTORICAL AVERAGE
S&P 500
S&P 500 HISTORICAL AVERAGE
IBEX 35
IBEX 35 HISTORICAL AVERAGE
EURO AREA INVESTMENT GRADE EURO AREA HIGH YIELD
US INVESTMENT GRADE US HIGH YIELD
BANCO DE ESPAÑA 35 FINANCIAL STABILITY REPORT. AUTUMN 2021 1. RISKS LINKED TO THE MACRO-FINANCIAL ENVIRONMENT
contained. The recent housing demand dynamics appear to be backed, not only by
the improvement in the general economic situation and the accommodative financial
conditions, but also by the materialisation of investment decisions that had been
postponed following the onset of the pandemic and by changes in households’
housing preferences arising from that shock (see Chart 1.6.1). In particular, these
changes are being reflected in a comparatively more dynamic demand for single-
family homes and new housing. But housing supply is less dynamic and, were the
current patterns to continue, it could be insufficient to absorb higher demand in the
coming years. In any event, in the medium term, the Housing Renovation and Urban
Regeneration Plan, to be implemented within the framework of the Recovery,
Transformation and Resilience Plan (RTRP), which has funding of €6,820 million out
of the NGEU funds, could drive activity in the residential sector, including both
renovation and new housing.
This increase in house purchases prompted an acceleration in average house
pricesinQ2,reversingtheslowdownobservedsinceearly2019.House prices,
which rose by 3.3% year-on-year (see Chart 1.6.2), were stronger both in the new
housing segment (6%) and, to a lesser extent, in second-hand housing (2.9%). New
house prices have risen the most in recent years, which could be related to the fact
that new housing can be more easily adapted to buyers’ preferences and is in shorter
supply than second-hand housing. Going forward, the recent sharp increase in the
cost of building industry inputs, were it to persist, could put further pressure on new
house prices. It should also be borne in mind that the growth in activity stemming
from the implementation of the RTRP could further tighten the costs of building
industry inputs and labour. Despite these recent developments in house prices,
there are still no signs that these prices are, on average, significantly above their
long-term equilibrium level (see Chapter 3 of this report).
Inkeepingwith thegreaterdynamismofhousesales,newmortgage loans
also recorded strong growth in 2021 H1. Specifically, new lending for house
purchase was some 40% higher than in 2019 H1. Nevertheless, the outstanding
amount of mortgage lending has increased very moderately, as mortgage repayments
have also risen, possibly because households have used the savings they
accumulated in the early stages of the pandemic to early repay all or part of their
mortgage loans. Another possible factor is the end of the moratorium programmes,
which entails the restart of mortgage repayments that had been suspended.
Thismortgage loangrowthessentiallyappears to respond todemand-side
factors,astherearenosignsofeasingofcreditstandardsinrecentmonths,
although interest rate spreads in the fixed-rate mortgage segment have
narrowedrecently.For instance, average loan-to-price (LTP) ratios have held quite
steady in recent months, although for floating-rate mortgages they have dipped
slightly; this suggests that mortgage lending criteria may have become somewhat
more stringent. Moreover, the proportion of mortgage loans with LTP ratios over

BANCO DE ESPAÑA 36 FINANCIAL STABILITY REPORT. AUTUMN 2021 1. RISKS LINKED TO THE MACRO-FINANCIAL ENVIRONMENT
80% has not increased. Interest rate spreads have remained steady for floating-rate
mortgages, but fixed-rate spreads have narrowed to their lowest levels in recent
years (see Chart 1.6.3). At the same time, fixed-rate mortgage maturities have
lengthened and their share of new mortgages has increased.
Housing transactions have risen sharply in 2021 to date compared with the same period of 2019, while housing supply dynamics have been weak. Accordingly, average house prices accelerated in Q2, especially in the new housing segment. Although mortgage conditions have remained generally steady, fixed-rate mortgage spreads have narrowed significantly in the year. In the commercial real estate market, average prices fell again in Q1, followed by some signs of recovery in Q2.
HOUSE SALES AND PRICES HAVE ACCELERATED SIGNIFICANTLY IN 2021 TO DATE, WHILE AVERAGE PRICES OFCOMMERCIAL REAL ESTATE SHOWED SOME SIGNS OF RECOVERY IN Q2
Chart 1.6
SOURCES: Instituto Nacional de Estadistica, Ministerio de Transportes, Movilidad y Agenda Urbana, TINSA, Colegio de Registradores and Banco de España.
a Housing supply comprises new housing, proxied by building completion certificates, and second-hand housing, proxied by the net supply of housing on the main real estate portals compiled by TINSA. Housing demand data refer to housing sales published by INE.
b The rate spread of each new mortgage over the euro IRS curve or swap curve. For floating-rate mortgages, the 1-year IRS rate is used to calculate the spread; for fixed-rate mortgages, the term equivalent to the mortgage term is chosen. The chart depicts the median of the spreads for the two types of mortgages. The 2021 Q2 data are provisional.
c To calculate these indices, each market is divided into strata of homogeneous real estate. A price is then estimated for each stratum, using a hedonic regression model. The indices aggregate the estimated price data for each stratum. The 2021 Q2 data are provisional.
0
2
4
6
8
10
12
14
2018 2019 2020 2021
TOTAL NEW SECOND-HAND
2 HOUSE PRICESYear-on-year change
%
80
85
90
95
100
105
110
2018 2019 2020 2021
GENERAL RETAIL PREMISES OFFICES
INDUSTRIAL PREMISES PRIME AREAS
4 COMMERCIAL REAL ESTATE MARKET PRICE INDICES (c)
2019 Q4 = 100
0
50
100
150
200
250
300
350
400
450
500
2013 2014 2015 2016 2017 2018 2019 2020 2021
FLOATING RATE FIXED RATE
3 RISK-FREE RATE SPREADS (b)
bp
50
60
70
80
90
100
110
120
130
SUPPLY DEMAND
1 HOUSING SUPPLY AND DEMAND (a)
2019 Q4 = 100
2018 2019 2020 2021
BANCO DE ESPAÑA 37 FINANCIAL STABILITY REPORT. AUTUMN 2021 1. RISKS LINKED TO THE MACRO-FINANCIAL ENVIRONMENT
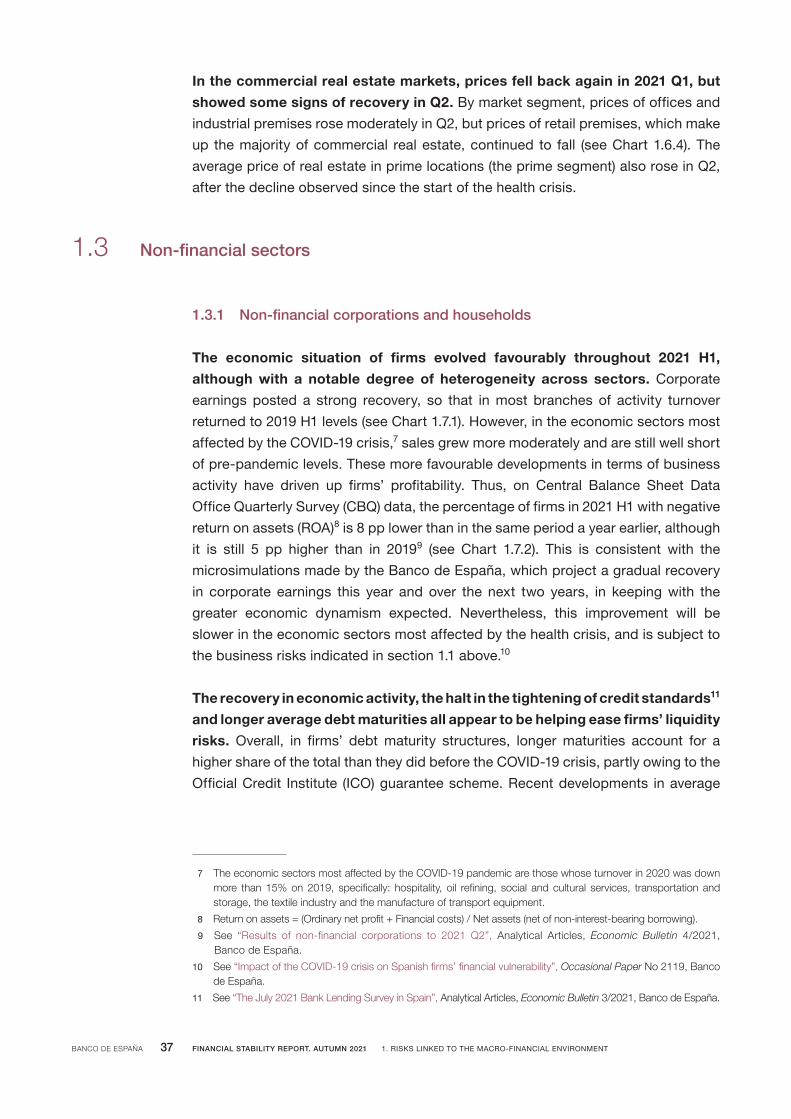
Inthecommercialrealestatemarkets,pricesfellbackagainin2021 Q1,but
showedsomesignsofrecoveryinQ2.By market segment, prices of offices and
industrial premises rose moderately in Q2, but prices of retail premises, which make
up the majority of commercial real estate, continued to fall (see Chart 1.6.4). The
average price of real estate in prime locations (the prime segment) also rose in Q2,
after the decline observed since the start of the health crisis.
1.3 Non-financial sectors
1.3.1 Non-financial corporations and households
The economic situation of firms evolved favourably throughout 2021 H1,
althoughwith a notable degree of heterogeneity across sectors.Corporate
earnings posted a strong recovery, so that in most branches of activity turnover
returned to 2019 H1 levels (see Chart 1.7.1). However, in the economic sectors most
affected by the COVID-19 crisis,7 sales grew more moderately and are still well short
of pre-pandemic levels. These more favourable developments in terms of business
activity have driven up firms’ profitability. Thus, on Central Balance Sheet Data
Office Quarterly Survey (CBQ) data, the percentage of firms in 2021 H1 with negative
return on assets (ROA)8 is 8 pp lower than in the same period a year earlier, although
it is still 5 pp higher than in 20199 (see Chart 1.7.2). This is consistent with the
microsimulations made by the Banco de España, which project a gradual recovery
in corporate earnings this year and over the next two years, in keeping with the
greater economic dynamism expected. Nevertheless, this improvement will be
slower in the economic sectors most affected by the health crisis, and is subject to
the business risks indicated in section 1.1 above.10
Therecoveryineconomicactivity,thehaltinthetighteningofcreditstandards11
andlongeraveragedebtmaturitiesallappeartobehelpingeasefirms’liquidity
risks. Overall, in firms’ debt maturity structures, longer maturities account for a
higher share of the total than they did before the COVID-19 crisis, partly owing to the
Official Credit Institute (ICO) guarantee scheme. Recent developments in average
7 TheeconomicsectorsmostaffectedbytheCOVID-19pandemicarethosewhoseturnoverin2020wasdownmore than15%on2019, specifically: hospitality, oil refining, social andcultural services, transportation andstorage,thetextileindustryandthemanufactureoftransportequipment.
8 Returnonassets=(Ordinarynetprofit+Financialcosts)/Netassets(netofnon-interest-bearingborrowing).
9 See “Results of non-financial corporations to 2021 Q2”, Analytical Articles, Economic Bulletin 4/2021,Banco de España.
10 See“ImpactoftheCOVID-19crisisonSpanishfirms’financialvulnerability”,Occasional Paper No 2119,Bancode España.
11 See “TheJuly 2021BankLendingSurveyinSpain”,Analytical Articles, Economic Bulletin3/2021,BancodeEspaña.

BANCO DE ESPAÑA 38 FINANCIAL STABILITY REPORT. AUTUMN 2021 1. RISKS LINKED TO THE MACRO-FINANCIAL ENVIRONMENT
payment periods to suppliers, which on CBQ data returned, in 2021 Q2, to levels
similar to their pre-pandemic levels, also point to a drop in liquidity tensions.12
Therisksrelatedtothesolvencyofnon-financialcorporationsalsoappearto
be easing, as the recovery in economic activity has been accompanied by
lower debt growth. In consequence, average debt and debt burden ratios have
fallen, in the case of the latter driven also by the decline in the average cost of
outstanding debt. Developments in the volume and quality of bank debt and the use
of support measures such as the ICO guarantees have been uneven across economic
sectors and firms (see Chapter 2 of this report).
The economic situation of households has also recovered, as evidenced by
recent household income and labour market developments, but again with a
12 SeeBox 1,“Recentdevelopmentsintradefinancegrantedandreceivedbynon-financialcorporations”,in“Results ofnon-financialcorporationsto2021 Q2”, Analytical Articles, Economic Bulletin 4/2021,BancodeEspaña.
During the first half of the year, business turnover in most economic sectors returned to pre-pandemic levels. However, in the sectors severely affected by the health crisis, the recovery is proving to be slower and activity is still clearly below 2019 levels. Growth in corporate earnings has translated into an – albeit still incomplete – improvement in profitability.
FIRMS’ SALES AND PROFITABILITY HAVE IMPROVED, ALBEIT VERY UNEVENLY ACROSS ECONOMIC SECTORSChart 1.7
SOURCES: Agencia Estatal de Administración Tributaria and Banco de España.
a Economic sectors severely affected: those whose turnover fell by more than 15% in 2020.b Economic sectors moderately affected: those whose turnover fell by more than 8% but less than 15% in 2020.c Economic sectors least affected: those whose turnover fell by less than 8% in 2020.d CBQ data. Return on assets (R) = (Ordinary net profit + Financial costs) / Net assets (net of non-interest-bearing borrowing).
R <= 0% 0% < R <= 5% 5% < R <= 10%
10% < R <= 15% R > 15%
2 PERCENTAGE OF FIRMS BY RANGE OF ORDINARY RESULTS (ROA) (d)
%
-60
-50
-40
-30
-20
-10
0
10
20
Hos
pita
lity
Oil
refin
ing
Soc
ial s
ervs
. & c
ultu
re
Tran
spor
t. &
sto
rage
Text
ile in
dust
ry
Man
uf. t
rans
. equ
ip.
Man
uf. m
etal
pro
ds.
Oth
er p
rod.
ser
vs.
Woo
d &
furn
iture
Pap
er &
gra
phic
art
s
Man
uf. m
achi
nery
Who
lesa
le t
rad
e
Oth
er m
anuf
. ind
s.
Ext
ract
ive
indu
stry
Con
stru
ctio
n
Util
ities
Ret
ail t
rade
Info
rm. &
com
m.
Rea
l est
ate
activ
s.
Che
mic
al in
dust
ry
Food
Agr
icul
ture
Sectors severelyaffected (a)
Sectors moderatelyaffected (b)
Sectors leastaffected (c)
CHANGE IN ANNUAL TURNOVER: 2019-2020
CHANGE IN HALF-YEARLY TURNOVER: 2019 H1-2021 H1
%
1 BUSINESS TURNOVER BY SECTORRate of change compared with same period of 2019
0
20
40
60
80
100
2019 2020 2019Q1 to Q2
2020Q1 to Q2
2021Q1 to Q2

BANCO DE ESPAÑA 39 FINANCIAL STABILITY REPORT. AUTUMN 2021 1. RISKS LINKED TO THE MACRO-FINANCIAL ENVIRONMENT
certaindegreeofheterogeneity. Specifically, households’ gross disposable income
(GDI) rose by 1% in 2021 H1, but it is still 3.9% below the 2019 levels. Also, at September
2021, effective social security registrations13 were barely 1.2% lower than their pre-
pandemic levels (see Chart 1.8.1), placing the number of employed workers of the Labor
Force Survey (EPA), in this same period, above those observed before the pandemic.
Similarly, according to the European Commission’s consumer survey, at that date
households either expected their economic situation to improve over the next 12
months (households in the top two income quartiles) or to hold relatively steady
(households in the bottom two income quartiles)14 (see Chart 1.8.2). It must also be
borne in mind that since the start of the year there has been a significant cutback in
some of the household income support measures, such as the loan moratoria,15 and
this will have had most impact on the more vulnerable households.
Theaveragedebtratioroseslightlyin2021 H1,whiletheaveragedebtburden
ratiofellduetothedeclineintheaveragecostofoutstandingdebt.Thus, the
debt-to-GDI ratio stood at 94.9% in June, 4.2 pp above the pre-pandemic level,
while the debt burden-to-GDI ratio was 0.5 pp above its pre-pandemic level.
The more granular data point to different lending dynamics according to
certain household characteristics. Households that had loans before the outbreak
of the pandemic have generally reduced their level of debt, albeit at an increasingly
more moderate pace. The lowest reductions in the outstanding sum of bank loans
are recorded among higher income households (proxied according to income by
postcode) and among those resident in the municipalities hardest hit by the crisis
(proxied by those with the highest percentage of firms with furloughed workers) (see
Chart 1.8.3). The latter might be explained, at least in part, by the greater use made
of loan moratoria in the areas most affected by the crisis.16 An analysis of the new
debt taken on by households that had no loans at the onset of the pandemic also
shows stronger lending growth in higher income areas and in those hardest hit by
the crisis (see Chart 1.8.4). For all households, whether or not indebted at the start
of the crisis, income is the variable that best explains credit developments.17 This
suggests that higher income households, and especially those in the top income
quintile, were most likely to take on debt and/or to have had greater access to credit
since the beginning of the pandemic.
13 Effective social security registrations are total registrations excluding workers subject to furlough schemes(ERTEs by their Spanish name).
14 See the European Commission’s monthly consumer survey.
15 Forinstance,theapplicationperiodforbankloanmoratoria,withamaximumdurationofninemonths,endedon31 March 2021.SeeRoyalDecree-Law3/2021of2 February 2021adoptingmeasurestonarrowthegendergap and on other Social Security and economic matters.
16 See “Supportmeasuresinthebankingsector:loanmoratoria”,Financial Stability Review, Issue 40,spring2021,Banco de España.
17 Strongernewlendinginthemunicipalitieswiththemostfurloughedworkersisconsistentwithdebtstakenontomeettheircurrentexpenditure.However,thepositivecorrelationbetweenincomelevelandthepercentageoffirmswithfurloughedworkersatthemunicipallevelsuggeststhatthisincreaseinlendingcouldreflectanincomeeffect.
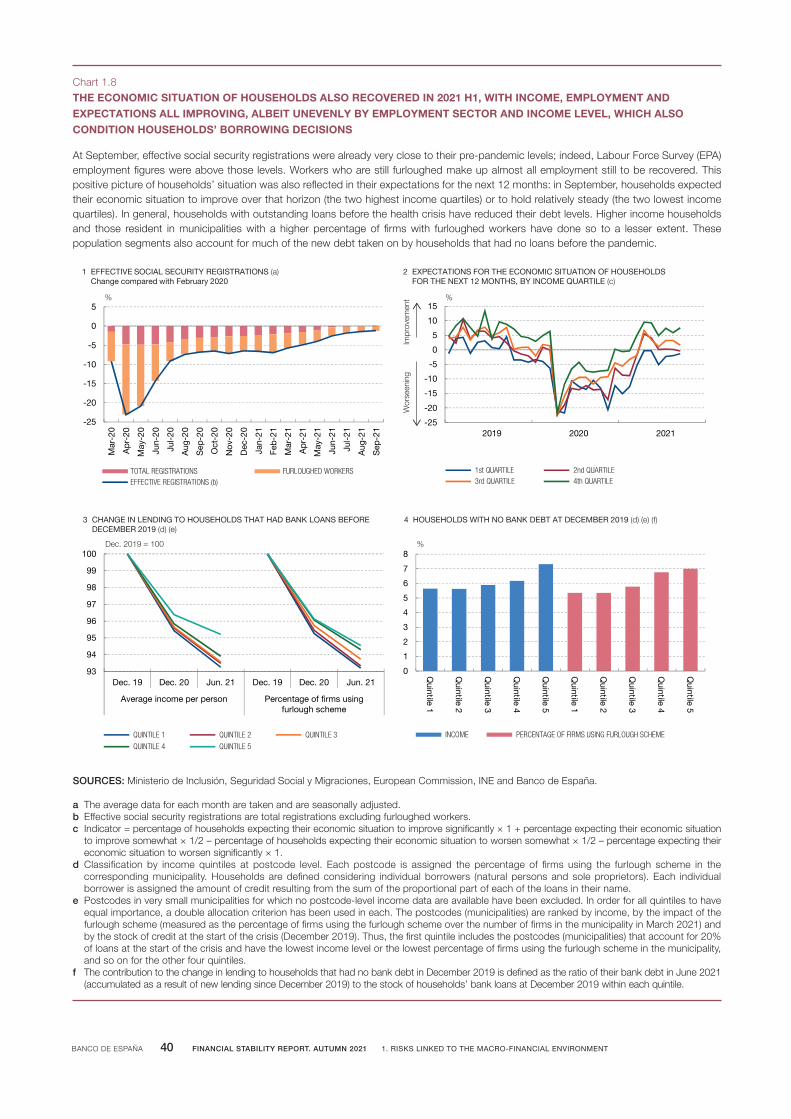
BANCO DE ESPAÑA 40 FINANCIAL STABILITY REPORT. AUTUMN 2021 1. RISKS LINKED TO THE MACRO-FINANCIAL ENVIRONMENT
At September, effective social security registrations were already very close to their pre-pandemic levels; indeed, Labour Force Survey (EPA) employment figures were above those levels. Workers who are still furloughed make up almost all employment still to be recovered. This positive picture of households’ situation was also reflected in their expectations for the next 12 months: in September, households expected their economic situation to improve over that horizon (the two highest income quartiles) or to hold relatively steady (the two lowest income quartiles). In general, households with outstanding loans before the health crisis have reduced their debt levels. Higher income households and those resident in municipalities with a higher percentage of firms with furloughed workers have done so to a lesser extent. These population segments also account for much of the new debt taken on by households that had no loans before the pandemic.
THE ECONOMIC SITUATION OF HOUSEHOLDS ALSO RECOVERED IN 2021 H1, WITH INCOME, EMPLOYMENT ANDEXPECTATIONS ALL IMPROVING, ALBEIT UNEVENLY BY EMPLOYMENT SECTOR AND INCOME LEVEL, WHICH ALSOCONDITION HOUSEHOLDS’ BORROWING DECISIONS
Chart 1.8
SOURCES: Ministerio de Inclusión, Seguridad Social y Migraciones, European Commission, INE and Banco de España.
a The average data for each month are taken and are seasonally adjusted.b Effective social security registrations are total registrations excluding furloughed workers.c Indicator = percentage of households expecting their economic situation to improve significantly × 1 + percentage expecting their economic situation
to improve somewhat × 1/2 – percentage of households expecting their economic situation to worsen somewhat × 1/2 – percentage expecting their economic situation to worsen significantly × 1.
d Classification by income quintiles at postcode level. Each postcode is assigned the percentage of firms using the furlough scheme in the corresponding municipality. Households are defined considering individual borrowers (natural persons and sole proprietors). Each individual borrower is assigned the amount of credit resulting from the sum of the proportional part of each of the loans in their name.
e Postcodes in very small municipalities for which no postcode-level income data are available have been excluded. In order for all quintiles to have equal importance, a double allocation criterion has been used in each. The postcodes (municipalities) are ranked by income, by the impact of the furlough scheme (measured as the percentage of firms using the furlough scheme over the number of firms in the municipality in March 2021) and by the stock of credit at the start of the crisis (December 2019). Thus, the first quintile includes the postcodes (municipalities) that account for 20% of loans at the start of the crisis and have the lowest income level or the lowest percentage of firms using the furlough scheme in the municipality, and so on for the other four quintiles.
f The contribution to the change in lending to households that had no bank debt in December 2019 is defined as the ratio of their bank debt in June 2021 (accumulated as a result of new lending since December 2019) to the stock of households’ bank loans at December 2019 within each quintile.
-25
-20
-15
-10
-5
0
5
10
15
2019 2020 2021
1st QUARTILE 2nd QUARTILE3rd QUARTILE 4th QUARTILE
2 EXPECTATIONS FOR THE ECONOMIC SITUATION OF HOUSEHOLDSFOR THE NEXT 12 MONTHS, BY INCOME QUARTILE (c)
%
Impr
ovem
ent
Wor
seen
ing
-25
-20
-15
-10
-5
0
5
Mar
-20
Apr
-20
May
-20
Jun-
20
Jul-
20
Aug
-20
Sep
-20
Oct
-20
Nov
-20
Dec
-20
Jan-
21
Feb-
21
Mar
-21
Apr
-21
May
-21
Jun-
21
Jul-
21
Aug
-21
Sep
-21
TOTAL REGISTRATIONS FURLOUGHED WORKERSEFFECTIVE REGISTRATIONS (b)
%
1 EFFECTIVE SOCIAL SECURITY REGISTRATIONS (a)Change compared with February 2020
0
1
2
3
4
5
6
7
8
Quintile 1
Quintile 2
Quintile 3
Quintile 4
Quintile 5
Quintile 1
Quintile 2
Quintile 3
Quintile 4
Quintile 5
INCOME PERCENTAGE OF FIRMS USING FURLOUGH SCHEME
4 HOUSEHOLDS WITH NO BANK DEBT AT DECEMBER 2019 (d) (e) (f)
%
93
94
95
96
97
98
99
100
Dec. 19 Dec. 20 Jun. 21 Dec. 19 Dec. 20 Jun. 21
Average income per person Percentage of firms usingfurlough scheme
QUINTILE 1 QUINTILE 2 QUINTILE 3
QUINTILE 4 QUINTILE 5
Dec. 2019 = 100
3 CHANGE IN LENDING TO HOUSEHOLDS THAT HAD BANK LOANS BEFORE DECEMBER 2019 (d) (e)

BANCO DE ESPAÑA 41 FINANCIAL STABILITY REPORT. AUTUMN 2021 1. RISKS LINKED TO THE MACRO-FINANCIAL ENVIRONMENT
The increase in households’ aggregate wealth —on account of the rising
pricesofboth financialandrealassetsandthesavingsaccumulated—has
also strengthened the financial positionof households.As consumption has
increased, the household saving rate has moderated, but it is still above its historical
average. In addition, the Household Budget Survey18 shows that all household
income quartiles made a positive contribution to the significant increase in aggregate
saving in 2020, although the contribution of lower income households was smaller.
1.3.2 General government in Spain
Thelatestdataavailable,correspondingto2021 H1,arebeginningtoreflecta
certaincorrectionintheimbalanceinpublicfinancesinSpaincomparedwith
thehighlevelsreachedin2020.The general government deficit stood at 8.7% of
GDP in June in cumulative 12-month terms, slightly more than 2 pp below the end-
2020 figure (see Chart 1.9.1), while public debt stood at a still very high 123% of GDP
in June. The deficit correction is explained by the pick-up in income (10.5% compared
with the same period of the previous year) arising from the economic recovery under
way, and by the moderation of expenditure growth, on the back of lower extraordinary
expenses related to the response to COVID-19 (total expenditure remained constant
compared with the same period of the previous year).
Bearinginmindthesedevelopments,theBancodeEspaña’slatestprojections,
published in September,19expectthegeneralgovernmentdeficit to improve
significantlyin2021andoverthenexttwoyears (see Chart 1.9.2). After reaching
11% of GDP in 2020, the budget deficit could close 2021 around 7.6%. This forecast
takes into account the measures adopted to temper the strong surge in electricity
prices, and also the costs of a further extension, to the end of the year, of the
COVID-19-related furlough schemes. The imbalance in public finances is expected
to continue to correct in 2022 and 2023, thanks to the improved cyclical momentum
expected and to the withdrawal of the extraordinary COVID-19-related measures.20
Nevertheless, the deficit will still be above 3% of GDP in 2023 and public debt will
decline by barely 5 pp over the projection horizon.
Thestructuraldeficitanddebtlevelsenvisagedfortheendoftheprojection
horizon (2021-2023) placeSpanish public finances in a vulnerable position,
which could also continue over longer horizons. In addition to the high level of
public debt expected for 2023 (over 110% of GDP), the structural adjustment of Spanish
18 See the INE’s Household Budget Survey. Year 2020.
19 See MacroeconomicprojectionsfortheSpanisheconomy(2021-2023).
20 Thedraft2022StateandSocialSecurityBudgetandthedraftBudgetaryPlanfor2022,whichwerepresentedafterthecut-offdatefortheBancodeEspaña’sSeptemberprojections,entailnosignificantchangetothefiscaloutlookfor2022.

BANCO DE ESPAÑA 42 FINANCIAL STABILITY REPORT. AUTUMN 2021 1. RISKS LINKED TO THE MACRO-FINANCIAL ENVIRONMENT
public expenditure and revenue remains outstanding (over 3% of GDP), along with
the challenges posed by population ageing. In the short and medium term, the
monetary policy of the European Central Bank (ECB) and the economic growth
momentum foreseeable as a result of the take-up of the NGEU funds are expected
In the first half of 2021 the general government deficit declined, a process that is expected to continue during the rest of the year and over the next two years. However, if no new measures are introduced, the public debt and budget deficit levels expected for the end of the projection horizon will remain high, representing a source of vulnerability for the Spanish economy. This vulnerability is mitigated by low interest rate levels, which are reflected in reduced and declining cost of debt service. Although, in the short term, the expansionary fiscal policy should continue to help support the ongoing economic recovery, the need for a future credible and sustainable fiscal consolidation process advises that details of this process be defined and announced without delay.
THE SPANISH BUDGET DEFICIT HAS DECLINED IN 2021, BUT IT REMAINS ABOVE ITS PRE-PANDEMIC LEVEL AND THE PROJECTED DEBT REDUCTION UP TO 2023 IS LIMITED
Chart 1.9
SOURCES: Intervención General de la Administración del Estado (IGAE) and Banco de España.
a Four-quarter cumulative data.b Banco de España macroeconomic projections published on 21 September 2021. The squares in 2020 denote the figure revised by the National
Audit Office (IGAE) nine days later.c The pre-COVID-19 scenario replicates the simulations of the public debt-to-GDP ratio made with data and projections at December 2019. The
neutral fiscal policy scenario simulates the debt projections drawing on the Banco de España’s latest forecasts (see Macroeconomic projections for the Spanish economy (2021-2023)), with no additional restrictions on the change in the structural balance. Fulfilment of the SGP scenario assumes a public debt consolidation plan with a reduction in the structural deficit, up to budgetary equilibrium, of 0.5 pp of GDP every year. The last scenario adds structural reforms that would lead to an increase in potential GDP of 0.6 pp in the long term.
30
45
60
75
90
105
120
135
-2
0
2
4
6
8
10
12
08 09 10 11 12 13 14 15 16 17 18 19 20 21
BUDGET DEFICIT (a) DEBT RATIO (right-hand scale)
1 FINANCIAL POSITION OF GENERAL GOVERNMENT
% of GDP % of GDP
80
90
100
110
120
130
140
0
2
4
6
8
10
12
2020 2021 2022 2023
BUDGET DEFICIT PUBLIC DEBT (right-hand scale)
2 PUBLIC DEBT AND BUDGET DEFICIT FORECASTS (b)
% of GDP % of GDP
0.0
0.5
1.0
1.5
2.0
2.5
3.0
3.5
4.0
2007 2009 2011 2013 2015 2017 2019 2021
3 INTEREST EXPENSES
% of GDP
60
70
80
90
100
110
120
130
2014 2018 2022 2026 2030 2034
PRE-COVID-19 NEUTRAL FISCAL POLICY
FULFILMENT OF SGP FULFILMENT OF SGP + REFORMS
4 SIMULATED PUBLIC DEBT PATHS (c)
% of GDP

BANCO DE ESPAÑA 43 FINANCIAL STABILITY REPORT. AUTUMN 2021 1. RISKS LINKED TO THE MACRO-FINANCIAL ENVIRONMENT
to help contain this vulnerability. So far, the impact of the rise in the debt ratio on
interest expenses (see Chart 1.9.3) has also been mitigated by the low interest rates.
However, a hypothetical future increase in interest rates would trigger a spike in
interest expenses, adding pressure to the fiscal position, although this effect would
not be immediate, given the maturities of the public debt. Moreover, an accommodative
fiscal policy remains necessary to consolidate the economic recovery currently
under way. In any event, this does not preclude the need for fiscal consolidation, to
ensure that, in the medium term, the Spanish economy is in a better position to
address the challenges outstanding, and in a less vulnerable position in the event of
future adverse economic developments or a crisis of confidence. According to the
simulation exercises performed, in the absence of budgetary consolidation measures
the debt ratio would remain around 115% of GDP over the next fifteen years, under
the assumption that the Spanish economy maintained growth rates similar to the
average of recent decades. By contrast, fulfilment of the Stability and Growth Pact
(SGP), especially if it is accompanied by structural reforms, would allow to reach
over that period a lower level of indebtedness than that observed before the outbreak
of the pandemic (see Chart 1.9.4).21
1.3.3 Financial flows vis-à-vis the rest of the world and the international investment position
In2021 H1, and in contrast to 2020, international investorsagainmadenet
purchasesofSpanishgeneralgovernmentdebt,an indication that financial
flows vis-à-vis the rest of the world were returning to normal. International
investors’ net purchases in 2021 H1 totalled €41.2 billion. In consequence, their
holdings, which amount to around 45% of Spanish sovereign debt, ceased to fall as
a proportion of the total (see Chart 1.10.1).
The Spanish economy’s negative net international investment position (IIP)
stoodat78.4%ofGDPinJune,representinganelementofvulnerabilityinthe
event of deterioration of financing conditions in the international markets.
Nevertheless, the ratio has fallen significantly since end-2020, specifically by 7.2 pp,
of which 2.8 pp are explained by GDP growth. The valuation effects resulting from
the increase in value of foreign assets held by Spanish residents and the decrease
in value of Spanish liabilities held by international investors (see Chart 1.10.2) explains
a further significant portion of this adjustment. In any event, this level of negative net
IIP to GDP is still 3.4 pp higher than that existing at end-2019.
21 TheSGPenvisagesapublicfinanceadjustmentthattranslatesintoanimprovementinthestructuralbalanceof0.5 ppofGDPperyearuntilthelevelofthisbalancereacheszero.Furthermore,thedebtrulerequiresthattheexcessof thedebt-to-GDP ratio above the60%benchmarkbe reducedbyone twentiethper year.As theSpanishpublicdebt ratio reached120%ofGDP in2020, thatexcess is60 pp.Therefore,according to theEuropeanrule,thedebtratioshouldbereduced,onaverage,by3 ppperyear.

BANCO DE ESPAÑA 44 FINANCIAL STABILITY REPORT. AUTUMN 2021 1. RISKS LINKED TO THE MACRO-FINANCIAL ENVIRONMENT
Spain’sgrossexternaldebtroseby€66.4 billionin2021 H1;althoughitfellto
197.9% of GDP thanks to output growth, it is still 28.4 pp above the pre-
pandemic level. This high debt level is an element of vulnerability in the event of a
possible tightening of financing conditions in the international markets. However,
this vulnerability is mitigated, to a certain extent, by the debt composition, as slightly
more than half is public sector debt (general government and Banco de España),
and by the fact that the average repayment periods are lengthy and it is mostly euro-
denominated debt.
Non-resident sectors again made net purchases of Spanish general government debt in 2021 H1, an indication that financial flows vis-à-vis the rest of the world were returning to normal. In the same period, the Spanish economy’s negative net international investment position (IIP) fell by 7.2 pp of GDP, thanks to positive valuation effects (due both to an increase in the value of foreign assets held by Spanish residents and a decrease in the value of Spanish liabilities held by foreign investors), net financial transactions vis-à-vis the rest of the world that were also positive (the counterpart of the current and capital account surpluses), and GDP growth.
IN 2021 H1, INTERNATIONAL INVESTORS RETURNED TO THE SPANISH GOVERNMENT DEBT MARKET AND SPAIN’S NEGATIVE NET INTERNATIONAL INVESTMENT POSITION DECLINED
Chart 1.10
SOURCE: Banco de España.
a The net IIP is the difference between the value of resident sectors’ foreign assets and that of the liabilities to the rest of the world.b Calculated on four-quarter cumulative GDP.
-15
-10
-5
0
5
10
15
20
15 16 17 18 19 20 2021H1 (b)
GDP EFFECT
VALUATION EFFECTS AND OTHER ADJUSTMENTS
FINANCIAL TRANSACTIONS BANCO DE ESPAÑA
FINANCIAL TRANSACTIONS (EXCLUDING BANCO DE ESPAÑA)
CHANGE IN NET IIP
2 DETERMINANTS OF CHANGE IN NEGATIVE NET IIP (a)
% of GDP
40
42
44
46
48
50
52
-30
-20
-10
0
10
20
30
2016 2017 2018 2019 2020 2021
QUARTERLY NET ACQUISITIONS
SHARE OF TOTAL HELD BY NON-RESIDENTS (right-hand scale)
1 INTERNATIONAL INVESTORS' NET ACQUISITIONS AND HOLDINGSOF SPANISH GENERAL GOVERNMENT DEBT
€bn %
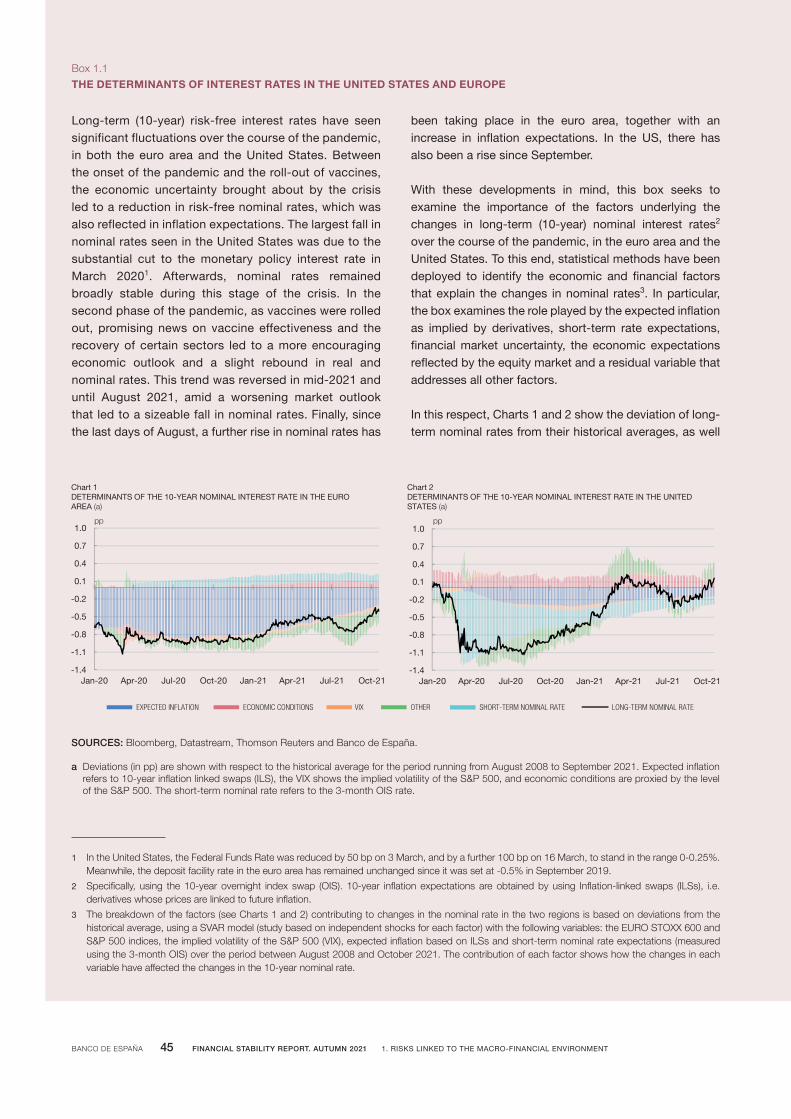
BANCO DE ESPAÑA 45 FINANCIAL STABILITY REPORT. AUTUMN 2021 1. RISKS LINKED TO THE MACRO-FINANCIAL ENVIRONMENT
Box1.1
THE DETERMINANTS OF INTEREST RATES IN THE UNITED STATES AND EUROPE
Long-term (10-year) risk-free interest rates have seen significant fluctuations over the course of the pandemic, in both the euro area and the United States. Between the onset of the pandemic and the roll-out of vaccines, the economic uncertainty brought about by the crisis led to a reduction in risk-free nominal rates, which was also reflected in inflation expectations. The largest fall in nominal rates seen in the United States was due to the substantial cut to the monetary policy interest rate in March 20201. Afterwards, nominal rates remained broadly stable during this stage of the crisis. In the second phase of the pandemic, as vaccines were rolled out, promising news on vaccine effectiveness and the recovery of certain sectors led to a more encouraging economic outlook and a slight rebound in real and nominal rates. This trend was reversed in mid-2021 and until August 2021, amid a worsening market outlook that led to a sizeable fall in nominal rates. Finally, since the last days of August, a further rise in nominal rates has
been taking place in the euro area, together with an increase in inflation expectations. In the US, there has also been a rise since September.
With these developments in mind, this box seeks to examine the importance of the factors underlying the changes in long-term (10-year) nominal interest rates2 over the course of the pandemic, in the euro area and the United States. To this end, statistical methods have been deployed to identify the economic and financial factors that explain the changes in nominal rates3. In particular, the box examines the role played by the expected inflation as implied by derivatives, short-term rate expectations, financial market uncertainty, the economic expectations reflected by the equity market and a residual variable that addresses all other factors.
In this respect, Charts 1 and 2 show the deviation of long-term nominal rates from their historical averages, as well
1 IntheUnitedStates,theFederalFundsRatewasreducedby50bpon3March,andbyafurther100bpon16March,tostandintherange0-0.25%.Meanwhile,thedepositfacilityrateintheeuroareahasremainedunchangedsinceitwassetat-0.5%inSeptember2019.
2 Specifically, using the10-yearovernight index swap (OIS). 10-year inflationexpectationsareobtainedbyusing Inflation-linkedswaps (ILSs), i.e.derivativeswhosepricesarelinkedtofutureinflation.
3 Thebreakdownofthefactors(seeCharts1and2)contributingtochangesinthenominalrateinthetworegionsisbasedondeviationsfromthehistoricalaverage,usingaSVARmodel(studybasedonindependentshocksforeachfactor)withthefollowingvariables:theEUROSTOXX600andS&P500indices,theimpliedvolatilityoftheS&P500(VIX),expectedinflationbasedonILSsandshort-termnominalrateexpectations(measuredusingthe3-monthOIS)overtheperiodbetweenAugust2008andOctober2021.Thecontributionofeachfactorshowshowthechangesineachvariablehaveaffectedthechangesinthe10-yearnominalrate.
SOURCES: Bloomberg, Datastream, Thomson Reuters and Banco de España.
a Deviations (in pp) are shown with respect to the historical average for the period running from August 2008 to September 2021. Expected inflation refers to 10-year inflation linked swaps (ILS), the VIX shows the implied volatility of the S&P 500, and economic conditions are proxied by the level of the S&P 500. The short-term nominal rate refers to the 3-month OIS rate.
pp
-1.4
-1.1
-0.8
-0.5
-0.2
0.1
0.4
0.7
1.0
Jan-20 Apr-20 Jul-20 Oct-20 Jan-21 Apr-21 Jul-21 Oct-21
Chart 1DETERMINANTS OF THE 10-YEAR NOMINAL INTEREST RATE IN THE EURO AREA (a)
-1.4
-1.1
-0.8
-0.5
-0.2
0.1
0.4
0.7
1.0
Jan-20 Apr-20 Jul-20 Oct-20 Jan-21 Apr-21 Jul-21 Oct-21
pp
Chart 2DETERMINANTS OF THE 10-YEAR NOMINAL INTEREST RATE IN THE UNITED STATES (a)
EXPECTED INFLATION ECONOMIC CONDITIONS VIX OTHER SHORT-TERM NOMINAL RATE LONG-TERM NOMINAL RATE
BANCO DE ESPAÑA 46 FINANCIAL STABILITY REPORT. AUTUMN 2021 1. RISKS LINKED TO THE MACRO-FINANCIAL ENVIRONMENT
Box1.1
THE DETERMINANTS OF INTEREST RATES IN THE UNITED STATES AND EUROPE (cont’d)
as the contribution made by each of the above factors. Certain aspects of such contributions vary across time and between the two geographic regions. Thus, in the case of Europe, the changes in long-term nominal rates following the restrictions on movement set in place in March 2020 can be explained by greater market uncertainty and, to a lesser degree, a worse economic outlook. In the United States, the initial fall in long-term nominal rates was essentially due to the easing of monetary policy and the rate cut immediately after the outbreak of the pandemic. One aspect common to both regions is that the contribution of expected inflation to nominal rates has been below its historical average, especially in Europe in the stage of the crisis prior to the announcement of the development of vaccines. In the case of Europe, this moderating effect of inflation expectations on rates was already apparent before the outbreak of the crisis.
Nonetheless, this situation began to change towards the end of 2020, amid a more encouraging economic environment and promising news on vaccine development. Thus, rising inflation brought upward pressure to bear on nominal rates in the euro area, especially from summer 2021 onwards. Also worth noting is the minor role played by the VIX component during this period, suggesting that
nominal rates have not been affected by greater uncertainty, even though US public debt is seen as a safe asset that serves as a haven from uncertainty.
The overall contribution made by other factors is also notable. Specifically, purchase programmes and accommodative monetary policy may have helped ensure that rates in the euro area have remained lower than might be expected solely from the economic variables expressly included in the model, particularly between June and October 2021. In the United States, these other factors have contributed to steeper rate increases in the first half of 2021. This could be explained by more optimistic expectations of growth in specific sectors, above all those dependent on the reopening of the economy (hotels, transport, leisure, etc.), which far outperformed the general index (S&P 500) used in the estimates assessing economic conditions.
In short, the changes in long-term nominal interest rates over 2021 appear to have been closely related to expectations of rising inflation following the post-pandemic resumption of activity and a brighter economic outlook. The rebound observed in the last month, which has been of greater intensity in the euro area, is mainly due to the higher levels of inflation expected.


BANCO DE ESPAÑA 48 INFORME DE ESTABILIDAD FINANCIERA. PRIMAVERA 2021 2. RIESGOS Y CAPACIDAD DE RESISTENCIA DEL SECTOR FINANCIERO

2RISKS TO THE FINANCIAL SECTOR AND ITS RESILIENCE

BANCO DE ESPAÑA 50 FINANCIAL STABILITY REPORT. AUTUMN 2021 2. RISKS TO THE FINANCIAL SECTOR AND ITS RESILIENCE

BANCO DE ESPAÑA 51 FINANCIAL STABILITY REPORT. AUTUMN 2021 2. RISKS TO THE FINANCIAL SECTOR AND ITS RESILIENCE
Bank lending has been notably more subdued in the first half of 2021, mainly as a
result of the fall in demand. This moderation contrasts with the growth observed
during the initial phases of the pandemic, which was driven by the private sector’s
liquidity needs and the support schemes established to mitigate the impact of the
crisis. The volume of non-performing loans (NPLs) has continued to decline, although
significant latent risks have been detected. Specifically, these are more
pronounced in the loans granted under the support schemes which were naturally
concentrated in the hardest-hit sectors and businesses. The economic upturn has
led to the recovery in bank profitability which, nevertheless, remains relatively low
compared with that of other sectors and non-euro area banking systems. The
measures implemented by the authorities have also been key to increasing banks’
solvency in the past year. In this connection, the stress tests conducted by the Banco
de España and the European Banking Authority (EBA) reflect the banking sector’s
considerable resilience, in aggregate terms, to the materialisation of the risks
identified, although there are notable differences across banks in terms of capital
charges under the adverse scenario. In any case, the results of these tests do not
indicate a need for extensive supervisory intervention under this scenario. The high
risk-absorbing capacity of banks can be partly explained by the measures adopted
by the authorities to address the economic and social effects of the crisis.
2.1 Deposit institutions
2.1.1 Balance sheet structure, risks and vulnerabilities
Credit risk
ThevolumeoflendingtotheresidentprivatesectorinSpainremainedstable
in the last 12 months as a whole. Lending by deposit institutions to the resident
private sector fell by 0.2%1 from June 2020 (see Chart 2.1.1), in clear contrast to the
increase posted between December 2019 and June 2020, which was largely due to
the economic policy measures implemented to alleviate the effects of the pandemic.
The slight decline in the stock was influenced by the sharp decrease in total new
lending granted to households and non-financial corporations (NFCs) in 2021 H1,
which fell by 31% year-on-year. This reduction is mainly explained by the lower
1 ThechangeinJune2021wasaffectedbyacorporatetransactionconsistingoftheabsorptionofanSLIintoasignificantdepositinstitution(DI).Excludingthisoperation,theyear-on-yeardecreaseincreditwouldbe0.8%.
2 RISKS TO THE FINANCIAL SECTOR AND ITS RESILIENCE

BANCO DE ESPAÑA 52 FINANCIAL STABILITY REPORT. AUTUMN 2021 2. RISKS TO THE FINANCIAL SECTOR AND ITS RESILIENCE
volume of new loans with ICO guarantees which amounted to less than €10 billion,
far below the amount of almost €70 billion recorded in 2020 H1. The increase in
principal drawn down also moderated, thus converging to pre-pandemic levels.
SlowergrowthinlendingtoNFCsandsoleproprietors,mainlythosehardest
hit by the pandemic, contrasted with the quickening growth of lending to
households. The volume of lending to NFCs and sole proprietors decreased by
1.6% (see Chart 2.2.1) in the last 12 months, reflecting the significant contraction, of
40%, in new lending to these enterprises in 2021 H1 overall, compared with the
same period a year earlier. In fact, lending to NFCs and sole proprietors in the sectors
most severely affected by the pandemic posted the strongest growth in 2020 H1.2
So far in 2021, growth rates have levelled across different sectors, all of which show
a clear trend towards stabilisation (see Chart 2.2.2). Lending to households rose by
1.2% year-on-year, following growth of 20.1% in new lending in H1, compared with
2 Lendingtothehardest-hitsectorsisproxiedbythatcorrespondingtothesectorswithafallinturnoverofmorethan15%in2020,whichcanbeidentifiedintheFI-130regulatoryreturn.Specifically,lendingtothemostseverelyaffected sectors includes hospitality, the manufacture of refined petroleum products, social services andentertainment,transportationandstorage,andthemanufactureoftransportequipment.
The stock of credit, which grew at the start of the pandemic as a result of the economic policy measures adopted (mainly ICO guarantees), remained stable over the last 12 months (-0.2% year-on-year in June 2021). In 2021 H1, new lending to non-financial corporations and sole proprietors decreased notably with respect to the previous year owing to the lower volume of new ICO-backed loans to businesses. However, new lending to households rose significantly.
THE VOLUME OF LENDING TO THE RESIDENT PRIVATE SECTOR REMAINED STABLE OVER THE LAST 12 MONTHS, LARGELYDUE TO THE MODERATION IN NEW LOANS WITH ICO GUARANTEES
Chart 2.1
SOURCES: Instituto de Crédito Oficial and Banco de España.
-15
-10
-5
0
5
10
15
0
200
400
600
800
1,000
1,200
1,400
1,600
1,800
Jun-21Jun-18Jun-15Jun-12
€bn
1 VOLUME OF LENDING AND YEAR-ON-YEAR RATE OF CHANGE Business in Spain, ID
LENDING TO THE RESIDENT PRIVATE SECTOR
%
0
50
100
150
200
250
300
350
2021 H12020 H12019 H12018 H12017 H1
INCREASE IN PRINCIPAL DRAWN DOWN
NEW LOANS. HOUSEHOLDS
NEW LOANS. NFCs AND SOLE PROPRIETORS WITH ICO GUARANTEES
NEW LOANS. NFCs AND SOLE PROPRIETORS WITHOUT ICO GUARANTEES
NEW LOANS. NFCs AND SOLE PROPRIETORS
€bn
2 VOLUME OF NEW LENDING IN THE LAST SIX MONTHS. HOUSEHOLDS,NFCs AND SOLE PROPRIETORSBusiness in Spain, ID
-2
-1
0
1
2
3
4
5
Q1 Q2 Q3 Q4 Q1 Q2
2020 2021
Q-ON-Q RATE
AVERAGEQ-ON-Q RATE2014-2019
%
YEAR-ON-YEAR RATE OF CHANGE IN LENDING (right-hand scale)
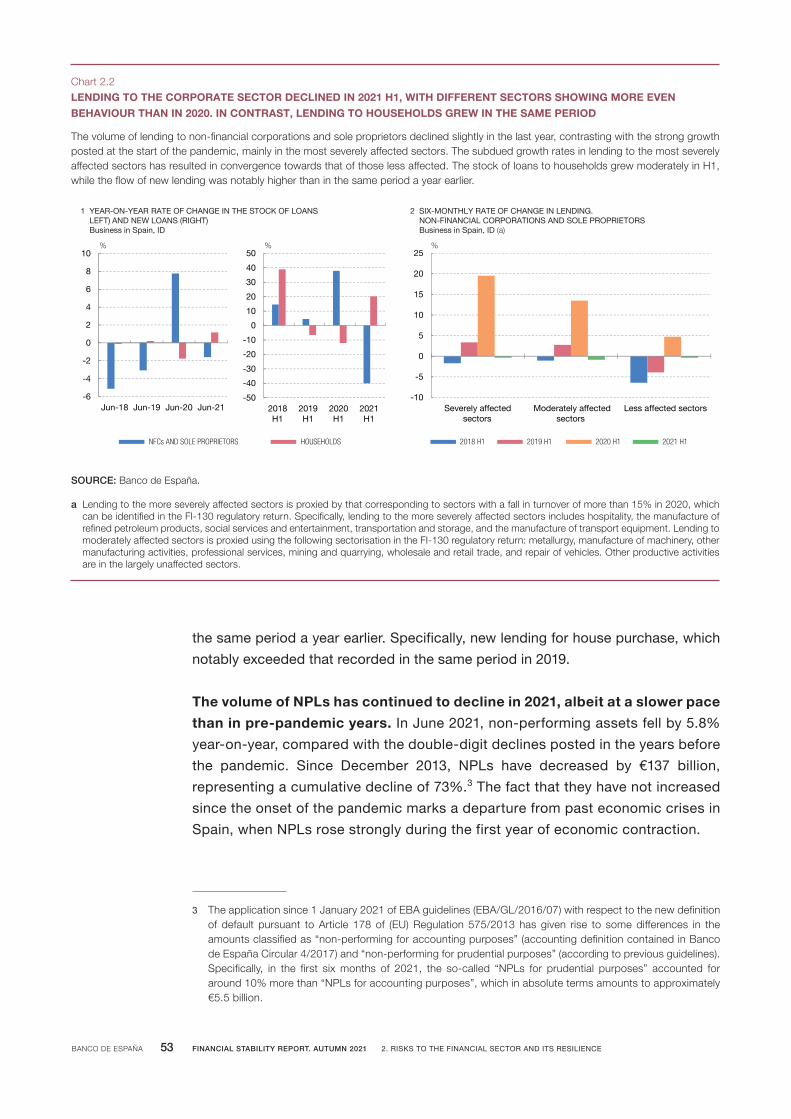
BANCO DE ESPAÑA 53 FINANCIAL STABILITY REPORT. AUTUMN 2021 2. RISKS TO THE FINANCIAL SECTOR AND ITS RESILIENCE
the same period a year earlier. Specifically, new lending for house purchase, which
notably exceeded that recorded in the same period in 2019.
ThevolumeofNPLshascontinuedtodeclinein2021,albeitataslowerpace
thaninpre-pandemicyears. In June 2021, non-performing assets fell by 5.8%
year-on-year, compared with the double-digit declines posted in the years before
the pandemic. Since December 2013, NPLs have decreased by €137 billion,
representing a cumulative decline of 73%.3 The fact that they have not increased
since the onset of the pandemic marks a departure from past economic crises in
Spain, when NPLs rose strongly during the first year of economic contraction.
3 Theapplicationsince1January2021ofEBAguidelines(EBA/GL/2016/07)withrespecttothenewdefinitionof default pursuant toArticle 178of (EU)Regulation575/2013hasgiven rise to somedifferences in theamountsclassifiedas“non-performingforaccountingpurposes”(accountingdefinitioncontainedinBancodeEspañaCircular4/2017)and“non-performingforprudentialpurposes”(accordingtopreviousguidelines).Specifically, in the first sixmonths of 2021, the so-called “NPLs for prudential purposes” accounted foraround10%morethan“NPLsforaccountingpurposes”,whichinabsolutetermsamountstoapproximately€5.5 billion.
The volume of lending to non-financial corporations and sole proprietors declined slightly in the last year, contrasting with the strong growth posted at the start of the pandemic, mainly in the most severely affected sectors. The subdued growth rates in lending to the most severely affected sectors has resulted in convergence towards that of those less affected. The stock of loans to households grew moderately in H1, while the flow of new lending was notably higher than in the same period a year earlier.
LENDING TO THE CORPORATE SECTOR DECLINED IN 2021 H1, WITH DIFFERENT SECTORS SHOWING MORE EVENBEHAVIOUR THAN IN 2020. IN CONTRAST, LENDING TO HOUSEHOLDS GREW IN THE SAME PERIOD
Chart 2.2
SOURCE: Banco de España.
a Lending to the more severely affected sectors is proxied by that corresponding to sectors with a fall in turnover of more than 15% in 2020, which can be identified in the FI-130 regulatory return. Specifically, lending to the more severely affected sectors includes hospitality, the manufacture of refined petroleum products, social services and entertainment, transportation and storage, and the manufacture of transport equipment. Lending to moderately affected sectors is proxied using the following sectorisation in the FI-130 regulatory return: metallurgy, manufacture of machinery, other manufacturing activities, professional services, mining and quarrying, wholesale and retail trade, and repair of vehicles. Other productive activities are in the largely unaffected sectors.
-6
-4
-2
0
2
4
6
8
10
Jun-18 Jun-19 Jun-20 Jun-21
1 YEAR-ON-YEAR RATE OF CHANGE IN THE STOCK OF LOANS LEFT) AND NEW LOANS (RIGHT)Business in Spain, ID
NFCs AND SOLE PROPRIETORS HOUSEHOLDS
%
-10
-5
0
5
10
15
20
25
Severely affectedsectors
Moderately affectedsectors
Less affected sectors
2018 H1 2019 H1 2020 H1 2021 H1
%
2 SIX-MONTHLY RATE OF CHANGE IN LENDING.NON-FINANCIAL CORPORATIONS AND SOLE PROPRIETORSBusiness in Spain, ID (a)
-50
-40
-30
-20
-10
0
10
20
30
40
50
2018H1
2019H1
2020H1
2021H1
%

BANCO DE ESPAÑA 54 FINANCIAL STABILITY REPORT. AUTUMN 2021 2. RISKS TO THE FINANCIAL SECTOR AND ITS RESILIENCE
The NPL ratio also continued to decline in the last 12 months, again more
moderatelythanbeforetheoutbreakoftheCOVID-19crisis. In June 2021, the
NPL ratio for lending to the resident private sector stood at 4.3% (see Chart 2.3.1),
down 0.25 pp from the same month a year earlier. The lower decline in NPLs
(numerator) and the stalling growth in lending (denominator) explain the moderate
fall in the ratio in the last 12 months. As mentioned in previous FSRs, economic
policy measures such as furlough schemes, tax moratoria and public guarantee and
debt moratoria schemes have sustained the financial capacity of economic agents,
particularly firms, thus cushioning the impact of the economic downturn observed in
Spain as a result of the pandemic. In this connection, the rate of decline of NPLs of
non-financial corporations and sole proprietors slowed, whereas in the case of
households, the NPL ratio continued to fall.
DespitetheaggregatedeclineinNPLs,therearesomesignsofcreditquality
impairment,inparticulartheincreaseinrefinancedandStage2loans.Stage
2 loans, with a higher anticipated probability of default than other performing
loans,4 increased substantially (53%) in the last 12 months (see Chart 2.3.2). This
trend began to be observed in 2020 Q3, quickening notably in 2020 Q4, with the
year-on-year rate of change in these loans continuing to rise. Forborne loans,
which had declined more moderately in recent quarters, posted an increase of
8.8% year-on-year in June 2021, possibly indicating some banks’ greater recourse
to them to mitigate the loan repayment difficulties encountered by some borrowers,
especially NFCs.5
The sectors hardest hit by thepandemic are thosewith themost evident
signsofcurrentandpotentialcreditimpairment. NFCs and sole proprietors in
these economic sectors, which were particularly affected, first and foremost
because of the restrictions on activity, have seen their ability to repay existing
loans diminish. This initially led to higher Stage 2 loans to these sectors, especially
in 2020 H2 (see Chart 2.3.3), followed by an increase in their NPLs in 2021 H1 (see
Chart 2.3.4).
Thedegreeofcreditqualityimpairmentofloanslinkedtoexpiredmoratoria
asofJune2021remainedunchanged,whilethatofloanswithICOguarantees
increased. The proportion of loans linked to expired or cancelled moratoria which
showed signs of credit impairment (see Chart 2.4.1) was 20% for Stage 2 (compared
with 19% in December 2020), and 9% for NPLs (compared with 8% in December
2020). This impairment could increase in the coming quarters, since a significant
proportion of moratoria have expired only very recently, in the second quarter of
4 PursuanttoCircular4/2017,aloanisclassifiedasaStage2exposurewhencreditriskhasincreasedsignificantlysinceinitialrecognition,eventhoughnoeventofdefaulthasoccurred.
5 TheincreaseinforborneloanslargelycorrespondstoICO-backedloanswithextensionspursuanttotheprovisionsofRoyalDecree-Law34/2020.

BANCO DE ESPAÑA 55 FINANCIAL STABILITY REPORT. AUTUMN 2021 2. RISKS TO THE FINANCIAL SECTOR AND ITS RESILIENCE
The volume of NPLs continued on the downward trend of recent years, although the decline was more moderate. This, along with the stabilisation of lending between June 2020 and June 2021, led to a lower decline also in the NPL ratio. However, early signs of loan repayment difficulties by economic agents were observed, such as the strong increase in Stage 2 loans, particularly in the sectors most severely affected by the pandemic, and a year-on-year increase in refinanced loans, something which had not occurred since the end of the global financial crisis.
THE VOLUME OF NPLs CONTINUED TO DECLINE, ALTHOUGH SOME SIGNS OF CREDIT QUALITY IMPAIRMENT AND UNEVENBEHAVIOUR ACROSS SECTORS WERE OBSERVED
Chart 2.3
SOURCE: Banco de España.
a Lending to the more severely affected sectors is proxied by that corresponding to sectors with a fall in turnover of more than 15% in 2020, which can be identified in the FI-130 regulatory return. Specifically, lending to the more severely affected sectors includes hospitality, the manufacture of refined petroleum products, social services and entertainment, transportation and storage, and the manufacture of transport equipment. Lending to moderately affected sectors is proxied using the following sectorisation in the FI-130 regulatory return: metallurgy, manufacture of machinery, other manufacturing activities, professional services, mining and quarrying, wholesale and retail trade, and repair of vehicles. Other productive activities are in the largely unaffected sectors.
0
2
4
6
8
10
12
14
16
0
20
40
60
80
100
120
140
160
180
200
Jun-09 Jun-11 Jun-13 Jun-15 Jun-17 Jun-19 Jun-21
NPL VOLUME NPL RATIO (right-hand scale)
1 NPLs AND NPL RATIO OF THE RESIDENT PRIVATE SECTORBusiness in Spain, ID
€bn %
-30
-20
-10
0
10
20
30
Jun-19Dec-19Jun-20Dec-20Jun-21
CONSUMPTION
HOUSEHOLDS
NFCs AND SOLE PROPRIETORS
2 YEAR-ON-YEAR RATES OF CHANGE OF NPLs (LEFT) AND SIGNS OF EARLY IMPAIRMENT IN LENDING TO RESIDENT PRIVATE SECTOR (RIGHT)Business in Spain, ID
%
-40
-20
0
20
40
60
80
100
120
Sectors severelyaffected by the
COVID-19 pandemic (a)
Sectors moderatelyaffected by the
COVID-19 pandemic (a)
Sectors largelyunaffected by the
COVID-19 pandemic (a)
3 SIX-MONTHLY RATE OF CHANGE OF STAGE 2 LOANS. NFCs AND SOLE PROPRIETORSBusiness in Spain, ID
%
-30
-20
-10
0
10
20
30
40
50
60
Jun-19Dec-19Jun-20Dec-20Jun-21
YEAR-ON-YEAR RATE OF CHANGE OFREFINANCED LOANS
YEAR-ON-YEAR RATE OF CHANGE OFSTAGE 2 LOANS
%
-30
-20
-10
0
10
20
30
40
Sectors severelyaffected by the
COVID-19 pandemic (a)
Sectors moderatelyaffected by the
COVID-19 pandemic (a)
Sectors largelyunaffected by the
COVID-19 pandemic (a)
4 SIX-MONTHLY RATE OF CHANGE OF NPLs. NFCs AND SOLE PROPRIETORSBusiness in Spain, ID
%
DECEMBER 2019 JUNE 2020 DECEMBER 2020 JUNE 2021

BANCO DE ESPAÑA 56 FINANCIAL STABILITY REPORT. AUTUMN 2021 2. RISKS TO THE FINANCIAL SECTOR AND ITS RESILIENCE
2021. However, the loans benefitting from moratoria account for a small percentage
of banks’ portfolios.6 The situation of ICO-guaranteed loans granted to non-financial
corporations and sole proprietors had deteriorated in June 2021 with respect to
December 2020 (see Chart 2.4.2). In transactions with ICO guarantees, Stage 2
loans accounted for 16% of the credit drawn, an increase of 8 percentage points
(pp). The increase was more subdued in the case of sole proprietors, but it reached
the same percentage. It should be borne in mind that a large portion of these ICO-
guaranteed loans currently have payment holidays, which reduces the possibility of
credit risks materialising in the short term. It is also observed that the proportion of
ICO loans linked to customers with one or more troubled loans (of all their loans, not
only those with ICO guarantees) has increased significantly in the case of NFCs. The
abundant signs of credit impairment in customers with ICO guarantees suggests
that risk in ICO-backed loans may materialise to a greater extent, once the payment
holidays have expired. Box 2.1 analyses in more detail the characteristics of the
6 Loansthathavebecomesubjecttomoratoriaatanypointsincetheonsetofthecrisisamountto€60.5billion(8.6%ofalllendingintheloanportfolioseligibleformoratoriaand5.5%ofalllendingtothenon-financialprivatesector in December 2020.
The credit quality of loans linked to expired moratoria worsened in 2021 H1 owing to the behaviour of those with no mortgage guarantee. The credit quality of ICO backed loans deteriorated, as the ratio of loans in Stage 2 and of non-performing loans increased. This deterioration can also be observed when analysing the overall quality of all loans arranged by customers who have been granted ICO-backed loans.
THE SIGNS OF DETERIORATION IN THE CREDIT QUALITY OF LOANS WITH EXPIRED MORATORIA REMAIN AND HAVEINTENSIFIED IN THE CASE OF ICO-BACKED LOANS
Chart 2.4
SOURCE: Banco de España.
a In the customer-level analysis, for each firm or sole proprietor with one or more ICO-backed loans all possible deteriorations are identified in any of their loans (ICO-backed or otherwise) arranged with the bank that granted it the ICO-backed loan or with other banks. If customers have problematic loans above a minimum materiality threshold, they are flagged as a customer with some sign of deterioration. In the analysis at customer-guaranteed loan level, only the possible credit problems affecting the ICO-backed loans of those customers are examined.
0
5
10
15
20
25
gnimrofrep-noN2 egatS
SECURED BY A MORTGAGE NO MORTGAGE GUARANTEE
TOTAL EXPIRED MORATORIA
DECEMBER 2020
%
1 CREDIT QUALITY OF LOANS LINKED TO EXPIRED OR CANCELLED MORATORIA IN JUNE 2021
0
5
10
15
20
25
30
35
40
45
50
% Stage 2 % non-performing
% drawn down, June 2021
0
5
10
15
20
25
30
35
40
45
50
% Stage 2 % non-performing
FIRMS SOLE PROPRIETORS DECEMBER 2020
2 STATUS OF ICO-BACKED LOANS IN JUNE 2021Loan level (l-h panel) / Customer level (r-h panel) (a)
% drawn down, June 2021
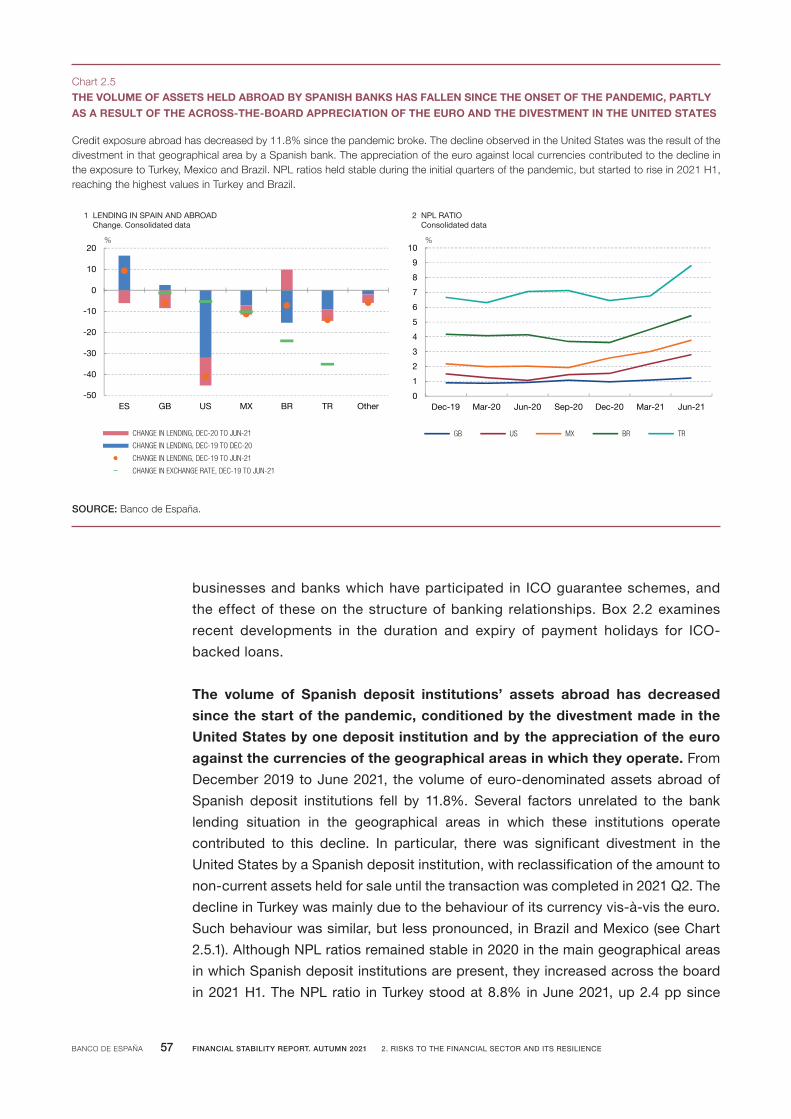
BANCO DE ESPAÑA 57 FINANCIAL STABILITY REPORT. AUTUMN 2021 2. RISKS TO THE FINANCIAL SECTOR AND ITS RESILIENCE
businesses and banks which have participated in ICO guarantee schemes, and
the effect of these on the structure of banking relationships. Box 2.2 examines
recent developments in the duration and expiry of payment holidays for ICO-
backed loans.
The volume of Spanish deposit institutions’ assets abroad has decreased
sincethestartofthepandemic,conditionedbythedivestmentmadeinthe
UnitedStatesbyonedepositinstitutionandbytheappreciationoftheeuro
againstthecurrenciesofthegeographicalareasinwhichtheyoperate. From
December 2019 to June 2021, the volume of euro-denominated assets abroad of
Spanish deposit institutions fell by 11.8%. Several factors unrelated to the bank
lending situation in the geographical areas in which these institutions operate
contributed to this decline. In particular, there was significant divestment in the
United States by a Spanish deposit institution, with reclassification of the amount to
non-current assets held for sale until the transaction was completed in 2021 Q2. The
decline in Turkey was mainly due to the behaviour of its currency vis-à-vis the euro.
Such behaviour was similar, but less pronounced, in Brazil and Mexico (see Chart
2.5.1). Although NPL ratios remained stable in 2020 in the main geographical areas
in which Spanish deposit institutions are present, they increased across the board
in 2021 H1. The NPL ratio in Turkey stood at 8.8% in June 2021, up 2.4 pp since
Credit exposure abroad has decreased by 11.8% since the pandemic broke. The decline observed in the United States was the result of the divestment in that geographical area by a Spanish bank. The appreciation of the euro against local currencies contributed to the decline in the exposure to Turkey, Mexico and Brazil. NPL ratios held stable during the initial quarters of the pandemic, but started to rise in 2021 H1, reaching the highest values in Turkey and Brazil.
THE VOLUME OF ASSETS HELD ABROAD BY SPANISH BANKS HAS FALLEN SINCE THE ONSET OF THE PANDEMIC, PARTLYAS A RESULT OF THE ACROSS-THE-BOARD APPRECIATION OF THE EURO AND THE DIVESTMENT IN THE UNITED STATES
Chart 2.5
SOURCE: Banco de España.
-50
-40
-30
-20
-10
0
10
20
ES GB US MX BR TR Other
1 LENDING IN SPAIN AND ABROADChange. Consolidated data
CHANGE IN LENDING, DEC-20 TO JUN-21
CHANGE IN LENDING, DEC-19 TO DEC-20
CHANGE IN LENDING, DEC-19 TO JUN-21
CHANGE IN EXCHANGE RATE, DEC-19 TO JUN-21
%
0
1
2
3
4
5
6
7
8
9
10
Dec-19 Mar-20 Jun-20 Sep-20 Dec-20 Mar-21 Jun-21
GB US MX BR TR
%
2 NPL RATIOConsolidated data

BANCO DE ESPAÑA 58 FINANCIAL STABILITY REPORT. AUTUMN 2021 2. RISKS TO THE FINANCIAL SECTOR AND ITS RESILIENCE
December 2020, while Brazil posted 5.4% and Mexico 3.8%, with increases of 1.8
pp and 1.2 pp, respectively, since end-2020.
Financing conditions
Banks’financingconditionshavecontinuedtoimprove,assistedbytheexcess
liquidityresultingfromtheECB’spurchaseprogrammesandtherefinancing
operations (TLTRO III), which have pushed down interest rates on unsecured
loans. The Eurosystem’s balance sheet has almost doubled since the start of the
pandemic, driven by the different purchase programmes and loan facilities, which
have led to a rise in the system’s excess liquidity. Money market interest rates have
continued to fall in this setting of ample liquidity (see Chart 2.6.1). The significant
increase in refinancing operations in the summer of 20207 led to a gradual fall in the
unsecured rate (€STR8) and therefore, to a considerably larger negative gap
between the latter and the deposit facility rate, which has remained largely unchanged
in 2021. The repo rate9 has also tended to decline owing to excess liquidity, and the
reduction of available collateral resulting from, among other factors, the increase in
purchases by the Eurosystem. However, the relationship between the repo-deposit
facility rate spread and excess liquidity has been less intense in recent months,
thanks to the increase in securities lending by the Eurosystem since end-2020, and
to the relaxation of collateral requirements in financing transactions in which assets
other than sovereign debt are accepted.10
Theinterbankfundingspread11hasremainedrelativelystable,whilethemarket
perception of credit risk at Spanish banks is very low (see Chart 2.6.2). The
interbank funding spread has remained at levels similar to those observed at the date
of the last report, with a slight rebound in the months of September and October, and
market expectations regarding this indicator suggest that the interbank costs could
increase slightly in 2022, coinciding with the termination of the PEPP and the end of
the favourable financing conditions applied to TLTRO III.12
7 InthefourthandfifthroundsofTLTROIIIin2020,euroareabanksappliedfor€1,308billionand€175billion,respectively,leadingtoanetliquidityinjectionof€706billion.Formoreinformation,see: Financial Stability Report, Autumn2020,Chapter2:Liquidityandfinancingconditions.
8 Representstheunsecuredovernightborrowingcostsofbankslocatedintheeuroarea.BoththeinterestrateandthetradingvolumearecalculatedandpublishedeachbusinessdaybytheECBbasedontheinformationprovided by the 48 euro area MMSR reporting banks.
9 Referstotheovernightrate,accordingtothedatareportedbybankstotheMMSR,agreedwithotherfinancialinstitutions, the collateral used being sovereign bonds issued by Spain, Italy, Germany and France.
10 Theslower-than-expectedpaceofpurchasesunderthePEPPannouncedattheECBGoverningCouncil’smostrecentmeetingcouldreducetherestrictionsonavailablecollateralandthuseasethedownwardpressureonrepo rates.
11 Formoreinformationabouthowthisspreadiscalculated,seeFinancial Stability Report, Autumn 2020, Chapter 2:LiquidityandfinancingconditionsandJondeauetal.(2020).
12 Theinterestrateappliedtotheseoperationswillremain50bpbelowthethemainrefinancingrateuntilJune2022andupto50bpbelowthedepositfacilityrateforbanksmeetingcertaincriteria.

BANCO DE ESPAÑA 59 FINANCIAL STABILITY REPORT. AUTUMN 2021 2. RISKS TO THE FINANCIAL SECTOR AND ITS RESILIENCE
Thecostofissuanceforbanksonthewholesalemarkethasdecreasedacross
theboard,whereas thevolumeof issuesremainshigh (see Charts 2.6.3 and
2.6.4). Investors’ perception of risk regarding debt issued by banks13 is very low, as
13 Measuredusing thecredit riskpremium forunsecuredbank lending (ineuro),which iscalculatedas thespreadbetweentheinterestrateonthesecondarymarketofeachlistedbondandtheGermanBundwiththesamematurity.
Money market interest rates have remained on a downward path in 2021, with a strong negative correlation between money market spreads and the deposit facility rate and rising volumes of excess liquidity and growth in purchase programmes. However, the impact of purchase programmes’ on lower repo rates through collateral availability seems to have diminished in 2021. Likewise, interbank funding costs are expected to recover slightly in 2022, when some monetary policy measures are set to end, but would hold at pre-COVID levels; so too would the risk premium for Spanish banks’ bond issuances. Consistent with this, the cost (and volume) of bank issuances on the wholesale market remain at historically low (high) levels.
IN 2021, THE STABILISATION OF MONETARY POLICY HAS CONTINUED TO CONTRIBUTE, ALBEIT LESS SO THAN IN 2020,TOWARDS IMPROVING INTERBANK AND WHOLESALE FUNDING CONDITIONS
Chart 2.6
SOURCES: Bloomberg, Thomson Reuters and Banco de España.
a The dots show the daily figure for the €STR-DFR and repo-DFR spreads, respectively (vertical axis), and the excess liquidity (horizontal axis). The post-COVID period runs from 26 June to 31 December 2020. The data for 2021 include from 1 January to 22 October 2021.
b The solid line (blue) shows the spread between the Euribor-3M (3-months forward) rate and the OIS curve 3-month forward rate, while the series of points shows the projections for this spread over different time horizons.
c The credit risk spread is calculated for unsecured debt bonds issued in euro by Spanish banks (Santander, BBVA and CaixaBank). First, the average interest rate on the secondary market for these bonds is obtained and the spread is calculated against the German Bund (risk-free) with the same maturity.
d Comparison of the issuances in each year (2020 and 2021) up to the respective month of October.
-9.0
-8.5
-8.0
-7.5
-7.0
-6.5
-6.0
-5.5
-5.0
-4.5
-4.0
2,500 3,000 3,500 4,000 4,500 5,000
Excess liquidity (€bn)
POST-COVID 2021
1 MONEY MARKET RATES AND EXCESS LIQUIDITY (a)Spread (bp) Spread (bp)
€STR-DFR
50
100
150
200
250
300
Jan-
20M
ar-2
0M
ay-2
0Ju
l-20
Sep
-20
Nov
-20
Jan-
21M
ar-2
1M
ay-2
1Ju
l-21
Sep
-21
INTERBANK FUNDING SPREAD (right-hand scale)
CREDIT RISK SPREAD
bp2 INTERBANK FUNDING SPREAD AND CREDIT RISK (b) (c)
bp
-30.0
-25.0
-20.0
-15.0
-10.0
-5.0
0.0
2,800 3,300 3,800 4,300 4,800
Excess liquidity (€bn)
Repo-DFR
-2
-1
0
1
2
3
4
5
6
7
2020 2021 2020 2021 2020 2021 2020 2021 2020 2021
CoCos Tier II Senior non-preferred
Unsecured Secured
FIRST AND THIRD QUARTILE 5TH-95TH PERCENTILE
MEDIAN
pp
3 ISSUANCE COST (IN EURO) BY INSTRUMENT TYPE: 2020 vs 2021
0
2
4
6
8
10
12
14
16
18
2020 2021 2020 2021 2020 2021 2020 2021 2020 2021
CoCos Tier II Senior non-preferred
Unsecured Secured
€bn
EUROS OTHER CURRENCIES
4 VOLUME OF ISSUANCES BY INSTRUMENT TYPE: 2020 vs 2021 (d)
Dec
-21
Feb-
22
Apr
-22
Jun-
22
Aug
-22
Oct
-22
Dec
-22
-20
-10
0
10
20
30
40

BANCO DE ESPAÑA 60 FINANCIAL STABILITY REPORT. AUTUMN 2021 2. RISKS TO THE FINANCIAL SECTOR AND ITS RESILIENCE
reflected also in the wholesale funding market, where costs have decreased or held
steady in 2021 for most debt instruments, particularly in the case of different types
of senior debt (non-preferred, secured and unsecured). Also, the cost of issuance is
less dispersed in these cases, unlike subordinated debt (Tier II) and contingent
convertible bonds (CoCos), where dispersion has increased due to the divergence
of costs observed between banks. The dispersion in the cost of CoCo issuance
indicates that in 2020 this had been limited to larger banks, whereas in 2021, smaller
banks have also been able to issue CoCos, at a higher cost. In the first ten months
of 2021, banks have benefitted from these lower funding costs to increase the volume
of issues of instruments directly associated with regulatory, prudential or resolution
requirements, in particular, MREL-eligible instruments classified as senior non-
preferred instruments.14 However, this has not occurred in the issuance of secured
or unsecured senior bonds, whose volume decreased with respect to 2020, largely
owing to the current context of excess liquidity.
Bank deposits have slowed, but continue to grow at a good pace. Indeed,
households and companies have moderated the pace of growth of their deposits in
institutions once uncertainty has been reduced, the profitability of other financial
assets has increased, there is no longer forced savings and most of the loan
programme with public guarantees has been deployed. Specifically, the year-on-year
rate of change of deposits from households and firms until June 2021 stood at close
to 5% in business in Spain, around 2.5 pp below the rate observed in the same month
of the previous year. The slowdown is being more intense among firms, which register
yearly increases of just 2%. Unlike other European countries, the volume of deposits
remunerated at negative rates is not material and is limited to large firms.
2.1.2 Profitability and solvency
Profitability
TheSpanishbankingsystemearnedconsolidatednetprofitof€13.8billionin
2021H1,upsignificantlyonthefigureforthesameperiodof2020. After the
losses recognised by the Spanish banking sector in 2020 H1, consolidated net profit
has improved by €23 billion. This translates into a return on assets (ROA) of 0.71%
(up 1.2 pp from -0.5% in June 2020) and a return on equity (ROE) of 11.2% (up 18.5
pp from -7.3% in June 2020).15
Extraordinarygainsandlosses(anetlossin2020andanetgainin2021)have
asignificantimpactonthisyear-on-yearimprovementinprofitability. In 2021
14 This category also includes CoCos and eligible subordinated debt instruments as Tier II capital.
15 InthecaseofROE,theyear-on-yeardifferencealsoincreasedduetothe5%declineinaverageequitybetweenJune2020andJune2021,whereasaveragetotalassetsheldsteadierduringthatperiod,growingby1.9%.
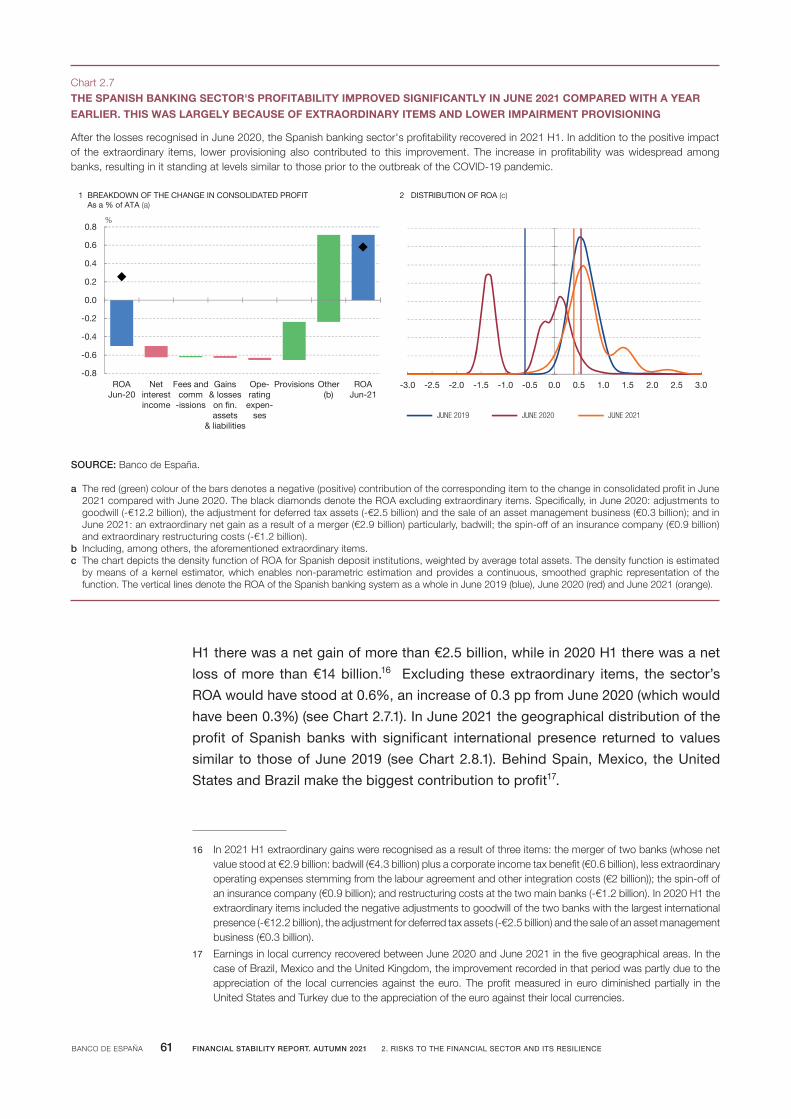
BANCO DE ESPAÑA 61 FINANCIAL STABILITY REPORT. AUTUMN 2021 2. RISKS TO THE FINANCIAL SECTOR AND ITS RESILIENCE
H1 there was a net gain of more than €2.5 billion, while in 2020 H1 there was a net
loss of more than €14 billion.16 Excluding these extraordinary items, the sector’s
ROA would have stood at 0.6%, an increase of 0.3 pp from June 2020 (which would
have been 0.3%) (see Chart 2.7.1). In June 2021 the geographical distribution of the
profit of Spanish banks with significant international presence returned to values
similar to those of June 2019 (see Chart 2.8.1). Behind Spain, Mexico, the United
States and Brazil make the biggest contribution to profit17.
16 In2021H1extraordinarygainswererecognisedasaresultofthreeitems:themergeroftwobanks(whosenetvaluestoodat€2.9billion:badwill(€4.3billion)plusacorporateincometaxbenefit(€0.6billion),lessextraordinaryoperatingexpensesstemmingfromthelabouragreementandotherintegrationcosts(€2billion));thespin-offofaninsurancecompany(€0.9billion);andrestructuringcostsatthetwomainbanks(-€1.2billion).In2020H1theextraordinaryitemsincludedthenegativeadjustmentstogoodwillofthetwobankswiththelargestinternationalpresence(-€12.2billion),theadjustmentfordeferredtaxassets(-€2.5billion)andthesaleofanassetmanagementbusiness (€0.3 billion).
17 EarningsinlocalcurrencyrecoveredbetweenJune2020andJune2021inthefivegeographicalareas.InthecaseofBrazil,MexicoandtheUnitedKingdom,theimprovementrecordedinthatperiodwaspartlyduetotheappreciationof the local currenciesagainst theeuro.Theprofitmeasured in eurodiminishedpartially in theUnitedStatesandTurkeyduetotheappreciationoftheeuroagainsttheirlocalcurrencies.
After the losses recognised in June 2020, the Spanish banking sector's profitability recovered in 2021 H1. In addition to the positive impactof the extraordinary items, lower provisioning also contributed to this improvement. The increase in profitability was widespread among banks, resulting in it standing at levels similar to those prior to the outbreak of the COVID-19 pandemic.
THE SPANISH BANKING SECTOR'S PROFITABILITY IMPROVED SIGNIFICANTLY IN JUNE 2021 COMPARED WITH A YEAREARLIER. THIS WAS LARGELY BECAUSE OF EXTRAORDINARY ITEMS AND LOWER IMPAIRMENT PROVISIONING
Chart 2.7
SOURCE: Banco de España.
a The red (green) colour of the bars denotes a negative (positive) contribution of the corresponding item to the change in consolidated profit in June 2021 compared with June 2020. The black diamonds denote the ROA excluding extraordinary items. Specifically, in June 2020: adjustments to goodwill (-€12.2 billion), the adjustment for deferred tax assets (-€2.5 billion) and the sale of an asset management business (€0.3 billion); and in June 2021: an extraordinary net gain as a result of a merger (€2.9 billion) particularly, badwill; the spin-off of an insurance company (€0.9 billion) and extraordinary restructuring costs (-€1.2 billion).
b Including, among others, the aforementioned extraordinary items.c The chart depicts the density function of ROA for Spanish deposit institutions, weighted by average total assets. The density function is estimated
by means of a kernel estimator, which enables non-parametric estimation and provides a continuous, smoothed graphic representation of the function. The vertical lines denote the ROA of the Spanish banking system as a whole in June 2019 (blue), June 2020 (red) and June 2021 (orange).
-0.8
-0.6
-0.4
-0.2
0.0
0.2
0.4
0.6
0.8
ROAJun-20
Netinterestincome
Fees andcomm
-issions
Gains& losseson fin.assets
& liabilities
Ope-rating
expen-ses
Provisions Other(b)
ROAJun-21
1 BREAKDOWN OF THE CHANGE IN CONSOLIDATED PROFIT As a % of ATA (a)
%
-3.0 -2.5 -2.0 -1.5 -1.0 -0.5 0.0 0.5 1.0 1.5 2.0 2.5 3.0
JUNE 2019 JUNE 2020 JUNE 2021
2 DISTRIBUTION OF ROA (c)
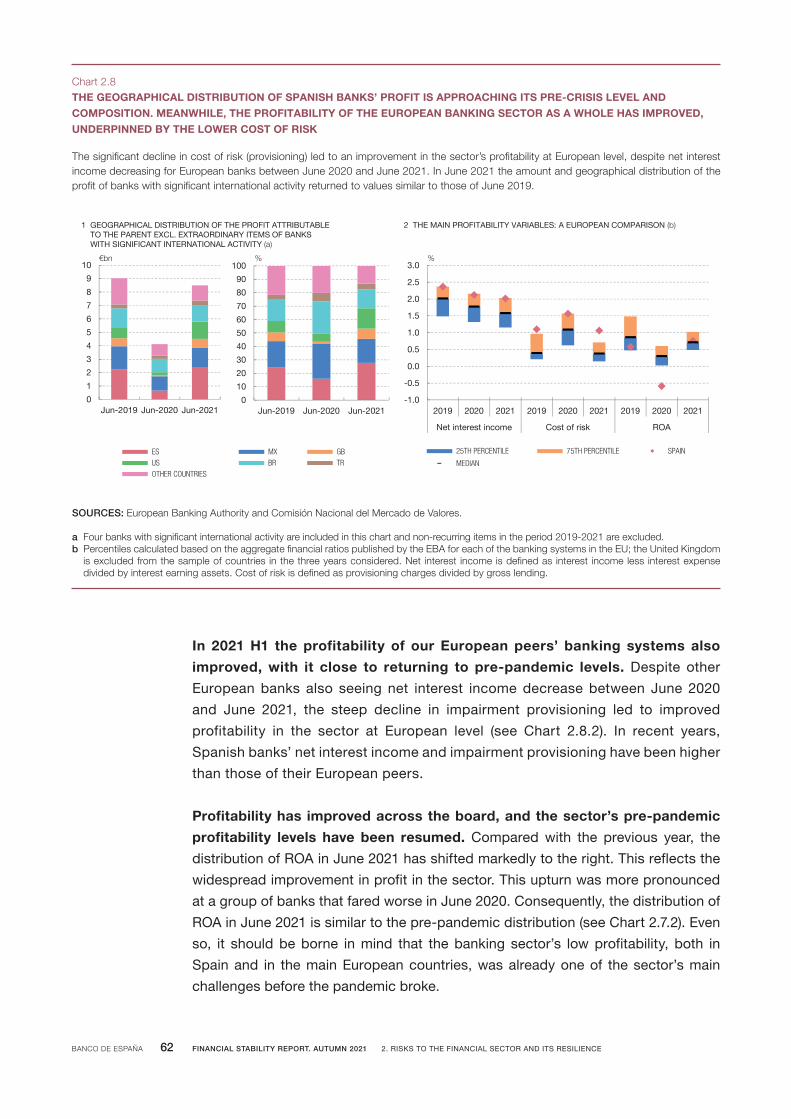
BANCO DE ESPAÑA 62 FINANCIAL STABILITY REPORT. AUTUMN 2021 2. RISKS TO THE FINANCIAL SECTOR AND ITS RESILIENCE
In 2021H1 the profitability of our European peers’ banking systems also
improved, with it close to returning to pre-pandemic levels. Despite other
European banks also seeing net interest income decrease between June 2020
and June 2021, the steep decline in impairment provisioning led to improved
profitability in the sector at European level (see Chart 2.8.2). In recent years,
Spanish banks’ net interest income and impairment provisioning have been higher
than those of their European peers.
Profitabilityhas improvedacrosstheboard,andthesector’spre-pandemic
profitability levels have been resumed.Compared with the previous year, the
distribution of ROA in June 2021 has shifted markedly to the right. This reflects the
widespread improvement in profit in the sector. This upturn was more pronounced
at a group of banks that fared worse in June 2020. Consequently, the distribution of
ROA in June 2021 is similar to the pre-pandemic distribution (see Chart 2.7.2). Even
so, it should be borne in mind that the banking sector’s low profitability, both in
Spain and in the main European countries, was already one of the sector’s main
challenges before the pandemic broke.
The significant decline in cost of risk (provisioning) led to an improvement in the sector’s profitability at European level, despite net interest income decreasing for European banks between June 2020 and June 2021. In June 2021 the amount and geographical distribution of the profit of banks with significant international activity returned to values similar to those of June 2019.
THE GEOGRAPHICAL DISTRIBUTION OF SPANISH BANKS’ PROFIT IS APPROACHING ITS PRE-CRISIS LEVEL ANDCOMPOSITION. MEANWHILE, THE PROFITABILITY OF THE EUROPEAN BANKING SECTOR AS A WHOLE HAS IMPROVED,UNDERPINNED BY THE LOWER COST OF RISK
Chart 2.8
SOURCES: European Banking Authority and Comisión Nacional del Mercado de Valores.
a Four banks with significant international activity are included in this chart and non-recurring items in the period 2019-2021 are excluded.b Percentiles calculated based on the aggregate financial ratios published by the EBA for each of the banking systems in the EU; the United Kingdom
is excluded from the sample of countries in the three years considered. Net interest income is defined as interest income less interest expense divided by interest earning assets. Cost of risk is defined as provisioning charges divided by gross lending.
0
1
2
3
4
5
6
7
8
9
10
Jun-2019 Jun-2020 Jun-2021
ES MX GBUS BR TROTHER COUNTRIES
€bn
1 GEOGRAPHICAL DISTRIBUTION OF THE PROFIT ATTRIBUTABLE TO THE PARENT EXCL. EXTRAORDINARY ITEMS OF BANKS WITH SIGNIFICANT INTERNATIONAL ACTIVITY (a)
-1.0
-0.5
0.0
0.5
1.0
1.5
2.0
2.5
3.0
2019 2020 2021 2019 2020 2021 2019 2020 2021
Net interest income Cost of risk ROA
25TH PERCENTILE 75TH PERCENTILE SPAIN
MEDIAN
%
2 THE MAIN PROFITABILITY VARIABLES: A EUROPEAN COMPARISON (b)
0
10
20
30
40
50
60
70
80
90
100
Jun-2019 Jun-2020 Jun-2021
%
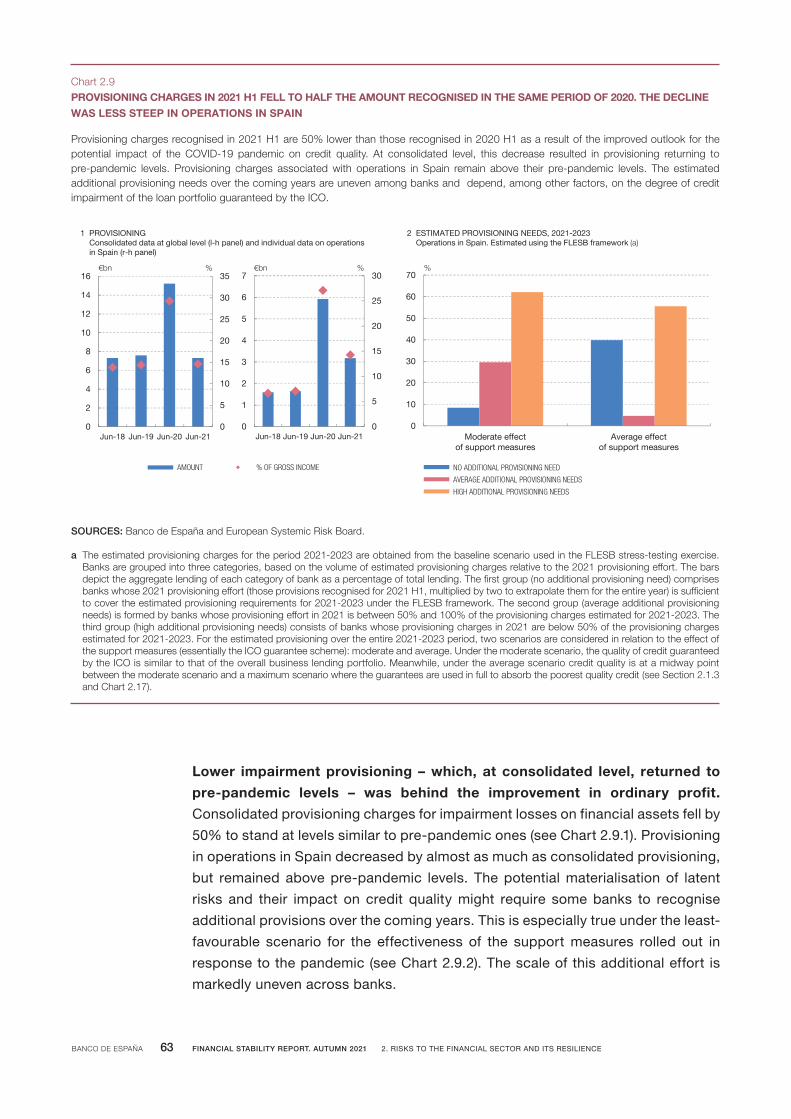
BANCO DE ESPAÑA 63 FINANCIAL STABILITY REPORT. AUTUMN 2021 2. RISKS TO THE FINANCIAL SECTOR AND ITS RESILIENCE
Lower impairment provisioning – which, at consolidated level, returned to
pre-pandemic levels – was behind the improvement in ordinary profit.
Consolidated provisioning charges for impairment losses on financial assets fell by
50% to stand at levels similar to pre-pandemic ones (see Chart 2.9.1). Provisioning
in operations in Spain decreased by almost as much as consolidated provisioning,
but remained above pre-pandemic levels. The potential materialisation of latent
risks and their impact on credit quality might require some banks to recognise
additional provisions over the coming years. This is especially true under the least-
favourable scenario for the effectiveness of the support measures rolled out in
response to the pandemic (see Chart 2.9.2). The scale of this additional effort is
markedly uneven across banks.
Provisioning charges recognised in 2021 H1 are 50% lower than those recognised in 2020 H1 as a result of the improved outlook for the potential impact of the COVID-19 pandemic on credit quality. At consolidated level, this decrease resulted in provisioning returning to pre-pandemic levels. Provisioning charges associated with operations in Spain remain above their pre-pandemic levels. The estimated additional provisioning needs over the coming years are uneven among banks and depend, among other factors, on the degree of credit impairment of the loan portfolio guaranteed by the ICO.
PROVISIONING CHARGES IN 2021 H1 FELL TO HALF THE AMOUNT RECOGNISED IN THE SAME PERIOD OF 2020. THE DECLINEWAS LESS STEEP IN OPERATIONS IN SPAIN
Chart 2.9
SOURCES: Banco de España and European Systemic Risk Board.
a The estimated provisioning charges for the period 2021-2023 are obtained from the baseline scenario used in the FLESB stress-testing exercise. Banks are grouped into three categories, based on the volume of estimated provisioning charges relative to the 2021 provisioning effort. The bars depict the aggregate lending of each category of bank as a percentage of total lending. The first group (no additional provisioning need) comprises banks whose 2021 provisioning effort (those provisions recognised for 2021 H1, multiplied by two to extrapolate them for the entire year) is sufficient to cover the estimated provisioning requirements for 2021-2023 under the FLESB framework. The second group (average additional provisioning needs) is formed by banks whose provisioning effort in 2021 is between 50% and 100% of the provisioning charges estimated for 2021-2023. The third group (high additional provisioning needs) consists of banks whose provisioning charges in 2021 are below 50% of the provisioning charges estimated for 2021-2023. For the estimated provisioning over the entire 2021-2023 period, two scenarios are considered in relation to the effect of the support measures (essentially the ICO guarantee scheme): moderate and average. Under the moderate scenario, the quality of credit guaranteed by the ICO is similar to that of the overall business lending portfolio. Meanwhile, under the average scenario credit quality is at a midway point between the moderate scenario and a maximum scenario where the guarantees are used in full to absorb the poorest quality credit (see Section 2.1.3 and Chart 2.17).
0
5
10
15
20
25
30
35
0
2
4
6
8
10
12
14
16
Jun-18 Jun-19 Jun-20 Jun-21
AMOUNT % OF GROSS INCOME
€bn
1 PROVISIONINGConsolidated data at global level (l-h panel) and individual data on operations in Spain (r-h panel)
%
0
10
20
30
40
50
60
70
Moderate effectof support measures
Average effectof support measures
NO ADDITIONAL PROVISIONING NEED
AVERAGE ADDITIONAL PROVISIONING NEEDS
HIGH ADDITIONAL PROVISIONING NEEDS
2 ESTIMATED PROVISIONING NEEDS, 2021-2023Operations in Spain. Estimated using the FLESB framework (a)
%
0
5
10
15
20
25
30
0
1
2
3
4
5
6
7
Jun-18 Jun-19 Jun-20 Jun-21
€bn %

BANCO DE ESPAÑA 64 FINANCIAL STABILITY REPORT. AUTUMN 2021 2. RISKS TO THE FINANCIAL SECTOR AND ITS RESILIENCE
Grossincomefellin2021H1comparedwiththesameperiodayearearlier,as
thedeclineinnetinterestincomewasnotoffsetbytheimprovementinnetfee
and commission income (see Annex 2). Net interest income fell 5.1% year-on-year,
while net fee and commission income increased 4%. The more than 10% drop in
gains and losses on financial assets and liabilities also contributed to the decline in
gross income. The operating expenses of the sector as a whole rose. This led to a
decline in net operating income and to an increase of almost 3 pp in the cost-to-
income ratio (from 48.8% in June 2020 to 51.7% in June 2021). However, excluding
the extraordinary costs associated with the merger of two banks during this period
(see footnote 16), net operating income would have fallen less and the cost-to-
income ratio would have improved slightly. In any event, the efficiency advantage
over our European peers’ banking systems has been retained (see Chart 2.10.1).
From a structural standpoint, the number of branches continue to fall across the
euro area, with the employment level remaining more stable (see Chart 2.10.2).
Solvency
Capitalratiosimprovedslightlyin2021H1,andsignificantlyoverthelast12
months (see Chart 2.11.1). This was due both to the increase in capital levels (the
ratios’ numerators) and to the decline in risk-weighted assets (RWAs) (the ratios’
Broadly speaking, the cost-to-income ratio of our peers’ banking systems has improved after the downturn recorded in 2020 H1 due to the period’s atypical effects. The cost-to-income ratio of Spanish institutions in 2021 is still affected by extraordinary negative factors. From a structural standpoint, the number of branches continues to decrease throughout the euro area, while the adjustment to employment has stalled.
SPANISH BANKS MAINTAIN THE COST-TO-INCOME RATIO ADVANTAGE OVER THEIR EUROPEAN PEERSChart 2.10
SOURCES: European Central Bank and European Banking Authority.
a The cost-to-income ratio is defined as the ratio between operating expenses and gross income, such that higher (lower) values refer to lower (higher) efficiency.
0
20
40
60
80
100
120
2008 2011 2014 2017 2020
SPAIN EURO AREA
2008 =100
0
20
40
60
80
100
120
2008 2011 2014 2017 2020
2008=100
2 BRANCHES (L-H PANEL) AND EMPLOYEES (R-H PANEL), BY GEOGRAPHICAL AREA
0
10
20
30
40
50
60
70
80
90
2020 2021 2020 2021 2020 2021 2020 2021 2020 2021
DE ES FR IT NL
1 COST-TO-INCOME RATIO (a)H1
RATIO AVERAGE, 2015-2019
%

BANCO DE ESPAÑA 65 FINANCIAL STABILITY REPORT. AUTUMN 2021 2. RISKS TO THE FINANCIAL SECTOR AND ITS RESILIENCE
denominator). Two distinct stages can be identified. The improvement in the common
equity tier 1 (CET1) ratio was more pronounced between June 2020 and December
2020, when it rose by 69 bp. This was the result of growth of 3.6% in CET1 and the
1.8% decline in RWAs. The measures implemented by the authorities to mitigate the
impact of the pandemic largely explain these developments.18 The increase in the CET1
ratio moderated between December 2020 and June 2021 (amounting to 14 bp) due to
lower growth in CET1 in that period (0.4%) and a smaller decline in RWAs (0.7%). A
similar pattern is observed for the Tier 1 and total capital ratios (see Chart 2.11.1).19
The increaseover the last12months in theSpanishbankingsector’sCET1
ratiowasin linewiththatofthemainEuropeancountries. The CET1 ratio of
Spanish banks continued to trail that of the main European countries and remained
around 2.7 pp off the European average (see Chart 2.11). This difference vis-à-vis the
European average existed prior to the COVID-19 crisis and owes partly to structural
factors such as the greater use of the standardised approach by Spanish banks.
18 The loss recorded inDecember 2020did not lead to lower banks solvency, largely because the significantnegativeextraordinaryitems(e.g.goodwillimpairment)affectbalancesheetitemsthatarenotcountedtowardsbanks’ prudential capital.
19 Thebringingforwardofthephase-inschedulesoftheBaselIIIframeworkcontributedtothismoderationinthegrowthofcapital ratios. In fully loadedterms,theCET1ratiogrewmost (27bp in2021H1) from12.77%inDecember2020to13.04%inJune2021.
The CET1 ratio increased by 83 bp between June 2020 and June 2021 to stand at 13.4%, as a result both of the increase in capital and the decrease in RWAs. Most of this increase (69 bp) arose in 2020 H2 and was largely due to the measures adopted by the authorities to mitigate the effects of the health crisis. The CET1 ratio of Spanish deposit institutions remains the lowest of the main European countries, while year-on-year growth in the ratio was in line with the growth recorded by our peers.
THE AGGREGATE CAPITAL RATIOS OF THE SPANISH BANKING SECTOR INCREASED SLIGHTLY IN 2021 H1Chart 2.11
SOURCES: European Banking Authority and Banco de España.
a Data for Spain are in red.b EBA data include Iceland.
8
9
10
11
12
13
14
15
16
17
18
Total capital Tier 1 capital CET1 capital
DECEMBER 2019 JUNE 2020
DECEMBER 2020 JUNE 2021
%
1 CAPITAL RATIOS
0.0
0.1
0.2
0.3
0.4
0.5
0.6
0.7
0.8
0.9
1.0
0
2
4
6
8
10
12
14
16
18
NL DE FR IT ES
EU27/EEA AVERAGE (b) YEAR-ON-YEAR CHANGE (pp) (r-h scale)
% %
2 CET1 RATIO (a)Consolidated data. June 2021Consolidated data

BANCO DE ESPAÑA 66 FINANCIAL STABILITY REPORT. AUTUMN 2021 2. RISKS TO THE FINANCIAL SECTOR AND ITS RESILIENCE
Indeed, if solvency is measured in terms of the leverage ratio, Spain’s significant
institutions (5.7%) are in line with the European average.
CET1 increased across the board, whereas the change in RWAs was more
uneven (see Chart 2.12.1). Indeed, most banks recorded a rise in RWAs. However,
the total amount of RWAs in the system fell due to the notable decline at some of the
bigger banks20 and, in particular, to the divestment in the United States by one of the
banks with the largest international presence. Overall, the CET1 ratio has improved,
which is reflected by the shift of its distribution to the right (see Chart 2.12.2).
2.1.3 Forward-looking assessment of the Spanish banking system’s resilience
Methodology applied. The FLESB framework
TheBancodeEspañahasapplieditsownFLESBmethodologicalframework
tomeasuretheresilienceofSpanishbanksintermsofsolvencyandliquidity.
20 Indeed,whileforbanksdirectlysupervisedbytheSSMRWAsdecreasedby2.9%betweenJune2020andJune2021,fortherestofthesystemtheyroseby3.5%.
Most banks increased their volume of CET1 between June 2020 and June 2021. Despite the overall decrease in RWAs in the Spanish banking sector, most banks increased their RWAs over the last year, with a small but significant number of banks reducing them. The shift towards more positive values in the distribution of the CET1 ratio was above all recorded between June 2020 and December 2020.
CET1 INCREASED ACROSS THE BOARD, WHILE THE DECLINE IN RWAs MOSTLY AFFECTED SOME SIGNIFICANT INSTITUTIONS
Chart 2.12
SOURCE: Banco de España.
a The red dots represent banks directly supervised by the SSM. The dots above the bisector depict increases (decreases) in the volume of CET1 over the last year that are higher (lower) than the increase (decrease) in the volume of RWAs. Consequently, they refer to increases in the CET1 ratio between June 2020 and June 2021. The opposite applies for the dots beneath the bisector.
b The chart depicts the CET1 ratio density function for Spanish deposit institutions, weighted by the amount of RWAs. The density function is estimated using a kernel estimator, which enables non-parametric estimation and provides a continuous, smoothed graphic representation of the function. The vertical lines denote the CET1 ratio for the Spanish banking system as a whole in June 2020 (blue), December 2020 (red) and June 2021 (orange).
-20
-15
-10
-5
0
5
10
15
20
-20 -15 -10 -5 0 5 10 15 20
BISECTOR
1 RATE OF CHANGE IN CET1 AND IN RWAs BETWEEN JUNE 2020 AND JUNE 2021 (a)
Rate of change of RWAs (%)
Rat
e of
cha
nge
of C
ET1
(%)
8 9 10 11 12 13 14 15 16 17 18 19 20
JUNE 2020 DECEMBER 2020 JUNE 2021
2 DISTRIBUTION OF THE CET1 RATIO (b)
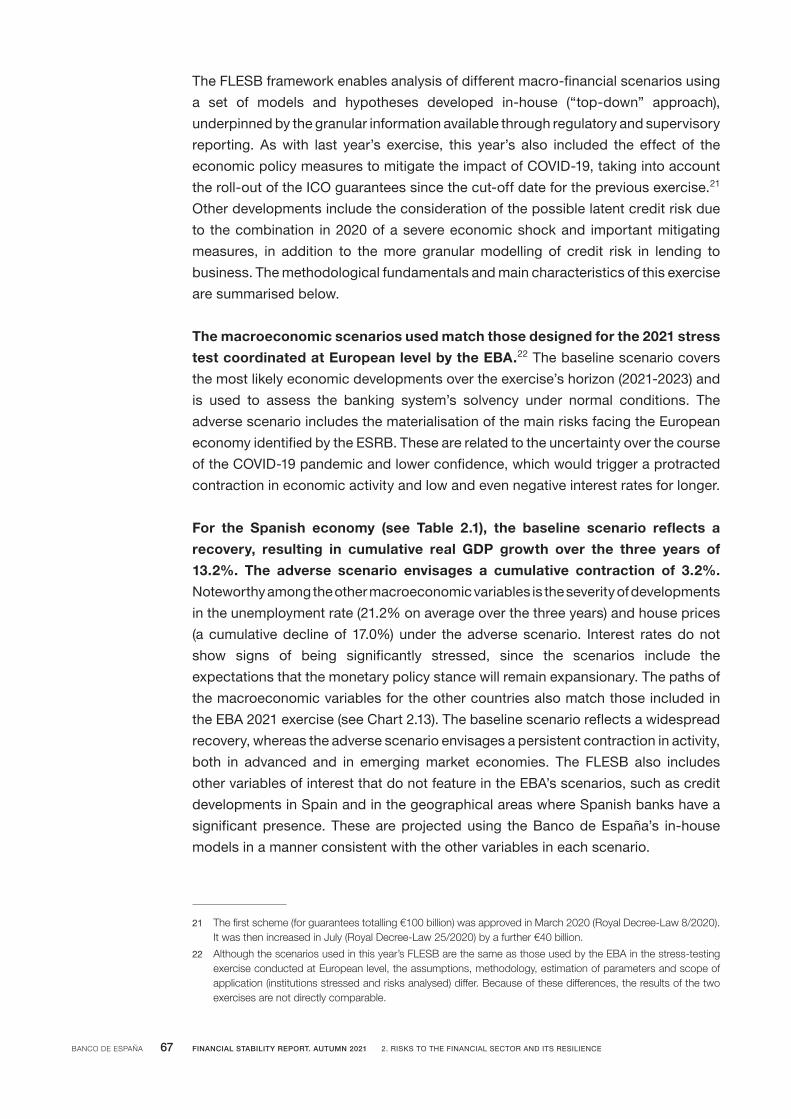
BANCO DE ESPAÑA 67 FINANCIAL STABILITY REPORT. AUTUMN 2021 2. RISKS TO THE FINANCIAL SECTOR AND ITS RESILIENCE
The FLESB framework enables analysis of different macro-financial scenarios using
a set of models and hypotheses developed in-house (“top-down” approach),
underpinned by the granular information available through regulatory and supervisory
reporting. As with last year’s exercise, this year’s also included the effect of the
economic policy measures to mitigate the impact of COVID-19, taking into account
the roll-out of the ICO guarantees since the cut-off date for the previous exercise.21
Other developments include the consideration of the possible latent credit risk due
to the combination in 2020 of a severe economic shock and important mitigating
measures, in addition to the more granular modelling of credit risk in lending to
business. The methodological fundamentals and main characteristics of this exercise
are summarised below.
Themacroeconomicscenariosusedmatchthosedesignedforthe2021stress
testcoordinatedatEuropeanlevelbytheEBA.22 The baseline scenario covers
the most likely economic developments over the exercise’s horizon (2021-2023) and
is used to assess the banking system’s solvency under normal conditions. The
adverse scenario includes the materialisation of the main risks facing the European
economy identified by the ESRB. These are related to the uncertainty over the course
of the COVID-19 pandemic and lower confidence, which would trigger a protracted
contraction in economic activity and low and even negative interest rates for longer.
For the Spanish economy (see Table 2.1), the baseline scenario reflects a
recovery, resulting in cumulative real GDP growth over the three years of
13.2%. The adverse scenario envisages a cumulative contraction of 3.2%.
Noteworthy among the other macroeconomic variables is the severity of developments
in the unemployment rate (21.2% on average over the three years) and house prices
(a cumulative decline of 17.0%) under the adverse scenario. Interest rates do not
show signs of being significantly stressed, since the scenarios include the
expectations that the monetary policy stance will remain expansionary. The paths of
the macroeconomic variables for the other countries also match those included in
the EBA 2021 exercise (see Chart 2.13). The baseline scenario reflects a widespread
recovery, whereas the adverse scenario envisages a persistent contraction in activity,
both in advanced and in emerging market economies. The FLESB also includes
other variables of interest that do not feature in the EBA’s scenarios, such as credit
developments in Spain and in the geographical areas where Spanish banks have a
significant presence. These are projected using the Banco de España’s in-house
models in a manner consistent with the other variables in each scenario.
21 Thefirstscheme(forguaranteestotalling€100billion)wasapprovedinMarch2020(RoyalDecree-Law8/2020).ItwasthenincreasedinJuly(RoyalDecree-Law25/2020)byafurther€40billion.
22 Although the scenarios used in this year’s FLESB are the same as those used by the EBA in the stress-testing exerciseconductedatEuropeanlevel,theassumptions,methodology,estimationofparametersandscopeofapplication(institutionsstressedandrisksanalysed)differ.Becauseofthesedifferences,theresultsofthetwoexercisesarenotdirectlycomparable.

BANCO DE ESPAÑA 68 FINANCIAL STABILITY REPORT. AUTUMN 2021 2. RISKS TO THE FINANCIAL SECTOR AND ITS RESILIENCE
Theportfoliosofbusinessloansarebrokendownbysectorofactivityandfirm
size to obtain a more granular estimate of the credit risk parameters.
Specifically, the sectoral breakdown of those credit portfolios has been enhanced to
a level similar to two-digit Spanish National Classification of Economic Activities
(CNAE by its Spanish initials) codes. In addition to the macroeconomic variables of
the scenarios, this more granular treatment factors in paths for real gross value
added for each sector and firms’ various financial ratios, which are consistent with
the scenarios in the projection horizon.23
Theexercisealsoenvisagesthepossiblefuturedeteriorationincreditquality,
whichdidnotmaterialisein2020becauseofthepositiveeffectoftheeconomic
policymeasures implemented inresponseto theCOVID-19. These measures
have largely mitigated the economic effects of the pandemic. Yet they have also put
off some of the financial consequences of the crisis until the future, when households
and firms will have to repay debts incurred in 2020 to meet liquidity needs stemming
from the crisis.
Tofacilitatetheirinterpretation,theresultsarepresentedinthreegroupsof
banks,asthebusinessmodelsandsourcesofriskvaryacrossthedifferent
groups. The first group comprises Spanish banks directly supervised by the SSM
with the most significant international presence.24 The second group consists of the
other banks under the direct supervision of the SSM. Lastly, the third group includes
23 The paths of real gross value added for each sector are generated using theBancodeEspaña’s in-housesectoralprojectionmodels,whichareconsistentwiththeaggregateFLESBscenarios.Thefinancialratiosareprojectedforeachfirmsizeandsectorusingmodelsthatconsiderthemacroeconomicscenariosandrealgrossvalueaddedpathsforeachsector.
24 Amongtheentitieswithsignificantinternationalactivity,thisgroupincludesthethreeinwhichit isofgreatestimportanceandmoreextendedintime.
MACROECONOMIC SCENARIOS FOR SPAIN IN THE STRESS TESTTable 2.1
SOURCE: Banco de España.
Baseline scenario2021-2023
Adverse scenario2021-2023
GDP, cumulative growth (%) 13.2 -3.2
2.120.61egareva ,)ecrof ruobal fo %( etar tnemyolpmenU
House prices, cumulative growth (%) 5.4 -17.0
3.21-5.0-)%( htworg evitalumuc ,esahcrup esuoh rof sdlohesuoh ot gnidneL
5.41-9.0-)%( htworg evitalumuc ,sdlohesuoh ot gnidnel rehto dna tiderc remusnoC
6.51-3.5-)%( htworg evitalumuc ,ssenisub ot gnidneL
6.0-5.0-)%( egareva ,etar tseretni knabretni M-21
1.13.0)%( egareva ,dleiy dnob ngierevos raey-01

BANCO DE ESPAÑA 69 FINANCIAL STABILITY REPORT. AUTUMN 2021 2. RISKS TO THE FINANCIAL SECTOR AND ITS RESILIENCE
smaller banks with no significant international presence which are under the direct
supervision of the Banco de España. In all cases, the impacts in terms of the fully
loaded CET1 ratio are shown.
Results of the stress tests
Forthegroupofbankswithgreater internationalactivitysupervisedbythe
SSMan increaseof1ppandadecreaseof2.2pp in theirCET1ratiowere
projectedunderthebaselineandadversescenarios,respectively (see Chart
2.14). This group’s starting CET1 ratio was 11.8 pp, lower than that of the other two
groups of banks. Under the baseline scenario, available provisions to cover
impairment losses in Spain (2% of RWAs) and the capacity to generate new capital
(4.2% of RWAs) offset the volume of impairment losses in operations in Spain and
sovereign exposure valuation adjustments (overall, 3.7% of RWAs). As a result of the
global recovery forecast over the period 2021-2023, operations outside Spain help
increase net profit under the baseline scenario. Conversely, the other impacts make
a negative contribution (1.6% of RWAs) to solvency, due to the net effect of other
gains and losses, the effect of taxes and profit distributions. The final result is a
CET1 ratio of 12.8 pp in 2023. Under the adverse scenario, the continued contraction
in activity results in a significantly lower generation of capital (1% of RWAs). This is
largely because of the greater impairment losses in operations outside Spain and, in
The scenarios for the other geographical areas where Spanish banks have significant activity are also consistent with those used in the EBA stress-testing exercise conducted at European level. The baseline scenario assumes a widespread recovery, whereas the adverse scenario envisages the materialisation of risks to financial stability related to the uncertainty surrounding the course of the COVID-19 pandemic and a drop in confidence causing a prolongation of the downturn.
IN THE GEOGRAPHICAL AREAS WHERE SPANISH BANKS HAVE SIGNIFICANT PRESENCE, THE BASELINE SCENARIOENVISAGES A WIDESPREAD RECOVERY, WHEREAS THE ADVERSE SCENARIO REFLECTS A PROLONGATION OF THECONTRACTION TRIGGERED BY THE COVID-19 PANDEMIC
Chart 2.13
SOURCE: Banco de España.
16.0
13.3
6.25.0
10.7
6.0
21.2
16.2
8.57.6
16.3
9.7
0
5
10
15
20
25
ES BR GB MX TR US
BASELINE SCENARIO ADVERSE SCENARIO
2 AVERAGE UNEMPLOYMENT RATE, 2021-2023
%
13.2
7.5
11.3
8.1
13.1
8.5
-3.2 -4.6 -4.1 -4.6 -3.6 -3.7-6
-4
-2
0
2
4
6
8
10
12
14
16
ES BR GB MX TR US
1 CUMULATIVE CHANGE IN GDP, 2021-2023
%

BANCO DE ESPAÑA 70 FINANCIAL STABILITY REPORT. AUTUMN 2021 2. RISKS TO THE FINANCIAL SECTOR AND ITS RESILIENCE
the same vein, impairment losses in Spain totalling 5.7% of RWAs. Under the adverse
scenario, the CET1 ratio stands at 9.6% at the end of the projection horizon.
For the other banks supervised by the SSM, an increase of 1.3 pp and a
decreaseof 3.3pp in theCET1 ratio areestimatedunder thebaselineand
adversescenarios,respectively (see Chart 2.15). This group’s CET1 ratio at the
start of the exercise (13.9%) was better than that of banks with significant international
activity. Under the baseline scenario, impairment losses in Spain (9.3% of RWAs) are
significantly higher than in the case of banks with significant international activity
because of the lesser geographical distribution of their risks. Provisions (4.7%) and
the generation of net operating income (5.8%) more than suffice to absorb the
impairment losses, thereby raising the CET1 ratio to 15.2%. Under the adverse
scenario, generation of capital falls vis-à-vis the baseline scenario (4.2% of RWAs)
and impairment losses increase (15.4% of RWAs). This results in solvency being
undermined, despite the positive contribution (3.2%) of the other impacts, associated
with the lower lending projected under this scenario. Capital consumption under the
adverse scenario is higher than for the other groups of banks, resulting in a CET1
ratio of 10.6% in 2023.
Banks with significant international exposure remain notably resilient, despite the relatively high volume of impairment losses in operations in Spain under both scenarios. Under the baseline scenario the use of provisions and the generation of capital offset the impairment losses, while under the adverse scenario the additional impairment and lower capital-generation capacity lead to a decrease in the 2023 CET1 ratio compared with the starting ratio. However, it remains above the minimum requirement.
THE BANKS WITH THE LARGEST INTERNATIONAL PRESENCE REMAIN FIRMLY RESILIENT, EVEN TO THE CONTINUED GLOBAL DOWNTURN ENVISAGED UNDER THE ADVERSE SCENARIO
Chart 2.14
SOURCE: Banco de España.
a The red (green) bars indicate a negative (positive) contribution of the corresponding item to the change in the CET1 ratio at the end of the projection horizon (2023) compared with the start of the exercise (2020).
b Generation of loss-absorbing capital in the case of banks with significant international activity includes the net operating income for Spain and net profit in operations abroad.
c Impairment losses on loans and foreclosed assets in operations in Spain and the impact on capital of a potential deterioration of sovereign exposures at consolidated level.
d Other consolidated gains and losses, tax effects, exchange differences, dividend distribution and changes in RWAs.
11.8%2.0%
4.2%3.7%
1.6%12.8%
0
4
8
12
16
20
CET1 2020 Provisionsused
in Spain
Capitalgeneration
(% ofRWAs2020)
(b)2020)
(b)
Impairmentlosses in
Spain andon sovereignexposures
(% of RWAs 2020) (c)
Otherimpacts (d)
CET1 2023
1 BASELINE SCENARIO (a)
%
11.8%
2.1% 1.0% 5.7%
0.5% 9.6%
0
4
8
12
16
20
CET1 2020 Provisionsused
in Spain
Capitalgeneration
(% ofRWAs
Impairmentlosses in
Spain andon sovereignexposures
(% of RWAs 2020) (c)
Otherimpacts (d)
CET1 2023
2 ADVERSE SCENARIO (a)
%
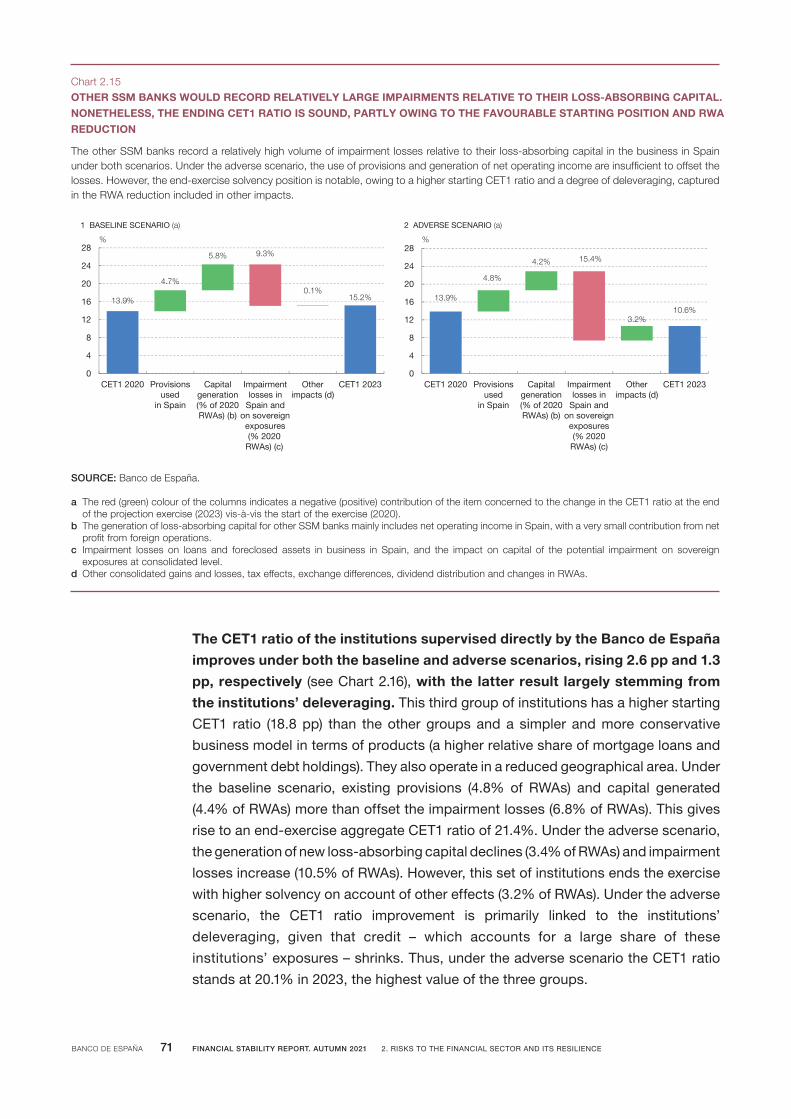
BANCO DE ESPAÑA 71 FINANCIAL STABILITY REPORT. AUTUMN 2021 2. RISKS TO THE FINANCIAL SECTOR AND ITS RESILIENCE
TheCET1ratiooftheinstitutionssuperviseddirectlybytheBancodeEspaña
improvesunderboththebaselineandadversescenarios,rising2.6ppand1.3
pp,respectively (see Chart 2.16), withthelatterresult largelystemmingfrom
theinstitutions’deleveraging.This third group of institutions has a higher starting
CET1 ratio (18.8 pp) than the other groups and a simpler and more conservative
business model in terms of products (a higher relative share of mortgage loans and
government debt holdings). They also operate in a reduced geographical area. Under
the baseline scenario, existing provisions (4.8% of RWAs) and capital generated
(4.4% of RWAs) more than offset the impairment losses (6.8% of RWAs). This gives
rise to an end-exercise aggregate CET1 ratio of 21.4%. Under the adverse scenario,
the generation of new loss-absorbing capital declines (3.4% of RWAs) and impairment
losses increase (10.5% of RWAs). However, this set of institutions ends the exercise
with higher solvency on account of other effects (3.2% of RWAs). Under the adverse
scenario, the CET1 ratio improvement is primarily linked to the institutions’
deleveraging, given that credit – which accounts for a large share of these
institutions’ exposures – shrinks. Thus, under the adverse scenario the CET1 ratio
stands at 20.1% in 2023, the highest value of the three groups.
The other SSM banks record a relatively high volume of impairment losses relative to their loss-absorbing capital in the business in Spain under both scenarios. Under the adverse scenario, the use of provisions and generation of net operating income are insufficient to offset the losses. However, the end-exercise solvency position is notable, owing to a higher starting CET1 ratio and a degree of deleveraging, captured in the RWA reduction included in other impacts.
OTHER SSM BANKS WOULD RECORD RELATIVELY LARGE IMPAIRMENTS RELATIVE TO THEIR LOSS-ABSORBING CAPITAL.NONETHELESS, THE ENDING CET1 RATIO IS SOUND, PARTLY OWING TO THE FAVOURABLE STARTING POSITION AND RWAREDUCTION
Chart 2.15
SOURCE: Banco de España.
a The red (green) colour of the columns indicates a negative (positive) contribution of the item concerned to the change in the CET1 ratio at the end of the projection exercise (2023) vis-à-vis the start of the exercise (2020).
b The generation of loss-absorbing capital for other SSM banks mainly includes net operating income in Spain, with a very small contribution from net profit from foreign operations.
c Impairment losses on loans and foreclosed assets in business in Spain, and the impact on capital of the potential impairment on sovereign exposures at consolidated level.
d Other consolidated gains and losses, tax effects, exchange differences, dividend distribution and changes in RWAs.
13.9%
4.7%
5.8% 9.3%
0.1%15.2%
0
4
8
12
16
20
24
28
CET1 2020 Provisionsused
in Spain
Capitalgeneration(% of 2020RWAs) (b)
Impairmentlosses in
Spain andon sovereignexposures
Otherimpacts (d)
CET1 2023
1 BASELINE SCENARIO (a)
%
13.9%
4.8%
4.2% 15.4%
3.2%10.6%
0
4
8
12
16
20
24
28
CET1 2020 Provisionsused
in Spain
Capitalgeneration(% of 2020RWAs) (b)
Impairmentlosses in
Spain andon sovereignexposures(% 2020
RWAs) (c)(% 2020
RWAs) (c)
Otherimpacts (d)
CET1 2023
2 ADVERSE SCENARIO (a)
%
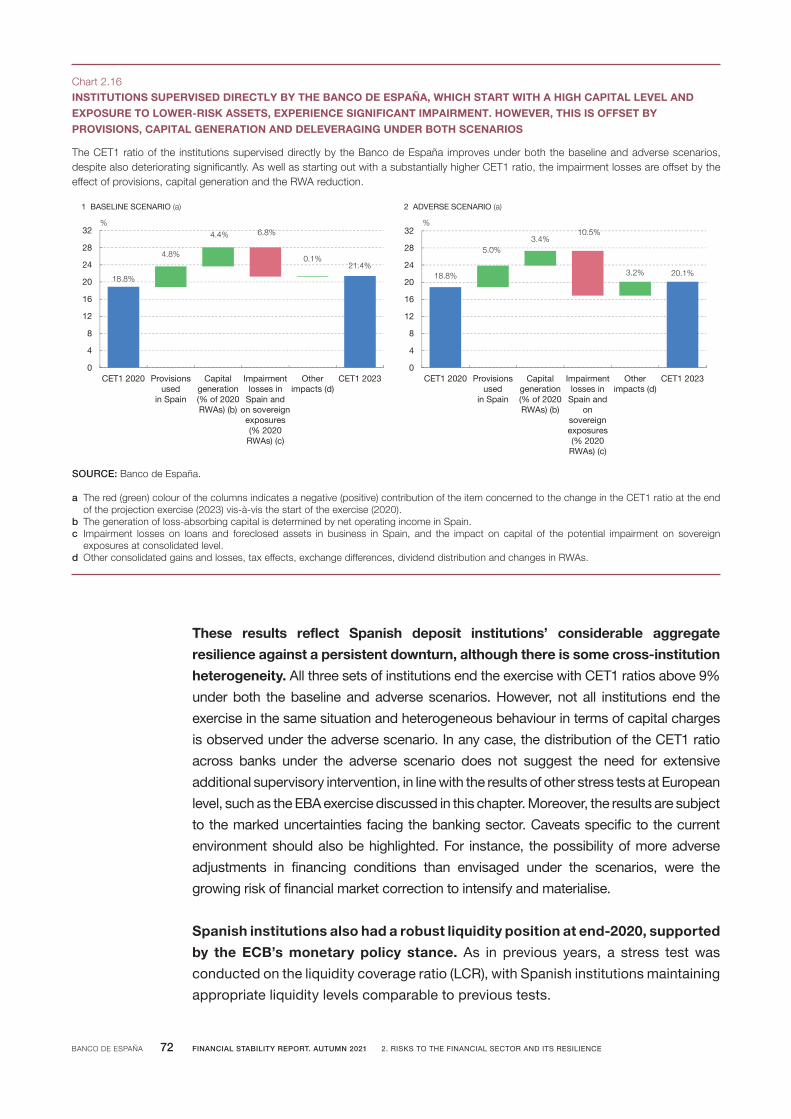
BANCO DE ESPAÑA 72 FINANCIAL STABILITY REPORT. AUTUMN 2021 2. RISKS TO THE FINANCIAL SECTOR AND ITS RESILIENCE
These results reflect Spanish deposit institutions’ considerable aggregate
resilience against a persistent downturn, although there is some cross-institution
heterogeneity. All three sets of institutions end the exercise with CET1 ratios above 9%
under both the baseline and adverse scenarios. However, not all institutions end the
exercise in the same situation and heterogeneous behaviour in terms of capital charges
is observed under the adverse scenario. In any case, the distribution of the CET1 ratio
across banks under the adverse scenario does not suggest the need for extensive
additional supervisory intervention, in line with the results of other stress tests at European
level, such as the EBA exercise discussed in this chapter. Moreover, the results are subject
to the marked uncertainties facing the banking sector. Caveats specific to the current
environment should also be highlighted. For instance, the possibility of more adverse
adjustments in financing conditions than envisaged under the scenarios, were the
growing risk of financial market correction to intensify and materialise.
Spanishinstitutionsalsohadarobustliquiditypositionatend-2020,supported
by theECB’smonetary policy stance. As in previous years, a stress test was
conducted on the liquidity coverage ratio (LCR), with Spanish institutions maintaining
appropriate liquidity levels comparable to previous tests.
The CET1 ratio of the institutions supervised directly by the Banco de España improves under both the baseline and adverse scenarios, despite also deteriorating significantly. As well as starting out with a substantially higher CET1 ratio, the impairment losses are offset by the effect of provisions, capital generation and the RWA reduction.
INSTITUTIONS SUPERVISED DIRECTLY BY THE BANCO DE ESPAÑA, WHICH START WITH A HIGH CAPITAL LEVEL ANDEXPOSURE TO LOWER-RISK ASSETS, EXPERIENCE SIGNIFICANT IMPAIRMENT. HOWEVER, THIS IS OFFSET BYPROVISIONS, CAPITAL GENERATION AND DELEVERAGING UNDER BOTH SCENARIOS
Chart 2.16
SOURCE: Banco de España.
a The red (green) colour of the columns indicates a negative (positive) contribution of the item concerned to the change in the CET1 ratio at the end of the projection exercise (2023) vis-à-vis the start of the exercise (2020).
b The generation of loss-absorbing capital is determined by net operating income in Spain.c Impairment losses on loans and foreclosed assets in business in Spain, and the impact on capital of the potential impairment on sovereign
exposures at consolidated level.d Other consolidated gains and losses, tax effects, exchange differences, dividend distribution and changes in RWAs.
18.8%
4.8%
4.4% 6.8%
0.1%21.4%
0
4
8
12
16
20
24
28
32
CET1 2020 Provisionsused
in Spain
Capitalgeneration(% of 2020RWAs) (b)
Impairmentlosses in
Spain andon sovereignexposures(% 2020
RWAs) (c)
Otherimpacts (d)
CET1 2023
1 BASELINE SCENARIO (a)
%
18.8%
5.0%3.4%
10.5%
3.2% 20.1%
0
4
8
12
16
20
24
28
32
CET1 2020 Provisionsused
in Spain
Capitalgeneration(% of 2020RWAs) (b)
Impairmentlosses in
Spain andon
sovereignexposures(% 2020
RWAs) (c)
Otherimpacts (d)
CET1 2023
2 ADVERSE SCENARIO (a)
%

BANCO DE ESPAÑA 73 FINANCIAL STABILITY REPORT. AUTUMN 2021 2. RISKS TO THE FINANCIAL SECTOR AND ITS RESILIENCE
Granular assessment of the effect of State guarantees and firms’ PDs
TheexercisefactorsinthemitigatingeffectonSpanishinstitutions’solvency
hadbythepublicguaranteeschemeforbusiness lending. Since the scale of
this effect remains uncertain, an impact range has been estimated taking into
account various assumptions regarding the probability of default of the guaranteed
loans (see Chart 2.17.1). The bottom end of the range assumes that the expected loss
is equal to the average for the corporate credit portfolio; the top end assumes that
the guaranteed loans are concentrated among higher-risk debtors. The previous
section’s findings are based on the impact of the ICO guarantees standing at the
midpoint of this range. It should be borne in mind that the more impairment losses
the programme is able to absorb, the greater its budgetary cost.
Themitigating effects of theState guarantee scheme for business lending
includereducingthelossgivendefault,butalsoloweringtheriskweightsof
State guarantees for corporate credit have a positive impact on the CET1 ratio under both scenarios, particularly the adverse scenario. The more granular treatment of corporate credit portfolios means risk is captured based on sensitivity to the economic cycle and specific potential shocks that may affect each sector and firm size.
ICO GUARANTEES LIMIT THE IMPACT ON CAPITAL OF LOAN LOSSES. THIS IS PARTICULARLY TRUE UNDER THE ADVERSESCENARIO, WHICH PRESENTS AN UNEVEN CREDIT QUALITY IMPAIRMENT RELATIVE TO THE BASELINE SCENARIO ACROSS FIRMS OF DIFFERENT SIZE AND SECTOR
Chart 2.17
SOURCE: Banco de España.
a The effect of the guarantee facility under an intermediate assumption, together with the restrictions on profit distribution and the impact of TLTROs, are incorporated into the main analysis, the results of which are set out in Charts 2.14, 2.15 and 2.16.
b Shown is the range of the measure's impact on the expected loss of the corporates portfolio (left panel) and on the CET1 ratio (right panel), depending on the assumptions regarding the credit quality of loans extended to firms and sole proprietors in Spain under the ICO guarantee facility. The minimum effect assumes that the expected loss is equal to the average of the corporate lending portfolio, while the maximum effect assumes that NPL inflows are primarily concentrated among guaranteed loans. The black line denotes the midrange effect.
c Probability of default (PD) is defined as the probability of transitioning from performing status to non-performing status in a 12-month period. This probability is estimated using a model that links observed PD to the firms’ macroeconomic variables and financial ratios. The chart shows the density function of the difference (in pp) between the PD estimated for each sector under the adverse scenario vis-à-vis the baseline scenario. This is estimated for each bank, but the weighted average for each sector is shown. The weighting is based on number of holders. The density function is approximated by means of a kernel estimator, which enables non-parametric estimation and provides a continuous, smoothed graphic representation of the function.
0
10
20
30
40
50
60
70
80
90
% expectedloss absorbed -
Baseline
% expectedloss absorbed -
Adverse
1 EFFECT OF ICO GUARANTEE FACILITY (a) (b)
%
0.0
0.5
1.0
1.5
2.0
2.5
3.0
CET1 ratioimprovement -
Baseline
CET1 ratioimprovement -
Adverse
pp (CET1 ratio improvement)
0 1 2 3 4 5 6
PD differences (pp)
LARGE FIRMS SMEs AND SOLE PROPRIETORS
2 DISTRIBUTION BY SECTOR AND SIZE OF PD DIFFERENCESBETWEEN THE ADVERSE AND BASELINE SCENARIOS (c)

BANCO DE ESPAÑA 74 FINANCIAL STABILITY REPORT. AUTUMN 2021 2. RISKS TO THE FINANCIAL SECTOR AND ITS RESILIENCE
the loans. The risk weight of the guaranteed portion of the loans granted under
the scheme are lowered to the 0% risk weight assigned to sovereign exposures.
In the event of default, the loss is assumed proportionally by the State. Thus,
under the baseline scenario the assumptions regarding the guaranteed loans’
credit quality would result in the guarantees absorbing between 11.5% and 69.5%
of the expected loss (midpoint of 40.5%), while under the adverse scenario the
range is from 15.4% to 78.5% (midpoint of 47%).25 The impact on the CET1 ratio
at the midpoint would be 0.6 pp and 1.7 pp under the baseline and adverse
scenario, respectively.
The firms’ characteristics (size, sector, etc.) have a bearing on the PDs
projected for the loans. Hence, under the adverse scenario the increase in PD
relative to the baseline scenario is larger for small and medium-sized enterprises
(see Chart 2.17.2). Likewise, much cross-sector heterogeneity is observed in the
difference between PDs under the baseline and adverse scenarios.
Results of the EU-wide stress test published by the European Banking Authority
TheresultsobtainedbytheEBAfor50banksintheEuropeanUnionandthe
European Economic Area show a CET1 capital ratio increase under the
baselinescenarioandasignificantcontractionundertheadversescenario.
Under the baseline scenario, this ratio would rise from 15% (fully loaded at end-
2020) to 15.8% in 2023 (see Chart 2.18.1). The Spanish institutions participating in
the exercise26 would, under this scenario, record a far sharper ratio increase (2.2 pp),
rising from 11.9% (fully loaded in December 2020) to 14.1% at the end of the projection
horizon. Under the adverse scenario the participating institutions would, overall, see
their CET1 capital ratio fall by 4.9 pp, placing it at 10.2% of RWAs at the end of the
exercise. The reduction is smaller for Spanish banks (of 2.9 pp to 9%). Thus, Spanish
banks show greater resilience to the adverse scenario and greater capacity to
generate capital under the baseline scenario than their European peers, despite
starting out with a lower capital ratio. This was also true in the 2018 EU-wide stress
tests coordinated by the EBA.
Spanish banks face one of the smallest adverse impacts on capital ratios
under the adverse scenario. A country-level analysis of the results (see Chart
2.18.2) places Spanish banks (together with those of Poland and Norway) among
those that experience a smaller capital ratio impact. At the other end of the scale are
25 The topendof the rangeassumes thatNPL inflowsareconcentratedamongguaranteed loans,which thusabsorbthebulkofthelosses.ThisresultconstitutesanupperboundtotheimpactoncapitalabsorbedbyICOguarantees.Foritspart,thelowerendoftherangeassumesthattheguaranteedloanlossesareequaltotheaverageforthecorporatecreditportfolio.
26 BancoSantander,S.A.,BancoBilbaoVizcayaArgentaria,S.A.,BancoSabadell,S.A.andBankinter,S.A.

BANCO DE ESPAÑA 75 FINANCIAL STABILITY REPORT. AUTUMN 2021 2. RISKS TO THE FINANCIAL SECTOR AND ITS RESILIENCE
Danish and Irish banks, whose CET1 capital ratios end the exercise down by more
than 6 pp.
Thedifferences–intermsofmethodology,scopeandrisksanalysed–between
the EBA exercise and the FLESB lie behind certain disparities in the results
obtained forSpanishbanks.The most significant differences between the two
exercises are associated with the fact that the EBA methodology assumes a static
balance sheet in all years. By contrast, the FLESB adapts to the macroeconomic
developments implicit in the scenarios. Similarly, the EBA-coordinated exercises
consider the impact of the scenarios on market and operational risk, aspects that fall
partially outside the scope of the FLESB. The EBA exercise likewise considers a
small sample of all Spanish deposit institutions, compared with the broader coverage
provided by the FLESB. In any event, both exercises evidence the Spanish banking
sector’s aggregate resilience to an adverse economic environment.
2.1.4 Deposit institutions’ operational risks
Spanishbanks’operationalrisklosseshavebeenindeclinesince2015,witha
simultaneous increase in perceived cyber risks. Despite the reduction in
operational risk losses (see Chart 2.19.1), the number of external fraud events has
increased, with the vast majority being cyber incidents. It comes as no surprise,
then, that concern surrounding cybersecurity has intensified over the last decade (see
The results obtained show that the participating institutions would, overall, see their CET1 capital ratio increase slightly under the baseline scenario and decline by nearly 5 pp under the adverse scenario. The solvency of Spanish banks would change more favourably than the average for participating institutions in both exercises.
EUROPEAN BANKS SHOW STRONG RESILIENCE UNDER THE ADVERSE SCENARIO OF THE EBA STRESS TEST, WITH BETTER-THAN-AVERAGE RESILIENCE FOR SPANISH BANKS
Chart 2.18
SOURCE: European Banking Authority.
15.0
11.9
15.8
14.1
10.29.0
0
2
4
6
8
10
12
14
16
18
Participating banks overall Spanish banks
CET1 FL 2020 CET1 FL 2023 BASELINECET1 FL 2023 ADVERSE
1 INITIAL CET1 FL AND RESULTS OF THE EBA STRESS TEST Participating banks overall vs Spanish banks
%
-7
-6
-5
-4
-3
-2
-1
0
PL NO ES SE HU BE AT FI NL FR DE IT IE DK
EU/EEA AVERAGE
2 ADVERSE SCENARIO RESULT, COMPARISON ACROSS COUNTRIESCET1 FL ratio reduction at the end of the exercise horizon
pp

BANCO DE ESPAÑA 76 FINANCIAL STABILITY REPORT. AUTUMN 2021 2. RISKS TO THE FINANCIAL SECTOR AND ITS RESILIENCE
Chart 2.19.2). The extraordinary circumstances of 2020 and the necessary commitment
to remote working created new opportunities for cybercriminals to exploit the growing
reliance on communication networks. The three main types of cybersecurity incidents
in 2020 were data kidnapping, data theft and server hacking. The banking sector is
particularly susceptible to such attacks, as evidenced by it topping the ranking in terms
of attack numbers for the fifth consecutive year. Guarding against these increasingly
frequent and costly incidents entails banks implementing safeguards and mitigation
measures. The immediate monetary costs stemming from cyber risk are highly
uncertain. However, the total costs would be even greater and material, since the critical
asset of customer confidence would be compromised.
2.2 Non-bank financial sector and systemic interconnections
2.2.1 Non-bank financial sector
Specialised lending institutions
Thecreditextendedbyspecialisedlendinginstitutions(SLIs)stabilisedinthe
last 12 months, while NPLs declined and income statements recovered. In
Operational risk losses have declined significantly since 2015, although the number of external fraud events has increased. Concern over the possible future impact of cyber risks is on a rising trajectory, as revealed by Google searches, although the scant data hinders any systematic measurement of their impact and cost.
OPERATIONAL RISK LOSSES HAVE DECLINED IN RECENT YEARS, BUT THERE IS GROWING CONCERN OVER THE FUTURECOSTS OF CYBER RISKS
Chart 2.19
SOURCES: Google Trends and Banco de España.
a The number of Google Trends searches is standardised using the number of searches for cybersecurity events in January 2010 as base 100.
0
10
20
30
40
50
60
70
0
1
2
3
4
5
6
7
8
OTHER EVENTS
BUSINESS DISRUPTION AND SYSTEM FAILURES
EXECUTION, DELIVERY & PROCESS MANAGEMENT
EXTERNAL FRAUD
CUSTOMERS, PRODUCTS AND BUSINESS PRACTICES
FIVE HIGHEST OPERATIONAL RISK LOSSES (% OF TOTAL) (Right-hand scale)
1 OPERATIONAL RISK. TOTAL LOSSESConsolidated data. December 2020
%€bn
0100200300400500600700800900
1,0001,1001,2001,3001,400
Jan-10 Jul-11 Jan-13 Jul-14 Jan-16 Jul-17 Jan-19 Jul-20
CYBERSECURITY DATA SECURITY
FINANCIAL STABILITY
2 GOOGLE TRENDS ON CYBERSECURITY (2010-2021) (a)
Cybersecurity event searches in January 2010 = 100
Dec-14 Dec-15 Dec-16 Dec-17 Dec-18 Dec-19 Dec-20

BANCO DE ESPAÑA 77 FINANCIAL STABILITY REPORT. AUTUMN 2021 2. RISKS TO THE FINANCIAL SECTOR AND ITS RESILIENCE
June 2021 the credit extended by SLIs to the resident private sector grew by 0.2%
year-on-year, improving markedly on previous quarters. The consumer credit
portfolio (a segment in which SLIs specialise) grew by 5.4% year-on-year, drawing
close to pre-pandemic levels. NPLs declined sharply in the last 12 months (-13.1%),
although much of that fall owed to the write-off of NPLs at a single institution. Thus,
the NPL ratio in June 2021 stood at 6.5%, down 1 pp on the same month a year
earlier. As with banks, the moderation of loan loss provisions has led to growth in
profit after tax, in this case by 11.8%, increasing the ROA by 30 bp over the last 12
months to 1.8% in June 2021.
Insurance companies
In the insurance sector, profitability and solvency indicators were largely
unchangedin2021H1,whilethecompanies’premiumsandtotalassetsboth
grew.27 Specifically, the volume of premiums increased by 5.5% as compared with
the same period a year earlier, with stronger growth in life premiums (9.3%) than
non-life premiums (3.4%). The overall saving managed by insurance companies
increased by 3.2% as compared with the same period a year earlier.
Investment funds
Investmentfundsdomiciledintheeuroarearecordednetcapitalinflowsin
2021 H1. Inflows have steadily recovered since end-2020, coinciding with an
improvement in economic expectations (see Chart 2.20.1), and rising returns in
some segments, following the sharp outflows during the initial weeks of the
pandemic in certain segments of the industry. This recovery has been intense,
comfortably offsetting the outflows that took place at the onset of the crisis, with
the exception of funds domiciled in Italy. Developments in capital flows differ
across the various vehicles, with equity funds recording the strongest flows.
Inflows have been more moderate for mixed funds, which invest in both fixed
income and equity, and above all in bond and money market funds, with some
jurisdictions even registering net capital outflows.
Spanishinvestmentfundstendtohaveafixed-incomeportfoliowithshorter
maturitiesandlargerliquidityholdingsthanaverageforeuroareafunds. For
the latter, the average maturity of fixed-income portfolios is around ten years, while
that for funds domiciled in Spain is considerably shorter (around four and a half
27 On22September2021, theEuropeanCommissionadopted the revisionof theSolvency IIDirective,whichincludedalegislativeproposaltoamendDirective2009/138/ECandalegislativeproposalforanewInsuranceRecoveryandResolutionDirective.Thechangestothesolvencydirectiveareexpectedtoreleasecapitalinthesector,thusfosteringlong-terminvestmentandassetgrowth.
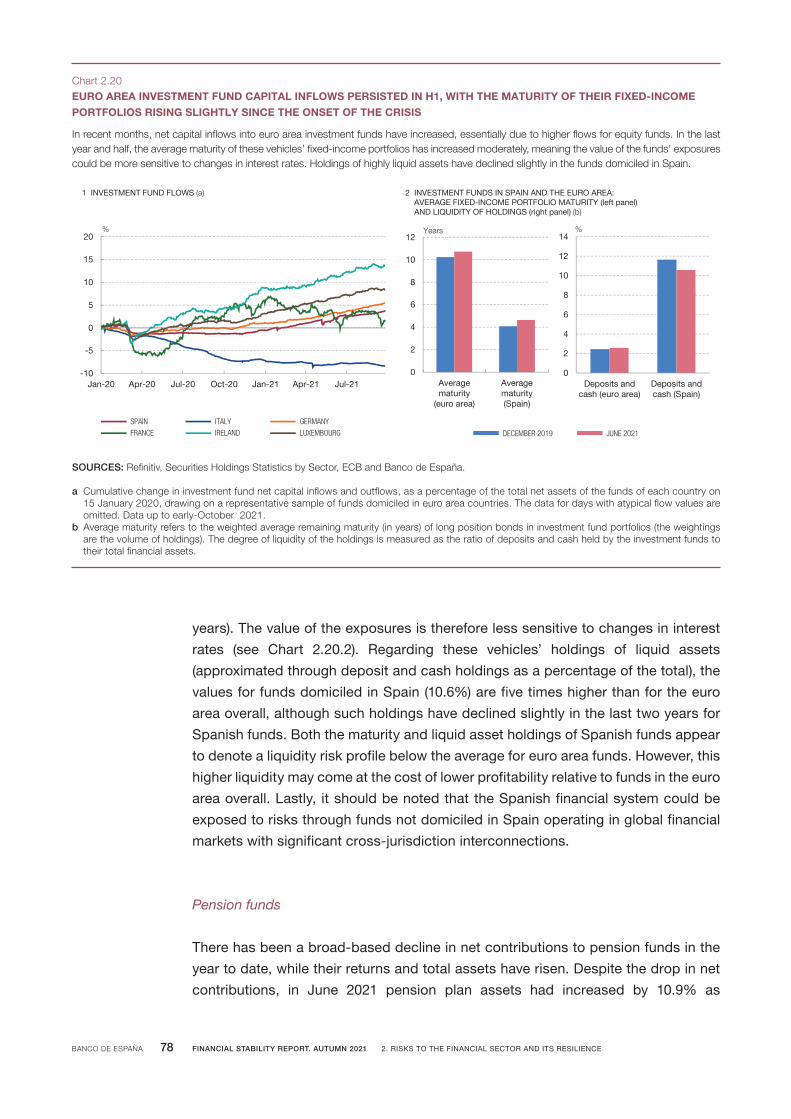
BANCO DE ESPAÑA 78 FINANCIAL STABILITY REPORT. AUTUMN 2021 2. RISKS TO THE FINANCIAL SECTOR AND ITS RESILIENCE
years). The value of the exposures is therefore less sensitive to changes in interest
rates (see Chart 2.20.2). Regarding these vehicles’ holdings of liquid assets
(approximated through deposit and cash holdings as a percentage of the total), the
values for funds domiciled in Spain (10.6%) are five times higher than for the euro
area overall, although such holdings have declined slightly in the last two years for
Spanish funds. Both the maturity and liquid asset holdings of Spanish funds appear
to denote a liquidity risk profile below the average for euro area funds. However, this
higher liquidity may come at the cost of lower profitability relative to funds in the euro
area overall. Lastly, it should be noted that the Spanish financial system could be
exposed to risks through funds not domiciled in Spain operating in global financial
markets with significant cross-jurisdiction interconnections.
Pension funds
There has been a broad-based decline in net contributions to pension funds in the
year to date, while their returns and total assets have risen. Despite the drop in net
contributions, in June 2021 pension plan assets had increased by 10.9% as
In recent months, net capital inflows into euro area investment funds have increased, essentially due to higher flows for equity funds. In the last year and half, the average maturity of these vehicles’ fixed-income portfolios has increased moderately, meaning the value of the funds’ exposures could be more sensitive to changes in interest rates. Holdings of highly liquid assets have declined slightly in the funds domiciled in Spain.
EURO AREA INVESTMENT FUND CAPITAL INFLOWS PERSISTED IN H1, WITH THE MATURITY OF THEIR FIXED-INCOME PORTFOLIOS RISING SLIGHTLY SINCE THE ONSET OF THE CRISIS
Chart 2.20
SOURCES: Refinitiv, Securities Holdings Statistics by Sector, ECB and Banco de España.
a Cumulative change in investment fund net capital inflows and outflows, as a percentage of the total net assets of the funds of each country on 15 January 2020, drawing on a representative sample of funds domiciled in euro area countries. The data for days with atypical flow values are omitted. Data up to early-October 2021.
b Average maturity refers to the weighted average remaining maturity (in years) of long position bonds in investment fund portfolios (the weightings are the volume of holdings). The degree of liquidity of the holdings is measured as the ratio of deposits and cash held by the investment funds to their total financial assets.
-10
-5
0
5
10
15
20
Jan-20 Apr-20 Jul-20 Oct-20 Jan-21 Apr-21 Jul-21
SPAIN ITALY GERMANY
FRANCE IRELAND LUXEMBOURG
1 INVESTMENT FUND FLOWS (a)
%
0
2
4
6
8
10
12
Averagematurity
(euro area)
Averagematurity(Spain)
DECEMBER 2019 JUNE 2021
2 INVESTMENT FUNDS IN SPAIN AND THE EURO AREA: AVERAGE FIXED-INCOME PORTFOLIO MATURITY (left panel) AND LIQUIDITY OF HOLDINGS (right panel) (b)
Years
0
2
4
6
8
10
12
14
Deposits andcash (euro area)
Deposits andcash (Spain)
%
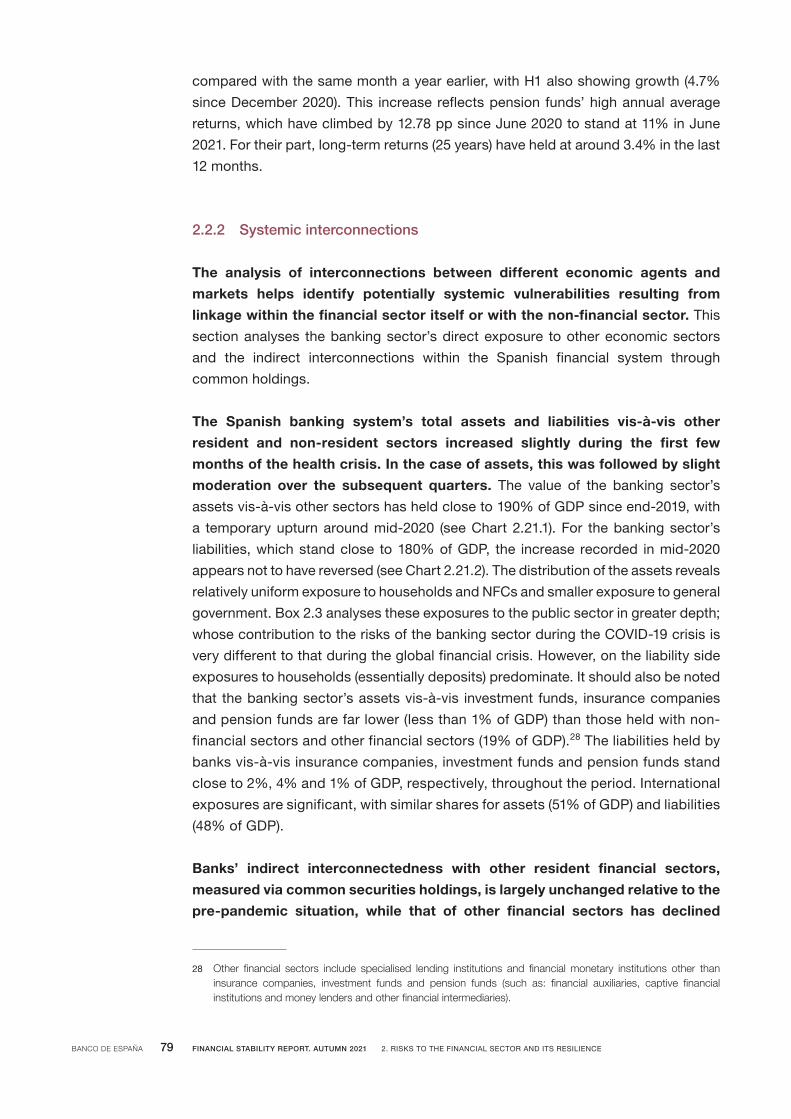
BANCO DE ESPAÑA 79 FINANCIAL STABILITY REPORT. AUTUMN 2021 2. RISKS TO THE FINANCIAL SECTOR AND ITS RESILIENCE
compared with the same month a year earlier, with H1 also showing growth (4.7%
since December 2020). This increase reflects pension funds’ high annual average
returns, which have climbed by 12.78 pp since June 2020 to stand at 11% in June
2021. For their part, long-term returns (25 years) have held at around 3.4% in the last
12 months.
2.2.2 Systemic interconnections
The analysis of interconnections between different economic agents and
markets helps identify potentially systemic vulnerabilities resulting from
linkagewithinthefinancialsectoritselforwiththenon-financialsector. This
section analyses the banking sector’s direct exposure to other economic sectors
and the indirect interconnections within the Spanish financial system through
common holdings.
The Spanish banking system’s total assets and liabilities vis-à-vis other
resident and non-resident sectors increased slightly during the first few
monthsofthehealthcrisis.Inthecaseofassets,thiswasfollowedbyslight
moderation over the subsequent quarters. The value of the banking sector’s
assets vis-à-vis other sectors has held close to 190% of GDP since end-2019, with
a temporary upturn around mid-2020 (see Chart 2.21.1). For the banking sector’s
liabilities, which stand close to 180% of GDP, the increase recorded in mid-2020
appears not to have reversed (see Chart 2.21.2). The distribution of the assets reveals
relatively uniform exposure to households and NFCs and smaller exposure to general
government. Box 2.3 analyses these exposures to the public sector in greater depth;
whose contribution to the risks of the banking sector during the COVID-19 crisis is
very different to that during the global financial crisis. However, on the liability side
exposures to households (essentially deposits) predominate. It should also be noted
that the banking sector’s assets vis-à-vis investment funds, insurance companies
and pension funds are far lower (less than 1% of GDP) than those held with non-
financial sectors and other financial sectors (19% of GDP).28 The liabilities held by
banks vis-à-vis insurance companies, investment funds and pension funds stand
close to 2%, 4% and 1% of GDP, respectively, throughout the period. International
exposures are significant, with similar shares for assets (51% of GDP) and liabilities
(48% of GDP).
Banks’ indirect interconnectedness with other resident financial sectors,
measuredviacommonsecuritiesholdings,islargelyunchangedrelativetothe
pre-pandemic situation, while that of other financial sectors has declined
28 Other financial sectors include specialised lending institutions and financialmonetary institutions other thaninsurance companies, investment funds and pension funds (such as: financial auxiliaries, captive financialinstitutionsandmoneylendersandotherfinancialintermediaries).
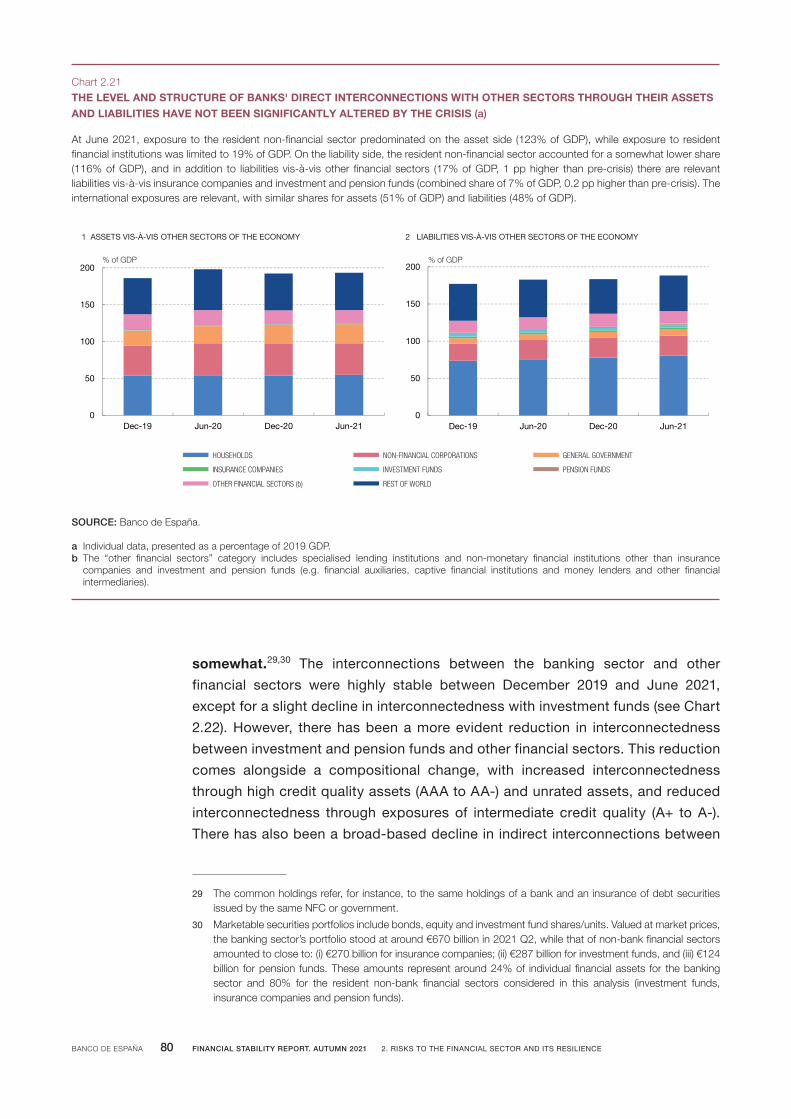
BANCO DE ESPAÑA 80 FINANCIAL STABILITY REPORT. AUTUMN 2021 2. RISKS TO THE FINANCIAL SECTOR AND ITS RESILIENCE
somewhat.29,30 The interconnections between the banking sector and other
financial sectors were highly stable between December 2019 and June 2021,
except for a slight decline in interconnectedness with investment funds (see Chart
2.22). However, there has been a more evident reduction in interconnectedness
between investment and pension funds and other financial sectors. This reduction
comes alongside a compositional change, with increased interconnectedness
through high credit quality assets (AAA to AA-) and unrated assets, and reduced
interconnectedness through exposures of intermediate credit quality (A+ to A-).
There has also been a broad-based decline in indirect interconnections between
29 Thecommonholdingsrefer,forinstance,tothesameholdingsofabankandaninsuranceofdebtsecuritiesissued by the same NFC or government.
30 Marketablesecuritiesportfoliosincludebonds,equityandinvestmentfundshares/units.Valuedatmarketprices,thebankingsector’sportfoliostoodataround€670billionin2021Q2,whilethatofnon-bankfinancialsectorsamountedtocloseto:(i)€270billionforinsurancecompanies;(ii)€287billionforinvestmentfunds,and(iii)€124billion forpension funds.Theseamounts representaround24%of individual financialassets for thebankingsector and 80% for the resident non-bank financial sectors considered in this analysis (investment funds,insurancecompaniesandpensionfunds).
At June 2021, exposure to the resident non-financial sector predominated on the asset side (123% of GDP), while exposure to resident financial institutions was limited to 19% of GDP. On the liability side, the resident non-financial sector accounted for a somewhat lower share (116% of GDP), and in addition to liabilities vis-à-vis other financial sectors (17% of GDP, 1 pp higher than pre-crisis) there are relevant liabilities vis-à-vis insurance companies and investment and pension funds (combined share of 7% of GDP, 0.2 pp higher than pre-crisis). The international exposures are relevant, with similar shares for assets (51% of GDP) and liabilities (48% of GDP).
THE LEVEL AND STRUCTURE OF BANKS' DIRECT INTERCONNECTIONS WITH OTHER SECTORS THROUGH THEIR ASSETS AND LIABILITIES HAVE NOT BEEN SIGNIFICANTLY ALTERED BY THE CRISIS (a)
Chart 2.21
SOURCE: Banco de España.
a Individual data, presented as a percentage of 2019 GDP.b The “other financial sectors” category includes specialised lending institutions and non-monetary financial institutions other than insurance
companies and investment and pension funds (e.g. financial auxiliaries, captive financial institutions and money lenders and other financial intermediaries).
0
50
100
150
200
Dec-19 Jun-20 Dec-20 Jun-21
1 ASSETS VIS-À-VIS OTHER SECTORS OF THE ECONOMY
% of GDP
0
50
100
150
200
Dec-19 Jun-20 Dec-20 Jun-21
% of GDP
2 LIABILITIES VIS-À-VIS OTHER SECTORS OF THE ECONOMY
HOUSEHOLDS NON-FINANCIAL CORPORATIONS GENERAL GOVERNMENT
INSURANCE COMPANIES INVESTMENT FUNDS PENSION FUNDS
OTHER FINANCIAL SECTORS (b) REST OF WORLD
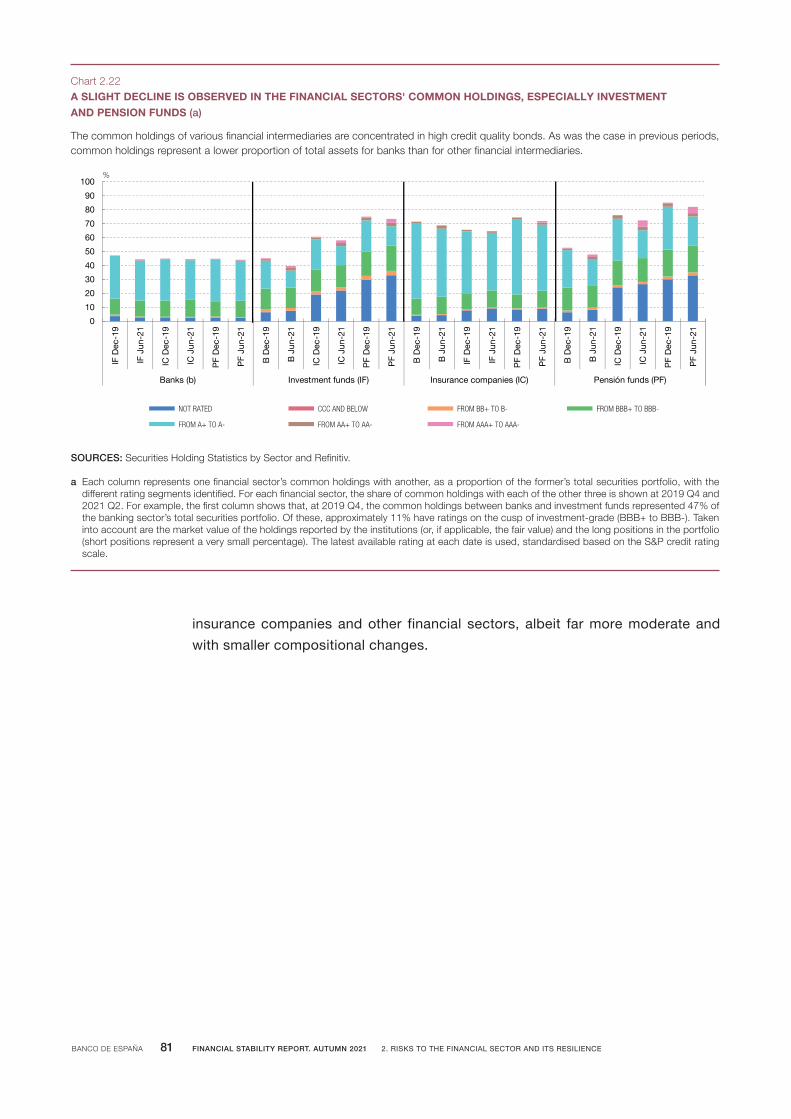
BANCO DE ESPAÑA 81 FINANCIAL STABILITY REPORT. AUTUMN 2021 2. RISKS TO THE FINANCIAL SECTOR AND ITS RESILIENCE
insurance companies and other financial sectors, albeit far more moderate and
with smaller compositional changes.
The common holdings of various financial intermediaries are concentrated in high credit quality bonds. As was the case in previous periods, common holdings represent a lower proportion of total assets for banks than for other financial intermediaries.
A SLIGHT DECLINE IS OBSERVED IN THE FINANCIAL SECTORS' COMMON HOLDINGS, ESPECIALLY INVESTMENT AND PENSION FUNDS (a)
Chart 2.22
SOURCES: Securities Holding Statistics by Sector and Refinitiv.
a Each column represents one financial sector’s common holdings with another, as a proportion of the former’s total securities portfolio, with the different rating segments identified. For each financial sector, the share of common holdings with each of the other three is shown at 2019 Q4 and 2021 Q2. For example, the first column shows that, at 2019 Q4, the common holdings between banks and investment funds represented 47% of the banking sector’s total securities portfolio. Of these, approximately 11% have ratings on the cusp of investment-grade (BBB+ to BBB-). Taken into account are the market value of the holdings reported by the institutions (or, if applicable, the fair value) and the long positions in the portfolio (short positions represent a very small percentage). The latest available rating at each date is used, standardised based on the S&P credit rating scale.
0
10
20
30
40
50
60
70
80
90
100
IF D
ec-1
9
IF J
un-2
1
IC D
ec-1
9
IC J
un-2
1
PF
Dec
-19
PF
Jun-
21
B D
ec-1
9
B J
un-2
1
IC D
ec-1
9
IC J
un-2
1
PF
Dec
-19
PF
Jun-
21
B D
ec-1
9
B J
un-2
1
IF D
ec-1
9
IF J
un-2
1
PF
Dec
-19
PF
Jun-
21
B D
ec-1
9
B J
un-2
1
IC D
ec-1
9
IC J
un-2
1
PF
Dec
-19
PF
Jun-
21
)FP( sdnuf nóisneP)CI( seinapmoc ecnarusnI)FI( sdnuf tnemtsevnI)b( sknaB
NOT RATED CCC AND BELOW FROM BB+ TO B- FROM BBB+ TO BBB-
FROM A+ TO A- FROM AA+ TO AA- FROM AAA+ TO AAA-
%
BANCO DE ESPAÑA 82 FINANCIAL STABILITY REPORT. AUTUMN 2021 2. RISKS TO THE FINANCIAL SECTOR AND ITS RESILIENCE
Recuadro ?.?
TÍTULO RECUADRORecuadro ?.?
TÍTULO RECUADRORecuadro ?.?
TÍTULO RECUADRO
Box2.1
IMPACT OF THE PUBLIC GUARANTEE SCHEME ON LENDING RELATIONSHIPS BETWEEN FIRMS AND BANKS
The main aim of the ICO guarantee scheme, set in place under successive Royal Decrees (RDL 8/2020, RDL 25/2020 and RDL 34/2020), is to enable firms1 to draw on the funds needed to deal with the fall-out of the crisis brought about by the sudden emergence of COVID-19. While such guarantees have had great success in providing liquidity to prop up and ensure firms’ survival during the initial phases of the crisis,2 their effects will be felt beyond 2020. Thus, this scheme may have longer-term consequences – analysed in this box – for the lending relationships between non-financial corporations and the banking sector. In particular, the characteristics of the firms and banks involved in ICO transactions are analysed, and the impact of the ICO scheme on the level and structure of banking relationships.
Firm-bank characteristics associated with the granting of ICO loans
To analyse the likelihood of a firm receiving an ICO-backed loan, all firm-bank pairings on the Banco de España’s Central Credit Register (CCR) in respect of new financing transactions arranged between March and December 2020 are identified. Firm-bank pairings in respect of new financing transactions requested by firms in that same period from banks with which they had no prior relationship have been added to this group. The database also includes all banking relationships at December 2019 involving the firms that have obtained and/or requested funding identified in the two preceding steps. Lastly, the database is completed with economic and financial information on this set of firms at end-2019, drawing on the Banco de España’s Central Balance Sheet Data Office (CBSO) and using figures from banks’ end-2019 balance sheets and income statements taken from their regulatory reporting to the Banco de España. As a result, the group
of firms that have actively sought funding is identified, and their associated structure of pre-existing banking relationships and the characteristics of the lending banks.
Drawing on all this information, a linear probability model is estimated to ascertain which variables have most influence (and with what outcome) on the likelihood of a firm having received an ICO-backed loan between March and December 2020.3 The firm-specific explanatory variables include size, ex-ante credit risk score based on firms’ financial ratios, and economic sector indicators and postcode. The bank-specific explanatory variables include their size, capital ratio, profitability, and liquidity and NPL ratios. Lastly, the closeness of the firm-bank relationship is measured according to each bank’s share of a firm’s overall bank borrowing.4
As can be seen in Chart 1, the characteristics of firms most likely to have been granted ICO guarantees are size (being an SME increases their chances by 28.5%), level of ex-ante risk (the chances increase by 10.1% for each standard deviation by which the score decreases) or belonging to a sector affected by the pandemic (increase of 11.1%). Larger banks, those with more liquid assets, with a higher NPL ratio or lower profitability are also associated with a greater likelihood of an ICO guarantee being granted (increasing, respectively, by 30.7%, 5.6%, 7.9% and 7.5% for each standard variation by which the explanatory variable worsens). Moreover, the closer the prior banking relationship (measured by the share of financing), the higher the probability (increase of 10.7% per standard deviation). These results are confirmed where the analysis is limited to firms that have relationships with several banks, including fixed firm-specific effects. It is thus possible to fully control for firm characteristics, including demand for financing.5
1 Theanalysisusesaccountingandfinancialratiosoffirmsin2019andisthusrestrictedtonon-financialcorporations(referredtogenerallyasfirmsintherestofthebox),excludingsoleproprietors.
2 See,forexample,Alvesetal.(2020),Recentdevelopmentsinfinancingandbanklendingtothenon-financialsector, Analytical Article, Economic Bulletin4/2020,BancodeEspaña,inparticularBox1,andR.Blanco,S.Mayordomo,Á.MenéndezandM.Mulino(2020),Spanishnon-financialcorporations’liquidityneedsandsolvencyaftertheCOVID-19shock, Occasional Paper No 2020, Banco de España.
3 Thedependentvariableoftheanalysistakesthevalueof1intheobservationswhereanICOloanhaseffectivelybeenobtainedoverthisperiod.Bycontrast, thedependentvariable takes thevalueof0 inobservationsrelating to: (a)new lendingwithoutan ICOguarantee; (b) loanapplicationsrejected;and(c)previousbank-firmrelationshipsnotresultinginnewfinancing,whetherornotICO-backed.
4 Topreventpossibleendogeneityproblems,alltheexplanatoryvariablesweremeasuredatend-2019.Standarderrorsarecorrectedatbankandfirmclusterlevel,bothinthisestimationandinallothersdescribedinthisbox.
5 Thisadditionalanalysis includesinteractionsoftheshareinfinancingvariablewithotherexplanatoryvariables,revealingthatacloserpre-existingrelationshipentailsahigherlikelihoodthatICOfinancingwillbegrantedwhereafirmwithgreaterex-anterisk,fromanaffectedsector,orbankswithlowercapitalandhigherNPLratios,areinvolved.

BANCO DE ESPAÑA 83 FINANCIAL STABILITY REPORT. AUTUMN 2021 2. RISKS TO THE FINANCIAL SECTOR AND ITS RESILIENCE
Recuadro ?.?
TÍTULO RECUADROBox2.1
IMPACT OF THE PUBLIC GUARANTEE SCHEME ON LENDING RELATIONSHIPS BETWEEN FIRMS AND BANKS (cont’d)
Impact of the ICO guarantee scheme on the level and structure of bank-firm financing relationships
The impact of the ICO guarantee scheme on the closeness of bank-firm financing relationships was also
analysed, and the extent to which the continuation of such relationships has depended on the use of ICO-backed loans. To this end, a difference-in-differences analysis was conducted, comparing (for each firm-bank pairing) changes in their share of financing between
SOURCE: Banco de España.
a Each bar denotes the relative change in the average probability of a non-financial corporation having received at least one ICO-backed loan between March and December 2020 as the variable indicated in the x axis increases, from a standard deviation if it is continuous or shifting from zero to one if it is discrete (Firms SMEs, Firms Sector most affected). For this calculation a linear probability model was estimated using CCR data, cross-matched with CBB data on firms, and bank data extracted from their regulatory reporting to the Banco de España at end-2019. Firms' ex-ante risk is captured with a variable obtained from a scoring model, calculated based on a high number of its financial ratios. The severely affected sectors by the crisis are defined as those whose turnover decreased by more than 15% in 2020. Bank size is measured in terms of the logarithm of total assets.
b Each bar denotes the impact (in percentage points) that a bank's arranging with a firm at least one ICO-backed loan between December 2019 and June 2021 has on the change in the share of financing of the bank and the firm between those dates, estimated using a difference-indifferences model drawing on CCR, CBB and regulatory reporting data.
c Each bar denotes the impact (in percentage points) that a bank's arranging with a firm at least one ICO-backed loan between December 2019 and June 2021 has on the change in the share of financing of the bank and the firm between those dates, according to the residual maturity (in months) of the firm's pre-existing loans with the bank at December 2019. The bank's share of the firm's total financing and its share of financing without ICO guarantees are considered. The impact has been estimated using a difference-in-differences model drawing on CCR, CBB and regulatory reporting data, with fixed firm-specific effects (limited to firms with more than two bank relationships).
0
5
10
15
20
25
30
35
FirmsSMEs
FirmsSeverelyaffectedsectors
Firms(+) Ex-ante
risk
Banks(+) Size
Banks(+) Liquidity
Banks(-) ROA
Banks(+) NPL
ratio
Chart 1IMPACT OF FIRM-BANK CHARACTERISTICS ON THE LIKELIHOOD OF ICO-BACKED LOANS BEING GRANTEDMarch-December 2020 (a)
pp
-10
-5
0
5
10
15
20
Change in non-ICOshare. Totalpopulation
Change in non-ICOshare. Firms with >1
bank relationship
Change in totalshare. Totalpopulation
Change in totalshare. Firms with >1
bank relationship
Chart 2IMPACT OF THE GRANTING OF AN ICO-BACKED LOAN ON THE SHARE OF THE FIRM'S FINANCING WITH THE LENDING BANK (b)December 2019-June 2021
pp
-15
-10
-5
0
5
10
15
20
25
1 2 5 15 37 66 189
SHARE WITHOUT GUARANTEES TOTAL SHARE
Chart 3IMPACT OF THE GRANTING OF AN ICO-BACKED LOAN ON THE CHANGE IN THE LENDING BANK'S SHARE OF FINANCING, ACCORDING TO THE BORROWING FIRM'S PRE-EXISTING RESIDUAL BANK DEBT MATURITY (c)
pp

BANCO DE ESPAÑA 84 FINANCIAL STABILITY REPORT. AUTUMN 2021 2. RISKS TO THE FINANCIAL SECTOR AND ITS RESILIENCE
Recuadro ?.?
TÍTULO RECUADROBox2.1
IMPACT OF THE PUBLIC GUARANTEE SCHEME ON LENDING RELATIONSHIPS BETWEEN FIRMS AND BANKS (cont’d)
December 2019 and June 2021. This share is defined as the amount of loans obtained from each bank as a proportion of the bank funding the firm obtains. Two definitions of this share are analysed, for firms’ total bank funding and for financing excluding ICO-backed loans. In the terminology used in this type of study, firms with some type of ICO-backed loan during the period studied make up the treatment or study group, while all other observations make up the control group.6 As in the previous section, the characteristics of the firms and the lending banks are also taken into account.
Chart 2 shows that the grant of an ICO-backed loan by a bank to a firm is associated with a reduction in that bank’s share of bank loans without an ICO guarantee which that firm receives. Specifically, the change in the share of financing in loans without an ICO guarantee from December 2019 to June 2021 is 4.7 percentage points (pp) lower on average in this case. This effect is even more pronounced (8.1 pp lower) when the sample is restricted to firms with more than two bank relationships. When the impact of granting an ICO-backed loan on the bank’s share of the firm’s total financing (including the financing guaranteed) is analysed, the opposite effect is observed: the change when an ICO-backed loan is granted is 14.6 pp higher for the total sample. Once again, the impact is greater (17.1 pp higher) when the sample is restricted to firms operating with more than one bank.
These results suggest that granting ICO-backed loans
makes the overall firm-bank relationship closer, although it
weakens when only the group of loans without public
guarantees is considered. Consequently, it may be
concluded that the granting of an ICO-backed loan is
associated with different loan supply behaviour by the
lending bank, which seeks to reinforce its relationship with
the firm, but via loans with guarantees, reducing its
exposure through other transactions.
As regards financing without an ICO guarantee, the
above-mentioned reduction in share has been particularly
sharp among firms with short residual bank debt
maturities at end-2019. This suggests that banks and
firms have replaced loans that have matured or are close
to maturity with new ICO-guaranteed loans (see Chart 3).
The fall in the share of financing without an ICO guarantee
is also sharper for firms with a greater ex-ante risk,
belonging to sectors hardest hit by the pandemic, and
for banksthat had lower capital ratios at the start of the
crisis. As regards the share of total financing, which
includes ICO-backed loans, the presence of short
residual maturities at December 2019 is associated with
a more positive change (owing to the granting of new
ICO-backed loans), albeit to a lesser extent for firms with
a poorer ex-ante risk score.
6 Theintensityofthetreatmentwasalsoanalysedusingacontinuousvariablecalculatedastheguaranteedamountasaproportionofthefirm’sassetsatDecember2019.Theresultsobtainedreinforcethosedescribedhere,observingstrongereffectsforamoreintensetreatment(greaterweightoftheguaranteesasaproportionoftotalassets).
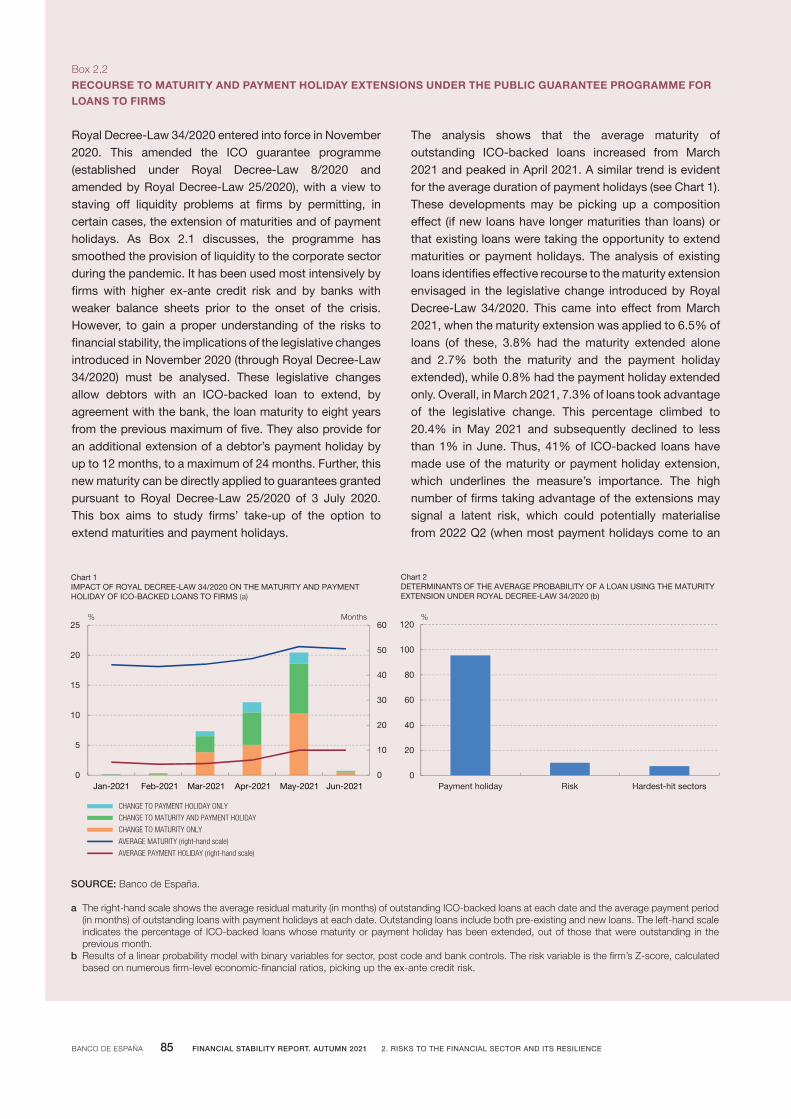
Royal Decree-Law 34/2020 entered into force in November 2020. This amended the ICO guarantee programme (established under Royal Decree-Law 8/2020 and amended by Royal Decree-Law 25/2020), with a view to staving off liquidity problems at firms by permitting, in certain cases, the extension of maturities and of payment holidays. As Box 2.1 discusses, the programme has smoothed the provision of liquidity to the corporate sector during the pandemic. It has been used most intensively by firms with higher ex-ante credit risk and by banks with weaker balance sheets prior to the onset of the crisis. However, to gain a proper understanding of the risks to financial stability, the implications of the legislative changes introduced in November 2020 (through Royal Decree-Law 34/2020) must be analysed. These legislative changes allow debtors with an ICO-backed loan to extend, by agreement with the bank, the loan maturity to eight years from the previous maximum of five. They also provide for an additional extension of a debtor’s payment holiday by up to 12 months, to a maximum of 24 months. Further, this new maturity can be directly applied to guarantees granted pursuant to Royal Decree-Law 25/2020 of 3 July 2020. This box aims to study firms’ take-up of the option to extend maturities and payment holidays.
The analysis shows that the average maturity of outstanding ICO-backed loans increased from March 2021 and peaked in April 2021. A similar trend is evident for the average duration of payment holidays (see Chart 1). These developments may be picking up a composition effect (if new loans have longer maturities than loans) or that existing loans were taking the opportunity to extend maturities or payment holidays. The analysis of existing loans identifies effective recourse to the maturity extension envisaged in the legislative change introduced by Royal Decree-Law 34/2020. This came into effect from March 2021, when the maturity extension was applied to 6.5% of loans (of these, 3.8% had the maturity extended alone and 2.7% both the maturity and the payment holiday extended), while 0.8% had the payment holiday extended only. Overall, in March 2021, 7.3% of loans took advantage of the legislative change. This percentage climbed to 20.4% in May 2021 and subsequently declined to less than 1% in June. Thus, 41% of ICO-backed loans have made use of the maturity or payment holiday extension, which underlines the measure’s importance. The high number of firms taking advantage of the extensions may signal a latent risk, which could potentially materialise from 2022 Q2 (when most payment holidays come to an
Box2.2
RECOURSE TO MATURITY AND PAYMENT HOLIDAY EXTENSIONS UNDER THE PUBLIC GUARANTEE PROGRAMME FOR LOANS TO FIRMS
SOURCE: Banco de España.
a The right-hand scale shows the average residual maturity (in months) of outstanding ICO-backed loans at each date and the average payment period (in months) of outstanding loans with payment holidays at each date. Outstanding loans include both pre-existing and new loans. The left-hand scale indicates the percentage of ICO-backed loans whose maturity or payment holiday has been extended, out of those that were outstanding in the previous month.
b Results of a linear probability model with binary variables for sector, post code and bank controls. The risk variable is the firm’s Z-score, calculated based on numerous firm-level economic-financial ratios, picking up the ex-ante credit risk.
0
10
20
30
40
50
60
0
5
10
15
20
25
CHANGE TO PAYMENT HOLIDAY ONLY
CHANGE TO MATURITY AND PAYMENT HOLIDAY
CHANGE TO MATURITY ONLY
AVERAGE MATURITY (right-hand scale)
AVERAGE PAYMENT HOLIDAY (right-hand scale)
Chart 1IMPACT OF ROYAL DECREE-LAW 34/2020 ON THE MATURITY AND PAYMENT HOLIDAY OF ICO-BACKED LOANS TO FIRMS (a)
% Months
Payment holiday Risk Hardest-hit sectors0
20
40
60
80
100
120
Chart 2DETERMINANTS OF THE AVERAGE PROBABILITY OF A LOAN USING THE MATURITY EXTENSION UNDER ROYAL DECREE-LAW 34/2020 (b)
%
Jan-2021 Feb-2021 Mar-2021 Apr-2021 May-2021 Jun-2021
BANCO DE ESPAÑA 85 FINANCIAL STABILITY REPORT. AUTUMN 2021 2. RISKS TO THE FINANCIAL SECTOR AND ITS RESILIENCE

Box2.2
RECOURSE TO MATURITY AND PAYMENT HOLIDAY EXTENSIONS UNDER THE PUBLIC GUARANTEE PROGRAMME FOR LOANS TO FIRMS (cont’d)
end) should the prospects of economic recovery fail to take root.
The study of decisions to extend maturities and payment holidays is based on all guaranteed loans obtained from the Banco de España’s Central Credit Register (CCR). Those data are complemented, at the firm level, by data drawn from the Banco de España’s Central Balance Sheet Data Office (CBSO) and, at the bank level, from the institutions’ regulatory reporting, in both cases relating to end-2019. This dataset is subject to an econometric analysis to assess the probability of an existing guaranteed loan taking advantage of Royal Decree-Law 34/2020 to extend either its maturity or payment holiday. Specifically, the estimates of a linear probability model (see Chart 2) indicate that the probability of extending the maturity or payment holiday is higher for loans with an existing payment holiday (95.4% higher than those without, indicating the complimentary use of these measures to defer payments). Bearing in mind the very widespread
recourse to payment holidays, the relative importance of firm-level factors is comparatively lower. Thus, belonging to one of the sectors hardest hit by the pandemic increases this probability by 7.3%, while firms with higher ex-ante credit risk show an increase of 10% for each standard deviation decrease in the score. There is no overall pattern regarding the characteristics of the banks that have assented to these arrangements, and therefore their use appears prevalent across the banks.
The analysis of recourse to maturity and payment holiday extensions for ICO-backed loans suggests strong demand. Said demand is higher for loans with an existing payment holiday and for firms facing greater difficulties. The results indicate an improvement in the firms’ liquidity profile, with the subsequent easing of short-term risks. However, they reinforce the importance of closely monitoring these loans during the recovery period, to ensure that any materialisation of risks to financial stability is detected at an early juncture.
BANCO DE ESPAÑA 86 FINANCIAL STABILITY REPORT. AUTUMN 2021 2. RISKS TO THE FINANCIAL SECTOR AND ITS RESILIENCE

In certain contexts, the existence of a high number of financial interconnections between banks and the public sector may pose risks to financial stability. The interconnections exist primarily because banks are typically significant holders of government debt securities and, furthermore, fiscal intervention is perceived as being the last resort in the event the banking sector faces solvency problems. Potential banking system or sovereign problems may result in a doom loop. The doom loop between the banking system and the sovereign materialised directly following the global financial crisis and in the subsequent sovereign debt crisis of 2012 which affected several European countries. In the wake of the global pandemic, the ICO guarantees represent an interconnection shared by banks and the public sector with the corporate sector.1 This box aims to describe how these nexus work and review the materiality of the risk to the Spanish banking system stemming from the interconnections with the sovereign after the outbreak of the global pandemic.
The sovereign-bank nexus can create feedback loops through two fundamental channels, as shown in Figure 1, which are separate from the indirect nexus with the non-financial corporate sector.2 First, problems in the banking system spread to the sovereign when the latter is expected to bail out a bank. Here, the expected budgetary cost associated with the bail-out increases the sovereign’s financing costs. Second, a drop in the price of sovereign debt impairs banks’ sovereign debt holdings on their balance sheets. This is particularly pronounced when these holdings are significant and are mostly measured at market value. This spillover from the sovereign to banks drives up the cost of bank financing. Consequently, lending by the banking system contracts, generating a tightened “liquidity channel” (see Bocola (2016))3.
In both cases there may be feedback loops, as higher financing costs for the sovereign have an adverse effect on banks’ balance sheets as holders of sovereign debt, and vice versa. In addition, the widespread increase in financing
costs reduces economic growth. This has adverse implications both for the quality of banks’ balance sheets and for government budget balances.
Banks’ government debt holdings are key in the sovereign-bank nexus. These holdings are justified, among other reasons, due to banks’ need to hold liquid assets on their balance sheets; government debt tends to be the safest and most liquid asset on the financial markets. Indeed, general government debt holdings account for the largest share of Spanish banks’ debt securities (see Chart 1). Spanish banks’ exposure to sovereign risk through these holdings has remained relatively stable since December 2019 (between 9.1% and 10.5% of total consolidated assets). This contrasts with the sharp rise in bank lending to the private sector during the initial phases of the pandemic.
As a percentage of total assets, Spanish banks’ holdings of Spanish sovereign debt are greater than those of French and German banks, but smaller than those of Italian banks. However, it should be noted that Spanish and Italian banks’ greater exposure largely originated from the global financial crisis. This is particularly true in the case of Spanish banks. Indeed, during the years leading up to the pandemic, the Spanish banking sector had gradually reduced its exposure to the Spanish sovereign. The COVID-19 crisis disrupted this trend, albeit without increasing exposure, as occurred during the global financial crisis (see Chart 3). Specifically, the main Spanish banks’ holdings of government debt, as a percentage of total assets, fell slightly during the pandemic. The decrease was greater in fair-value debt holdings, which are those that create greater exposure to the doom loop, as their valuation is updated automatically on the basis of debt market fluctuations (see Chart 4). This trend is similar to that of other euro area banking systems, except Italy, where these holdings have risen.
Finally, in the wake of the global pandemic, the corporate sector’s financial problems could become central to the
Box2.3
THE SOVEREIGN-BANK NEXUS
1 ForageneraldiscussionofinterconnectionsacrossthecorporatesectorseeGross,C.,AndC.Pancaro(2021).Credit risk transmission during the pandemic:thesovereign-bank-corporatenexus,Box4,ECBFinancialStabilityReview.
2 SeeChapter5ofK.J.MitchenerandC.Trebesch(2021),“SovereignDebtinthe21stCentury:LookingBackward,LookingForward”,NBERWorkingPaperSeriesWP28598forareviewoftheliteratureandtheempiricalevidence,andE.FarhiandJ.Tirole(2018),“DeadlyEmbrace:SovereignandFinancialBalanceSheetDoomLoops”,ReviewofEconomicStudies,Vol.85(3),pp.1781-1823.
3 L.Bocola(2016),“ThePass-ThroughofSovereignRisk”,JournalofPoliticalEconomy,Vol.124(4),pp.879-926.Thereisalsoa“riskchannel”,asBocola(2016)dubsit,wherebanksperceiveprivate-sectorassetsasriskierinthefaceofexpectationsofasovereigndebtcrisisand,asaresult,preventivelydeleverage.Thisgeneratesafeedbackloopwhichfurtherexacerbatesthesovereign’sposition.
BANCO DE ESPAÑA 87 FINANCIAL STABILITY REPORT. AUTUMN 2021 2. RISKS TO THE FINANCIAL SECTOR AND ITS RESILIENCE

Box2.3
THE SOVEREIGN-BANK NEXUS (cont`d)
sovereign-bank nexus owing to the loan guarantee scheme for firms established by the ICO. Indeed, the policies implemented to channel credit to the corporate sector through ICO guarantees has led to an increase in the sovereign’s contingent liabilities. The volume of ICO-backed lending to the corporate sector was close to 9% of GDP in June 2021, almost doubling the previous year’s figure. This means that the banking sector would be less exposed to the potential impairment of loans to the corporate sector, since the public guarantees cover a significant portion of its loan portfolio. Specifically, loans with ICO guarantees account for 25% of total lending to the corporate sector and are equivalent to 40% of bank capital. However, an adverse shock to the sovereign would eventually affect the banking sector, through the feedback loop described above.
Economic policy action can significantly mitigate the risks of the sovereign-bank nexus. In the current context,
the ECB’s monetary policy response to the COVID-19 crisis, and other support measures implemented by the economic authorities, have all contributed to preventing them from materialising. Thus, low interest rates, liquidity facilities, including the launch of a new TLTRO programme and the asset purchase programmes have all kept the sovereign risk premium in check, despite the increase in government debt, and banks’ funding needs have been satisfactorily met in a situation of marked economic downturn. These measures have also helped reduce the impairment of debtors’ credit quality and the contraction in lending by banks, thus avoiding further deterioration of the economy and banking solvency.
However, the notable support provided by monetary policy is not without its risks. Many of these derive from a low interest rate environment potentially eroding certain elements of bank profitability.4 Low profitability in the banking sector poses
SOURCE: Banco de España.
a The flowchart illustrates how an adverse shock to the financial valuation of the banking sector or the sovereign is transmitted to the other sector through different interconnection channels. The initial shock can originate from multiple sources, such as the materialisation of the costs of imbalances in the growth of lending in the banking sector, or an adverse shock to the sovereign's tax revenues.
Sovereign -> banking sector transmission channels
— Higher financing cost for the sovereign— Increased risk perception— Impairment of sovereign debt held as assets by
the banking system— Reduced lending — Lower revenue generated by the banking sector— Downgraded credit quality of agents whose credit
rating is poorer than the sovereign's
Adverse shock, sovereign
Adverse shock, banking sector
Banking sector -> sovereign transmission channels
— Expectations of a bank bail-out trigger a dropin the price of sovereign debt
— Budgetary imbalance due to the cost of a bail-out— Lower tax revenues due to the contraction in
lending — Downturn in economic activity
Figure 1SOVEREIGN-BANK NEXUS RISK CHANNELS OR DOOM LOOP (a)
4 Inthisconnection,however,theevidenceavailableshowsamixedfinaleffectonprofitability,owingtothecontainmentofloanlossprovisionsmadepossiblebylowinterestrates,especiallyinaparticularlyrecessivescenario.Theempiricaldiscussionisaddressed,interalia,in:C.PérezMontesandA.Ferrer(2018),“Theimpactoftheinterestratelevelonbankprofitabilityandbalancesheetstructure”,FinancialStabilityReview,No35;S.Claessens,N.ColemanandM.Donnelly(2017),“‘Low-For-Long’InterestRatesandBanks’InterestMarginsandProfitability:Cross-countryEvidence”,JournalofFinancialIntermediation,Vol.35,PartA;C.Altavilla,M.BoucinhaandJ.L.Peydró(2017),“Monetarypolicyandbankprofitabilityinalowinterestrateenvironment”,EconomicPolicy,Vol.33,Issue96.
BANCO DE ESPAÑA 88 FINANCIAL STABILITY REPORT. AUTUMN 2021 2. RISKS TO THE FINANCIAL SECTOR AND ITS RESILIENCE
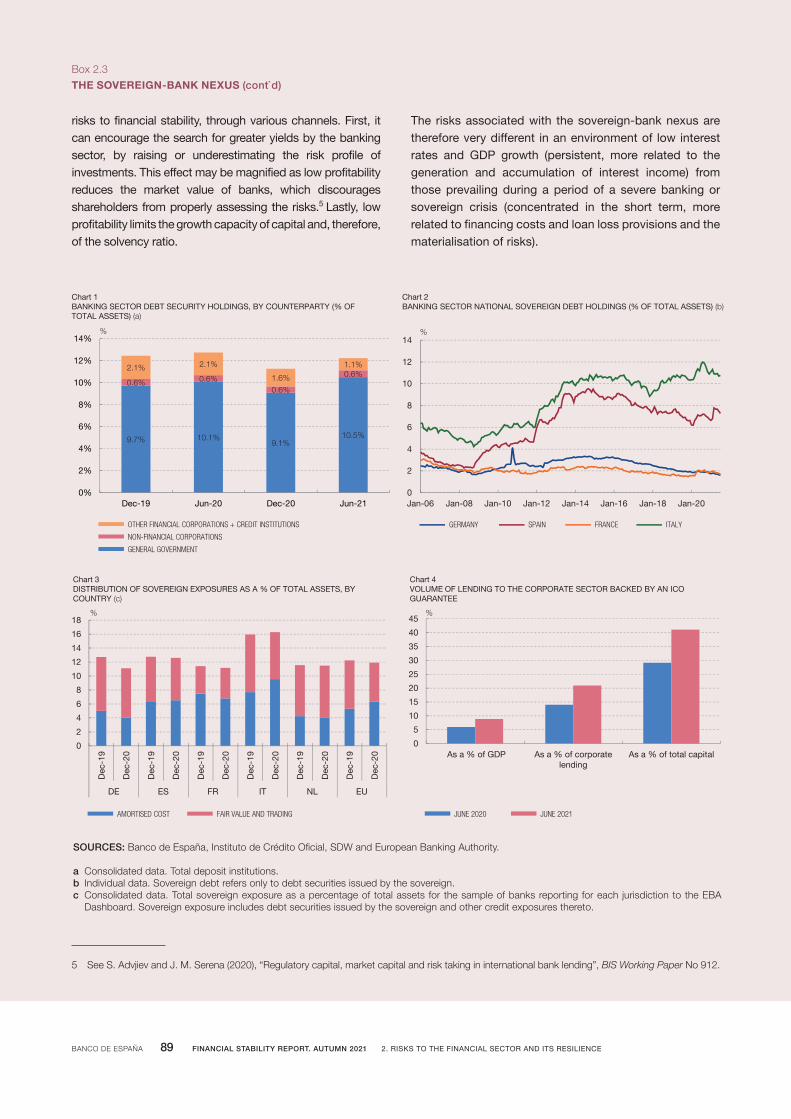
Box2.3
THE SOVEREIGN-BANK NEXUS (cont`d)
risks to financial stability, through various channels. First, it can encourage the search for greater yields by the banking sector, by raising or underestimating the risk profile of investments. This effect may be magnified as low profitability reduces the market value of banks, which discourages shareholders from properly assessing the risks.5 Lastly, low profitability limits the growth capacity of capital and, therefore, of the solvency ratio.
The risks associated with the sovereign-bank nexus are therefore very different in an environment of low interest rates and GDP growth (persistent, more related to the generation and accumulation of interest income) from those prevailing during a period of a severe banking or sovereign crisis (concentrated in the short term, more related to financing costs and loan loss provisions and the materialisation of risks).
SOURCES: Banco de España, Instituto de Crédito Oficial, SDW and European Banking Authority.
a Consolidated data. Total deposit institutions.b Individual data. Sovereign debt refers only to debt securities issued by the sovereign.c Consolidated data. Total sovereign exposure as a percentage of total assets for the sample of banks reporting for each jurisdiction to the EBA
Dashboard. Sovereign exposure includes debt securities issued by the sovereign and other credit exposures thereto.
10.5%9.1%
10.1%9.7%
0.6%
0.6%0.6%0.6%
1.1%
1.6%
2.1%2.1%
0%
2%
4%
6%
8%
10%
12%
14%
Jun-21Dec-20Jun-20Dec-19
OTHER FINANCIAL CORPORATIONS + CREDIT INSTITUTIONS
NON-FINANCIAL CORPORATIONS
GENERAL GOVERNMENT
%
Chart 1BANKING SECTOR DEBT SECURITY HOLDINGS, BY COUNTERPARTY (% OF TOTAL ASSETS) (a)
0
5
10
15
20
25
30
35
40
45
As a % of GDP As a % of corporatelending
As a % of total capital
JUNE 2020 JUNE 2021
%
Chart 4VOLUME OF LENDING TO THE CORPORATE SECTOR BACKED BY AN ICO GUARANTEE
0
2
4
6
8
10
12
14
Jan-06 Jan-08 Jan-10 Jan-12 Jan-14 Jan-16 Jan-18 Jan-20
%
GERMANY SPAIN FRANCE ITALY
Chart 2BANKING SECTOR NATIONAL SOVEREIGN DEBT HOLDINGS (% OF TOTAL ASSETS) (b)
0
2
4
6
8
10
12
14
16
18
Dec
-19
Dec
-20
Dec
-19
Dec
-20
Dec
-19
Dec
-20
Dec
-19
Dec
-20
Dec
-19
Dec
-20
Dec
-19
Dec
-20
DE ES FR IT NL EU
AMORTISED COST FAIR VALUE AND TRADING
%
Chart 3DISTRIBUTION OF SOVEREIGN EXPOSURES AS A % OF TOTAL ASSETS, BY COUNTRY (c)
5 SeeS.AdvjievandJ.M.Serena(2020),“Regulatorycapital,marketcapitalandrisktakingininternationalbanklending”,BIS Working PaperNo912.
BANCO DE ESPAÑA 89 FINANCIAL STABILITY REPORT. AUTUMN 2021 2. RISKS TO THE FINANCIAL SECTOR AND ITS RESILIENCE

Box2.3
THE SOVEREIGN-BANK NEXUS (cont`d)
In short, the COVID-19 crisis has not entailed any significant changes for Spanish banks’ exposure to Spanish sovereign risk, and the risk considerations identified in pre-pandemic years and associated with the low interest rate environment, which are very different from
the doom-loop dynamics of the 2012 sovereign debt crisis, continue to take priority. However, the increase in public indebtedness and the important role played by the ICO guarantee schemes are an indication of potential vulnerabilities that need to be monitored going forward.
BANCO DE ESPAÑA 90 FINANCIAL STABILITY REPORT. AUTUMN 2021 2. RISKS TO THE FINANCIAL SECTOR AND ITS RESILIENCE


BANCO DE ESPAÑA 92 INFORME DE ESTABILIDAD FINANCIERA. PRIMAVERA 2021 2. RIESGOS Y CAPACIDAD DE RESISTENCIA DEL SECTOR FINANCIERO

3SYSTEMIC RISK AND PRUDENTIAL POLICY

BANCO DE ESPAÑA 94 FINANCIAL STABILITY REPORT, AUTUM 2021 3. SYSTEMIC RISK AND PRUDENTIAL POLICY

BANCO DE ESPAÑA 95 FINANCIAL STABILITY REPORT, AUTUM 2021 3. SYSTEMIC RISK AND PRUDENTIAL POLICY
This chapter analyses the various vulnerability and systemic risk indicators, focusing
in particular on those used in decisions concerning the countercyclical capital buffer
(CCyB). This analysis suggests that market risk has risen to some extent recently,
but that it remains contained. The indicators of credit imbalances do not show
warning signals either, although close monitoring is needed of the correction of
those that exceeded the risk thresholds during the initial phases of the pandemic on
account of the sharp fall in GDP. The chapter goes on to review various recent
regulatory developments and macroprudential measures relevant to financial
stability. Overall, significant activity is under way on this front, with the implementation
of reforms agreed before the pandemic and of new initiatives stemming from the
lessons learned in this crisis and in response to the rise of emerging risks (e.g. those
associated with digitalisation, new technologies and climate change).
3.1 Analysis of risk indicators and systemic vulnerabilities
Althoughthetensionunleashedinthefinancialmarketsbytheoutbreakofthe
pandemichadbeenalmostcompletelycorrectedthroughout2021,ithasrisen
slightly sinceAugust, promptedbyhigher volatility. The systemic risk indicator
(SRI)1 increased sharply during the financial market turmoil between February and
March 2020. It then moved onto a sustained downward path from April 2020, returning
to almost its pre-turmoil level by end-2020 (see Chart 3.1.1). However, since August 2021
the SRI has risen slightly, owing to heightened volatility in the four segments of the
Spanish financial market,2 particularly in the equity segment. This higher financial
market volatility is not unique to Spain, but is widespread in the international markets,
in a setting in which investors are starting to factor in the possible withdrawal of part of
the main central banks’ monetary stimuli. Overall, this evidence suggests that market
risks are currently significant and need close monitoring.
The SRISK indicator, which measures banks’ strength vis-à-vis adverse
systemicshocks,sawanotable improvement in2021 H1andhasstabilised
since the summer. SRISK3 quantifies the systemic importance of individual banks
and the banking sector overall, since it assesses and aggregates the impact of an
extreme negative market event on each bank. This latent risk indicator provides
1 ForadetailedexplanationoftheSRIcalculationmethodology,seeBox 1.1oftheMay 2013FSR.
2 Moneymarket,governmentdebt,equityandfinancialintermediaries.
3 SeeC.BrownleesandR.Engle(2017)“SRISK:Aconditionalcapitalshortfallmeasureofsystemicrisk”,The Review of Financial Studies Vol.30,pp.48-79.
3 SYSTEMIC RISK AND PRUDENTIAL POLICY

BANCO DE ESPAÑA 96 FINANCIAL STABILITY REPORT, AUTUM 2021 3. SYSTEMIC RISK AND PRUDENTIAL POLICY
an estimate of a bank’s expected capital shortfall after a hypothetical severe crisis
in equity markets entailing a correction of its market capitalisation. The changes
in this indicator since mid-2020 suggest a gradual decline in systemic risk in the
banking sector, although it is still above pre-pandemic levels (see Chart 3.1.2).
The improvement in this indicator has slowed down since July 2021, consistent
with the signs of financial market volatility captured by the SRI.
Therecoveryineconomicactivityhashelpedcorrectpartoftheimbalances
in the credit-to-GDP gap and the output gap that arose during the pandemic.
The credit-to-GDP gap, which is one of the main indicators guiding the setting of the
CCyB during expansionary phases of the credit cycle, widened considerably after
the outbreak of the pandemic. As mentioned in previous FSRs,4 in the context of the
crisis prompted by the pandemic, this widening should not be interpreted as an early
4 See FSR Spring 2021.
Having held at very relaxed levels since end-2020, the SRI has risen since August 2021 due to heightened volatility in the financial markets, particularly in the equity segment. Banks' systemic risk, measured by the SRISK indicator, has decreased over 2021, in line with the favourable performance of the markets, although the progression of the improvement appears to have stabilised.
THE SYSTEMIC RISK INDICATOR (SRI) HAS RISEN SINCE AUGUST 2021 AND THE IMPROVEMENT IN BANK SYSTEMICRISK HAS SLOWED SOMEWHAT. HOWEVER, BOTH METRICS REMAIN VERY FAR FROM THE 2020 STRESS LEVELS
Chart 3.1
SOURCES: Datastream, SNL, Instituto Nacional de Estadística and Banco de España.
a The systemic risk indicator (SRI) aggregates 12 individual stress indicators (volatilities, interest rate spreads, maximum historical losses, etc.) from different segments of the Spanish financial system. In calculating the SRI, the effect of cross-correlations is taken into account, whereby the SRI registers higher values if the correlation between the four markets is high, and lower values where there is less or negative correlation. For a detailed explanation of this indicator, see Box 1.1 of the May 2013 Financial Stability Report. Data updated as at 20 October 2021.
b SRISK captures the additional capital for covering bank capital requirements at market value when faced with a significant market shock, expressed as a percentage of each institution's total assets. The parameters used are k=4.5% for the capital requirement, C=10% for the market decline and h=22 business days for the period over which the hypothetical decline occurs, see Brownlees and Engle (2017) for further details. The SRISK index for the months of 2021 Q3 is calculated from the values of assets and liabilities of 2021 Q2 with the stock prices data of the corresponding month. The series have been smoothed using a three-month moving average. Compared with the results published in the Spring 2021 Financial Stability Report, the sample of European banks has been extended to include smaller institutions.
10th PERCENTILE 25th PERCENTILE MEDIAN75th PERCENTILE 90th PERCENTILE
2 DISTRIBUTION OF THE SRISK SYSTEMIC RISK INDICATOR (b)1 SYSTEMIC RISK INDICATOR (a)
GOVERNMENT DEBT MONEY MARKETEQUITY FINANCIAL INTERMEDIARIESCORRELATION SRI
0
1
2
3
4
08 09 10 11 12 13 14 15 16 17 18 19 20 21
%
-0.3
-0.1
0.1
0.3
0.5
0.7
0.9
Jan-20 May-20 Sep-20 Jan-21 May-21 Sep-21
BANCO DE ESPAÑA 97 FINANCIAL STABILITY REPORT, AUTUM 2021 3. SYSTEMIC RISK AND PRUDENTIAL POLICY
warning of the emergence of a cyclical imbalance. It is simply the consequence of
the sharp drop in GDP (the denominator in the credit-to-GDP ratio) in 2020 and of the
measures to support the provision of credit to the economy. The information
available for 2021 Q2 shows a significant correction in the credit-to-GDP gap for
the first time since the onset of the pandemic (see Chart 3.2.1). This change in trend
owes chiefly to the rebound in GDP growth, although this only partially offsets the
deterioration built up since 2020. Meanwhile, credit (the ratio’s numerator) has
stabilised in recent quarters, after having risen significantly since 2020 Q2.
Consequently, the partial correction of the widening of the credit-to-GDP gap in
2021 Q2 is a positive signal that the imbalances seen in this variable since mid-2020
may be temporary. Nevertheless, this indicator remains above the reference
threshold of 2 pp, beyond which the gap is considered to show signs of imbalance
in the credit cycle. It will therefore be important to monitor how the correction of
this warning signal progresses over the coming quarters.
ThereboundinGDPgrowthhasalsocontributedtoafavourableperformance
ofothermacroeconomic indicators. In particular, the negative output gap has
begun to narrow, with the upward trend observed since late 2020 gaining momentum.
In line with the expectations of recovery, this favourable trend is set to progress
substantially over the coming quarters. Nevertheless, it remains at significantly
negative values that are far from pre-pandemic levels (see Chart 3.2.1).
Indicatorsofhousepriceimbalancessuggestthatsuchpricesstandabove,
but very close to, their equilibrium levels. It is essential that possible price
imbalances in the real estate market be analysed, because the situation in this
market has a particular impact on the credit cycle, as it can amplify the cycle through
mortgage loans and loans to the construction sector and to real estate activities.
The Banco de España regularly analyses a series of indicators of house price
imbalances that measure the difference between the average price index and their
estimated long-term equilibrium level, provided by various econometric models. As
mentioned in Chapter 1, all the indicators are currently close to equilibrium levels,
with no signs of overvaluation (see Chart 3.2.2). Nevertheless, these indicators have
risen since the run-up to the outbreak of the pandemic. Thus, while in 2019 they
tended to be negative but close to equilibrium levels, they now tend to be positive
but, again, close to equilibrium. It will therefore be important to monitor these
indicators closely as well, to determine whether they stabilise at their current values
or begin to rise to warning levels.
Sincetheoutbreakofthepandemic,notabledifferenceshavebeenobserved
innewloanstohouseholdsandfirmsandinthecontributionofsupplyand
demand-side factors tochanges therein,whichwereofoppositesigns in
2021 H1. Drawing on econometric models, changes in new loans to households
and firms can be broken down into estimated supply and demand-side factors.
The estimates from these models show that the significant decline in new loans to
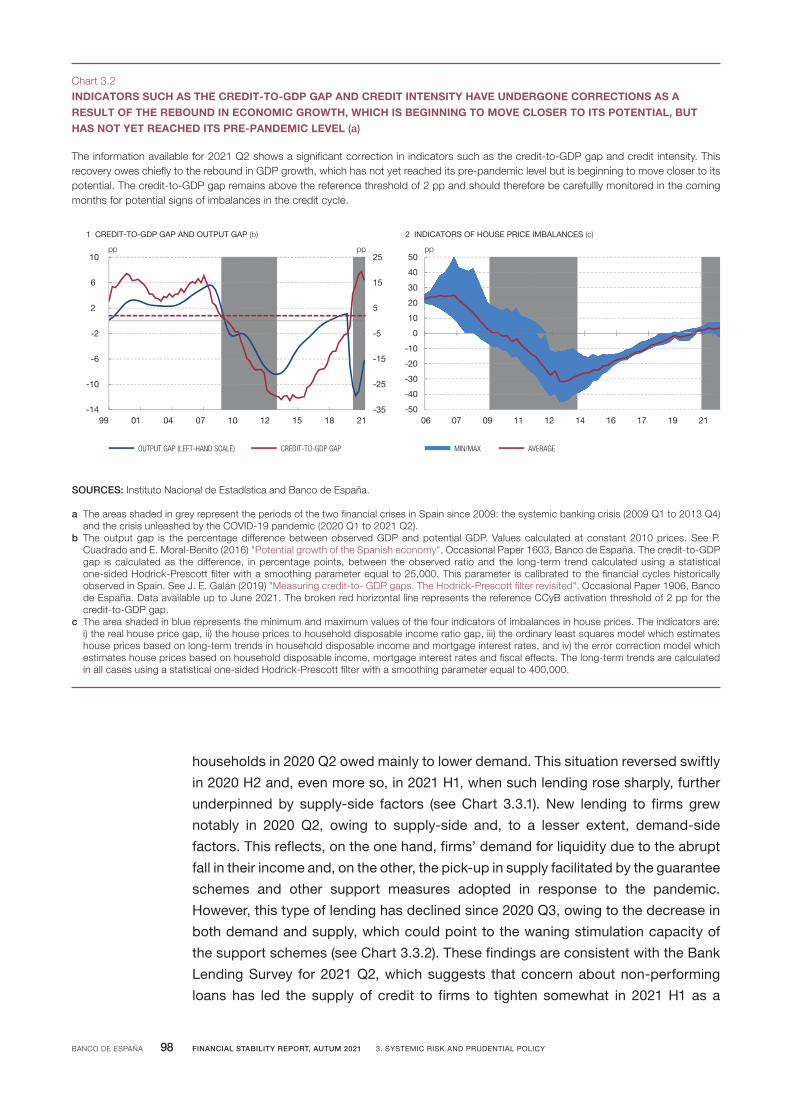
BANCO DE ESPAÑA 98 FINANCIAL STABILITY REPORT, AUTUM 2021 3. SYSTEMIC RISK AND PRUDENTIAL POLICY
households in 2020 Q2 owed mainly to lower demand. This situation reversed swiftly
in 2020 H2 and, even more so, in 2021 H1, when such lending rose sharply, further
underpinned by supply-side factors (see Chart 3.3.1). New lending to firms grew
notably in 2020 Q2, owing to supply-side and, to a lesser extent, demand-side
factors. This reflects, on the one hand, firms’ demand for liquidity due to the abrupt
fall in their income and, on the other, the pick-up in supply facilitated by the guarantee
schemes and other support measures adopted in response to the pandemic.
However, this type of lending has declined since 2020 Q3, owing to the decrease in
both demand and supply, which could point to the waning stimulation capacity of
the support schemes (see Chart 3.3.2). These findings are consistent with the Bank
Lending Survey for 2021 Q2, which suggests that concern about non-performing
loans has led the supply of credit to firms to tighten somewhat in 2021 H1 as a
The information available for 2021 Q2 shows a significant correction in indicators such as the credit-to-GDP gap and credit intensity. This recovery owes chiefly to the rebound in GDP growth, which has not yet reached its pre-pandemic level but is beginning to move closer to its potential. The credit-to-GDP gap remains above the reference threshold of 2 pp and should therefore be carefullly monitored in the coming months for potential signs of imbalances in the credit cycle.
INDICATORS SUCH AS THE CREDIT-TO-GDP GAP AND CREDIT INTENSITY HAVE UNDERGONE CORRECTIONS AS ARESULT OF THE REBOUND IN ECONOMIC GROWTH, WHICH IS BEGINNING TO MOVE CLOSER TO ITS POTENTIAL, BUTHAS NOT YET REACHED ITS PRE-PANDEMIC LEVEL (a)
Chart 3.2
SOURCES: Instituto Nacional de Estadística and Banco de España.
a The areas shaded in grey represent the periods of the two financial crises in Spain since 2009: the systemic banking crisis (2009 Q1 to 2013 Q4) and the crisis unleashed by the COVID-19 pandemic (2020 Q1 to 2021 Q2).
b The output gap is the percentage difference between observed GDP and potential GDP. Values calculated at constant 2010 prices. See P. Cuadrado and E. Moral-Benito (2016) "Potential growth of the Spanish economy", Occasional Paper 1603, Banco de España. The credit-to-GDP gap is calculated as the difference, in percentage points, between the observed ratio and the long-term trend calculated using a statistical one-sided Hodrick-Prescott filter with a smoothing parameter equal to 25,000. This parameter is calibrated to the financial cycles historically observed in Spain. See J. E. Galán (2019) "Measuring credit-to- GDP gaps. The Hodrick-Prescott filter revisited", Occasional Paper 1906, Banco de España. Data available up to June 2021. The broken red horizontal line represents the reference CCyB activation threshold of 2 pp for the credit-to-GDP gap.
c The area shaded in blue represents the minimum and maximum values of the four indicators of imbalances in house prices. The indicators are: i) the real house price gap, ii) the house prices to household disposable income ratio gap, iii) the ordinary least squares model which estimates house prices based on long-term trends in household disposable income and mortgage interest rates, and iv) the error correction model which estimates house prices based on household disposable income, mortgage interest rates and fiscal effects. The long-term trends are calculated in all cases using a statistical one-sided Hodrick-Prescott filter with a smoothing parameter equal to 400,000.
-35
-25
-15
-5
5
15
25
-14
-10
-6
-2
2
6
10
99 01 04 07 10 12 15 18 21
1 CREDIT-TO-GDP GAP AND OUTPUT GAP (b)
OUTPUT GAP (LEFT-HAND SCALE) CREDIT-TO-GDP GAP
pp pp
-50
-40
-30
-20
-10
0
10
20
30
40
50
06 07 09 11 12 14 16 17 19 21
MIN/MAX AVERAGE
pp
2 INDICATORS OF HOUSE PRICE IMBALANCES (c)

BANCO DE ESPAÑA 99 FINANCIAL STABILITY REPORT, AUTUM 2021 3. SYSTEMIC RISK AND PRUDENTIAL POLICY
whole. In any event, this effect may be temporary, as the latest data suggest that the
supply of credit to firms is stabilising.5
Takingthissetofmacro-financialindicatorsintoaccount,theBancodeEspaña
hasmaintainedtheCCyBrateat0%anddoesnotenvisageincreasingituntil
economic activity has returned to its potential level or there are signs of
imbalances arising in the credit cycle. As it has regularly announced6 since
March 2020, the Banco de España continues to consider it appropriate to maintain the
CCyB rate applicable to exposures in Spain at the minimum of 0% to make it easier for
banks to be able to sustain the credit flow and thus contribute to alleviating the negative
5 See A.Menéndez andM.Mulino (2021) “The July 2021Bank Lending Survey in Spain”,Analytical Articles, EconomicBulletin3/2021,BancodeEspaña,andA.MenéndezandM.Mulino(2021)“TheOctober 2021BankLendingSurveyinSpain”, Analytical Articles, Economic Bulletin 4/2021,BancodeEspaña
6 TheBancodeEspañahasrecentlyadapteditsstatementsonthequarterlyCCyBdecisionsonaccountoftheamendments set out in Directive(EU)2019/878(CRDV)simplifyingtheframeworkfornotifyingCCyBmeasuresinthosequarterswhentherateforthistoolisnotrecalibrated.Specifically,theBancodeEspaña’squarterlypressreleasesontheCCyBthatwerereleaseduntilMarch 2021havebeenreplacedbythedisseminationofanupdatedExcel filewith the quantitative information used to inform the latest quarterly decision (available in theCCyB sectionoftheBancodeEspaña’swebsite).
In the early months of the pandemic, loans to households declined owing to a sharp contraction in demand, while loans to firms grew notably driven by these agents' demand for liquidity and the supply stimulus provided by the support measures implemented. From 2020 H2 to 2021 H1 the pattern reversed in both cases. There has been a strong increase in lending to households, due to both supply and demand-side factors, and a contraction in lending to firms, owing to both a decline in demand attributable to lower liquidity needs and a contraction in supply, at least partly explained by the base effect induced by the support measures implemented in the second quarter of 2020.
IN THE FIRST SEMESTER OF 2021 SUPPLY AND DEMAND-SIDE FACTORS HAVE SIGNIFICANTLY BOOSTED NEW LENDINGTO HOUSEHOLDS, WHILE CONTRACTING NEW LENDING TO FIRMS
Chart 3.3
SOURCE: Banco de España.
a Cumulative change over four quarters. Breakdown of the supply and demand-side effects obtained using a structural vectoral autoregression (S-VAR) model through which the short-term relationships between credit and interest rate spreads are estimated, allowing for simultaneous shocks between the two variables. The models are estimated separately for lending to households and firms. Data on new lending in euro area countries are used. New lending excludes renegotiations, overdrafts and credit card balances. For further details, see Box 1 in P. Alves, F. Arrizabalaga, J. Delgado, J. Galán, E. Pérez, C. Pérez and C. Trucharte (2021) "Recent developments in financing and bank lending to the non-financial private sector", Analytical Articles, Economic Bulletin 1/2021, Banco de España.
-60
-50
-40
-30
-20
-10
0
10
20
30
40
50
09 10 11 12 13 14 15 16 17 18 19 20 21
1 BREAKDOWN OF NEW LENDING TO HOUSEHOLDS INTO SUPPLY AND DEMAND-SIDE FACTORS (a)
pp
-50
-40
-30
-20
-10
0
10
20
30
40
50
09 10 11 12 13 14 15 16 17 18 19 20 21
2 BREAKDOWN OF NEW LENDING TO FIRMS INTO SUPPLY AND DEMAND-SIDE FACTORS (a)
pp
DEMAND SUPPLY CUMULATIVE CHANGE OVER FOUR QUARTERS
BANCO DE ESPAÑA 100 FINANCIAL STABILITY REPORT, AUTUM 2021 3. SYSTEMIC RISK AND PRUDENTIAL POLICY
pressure on economic growth. Holding the CCyB rate at 0% is consistent with the
guidance on the flexible application of prudential requirements in response to this crisis
advocated by the ECB and other EU (ESRB, EBA) and global bodies (BCBS and FSB).7
Insofar as the economic recovery takes hold, the CCyB rate, no longer in a context
of crisis, will be conditional upon the path of recovery and the possible emergence of
systemic imbalances that could be tackled by this macroprudential tool.
SomeEuropeancountriesare takingmeasures to raise theCCyB rate.The
macro-financial situation of other European economies is highly diverse. Some are
already in a marked upward phase of their credit cycle, in which cyclical systemic
imbalances have arisen, and have already announced measures for restoring the
CCyB. Specifically, the authorities in Bulgaria,8 Denmark9 and Sweden10 have in
recent months announced that the CCyB rate is to be set at 1%, while those in the
Czech Republic11 and Norway12 have opted to set it at 1.5%. All these measures,
which are geared towards replenishing part or all of the CCyB in place in these
countries at the start of the pandemic, will be effective from 2022 Q3.
The empirical evidence during the pandemic suggests that building up
macroprudential buffers in normal timesand subsequently releasing them in
crisissituationshelpsstabilise lending to theeconomy. Econometric estimates
can be made of the probability of different credit growth scenarios over a one-year
horizon, assessing how they are affected by changes in macroprudential policy.13 The
results of this analysis for European countries show that expected growth already
exceeds the pre-pandemic estimate. This is the case both in countries that were able
to ease macroprudential measures in response to the pandemic and in those that were
unable to do so owing to a lack of macroprudential space, as they had not previously
activated such measures because they did not present systemic risk (see Chart 3.4).
7 Additionally, each year theBanco de España identifies a list of third countries (i.e. outside of the EuropeanEconomicArea)thataremateriallysignificantfortheSpanishbankingsystemforCCyBpurposes,basedonthevolumeofSpanishbanks’internationalexposures.ThisexerciseisconductedpursuanttothemethodologicalrecommendationsoftheESRB.In2021theBancodeEspañaidentifiedthefollowingeightmaterialcountries(inalphabeticalorder):Brazil,Chile,Colombia,Mexico,Peru,Turkey,theUnitedKingdomandtheUnitedStates.
8 See theCountercyclicalCapitalBuffersectionoftheBulgarianNationalBank’swebsite.
9 See “Reactivationofthecountercyclicalcapitalbuffer”,Danish Systemic Risk Council (Det Systemiske Risikorad) recommendationof22 June 2021.
10 See “FIintendstoraisethecountercyclicalbufferrateto1percent”,SwedishFinancialSupervisoryAuthority(Finansinspektionen)pressreleaseof9 September 2021.
11 See “Provision of a general nature III/2021 on setting the countercyclical capital buffer rate for the CzechRepublic”of26 August 2021,Českánárodníbanka.
12 See “Adviceonthecountercyclicalcapitalbuffer2021 Q2”,NorgesBankpressreleaseof17 June 2021.TheNorwegian central bank has become the national designated authority for decision-making concerning thismacroprudentialtool,havingbeenrecentlydelegatedthiscompetence,whichwaspreviouslytheresponsibilityoftheMinistryofFinance.See“NewTasksforNorgesBank”,pressreleaseof3 September 2021.
13 These estimates aremade using quantile regressions of credit growth based on themethodology recentlydevelopedbytheBancodeEspañaforassessingtheimpactofthebuild-upofcyclicalvulnerabilities,theboutsoffinancialstressandtheuseofmacroprudentialtoolsonGDPgrowthdistribution.Foradetaileddescriptionofits use, see Box 3.1,2020AutumnFSR,andformethodologicaldetails,seeJ.E.Galán(2020)“Thebenefitsareatthetail:Uncoveringtheimpactofmacroprudentialpolicyongrowth-at-risk”, Journal of Financial Stability.

BANCO DE ESPAÑA 101 FINANCIAL STABILITY REPORT, AUTUM 2021 3. SYSTEMIC RISK AND PRUDENTIAL POLICY
However, there are significant differences between these two groups of countries as
regards the so-called “credit growth-at-risk”, i.e. the credit growth rate that would be
observed under an adverse scenario that occurs with a 5% probability. In countries
that have eased macroprudential measures, the estimated decline in credit under
the aforementioned adverse scenario has remained relatively stable since the start
of the pandemic and is in fact lower than the pre-crisis estimate. By contrast, in
countries without this type of buffer, credit growth-at-risk is more than two times
lower and remains below pre-pandemic estimates. Given the similar median growth
projections for the two groups of countries, it could be concluded that the existence
of macroprudential space in crisis periods results in less uncertainty about the
variability of credit growth compared with the baseline scenario and, therefore, more
stable lending to the real economy throughout economic cycles.
In July 2021 the Banco de España announced the designation of other
systemicallyimportantinstitutions(O-SIIs),togetherwiththeirmacroprudential
capital buffers applicable in 2022.14 Designation as a systemically important
14 See “The Banco de España updates the list of other systemically important institutions and sets theirmacroprudentialcapitalbufferratesfor2022”,pressreleaseof29 July 2021.
Estimates of median credit growth over a one-year horizon (50th percentile) do not differ significantly between countries that eased macroprudential measures and those that did not. However, significant differences are seen in terms of the change in credit that would be observed under an adverse scenario (5th percentile). While, under such a scenario, credit contraction is even lower than the pre-pandemic estimate in countries that eased macroprudential measures, it is more than twice as high, exceeding the pre-pandemic estimate, in those that did not have room to ease such measures.
COUNTRIES THAT HAD ROOM TO EASE MACROPRUDENTIAL MEASURES DURING THE PANDEMIC HAD A LOWER RISK OFSEVERE CREDIT CONTRACTION, WITH THIS PATTERN CONTINUING IN 2021
Chart 3.4
SOURCE: European Banking Authority and Bank for International Settlements.
a The bars represent the average for the countries in the group under analysis in the 5th and 50th percentiles of the estimated credit growth distribution over a one year horizon, estimated at the dates indicated. The estimates are calculated using quantile regressions of one-year credit growth on variables capturing cyclical vulnerabilities, financial stress episodes, economic growth and the use of macroprudential tools.
-20
-15
-10
-5
0
5
10
Dec-19 Mar-20 Jun-20 Sep-20 Dec-20 Mar-21 Jun-21
1 5TH AND 50TH PERCENTILES OF THE DISTRIBUTION OF ANNUAL CREDIT GROWTH IN COUNTRIES THAT DID NOT EASE MACROPRUDENTIAL MEASURES DURING THE PANDEMIC (a)
pp
-20
-15
-10
-5
0
5
10
Dec-19 Mar-20 Jun-20 Sep-20 Dec-20 Mar-21 Jun-21
2 5TH AND 50TH PERCENTILES OF THE DISTRIBUTION OF ANNUAL CREDIT GROWTH IN COUNTRIES THAT EASED MACROPRUDENTIALMEASURES DURING THE PANDEMIC (a)
pp
5th PERCENTILE 50th PERCENTILE

BANCO DE ESPAÑA 102 FINANCIAL STABILITY REPORT, AUTUM 2021 3. SYSTEMIC RISK AND PRUDENTIAL POLICY
institution entails the requirement of an additional capital surcharge, which aims to
internalise the greater impact on financial stability were these banks to experience
difficulties, and to mitigate possible competitive advantages they might have in the
markets owing to their systemic nature. The list of O-SIIs has changed from previous
years because BFA Tenedora de Acciones, S.A.U. (holding company of Bankia, S.A.)
is no longer considered as such on account of the merger by acquisition of Bankia,
S.A. by CaixaBank, S.A. in March 2021. CaixaBank’s greater systemic importance
following this merger entails a 0.25 pp increase in its O-SII capital buffer, according
to the methodology used by the Banco de España to determine this macroprudential
requirement. In the light of last year’s crisis, this increase to 0.5% will be applied
gradually until 1 January 2023, such that in 2022 the institution’s buffer will be
0.375% (see Table 3.1).
3.2 Regulatory developments relevant to financial stability
SincethepublicationoftheSpringFSR,someoftheexceptionaltemporary
measures introduced in thewakeof thepandemichavebeenwithdrawn,
while progress has continued in various initiatives to develop and strengthen
the banking sector’s prudential regulation.Most notably, the results of the
stress tests on European banks and the improved macroeconomic outlook across
the board have made it possible to lift the EU-wide precautionary restrictions on
profit distribution by financial institutions. This return to normal has been
accompanied in some countries by the tightening of some macroprudential
measures, as analysed in Section 3.1. In recent months, the European Commission
has begun the review of the macroprudential framework of EU banking regulation
and has announced the legislative proposal for the technical developments for
implementing the outstanding Basel III reforms in the EU. Other important areas
of regulatory and supervisory focus will continue to be crypto-assets and climate
change risks.
CAPITAL BUFFERS FOR SYSTEMICALLY IMPORTANT INSTITUTIONSTable 3.1
SOURCE: Banco de España.
a G-SII means Global Systemically Important Institution.b The capital buffer applicable to CaixaBank, S.A. will be 0.5% from 1 January 2023 onwards (to be confirmed in next year's O-SII decision).
)a( noitangiseDnoitutitsnIreifitnedI ytitnE lageLCapital buffer to be required in 2022 (b)
%0.1IIS-O dna IIS-G.A.S ,rednatnaS ocnaB31MAIWYMDDFMQ6003945
%57.0IIS-O.A.S ,airatnegrA ayacziV oabliB ocnaB17ZA15QW2Z5N7DF7SM8K
%573.0IIS-O.A.S ,knaBaxiaC78IFGD7K6DIW335SNUC7
%52.0IIS-O.A.S ,lledabaS ed ocnaB 02MRKXCZLQQW0M2GR5IS

BANCO DE ESPAÑA 103 FINANCIAL STABILITY REPORT, AUTUM 2021 3. SYSTEMIC RISK AND PRUDENTIAL POLICY
The recommendations introducing system-wide restrictions in Europe on
profitdistributionbyfinancialinstitutionspromptedbytheCOVID-19pandemic
have been repealed. The economic upturn anticipated by the latest projections,
the reassuring outcome of the EBA and SSM stress tests and lower uncertainty
led the ECB to decide15 in July not to extend beyond 30 September 2021 its
recommendation, in place since the start of the pandemic, that all significant credit
institutions under its direct supervision limit dividend distribution. In coordination
with other national authorities, the Banco de España also agreed16 not to extend its
recommendation for less significant institutions in Spain, which also expired on
30 September. At the same time, the ESRB also decided17 to allow its dividend
recommendation affecting various sectors of the EU financial system to expire as of
1 October. All these authorities have publicly reiterated the need to remain prudent
in decisions on dividend distribution, equity buybacks and remuneration policies,
paying particular attention to business model sustainability.
Various studies suggest that the limitations on dividend distribution have had
a significant positive impact on new lending and solvency ratios.Empirical
analysis of granular bank lending data shows that Spanish institutions which did not
distribute dividends in 2020 were more active granting loans and, consequently,
helped to mitigate the impact of the crisis on the real economy.18 At the global level,
in countries where restrictions were implemented, capital ratios recovered from the
falls in 2020 Q1, or even increased, despite the fall in profit. Conversely, capital ratios
continued to decline in countries where no restrictions were implemented initially.19
The European macroprudential framework in the capital requirements
legislation (CRR and CRD) will be reviewed in the coming months. As laid down
in Article 513 of Regulation (EU) 2019/876 (CRR), by 30 June 2022, and every five
years thereafter, the European Commission shall review whether the macroprudential
rules contained in the EU regulations in force are sufficient to properly mitigate
systemic risks. This review will allow the use and design of macroprudential tools to
be examined in the light of the practical experience gained in recent years since
macroprudential tools were effectively introduced in 2016 and of some of the lessons
learned from the COVID-19 pandemic crisis in particular. Specifically, the desirability
of increasing the share of releasable buffers, as opposed to structural buffers, and
the practical difficulties faced by banks when using their buffers could be considered.
15 See “ECBdecidesnottoextenddividendrecommendationbeyondSeptember 2021”,ECBpressreleaseof23 July 2021.
16 See“Recomendaciónsobredistribucióndedividendosyremuneraciónvariable”,Banco de España statement of23 July 2021(onlyavailableinSpanish).
17 See “TheGeneralBoardoftheEuropeanSystemicRiskBoardheldits43rdregularmeetingon23 September 2021”,ESRBpressreleaseof24 September 2021.
18 SeeD.MartínezMieraandR.Vegas(2021)“Impactofthedividenddistributionrestrictionontheflowofcredittonon-financialcorporationsinSpain”,Analytical Article, Economic Bulletin 1/2021,BancodeEspaña.
19 See B. Hardy (2021)“Covid-19bankdividendpayoutrestrictions:effectsandtrade-offs”,BIS Bulletin 38.
BANCO DE ESPAÑA 104 FINANCIAL STABILITY REPORT, AUTUM 2021 3. SYSTEMIC RISK AND PRUDENTIAL POLICY
To review the macroprudential framework, the European Commission has
requestedadvisoryreportsfromtheECB,theEBAandtheESRB. Through a call
for advice20 addressed to these three authorities, the Commission seeks to obtain
qualitative and quantitative evidence to support possible legislative changes. The three
authorities consulted will need to submit their views by 31 March 2022 so that the
European Commission can propose a legislative reform no later than December 2022,
which will then be negotiated with the Council and the European Parliament.
Further progress has been made on pending EU prudential regulatory
developments. Notable in the macroprudential realm is the amendment of the
regulatory technical standards (RTSs) for identifying G-SIIs, which set out the additional
methodology for identifying these institutions.21 In addition, the EBA has submitted to
public consultation the review of the prudential treatment of exposures secured by
immovable property. Under this prudential treatment, the relevant authorities may set
higher risk weights or increase the minimum LGD values when these do not adequately
reflect risk or are inadequate and could adversely affect financial stability in the Member
State. The EBA’s draft RTS was submitted to public consultation22 and its final version
is expected to be ready in the coming months.
On 27 October, the European Commission published a proposal to review the
regulation applicable to the banking sector23, which includes legislative
changes to implement the Basel III agreement24, considering the specific
characteristicsoftheEuropeanbankingsector.The proposal aims to strengthen
EU banks’ resilience, without resulting in significant increases in capital requirements,
and introduces an extended transitional period, starting in 2025 for some aspects. It
also sets rules on the management, monitoring and disclosure to third parties of
environmental, social and governance (ESG) risks, in keeping with the objectives
of the EU’s sustainable finance strategy. Lastly, the supervisory toolkit is
20 See“CallforAdvice-ReviewoftheEUMacroprudentialFramework”,EuropeanCommission,8 July 2021.
21 See CommissionDelegatedRegulation(EU)2021/539of11 February 2021amendingDelegatedRegulation(EU)No1222/2014supplementingDirective2013/36/EUof theEuropeanParliamentandof theCouncilwithregardtoregulatorytechnicalstandardsforthespecificationofthemethodologyfortheidentificationofglobalsystemically important institutionsand for thedefinitionofsubcategoriesofglobalsystemicallyimportant institutions.
22 See “EBAconsults ondraft technical standards specifying how to identify the appropriate riskweights andconditionswhenassessingminimumLGDvaluesforexposuressecuredby immovableproperty”, EBA press releaseof29 April 2021.
23 See“BankingPackage2021:newEUrulestostrengthenbanks’resilienceandbetterprepareforthefuture”, legislativeproposaloftheEuropeanCommissionof27October.
24 WithregardtotheimplementationofBasel III inEurope,twoletterssenttotheEuropeanCommissionby25EUcentralbanksandnationalsupervisoryauthorities(includingtheBancodeEspaña)andbytheECBandtheEBAweremadepublic.BothletterscalledontheCommissiontoimplementtheBaselIIIagreementinafull,consistentandtimelymanner. See“TheEUshouldsticktotheBaselIIIagreement”,letterof7September2021signedbythecentralbanksandbanking supervisory authoritiesofAustria,Belgium,Bulgaria,Croatia, theCzechRepublic,Estonia,Greece,Ireland,Italy,Latvia,Lithuania,Malta,theNetherlands,Poland,Portugal,Slovakia,Slovenia,SpainandSweden.See “EUimplementationofoutstandingBaselIIIreforms”, letterof7September2021co-signedbytheChairpersonoftheEBA,theVicePresidentoftheECBandtheChairoftheSupervisoryBoardoftheECB.
BANCO DE ESPAÑA 105 FINANCIAL STABILITY REPORT, AUTUM 2021 3. SYSTEMIC RISK AND PRUDENTIAL POLICY
enhanced in certain areas to ensure sounder and more prudent management of EU
banks. In addition, the European Commission has published a proposal to amend
some prudential and resolution rules in order to clarify the regime of requirements for
liabilities payable in chains of subsidiaries (the so-called Daisy chains) and the
requirements in the area of resolution of institutions of global systemic importance
(G-SII). This proposal will be processed in an accelerated and separate manner.
Facedwiththeincreasingrelevanceofclimate-relatedimpactsonfinance,both
the EBA and the BCBS have published reports on this matter. In June, the EBA
released25 a report on management and supervision of ESG risks. The report includes a
comprehensive proposal on how ESG factors and ESG risks should be integrated into the
strategy, governance and risk management of credit institutions and investment firms, as
well as into supervisory processes. To enhance the supervisory review and evaluation
process (SREP), in this report the EBA sees a need to extend the time horizon of the
assessment and proposes including environmental and climate-related factors and risks
into the business model. Later this year, the EBA plans to publish the disclosure
requirements (Pillar 3) for credit institutions regarding the risks identified in this report.
InApril,theBCBSpublishedtwoanalyticalreportsonclimate-relatedfinancial
risks.26 The two reports broach: (i) climate-related risk drivers and their transmission
channels to the banking system and (ii) the corresponding measurement methodologies.
Although climate risk can be captured in traditional financial risk categories, they both
acknowledge that additional progress is needed to better estimate these risks. In this
setting, the reports provide a conceptual basis for identifying gaps in the current Basel
framework and possible measures to address them. The BCBS is working on a set of
supervisory practices which it plans to consult on by the end of the year and will
continue to analyse whether supervisory, regulatory or transparency measures are
needed. Box 3.1 of this Report sets out the stress tests conducted on Spanish banks
by the Banco de España to gauge the implications of the materialisation of some of
these climate-related risks. Box 3.2 quantifies the potential implications of an episode
of environmental deterioration, which can help measure the impact of the materialisation
of climate-related physical risks in the future.
Thecontinuedgrowthandinnovationseenincrypto-assets,includingso-known
stablecoins,furtherunderlinestheimportanceoftheworkoftheBCBSand
theFSB in thisarea,which focusesonanalysing the implications thismay
haveforthestabilityofthefinancialsystem. Although banks’ exposure to crypto-
assets is currently limited, innovation in crypto-assets and related services, coupled
with some banks’ increased interest, could heighten concerns about global financial
25 See “EBApublishesitsReportonmanagementandsupervisionofESGrisksforcreditinstitutionsandinvestmentfirms”,EBApressreleaseof23June2021.
26 See “BaselCommitteepublishesanalyticalreportsonclimate-relatedfinancialrisks”, BCBS press release, April 14 2021.
BANCO DE ESPAÑA 106 FINANCIAL STABILITY REPORT, AUTUM 2021 3. SYSTEMIC RISK AND PRUDENTIAL POLICY
stability and the risks to the banking system in the absence of a specific regulatory
framework.27 The BCBS has run a public consultation on its proposals for the
prudential treatment of banks’ crypto-asset exposures this year.28 In 2020, the FSB
issued a series of high-level recommendations for the regulation, supervision and
oversight of “global stablecoin” (GSC) arrangements,29 a specific type of crypto-asset
which seeks to hold a stable value by pegging it to another asset, such as a stable
fiat currency. The recommendations promote coordinated and effective regulation,
supervision and oversight of GSCs to address the financial stability risks they pose,
both domestically and globally, and are part of a broader FSB work programme
which will continue until at least 2023.
ThetranspositioninSpainofthechangesinthebankrecoveryandresolution
framework (BRRD II)30 is also progressing. The BRRD II introduced significant
new features in the EU resolution framework, such as a reviewed methodology for
determining the minimum requirement for own funds and eligible liabilities (MREL), a
requirement equivalent to TLAC standard for G-SIIs and the possibility for resolution
authorities to suspend the contractual obligations of institutions. Its transposition
into Spanish law has begun with Royal Decree-Law 7/2021 amending Law 11/2015,
among other regulations, and is expected to conclude shortly with the publication of
a royal decree amending Royal Decree 1012/2015.
The European Commission has also started to review the bank crisis
management and deposit insurance framework, with the aim ofmaking it
moreflexibleandefficientandincreasingdepositorprotection,ensuringthey
receive equal treatment. This review is part of the agenda to complete the Banking
Union, which will culminate in the creation of a European Deposit Insurance Scheme
(EDIS). The Commission is also contemplating harmonising insolvency regimes,31
which would include quasi-resolution tools for the administrative winding-up of
credit institutions and would ensure the support of insolvency deposit insurance
schemes as an alternative to paying the covered deposits.32 The proposal for a
Directive is expected to be published towards the end of 2021.
27 AspartoftheDigitalFinanceStrategyfortheEuropeanUnion,inSeptember2020theEuropeanCommissionsubmittedProposalforaRegulationCOM/2020/593onmarketsincrypto-assetstotheEuropeanParliamentandtheCouncil,whichwouldpotentiallycorrectthissituationinEurope.
28 See “BaselCommitteeconsultsonprudential treatmentof crypto-assetexposures”,BCBSpress releaseof10 June 2021.
29 See“Regulation,SupervisionandOversightofGlobalStablecoinArrangements”,FSBreportof13October2020.
30 See Directive(EU)2019/879oftheEuropeanParliamentandoftheCouncilof20 May 2019amendingDirective2014/59/EUas regards the loss-absorbingand recapitalisationcapacityofcredit institutionsand investmentfirmsandDirective98/26/EC.
31 See ReportfromtheCommissiontotheEuropeanParliamentandtheCouncilontheapplicationandreviewofDirective2014/59/EU (BankRecoveryandResolutionDirective)andRegulation806/2014 (SingleResolutionMechanism Regulation) of30 April 2019.
32 See Combinedevaluationroadmap/inceptionimpactassessment,EuropeanCommission,10 November 2020.

BANCO DE ESPAÑA 107 FINANCIAL STABILITY REPORT, AUTUM 2021 3. SYSTEMIC RISK AND PRUDENTIAL POLICY
Recuadro ?.?
TÍTULO RECUADROBox3.1
IMPACT OF CLIMATE CHANGE RISKS ON THE BANKING SECTOR
Climate change and the need to implement measures to
move towards a more sustainable economy pose risks
to the banking sector. Some stem from the materialisation
of physical risks associated with extreme climate conditions,
such as rising sea levels and water stress in certain areas.
Another set of risks is associated with the transition to a
more sustainable economy, since the implementation of
measures to prevent or mitigate climate change would
entail significant changes to human and economic activity.
These two types of risks could materialise simultaneously,
as risk mitigation measures may be late or insufficient. In
both cases, assessing their impact requires the use of
quantitative tools.
This box summarises the first work undertaken by the
Banco de España to quantify the impact of transition risks
on the banking sector using analytical models. The results
should be viewed with caution, as only part of the channels
are modelled, with a methodology that captures just some
of the adjustment costs. In addition, the box presents a
more exploratory study of the potential long-term impact
of physical risks on credit risk, comparing them with
transition risks, using scenarios from the Network for
Greening the Financial System (NGFS). This allows an
assessment to be made of the advantages of taking action
now to prevent climate change and avoid the costs that
would arise if the physical risks materialise.
The scenarios used in this first analysis to assess the impact of climate change-related transition risks were prepared using the Carbon Tax Sectoral (CATS) model.1 This is a general equilibrium model with a very detailed sectoral structure (51 non-energy and two energy sectors), designed to capture the impact of an increase in the cost of greenhouse gas emissions. The calibration of the model replicates the main characteristics of the Spanish economy in terms of productive structure, energy intensity, emissions by type of technology, etc.
With this model, simulations were carried out to assess the impact on the Spanish economy of four different shocks: 1) an increase in the price of emission allowances (from €25 to €100 per tonne of CO2 equivalent); 2) an extension of the Emissions Trading Scheme (ETS) to all firms, including those currently excluded for belonging to the so-called non-ETS sectors; 3) a combination of the two foregoing measures; and, additionally, 4) the extension of the ETS to also include emissions generated directly by households. The baseline scenario used to study the implementation of these measures considers an economic trend in Spain that is analogous to that prior to the COVID-19 crisis.
According to the results of the model, the effect of these shocks on economic activity in aggregate terms would be noticeable but not huge (see Table 1). However, there are a number of reasons why these effects might constitute a
1 SeeP.Aguilar,B.GonzálezandS.Hurtado(2021),“CarbonTaxSectoralModel(CATS):asectoralmodelforclimatechangestresstestscenarios”,Occasional Paper, BancodeEspaña(forthcoming).
SOURCE: Banco de España.
a The lower bound of the range of impact on sectoral GVA under each scenario is the most negative difference between the accumulated rates of change over the three years of the exercise and the corresponding measures under the baseline scenario. The upper bound represents the analogous most positive difference. The scenarios 1) increase in the price of emission allowances; 2) extension of the ETS coverage; 3) combination (of the two shocks); and 4) combination including extension to households, correspond to those described in the text with the same numbering.
GDP Lower bound Upper bound
1.03.5-6.0-esaercni ecirp snoissimE1.01.2-3.0-egarevoc STE fo noisnetxE
3.04.8-3.1-noitanibmoC
3.01.9-9.1-sdlohesuoh ot noisnetxe .lcni noitanibmoC
Range of impact on non-energy sectoral GVA (a)
IMPACT OF SIMULATED SHOCKS ON ECONOMIC ACTIVITY
Table 1
Differences in accumulated rates of change (t+1, t+2, t+3) vis-à-vis the baseline scenario
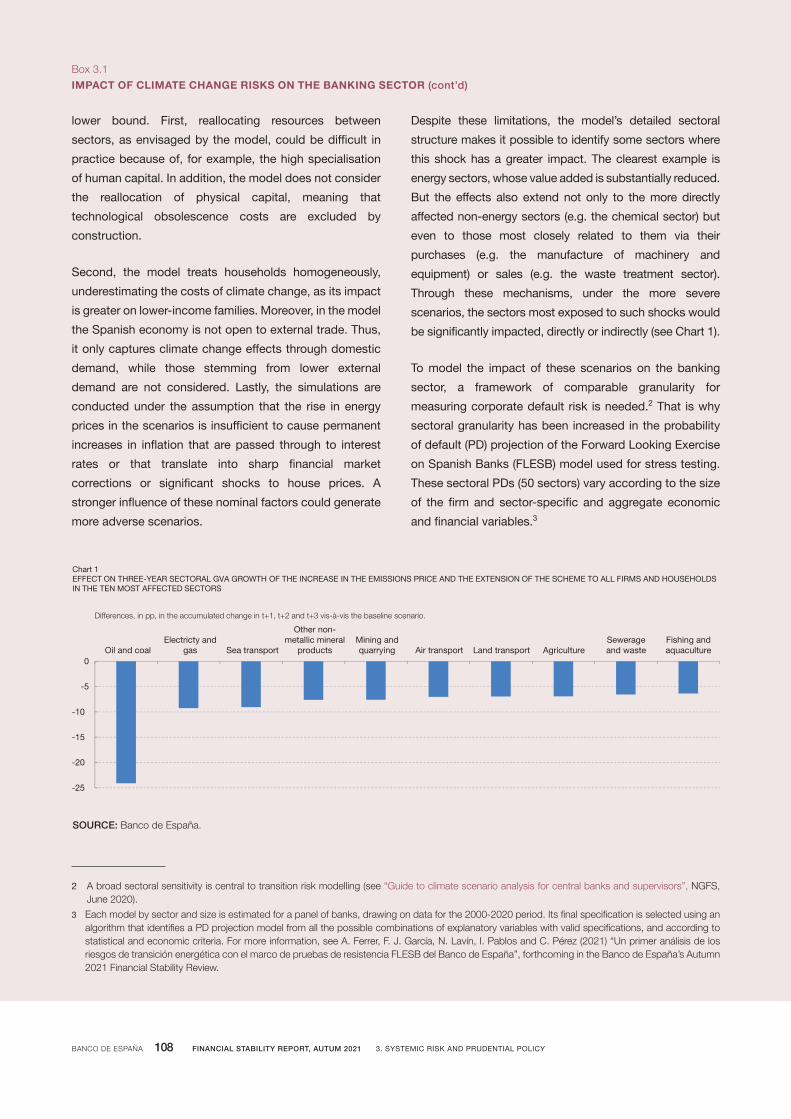
BANCO DE ESPAÑA 108 FINANCIAL STABILITY REPORT, AUTUM 2021 3. SYSTEMIC RISK AND PRUDENTIAL POLICY
Recuadro ?.?
TÍTULO RECUADROBox3.1
IMPACT OF CLIMATE CHANGE RISKS ON THE BANKING SECTOR (cont’d)
lower bound. First, reallocating resources between
sectors, as envisaged by the model, could be difficult in
practice because of, for example, the high specialisation
of human capital. In addition, the model does not consider
the reallocation of physical capital, meaning that
technological obsolescence costs are excluded by
construction.
Second, the model treats households homogeneously,
underestimating the costs of climate change, as its impact
is greater on lower-income families. Moreover, in the model
the Spanish economy is not open to external trade. Thus,
it only captures climate change effects through domestic
demand, while those stemming from lower external
demand are not considered. Lastly, the simulations are
conducted under the assumption that the rise in energy
prices in the scenarios is insufficient to cause permanent
increases in inflation that are passed through to interest
rates or that translate into sharp financial market
corrections or significant shocks to house prices. A
stronger influence of these nominal factors could generate
more adverse scenarios.
Despite these limitations, the model’s detailed sectoral
structure makes it possible to identify some sectors where
this shock has a greater impact. The clearest example is
energy sectors, whose value added is substantially reduced.
But the effects also extend not only to the more directly
affected non-energy sectors (e.g. the chemical sector) but
even to those most closely related to them via their
purchases (e.g. the manufacture of machinery and
equipment) or sales (e.g. the waste treatment sector).
Through these mechanisms, under the more severe
scenarios, the sectors most exposed to such shocks would
be significantly impacted, directly or indirectly (see Chart 1).
To model the impact of these scenarios on the banking
sector, a framework of comparable granularity for
measuring corporate default risk is needed.2 That is why
sectoral granularity has been increased in the probability
of default (PD) projection of the Forward Looking Exercise
on Spanish Banks (FLESB) model used for stress testing.
These sectoral PDs (50 sectors) vary according to the size
of the firm and sector-specific and aggregate economic
and financial variables.3
2 A broad sectoral sensitivity is central to transition risk modelling (see “Guidetoclimatescenarioanalysisforcentralbanksandsupervisors”,NGFS, June2020).
3 Eachmodelbysectorandsizeisestimatedforapanelofbanks,drawingondataforthe2000-2020period.ItsfinalspecificationisselectedusinganalgorithmthatidentifiesaPDprojectionmodelfromallthepossiblecombinationsofexplanatoryvariableswithvalidspecifications,andaccordingtostatisticalandeconomiccriteria.Formoreinformation,seeA.Ferrer,F.J.García,N.Lavín,I.PablosandC.Pérez(2021)“UnprimeranálisisdelosriesgosdetransiciónenergéticaconelmarcodepruebasderesistenciaFLESBdelBancodeEspaña”,forthcomingintheBancodeEspaña’sAutumn2021FinancialStabilityReview.
SOURCE: Banco de España.
-25
-20
-15
-10
-5
0Oil and coal
Electricty andgas Sea transport
Other non-metallic mineral
productsMining andquarrying Air transport Land transport Agriculture
Sewerageand waste
Fishing andaquaculture
Chart 1EFFECT ON THREE-YEAR SECTORAL GVA GROWTH OF THE INCREASE IN THE EMISSIONS PRICE AND THE EXTENSION OF THE SCHEME TO ALL FIRMS AND HOUSEHOLDS IN THE TEN MOST AFFECTED SECTORS
Differences, in pp, in the accumulated change in t+1, t+2 and t+3 vis-à-vis the baseline scenario.

BANCO DE ESPAÑA 109 FINANCIAL STABILITY REPORT, AUTUM 2021 3. SYSTEMIC RISK AND PRUDENTIAL POLICY
Recuadro ?.?
TÍTULO RECUADRORecuadro ?.?
TÍTULO RECUADROBox3.1
IMPACT OF CLIMATE CHANGE RISKS ON THE BANKING SECTOR (cont’d)
It should be noted that this framework captures transition
scenarios’ sectoral heterogeneity in two ways: i) by including
economic and financial variables in all models, and ii) by
constructing separate models by sector and size, providing
different elasticities whenever the available information so
allows.4 Considering sectoral financial ratios makes it
possible to analyse PD sensitivity to firms’ hypothetical
responses aimed at reducing their emissions (e.g. increasing
borrowing to acquire new, greener technologies).
The impact on PDs of the transition scenarios varies
among sectors. It is summarised in Chart 2, which presents
a scatter plot, with each point representing a sector,
showing the differences in GVA growth (three-year average,
X axis) and in PD (average for 2021-2023, Y axis) between
different scenarios and the baseline scenario. Specifically,
the left-hand panel shows these differences for the
emissions price increase scenario, while the right-hand
panel depicts those for the scenario that also envisages
extending ETS coverage to all firms and households
(severest scenario). As is to be expected, the sectors hit
hardest by the climate transition (those with the largest
falls in GVA vis-à-vis the baseline scenario) tend to present
higher PD increases.
As shown in Chart 3, these higher probabilities of default
would impact cumulative bank profitability. To illustrate this
impact, the ratio of accumulated profit after tax divided by the
volume of average risk-weighted assets (RWAs), both as
per the scenario, is considered. The difference in this ratio
4 Theestimationalgorithmassesseswhetherthenumberofobservationsissufficienttoestimateaseparatemodelforeachsectorandfirmsize.Whentheavailabledataareinsufficientforestimationatthehighestlevelofdisaggregationinasector,theestimatedelasticitiesofthebroaderindustrytowhichitbelongsareassignedtoitoverall.
SOURCE: Banco de España.
a Each point on the chart relates to a sector of business activity in accordance with the Spanish National Classification of Economic Activities and depicts the difference in that sector's average PD, weighted by the number of borrowers, over a three-year horizon between a trend-based baseline scenario (under which no measures are applied) and adverse scenarios resulting from different extensions of the CO2 emission allowances trading scheme. See Box 3.1 for further details.
b This adverse scenario considers an increase in CO2 emission allowance prices from €25 to €100.c This adverse scenario considers a combination of the scenario described in (b) and an extension of the requirement for allowances to other productive
sectors and to households.d The bars show the difference in the ratio of profit after tax to RWAs between the corresponding scenario and the baseline scenario, for each of the
three groups of institutions.e The effects of the transition costs are calculated under four alternative scenarios. The first scenario, “emissions price increase”, considers an increase in
CO2 emission allowance prices from €25 to €100. The second scenario, “extension of ETS coverage”, considers the extension of the ETS coverage to all firms. The “combination” scenario simultaneously considers the CO2 emission allowance price increase and the extension of the ETS coverage to all firms. Lastly, the “combination including extension to households” considers the ETS coverage also being extended to households.
f To calculate the ratio, the numerator (profit after tax) is cumulative for the three years in the exercise, while the denominator reflects the value of average RWAs in the same period.
-0.45
-0.40
-0.35
-0.30
-0.25
-0.20
-0.15
-0.10
-0.05
0.00
Emissions priceincrease
Extension of ETScoverage Combination
Combination incl.extension tohouseholds
Chart 3EFFECT OF TRANSITION COSTS ON THE RATIO OF PROFIT AFTER TAX TO RWAs (d) (e) (f)
0.0
0.1
0.2
0.3
0.4
0.5
0.6
0.7
0.8
0.9
-9 -8 -7 -6 -5 -4 -3 -2 -1 0
EMISSIONS PRICE INCREASE (b)
Chart 2EFFECT OF TRANSITION COSTS ON PROBABILITIES OF DEFAULT (PD) (a)
pp
0.0
0.1
0.2
0.3
0.4
0.5
0.6
0.7
0.8
0.9
-9 -8 -7 -6 -5 -4 -3 -2 -1 0
COMBINATION INCL. EXTENSION TOHOUSEHOLDS (c)
INTERNATIONAL SIs OTHER SIs LSIs
X axis: differences in average rates of change in GVA vis-à-vis the baseline scenario (pp)Y axis: differences in average PDs vis-à-vis the baseline scenario (pp)
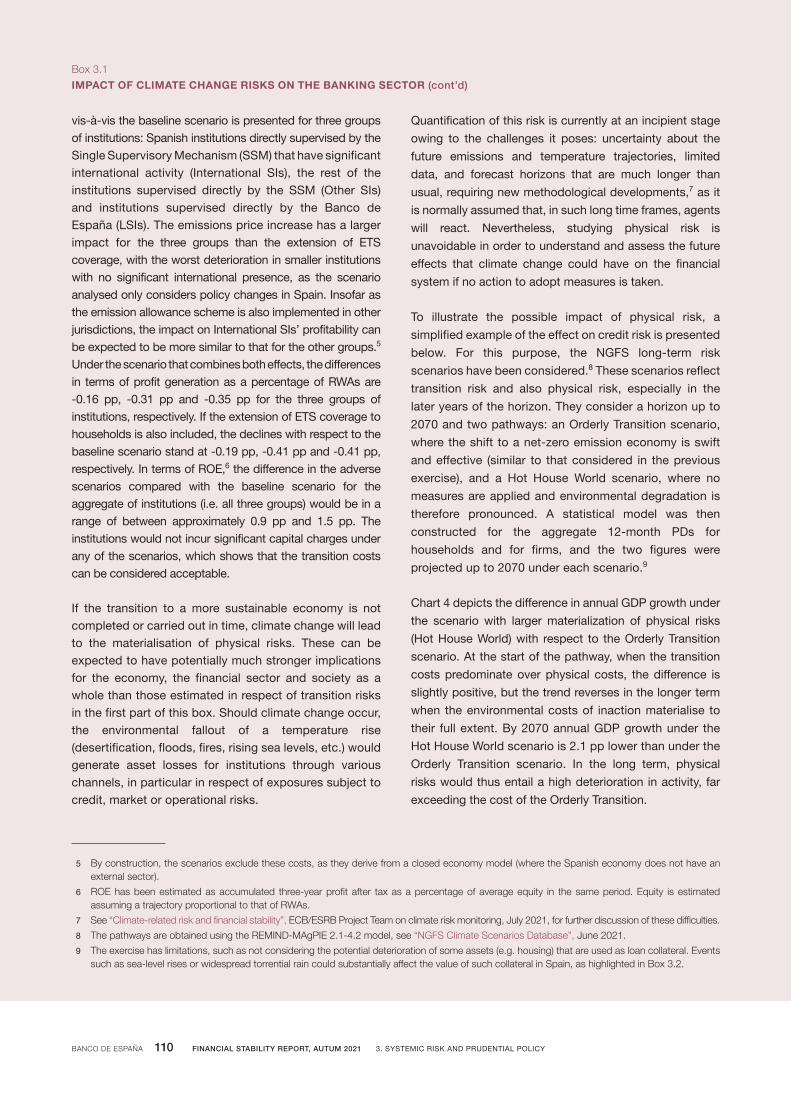
BANCO DE ESPAÑA 110 FINANCIAL STABILITY REPORT, AUTUM 2021 3. SYSTEMIC RISK AND PRUDENTIAL POLICY
Recuadro ?.?
TÍTULO RECUADRORecuadro ?.?
TÍTULO RECUADRO
º
Box3.1
IMPACT OF CLIMATE CHANGE RISKS ON THE BANKING SECTOR (cont’d)
vis-à-vis the baseline scenario is presented for three groups of institutions: Spanish institutions directly supervised by the Single Supervisory Mechanism (SSM) that have significant international activity (International SIs), the rest of the institutions supervised directly by the SSM (Other SIs) and institutions supervised directly by the Banco de España (LSIs). The emissions price increase has a larger impact for the three groups than the extension of ETS coverage, with the worst deterioration in smaller institutions with no significant international presence, as the scenario analysed only considers policy changes in Spain. Insofar as the emission allowance scheme is also implemented in other jurisdictions, the impact on International SIs’ profitability can be expected to be more similar to that for the other groups.5 Under the scenario that combines both effects, the differences in terms of profit generation as a percentage of RWAs are -0.16 pp, -0.31 pp and -0.35 pp for the three groups of institutions, respectively. If the extension of ETS coverage to households is also included, the declines with respect to the baseline scenario stand at -0.19 pp, -0.41 pp and -0.41 pp, respectively. In terms of ROE,6 the difference in the adverse scenarios compared with the baseline scenario for the aggregate of institutions (i.e. all three groups) would be in a range of between approximately 0.9 pp and 1.5 pp. The institutions would not incur significant capital charges under any of the scenarios, which shows that the transition costs can be considered acceptable.
If the transition to a more sustainable economy is not completed or carried out in time, climate change will lead to the materialisation of physical risks. These can be expected to have potentially much stronger implications for the economy, the financial sector and society as a whole than those estimated in respect of transition risks in the first part of this box. Should climate change occur, the environmental fallout of a temperature rise (desertification, floods, fires, rising sea levels, etc.) would generate asset losses for institutions through various channels, in particular in respect of exposures subject to credit, market or operational risks.
Quantification of this risk is currently at an incipient stage
owing to the challenges it poses: uncertainty about the
future emissions and temperature trajectories, limited
data, and forecast horizons that are much longer than
usual, requiring new methodological developments,7 as it
is normally assumed that, in such long time frames, agents
will react. Nevertheless, studying physical risk is
unavoidable in order to understand and assess the future
effects that climate change could have on the financial
system if no action to adopt measures is taken.
To illustrate the possible impact of physical risk, a
simplified example of the effect on credit risk is presented
below. For this purpose, the NGFS long-term risk
scenarios have been considered.8 These scenarios reflect
transition risk and also physical risk, especially in the
later years of the horizon. They consider a horizon up to
2070 and two pathways: an Orderly Transition scenario,
where the shift to a net-zero emission economy is swift
and effective (similar to that considered in the previous
exercise), and a Hot House World scenario, where no
measures are applied and environmental degradation is
therefore pronounced. A statistical model was then
constructed for the aggregate 12-month PDs for
households and for firms, and the two figures were
projected up to 2070 under each scenario.9
Chart 4 depicts the difference in annual GDP growth under
the scenario with larger materialization of physical risks
(Hot House World) with respect to the Orderly Transition
scenario. At the start of the pathway, when the transition
costs predominate over physical costs, the difference is
slightly positive, but the trend reverses in the longer term
when the environmental costs of inaction materialise to
their full extent. By 2070 annual GDP growth under the
Hot House World scenario is 2.1 pp lower than under the
Orderly Transition scenario. In the long term, physical
risks would thus entail a high deterioration in activity, far
exceeding the cost of the Orderly Transition.
5 Byconstruction,thescenariosexcludethesecosts,astheyderivefromaclosedeconomymodel(wheretheSpanisheconomydoesnothaveanexternalsector).
6 ROEhasbeenestimatedasaccumulated three-yearprofitafter taxasapercentageofaverageequity in thesameperiod.Equity isestimatedassumingatrajectoryproportionaltothatofRWAs.
7 See “Climate-relatedriskandfinancialstability”,ECB/ESRBProjectTeamonclimateriskmonitoring,July2021,forfurtherdiscussionofthesedifficulties.
8 ThepathwaysareobtainedusingtheREMIND-MAgPIE2.1-4.2model,see“NGFSClimateScenariosDatabase”,June2021.
9 Theexercisehaslimitations,suchasnotconsideringthepotentialdeteriorationofsomeassets(e.g.housing)thatareusedasloancollateral.Eventssuchassea-levelrisesorwidespreadtorrentialraincouldsubstantiallyaffectthevalueofsuchcollateralinSpain,ashighlightedinBox3.2.
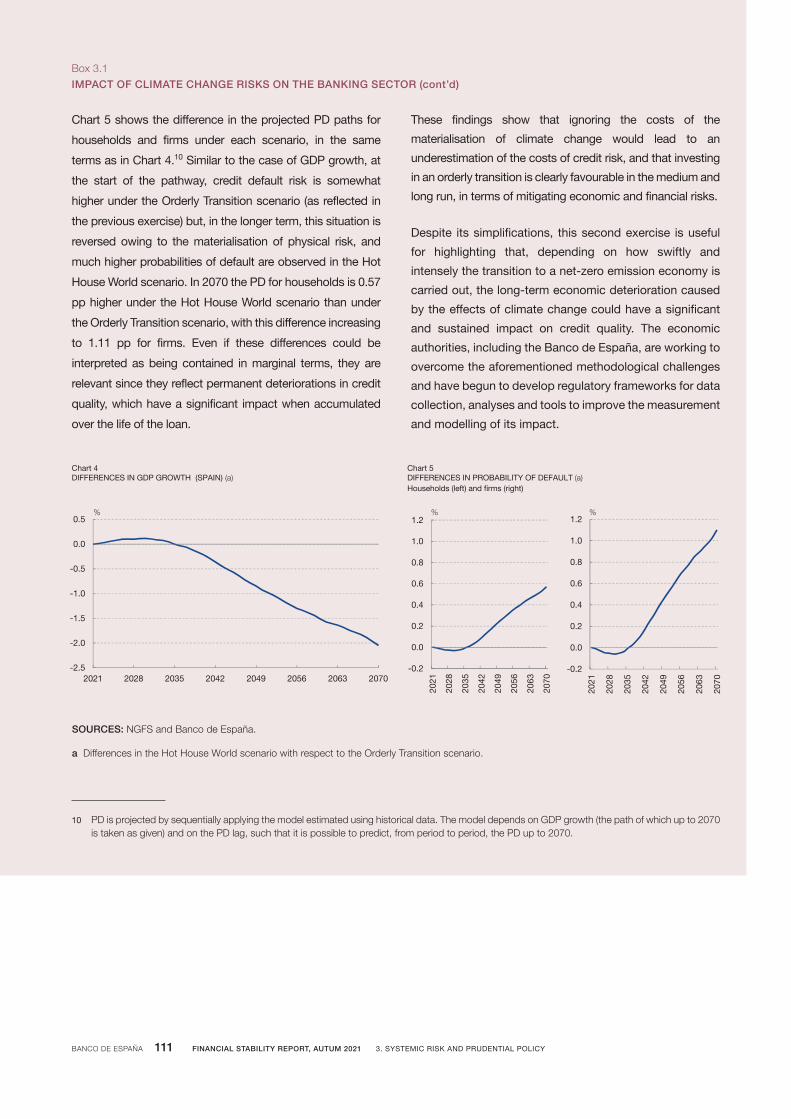
º
10 PDisprojectedbysequentiallyapplyingthemodelestimatedusinghistoricaldata.ThemodeldependsonGDPgrowth(thepathofwhichupto2070istakenasgiven)andonthePDlag,suchthatitispossibletopredict,fromperiodtoperiod,thePDupto2070.
BANCO DE ESPAÑA 111 FINANCIAL STABILITY REPORT, AUTUM 2021 3. SYSTEMIC RISK AND PRUDENTIAL POLICY
Box3.1
IMPACT OF CLIMATE CHANGE RISKS ON THE BANKING SECTOR (cont’d)
Chart 5 shows the difference in the projected PD paths for
households and firms under each scenario, in the same
terms as in Chart 4.10 Similar to the case of GDP growth, at
the start of the pathway, credit default risk is somewhat
higher under the Orderly Transition scenario (as reflected in
the previous exercise) but, in the longer term, this situation is
reversed owing to the materialisation of physical risk, and
much higher probabilities of default are observed in the Hot
House World scenario. In 2070 the PD for households is 0.57
pp higher under the Hot House World scenario than under
the Orderly Transition scenario, with this difference increasing
to 1.11 pp for firms. Even if these differences could be
interpreted as being contained in marginal terms, they are
relevant since they reflect permanent deteriorations in credit
quality, which have a significant impact when accumulated
over the life of the loan.
These findings show that ignoring the costs of the
materialisation of climate change would lead to an
underestimation of the costs of credit risk, and that investing
in an orderly transition is clearly favourable in the medium and
long run, in terms of mitigating economic and financial risks.
Despite its simplifications, this second exercise is useful
for highlighting that, depending on how swiftly and
intensely the transition to a net-zero emission economy is
carried out, the long-term economic deterioration caused
by the effects of climate change could have a significant
and sustained impact on credit quality. The economic
authorities, including the Banco de España, are working to
overcome the aforementioned methodological challenges
and have begun to develop regulatory frameworks for data
collection, analyses and tools to improve the measurement
and modelling of its impact.
SOURCES: NGFS and Banco de España.
a Differences in the Hot House World scenario with respect to the Orderly Transition scenario.
Chart 5DIFFERENCES IN PROBABILITY OF DEFAULT (a)Households (left) and firms (right)
Chart 4DIFFERENCES IN GDP GROWTH (SPAIN) (a)
%% %
-0.2
0.0
0.2
0.4
0.6
0.8
1.0
1.2
2021
2028
2035
2042
2049
2056
2063
2070
-2.5
-2.0
-1.5
-1.0
-0.5
0.0
0.5
2021 2028 2035 2042 2049 2056 2063 2070-0.2
0.0
0.2
0.4
0.6
0.8
1.0
1.2
2021
2028
2035
2042
2049
2056
2063
2070
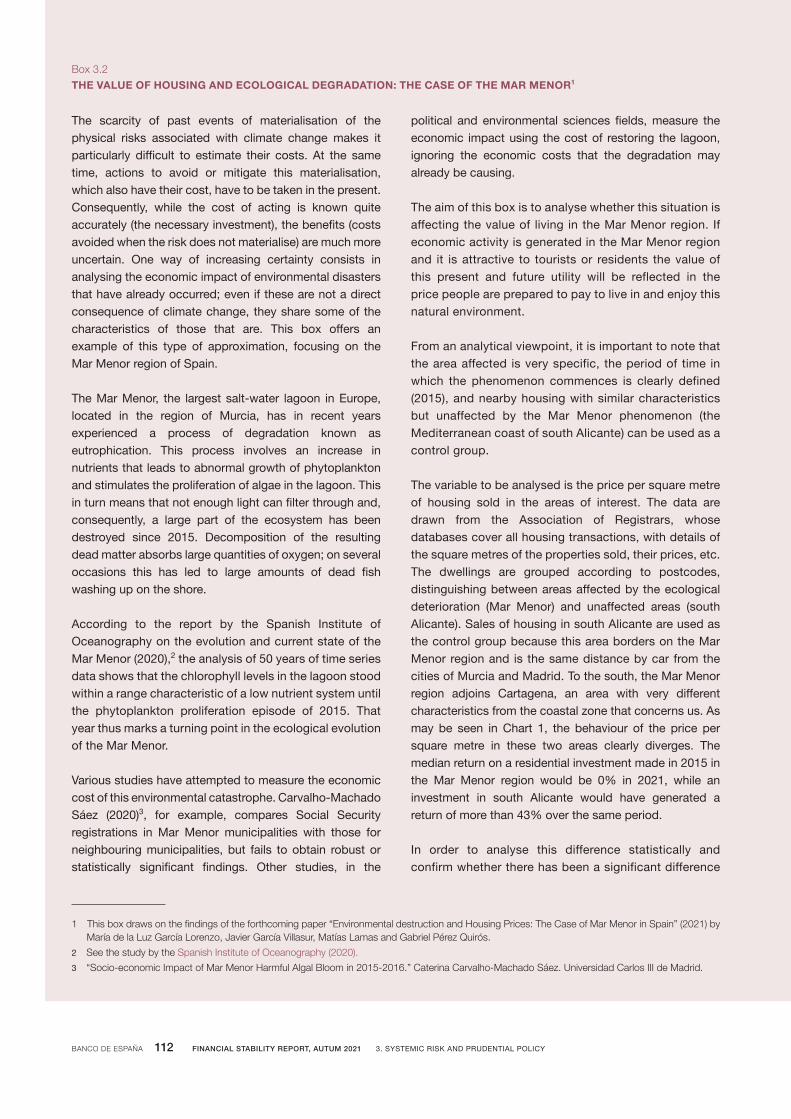
BANCO DE ESPAÑA 112 FINANCIAL STABILITY REPORT, AUTUM 2021 3. SYSTEMIC RISK AND PRUDENTIAL POLICY
Recuadro ?.?
TÍTULO RECUADRORecuadro ?.?
TÍTULO RECUADRO
The scarcity of past events of materialisation of the physical risks associated with climate change makes it particularly difficult to estimate their costs. At the same time, actions to avoid or mitigate this materialisation, which also have their cost, have to be taken in the present. Consequently, while the cost of acting is known quite accurately (the necessary investment), the benefits (costs avoided when the risk does not materialise) are much more uncertain. One way of increasing certainty consists in analysing the economic impact of environmental disasters that have already occurred; even if these are not a direct consequence of climate change, they share some of the characteristics of those that are. This box offers an example of this type of approximation, focusing on the Mar Menor region of Spain.
The Mar Menor, the largest salt-water lagoon in Europe, located in the region of Murcia, has in recent years experienced a process of degradation known as eutrophication. This process involves an increase in nutrients that leads to abnormal growth of phytoplankton and stimulates the proliferation of algae in the lagoon. This in turn means that not enough light can filter through and, consequently, a large part of the ecosystem has been destroyed since 2015. Decomposition of the resulting dead matter absorbs large quantities of oxygen; on several occasions this has led to large amounts of dead fish washing up on the shore.
According to the report by the Spanish Institute of Oceanography on the evolution and current state of the Mar Menor (2020),2 the analysis of 50 years of time series data shows that the chlorophyll levels in the lagoon stood within a range characteristic of a low nutrient system until the phytoplankton proliferation episode of 2015. That year thus marks a turning point in the ecological evolution of the Mar Menor.
Various studies have attempted to measure the economic cost of this environmental catastrophe. Carvalho-Machado Sáez (2020)3, for example, compares Social Security registrations in Mar Menor municipalities with those for neighbouring municipalities, but fails to obtain robust or statistically significant findings. Other studies, in the
political and environmental sciences fields, measure the economic impact using the cost of restoring the lagoon, ignoring the economic costs that the degradation may already be causing.
The aim of this box is to analyse whether this situation is affecting the value of living in the Mar Menor region. If economic activity is generated in the Mar Menor region and it is attractive to tourists or residents the value of this present and future utility will be reflected in the price people are prepared to pay to live in and enjoy this natural environment.
From an analytical viewpoint, it is important to note that the area affected is very specific, the period of time in which the phenomenon commences is clearly defined (2015), and nearby housing with similar characteristics but unaffected by the Mar Menor phenomenon (the Mediterranean coast of south Alicante) can be used as a control group.
The variable to be analysed is the price per square metre of housing sold in the areas of interest. The data are drawn from the Association of Registrars, whose databases cover all housing transactions, with details of the square metres of the properties sold, their prices, etc. The dwellings are grouped according to postcodes, distinguishing between areas affected by the ecological deterioration (Mar Menor) and unaffected areas (south Alicante). Sales of housing in south Alicante are used as the control group because this area borders on the Mar Menor region and is the same distance by car from the cities of Murcia and Madrid. To the south, the Mar Menor region adjoins Cartagena, an area with very different characteristics from the coastal zone that concerns us. As may be seen in Chart 1, the behaviour of the price per square metre in these two areas clearly diverges. The median return on a residential investment made in 2015 in the Mar Menor region would be 0% in 2021, while an investment in south Alicante would have generated a return of more than 43% over the same period.
In order to analyse this difference statistically and confirm whether there has been a significant difference
Box3.2
THE VALUE OF HOUSING AND ECOLOGICAL DEGRADATION: THE CASE OF THE MAR MENOR1
1 Thisboxdrawsonthefindingsoftheforthcomingpaper“EnvironmentaldestructionandHousingPrices:TheCaseofMarMenorinSpain”(2021)byMaríadelaLuzGarcíaLorenzo,JavierGarcíaVillasur,MatíasLamasandGabrielPérezQuirós.
2 See the study by theSpanishInstituteofOceanography(2020).
3 “Socio-economicImpactofMarMenorHarmfulAlgalBloomin2015-2016.”CaterinaCarvalho-MachadoSáez.UniversidadCarlosIIIdeMadrid.
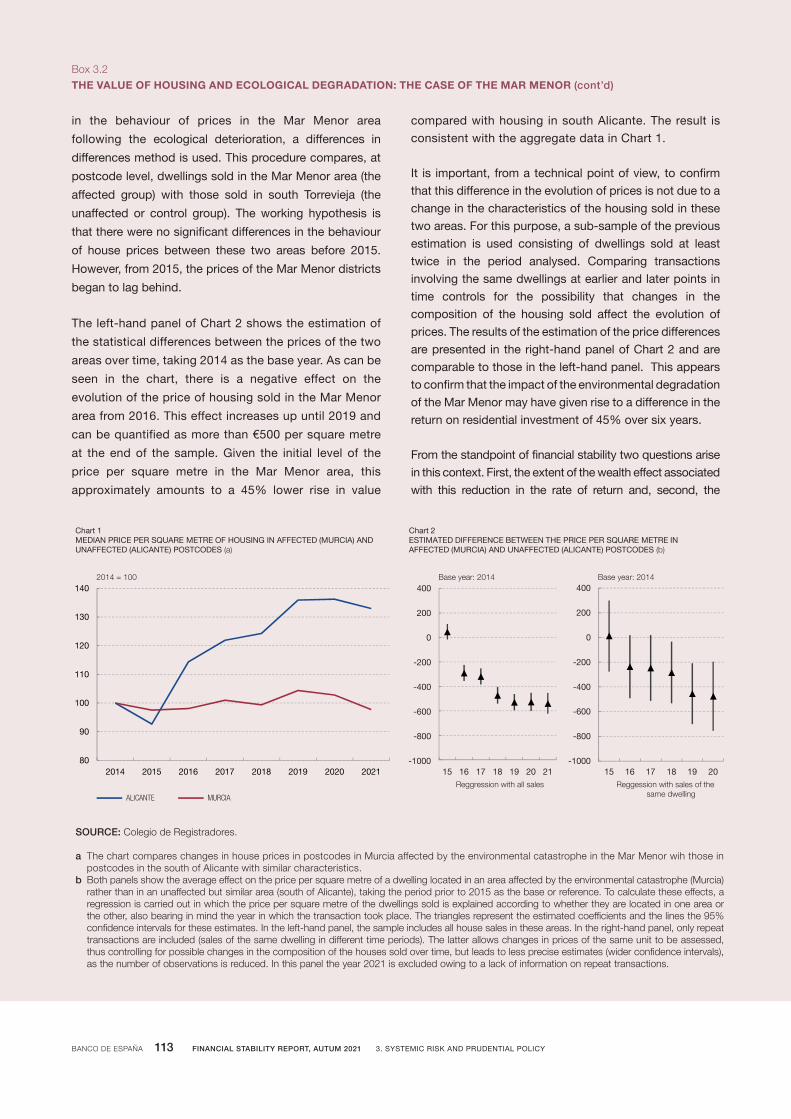
BANCO DE ESPAÑA 113 FINANCIAL STABILITY REPORT, AUTUM 2021 3. SYSTEMIC RISK AND PRUDENTIAL POLICY
Recuadro ?.?
TÍTULO RECUADROBox3.2
THE VALUE OF HOUSING AND ECOLOGICAL DEGRADATION: THE CASE OF THE MAR MENOR (cont’d)
in the behaviour of prices in the Mar Menor area
following the ecological deterioration, a differences in
differences method is used. This procedure compares, at
postcode level, dwellings sold in the Mar Menor area (the
affected group) with those sold in south Torrevieja (the
unaffected or control group). The working hypothesis is
that there were no significant differences in the behaviour
of house prices between these two areas before 2015.
However, from 2015, the prices of the Mar Menor districts
began to lag behind.
The left-hand panel of Chart 2 shows the estimation of
the statistical differences between the prices of the two
areas over time, taking 2014 as the base year. As can be
seen in the chart, there is a negative effect on the
evolution of the price of housing sold in the Mar Menor
area from 2016. This effect increases up until 2019 and
can be quantified as more than €500 per square metre
at the end of the sample. Given the initial level of the
price per square metre in the Mar Menor area, this
approximately amounts to a 45% lower rise in value
compared with housing in south Alicante. The result is consistent with the aggregate data in Chart 1.
It is important, from a technical point of view, to confirm that this difference in the evolution of prices is not due to a change in the characteristics of the housing sold in these two areas. For this purpose, a sub-sample of the previous estimation is used consisting of dwellings sold at least twice in the period analysed. Comparing transactions involving the same dwellings at earlier and later points in time controls for the possibility that changes in the composition of the housing sold affect the evolution of prices. The results of the estimation of the price differences are presented in the right-hand panel of Chart 2 and are comparable to those in the left-hand panel. This appears to confirm that the impact of the environmental degradation of the Mar Menor may have given rise to a difference in the return on residential investment of 45% over six years.
From the standpoint of financial stability two questions arise in this context. First, the extent of the wealth effect associated with this reduction in the rate of return and, second, the
SOURCE: Colegio de Registradores.
a The chart compares changes in house prices in postcodes in Murcia affected by the environmental catastrophe in the Mar Menor wih those in postcodes in the south of Alicante with similar characteristics.
b Both panels show the average effect on the price per square metre of a dwelling located in an area affected by the environmental catastrophe (Murcia) rather than in an unaffected but similar area (south of Alicante), taking the period prior to 2015 as the base or reference. To calculate these effects, a regression is carried out in which the price per square metre of the dwellings sold is explained according to whether they are located in one area or the other, also bearing in mind the year in which the transaction took place. The triangles represent the estimated coefficients and the lines the 95% confidence intervals for these estimates. In the left-hand panel, the sample includes all house sales in these areas. In the right-hand panel, only repeat transactions are included (sales of the same dwelling in different time periods). The latter allows changes in prices of the same unit to be assessed, thus controlling for possible changes in the composition of the houses sold over time, but leads to less precise estimates (wider confidence intervals), as the number of observations is reduced. In this panel the year 2021 is excluded owing to a lack of information on repeat transactions.
80
90
100
110
120
130
140
2014 2015 2016 2017 2018 2019 2020 2021
ALICANTE MURCIA
2014 = 100
Chart 1MEDIAN PRICE PER SQUARE METRE OF HOUSING IN AFFECTED (MURCIA) AND UNAFFECTED (ALICANTE) POSTCODES (a)
-1000
-800
-600
-400
-200
0
200
400
15 16 17 18 19 20 21
Chart 2ESTIMATED DIFFERENCE BETWEEN THE PRICE PER SQUARE METRE IN AFFECTED (MURCIA) AND UNAFFECTED (ALICANTE) POSTCODES (b)
Base year: 2014
Reggression with all sales
-1000
-800
-600
-400
-200
0
200
400
15 16 17 18 19 20Reggession with sales of the
same dwelling
Base year: 2014

BANCO DE ESPAÑA 114 FINANCIAL STABILITY REPORT, AUTUM 2021 3. SYSTEMIC RISK AND PRUDENTIAL POLICY
Recuadro ?.?
TÍTULO RECUADRO
consequences it may have on credit standards for loans secured by housing affected by an ecological deterioration of this type. Obviously, if this problem is limited to a very specific area, such as the Mar Menor, then the stability of the Spanish financial system will not be threatened. However, should it extend to a much wider area, which may occur, for example, if the sea level rises significantly as a result of climate change, the consequences may be material.
Answering the first question on the wealth effect requires an estimation of the number of dwellings existing in the affected Mar Menor postcodes. A rough estimate is obtained using information from cadastral statistics. According to the latter, the total number of dwellings in the Mar Menor area in 2021 was 117,000. Given that the median dwelling is 72 square metres and the median price per square metre is €1,095 the total value of the housing is €9,224 million. The failure of the price of these dwellings to rise during the period analysed implies a loss of wealth of €4,150 million, relative to a scenario in which the ecological catastrophe did not occur.
A first approximation to the answer to the second question on credit market conditions is obtained by analysing the
evolution of the median mortgage in both areas. In the Mar
Menor area, the median mortgage remained unchanged
between 2014 and 2021, at around €60,000. The median
mortgage in the south Alicante area increased by more
than 100%, from €44,000 in 2014 to a high of more than
€90,000 in 2021, which shows the dynamism of one area
compared with the stagnation of the other. The findings
suggest that an ecological deterioration like the one
described has the potential to significantly reduce the
value of the available collateral, making access to credit
more difficult in the affected areas.
In short, this exercise, which gives a precise estimate of
the serious economic impact of the environmental
deterioration in the Mar Menor region, seeks to illustrate
more generally the importance of the physical risks of
climate change for financial stability and, specifically, the
wealth of households and the quality of banks’ mortgage
portfolios. This analysis suggests that, should the
materialisation of climate change lead to comparable
environmental damage in other areas of the Spanish
Levante, the economic damage and its implications for
financial stability could be significant.
Box3.2
THE VALUE OF HOUSING AND ECOLOGICAL DEGRADATION: THE CASE OF THE MAR MENOR (cont’d)


BANCO DE ESPAÑA 116 INFORME DE ESTABILIDAD FINANCIERA. PRIMAVERA 2021 2. RIESGOS Y CAPACIDAD DE RESISTENCIA DEL SECTOR FINANCIERO
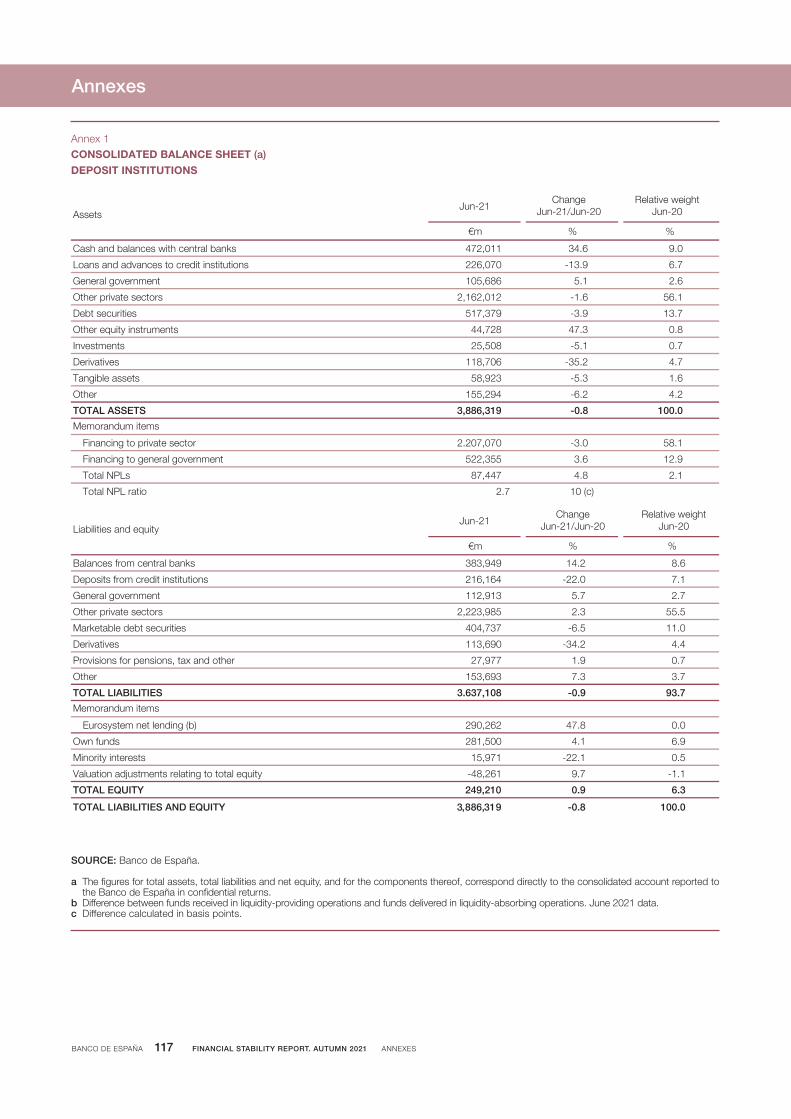
BANCO DE ESPAÑA 117 FINANCIAL STABILITY REPORT. AUTUMN 2021 ANNEXES
Annexes
CONSOLIDATED BALANCE SHEET (a)
DEPOSIT INSTITUTIONS
Annex 1
SOURCE: Banco de España.
a The figures for total assets, total liabilities and net equity, and for the components thereof, correspond directly to the consolidated account reported to the Banco de España in confidential returns.
b Difference between funds received in liquidity-providing operations and funds delivered in liquidity-absorbing operations. June 2021 data. c Difference calculated in basis points.
Jun-21Change
Jun-21/Jun-20Relative weight
Jun-20
% %€m
0.96.43110,274Cash and balances with central banks
7.69.31-070,622Loans and advances to credit institutions
6.21.5686,501General government
1.656.1-210,261,2Other private sectors
7.319.3-973,715Debt securities
8.03.74827,44Other equity instruments
Investments 25,508 -5.1 0.7
Derivatives 118,706 -35.2 4.7
Tangible assets
Memorandum items
58,923 -5.3 1.6
Other 155,294 -6.2 4.2
0.0018.0-913,688,3TOTAL ASSETS
1.850.3-070,702.2Financing to private sector
9.216.3553,225Financing to general government
1.28.4744,78Total NPLs
)c( 017.2Total NPL ratio
Jun-21Change
Jun-21/Jun-20Relative weight
Jun-20
% %€m
6.82.41949,383Balances from central banks
1.70.22-461,612Deposits from credit institutions
7.27.5319,211General government
5.553.2589,322,2Other private sectors
0.115.6-737,404Marketable debt securities
Derivatives
Memorandum items
113,690 -34.2 4.4
7.09.1779,72Provisions for pensions, tax and other
Other 153,693 7.3 3.7
7.399.0-801,736.3TOTAL LIABILITIES
0.08.74262,092Eurosystem net lending (b)
Own funds 281,500 6.9
5.01.22-179,51Minority interests
1.1-7.9162,84-Valuation adjustments relating to total equity
3.69.0012,942TOTAL EQUITY
0.0018.0-913,688,3TOTAL LIABILITIES AND EQUITY
Assets
Liabilities and equity
4.1

BANCO DE ESPAÑA 118 FINANCIAL STABILITY REPORT. AUTUMN 2021 ANNEXES
CONSOLIDATED INCOME STATEMENTDEPOSIT INSTITUTIONS
Annex 2
SOURCE: Banco de España.NOTE: The consolidated income statement includes pro-forma information pertaining to the months of activity of a significant institution absorbed in 2021 through a merger process.
Jun-20 Jun-21
€m% Change
Jun-21/Jun-20% ATA % ATA
23.236.21.01-408,44eunever laicnaniF
36.028.05.12-861,21stsoc laicnaniF
96.118.11.5-636,23emocni tseretni teN
40.030.09.82297stnemurtsni latipac morf nruteR
37.148.15.4-924,33emocni laicnanif teN
Share of profit or loss of entities accounted for using the equity method 1,468 43.7 0.05 0.08
86.076.00.4791,31snoissimmoc teN
51.071.02.11-748,2seitilibail dna stessa laicnanif no sessol dna sniaG
00.010.07.59-7)ten( emocni gnitarepo rehtO
46.247.22.2-849,05emocni ssorG
63.143.16.3733,62sesnepxe gnitarepO
72.104.17.7-116,42emocni gnitarepo teN
Asset impairment losses (specific and general provisions) 7,438 -51.1 0.80 0.38
71.090.06.58062,3)ten( esnepxe gninoisivorP
12.067.0-_131,4)ten( slasopsid morf emocnI
39.052.0-_440,81)snoitarepo deunitnocsid gnidulcni( xat erofeb tiforP
17.005.0-_577,31emocni teN
Memorandum item
56.055.0-_335,21ytitne gnillortnoc eht ot elbatubirtta emocnI
Jun-21
BANCO DE ESPAÑA 119 INFORME DE ESTABILIDAD FINANCIERA, XXXXXX 202X PUBLICACIONES DEL BANCO DE ESPAÑA
The Banco de España publishes various types of documents that provide information on its
activity (economic reports, statistical information, research papers, etc.). The full list of Banco
de España publications can be found on its website at http://www.bde.es/f/webbde/Secciones/
Publicaciones/Relacionados/Fic/Catalogopublicaciones.pdf.
Most of these documents are available in pdf format and can be downloaded free of charge from
the Banco de España website, http://www.bde.es/bde/es/secciones/informes/. A request for
others can be made to the following e-mail address: [email protected].
BANCO DE ESPAÑA PUBLICATIONS
The cut-off date of this report: 22 October 2021
Reproduction for educational and non-commercial purposes
is permitted provided that the source is acknowledged.
© Banco de España, Madrid, 2021
ISSN: 1696-3520 (online)
BANCO DE ESPAÑA 120 INFORME DE ESTABILIDAD FINANCIERA, XXXXXX 202X SÍMBOLOS, ABREVIATURAS Y CÓDIGOS ISO DE PAÍSES
AEAT
ATABCBSBISbnbpBRRD II CBQ
CBSOCCRCCyBCET1CNAE
CNMV
CoCoCOVID-19CRDCRRDFRDIEAPSEBAECBEDISEEAEDPEIOPAEMCIEPAERTE
ESGESRB€STRETSEUEURIBOREVFLFLESBFSBFSRGDIGDPGSCG-SIIGVAHICO
IDIGAE
IIPINEIRSLEILGFLSILTPmMMSRMOVEMRELMRONACE
NBERNFCNGEUNGFSNPLOISO-SIIPDPEPPPERPMIppQq-o-qRDLROAROERTRPRTSRWASareb
SGPSISLISMESREPSRISSMTLACTLTROUSMCAy-o-y
Agencia Estatal de Administración Tributaria (State tax revenue service)Average total assetsBasel Committee on Banking SupervisionBank for International SettlementsBillionBasis pointsBank Recovery and Resolution Directive Banco de España Central Balance Sheet Data Office Quarterly SurveyBanco de España Central Balance Sheet Data OfficeBanco de España Central Credit RegisterCountercyclical capital bufferCommon Equity Tier 1Clasificación Nacional de Actividades Económicas (Spanish National Classification of Economic Activities)Comisión Nacional del Mercado de Valores (National Securities Market Commission)Contingent convertible bondCoronavirus disease 2019Capital Requirements DirectiveCapital Requirements RegulationDeposit facility rateDeposit institutionEconomically active population surveyEuropean Banking AuthorityEuropean Central BankEuropean Deposit Insurance SchemeEuropean Economic AreaExcessive Deficit ProtocolEuropean Insurance and Occupational Pensions AuthorityEmerging markets currency indexEncuesta de población activa (Labour Force Survey)Expediente de regulación temporal de empleo (furlough schemes)Environmental, social and governanceEuropean Systemic Risk BoardEuro short-term rateEmissions Trading SchemeEuropean UnionEuro Interbank Offered RateEnterprise ValueForward-lookingForward-looking exercise on Spanish banksFinancial Stability BoardFinancial Stability ReportGross disposable incomeGross domestic productGlobal stablecoinGlobal systemically important institutionGross value addedHalf-yearInstituto Oficial de Crédito (Official Credit Institute)
Data obtained from individual financial statementsIntervención General de la Administración del Estado (National Audit Office)International investment positionInstituto Nacional de Estadística (National Statistics Institute)Interest-rate swapLegal entity identifierLoss given defaultLess significant institutionLoan-to-price ratioMillionMoney Market Statistical ReportingMerrill Lynch Option Volatility EstimateMinimum requirement for own funds and eligible liabilitiesMain refinancing operationStatistical classification of economic activities in the European CommunityNational Bureau of Economic ResearchNon-financial corporationNext Generation EUNetwork for Greening the Financial SystemNon-performing loanOvernight interest swapOther systemically important institutionProbability of defaultPandemic emergency purchase programmePrice-to-earnings ratioPurchasing Managers’ Indexpercentage pointsQuarterQuarter-on-quarterRoyal Decree-LawReturn on assetsReturn on equityRecovery, Transformation and Resilience PlanRegulatory technical standardsRisk-weighted assetSociedad de Gestión de Activos Procedentes de la Reestructuración Bancaria (asset management company for trading assets arising from bank restructuring)Stability and Growth PactSignificant institutionSpecialised lending institutionSmall and medium-sized enterpriseSupervisory review and evaluation processSystemic risk indicatorSingle Supervisory MechanismTotal loss-absorbing capacityTargeted Longer-term refinancing operationUnited States-Mexico-Canada AgreementYear-on-year
SYMBOLS AND ABBREVIATIONS
ISO COUNTRY CODESAT AustriaAU AustraliaBE BelgiumBG BulgariaBR BrazilCA CanadaCH SwitzerlandCL ChileCN ChinaCY CyprusCZ Czech Republic
DE GermanyDK DenmarkEE EstoniaES SpainFI FinlandFR FranciaGB United KingdomGR GreeceHR CroatiaHU Hungary
IE IrelandIT ItalyJP JapanKR South KoreaKY Cayman IslandsLT LithuaniaLU LuxembourgLV LatviaMT MaltaMX Mexico
NL NetherlandsNO NorwayPL PolandPT PortugalRO RomaniaSE SwedenSI SloveniaSK SlovakiaTR TurkeyUS United States
BANCO DE ESPAÑA 120 FINANCIAL STABILITY REPORT, AUTUMN 2021 SYMBOLS, ABBREVIATIONS AND ISO COUNTRY CODES