FINANCIAL STABILITY REPORT 42
82
FINANCIAL STABILITY REPORT 42 Security through stability. NOVEMBER 2021 OESTERREICHISCHE NATIONALBANK EUROSYSTEM
Transcript of FINANCIAL STABILITY REPORT 42

FINANCIAL STABILITYREPORT 42
Security through stability.FIN
AN
CIA
L ST
ABI
LIT
Y R
EPO
RT 4
2 N
OV
EMBE
R 2
021
NOVEMBER 2021
OESTERREICHISCHE NATIONALBANKE U RO S Y S T EM
The OeNB’s semiannual Financial Stability Report provides regular analyses of Austrian and international developments with an impact on financial stability. In addition, it includes studies offering in-depth insights into specific topics related to financial stability.
Publisher and editor Oesterreichische NationalbankOtto-Wagner-Platz 3, 1090 ViennaPO Box 61, 1011 Vienna, [email protected] (+43-1) 40420-6666Fax (+43-1) 40420-046698
Editorial board Birgit Niessner, Vanessa Redak, Martin Schürz, Markus Schwaiger
Coordinators Andreas Greiner, Stefan Michael Kavan, Walter Waschiczek
Editing Dagmar Dichtl, Jennifer Gredler, Ingrid Haussteiner
Layout and typesetting Birgit Jank, Andreas Kulleschitz, Melanie Schuhmacher
Design Information Management and Services Division
Printing and production Oesterreichische Nationalbank, 1090 Vienna
Data protection information www.oenb.at/en/dataprotection
ISSN 2309-7272 (online)
© Oesterreichische Nationalbank, 2021. All rights reserved.
May be reproduced for noncommercial, educational and scientific purposes provided that the source is acknowledged.
Printed in accordance with the Austrian Ecolabel guideline for printed matter.
Please collect used paper for recycling. EU Ecolabel: AT/028/024
REG.NO. AT- 000311

FINANCIAL STABILITY REPORT 42 – NOVEMBER 2021 3
Editorial close: October 21, 2021
Opinions expressed by the authors of studies do not necessarily reflect the official
viewpoint of the Oesterreichische Nationalbank or the Eurosystem.
Content
Call for applications: Klaus Liebscher Economic Research Scholarship 4
Recent developments 7
Policy measures alleviate debt servicing for the nonfinancial corporate sector in Austria 7
Household debt fundamentals show resilience, but housing loans continue to rise strongly 11
Austrian banking sector rebounds from the pandemic’s impact, but risks from real estate financing might warrant action 13
Box 1: Solvency stress test 14
Recommendations by the OeNB 18
Special topics Nontechnical summaries in English 22
Nontechnical summaries in German 24
OeNB climate risk stress test – modeling a carbon price shock for the Austrian banking sector 27
Martin Guth, Jannika Hesse, Csilla Königswieser, Gerald Krenn, Christian Lipp, Benjamin Neudorfer, Martin Schneider, Philipp Weiss
Identifying banks with significant negative effects on financial stability in systemic shock scenarios 47
Judith Eidenberger, Katharina Steiner
Nonbank financial intermediation in Austria – an update 57
Alexandra Schober-Rhomberg, Alexander Trachta, Matthias Wicho
Annex: Key financial indicators 71
4 OESTERREICHISCHE NATIONALBANK
Call for applications: Klaus Liebscher Economic Research Scholarship
Please e-mail applications to [email protected] by the end of October 2022. Applicants will be notified of the jury’s decision by end-November 2022.
The Oesterreichische Nationalbank (OeNB) invites applications for the “Klaus Liebscher Economic Research Scholarship.” This scholarship program gives out-standing researchers the opportunity to contribute their expertise to the research activities of the OeNB’s Economic Analysis and Research Department. This contri-bution will take the form of remunerated consultancy services.
The scholarship program targets Austrian and international experts with a proven research record in economics and finance, and postdoctoral research expe-rience. Applicants need to be in active employment and should be interested in broadening their research experience and expanding their personal research networks. Given the OeNB’s strategic research focus on Central, Eastern and Southeastern Europe, the analysis of economic developments in this region will be a key field of research in this context.
The OeNB offers a stimulating and professional research environment in close proximity to the policymaking process. The selected scholarship recipients will be expected to collaborate with the OeNB’s research staff on a prespecified topic and are invited to participate actively in the department’s internal seminars and other research activities. Their research output may be published in one of the depart-ment’s publication outlets or as an OeNB Working Paper. As a rule, the consul-tancy services under the scholarship will be provided over a period of two to three months. As far as possible, an adequate accommodation for the stay in Vienna will be provided.1
Applicants must provide the following documents and information:• a letter of motivation, including an indication of the time period envisaged for
the consultancy• a detailed consultancy proposal• a description of current research topics and activities• an academic curriculum vitae• an up-to-date list of publications (or an extract therefrom)• the names of two references that the OeNB may contact to obtain further infor-
mation about the applicant• evidence of basic income during the term of the scholarship (employment contract
with the applicant’s home institution)• written confirmation by the home institution that the provision of consultancy
services by the applicant is not in violation of the applicant’s employment contract with the home institution
1 We are also exploring alternative formats to continue research cooperation under the scholarship program for as long as we cannot resume visits due to the pandemic situation.

Financial stability means that the financial system – financial intermediaries, financial markets and financial infrastructures – is capable of ensuring the efficient allocation of financial resources and fulfilling its key macroeconomic functions even if financial imbalances and shocks occur. Under conditions of financial stability, economic agents have confidence in the banking system and have ready access to financial services, such as payments, lending, deposits and hedging.


FINANCIAL STABILITY REPORT 42 – NOVEMBER 2021 7
Recent developmentsPolicy measures alleviate debt servicing for the nonfinancial corporate sector in Austria
The Austrian economy has recovered in 2021 to date. In the second quarter of 2021, real GDP rose by 3.6% quarter on quarter. The lifting of COVID-19- related restrictions led to a significant increase in services while industrial activity and construction slowed somewhat. Gross fixed capital formation expanded strongly in the first quarter of 2021, which reflected not only pent-up demand following the setback in 2020 but also the need for increasing production capacity. In the second quarter, the expansion lost some momentum, however, even if real growth remained positive.
External financing volumes of Austrian nonfinancial corporations dropped strongly in the first half of 2021. At EUR 11.5 billion, total external financing was one-third less than in the same period of 2020, according to prelim-inary financial accounts data, notwithstanding a recovery in corporate investment activity and favorable financing conditions. Both equity and debt financing decreased in the first half of 2021 year on year. At EUR 0.9 billion, equity financing – which had already been rather subdued in the years before the onset of the pandemic – amounted to half the value recorded in 2020, and debt financing declined by almost one-third to EUR 10.6 billion.
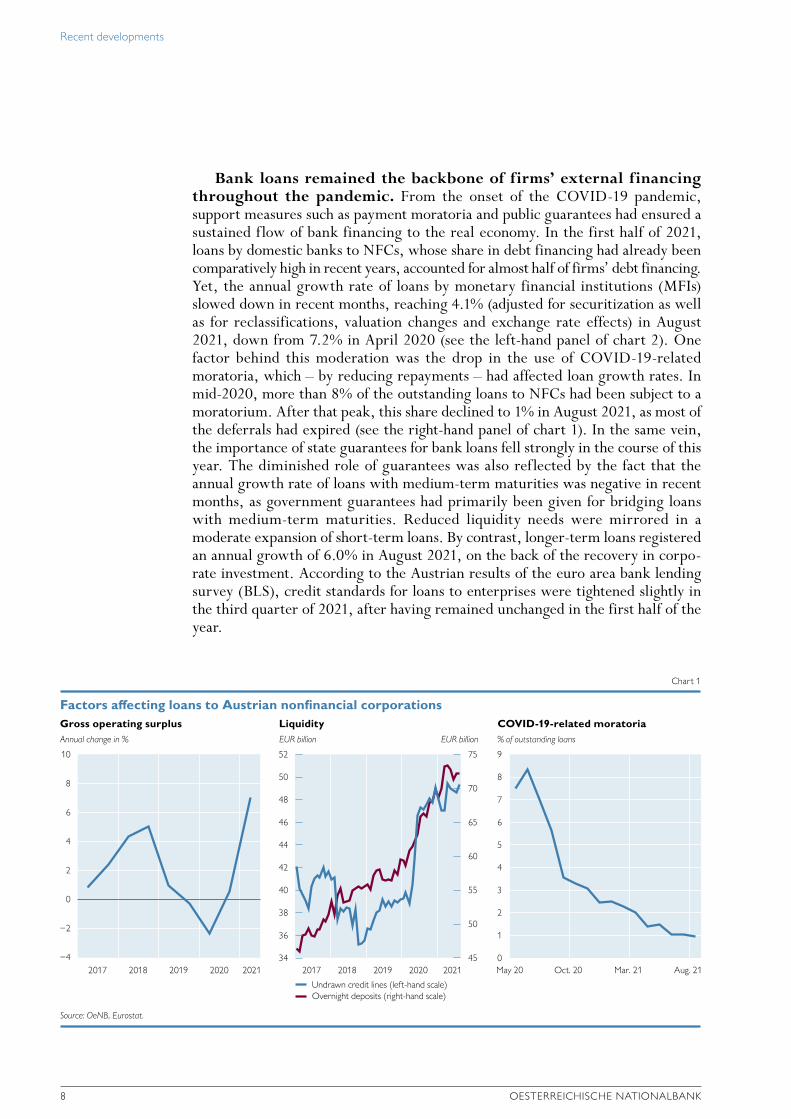
Internal financing has increased since the onset of COVID-19, which has reduced the need for external financing. The gross operating surplus1 of Austrian nonfinancial corporations (NFCs) was 7% higher in the first half of 2021 than one year earlier (and exceeded the respective 2019 value by 5%; see the left-hand panel of chart 1). While compensation of employees had shrunk, the increase was mainly due to a marked rise in subsidies2 that NFCs received as a result of COVID-19-related support measures. Moreover, firms had considerably lowered profit distributions to their owners or shareholders (including reinvested profits by foreign multinational corporations in their Austrian subsidiaries).3 For one thing, uncertainties about the current economic environment might have induced firms to safeguard their liquidity. More importantly, businesses having received a fixed cost grant had to comply with the prohibition of distributing profits and dividends. As a result, Austrian NFCs’ gross internal financing rose markedly year on year, even though the analogous 2020 value had been substantial already.
Moreover, the sizable liquidity buffers built up in the first phase of the pandemic reduced financing needs. NFCs’ overnight deposits continued to rise (by 8.8% in August 2021), although they had been increasingly subject to negative interest rates. The increase is to a large extent ascribable to funds raised after the onset of COVID-19 but not yet spent. Additionally, firms disposed of high undrawn credit lines, having made only partial use of new credit lines provided by banks (see the middle panel of chart 1).
1 Including mixed income (self-employed and other unincorporated businesses).2 “Other subsidies on production” in the sector accounts.3 However, as the distributed income of corporations is derived as a residual and the reinvested earnings on foreign
direct investment reflect an imputation in the national accounts, these figures are surrounded by a certain degree of uncertainty.
Recent developments
8 OESTERREICHISCHE NATIONALBANK
Bank loans remained the backbone of firms’ external financing throughout the pandemic. From the onset of the COVID-19 pandemic, support measures such as payment moratoria and public guarantees had ensured a sustained flow of bank financing to the real economy. In the first half of 2021, loans by domestic banks to NFCs, whose share in debt financing had already been comparatively high in recent years, accounted for almost half of firms’ debt financing. Yet, the annual growth rate of loans by monetary financial institutions (MFIs) slowed down in recent months, reaching 4.1% (adjusted for securitization as well as for reclassifications, valuation changes and exchange rate effects) in August 2021, down from 7.2% in April 2020 (see the left-hand panel of chart 2). One factor behind this moderation was the drop in the use of COVID-19-related moratoria, which – by reducing repayments – had affected loan growth rates. In mid-2020, more than 8% of the outstanding loans to NFCs had been subject to a moratorium. After that peak, this share declined to 1% in August 2021, as most of the deferrals had expired (see the right-hand panel of chart 1). In the same vein, the importance of state guarantees for bank loans fell strongly in the course of this year. The diminished role of guarantees was also reflected by the fact that the annual growth rate of loans with medium-term maturities was negative in recent months, as government guarantees had primarily been given for bridging loans with medium-term maturities. Reduced liquidity needs were mirrored in a moderate expansion of short-term loans. By contrast, longer-term loans registered an annual growth of 6.0% in August 2021, on the back of the recovery in corpo-rate investment. According to the Austrian results of the euro area bank lending survey (BLS), credit standards for loans to enterprises were tightened slightly in the third quarter of 2021, after having remained unchanged in the first half of the year.
Annual change in % EUR billion EUR billion % of outstanding loans
Gross operating surplus Liquidity COVID-19-related moratoria
10
8
6
4
2
0
−2
−4
52
50
48
46
44
42
40
38
36
34
9
8
7
6
5
4
3
2
1
0
75
70
65
60
55
50
45
Factors affecting loans to Austrian nonfinancial corporations
Chart 1
Source: OeNB, Eurostat.
Undrawn credit lines (left-hand scale)Overnight deposits (right-hand scale)
2017 2018 2019 2020 2021 2017 2018 2019 2020 2021 May 20 Oct. 20 Mar. 21 Aug. 21

Recent developments
FINANCIAL STABILITY REPORT 42 – NOVEMBER 2021 9
Credit conditions have tightened somewhat since the outbreak of the pandemic. Between February 2020, the last month before COVID-19, and August 2021, interest rates on new loans to NFCs increased on average by 17 basis points, the easing monetary policy stance notwithstanding, but remained low from a historical perspective. This increase probably reflected higher risk premia that were due to the economic impact of the pandemic. Banks participating in the BLS stated that, over the course of the pandemic, interest margins on riskier loans to firms widened much more strongly than margins on loans with average risk (which had also been the case in the years before the pandemic). However, there was large heterogeneity across different loan sizes. While interest rates on larger loans (with a volume of more than EUR 1 million) rose, rates on smaller-scale loans were still below their pre-pandemic value. Guaranteed loans – for which risk considerations are less of a concern – typically fell into this size bracket. Yet, with the role of guarantees in loans diminishing, the interest rate on smaller-size loans rebounded.
Corporate bond issuance has grown at a much slower pace so far than in the year before. According to securities statistics data, Austrian NFCs raised EUR 0.4 billion in net terms via debt securities in the first eight months of 2021, 7% of the value registered in the same period of 2020. However, this form of finance is mostly used by a comparatively small number of large firms.
The debt sustainability of Austrian companies improved somewhat in the first half of 2021. After having risen by more than 13 percentage points in 2020, the corporate sector’s debt-to-income (DTI) ratio decreased by 4 percentage points to 327%, as rising corporate debt was offset by improved gross operating surplus (see chart 3). Yet, this improvement in gross operating surplus was not only due to the rebound in economic activity but to a large extent also to public support measures. Even if gross debt levels are currently manageable, their elevated
Annual change in %
Loans to nonfinancial corporations Loans to households
12
10
8
6
4
2
0
−2
−4
−6
−8
Annual change in %
12
10
8
6
4
2
0
−2
−4
−6
−8
MFI loans to Austrian nonfinancial corporations and households
Chart 2
Source: OeNB.
Total Long-term loans (over 5 years) Total Housing loansConsumer loans Other loans
2008 2010 2012 2014 2016 2018 2020 2008 2010 2012 2014 2016 2018 2020

Recent developments
10 OESTERREICHISCHE NATIONALBANK
level suggests a high sensitivity among NFCs to adverse shocks, in particular of highly indebted firms. At the same time, raising external equity has proven difficult in the current situation. Thus, it will be crucial for economic policy to address impediments in the buildup of equity of Austrian enterprises in general and SMEs in particular.
A number of factors alleviate firms’ debt servicing. For one thing, gross indebtedness went hand in hand with a large buildup of liquid assets (cash and bank deposits). In the aggregate, the balance of corporate debt and liquid assets decreased slightly in the first half of 2021. If these liquid assets are held by indebted firms, this may be a mitigating factor. Furthermore, NFCs’ debt servicing costs remained low in the first half of 2021, reflecting the still low interest rate level. In the second quarter of 2021, the ratio of interest payment obligations for (domestic) bank loans to gross operating surplus remained stable at 2.8%. Moreover, a large share of the debt incurred during the pandemic was longer-term debt, reducing refinancing risks, and was taken up in the form of guaranteed loans. The share of variable rate loans, which had decreased considerably in the years before the pandemic, increased by 1.0 percentage point year on year, to 78.6% in the second quarter of 2021.
Insolvency numbers remained significantly below pre-pandemic levels. In the third quarter of 2021, the number of insolvencies was almost one-quarter higher than in the corresponding period of 2020, but still nearly 40% below the value recorded in 2019, according to data provided by creditor protec-tion agency KSV 1870. However, the lower numbers did not reflect underlying economic developments, but were attributable to large-scale government aid and mitigating measures. While these relief measures have helped avoid widespread bankruptcies so far, measures such as moratoria and short-term payment deferrals have shifted insolvency risks partially into the future.
% of gross operating surplus
Debt-to-income (DTI) ratio
450
400
350
300
250
200
Cumulative change since Q4 19 in percentage points
Change of consolidated DTI ratio
25
20
15
10
5
0
−5
−10
Consolidated debt of Austrian nonfinancial corporations
Chart 3
Source: OeNB, Statistics Austria, ECB, Eurostat.
Debt Debt minus liquid assetsDebt (euro area) Due to change in gross operating surplus
Due to change in debt
Change
2007 2009 2011 2013 2015 2017 2019 2021 Q1 20 Q3 20 Q1 21
Note: Consolidated gross debt: sum of total loans granted to and debt securities issued by nonfinancial corporations net of intrasectoral lending. Liquid assets: currency and deposits. Data for 2021 are preliminary.

Recent developments
FINANCIAL STABILITY REPORT 42 – NOVEMBER 2021 11
Household debt fundamentals show resilience, but housing loans continue to rise strongly
In the household sector, growth of nominal disposable household income recovered in the first half of 2021 year on year. As in 2020, house-hold income was supported by government transfers. Moreover, compensation of employees recovered. At the same time, the rise in inflation dampened real disposable household income. As private consumption rebounded in the second quarter of 2021 upon the lifting of lockdown restrictions, the saving rate declined but remained high in historical perspective.
Financial investment flows of households fell in the first half of 2021, which reflected the declining saving rate. In the first half of 2021, households’ financial investment flows amounted to EUR 9.1 billion, which fell 33% short of the value registered in the first half of 2020. While a large share of financial investments continued to be allocated into liquid assets, the latter’s role diminished somewhat, with liquid assets contributing less than half (46%) to total financial investment flows. In the first two quarters of this year, households’ cash holdings increased by EUR 0.3 billion and bank deposits by EUR 4.2 billion.
Households’ capital market investment has risen strongly since the second quarter of 2020, which suggests a search for yield in the face of negative real returns for low-risk assets. In the first half of 2021, house-holds’ net financial investments in capital market instruments amounted to EUR 3.4 billion, or more than one-third of total financial investments. Invest-ments in mutual funds registered particularly strong growth. At EUR 4.3 billion, net financial investments in mutual fund shares equaled investment in bank deposits in the first six months of this year. Moreover, households continued to invest in listed shares but reduced their direct holdings of debt securities. From the second quarter of 2021 onward, households’ capital market investment holdings registered sizable (unrealized) valuation gains, totaling more than EUR 25 billion. This figure corresponds to 24% of the amount outstanding at the end of the first quarter of 2020. The recent valuation gains offset the massive (likewise unrealized) valuation losses registered in the first quarter of 2020.
Growth of lending to households accelerated over the course of this year. In the twelve months up to August 2021, the annual growth rate of bank loans to households rose from 4.1% to 4.7% year on year (adjusted for reclassifica-tions, valuation changes and exchange rate effects; see the right-hand panel of chart 2). As in past years, the main contribution to loan growth came from housing loans, not only because they are the largest loan category for households – accounting for more than two-thirds of the outstanding volume of loans to house-holds – but also because they registered the highest growth rate, which reached 6.8% year on year in August 2021. According to the BLS, Austrian banks slightly eased the credit standards for housing loans in the third quarter of 2021. At the same time, banks reported a further slight increase in the demand for housing loans (as in the first half of 2021). In line with the decrease in the consumption of durables and the fall in consumer confidence after the onset of the pandemic, consumer loans were down 2.5% year on year in August 2021. Other loans, which include loans to sole proprietors and unincorporated enterprises, rose by 1.0%.
The conditions for housing loans remained favorable. In August 2021, interest rates on new bank loans stood at 1.78%, down 3 basis points against
Recent developments
12 OESTERREICHISCHE NATIONALBANK
February 2020, despite the rising trend seen in this year so far. Interest rates on housing loans fell by 20 basis points since February 2020, while those on consumer loans rose by 71 basis points. BLS results show that, due to risk considerations, banks’ margins for riskier housing loans were tightened more often since the onset of COVID-19 than those for loans with an average risk profile.
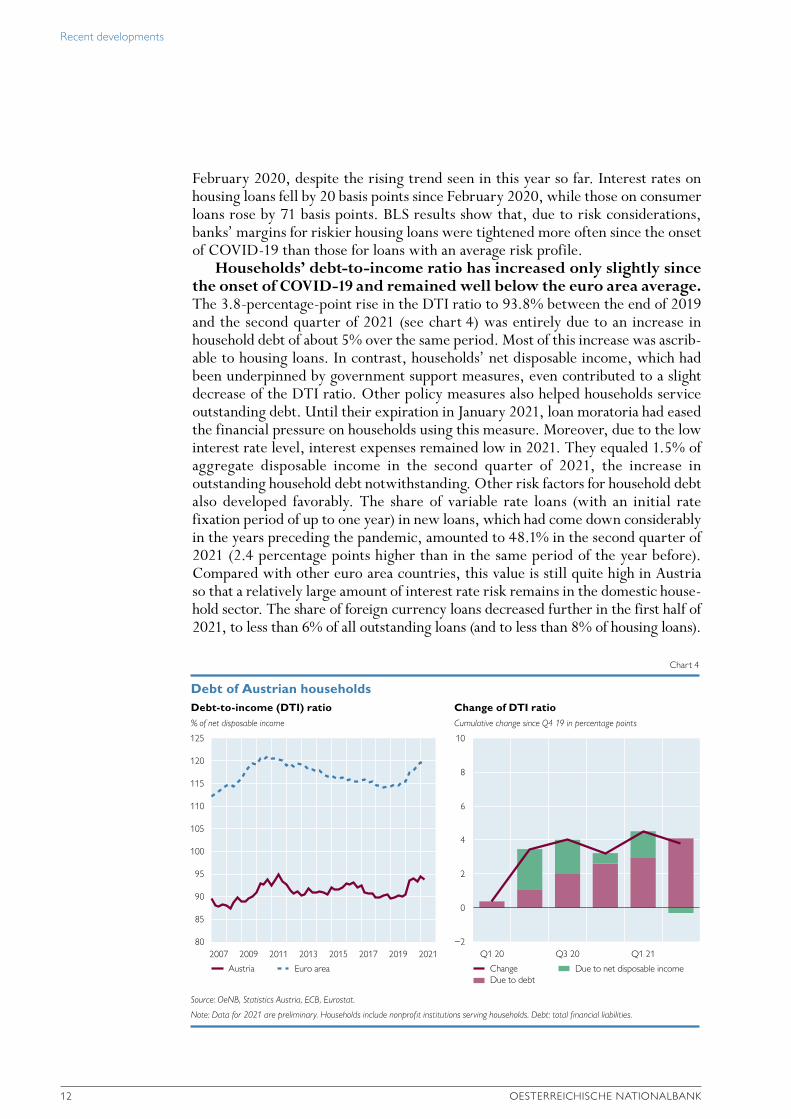
Households’ debt-to-income ratio has increased only slightly since the onset of COVID-19 and remained well below the euro area average. The 3.8-percentage-point rise in the DTI ratio to 93.8% between the end of 2019 and the second quarter of 2021 (see chart 4) was entirely due to an increase in household debt of about 5% over the same period. Most of this increase was ascrib-able to housing loans. In contrast, households’ net disposable income, which had been underpinned by government support measures, even contributed to a slight decrease of the DTI ratio. Other policy measures also helped households service outstanding debt. Until their expiration in January 2021, loan moratoria had eased the financial pressure on households using this measure. Moreover, due to the low interest rate level, interest expenses remained low in 2021. They equaled 1.5% of aggregate disposable income in the second quarter of 2021, the increase in outstanding household debt notwithstanding. Other risk factors for household debt also developed favorably. The share of variable rate loans (with an initial rate fixation period of up to one year) in new loans, which had come down considerably in the years preceding the pandemic, amounted to 48.1% in the second quarter of 2021 (2.4 percentage points higher than in the same period of the year before). Compared with other euro area countries, this value is still quite high in Austria so that a relatively large amount of interest rate risk remains in the domestic house-hold sector. The share of foreign currency loans decreased further in the first half of 2021, to less than 6% of all outstanding loans (and to less than 8% of housing loans).
% of net disposable income
Debt-to-income (DTI) ratioCumulative change since Q4 19 in percentage points
Change of DTI ratio
125
120
115
110
105
100
95
90
85
80
10
8
6
4
2
0
−2
Debt of Austrian households
Chart 4
Source: OeNB, Statistics Austria, ECB, Eurostat.
Note: Data for 2021 are preliminary. Households include nonprofit institutions serving households. Debt: total financial liabilities.
Austria Euro areaDue to debtChange Due to net disposable income
2007 2009 2011 2013 2015 2017 2019 2021 Q1 20 Q3 20 Q1 21

Recent developments
FINANCIAL STABILITY REPORT 42 – NOVEMBER 2021 13
Residential property prices in Austria rose further in the course of 2021. In the third quarter of 2021, they increased by 10.4% year on year. In light of this marked price growth, the OeNB fundamentals indicator for residential property prices in Austria went up significantly, reaching 22.8% for Austria overall (and 31.0% for Vienna). In other words, residential real estate prices are increasingly deviating from the levels suggested by the factors tracked by the indicator, which warrants closer attention.4
Austrian banking sector rebounds from the pandemic’s impact, but risks from real estate financing might warrant action
In the first half of 2021, Austrian banks’ net profits quadrupled compared to the same period of 2020, as operating profits expanded and provisioning declined. Over the course of the first six months of the year, Austrian banks made a profit of EUR 3.7 billion. This was not only equivalent to a fourfold increase against the pandemic-burdened first half of 2020, but also the highest profit ever recorded by Austrian banks in a year’s first half. Operating profit grew by half, as favorable market conditions improved fee and commission income as well as dividend income. Net interest income stagnated despite strong growth especially in mortgage lending, with the prolongation of the low interest rate environment putting further pressure on banks’ interest margins. Widely used remote work and subdued business travel continued to have positive effects on administrative costs, which were down nearly 3%. At the same time, loan loss provisioning decreased by three-quarters to pre-pandemic levels, as fears of wide-spread credit defaults had not (yet) materialized.
The quality of Austrian banks’ loan portfolio continued to improve in the first half of 2021 due to the strong inflow of new loans and the stagnation of nonperforming loans (NPLs). Driven by a pronounced economic recovery and brisk demand for home ownership, loan growth continued to be strong in the first half of 2021, leading to a constant inflow of new loans into Austrian banks’ loan portfolio. Together with a stagnating NPL volume, this resulted in a further reduction of the consolidated NPL ratio to 1.9% at the end of June 2021. The improvement was particularly apparent in loans to small and medium-sized enterprises (SMEs) and in commercial real estate loans.
Public support measures reduced credit defaults, but indicators show that banks’ outlook remained cautious. Unprecedented monetary policy measures and fiscal aid – such as central banks’ asset purchase programs, government guarantees or short-time work – helped reduce insolvencies and limit unemployment. Consequently, banks have not faced broad-based defaults in the pandemic so far. But they have nevertheless started to provide for a deterioration in loan quality as support measures are being phased out: despite brisk lending, the coverage ratio remained at 49% and the share of IFRS stage 2 loans continued to be well above the pre-pandemic level.
4 For more information on the property market in Austria, see the publication “Austrian Property Market Review” at https://www.oenb.at/en/Publications/Economics/property-market-review.html.

Recent developments
14 OESTERREICHISCHE NATIONALBANK
Amid strong loan growth, Austrian banks have kept their capital-ization constant. Their common equity tier 1 (CET1) capital ratio remained at 16.1% in mid-2021. Supervisory recommendations for carefully considering profit distributions helped bolster banks’ risk absorbing capacity. However, although banks increased their capital by more than 6%, continued strong loan growth in both Austria and Central, Eastern and Southeastern Europe (CESEE) drove up risk-weighted assets, which resulted in stable capital ratios.
Box 1
Solvency stress test
BackgroundThe OeNB conducts annual stress tests for all Austrian banks under its dual mandate for banking supervision and financial stability. The solvency stress test is designed to assess banks’ resilience to adverse macroeconomic shocks and is meant to provide insights on both a bank and a system-wide level. Conducted in a top-down fashion, it relies on the OeNB’s well-established stress testing framework ARNIE, which is continuously improved. Stress testing covers both signif icant and less signif icant institutions at the highest consolidated level. It focuses on risks relevant for the Austrian banking sector, including spillover effects among banks, which are particularly important for the cooperative sector. The most recent stress test provides an assessment of risks as at year-end 2020 and covers the period from 2021 to 2023.
ScenarioTo be consistent with the recent EBA/ECB exercise, the OeNB employed the same baseline and adverse scenarios for its calculations. The Austrian economy contracted by 7.6% in 2020, which is why the baseline scenario foresees a strong recovery with cumulative GDP growth of 9.5% over the stress test horizon (2021–23). The adverse scenario, in which we assume a prolongation of the COVID-19 pandemic, projects a cumulative decline of 2.9%,
%
Return on assets%
CET1 ratio
0.9
0.8
0.7
0.6
0.5
0.4
0.3
0.2
0.1
0
17
16
15
14
13
12
11
10
Profitability and capitalization of banks
Chart 5
Source: OeNB, ECB, EBA (for data as at H1 21).
Austria EU average
2016 2017 2018 2019 2020 H1 21 2016 2017 2018 2019 2020 H1 21

Recent developments
FINANCIAL STABILITY REPORT 42 – NOVEMBER 2021 15
coupled with a general loss of confidence. This leads to a prolonged “lower for longer” interest rate environment, where long-term risk-free rates decline even further from an already historically low level. Real estate prices are projected to drop sharply by 24% for both commercial and residential real estate. Exchange rates for the US dollar, Swiss franc and pound sterling will remain stable but the currencies of most CESEE countries will depreciate against the euro.5
Results and risk driversWhile the aggregate CET1 ratio increases by 2.1 percentage points in the baseline scenario, it declines by 5.1 percentage points in the adverse scenario, landing at 11% at year-end 2023. Despite the harsh economic environment, Austrian banks improved their aggregate CET1 ratios from 15.6% to 16.1% in 2020, partly also as a result of relatively generous fiscal and regulatory support measures. The following waterfall charts depict the most important risk drivers and their contribution to capital depletion for both the baseline and the adverse scenario. An interactive presentation of the results is available on the OeNB’s website.6
Credit risk remains the main risk driver and draws down capital by 4.9 per-centage points in the adverse scenario (baseline: –0.7 percentage points). Gains and losses from equity participations in nonfinancial corporations and especially other banks are significant as well. While in the baseline scenario banks participate in the profits of entities they are invested in and build up capital (+1.6 percentage points), the picture reverses in the adverse scenario. Reduced dividend income and the revaluation of equity stakes result in a depletion of capital (–0.8 percentage points). Finally, net interest income shrinks from 9.1 per-centage points in the baseline to 7.5 percentage points in the adverse scenario mainly as a result of both higher funding costs and reduced income generation capacity following increases in nonperforming exposures.
5 For more information on the scenario, see https://www.eba.europa.eu/eba-launches-2021-eu-wide-stress-test-exercise.6 https://www.oenb.at/en/financial-market/banking-supervision/stress-tests.html.
% %
Baseline CET1 ratio of the Austrian banking system
Adverse CET1 ratio of the Austrian banking system
35
30
25
20
15
10
5
0
35
30
25
20
15
10
5
0
Austrian stess test – results and risk drivers
Chart B1
Source: OeNB.
16.1
9.1
4.5 –9.3
–0.7 –0.01.6 –3.1
18.2
CET
1 ra
tio (
2020
)
Net
inte
rest
inco
me
Oth
er in
com
e
Adm
inist
rativ
e ex
pens
es
Cre
dit r
isk
Fore
ign
curr
ency
loan
s
Part
icip
atio
ns
Oth
er
CET
1 ra
tio (
2023
)
16.1
7.5
4.4 –9.3
–4.9
–0.9 –0.8 –1.1 11.0
CET
1 ra
tio (
2020
)
Net
inte
rest
inco
me
Oth
er in
com
e
Adm
inist
rativ
e ex
pens
es
Cre
dit r
isk
Fore
ign
curr
ency
loan
s
Part
icip
atio
ns
Oth
er
CET
1 ra
tio (
2023
)

Recent developments
16 OESTERREICHISCHE NATIONALBANK
ConclusionsOverall, the stress test results indicate that the Austrian banking system is well placed to withstand substantial macroeconomic shocks. Compared to last year’s stress test, capital depletion is slightly more pronounced, driven by the combination of a weaker starting point of the economy due to the pandemic and a comparably more severe scenario. Nonetheless, capital ratios would not fall to concerning levels in the adverse scenario and remain well above those observed in 2007/2008, i.e. before the great f inancial crisis. The pandemic has demonstrated the important role that a well-capitalized banking sector plays in supporting lending to the real economy and in withstanding losses. In light of signif icant uncertainty and very low default rates, banks are advised to take advantage of positive economic developments to strengthen their resilience and to also exercise prudence with capital distributions.
While the COVID-19 pandemic had a significant negative impact on Austrian banks’ profitability, it did not dent balance sheet growth. The latter was largely due to the Eurosystem’s targeted longer-term refinancing operations (TLTROs). Ongoing strong lending together with surging cash and central bank deposits drove up total assets to EUR 1,169 billion (as of mid-2021). Since the start of the COVID-19 pandemic, Austrian banks have increasingly funded their balance sheets by having recourse to the Eurosystem’s TLTROs. By mid-2021, more than 8% of their aggregated (unconsolidated) balance sheet had been funded via these operations, up from 2% at end-2019. At the peak of the global financial crisis, that percentage stood at 4%. The current increase was driven by favorable terms, which provided a nonnegligible boost to banks’ profitability.
Market confidence in the Austrian banking system has remained high over the course of the pandemic. Austria’s Banking Industry Country Risk Assessment Rating issued by Standard & Poor’s continued to be among the strongest in the world. When TLTROs will eventually have to be substituted, this – together with Austrian banks’ strong liquidity position – should allow for issu-ances at competitive funding costs.
While the relative importance of nonbank finance increased some-what over the past decade, no structural shift became evident in the Austrian financial system over the last years. Financing in Austria is still dominated by banks, and market-based finance continues to play a smaller role, accounting for less than one-quarter of the financial system’s assets. Overall, the relatively small growth registered by nonbank financial intermediaries in Austria is not seen as a matter of concern, as neither their structure nor their size is currently considered to pose a threat to financial stability. Nevertheless, supervisors monitor closely whether nonbank financial intermediaries are likely to be affected by investors’ herding behavior, to what extent they can withstand losses and how their use of leverage is developing.7
Austrian banking subsidiaries’ profits in CESEE came to EUR 1.4 billion in the first half of 2021, while total assets amounted to EUR 258 billion. Czechia is by far the most important CESEE host market for Austrian
7 For more information see Schober-Rhomberg, A., A. Trachta and M. Wicho. 2021. Nonbank financial intermediation in Austria – an update. In: Financial Stability Report 42. OeNB.

Recent developments
FINANCIAL STABILITY REPORT 42 – NOVEMBER 2021 17
banking subsidiaries, accounting for more than one-third of total assets and close to one-quarter of profits. Measured by total assets, Slovakia and Romania complete the top three, with Hungary, Croatia and Russia close behind. The profit ranking for the first half of 2021 features the same countries, but highlights diverging profit-ability: behind Czechia, Russia takes the second and Romania the third place, followed by Slovakia, Hungary and Croatia. In total, Austrian banks’ CESEE exposure is geographically well diversified, and more than four-fifths of total assets as well as more than two-thirds of profits relate to subsidiaries in the EU.
In the first half of 2021, Austrian banking subsidiaries in CESEE earned 56% more than during the same period of 2020, driven by much lower credit risk provisioning. Despite a slight reduction of net interest income and a negative contribution from trading losses, operating income rose by a slight 3%, as fees and commissions surged and other sources of income rebounded. With staff costs remaining flat but administrative costs rising noticeably, operating costs went up by 3%. As a result, operating profit increased by 4%. The largest contribution to the recovery in subsidiaries’ first-half profit to EUR 1.4 billion came from much lower credit risk provisioning (–79% compared to the first half of 2020). While the subsidiaries were thus still provisioning for risks, the impact relative to operating profits returned to historically low pre-COVID-19 levels (see chart 6). This can be interpreted as a confirmation of banks’ active provisioning in 2020, but given persistent uncertainties (e.g. related to low vaccination levels in several countries) and ongoing public support measures in the region, banks are well advised to exercise caution and ensure an adequate level of loan loss provisions.
The ratio of NPLs at Austrian banking subsidiaries in CESEE reached a new low of 2.2% in mid-2021, while capitalization remained solid. The low NPL ratio for total loans in the region masks several heterogeneities. Depending on the loan segment, the NPL ratio ranges from 1.9% for residential real estate
EUR billion %
8
7
6
5
4
3
2
1
0
80
70
60
50
40
30
20
10
0
Profitability of Austrian banking subsidiaries in CESEE
Chart 6
Source: OeNB. 1 From 2016 onward, excluding subsidiaries of UniCredit Bank Austria.
Operating profit ProfitCost-income ratio (right-hand scale) Risk provisioning to operating profit (right-hand scale)
2009 2010 2011 2012 2013 2014 2015 20161 2017 2018 2019 2020 H1 21
Recent developments
18 OESTERREICHISCHE NATIONALBANK
secured loans to 3.7% for corporate loans and 5.9% for consumer loans. In a country comparison, the lowest ratio was recorded in Czechia (1.3%), while it was, for instance, elevated in Croatia (4.7%). The aggregate coverage ratio ran to 64%. In mid-2021, the aggregate CET1 ratio of Austrian banking subsidiaries in CESEE stood at 18% and the loan-to-deposit ratio at 72%. The solid capital and funding levels bear testament to past efforts by banks and their supervisors to make banking systems more resilient, which serves financial stability well during the ongoing pandemic.
Systemic risks arising from real estate financing might warrant further action in Austria. Lending to households for house purchases continued to grow briskly in 2021, and house prices rose sharply. These developments were fueled by very low interest rates and strong competition among lenders. As a result, lenders saw their margins drop further and they were willing to tolerate more risk in the form of elevated loan-to-value and debt service-to-income ratios. Data for the first half of 2021 show that a considerable share of new lending still failed to comply with the recommendation issued by the Austrian Financial Market Stability Board (FMSB) in 20188. In addition, variable rate loans still account for close to 40% of new lending, exposing households to considerable interest rate risk. Therefore, the FMSB has asked the OeNB to perform a comprehensive analysis of systemic risks arising from real estate financing, based on which the FMSB will decide on the need for further action.
The credit-to-GDP gap widened, yet primarily because of a negative business cycle, as annual GDP plummeted by 5.5% from the first quarter of 2020 to the first quarter of 2021. For the time being, the FMSB recommends applying a countercyclical capital buffer (CCyB) of 0%, but emphasizes that credit growth (relative to GDP growth) is high and appears to be less and less aligned with economic growth. Moreover, additional indicators signal substantial financial market mispricing, increased risk taking by banks and a significant overvaluation of property prices. In particular, the risk weights of mortgage-backed and corporate loans are at historically low levels. Thanks to public support measures, insolvencies have decreased markedly compared to pre-pandemic levels, but their number may still increase as measures expire. A prolonged decoupling of rising risks and reduced risk awareness may threaten systemic stability over the medium term. As the economy recovers, any future decision on whether a higher CCyB requirement should be recommended will thus depend on whether the relevant indicators point to a sustained improvement.
Recommendations by the OeNB The COVID-19 pandemic and its repercussions have overshadowed almost every-thing else for much of the last two years. To date, Austrian banks have weathered this difficult situation well thanks to the buildup of macroprudential capital buffers, temporary restrictions on dividend payments as well as public support measures provided for companies and households. Importantly, banks were able to continu-ously support the economy. Even though the recovery in 2021 provides grounds for cautious optimism, many uncertainties persist regarding the situation of both public
8 For further information, please refer to www.fmsg.at/en/publications/press-releases/2018/17th-meeting.html.

Recent developments
FINANCIAL STABILITY REPORT 42 – NOVEMBER 2021 19
health and the economy. The OeNB therefore recommends that banks take the following measures:• Focus on a solid capital base by exercising restraint with regard to profit
distributions.• Apply sustainable lending standards, particularly in real estate lending, both in
Austria and in CESEE, and comply with the quantitative guidance issued by the Austrian Financial Market Stability Board.
• Ensure an adequate level of loan loss provisions, especially after the expiration of COVID-19-related support measures.
• Continue efforts to improve cost efficiency and operational profitability.• Further develop and implement strategies to deal with the challenges of
digitalization and climate change.9
9 Please refer to Guth, M., J. Hesse, C. Königswieser, G. Krenn, C. Lipp, B. Neudorfer, M. Schneider, P. Weiss. 2021. OeNB climate risk stress test – modeling a carbon price shock for the Austrian banking sector. In: Financial Stability Report 42. OeNB.


Special topics
22 OESTERREICHISCHE NATIONALBANK
Nontechnical summaries in English
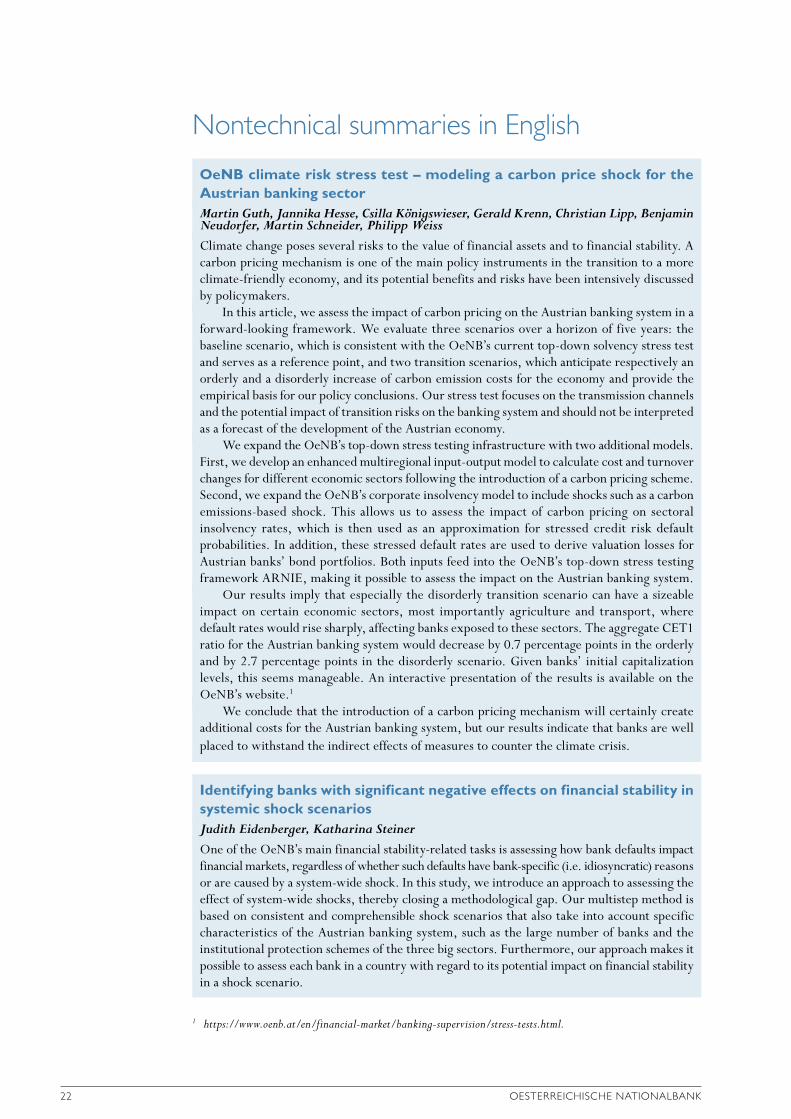
OeNB climate risk stress test – modeling a carbon price shock for the Austrian banking sectorMartin Guth, Jannika Hesse, Csilla Königswieser, Gerald Krenn, Christian Lipp, Benjamin Neudorfer, Martin Schneider, Philipp Weiss Climate change poses several risks to the value of financial assets and to financial stability. A carbon pricing mechanism is one of the main policy instruments in the transition to a more climate-friendly economy, and its potential benefits and risks have been intensively discussed by policymakers.
In this article, we assess the impact of carbon pricing on the Austrian banking system in a forward-looking framework. We evaluate three scenarios over a horizon of five years: the baseline scenario, which is consistent with the OeNB’s current top-down solvency stress test and serves as a reference point, and two transition scenarios, which anticipate respectively an orderly and a disorderly increase of carbon emission costs for the economy and provide the empirical basis for our policy conclusions. Our stress test focuses on the transmission channels and the potential impact of transition risks on the banking system and should not be interpreted as a forecast of the development of the Austrian economy.
We expand the OeNB’s top-down stress testing infrastructure with two additional models. First, we develop an enhanced multiregional input-output model to calculate cost and turnover changes for different economic sectors following the introduction of a carbon pricing scheme. Second, we expand the OeNB’s corporate insolvency model to include shocks such as a carbon emissions-based shock. This allows us to assess the impact of carbon pricing on sectoral insolvency rates, which is then used as an approximation for stressed credit risk default probabilities. In addition, these stressed default rates are used to derive valuation losses for Austrian banks’ bond portfolios. Both inputs feed into the OeNB’s top-down stress testing framework ARNIE, making it possible to assess the impact on the Austrian banking system.
Our results imply that especially the disorderly transition scenario can have a sizeable impact on certain economic sectors, most importantly agriculture and transport, where default rates would rise sharply, affecting banks exposed to these sectors. The aggregate CET1 ratio for the Austrian banking system would decrease by 0.7 percentage points in the orderly and by 2.7 percentage points in the disorderly scenario. Given banks’ initial capitalization levels, this seems manageable. An interactive presentation of the results is available on the OeNB’s website.1
We conclude that the introduction of a carbon pricing mechanism will certainly create additional costs for the Austrian banking system, but our results indicate that banks are well placed to withstand the indirect effects of measures to counter the climate crisis.
Identifying banks with significant negative effects on financial stability in systemic shock scenariosJudith Eidenberger, Katharina SteinerOne of the OeNB’s main financial stability-related tasks is assessing how bank defaults impact financial markets, regardless of whether such defaults have bank-specific (i.e. idiosyncratic) reasons or are caused by a system-wide shock. In this study, we introduce an approach to assessing the effect of system-wide shocks, thereby closing a methodological gap. Our multistep method is based on consistent and comprehensible shock scenarios that also take into account specific characteristics of the Austrian banking system, such as the large number of banks and the institutional protection schemes of the three big sectors. Furthermore, our approach makes it possible to assess each bank in a country with regard to its potential impact on financial stability in a shock scenario.
1 https://www.oenb.at/en/financial-market/banking-supervision/stress-tests.html.

Nontechnical summaries in English
FINANCIAL STABILITY REPORT 42 – NOVEMBER 2021 23
The method builds on the threshold approach developed for the idiosyncratic scenario, thereby ensuring consistency between idiosyncratic and systemic scenario analyses. The assessments of financial stability effects based on our approach may feed into macroprudential deliberations, crisis prevention (resolution planning) and crisis management, and they are also relevant with regard to deposit guarantee schemes.
Nonbank financial intermediation in Austria – an update Alexandra Schober-Rhomberg, Alexander Trachta, Matthias WichoNonbank finance, which complements traditional bank finance, helps increase competition in the financial system. Moreover, it helps diversify the sources of financing for the real economy, that is businesses and households. Its importance has risen since the global financial crisis. Capital markets can function as a buffer by stabilizing financing flows for firms when bank credit decreases. While increased risk-sharing across the financial system is beneficial, activities by nonbank financial institutions also carry systemic risks. These may result from investors’ herding behavior and interconnectedness within the financial system or from maturity or liquidity transformation and the creation of leverage. Maturity transformation means borrowing money on shorter timeframes compared with the maturities involved in lending. Liquidity transformation refers to the financing of less liquid assets, e.g. loans, using liabilities which can be redeemed at any time. Leverage refers to the degree to which investors or businesses use borrowed money.
The relative importance of nonbank finance vis-à-vis traditional banking has increased markedly in the past decade, both worldwide and in the European Union. In Austria, however, the financial system is still dominated by bank financing. The most important nonbank financial institutions are open-end investment funds, insurance corporations and pension funds. Overall, nonbank financial activities in Austria are currently not seen as a concern from a financial stability perspective. Systemic risks from nonbank financial intermediation seem contained and all actors with substantial activities are subject to financial regulation and supervision. The Austrian financial system remains largely dependent on traditional banking and does not yet fully enjoy the benefits of diversified funding sources. Given their increasing relevance, nonbank financial activities – and the systemic risks – need to be monitored closely, both from a micro- and a macroprudential policy perspective.

24 OESTERREICHISCHE NATIONALBANK
Nontechnical summaries in German
OeNB-Klimastresstest: Was bedeutet ein CO2-Preisschock für den österreichischen Bankensektor?Martin Guth, Jannika Hesse, Csilla Königswieser, Gerald Krenn, Christian Lipp, Benjamin Neudorfer, Martin Schneider, Philipp Weiss Der Klimawandel birgt Risiken, die den Wert von Finanzanlagen und die Finanzstabilität beeinträchtigen können. Für die Bewerkstelligung des Übergang zu einer klimafreundlicheren Wirtschaft stellt die Bepreisung von CO2 eines der wichtigsten Instrumente dar, deren potenzielle Vorteile und Risiken von der Politik breit diskutiert werden.
In dieser Studie untersuchen wir mit Hilfe eines vorausschauenden Modells den Effekt einer CO2-Bepreisung auf das österreichische Bankensystem. Dabei analysieren wir drei Szenarien über einen Zeithorizont von fünf Jahren: das Basisszenario, das als Referenzrahmen dient und mit dem aktuellen Top-down-Solvabilitätsstresstest der OeNB konsistent ist, und zwei Übergangsszenarien, in denen ein geordneter bzw. ein disruptiver Anstieg der CO2- Kosten für die Wirtschaft angenommen wird. Die Berechnungen der letzteren beiden Szenarien bilden die empirische Grundlage für unsere Schlussfolgerungen. Wir zielen mit unserer Arbeit vor allem auf die Übertragungskanäle und die potenziellen Auswirkungen von Übergangsrisiken auf das Bankensystem ab. Für eine Vorhersage der wirtschaftlichen Entwicklung in Österreich sollte der Stresstest nicht herangezogen werden.
Der bestehende Top-down-Stresstestrahmen der OeNB wird um zwei zusätzliche Modelle erweitert. Zum einen entwickeln wir ein verbessertes multiregionales Input-Output-Modell, um die Kosten- bzw. Umsatzveränderungen in den einzelnen wirtschaftlichen Sektoren nach Einführung einer CO2-Bepreisung zu ermitteln. Zum anderen erweitern wir das Unternehmensinsolvenzmodell der OeNB, das 2020 zur Einschätzung der Auswirkungen der COVID-19-Pandemie erstmals eingesetzt wurde, um Schocks wie die Einführung einer CO2-Bepreisung abzubilden. Auf diese Weise können wir die Auswirkungen der zuvor erwähnten Maßnahmen auf Insolvenzquoten bewerten, die wiederum für die näherungsweise Schätzung von Kreditausfallswahrscheinlichkeiten herangezogen werden. Darüber hinaus leiten wir aus den Ausfallsquoten Bewertungsverluste für die Anleiheportfolios österreichischer Banken ab. Mit diesem Input werden dann im Top-down-Stresstest der OeNB („ARNIE“) die Auswirkungen auf das österreichische Bankensystem ermittelt.
Unsere Ergebnisse deuten darauf hin, dass insbesondere ein disruptiver Übergang in bestimmten Sektoren – vor allem Landwirtschaft und Verkehr – beträchtliche Effekte haben kann. Die Ausfallsquoten würden stark steigen und somit würden auch Banken mit Engage-ments in diesen Sektoren in Mitleidenschaft gezogen werden. Die aggregierte Kernkapital-quote (CET1-Quote) des österreichischen Bankensystems sinkt im Szenario eines geordneten Übergangs um 0,7 Prozentpunkte und in jenem eines disruptiven Übergangs um 2,7 Prozent-punkte. Angesichts der bestehenden Kapitalausstattung dürften die Banken aber in der Lage sein, beide Szenarien zu bewältigen. Eine interaktive Darstellung der Ergebnisse ist auf der Website der OeNB verfügbar.1
Die Einführung einer CO2-Bepreisung verursacht also in jedem Fall zusätzliche Kosten für das heimische Bankensystem, doch dürfte dieses gut gerüstet sein, um den indirekten Auswirkungen solcher Klimaschutzmaßnahmen standzuhalten.
Identifikation von Banken mit signifikanten negativen Effekten auf die Finanzmarkstabilität in systemischen SchockszenarienJudith Eidenberger, Katharina SteinerZu einer wesentlichen Aufgabe der OeNB im Bereich Finanzmarktstabilität zählt die Bewertung dessen, wie sich Ausfälle von Banken auf den Finanzmarkt auswirken, und zwar
1 https://www.oenb.at/finanzmarkt/bankenaufsicht/stresstests.html.

Nontechnical summaries in German
FINANCIAL STABILITY REPORT 42 – NOVEMBER 2021 25
unabhängig davon, ob diese Ausfälle bankspezifische (idiosynkratische) Gründe haben oder durch einen systemweiten Schock hervorgerufen werden. In der vorliegenden Studie stellen wir einen Ansatz zur Bewertung der Effekte systemweiter Schocks vor und schließen damit eine methodische Lücke. Unsere mehrstufige Methode zieht einerseits konsistente und schlüssige Schockszenarien heran, wobei auch österreichische Spezifika des Bankensektors – wie die hohe Anzahl an Banken und die Sicherungssysteme der drei großen Sektoren – berücksichtigt werden. Andererseits ermöglicht der Ansatz die Bewertung jeder Bank eines Landes hinsichtlich ihrer Bedeutung für die Finanzmarktstabilität in einem Schockszenario.
Die Methode baut zudem auf dem bereits 2019 für das idiosynkratische Szenario entwickelten Schwellenwertansatz auf, sodass Konsistenz zwischen den idiosynkratischen und den systemischen Szenarioanalysen gegeben ist.
Die vorgestellte Methodik zur Bewertung von Effekten auf die Finanzmarktstabilität kann für Fragestellungen der makroprudenziellen Aufsicht, der Krisenprävention (Abwicklungs-planung) und des Krisenmanagements bei einem Bankausfall angewandt werden; zudem ist sie relevant im Zusammenhang mit Finanzmarktstabilitätsanalysen der Einlagensicherung.
Finanzintermediation außerhalb des Bankensektors in Österreich – jüngste Entwicklungen Alexandra Schober-Rhomberg, Alexander Trachta, Matthias WichoDer klassische Bankkredit erhält zunehmend durch das Finanzierungsangebot von Finanz-dienstleistern außerhalb des etablierten Bankensystems („Nichtbanken“) Konkurrenz bzw. wird durch dieses ergänzt, wodurch den Unternehmen und privaten Haushalten – also der Realwirtschaft – auch eine größere Auswahl an Finanzierungsquellen zur Verfügung steht. Seit der globalen Finanzkrise 2008 haben alternative Finanzierungformen stetig an Bedeutung gewonnen. Wenn Bankkredite knapp werden, können die Kapitalmärkte einspringen und die Unternehmensfinanzierung stabilisieren. Die breitere Risikostreuung innerhalb des Finanz-systems ist einerseits zwar positiv einzuschätzen, sie birgt aber andererseits auch neue Risiken für das Finanzsystem. Als mögliche Risikofaktoren gelten potenzielles Herdenverhalten von Investoren und sektorale Verflechtungen innerhalb des Finanzsystems, aber auch die Anwen-dung der Fristen- und Liquiditätstransformation und der Einsatz von Hebelfinanzierungen durch Nichtbanken. Anders gesagt, mögliche Risiken liegen in der Finanzierung langfristiger Kredite über kurzfristige Geldanlagen (Fristentransformation) und der Finanzierung weniger liquider Werte, wie etwa Kredite, durch jederzeit fällige Verbindlichkeiten (Liquiditätstrans-formation). Hinzu kann ein weiterer Faktor kommen: die Ausnutzung der Hebelwirkung zur Steigerung der Eigenkapitalrendite einer Investition durch den Einsatz von Fremdkapital (Hebelfinanzierung).
Im letzten Jahrzehnt hat die Bedeutung des Nichtbankengeschäfts im Vergleich zum traditionellen Bankgeschäft stark zugenommen. Dieser globale Trend spiegelt sich auch in der Entwicklung in der Europäischen Union wider. In Österreich dominiert der Bankkredit jedoch nach wie vor das Finanzierungsgeschehen. Außerhalb des Bankensektors nutzen die Österreicher und Österreicherinnen in erster Linie Veranlagungsmöglichkeiten bei offenen Investmentfonds, Versicherungen und Pensionsfonds. Aus Sicht der Finanzmarktstabilität ist die Tätigkeit österreichischer Nichtbanken derzeit als unproblematisch einzustufen. Die Systemrisiken aus dem Nichtbankengeschäft dürften sich in Grenzen halten. Zudem unterliegen alle Akteure mit nennenswerten Umsätzen der Finanzmarktregulierung und -aufsicht. Das österreichische Finanzsystem ist weiterhin in hohem Maß von den Banken abhängig. Die Vorteile, die eine Diversifikation der Finanzierungsquellen mit sich bringt, werden hierzu-lande also noch nicht voll ausgeschöpft. Die zunehmende Bedeutung der Nichtbanken – und die damit einhergehenden Systemrisiken – erfordern aber eine genaue Beobachtung und Analyse sowohl auf Einzelinstitutsebene als auch auf Systemebene.


FINANCIAL STABILITY REPORT 42 – NOVEMBER 2021 27
OeNB climate risk stress test – modeling a carbon price shock for the Austrian banking sector
Martin Guth, Jannika Hesse, Csilla Königswieser, Gerald Krenn, Christian Lipp, Benjamin Neudorfer, Martin Schneider, Philipp Weiss1
Refereed by: Robert Vermeulen, De Nederlandsche Bank
The climate crisis is one of the most pressing global issues of our time. Policymakers across the field are challenged with the trade-offs of either taking insufficient action to tackle climate change and keeping the current economy humming or decisively addressing global warming and sending the economy into a tailspin. The introduction of a carbon pricing mechanism, one of the main policy instruments in the transition to a more climate- friendly economy, has been intensively discussed. In Austria, the government presented a tax reform package in September 2021, which also includes a carbon pricing scheme.
In this article, we assess the impact of carbon pricing on the Austrian banking system in a forward-looking framework. We evaluate three scenarios over a horizon of five years: The baseline scenario is consistent with the current OeNB top-down solvency stress test and serves as a reference point. One transition scenario assumes an orderly increase of carbon emission costs for the economy, the other one envisages a disorderly increase. These two scenarios provide the empirical basis for our policy conclusions. Our stress test focuses on the transmission channels and the potential impact of transition risks on the banking system and should not be inter-preted as a forecast of the development of the Austrian economy.
We expand the OeNB’s top-down stress testing infrastructure with two additional models. First, we develop an enhanced multiregional input-output model to calculate cost and turnover changes for different economic sectors following the introduction of carbon pricing schemes. Second, we expand the OeNB’s corporate insolvency model introduced in 2020 to assess the impact of the COVID-19 pandemic to include shocks such as a carbon emissions-based shock. This allows us to assess the impact of the aforementioned policy measures on sectoral insolvency rates, which is then used as an approximation for stressed credit risk default probabilities. In addition, we use these stressed default rates to derive valuation losses in Austrian banks’ bond portfolios. Both inputs feed into the OeNB’s top-down stress testing framework ARNIE, making it possible to assess the impact on the Austrian banking system.
Our results imply that especially the disorderly transition scenario can have a sizable impact on certain economic sectors, most importantly agriculture and transport, where default rates would rise sharply, affecting banks exposed to these sectors. The aggregate CET1 ratio for the Austrian banking system would decrease by 2.7 percentage points in the disorderly scenario and by 0.7 percentage points in the orderly scenario. Given initial capitalization levels, this seems manageable. Hence, while the introduction of a carbon pricing mechanism will certainly create additional costs for the Austrian banking system, our results indicate that the banks are well placed to withstand the indirect effects of measures to counter the climate crisis.
JEL classification: G18, G32, Q54Keywords: climate change, stress tests, banks, credit risk, risk management
1 Oesterreichische Nationalbank, Supervision Policy, Regulation and Strategy Division, [email protected], [email protected], [email protected], [email protected], [email protected], [email protected], [email protected] and Economic Analysis Division, [email protected]. Opinions expressed by the authors of studies do not necessarily reflect the official viewpoint of the OeNB or the Eurosystem. The authors would especially like to thank Claus Puhr and Ralph Spitzer (both OeNB) for helpful comments and valuable support.

OeNB climate risk stress test – modeling a carbon price shock for the Austrian banking sector
28 OESTERREICHISCHE NATIONALBANK
Climate change has been intensively discussed in the scientific community for several decades. For central banks, it is a fairly new topic by comparison, which is gaining traction as the implications of climate change for monetary policy and financial stability are becoming more and more tangible. Since 2017, several super-visory authorities and central banks have conducted climate risk stress tests and sensitivity analyses, either on their own by using reporting data (i.e. top-down) or together with banks (i.e. bottom-up).2 Broadly speaking, there are two main types of climate risk: transition risk3 and physical risk4. When analyzing transition risk, the carbon intensity of economic sectors is the key factor as energy- and emissions- intensive sectors are sensitive to climate policy measures. When looking at physical risks, the geographical location of production facilities and assets pledged as collateral are of particular importance.
The dual challenge of traditional banking sector stress tests – model and scenario uncertainty – is particularly pronounced in the analysis of climate risks. Especially with regard to physical risk, extended time horizons play a crucial role. Climate change and its impact will be unfolding over decades, and the global economy will likely undergo an unforeseeable transformation. Unfortunately, traditional financial sector stress tests usually cover a period of no more than three to five years and employ a static balance sheet assumption5. To counter this shortcoming, more dynamic models could be employed, however, at the cost of a substantial increase in modeling risks.
Still, the quantification of climate risks – even if fraught with uncertainty – can support decision-makers in assessing the magnitude and urgency of these risks for the banking sector as well as the potential impact of policy measures. Having a long history of conducting stress tests and scenario analyses, the OeNB decided in 2020 to run a pilot exercise to assess the potential impact of climate policy measures on the Austrian banking system. Like most other central banks, we expanded the time horizon of our analysis by two years compared to our regular banking sector stress tests and focused exclusively on transition risks to alleviate some of the above concerns.
This paper is structured as follows: In section 1, we provide an overview of the scope of this paper, followed by a description of the underlying scenarios of our climate risk assessment in section 2. Section 3 provides details regarding the components of our modeling framework, and in section 4, we present results, again for each component. Finally, we close with a discussion of our findings in section 5.
2 For a comprehensive overview of climate risk stress testing activities across different institutions, see ECB (2021). Most notably, De Nederlandsche Bank conducted the very first top-down stress test in 2018 (Vermeulen et al., 2021), and the Bank of England (2019) and the Banque de France (Allen et al., 2020) conducted the two subsequent bottom-up exercises. Although similar in their nature of addressing climate-related risks, the stress tests are difficult to compare as the methodologies and underlying assumptions diverge significantly between institu-tions.
3 Transition risks refer to the risks associated with the transition to a low-carbon economy. The risks arise due to disruptive processes triggered by the need to reduce carbon emissions, such as policy, legal and technology shocks (IPCC, 2020).
4 Physical risks refer to the risks associated with the potential damage to infrastructure, buildings, raw materials and supply chains by weather and climate. These risks are often grouped into risks from short-term events (e.g. increased insurance costs) and long-term events (e.g. flooding of coastal areas) (IPCC, 2020).
5 The static balance sheet assumption serves as a simplification for the stress test; it implies that banks do not take any management action or change their business model over the projection period. Hence, the size, composition and risk profile of a bank’s balance sheet is kept constant (EBA, 2018).
OeNB climate risk stress test – modeling a carbon price shock for the Austrian banking sector
FINANCIAL STABILITY REPORT 42 – NOVEMBER 2021 29
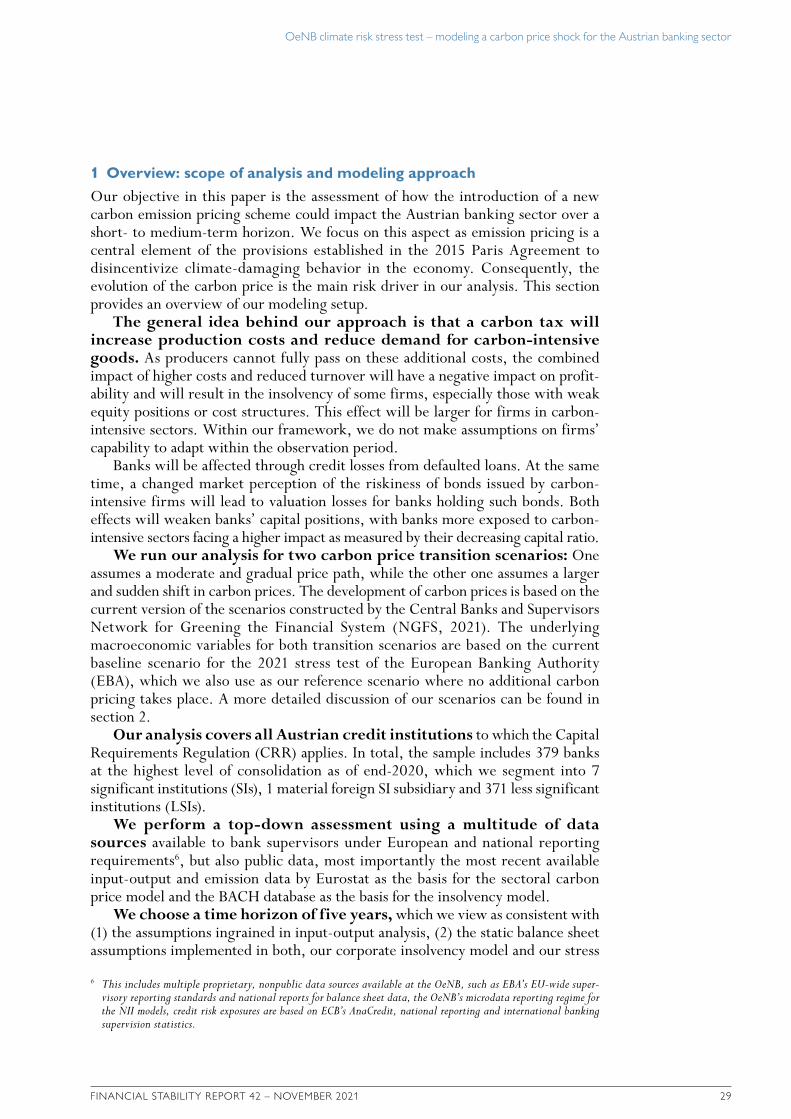
1 Overview: scope of analysis and modeling approach
Our objective in this paper is the assessment of how the introduction of a new carbon emission pricing scheme could impact the Austrian banking sector over a short- to medium-term horizon. We focus on this aspect as emission pricing is a central element of the provisions established in the 2015 Paris Agreement to disincentivize climate-damaging behavior in the economy. Consequently, the evolution of the carbon price is the main risk driver in our analysis. This section provides an overview of our modeling setup.
The general idea behind our approach is that a carbon tax will increase production costs and reduce demand for carbon-intensive goods. As producers cannot fully pass on these additional costs, the combined impact of higher costs and reduced turnover will have a negative impact on profit-ability and will result in the insolvency of some firms, especially those with weak equity positions or cost structures. This effect will be larger for firms in carbon- intensive sectors. Within our framework, we do not make assumptions on firms’ capability to adapt within the observation period.
Banks will be affected through credit losses from defaulted loans. At the same time, a changed market perception of the riskiness of bonds issued by carbon- intensive firms will lead to valuation losses for banks holding such bonds. Both effects will weaken banks’ capital positions, with banks more exposed to carbon- intensive sectors facing a higher impact as measured by their decreasing capital ratio.
We run our analysis for two carbon price transition scenarios: One assumes a moderate and gradual price path, while the other one assumes a larger and sudden shift in carbon prices. The development of carbon prices is based on the current version of the scenarios constructed by the Central Banks and Supervisors Network for Greening the Financial System (NGFS, 2021). The underlying macroeconomic variables for both transition scenarios are based on the current baseline scenario for the 2021 stress test of the European Banking Authority (EBA), which we also use as our reference scenario where no additional carbon pricing takes place. A more detailed discussion of our scenarios can be found in section 2.
Our analysis covers all Austrian credit institutions to which the Capital Requirements Regulation (CRR) applies. In total, the sample includes 379 banks at the highest level of consolidation as of end-2020, which we segment into 7 significant institutions (SIs), 1 material foreign SI subsidiary and 371 less significant institutions (LSIs).
We perform a top-down assessment using a multitude of data sources available to bank supervisors under European and national reporting requirements6, but also public data, most importantly the most recent available input-output and emission data by Eurostat as the basis for the sectoral carbon price model and the BACH database as the basis for the insolvency model.
We choose a time horizon of five years, which we view as consistent with (1) the assumptions ingrained in input-output analysis, (2) the static balance sheet assumptions implemented in both, our corporate insolvency model and our stress
6 This includes multiple proprietary, nonpublic data sources available at the OeNB, such as EBA’s EU-wide super-visory reporting standards and national reports for balance sheet data, the OeNB’s microdata reporting regime for the NII models, credit risk exposures are based on ECB’s AnaCredit, national reporting and international banking supervision statistics.

OeNB climate risk stress test – modeling a carbon price shock for the Austrian banking sector
30 OESTERREICHISCHE NATIONALBANK
test framework ARNIE, and (3) our use of the current baseline scenario for the 2021 EBA stress test, which we extend to five years and combine with carbon price paths. The calculation steps are performed for each quarter of our simulation horizon.
These choices are also consistent with our objective of providing an assessment of how a sudden increase in carbon prices could impact the banking sector while limiting model uncertainty. Consequently, we explicitly exclude the longer-term impact of physical risk and the large-scale and unforeseeable transformation our economy will undergo if climate change continues unchecked. It is important to keep these limitations in mind when interpreting the results.
Our model builds on the following four components, as illustrated in figure 1.
A newly developed sectoral carbon price model links additional carbon charges to economic sectors’ costs and output. Specifically, we employ an input-output analysis which captures differences as well as interlinkages between economic sectors on a granular level (Owen, 2017). In contrast to traditional applications, we do not assume that costs can be fully passed on to other customers, but restrict this ability based on a sector’s trade and emissions intensity.
The OeNB’s corporate insolvency model, a microdata-founded structural approach developed in 2020 to assess sectoral vulnerabilities in the COVID-19 environment (Puhr and Schneider, 2021), will translate higher costs and lower turnover into increased insolvency rates for Austrian corporates based on their sector-specific balance sheets and profitability characteristics. The increases in insolvency rates are later used as sector-specific shocks to probabilities of default (PDs).
A set of linking equations translates sector-specific PD shocks for the Austrian economy into shocks for other countries. This step is necessary as our corporate insolvency model is only available for Austrian firms. Moreover, the Austrian insolvency rates are further used as an input to the market risk module, which calculates valuations losses as an additional shock factor.
Finally, ARNIE, the OeNB’s well-proven top-down stress testing framework (Feldkircher et al., 2013), is used to calculate the impact of carbon price-induced credit risk and market risk shocks on individual banks. Each box depicted in figure 1 will be explained in more detail in section 3.
2 Scenario definitionThe scenario narratives published by the NGFS since 2020 serve as the starting point for most recent climate risk assessments. Covering the periods 2020 to 2050 and 2050 to 2100, respectively, these scenarios provide a range of macroeconomic variables such as GDP and carbon price paths for an orderly and a disorderly transition to a carbon-neutral economy (NGFS, 2021). Given our short- to medium- term time horizon and our focus on carbon pricing, we follow a slightly different approach.
A five-year baseline scenario serves as the reference scenario to which we add two sets of carbon price paths inspired by the NGFS scenarios. For the baseline scenario, the forecast of the broader economy is based on the current baseline scenario for the EBA EU-wide stress test, which we also use for the OeNB’s regular top-down banking stress test also published in this
Stylized overview of the OeNB's climate risk stress test framework
Figure 1
Source: Authors’ compilation.
Sectoral carbon price model
Insolvencymodel
Linking
Baseline scenarioCarbon pricescenario
equa�ons
ARNIE
Market risk
Cost & turnover changes
Sectoralinsolvency
rates
Valua�on losses
PDs for all countries
Bank-specificcapital impact

OeNB climate risk stress test – modeling a carbon price shock for the Austrian banking sector
FINANCIAL STABILITY REPORT 42 – NOVEMBER 2021 31
report.7 The scenario of the EBA stress test is enriched by the current OeNB forecast (June 2021) to enable its decomposition into granular economic sectors.
In the first transition scenario, carbon pricing is implemented in an orderly fashion, where the additional cost of emitting greenhouse gases rises steadily from EUR 30 per ton CO2 equivalent in 2021 to EUR 130 per ton in 2025. The second scenario assumes a disorderly transition such that the cost of emitting greenhouse gases jumps immediately to EUR 130 in 2021 and rises to EUR 260 in 2025 (see chart 1).
Importantly, we model the carbon price as an additional impact on existing direct and indirect emission pricing schemes such as fuel taxes, the European Emission Trading System (ETS) and national pricing regimes. In both scenarios, carbon pricing applies to all economic sectors and includes all important greenhouse gases.8
7 See the “Recent developments” section in this publication.8 The main greenhouse gases – carbon dioxide (CO2), methane (CH4), nitrous oxide, hydrofluorocarbons, perfluoro-
carbons, sulphur hexafluoride and nitrogen trifluoride – are measured in CO2 equivalents in our analysis.
EUR per ton of CO2 equivalent
300
250
200
150
100
50
0
Carbon price paths in the orderly and disorderly scenarios
Chart 1
Source: OeNB.
Orderly Disorderly
2021 2022 2023 2024 2025
test framework ARNIE, and (3) our use of the current baseline scenario for the 2021 EBA stress test, which we extend to five years and combine with carbon price paths. The calculation steps are performed for each quarter of our simulation horizon.
These choices are also consistent with our objective of providing an assessment of how a sudden increase in carbon prices could impact the banking sector while limiting model uncertainty. Consequently, we explicitly exclude the longer-term impact of physical risk and the large-scale and unforeseeable transformation our economy will undergo if climate change continues unchecked. It is important to keep these limitations in mind when interpreting the results.
Our model builds on the following four components, as illustrated in figure 1.
A newly developed sectoral carbon price model links additional carbon charges to economic sectors’ costs and output. Specifically, we employ an input-output analysis which captures differences as well as interlinkages between economic sectors on a granular level (Owen, 2017). In contrast to traditional applications, we do not assume that costs can be fully passed on to other customers, but restrict this ability based on a sector’s trade and emissions intensity.
The OeNB’s corporate insolvency model, a microdata-founded structural approach developed in 2020 to assess sectoral vulnerabilities in the COVID-19 environment (Puhr and Schneider, 2021), will translate higher costs and lower turnover into increased insolvency rates for Austrian corporates based on their sector-specific balance sheets and profitability characteristics. The increases in insolvency rates are later used as sector-specific shocks to probabilities of default (PDs).
A set of linking equations translates sector-specific PD shocks for the Austrian economy into shocks for other countries. This step is necessary as our corporate insolvency model is only available for Austrian firms. Moreover, the Austrian insolvency rates are further used as an input to the market risk module, which calculates valuations losses as an additional shock factor.
Finally, ARNIE, the OeNB’s well-proven top-down stress testing framework (Feldkircher et al., 2013), is used to calculate the impact of carbon price-induced credit risk and market risk shocks on individual banks. Each box depicted in figure 1 will be explained in more detail in section 3.
2 Scenario definitionThe scenario narratives published by the NGFS since 2020 serve as the starting point for most recent climate risk assessments. Covering the periods 2020 to 2050 and 2050 to 2100, respectively, these scenarios provide a range of macroeconomic variables such as GDP and carbon price paths for an orderly and a disorderly transition to a carbon-neutral economy (NGFS, 2021). Given our short- to medium- term time horizon and our focus on carbon pricing, we follow a slightly different approach.
A five-year baseline scenario serves as the reference scenario to which we add two sets of carbon price paths inspired by the NGFS scenarios. For the baseline scenario, the forecast of the broader economy is based on the current baseline scenario for the EBA EU-wide stress test, which we also use for the OeNB’s regular top-down banking stress test also published in this
Stylized overview of the OeNB's climate risk stress test framework
Figure 1
Source: Authors’ compilation.
Sectoral carbon price model
Insolvencymodel
Linking
Baseline scenarioCarbon pricescenario
equa�ons
ARNIE
Market risk
Cost & turnover changes
Sectoralinsolvency
rates
Valua�on losses
PDs for all countries
Bank-specificcapital impact
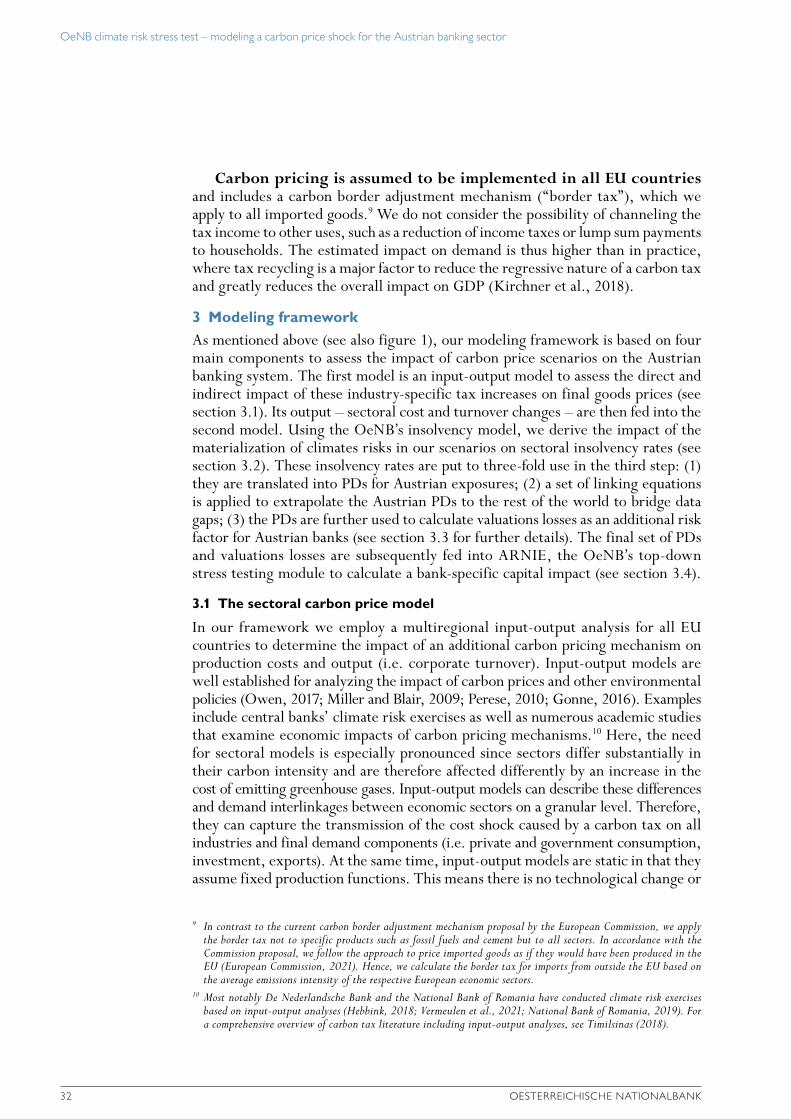
OeNB climate risk stress test – modeling a carbon price shock for the Austrian banking sector
32 OESTERREICHISCHE NATIONALBANK
Carbon pricing is assumed to be implemented in all EU countries and includes a carbon border adjustment mechanism (“border tax”), which we apply to all imported goods.9 We do not consider the possibility of channeling the tax income to other uses, such as a reduction of income taxes or lump sum payments to households. The estimated impact on demand is thus higher than in practice, where tax recycling is a major factor to reduce the regressive nature of a carbon tax and greatly reduces the overall impact on GDP (Kirchner et al., 2018).
3 Modeling frameworkAs mentioned above (see also figure 1), our modeling framework is based on four main components to assess the impact of carbon price scenarios on the Austrian banking system. The first model is an input-output model to assess the direct and indirect impact of these industry-specific tax increases on final goods prices (see section 3.1). Its output – sectoral cost and turnover changes – are then fed into the second model. Using the OeNB’s insolvency model, we derive the impact of the materialization of climates risks in our scenarios on sectoral insolvency rates (see section 3.2). These insolvency rates are put to three-fold use in the third step: (1) they are translated into PDs for Austrian exposures; (2) a set of linking equations is applied to extrapolate the Austrian PDs to the rest of the world to bridge data gaps; (3) the PDs are further used to calculate valuations losses as an additional risk factor for Austrian banks (see section 3.3 for further details). The final set of PDs and valuations losses are subsequently fed into ARNIE, the OeNB’s top-down stress testing module to calculate a bank-specific capital impact (see section 3.4).
3.1 The sectoral carbon price model
In our framework we employ a multiregional input-output analysis for all EU countries to determine the impact of an additional carbon pricing mechanism on production costs and output (i.e. corporate turnover). Input-output models are well established for analyzing the impact of carbon prices and other environmental policies (Owen, 2017; Miller and Blair, 2009; Perese, 2010; Gonne, 2016). Examples include central banks’ climate risk exercises as well as numerous academic studies that examine economic impacts of carbon pricing mechanisms.10 Here, the need for sectoral models is especially pronounced since sectors differ substantially in their carbon intensity and are therefore affected differently by an increase in the cost of emitting greenhouse gases. Input-output models can describe these differences and demand interlinkages between economic sectors on a granular level. Therefore, they can capture the transmission of the cost shock caused by a carbon tax on all industries and final demand components (i.e. private and government consumption, investment, exports). At the same time, input-output models are static in that they assume fixed production functions. This means there is no technological change or
9 In contrast to the current carbon border adjustment mechanism proposal by the European Commission, we apply the border tax not to specific products such as fossil fuels and cement but to all sectors. In accordance with the Commission proposal, we follow the approach to price imported goods as if they would have been produced in the EU (European Commission, 2021). Hence, we calculate the border tax for imports from outside the EU based on the average emissions intensity of the respective European economic sectors.
10 Most notably De Nederlandsche Bank and the National Bank of Romania have conducted climate risk exercises based on input-output analyses (Hebbink, 2018; Vermeulen et al., 2021; National Bank of Romania, 2019). For a comprehensive overview of carbon tax literature including input-output analyses, see Timilsinas (2018).

OeNB climate risk stress test – modeling a carbon price shock for the Austrian banking sector
FINANCIAL STABILITY REPORT 42 – NOVEMBER 2021 33
substitution of inputs. Firms are assumed to continue producing with the same mix of input materials, they only react to carbon price-driven changes in demand by producing more or less of the same goods. The databases used for our input-out-put model are the latest FIGARO11 multiregional input-output tables for 2019.
Figure 2 provides an overview of our approach.We perform our calculations in five steps:1. Based on the carbon price scenarios described in section 2 and sectoral
emission intensities, we calculate sector-specific carbon price shocks. 2. The price model provides consistent price changes for the goods each sector
produces. Input-output analysis generally assumes a full pass-through of costs to consumers. To capture not only output effects (i.e. reductions in turnover), but also cost effects, we extend this framework by including incomplete pass-through rates. The ability of firms to pass through additional costs to consumers depends on (1) the competitive situation of the firm and (2) the size of the cost shock. We approximate the first component by its trade intensity, i.e. firms in more competitive markets are less able to pass on costs. The second determinant accounts for the empirical observation that higher cost shocks are more difficult to pass on to consumers than lower ones. We combine both effects and classify sectors into three groups, with pass-through rates ranging from 90% to 99% (for more details, see the online supplement to this study).12 The part of the cost shock that is passed on results in higher prices. The remainder of the shock is our first input for the insolvency model (profit reduction, production cost increase).
3. The final demand model translates higher prices into demand reductions for 21 sectors. This is done separately for private consumption and for exports, using own price elasticities for all goods (for more details, see the online supplement to this study).
4. Based on these demand changes, the input-output quantity model yields sectoral output reductions, which capture the direct effects per industry and the indirect effects by intermediate demand linkages between industries, i.e. first-round effects.
5. Finally, we account for second-round effects. In traditional input-output analysis, second-round effects via a reduction in employment and wages are usually not captured. As analyzing these effects in detail would require integrating the input-output framework into a fully-fledged dynamic macroeconomic model, we simulate the impact of wage losses via a reduction of private consumption, which in turn reduces output, employment and, ultimately, wages. We use a Keynesian multiplier based on the intrayear dynamic responses of the OeNB’s macroeconomic model13. These second- round effects are added to the first-round effects to obtain the total carbon
11 FIGARO stands for “ full international and global accounts for research in input-output analysis,” latest version published by Eurostat in May 2021.
12 This approach is derived from the EU’s Emission Trading System methodology to calculate a sector’s carbon leakage indicator to determine the number of free certificates a sector receives ( for formulae, see the online supplement to this study).
13 See Fenz and Spitzer (2005) and Leibrecht and Schneider (2006).

OeNB climate risk stress test – modeling a carbon price shock for the Austrian banking sector
34 OESTERREICHISCHE NATIONALBANK
price impact on output. This output reduction (a shock to firms’ turnover) is the second input which feeds into the insolvency model.
3.2 The OeNB’s corporate insolvency model for Austrian firms
Originally implemented to assess the impact of COVID-19 and the associated mitigating measures on the Austrian economy, the OeNB’s insolvency model allows us to estimate the effect of an additional carbon price tax on sectoral insolvency rates in Austria. Adapting the original model,14 we (1) extend the observation horizon by two years to a five-year period and (2) cover not only shocks to turnover but also shocks to production costs.
The model is based on simulated firm-level microdata for nonfinancial firms in 17 NACE 1 sectors. We generate 100,000 hypothetical firms per sector by performing a Monte Carlo simulation. The required marginal distributions of and dependence structures between financial core variables are modeled on distribution parameters sourced from the BACH database15 and firm-level data from the SABINA database16. Our granular firm dataset allows us to simulate firms’ profits, cash flows and balance sheets. Over time, shocks to turnover and
14 See Puhr and Schneider (2021) for a detailed description.15 BACH is a database of aggregated and harmonized accounting data of nonfinancial incorporated enterprises from
13 European countries. It contains over 100 variables for 17 NACE sections, about 80 NACE divisions and 4 firm size classes (https://www.bach.banque-france.fr/?lang=en). Besides the weighted mean, data for the quartiles of the distribution for each variable are available.
16 The SABINA database contains firm-level accounting data for more than 130,000 Austrian firms compiled by Bureau van Dijk.
Stylized overview of the input-output (IO) model
Figure 2
Source: OeNB.
CO2 taxincreasesbased oncarbonprice
scenario
First-round effects
Pass-troughrates
Priceelasticities
Insolvencymodel
IO quantitymodel
∆ profits ∆ output
∆ output
∆ wages
∆ finaldemand
Second-round effects
Total effects
∆ goodsprices
∆ finaldemand
International pricecompetitiveness
IO pricemodel
Finaldemandmodel
IO quantitymodel
∆ output
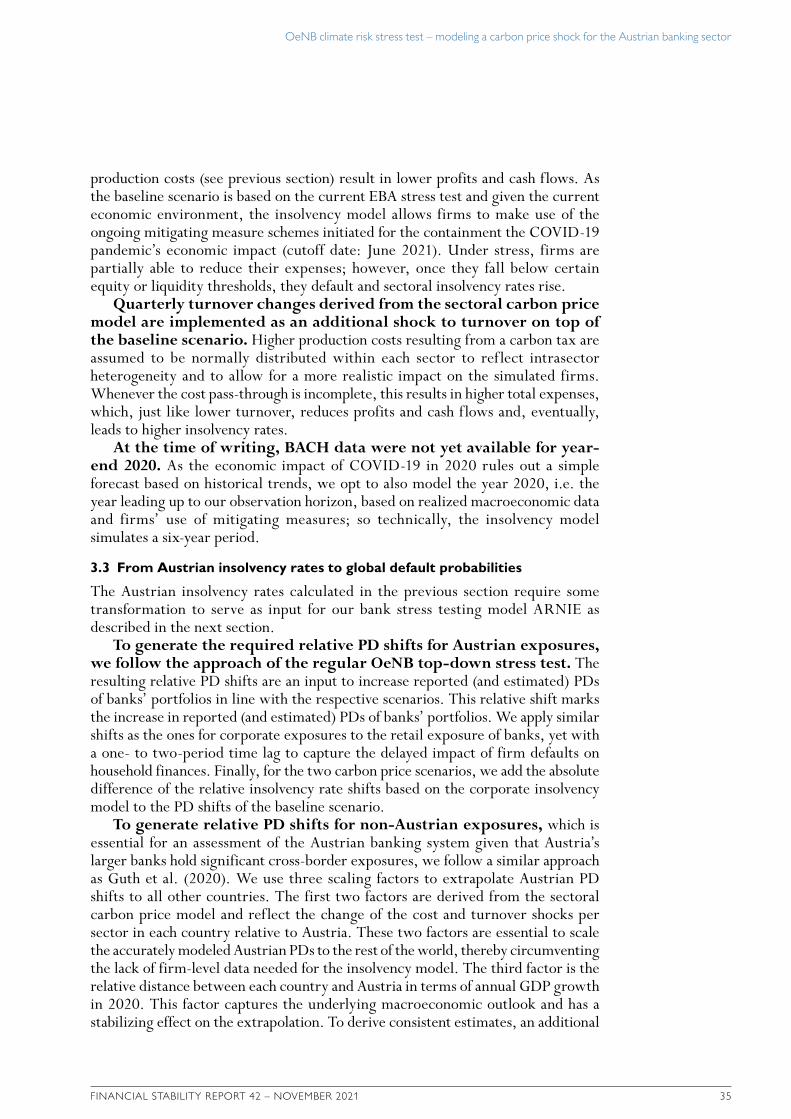
OeNB climate risk stress test – modeling a carbon price shock for the Austrian banking sector
FINANCIAL STABILITY REPORT 42 – NOVEMBER 2021 35
production costs (see previous section) result in lower profits and cash flows. As the baseline scenario is based on the current EBA stress test and given the current economic environment, the insolvency model allows firms to make use of the ongoing mitigating measure schemes initiated for the containment the COVID-19 pandemic’s economic impact (cutoff date: June 2021). Under stress, firms are partially able to reduce their expenses; however, once they fall below certain equity or liquidity thresholds, they default and sectoral insolvency rates rise.
Quarterly turnover changes derived from the sectoral carbon price model are implemented as an additional shock to turnover on top of the baseline scenario. Higher production costs resulting from a carbon tax are assumed to be normally distributed within each sector to reflect intrasector heterogeneity and to allow for a more realistic impact on the simulated firms. Whenever the cost pass-through is incomplete, this results in higher total expenses, which, just like lower turnover, reduces profits and cash flows and, eventually, leads to higher insolvency rates.
At the time of writing, BACH data were not yet available for year-end 2020. As the economic impact of COVID-19 in 2020 rules out a simple forecast based on historical trends, we opt to also model the year 2020, i.e. the year leading up to our observation horizon, based on realized macroeconomic data and firms’ use of mitigating measures; so technically, the insolvency model simulates a six-year period.
3.3 From Austrian insolvency rates to global default probabilities
The Austrian insolvency rates calculated in the previous section require some transformation to serve as input for our bank stress testing model ARNIE as described in the next section.
To generate the required relative PD shifts for Austrian exposures, we follow the approach of the regular OeNB top-down stress test. The resulting relative PD shifts are an input to increase reported (and estimated) PDs of banks’ portfolios in line with the respective scenarios. This relative shift marks the increase in reported (and estimated) PDs of banks’ portfolios. We apply similar shifts as the ones for corporate exposures to the retail exposure of banks, yet with a one- to two-period time lag to capture the delayed impact of firm defaults on household finances. Finally, for the two carbon price scenarios, we add the absolute difference of the relative insolvency rate shifts based on the corporate insolvency model to the PD shifts of the baseline scenario.
To generate relative PD shifts for non-Austrian exposures, which is essential for an assessment of the Austrian banking system given that Austria’s larger banks hold significant cross-border exposures, we follow a similar approach as Guth et al. (2020). We use three scaling factors to extrapolate Austrian PD shifts to all other countries. The first two factors are derived from the sectoral carbon price model and reflect the change of the cost and turnover shocks per sector in each country relative to Austria. These two factors are essential to scale the accurately modeled Austrian PDs to the rest of the world, thereby circumventing the lack of firm-level data needed for the insolvency model. The third factor is the relative distance between each country and Austria in terms of annual GDP growth in 2020. This factor captures the underlying macroeconomic outlook and has a stabilizing effect on the extrapolation. To derive consistent estimates, an additional

OeNB climate risk stress test – modeling a carbon price shock for the Austrian banking sector
36 OESTERREICHISCHE NATIONALBANK
outlier adjustment is introduced to smooth the extreme values on each side of the PD shock spectrum.
Finally, these PD shifts are also used to estimate the market price impact on Austrian banks via valuation losses on bond holdings and equity stakes. To this end, we focus on the impact of widened credit spreads in the different economic sectors and leave other market risk factors (such as the risk-free yield curve) constant. Using the stressed sectoral five-year PD paths as a starting point, we take the maximum yearly relative PD increase, which we interpret as a severe but plausible credit spread shock. A bond’s resulting valuation loss is calculated as the difference between its actual and its stressed expected discounted cash flows. Our calculation uses instrument-level data for domestic banks, including coupon payments, residual maturity, economic sector and current PDs. We only include mark-to-market portfolios, i.e. those sensitive to credit spread-driven valuation losses, in our analysis. We follow a similar approach for material equity stakes in nonfinancial firms. For the material equity stakes in nonfinancial firms, we employ a bucketing approach based on the incurred costs at NACE sector level to apply haircuts. These haircuts reflect the severity of the cost component of the sectoral carbon price model, ranging from 0% to 40% for the orderly scenario and from 0% to 70% for the disorderly scenario. The haircuts are applied to the book value of the equity holdings to derive additional losses.
3.4 Using ARNIE to analyze the impact on the banking sector
We utilize the OeNB’s well-proven and well-documented top-down stress testing framework ARNIE, a MATLAB-based software used for micro- and macropru-dential stress testing and scenario analyses, to investigate the impact of additional carbon pricing on the solvency of Austrian banks, both at the individual and the aggregate banking sector level. ARNIE implements the stress test methodology developed by the EBA for the EU-wide stress test exercise (EBA, 2020) and considers additional risks specific to the Austrian banking sector, such as banks’ equity stakes in other banks, which can amplify shocks.17
4 ResultsIn the subsequent section, we describe the individual results of each component of our climate risk stress testing framework. First, we discuss the economic impact of the two carbon price scenarios on Austria’s economic sectors (see section 4.1). Second, we present the impact on sectoral insolvency rates for Austrian firms (see section 4.2). Third, we discuss how these elevated Austrian insolvency rates translate into higher default probabilities and valuation losses (see section 4.3). Finally, we show the impact of carbon pricing on the Austrian banking system (see section 4.4). An interactive presentation of the results is available on the OeNB’s website.18
4.1 The impact of carbon pricing on sectoral turnover and costs
Using the input-output model described in section 3.1, we determine the impact of the carbon price scenarios on sectoral price levels, output and production costs.
17 For more details see Feldkircher et al. (2013), OeNB (2019, box 1) and Guth et al. (2021).18 https://www.oenb.at/en/financial-market/banking-supervision/stress-tests.html.

OeNB climate risk stress test – modeling a carbon price shock for the Austrian banking sector
FINANCIAL STABILITY REPORT 42 – NOVEMBER 2021 37
Table 1 presents these results across 17 NACE 1 sectors for Austria and the EU aggregate at a carbon price of EUR 130 per ton – the end point of the orderly price scenario and the starting point of our disorderly scenario. Since our input-output modeling framework relies on linear assumptions, the results shown in table 1 can easily be scaled to different carbon prices.
Not surprisingly, the sectors hit hardest are generally those with the highest emissions per unit of output and/or elastic demand. In Austria, sector A (agriculture), currently the most emissions intensive, sees a price increase of about 16%, which would reduce output by 7%. In the second hard-est-hit sector, H (transporting and storage), prices increase by less than 4% but demand decreases by almost 5%. Sector I (accommodation and food service activities) faces the third-highest turnover losses – almost 3.5% – while prices increase by about 2%.
The size of the cost shock is determined by a sector’s direct emissions and its ability to pass on additional costs. In our model, pass-through rates are high (99%) for most sectors, hence the relative cost increase is low, amounting to 0.57%, 0.22% and 0.07% for the sectors A, H and I, respectively, in Austria. Still, this can have a substantial impact on insolvencies, depending on individual sector profitability.
Generally, and within the confines of the modeling framework, the results of our input-output analysis can be interpreted as the upper bound of a carbon price impact since neither tax recycling nor technological change are included. Especially in industries such as electricity production, transport and agriculture, carbon- neutral technologies already exist, which could reduce emissions intensity and thus the tax burden if they were to be adopted at a large scale.
Table 1
Price, turnover and cost changes derived from the sectoral carbon price model
Direct GHG/EUR1
Price changes (%)2
Turnover changes (%)2
Cost changes (%)2
Sector AT EU AT EU AT EU AT EU
Agriculture, forestry and fishing (A) 0.9 0.95 15.78 15.51 –7.18 –8.70 0.16 0.57Mining and quarrying (B) 0.4 0.68 8.84 11.85 –3.01 –3.88 0.09 0.36Manufacturing (C) 0.1 0.12 4.21 4.36 –3.00 –3.27 0.04 0.16Electricity, gas, steam and air conditioning supply (D) 0.3 1.30 13.75 22.20 –2.50 –3.18 0.14 0.86Water supply; sewerage; waste management and remediation activities (E) 0.3 0.52 6.54 9.24 –2.14 –2.34 0.07 0.33Construction (F) 0.0 0.03 1.58 2.05 –2.16 –2.72 0.02 0.07Wholesale and retail trade; repair of motor vehicles and motorcycles (G) 0.0 0.03 1.11 1.70 –1.81 –2.20 0.01 0.06Transporting and storage (H) 0.2 0.29 3.71 5.80 –4.66 –7.03 0.04 0.22Accommodation and food service activities (I) 0.0 0.02 1.18 2.04 –3.36 –4.76 0.01 0.07Information and communication (J) 0.0 0.0 0.75 0.89 –1.56 –1.79 0.01 0.03Real estate activities (L) 0.0 0.0 0.76 0.65 –1.95 –1.95 0.01 0.02Professional, scientific and technical activities (M) 0.0 0.0 0.72 0.92 –1.85 –2.07 0.01 0.03Administrative and support service activities (N) 0.0 0.0 0.71 1.15 –2.14 –2.56 0.01 0.04Education (P) 0.0 0.0 0.64 0.79 –0.27 –0.42 0.01 0.03Human health and social work activities (Q) 0.0 0.0 0.78 1.05 –0.31 –0.38 0.01 0.04Arts, entertainment and recreation (R) 0.0 0.0 1.04 1.43 –1.93 –2.07 0.01 0.05Other services activities (S) 0.0 0.0 0.89 1.48 –1.03 –1.69 0.01 0.05
Source: OeNB.1 Emissions coefficient: a sector’s direct greenhouse gas emissions (GHG) in thousand tons divided by its total output (in EUR million).2 At a carbon price of EUR 130 per ton using incomplete pass-through rates.

OeNB climate risk stress test – modeling a carbon price shock for the Austrian banking sector
38 OESTERREICHISCHE NATIONALBANK
it is important to note that our modeling approach does not allow firms to switch to less carbon-intensive means of production and that no new, potentially more innovative firms enter the market.
4.3 The impact of carbon pricing on default probabilities and valuation losses
As described in section 3.3, the main factors for extrapolating the relative shifts of Austrian PDs are the cost and turnover shocks per sector in each country relative to Austria. In general, Austria’s economy has a lower emissions intensity than the countries Austrian banks are exposed to, which can be largely attributed to the high share of renewable energy in the electricity sector (E-Control, 2020). Moreover, the geographical breakdown of the results from the input-output model reveals that Eastern Europe is hit harder by a carbon price shock than Western European countries and the EU on average. This is an important factor when analyzing the impact on the Austrian banking system due to the aforementioned significant cross-border holdings of the largest Austrian banks in harder-hit regions.
The impact of the scenarios on bond and equity valuations is rather muted. At system level, valuation losses amount to roughly EUR 150 million in the orderly and EUR 200 million in the disorderly transition scenario. This is not surprising, however, given that only one-third of bonds are marked to market. Of those, almost two-thirds are issued by financials, which typically possess high credit ratings (i.e. low PDs) while being faced with a lower direct CO2 impact. The revaluation of material equity stakes shows a similar picture, with losses of roughly EUR 189 million in the orderly and EUR 540 million in the disorderly transition scenario. However, these losses stem from a handful of large industry stakes concentrated in a couple of banks, thereby putting significant strain on the capitalization of these banks.
4.4 Results for the Austrian banking system
In this section, we present the impact of the baseline, the orderly and the disorderly carbon price transition scenarios on the consolidated Austrian banking system as calculated with ARNIE (see section 3.4). For the purpose of this paper, we are less interested in absolute CET1 ratios; rather, we look into the additional impact of
Table 2
Cumulative annual insolvency rates for Austrian nonfinancial corporate sectors
Share of exposure at default
Average1 Orderly (delta to baseline) Disorderly (delta to baseline)
2020 2017–2019 2021 2022 2023 2024 2025 2021 2022 2023 2024 2025
% Percentage points
Agriculture, forestry and fishing (A) 0.8 0.2 0.0 0.3 0.5 0.9 1.4 0.0 2.5 5.8 10.0 15.9 Mining and quarrying (B) 0.6 0.5 0.0 0.1 0.1 0.2 0.2 0.1 0.2 0.3 0.4 0.6 Manufacturing (C) 15.4 0.7 0.0 0.1 0.2 0.3 0.5 0.0 0.4 0.8 1.4 2.1 Electricity, gas, steam and air conditioning supply (D) 2.8 0.3 0.0 0.0 0.1 0.1 0.2 0.0 0.1 0.3 0.7 1.2 Water supply; sewerage; waste management and remediation activities (E) 1.0 0.7 0.0 0.3 0.7 1.1 1.6 0.2 1.3 2.6 3.9 5.2
Construction (F) 8.7 2.0 0.0 0.1 0.3 0.5 0.7 0.0 0.4 0.8 1.2 1.7 Wholesale and retail trade; repair of motor vehicles and motorcycles (G) 10.1 1.0 0.0 0.3 0.3 0.4 0.4 0.0 1.1 1.4 1.5 1.7
Transporting and storage (H) 3.3 2.6 0.3 0.9 1.6 2.3 2.9 1.7 4.5 7.6 10.3 12.9 Accomondation and food service activities (I) 4.3 2.0 0.0 0.3 0.5 0.7 0.9 0.0 1.2 1.8 2.5 3.2 Information and comunication (J) 1.9 0.6 0.0 0.0 0.1 0.1 0.1 0.1 0.2 0.3 0.3 0.4 Real estate activities (L) 29.9 0.3 0.0 0.0 0.0 0.0 0.1 0.0 0.1 0.2 0.2 0.2 Professional, scientific and technical activities (M) 14.9 0.5 0.0 0.0 0.1 0.1 0.1 0.0 0.1 0.1 0.2 0.3 Administrative and support service activities (N) 3.0 1.6 0.1 0.2 0.3 0.3 0.4 0.3 0.7 0.8 0.9 1.0 Education (P) 0.1 0.4 0.0 0.0 0.0 0.0 0.0 0.0 0.1 0.1 0.1 0.1 Human health and social work acitivities (Q) 1.7 0.4 0.0 0.0 0.0 0.0 0.2 0.0 0.0 0.0 0.0 0.4 Arts, entertainment and recreation (R) 0.4 0.6 0.1 0.4 0.8 1.2 1.6 0.5 1.3 2.2 2.9 3.7 Other services acitivities (S) 0.9 0.7 0.0 0.2 0.4 0.5 0.8 0.2 0.6 1.0 1.3 1.8 Total 100.0 0.9 0.0 0.2 0.3 0.4 0.6 0.0 0.8 1.3 1.8 2.5
Source: KSV 1870, OeNB, authors’ calculations.1 According to KSV 1870 data.
Difference from baseline in percentage points
0
–0.5
–1.0
–1.5
–2.0
–2.5
–3.0
CET1 ratio of the Austrian banking system in the OeNB climate risk stress test
Chart 2
Source: OeNB.
Orderly Disorderly
–0.7%
–2.7%
Q4 20 Q4 21 Q4 22 Q4 23 Q4 24 Q4 25
4.2 The impact of carbon pricing on corporate insolvencies
The impact of the carbon price shocks on the Austrian economy discussed in the previous section is used as input to the OeNB’s corporate insolvency model described in section 3.2. On aggregate, the insolvency model suggests that insolvency rates increase by 0.6 percentage points by end-2025 in our orderly transition scenario relative to the baseline scenario without carbon pricing. In the disorderly transition scenario, the aggregate insolvency rate is markedly higher, increasing by 2.5 percentage points by 2025 relative to the baseline. Put differently, additional average insolvencies would rise by 0.5 percentage points per year as a result of carbon pricing. Table 2 displays the cumulative annual insolvency rates expressed as the difference from the baseline scenario for all Austrian nonfinancial corporates in 17 NACE 1 sectors. For the purpose of comparison, the first column shows the percentage shares of firms’ individual exposure in the Austrian banking system at year-end 2020. The table shows that the impact of carbon pricing to be greatest for sectors A (agriculture) and H (transporting and storage), where insolvency rates would rise by an additional 15.9 and 12.9 percentage points, respectively, in the disorderly scenario when compared to the baseline. At the same time, however, Austrian banks’ exposure to these sectors is limited, amounting to 0.8 and 3.3 percentage points, respectively. While sectors I (accommodation and food service activities) and R (arts, entertainment and recreation) show higher insolvency rates, these are caused by already elevated insolvencies in the baseline scenario and to a lesser extent by carbon pricing. When interpreting these results,

OeNB climate risk stress test – modeling a carbon price shock for the Austrian banking sector
FINANCIAL STABILITY REPORT 42 – NOVEMBER 2021 39
it is important to note that our modeling approach does not allow firms to switch to less carbon-intensive means of production and that no new, potentially more innovative firms enter the market.
4.3 The impact of carbon pricing on default probabilities and valuation losses
As described in section 3.3, the main factors for extrapolating the relative shifts of Austrian PDs are the cost and turnover shocks per sector in each country relative to Austria. In general, Austria’s economy has a lower emissions intensity than the countries Austrian banks are exposed to, which can be largely attributed to the high share of renewable energy in the electricity sector (E-Control, 2020). Moreover, the geographical breakdown of the results from the input-output model reveals that Eastern Europe is hit harder by a carbon price shock than Western European countries and the EU on average. This is an important factor when analyzing the impact on the Austrian banking system due to the aforementioned significant cross-border holdings of the largest Austrian banks in harder-hit regions.
The impact of the scenarios on bond and equity valuations is rather muted. At system level, valuation losses amount to roughly EUR 150 million in the orderly and EUR 200 million in the disorderly transition scenario. This is not surprising, however, given that only one-third of bonds are marked to market. Of those, almost two-thirds are issued by financials, which typically possess high credit ratings (i.e. low PDs) while being faced with a lower direct CO2 impact. The revaluation of material equity stakes shows a similar picture, with losses of roughly EUR 189 million in the orderly and EUR 540 million in the disorderly transition scenario. However, these losses stem from a handful of large industry stakes concentrated in a couple of banks, thereby putting significant strain on the capitalization of these banks.
4.4 Results for the Austrian banking system
In this section, we present the impact of the baseline, the orderly and the disorderly carbon price transition scenarios on the consolidated Austrian banking system as calculated with ARNIE (see section 3.4). For the purpose of this paper, we are less interested in absolute CET1 ratios; rather, we look into the additional impact of
Table 2
Cumulative annual insolvency rates for Austrian nonfinancial corporate sectors
Share of exposure at default
Average1 Orderly (delta to baseline) Disorderly (delta to baseline)
2020 2017–2019 2021 2022 2023 2024 2025 2021 2022 2023 2024 2025
% Percentage points
Agriculture, forestry and fishing (A) 0.8 0.2 0.0 0.3 0.5 0.9 1.4 0.0 2.5 5.8 10.0 15.9 Mining and quarrying (B) 0.6 0.5 0.0 0.1 0.1 0.2 0.2 0.1 0.2 0.3 0.4 0.6 Manufacturing (C) 15.4 0.7 0.0 0.1 0.2 0.3 0.5 0.0 0.4 0.8 1.4 2.1 Electricity, gas, steam and air conditioning supply (D) 2.8 0.3 0.0 0.0 0.7 1.0 0.2 0.0 0.1 0.7 1.1 1.2 Water supply; sewerage; waste management and remediation activities (E) 1.0 0.7 0.0 0.3 2.7 5.3 1.6 0.2 1.3 3.6 6.1 5.2
Construction (F) 8.7 2.0 0.0 0.1 3.0 3.8 0.7 0.0 0.4 4.1 4.9 1.7 Wholesale and retail trade; repair of motor vehicles and motorcycles (G) 10.1 1.0 0.0 0.3 7.8 7.9 0.4 0.0 1.1 12.6 12.6 1.7
Transporting and storage (H) 3.3 2.6 0.3 0.9 8.0 10.0 2.9 1.7 4.5 18.0 20.0 12.9 Accomondation and food service activities (I) 4.3 2.0 0.0 0.3 11.9 11.9 0.9 0.0 1.2 26.5 26.5 3.2 Information and comunication (J) 1.9 0.6 0.0 0.0 2.0 2.4 0.1 0.1 0.2 2.3 2.6 0.4 Real estate activities (L) 29.9 0.3 0.0 0.0 4.3 4.3 0.1 0.0 0.1 4.0 4.0 0.2 Professional, scientific and technical activities (M) 14.9 0.5 0.0 0.0 2.0 2.3 0.1 0.0 0.1 2.3 2.5 0.3 Administrative and support service activities (N) 3.0 1.6 0.1 0.2 9.4 9.5 0.4 0.3 0.7 12.4 12.4 1.0 Education (P) 0.1 0.4 0.0 0.0 3.0 3.0 0.0 0.0 0.1 3.4 3.4 0.1 Human health and social work acitivities (Q) 1.7 0.4 0.0 0.0 0.4 0.9 0.2 0.0 0.0 1.8 1.8 0.4 Arts, entertainment and recreation (R) 0.4 0.6 0.1 0.4 13.5 15.8 1.6 0.5 1.3 39.3 40.3 3.7 Other services acitivities (S) 0.9 0.7 0.0 0.2 7.1 7.7 0.8 0.2 0.6 11.2 11.3 1.8 Total 100.0 0.9 0.0 0.2 5.3 5.7 0.6 0.0 0.8 9.2 9.3 2.5
Source: KSV 1870, OeNB, authors’ calculations.1 According to KSV 1870 data.
Difference from baseline in percentage points
0
–0.5
–1.0
–1.5
–2.0
–2.5
–3.0
CET1 ratio of the Austrian banking system in the OeNB climate risk stress test
Chart 2
Source: OeNB.
Orderly Disorderly
–0.7%
–2.7%
Q4 20 Q4 21 Q4 22 Q4 23 Q4 24 Q4 25

OeNB climate risk stress test – modeling a carbon price shock for the Austrian banking sector
40 OESTERREICHISCHE NATIONALBANK
carbon pricing and therefore focus on the deviation of banks’ capitalization in both transition scenarios from the baseline (chart 2).
Our results indicate that carbon pricing has a manageable impact on the capitalization of Austrian banks in both transition scenarios. In the orderly scenario, the aggregate CET1 ratio for the Austrian banking sector would be 0.7 percentage points lower compared to the baseline over the five-year observation horizon. Under the harsher disorderly scenario, the impact amounts to 2.7 percentage points.
Chart 3 shows how different risk drivers contribute to the change in the CET1 ratio; the green and red bars denote components contributing to capital buildup or depletion, respectively.
We see that credit risk is the main contributor to the deviation of both carbon price scenarios from the baseline. This is not surprising given our modeling framework. In the orderly and disorderly scenarios, net credit risk is 1.9 percentage points and 4.5 percentage points, respectively, higher than in the baseline. Credit risk reflects provisioning needs for newly defaulted and increased provision coverage of “old” defaulted assets as well as the impact on risk-weighted assets. Over five years, credit risk losses amount to 0.8% and 1.8%, respectively, of total exposure in the orderly and the disorderly scenario. This significant differ-ence is partly driven by the results of the insolvency model. Higher carbon prices and their speedier introduction lead to more defaults. Another important driver is a methodological assumption concerning cure rates. Under the orderly scenario, cure rates remain at historical levels, i.e. a share of the nonperforming portfolio is assumed to perform again. The disorderly scenario does not permit cures, which leads to significantly higher net credit risk costs.19
19 This follows the approach prescribed by the EBA in its methodology for the EU-wide stress test, see EBA (2020).
Impact on CET1 ratio in terms of percentage point difference from baseline Impact on CET1 ratio in terms of percentage point difference from baseline
Orderly scenario Disorderly scenario
4
2
0
–2
–4
4
2
0
–2
–4
Risk drivers for the Austrian banking system
Chart 3
Source: OeNB.
–0.2–0.8 –0.4 0.0
0.7
Ope
ratin
g pr
ofit
Net
cre
dit r
isk
Part
icip
atio
ns
Oth
er
Taxe
s, di
vide
nds
and
min
ority
inte
rest
s
–0.6
–3.5–1.0
0.0
2.4
Ope
ratin
g pr
ofit
Net
cre
dit r
isk
Part
icip
atio
ns
Oth
er
Taxe
s, di
vide
nds
and
min
ority
inte
rest
s

OeNB climate risk stress test – modeling a carbon price shock for the Austrian banking sector
FINANCIAL STABILITY REPORT 42 – NOVEMBER 2021 41
Higher default numbers in turn reduce operating profits. Nonper-forming exposures do not pay interest, thereby reducing net interest income. This effect reduces the CET1 ratio by 0.2 percentage points in the orderly scenario and by 0.6 percentage points in the disorderly scenario, each compared with the baseline.
The participation risk channel remains significant, also in the carbon transition scenarios. Cooperative ownership structures are an important feature of the Austrian banking sector, especially within the three-tiered Raiffeisen sector. The small local Raiffeisen banks (“primary banks”) own the Landesbanken, which again hold a substantial share in Raiffeisen Bank International. In good times, the lower tier benefits from profits made at the higher tiers through dividend distributions and potential revaluation surpluses of their equity stakes. In bad times, the reverse holds true. Income from equity stakes falls, and revaluation losses mount. The combined impact of both results in a drop in the CET1 ratio by 0.3 percentage points in the orderly and 1.0 percentage point in the disorderly scenario compared with the baseline.
Taxes, dividends and minority interest (TDM) have a stabilizing effect, as all three components are calculated as a fraction of profits. In our two transition scenarios, losses are higher, depleting capital, but at the same time tax payments and profit distribution are lower, supporting capitalization compared to the baseline.
Differences across banking sectors emerge but remain limited. Chart 4 breaks down the CET1 impact of the baseline as well as both transition scenarios by different sectors of the Austrian banking system. Joint stock banks, Raiffeisen banks and special purpose banks show the highest impact. For the small Raiffeisen banks, this impact is also an indirect one resulting from losses trickling down from second-tier Landesbanken and, ultimately, Raiffeisen Bank Inter-national (RBI).
In general, the impact of carbon pricing on banks reflects their portfolio mix. At the industry-sector level and in line with the sectoral carbon price model and the OeNB insolvency model, Austrian banks with a dispropor-tionately higher exposure to the hardest-hit NACE 1 sectors H (transporting and storage) and A (agriculture) are more affected in the transition scenarios relative to their exposure shares. In the disorderly scenario, this difference is more pronounced than in the orderly scenario. However, as has been noted in section 3.2, banks’ exposure to these most affected sectors is rather limited across the entire Austrian banking sector.
Furthermore, banks active in cross-border lending to Central, Eastern and Southeastern Europe (CESEE) also see a higher impact. In relative terms, banks’ Austrian exposure is affected less than their foreign exposures; especially in CESEE countries, the PD impact is higher in the relevant economic sectors due to the higher impact of carbon pricing in the respective economies in our model.
Overall, our results indicate that transition costs stemming from carbon pricing have a limited impact on the capitalization of Austrian banks. In line with other exercises20 that quantify transitional risks, we find that the impact is mainly driven by credit risk and only to a smaller extent by market
20 Also, Vermeulen et al. (2021) and (Alogoskoufis et al., 2021) see credit risk as the main driver of bank losses induced by climate risk.
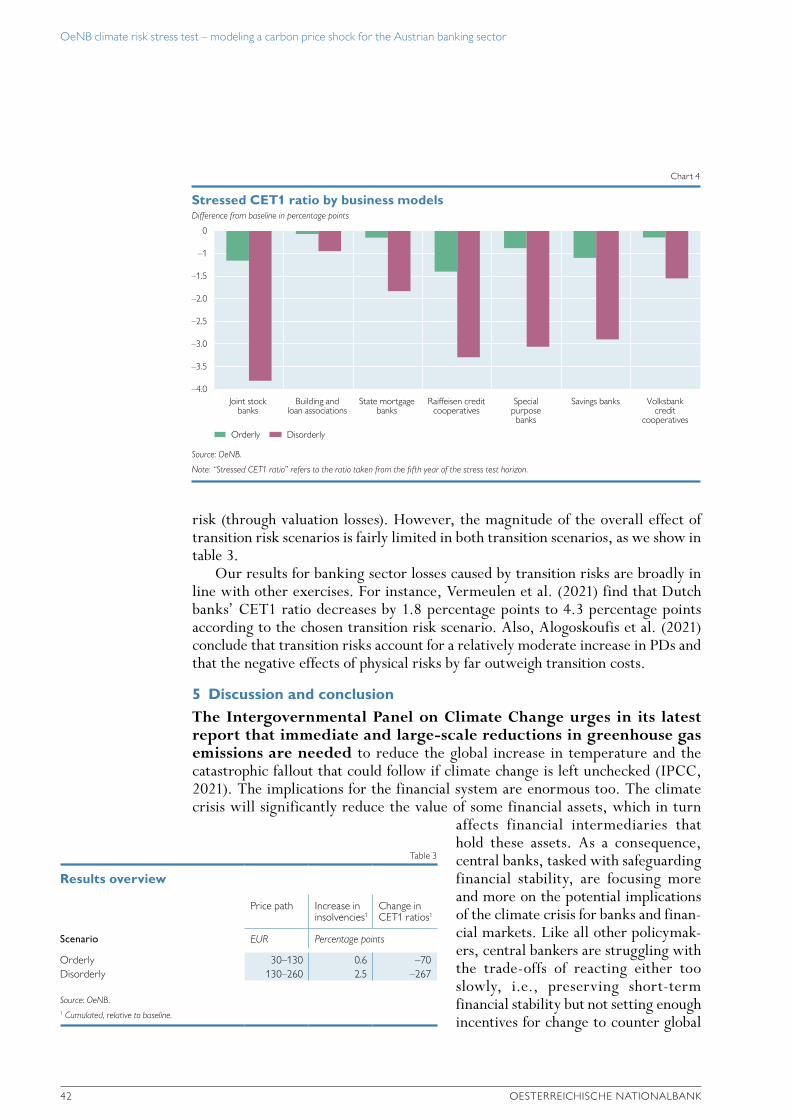
OeNB climate risk stress test – modeling a carbon price shock for the Austrian banking sector
42 OESTERREICHISCHE NATIONALBANK
risk (through valuation losses). However, the magnitude of the overall effect of transition risk scenarios is fairly limited in both transition scenarios, as we show in table 3.
Our results for banking sector losses caused by transition risks are broadly in line with other exercises. For instance, Vermeulen et al. (2021) find that Dutch banks’ CET1 ratio decreases by 1.8 percentage points to 4.3 percentage points according to the chosen transition risk scenario. Also, Alogoskoufis et al. (2021) conclude that transition risks account for a relatively moderate increase in PDs and that the negative effects of physical risks by far outweigh transition costs.
5 Discussion and conclusionThe Intergovernmental Panel on Climate Change urges in its latest report that immediate and large-scale reductions in greenhouse gas emissions are needed to reduce the global increase in temperature and the catastrophic fallout that could follow if climate change is left unchecked (IPCC, 2021). The implications for the financial system are enormous too. The climate crisis will significantly reduce the value of some financial assets, which in turn
affects financial intermediaries that hold these assets. As a consequence, central banks, tasked with safeguarding financial stability, are focusing more and more on the potential implications of the climate crisis for banks and finan-cial markets. Like all other policymak-ers, central bankers are struggling with the trade-offs of reacting either too slowly, i.e., preserving short-term financial stability but not setting enough incentives for change to counter global
Table 3
Results overview
Price path Increase in insolvencies1
Change in CET1 ratios1
Scenario EUR Percentage points
Orderly 30–130 0.6 –70Disorderly 130–260 2.5 –267
Source: OeNB.1 Cumulated, relative to baseline.
Difference from baseline in percentage points
0
–1
–1.5
–2.0
–2.5
–3.0
–3.5
–4.0
Stressed CET1 ratio by business models
Chart 4
Source: OeNB.
Note: “Stressed CET1 ratio” refers to the ratio taken from the fifth year of the stress test horizon.
Orderly Disorderly
Joint stockbanks
Building andloan associations
State mortgagebanks
Raiffeisen creditcooperatives
Specialpurpose
banks
Savings banks Volksbankcredit
cooperatives

OeNB climate risk stress test – modeling a carbon price shock for the Austrian banking sector
FINANCIAL STABILITY REPORT 42 – NOVEMBER 2021 43
warming or too fast, i.e., addressing global warming but putting undue strain on banks’ balance sheets and capitalization levels.
The OeNB was one of the first central banks to contribute to this research area by assessing the share of Austrian banks’ exposure to economic sectors that are particularly affected by climate transition risks (Battiston et al., 2020). In the current paper, we assess the impact of carbon pricing – one of the main policy instruments to counter global warming – on the Austrian banking system. To this end, we extend our previous work with a simple and consistent approach to quantify transitional risk costs for the Austrian banking system in two five-year scenarios, one assuming an orderly and the other a disorderly introduction of carbon pricing. By extending the framework of the OeNB’s top-down stress testing infrastructure ARNIE, we are able to calculate the impact stemming mainly from credit risk losses on the aggregate banking system as well as on 379 individual banks.
It should be noted that our modeling approach rests on a set of simplifying assumptions. First, the chosen input-output analysis framework implies that certain aspects have a substantial impact on the results. Most promi-nently, our results indicate that the insolvency rates are more sensitive to cost changes than to turnover changes. Furthermore, the results of the input-output model are sensitive to price elasticity assumptions. Therefore, a careful calibration of the pass-through rates and elasticities in the sectoral carbon price model is key for producing meaningful results.
Second, the deployed models operate in a static environment – the sectoral carbon price model implies a static economy and both, the OeNB’s insolvency model as well as ARNIE, are based on static balance sheet assumptions. This implies that our results exclude potential mitigating realignments of the economy and behavioral reactions of banks over the stress horizon. Introducing dynamic components will be a key part of future advancements in the field of stress testing in general and for climate-related stress tests in particular, as they allow us to produce more realistic results and study the impact of potential feedback effects.
Third, given the restriction of the time horizon owing to the static nature of our framework, physical risks are entirely disregarded in this exercise. Given the current state of climate research, such risks will materialize in the medium to long term if the climate crisis remains unaddressed. Hence, if such risks should be modelled, the dynamic interactions between climate scenarios, underlying macro-economic assumptions and banks’ balance sheets must be included. Moreover, granular information on climate-relevant data (e.g. emissions intensity) is not available in a consistent manner. Therefore, we conduct a sectoral rather than a firm-by-firm analysis, which, by design, may distort results when mapped to individual bank portfolios. Data gaps also drive the assumptions regarding the linking equations that map Austrian default probabilities to other countries. Our fairly simplistic extrapolation implies that the inherent dynamics driving the default probabilities in Austria are replicated for other countries.
These caveats notwithstanding, our results indicate that the impact of both the orderly and the disorderly introduction of a carbon pricing scheme is manageable for the Austrian banking system. While the impact is heterogeneous across economic sectors, it is most pronounced for the sectors H (transporting and storage) and A (agriculture), and the share of the most impacted

OeNB climate risk stress test – modeling a carbon price shock for the Austrian banking sector
44 OESTERREICHISCHE NATIONALBANK
sectors is relatively small compared to Austrian banks’ overall exposure. Hence, policy measures such as a carbon emissions tax to guide the transition of the Austrian economy toward an ecologically sustainable trajectory will certainly create additional costs for the banking system.
However, our results suggest that the Austrian financial system is well placed to withstand the indirect effects of measures to fight the climate crisis thanks to banks’ favorable initial capitalization levels. Despite diverging approaches and scenarios, other exercises that have been conducted lately come to similar conclusions. Less intrusive policies than the one modeled in our scenarios obviously entail lower costs in the short term, but continued inaction might eventually result in an even higher impact than anticipated now in the medium to long term.
To conclude, we strongly believe that in light of the climate crisis, a granular, micro-founded analysis of climate risks is warranted. Addressing the caveats above by including more granular data and the introduction of more dynamic elements in exercises such as this will hopefully provide further certainty on the impact of climate risks on the Austrian financial system in the future and confirm that Austrian banks are in a position to support the greening of the economy.
ReferencesAllen, T., S. Dees, J. Boissinot, C. M. Caicedo Graciano, V. Chouard, L. Clerc, L., A.
de Gaye, A. Devulder, S. Diot, N. Lisack, F. Pegoraro, M. Rabaté, R. Svartzman and L. Vernet. 2020. Climate-Related Scenarios for Financial Stability Assessment: An Application to France. Working Paper Series no. 774. Banque de France.
Alogoskoufis, S., N. Dunz, T. Emambakhsh, T. Hennig, M. Kaijser, C. Kouratzoglou, M. A. Muñoz, L. Parisi and C. Salleo. 2021. ECB economy-wide climate stress test. ECB Occasional Paper Series. No. 281. September.
Bank of England. 2019. The 2021 biennial exploratory scenario on the financial risks from climate change. Discussion Paper. December.
Basel Committee on Banking Supervision. 2005. An Explanatory Note on the Basel II IRB Risk Weight Functions. https://www.bis.org/bcbs/irbriskweight.pdf
Battiston, S., M. Guth, I. Monasterolo, B. Neudorfer and W. Pointner. 2020. Austrian banks’ exposure to climate-related transition risk. In: Financial Stability Report 40. OeNB. 31–44.
EBA. 2018. Guidelines on institutions’ stress testing. EBA/GL/2018/04. July.EBA. 2020. 2021 EU-Wide Stress Test – Methodological Note. November.ECB. 2021. Climate-related risk and financial stability. ECB/ESRB Project Team on climate risk
Monitoring. July.E-Control. 2020. Stromkennzeichnungsbericht 2020. https://www.e-control.at/documents/-
1785851/1811582/E-Control-Stromkennzeichnungsbericht-2020.pdfEuropean Commission. 2018. Explanatory note accompanying the proposal for the revision of
the Emission Trading System Guidelines. https://ec.europa.eu/competition/consultations/2020_ets_stateaid_guidelines/explanatory_note_en.pdf
European Commission. 2021. Proposal for a REGULATION OF THE EUROPEAN PARLIAMENT AND OF THE COUNCIL establishing a carbon border adjustment mechanism, https://eur-lex.europa.eu/legal-content/EN/TXT/HTML/?uri=CELEX:52021PC0564&from=EN
Eurostat. 2008. Eurostat Manual of Supply, Use and Input-Output Tables https://ec.europa.eu/eurostat/web/products-manuals-and-guidelines/-/KS-RA-07-013

OeNB climate risk stress test – modeling a carbon price shock for the Austrian banking sector
FINANCIAL STABILITY REPORT 42 – NOVEMBER 2021 45
Feldkircher, M., G. Fenz, R. Ferstl, G. Krenn, B. Neudorfer, C. Puhr, T. Reininger, S. W. Schmitz, M. Schneider, C. Siebenbrunner, M. Sigmund and R. Spitzer. 2013. ARNIE in Action: The 2013 FSAP Stress Tests for the Austrian Banking System. In: Financial Stability Report 26. OeNB. 100–118.
Fenz, G. and M. Spitzer. 2005. AQM. The Austrian Quarterly Model of the Oesterreichische Nationalbank. Working Paper 104. OeNB.
Gonne, N. 2016. Assessing the Impact of Carbon Taxation on Sectoral Competitiveness: The Case of Belgium. In: Reflets et Perspectives de la Vie Économique LV (2). June. 27 – 40. https://www.cairn.info/revue-reflets-et-perspectives-de-la-vie-economique-2016-2-page-27.htm
Grainger, C. A. and C. D. Kolstad. 2010. Who Pays a Price on Carbon? In: Environ Resource Econ 46. 359–376
Guth, M., C. Lipp, C. Puhr and M. Schneider. 2020. Modeling the COVID-19 effects on the Austrian economy and banking system. In: Financial Stability Report 40. OeNB. 63–86.
Hebbink, G., L. Berkvens, M. Bun, H. van Kerkhoff, J. Koistinen, G. Schotten and A. Stokman. 2018. The price of transition – an analysis of the economic implications of carbon taxing. Occasional Studies Volume 16-8. De Nederlandsche Bank.
IPCC. 2020. The concept of risk in the IPCC Sixth Assessment Report: a summary of cross-Working Group discussions. Guidance for IPCC authors. September.
IPCC. 2021. Climate Change 2021: The Physical Science Basis. Contribution of Working Group I to the Sixth Assessment Report of the Intergovernmental Panel on Climate Change. Cambridge University Press. Forthcoming.
Kirchner, M., M. Sommer, C. Kettner-Marx, D. Kletzan-Slamanig, K. Köberl and K. Kratena. 2018. CO2 Tax Scenarios for Austria. Impacts on Household Income Groups, CO2 Emissions, and the Economy. WIFO Working Papers (558). WIFO. Vienna.
Leibrecht, M. and M. Schneider. 2006. AQM-06: The Macro economic Model of the OeNB. Working Paper 132. OeNB.
Miller, R. E. and P. D. Blair. 2009. Input–Output Analysis. Foundations and Extensions. 2nd. Cambridge University Press.
National Bank of Romania. 2019. Special feature. Climate risks. Implications for financial stability. In: Financial Stability Report December 2019.
NGFS. 2021. NGFS Climate Scenarios for central banks and supervisors. https://www.ngfs.net/sites/default/files/media/2021/08/27/ngfs_climate_scenarios_phase2_june2021.pdf
Owen, A. 2017. Techniques for Evaluating the Differences in Multiregional Input-Output Data-bases. A Comparative Evaluation of CO2 Consumption-Based Accounts Calculated Using Eora, GTAP and WIOD. Springer.
Perese, K. 2010. Input-Output Model Analysis: Pricing Carbon Dioxide Emissions. Working Paper 2010-04. Congressional Budget Office. Washington, D.C.
Puhr, C. and M. Schneider. 2021. Have mitigating measures helped prevent insolvencies in Austria amid the COVID-19 pandemic? In: Monetary Policy and the Economy Q4/20 – Q1/21. OeNB. 77–110.
Timilsinas, G. R. 2018. Where Is the Carbon Tax after Thirty Years of Research? Policy Research Working Paper No. 8493. World Bank. Washington, D.C.
Vermeulen, R., E. Schets, M. Lohuis, B. Kölbl, D. J. Jansen and W. Heeringa. 2021. The heat is on: A framework for measuring financial stress under disruptive energy transition scenarios. Ecological Economics, 190, 107205.


FINANCIAL STABILITY REPORT 42 – NOVEMBER 2021 47
Identifying banks with significant negative effects on financial stability in systemic shock scenarios
Judith Eidenberger, Katharina Steiner1
We present a method that allows us to assess the effects on financial stability caused by banks exiting the market in a system-wide stress event based on a consistent and conclusive systemic stress scenario. The method fills a gap in the OeNB’s toolkit for assessing the financial stability effects of idiosyncratic and systemic bank failures (a method for an idiosyncratic scenario was developed in 2019). The outlined method follows a multistep approach. It is based on the idea that banks that are vulnerable and exposed to a shock get into trouble simultaneously and might even need to exit the market at the same time. In the first step, we define economic and financial shock scenarios. In the second step, we identify banks that are highly exposed to these shocks and are likely to default. The third step considers any potential mitigating (or amplifying) effects on banks’ solvency stemming from their membership in an institutional protection scheme (IPS). In the fourth and last step, we identify those banks whose exit causes marginal negative effects on the financial system in the system-wide event. Knowledge about the consequences of banks’ simultaneous failure for the financial system provides fundamental input for f inancial stability analysis, which, in turn, feeds into macroprudential supervision, crisis prevention, crisis management as well as deposit guarantee schemes. For this reason, Austria pursues an integrated approach in order to ensure overall consistency.
JEL classification: G18, G21, H81Keywords: financial stability, macroprudential supervision, resolution, systemically important banks, systemic scenario
Macroprudential policy aims to identify and mitigate systemic risk.2 One of its main tools is systemic scenario analysis to assess financial stability. It allows us not only to identify banks that might be threatened under certain economic circum-stances and financial conditions but also to evaluate the overall financial stability impact of bank failures. The macroprudential buffer regime3 aims at ex ante iden-tifying those banks whose failure might have significant negative effects on financial stability.
The general financial stability impact is also a core element of resolution planning and decision-making, which addresses this issue by assessing the resolution objective “avoidance of significant negative effects on financial stability.”4
This paper outlines a methodology to assess potential marginal effects of banks’ market exits in a hypothetical case of multiple bank failures due to a systemic
1 Oesterreichische Nationalbank, Financial Stability and Macroprudential Supervision Division, [email protected] and [email protected]. Opinions expressed by the authors of studies do not necessarily reflect the official viewpoint of the OeNB or the Eurosystem. The authors would like to thank Stefan Schmitz (OeNB) for helpful comments and valuable suggestions.
2 For more details on the goals and instruments of macroprudential policy, see European Systemic Risk Board (2018) or Eidenberger et al. (2014).
3 Set out in the Austrian Banking Act.4 In Austria, recovery and resolution are set out in the Bank Recovery and Resolution Act (Bundesgesetz über die
Sanierung und Abwicklung von Banken, BaSAG).

Identifying banks with significant negative effects on financial stability in systemic shock scenarios
48 OESTERREICHISCHE NATIONALBANK
event, thereby closing an important gap in financial stability analysis: the need to identify systemically important banks in a system-wide economic or financial event rather than just in an idiosyncratic (shock) scenario.
This paper is structured as follows: Section 1 discusses the integrated approach under which financial stability questions are analyzed in a consistent way. Section 2 outlines the role of systemic scenario analysis in closing the methodological gap of identifying systemically important banks. Section 3 shows an example of the multi-step approach, and section 4 concludes.
1 Financial stability issues captured in an integrated approachIn recent years, a number of new regulations and instruments have been imple-mented to foster financial stability by addressing negative financial stability effects of banks’ failures and to minimize the too-big-to-fail problem: the global systemi-cally important banks (GSIB5) and other systemically important institutions (O-SII6) buffers, the systemic risk buffer and other macroprudential tools as well as the Bank Recovery and Resolution Directive (BRRD, Directive 2014/59/EU). This framework requires, inter alia, that supervisors proactively identify banks that have the potential to cause negative financial stability7 effects. This require-ment makes it possible that supervisors (re)act in a timely manner and a bank can exit the market in an orderly way.
The potential impact of banks’ market exits on financial stability is fundamental not only for macroprudential supervision but also a key element of ex ante crisis prevention (including resolution planning) and ex post crisis management.8 Further-more, a risk-mitigating deposit guarantee scheme should be designed in a way that prevents contagious financial stability impacts.9
The identification as O-SII has wide-ranging implications for a bank. First, a systemically important bank is more likely to be resolved than to just be sent into insolvency. Consequently, it must have in place a comprehensive resolution plan, which implies higher operational costs. In addition, regulatory requirements (in terms of minimum capital and MREL10 requirements) are higher than for other banks. Hence, the identification of a bank as systemically important must rest on sound foundations to justify such interventions into property rights.
The “financial stability diamond” depicted in figure 1 illustrates the key elements of financial stability analysis and how they relate to each other. An efficient framework has to ensure consistency between macroprudential regulation, the resolution regime and the deposit guarantee scheme. For regulators, the interplay of measures in these areas is essential. A key question in all of these policy areas is: Which bank is systemically important to such a degree so that its failure causes significant adverse negative effects on financial stability, and which bank is there-fore of public interest?
5 Basel Committee on Banking Supervision (2013).6 European Banking Authority (2014).7 However, the BRRD does not provide a definition of the term “ financial stability.”8 Single Resolution Board (2019).9 Schmitz and Eidenberger (2021).10 MREL stands for minimum requirement for own funds and eligible liabilities.

Identifying banks with significant negative effects on financial stability in systemic shock scenarios
FINANCIAL STABILITY REPORT 42 – NOVEMBER 2021 49
In Austria, the OeNB follows an integrated approach: For example, the Austrian macroprudential buffer re-gime ensures consistency between crisis prevention and management as the calibration of the systemic risk buffer explicitly considers the two contagion risk channels: funding cost shocks due to stress at an Austrian bank and costs emanating from a deposit guarantee scheme event.11 The multistep approach outlined in this paper represents another instrument to foster the integrated approach.
2 Systemic scenario analysis to identify systemically important banks
A bank might fail either for idiosyncratic reasons or because it is affected by a systemic economic and/or financial shock, both of which may have significant negative implications for financial stability.
The regulatory framework includes guidelines on indicators that can be analyzed to capture financial stability effects but lacks explicit thresholds for individual indicators. This is a drawback for banking systems with a large number of banks, like the Austrian one. Eidenberger et al. (2019) presents a methodology for selecting banks for resolution planning based on the idiosyncratic risks banks pose to the financial system. The thresholds derived from the OeNB approach make it possible to deal with many banks in a consistent and comprehensible way based on the idea of substitutability: If market activities of a failing bank can be substituted by other market participants, financial stability will less likely be at risk. The threshold approach considers more than 20 indicators for the criteria economic importance as well as direct and indirect contagion. As a result, each bank’s financial stability impact is classified as high, medium-high, medium-low or low (these four financial stability impact categories are prescribed by the European Single Resolution Board, SRB).12 The Austrian threshold method mainly focuses on idiosyncratic shock scenarios. In this paper, we develop this method further by identifying banks commonly affected by systemic shocks.
In 2021, the SRB published its “Addendum to the Public Interest Assessment: SRB Approach,” in which it clarified that it will consider “system-wide events in resolution planning by assuming that the failure of a bank takes place in a situation where the rest of the banking system is affected by an adverse scenario.”13 Unfor-tunately, the SRB is not very explicit on the underlying method. The main concept of the SRB’s method is to consider a general capital depletion of the banking system
11 OeNB (2019).12 Banks with a high or medium-high impact are classified as being of public interest or systemically important,
respectively.13 Single Resolution Board (2021).
Financial stability diamond
Figure 1
Source: OeNB.
Macroprudential supervision
Depositguarantee scheme
Ex post crisismanagement
Ex ante crisisprevention

Identifying banks with significant negative effects on financial stability in systemic shock scenarios
50 OESTERREICHISCHE NATIONALBANK
in line with the outcome of the stress test. The national implementation, especially for less significant institutions (LSIs), rests with national resolution authorities (NRAs) and national competent authorities (NCAs).
The systemic scenario method14 outlined in this paper on the one hand seizes the idea of general capital depletion due to a systemic adverse scenario and, on the other hand, connects with the national idiosyncratic threshold approach as it makes it possible to assess the marginal effects of all banks on financial stability.
3 The multistep approach to systemic scenario analysisGiven the two major difficulties we are faced with in developing the method – (1) an unlimited number of potential scenarios and (2) an infinite number of potential combinations of failing banks – we chose a multistep approach. We address the first difficulty by aiming to provide for a sound conceptual foundation for the design of consistent and meaningful scenarios. To address the second difficulty, we aim to ensure a consistent framework by selecting systemically important banks not arbitrarily but based on their marginal impact on financial stability. Figure 2 illustrates the four steps that provide the basis for this comprehensible and consistent method.
In the first step, we define the shock scenario. The idea is that the shock causes a rise in insolvencies, partly connected with higher unemployment rates, which affect banks’ balance sheets via the credit risk channel. (The COVID-19 shock on the real economy is a recent example of a scenario analyzed for macroprudential
14 Besides scenario analysis, we also tested a cluster approach. A cluster approach – like the scenario analysis – has the advantage of considering that banks are exposed to risks in different ways. But the heterogeneity of banks’ exposure to risk persists within the different clusters. Therefore, we did not follow through with this approach.
Scenario approach: multistep procedure for the systemic scenario
Figure 2
Source: OeNB.
Definition of shock scenarios
Selection of exposed and vulnerable banks
Assessment of cumulative and marginal effects on financial stability
Capital marketshock
Real estateshock External
shock
Shock to thereal economy
Loss-sharing agreements as potential safety net
1
2
3
4

Identifying banks with significant negative effects on financial stability in systemic shock scenarios
FINANCIAL STABILITY REPORT 42 – NOVEMBER 2021 51
policy considerations at the OeNB.) For banks, the shock leads to write-downs, higher loan loss provisions and rising nonperforming loans (NPLs). Ultimately, banks’ capital could be depleted. A wide range of potential risk channels and, therefore, economic and financial shock scenarios need to be covered. For a general financial stability analysis, we consider the following plausible scenarios for Austria (for other countries, different scenarios may be appropriate): (1) a shock to the real economy, (2) a real estate shock, (3) a capital market shock and (4) an external shock.
In the second step, we identify the most exposed and vulnerable banks on the basis of the shock scenarios.15 Given that sound and well capitalized banks are not a threat to financial stability even if they are highly exposed to a shock scenario, we include the criterion “financial vulnerability,” combining four dimensions of vulnerability: (1) market view, (2) supervisory view, (3) capital view and (4) focus banks, i.e. banks which are currently under special supervisory monitoring.1. The market view displays banks’ ratings. It considers the OeNB’s consensus
rating (the OeNB has developed, and maintains, bank rating methods that can quantify the probability of default (PD) of an individual bank). The main advantage of this indicator is that it directly links ratings and PDs. As a rating is not available or robust for all banks, the market view is complemented by the other views.
2. The supervisory view is based on the OeNB’s Austrian Banking Business Analysis (ABBA) score. This model uses a set of a bank’s specific risk indicators to assess the riskiness of banks.16 The selection of vulnerable banks is based on the idea that banks with lower scores are more likely to default in a systemic shock.
3. Banks’ capital is also taken into account to ensure that banks with low capital-ization are included regardless of their rating and ABBA score.
4. It can be assumed that banks which are currently under special supervisory monitoring are more likely to default in case of a systemic shock. Hence, these focus banks are also included in the vulnerability assessment.
Overall, a bank can be classified as vulnerable if the relevant measure under one of these four dimensions reaches a certain level. After the second step, we have a list of banks that are highly exposed to one of the four shocks mentioned above and vulnerable at the same time.
In the third step, a specific characteristic of the Austrian banking system comes into play: loss-sharing agreements like institutional protection schemes (IPS). The three largest banking sectors in Austria have a sectoral loss-sharing agreement in place which should lower the probability of individual bank failures. To reflect this, highly exposed and vulnerable banks whose failure can be prevented by a loss-sharing agreement17 are of less relevance in our model.
In the fourth step, the cumulative and marginal effects are assessed as illustrated in figure 3. All in all, the effects on financial stability are derived from a potential simultaneous market exit of those exposed to one of the shocks and vulnerable banks – after considering any potential mitigating effects stemming from
15 Based on the free capital above early intervention and therefore reasonable NPLs, a threshold as a percentage of total assets is defined for each shock scenario. This allows us to identify the banks exposed to the shock.
16 The output of these models can help microprudential supervisors to prioritize their resources and to identify potentially problematic banks at an early stage. For a general overview, see Fedesin and Resch (2012).
17 Loss-sharing agreement- or IPS-simulation tools are used to assess the absorption capacity.
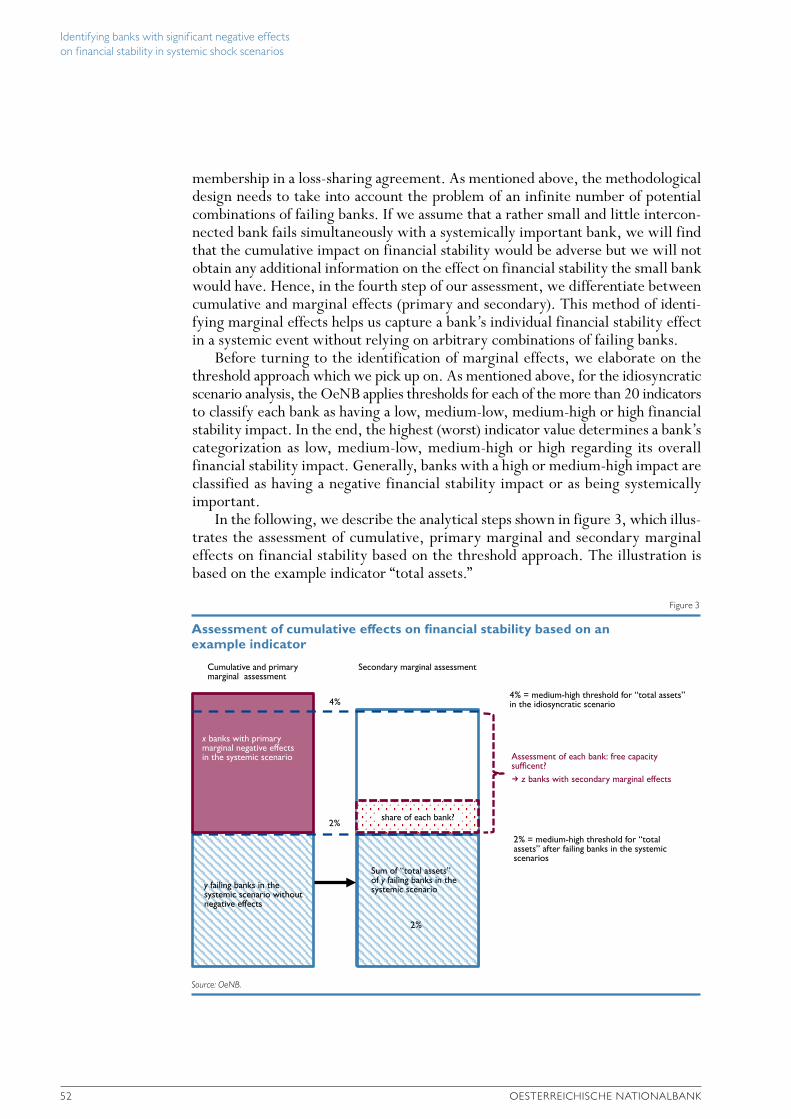
Identifying banks with significant negative effects on financial stability in systemic shock scenarios
52 OESTERREICHISCHE NATIONALBANK
membership in a loss-sharing agreement. As mentioned above, the methodological design needs to take into account the problem of an infinite number of potential combinations of failing banks. If we assume that a rather small and little intercon-nected bank fails simultaneously with a systemically important bank, we will find that the cumulative impact on financial stability would be adverse but we will not obtain any additional information on the effect on financial stability the small bank would have. Hence, in the fourth step of our assessment, we differentiate between cumulative and marginal effects (primary and secondary). This method of identi-fying marginal effects helps us capture a bank’s individual financial stability effect in a systemic event without relying on arbitrary combinations of failing banks.
Before turning to the identification of marginal effects, we elaborate on the threshold approach which we pick up on. As mentioned above, for the idiosyncratic scenario analysis, the OeNB applies thresholds for each of the more than 20 indicators to classify each bank as having a low, medium-low, medium-high or high financial stability impact. In the end, the highest (worst) indicator value determines a bank’s categorization as low, medium-low, medium-high or high regarding its overall financial stability impact. Generally, banks with a high or medium-high impact are classified as having a negative financial stability impact or as being systemically important.
In the following, we describe the analytical steps shown in figure 3, which illus-trates the assessment of cumulative, primary marginal and secondary marginal effects on financial stability based on the threshold approach. The illustration is based on the example indicator “total assets.”
Assessment of cumulative effects on financial stability based on an example indicator
Figure 3
Source: OeNB.
4% = medium-high threshold for “total assets” in the idiosyncratic scenario
?
Sum of “total assets” of y failing banks in the systemic scenario
x banks with primary marginal negative effects in the systemic scenario
Cumulative and primary marginal assessment
Secondary marginal assessment
y failing banks in the systemic scenario without negative effects
4%
2%
2%
Assessment of each bank: free capacity sufficent?k z banks with secondary marginal effects
2% = medium-high threshold for “total assets” after failing banks in the systemic scenarios
share of each bank?

Identifying banks with significant negative effects on financial stability in systemic shock scenarios
FINANCIAL STABILITY REPORT 42 – NOVEMBER 2021 53
First, we cumulate the identified banks into one fictitious bank along various bank indicators18 which are taken from the idiosyncratic scenario analysis to obtain a cumulative effect on financial stability, which is classified as high, medium-high, medium-low or low in analogy to the idiosyncratic scenario. Figure 3 shows an indicator (here: total assets) with a medium-high threshold of 4%19 in the idiosyncratic scenario. In this example, the cumulative bank’s share of total assets (represented by the left bar) exceeds the 4% threshold. As the cumulative impact is high or medium- high, the collective failing of these (aggregated) banks would cause a severe negative financial stability impact.20
As a result, any other bank that exits the market simultaneously with those cumulatively failing banks would be assessed (potentially unjustifiably so) as having a significant negative effect on financial stability. Thus, the relevant question is: which banks have a significant marginal negative impact? In our example, the question would be: which banks’ individual impact drives the cumulative impact above the 4% threshold? A way of identifying these banks is to look at the O-SII score. The O-SII score represents the systemic riskiness of a bank21 and therefore is a suitable aggregated indicator for selecting the banks with the largest impact (those with a marginal negative impact). Beginning with the bank with the highest O-SII score, we subtract banks along the O-SII score ranking until the cumulated fictitious bank’s financial stability impact falls to medium-low. In the example, an x number of banks would be identified as having (primary) marginal negative effects in a system-wide event based on the O-SII score ranking (represented by the purple area of the first bar). A y number of banks could exit the market without affecting financial stability (see the light blue area of the first bar). The total assets of these failing banks sum up to 2% in this example and are therefore of less concern to financial stability.
In the next stage, we look at secondary marginal effects. This method allows a consistent impact evaluation of any bank’s market exit in a systemic event. This is specifically relevant for a banking system with a large number of banks, like Austria’s. The question is: what are the effects of an additional failing bank leaving the market together with this y number of banks (the light blue area in the first bar equaling that of the second bar)? We know that the y failing banks together account for an aggregate share of 2% of total assets. This leaves a free capacity of 2%22 (illustrated by the white area of the right bar in the figure) up to the 4% medium- high threshold. Next we test each bank if the free capacity is sufficient to accom-modate its failure. In our example, we test if the purple dotted area (whose magnitude
18 Those indicators (out of those 20+ idiosyncratic indicators) for which a simple aggregation is not meaning ful (e.g., network indicators) are neglected.
19 The 4% threshold is an example; in practice, the threshold should be consistent with the medium-high threshold for the total assets indicator used in the idiosyncratic scenario. In Austria, the indicator is determined by the threshold approach already mentioned based on the substitutability capacity.
20 If the cumulative impact is medium-low or low, the collective failing of these banks would probably not cause a severe negative impact on financial stability; these banks should be able to exit the market collectively without causing financial stability repercussions even in a systemic event.
21 In line with the methodology set out in the EBA Guidelines, a set of criteria and indicators needs to be analyzed. The national assessment can be extended by other quantitative or qualitative factors. For more details on the O-SII score methodology, see European Banking Authority (2014).
22 The free capacity (the white area of the second bar above the light blue area) amounts to the remaining share of 2%: threshold of 4% minus the 2% used by the y number of banks equals 2% free capacity.

Identifying banks with significant negative effects on financial stability in systemic shock scenarios
54 OESTERREICHISCHE NATIONALBANK
depends on the bank’s total assets) is smaller or larger than the white area. If the bank’s share of total assets exceeds the free capacity (the purple dotted area is larger than the white area and therefore exceeds the 4% threshold), the bank will be identified as potentially having secondary marginal effects on financial stability. All z banks with a share of total assets of more than 2% in that example would be identified as having secondary marginal effects on financial stability.
This logic of calculating the free capacity is applied not only to the indicator “total assets” but to all those original indicators which are suitable for a systemic scenario. Thus, all banks are tested against the free capacity of each of these indicators. As a result, we can identify banks with potentially secondary marginal negative effects.23
To sum up, we identify those banks whose market exit has significant primary and secondary marginal negative effects on financial stability in a systemic scenario. In our example, all x and z banks would have financial stability effects in a system- wide event.24
4 ConclusionEach bank’s complexity and system-wide interconnectedness is of special interest from a financial stability perspective, particularly in times of systemic stress. In this paper, we present a method that closes a methodological gap by providing a tool for identifying banks commonly affected by systemic shocks. It assesses the impact of an individual bank’s market exit on financial stability in a system-wide event when several banks are affected by a shock at the same time. The definition and financial stability assessment of systemic scenarios are a fundamental part of macro prudential analysis, crisis prevention, crisis management and deposit guar-antee schemes. Thus, our method adds to the integrated Austrian approach to safe-guarding financial stability, which applies similar methodologies among these policy fields ensuring synergies and consistency.
The outlined method fills a gap in that it makes it possible to design a systemic scenario on the one hand and to evaluate each bank’s marginal financial stability impact in such a system-wide event on the other hand. This comprehensible and data-based method should be sufficiently economically and legally robust in order to allow interventions into property rights in terms of regulatory requirements.
23 In order not to discriminate between banks causing secondary or primary marginal effects, a robustness check is conducted. Ideally, all z banks should be systemically more important than the y banks which are assumed of not having marginal negative effects.
24 For IPS member banks, the IPSs could be tested as to whether they are capable of absorbing these banks’ failures; if yes, the failure of these banks might not endanger financial stability in a system-wide event.

Identifying banks with significant negative effects on financial stability in systemic shock scenarios
FINANCIAL STABILITY REPORT 42 – NOVEMBER 2021 55
References
Basel Committee on Banking Supervision. 2013. Global systemically important banks: updated assessment methodology and the higher loss absorbency requirement. https://www.bis.org/publ/bcbs255.pdf.
Eidenberger, J., D. Liebeg, S. W. Schmitz, R. Seliger, M. Sigmund, K. Steiner, P. Strobl and E. Ubl. 2014. Macroprudential Supervision: A Key Lesson from the Financial Crisis. In: Financial Stability Report 27. OeNB. 83–94.
Eidenberger, J., V. Redak and E. Ubl. 2019. Who puts our financial system at risk? A method-ological approach to identify banks with potential significant negative effects on financial stability. In: Financial Stability Report 37. OeNB. 57–72.
European Banking Authority. 2014. Guidelines on the criteria to determine the conditions of application of Article 131(3) of Directive 2013/36/EU (CRD) in relation to the assessment of other systemically important institutions (O-SIIs). EBA/GL/2014/10. December 16. https://eba.europa.eu/documents/10180/930752/EBA-GL-2014-10+%28Guidelines+on+O-SIIs+Assess-ment%29.pdf/964fa8c7-6f7c-431a-8c34-82d42d112d91.
European Systemic Risk Board. 2018. The ESRB handbook on operationalising macroprudential policy in the banking sector.
Fedesin, M. and F. Resch. 2012. Neugestaltung der ABBA-Modelllandschaft. In: Statistiken – Daten und Analysen Q3/12. OeNB. 64–70.
OeNB. 2019. Financial Stability Report 37.Schmitz, S. W. and J. Eidenberger. 2021. Einlagensicherung und Finanzmarktstabilität.
In: Einlagensicherung. Rauscher, Nicolas and Stern, Thomas (eds.). Vienna: Linde-Verlag. 75–104.Single Resolution Board. 2019. Public Interest Assessment: SRB Approach. https://www.srb.
europa.eu/en/system/files?file=media/document/2019-06-28_draft_pia_paper_v12.pdf.Single Resolution Board. 2021. Addendum to the Public Interest Assessment: SRB Approach.
https://www.srb.europa.eu/system/files/media/document/2021-05-29_srb_addendum_to_pub-lic_interest_assessment.pdf.


FINANCIAL STABILITY REPORT 42 – NOVEMBER 2021 57
Nonbank financial intermediation in Austria – an update
Alexandra Schober-Rhomberg, Alexander Trachta, Matthias Wicho1
Nonbank finance, which complements bank finance, increases competition in the supply of financing and supports economic activity. It may, however, also give rise to systemic risk, both directly and indirectly through interconnections with the banking system. The latter may be the case when nonbank finance involves activities that are typically performed by banks, such as maturity or liquidity transformation and the creation of leverage. Worldwide, and also in the EU, the relative importance of nonbank f inance has increased noticeably since the great financial crisis. In Austria, the financial system is still dominated by the bank finance model, however. Since 2018, the relative composition of the nonbank finance sector has remained unchanged in Austria. Neither the structure nor the size of nonbank financial intermediation in Austria is currently considered to pose a threat to the stability of the Austrian financial market.
JEL classification: G23Keywords: nonbank finance, nonbank financial intermediation, nonbank financial institutions, investment funds, insurance corporations, pension funds, other financial institutions, finance leasing, systemic risk, financial stability
Today, traditional banks are perceived to be safer and sounder than before the great financial crisis of 2008, which is due to improved regulation and supervision. But since then asset volumes in markets of nonbank financial intermediation have grown markedly in size, both in absolute terms and compared with the assets of the banking sector. Nonbank financial institutions have assumed business activities from banks, including credit intermediation and purchases of debt securities, and nonbank finance has become an increasingly important source of funding for the real economy worldwide. In light of EU policies to further deepen financial integration (European Commission, 2020), the importance of nonbank finance is expected to increase further also in Europe (Schnabel, 2021). While bank loans clearly remain the dominant debt instrument for corporate finance in the euro area, corporate bonds have become more relevant since the global financial crisis, with their volume having more than doubled relative to that of bank loans. This is anticipated to bring benefits – but also new risks – to those parts of the financial market that are regulated differently than banks.
In the past few years, the supervisory focus has increasingly shifted toward financial intermediation outside the traditional banking sector. This study aims at following up on previous analyses carried out by the OeNB (Wagner et al., 2017; Pöchel et al., 2019), which were inspired by benchmark monitoring exercises regarding nonbank financial intermediation by the Financial Stability Board (FSB) and the European Systemic Risk Board (ESRB). To account for specificities of the
1 Oesterreichische Nationalbank, External Statistics, Financial Accounts and Monetary and Financial Statistics Division, [email protected]; Financial Stability and Macroprudential Supervision Division, [email protected], [email protected]. Opinions expressed by the authors of studies do not necessarily reflect the official viewpoint of the OeNB or the Eurosystem.
Nonbank financial intermediation in Austria – an update
58 OESTERREICHISCHE NATIONALBANK
Austrian financial system, we had to slightly adjust the international monitoring methodology.2
1 Risks and vulnerabilities of nonbank finance Nonbank finance potentially brings benefits to the financial system, such as a greater diversity of funding sources for the economy and increased risk-sharing across the financial system. Both borrowers and investors may benefit from enhanced competition in financing markets. In addition, capital market finance may function as a buffer by stabilizing financing flows of firms in times of shrinking bank credit. However, these developments may also go hand in hand with increased risk taking in potentially less regulated parts of the financial sector and can involve new forms of risks to financial stability. Systemic vulnerabilities may result directly from credit intermediation activities of particular nonbank financial entities, which may involve maturity and liquidity transformation as well as leverage. Furthermore, issues may arise directly and indirectly through the interconnectedness of the nonbank financial intermediation (NBFI) sector with the regular banking system, or from investors’ herding behavior. Other interlinkages such as connections in the repo or securities lending markets might not always be visible from aggregate statistics due to existing data gaps3. In addition, the current low interest rate environment may incentivize procyclicality through higher conformity in investment strategies in the search for yield and might render nonbank financial intermediaries and investors vulnerable to a sudden repricing of risk, which in turn creates scope for bubbles and volatility. Finally, vulnerabilities can build up and remain unnoticed among entities where statistical information is not readily available or not granular enough, e.g. in some parts of the other financial inter-mediaries (OFI) sector.
2 Policy discussionThe COVID-19 pandemic was the first major test for the effectiveness of the regulatory and supervisory reforms put in place after the great financial crisis of 2008. While attesting to the overall resilience of the financial system, the pandemic also highlighted differences in resilience across financial sectors as well as vulnerabilities. Accordingly, it is not only the FSB (2021) that points to the need to step up international cooperation and coordination of policy responses. The ECB (2021a) recently analyzed the implications of shifts in the structure of financial intermediation for monetary policy transmission. While the risk-taking channel operating through nonbanks strengthens the transmission of monetary policy, it may affect nonbanks’ capacity to absorb losses and provide credit to the real economy. In addition, interconnections in the financial system can amplify contagion and impair a smooth transmission of monetary policy in periods of market distress, especially since nonbanks do not benefit from explicit official sector- driven backstops while performing liquidity, maturity and credit transformation.
2 In particular, from the perspective of the Austrian financial system, it makes sense to take the assets of insurance corporations and pension funds into account when analyzing “bank-like activities” of nonbank financial institutions.
3 To learn more about the implementation of detailed reporting, see Regulation (EU) 2015/2365 of the European Parliament and of the Council of 25 November 2015 on transparency of securities financing transactions and of reuse and amending Regulation (EU) No 648/2012.

Nonbank financial intermediation in Austria – an update
FINANCIAL STABILITY REPORT 42 – NOVEMBER 2021 59
Hence, the ECB (2021b) proposes to enhance the macroprudential framework for nonbanks to support financial stability and as a result also the smooth transmission of monetary policy. However, pursuing this avenue warrants further comprehensive analysis that takes into account the systemic relevance and interconnectedness of the heterogeneous NBFI market segments, particularly given investors’ herding behavior. The ESRB (2016), which published its approach to macroprudential policy beyond banking in 2016 already, closely monitors the development of the NBFI sector in the EU, considering also prudential policies to mitigate risks to financial stability (ESRB, 2021). Nevertheless, in the short run, it seems to be most efficient to step up supervision and close microprudential regulatory gaps with a view to addressing distortions in the various NBFI sectors. In Austria, the Financial Market Stability Board (FMSB), which was established to strengthen cooperation in the field of financial market stability and macroprudential supervision, annually investigates potential systemic risks arising from leverage in alternative investment funds and from liquidity transformation in real estate funds. The FMSB (2021) would recommend appropriate mitigating action should the need arise.
3 Nonbank financial intermediation worldwideAt the global level, the Financial Stability Board in 2011 initiated an annual world-wide monitoring exercise to assess global trends and risks from the growing role of NBFI4. According to the FSB, the overall worldwide NBFI sector5, comprising mainly pension funds, insurance corporations and other financial intermediaries, has grown faster than the banking sector over the past decade, including in 2019.6
At year-end 2019, the financial assets of the worldwide NBFI sector, according to the FSB (2020) measurement approach, amounted to USD 200.2 trillion, accounting for 49.5%, and thus nearly half of the total global financial system of approximately USD 404 trillion (figure 1). Ten years earlier, in 2010, the volume of total global financial assets, as measured by the FSB, had stood at about USD 250 trillion, while NBFI assets had amounted to roughly USD 113 trillion, i.e. only 45.2% of the world’s total assets.
In 2019, the narrow measure of NBFI grew by 11.1% to USD 57.1 trillion (2010: USD 29 trillion), making up 14.2% of total global financial assets. The 2019 growth rate even outpaced the average annual growth rate of 7.1% registered in the period 2013–18, which had already been brisk.
4 https://www.fsb.org/work-of-the-fsb/market-and-institutional-resilience/post-2008-financial-crisis-reforms/enhancing- resilience-of-non-bank-financial-intermediation/; data for 2020 were not yet available at the time of the finalization of this study.
5 Since 2018, the FSB has replaced the term “shadow banking” with the neutral term “nonbank financial inter-mediation.”
6 The FSB NBFI Monitor covers 29 jurisdictions that account for roughly 80% of global GDP. https://www.fsb.org/2020/12/global-monitoring-report-on-non-bank-financial-intermediation-2020/

Nonbank financial intermediation in Austria – an update
60 OESTERREICHISCHE NATIONALBANK
4 Nonbank finance in the European context In the EU, the ESRB has been responsible for the macroprudential oversight of the financial system and the prevention of systemic risk since 2011.7 Therefore, the mandate of the ESRB has a wide scope, encompassing credit institutions as well as insurers, asset managers, nonbank financial intermediaries, financial market infra-structures and other financial institutions and markets.
The ESRB (2021) measures the size of the NBFI universe by total assets under management. Its monitoring universe includes all investment funds and OFIs, thus excluding the assets of banks, insurance corporations and pension funds, and central counterparties with a banking license. Because of the withdrawal from the EU of the United Kingdom with its huge financial sector, NBFI assets in the EU declined by 6% from end-2018 to end-2020, dropping from EUR 41.9 trillion to EUR 39.4 trillion. In the euro area, NBFI assets stood at EUR 36.7 trillion in the fourth quarter of 2020, having increased by 9.2% against end-2018 (EUR 33.6 tril-lion). This measure had increased despite the fall of asset values and outflows in some market segments at the beginning of the COVID-19 pandemic in 2020. In 2008, the nonbank sector in the EU amounted to only roughly EUR 23 trillion. After Brexit, five EU member states (Luxembourg, the Netherlands, Ireland, Germany and France) account for 84% of NBFI in the EU. The NBFI volume currently amounts to 53% of the assets of the EU’s overall financial sector, including the European System of Central Banks. At EUR 22.3 trillion, the OFI sector
7 Regulation (EU) No 1092/2010 of the European Parliament and of the Council of 24 November 2010 on European Union macro-prudential oversight of the financial system and establishing a European Systemic Risk Board. OJ L 331, 15.12.2010. 1–11.
Figure 1
Source: FSB (2020, p. 3).
Key terms
• In the FSB methodology, OFIs comprise all financial institutions that are not central banks, banks, insurance corporations, pension funds, public financial institutions or financial auxiliaries. The largest OFI subsectors are investment funds, captive financial institutions and money lenders and broker-dealers.
• “Narrow measure” of nonbank financial inter-mediation includes nonbank financial entity types that authorities have assessed as being involved in credit intermediation activities that may pose bank-like financial stability risks, based on the FSB’s methodology and classification guidance.
Global financial assets by FSB monitoring aggregatesMonitoring aggregates at end-2019
Narrowing down
Total financial assetsUSD 404.1 trillion
NBFIUSD 200.2 trillion
OFIsUSD 123.8 trillion
Narrow measureUSD 57.1 trillion

Nonbank financial intermediation in Austria – an update
FINANCIAL STABILITY REPORT 42 – NOVEMBER 2021 61
remains the largest NBFI sector, followed by investment funds other than money market funds (MMFs) with EUR 14.9 trillion, and MMFs with EUR 1.4 trillion.8 The ESRB does not include insurance companies and pension funds (ICPFs) in the NBFI definition, but the assets of ICPFs in the EU amounted to EUR 13.2 trillion in aggregate, and thus constitute a large part of the financial system.
In its most recent report, the European Securities and Markets Authority (ESMA, 2021) points to risks and vulnerabilities in the EU’s NBFI markets. Amid marked increases in valuations across asset classes, the securities markets regulator flags fragile fundamentals and uncertainty about the sustainability of debt levels as well as rising inflation expectations. It also notes that current market developments need yet to show their sustainability over an extended period.
5 Nonbank financial intermediation in Austria In the past decade, the NBFI sector has gained importance relative to the traditional banking system also in Austria. Banking, however, still accounts for 76% of the overall assets of the Austrian financial system (chart 1). Total assets of the consolidated banking sector decreased by 3.4%, from EUR 1,176 billion (year-end 2008) to EUR 1,136 billion (year-end 2020). From year-end 2018, they had increased rather strongly again (+15.2%), starting from EUR 986 billion, thanks to a combination of dynamic lending and a significant increase in cash reserves.
In comparison, the asset volume of the other main financial sectors grew substantially during the same period.9 Investment funds (IFs) had increased their aggregated assets under management from EUR 127.4 billion to EUR 202.5 billion (+59%) by end-2020. Despite substantial losses in the first quarter of 2020 caused by the market turmoil at the beginning of the COVID-19 pandemic,10 this strong growth was mainly due to soar-ing inflows for the rest of 2020, but also due to substantial increases in the valuation of funds’ assets. According to the Austrian Financial Market Authority (FMA, 2021), EUR 112.6 billion or 55.6% of the overall assets of IFs were managed by Austrian alternative invest-ment funds (AIFs), while EUR 89.9 bil-lion or 44.4% were invested in Austrian undertakings for collective investment in transferable securities (UCITS).
From end-2008 to end-2020, insur-ance corporations (ICs) increased their total assets from approximately EUR 107 billion to EUR 141.1 billion
8 All the information presented in this paragraph is taken from ESRB (2021).9 See the statistical annex “Key financial indicators” of OeNB (2021, pp. 90–99).10 In response to the pandemic-related turbulences, the ESRB issued in May 2020 a recommendation on containing
liquidity risks in investment funds (ESRB/2020/4). https://www.esrb.europa.eu/pub/pdf/recommendations/esrb.recommendation200514_ESRB_on_liquidity_risks_in_investment_ funds~4a3972a25d.en.pdf
%
The Austrian financial sector at a glance
Chart 1
Source: OeNB Financial Stablity Report 41, FMA.
Banks Investment fundsPension fundsInsurance corporations
76
13
92
Note: Data as at end-2020.

Nonbank financial intermediation in Austria – an update
62 OESTERREICHISCHE NATIONALBANK
(+31.9%), while the assets of pension funds (PFs) grew from EUR 11.6 billion to EUR 25 billion (+115.5%). The relative sectoral composition of the Austrian financial market has not changed compared to 2018, however (chart 1).
5.1 Credit intermediation by nonbank financial entities
This study focuses on financial intermediation in Austria that relates to credit intermediation in a broader sense. In other words, the funding channel outside the banking system involves nonbank entities granting loans and buying debt securities. We give an update – up to the end of the second quarter of 2021 – on the previous analysis of nonbank financial intermediation that covered data up to the end of 2018 (Pöchel et al., 2019).11 The European System of National and Regional Accounts (ESA 2010) uses definitions of subsectors of the financial system which are not identical but very similar to the FSB definitions. Therefore, Austria’s financial accounts data, which are structured according to ESA 2010, can be used for an NBFI classification. These data are available for MMFs, IFs, OFIs, financial auxiliaries, captive financial institutions and money lenders as well as ICs and PFs. Nevertheless, MMFs are not taken into account as no MMFs are currently registered in Austria.12 OFIs according to ESA 2010 comprise financial vehicle corporations engaged in securitization transactions, security and derivative dealers, financial corporations engaged in lending, and specialized financial corporations.
Thus, the measure for broad-based credit intermediation conducted by nonmonetary financial institutions in Austria encompasses mainly IFs, ICs and PFs, but also some OFIs. In the OFI category, for instance, leasing or factoring companies that provide finance and do not report as part of a banking group are relevant in the context of more broadly defined credit intermediation outside the banking system.13 Chart 2 depicts the stock data of ICs and PFs separately from the aggregate measure calculated according to the ESRB’s “broad approach.” In Austria, ICs and PFs are included in the measurement of nonbank credit inter-mediation, while they are often excluded in the international context. The trans-action-based growth rate shows the development of all these sectors together from the first quarter of 2008 to the end of the second quarter of 2021. The stock of loans (excluding trade loans) and debt securities under management by nonbank financial entities including ICs and PFs increased by roughly 30%, from EUR 139.6 billion (Q1 2008) to EUR 182 billion (Q2 2021). From end-2018, the stock had grown by EUR 14.2 billion. Within the broad measure excluding ICs and PFs ( yellow area in chart 2), IFs play a dominant role. Of the stock of approximately EUR 182 billion (end-Q2 2021), roughly EUR 85.6 billion in assets, dominated by debt securities, belong to IFs. About EUR 37.2 billion, basically just loans, are attributable to the OFI category. Compared with monetary financial institutions, nonmonetary financial institutions’ importance regarding credit intermediation in a broad sense thus expanded from around 21% (Q1 2008) to approximately 25%
11 Note that due to data revisions the figures for 2018 and previous years given in this study may differ from Pöchel et al. (2019). The revisions have not, however, resulted in any changes of the statements presented in Pöchel et al.
12 There are no MMFs under direct supervision in Austria.13 In the following, the term OFI not only includes the described intermediaries but also all other financial institu-
tions according to ESA, namely financial auxiliaries as well as captive financial institutions and money lenders.

Nonbank financial intermediation in Austria – an update
FINANCIAL STABILITY REPORT 42 – NOVEMBER 2021 63
in 2018, after which it remained unchanged until the end of the second quarter of 2021. Cumulative net transactions during that period came to EUR 16.2 billion. Changes in stocks were caused not only by transactions but also by price and other changes, such as reclassifications.
Although transaction-based growth was negative in some quarters, the overall importance of loans and debt securities under management by nonbank financial intermediaries increased steadily.14 In comparison, at EUR 100 billion, banks have since 2008 recorded much higher net transactions of loans granted to nonbanks as well as investments in debt securities issued by nonbanks. Note that no counterparty breakdown is available for issuers of debt securities outside the euro area. Therefore, the above-stated transactions may also include some debt securities issued by banks outside the euro area.
5.2 Insurance corporations and pension funds post highest increases
The growth rates of debt securities and loans managed by Austrian nonbank financial intermediaries show higher increases for ICs and PFs than for other nonbank financial entities. Debt securities and loans are, however, first and foremost held by ICs rather than PFs. The asset side of PFs mainly consists of IF shares. By analyzing these IF shares with a look-through approach,15 we see that parts of PFs’ assets are indirectly invested in debt securities. While the loans shown in chart 2 are granted to nonbanks, debt securities held by nonbank financial entities can also include issues placed by banks. Thus, nonbank financial inter-mediaries also play a role in providing various forms of wholesale funding to banks, particularly through purchases of bank debt securities and by depositing funds. In this respect, developments in wholesale funding provided by nonbank financial entities to the banking sector have since 2008 only led to minor changes in the inter connectedness between the banking sector and the nonbank financial sector in Austria. Overall volumes of debt securities and deposits have hardly changed. Yet, the overall focus on deposits, compared to debt securities, increased, as is evident from chart 3.
14 The negative outlier of the transaction-based growth rate seen in chart 2 for 2020 was due to a transaction- related decrease of loans granted by captive financial institutions to foreign entities.
15 Under the look-through approach, the assets of funds are broken down into underlying financing instruments. This way, we gain an overview of fund investors’ indirect holdings of financial assets.

Nonbank financial intermediation in Austria – an update
64 OESTERREICHISCHE NATIONALBANK
5.3 Wholesale funding of banks by nonbank financial entitiesAs shown in the previous study (Pöchel et al., 2019), the total volume of wholesale funding of the Austrian banking sector by domestic nonbank financial entities, through both purchases of bank debt and deposits, increased only slightly from EUR 41.5 billion in the first quarter of 2008 to EUR 41.9 billion at the end of 2018. In the meantime, this volume even decreased slightly, namely to EUR 40.8 billion at the end of the second quarter of 2021. The NBFI share amounts to approximately 19% of the total volume of domestic wholesale funding in the form of debt securities and deposits in the Austrian banking sector. The bulk of domestic wholesale funding can be attributed to interbank funding.16 Due to the accommo-dative stance of monetary policy in the euro area, the need for banks to issue bonds has been subdued in recent years. Holdings of bank debt are negligible for OFIs in particular. However, increased volumes of bank deposits from entities of the nonbank financial sector have compensated for the overall decline of investment in bank debt. In this regard, OFIs have become more important than traditional financial institutions like IFs, ICs and PFs. OFIs increased their outstanding volume of bank deposits from EUR 9.5 billion to EUR 17.3 billion between the first quarter of 2008 and the second quarter of 2021. Bank deposits of ICs and PFs remained stable, while bank deposits of IFs decreased. Consequently, within the nonbank financial sector, OFIs became the largest category of providers of deposit funding for banks, which resulted in a higher interconnectedness between banks and OFIs, e.g. in the form of leasing and holding companies.
16 In this calculation, “wholesale funding” is assumed to consist of all domestic funding in the form of deposits and debt securities except deposits of nonfinancial corporations and deposits and debt securities of households and nonprofit institutions serving households.
EUR billion %
200
180
160
140
120
100
80
60
40
20
0
8
6
4
2
0
−2
−4
−6
−8
Debt securities and loans under management by nonbank financial intermediaries
Chart 2
Source: OeNB.
2008 2009 2010 2011 2012 2013 2014 2015 2016 2017 2018 2019 2020 H1 21
AT insurance corporations and pension funds
Transaction-based growth rate of AT broad measure (right-hand scale)AT broad measure excl. insurance corporations and pension funds

Nonbank financial intermediation in Austria – an update
FINANCIAL STABILITY REPORT 42 – NOVEMBER 2021 65
5.4 Financing of the nonfinancial corporate sectorOn the creditor side, however, banks are still the most important counterparty sector as regards the financing of nonfinancial corporations. Nevertheless, financing via the capital market has also gained importance. Especially the issuance of debt securities had been an important alternative source of financing after the peak of the great financial crisis, a trend that intensified with the beginning of the COVID-19 pandemic. Debt securities issued by nonfinancial corporations are largely held by nonbank sectors, including a large proportion of nondomestic investors, which has led to a diversification of counterparty sectors. But altogether, debt securities issued by nonfinancial corporations in Austria are limited to a few issuers, and shares (listed or unlisted) are generally a less important form of financing. Most small and medium-sized companies in Austria do not issue shares at all. However, especially since 2015, traditional financing in the form of bank loans has again become disproportionately important compared to financing via the capital market. Especially today, the need for loan financing through banks has increased sharply. The monetary policy instruments of the ECB likewise aim at promoting lending to the private sector. Chart 4 depicts the growth and distribution of net finance raised by nonfinancial corporations via various financing instruments, i.e. bank loans, loans from nonbank financial entities, debt securities and shares.
5.5 Interconnectedness through funding via the financial sector
In Austria, bank loans are the dominant form of financing in general and thus not only for nonfinancial corporations. Table 1 shows that Austrian deposit-taking entities, i.e. banks, dominate the funding of domestic creditors via loans.
EUR billion %
50
45
40
35
30
25
20
15
10
5
0
14
11
9
6
4
1
−2
−4
−7
−9
−12
−14
Wholesale funding provided to the banking sector by nonbank financial entities
Chart 3
Source: OeNB.
IF deposits OFI deposits IC and PF depositsIF debt securities OFI debt securitiesTransaction-based growth rate (right-hand scale)
IC and PF debt securities
2008 2009 2010 2011 2012 2013 2014 2015 2016 2017 2018 2019 2020 H1 21

Nonbank financial intermediation in Austria – an update
66 OESTERREICHISCHE NATIONALBANK
However, overall debt security-based funding through nonbank financial institutions as creditors exceeds bond funding provided by the traditional banking sector: in line with the FSB’s definition of the narrow approach to NBFI, the IF figures only include open-end funds because closed-end funds have different risk characteristics. This adjustment, however, concerns only a small fraction of the Austrian IF population.18 Domestic open-end IFs and ICs provide a substantial amount of financing via investments in debt securities of euro area debtors (EUR 41.6 billion and EUR 26.3 billion, respectively), primarily through holding general government bonds (EUR 23.2 billion and EUR 17.7 billion, respectively). PFs and other financial intermediaries (including financial auxiliaries and captive financial institutions) account for a combined EUR 2.1 billion.
Regarding the debtor side, i.e. bonds issued by nonfinancial corporations, the holdings of both Austrian IFs (EUR 9 billion) and ICs (EUR 4.8 billion) account for the largest part, while the holdings of banks (EUR 4.1 billion) only represent a quarter of the total amount. Like for loans, debt security-based funding by the nonbank financial sector did not increase noticeably from 2008 onward. The total amount of bond funding by entities outside the traditional banking sector increased from EUR 49.6 billion to EUR 69.9 billion between the end of 2008 and the second quarter of 2021.
5.6 Funding: the debtor perspective
From a general debtor perspective (table 1), especially the funding of general government heavily depends on the issuance of bonds (at the end of the second quarter of 2021, EUR 82.8 billion of euro area government bonds were held by Austrian financial entities), while loans to the general government sector (of euro area countries including Austria) play a much smaller role (at the end of the second quarter of 2021, EUR 19.7 billion of loans were in the books of domestic financial entities). In contrast, nonfinancial corporations mainly use loans (EUR 228.4 billion) rather than the issuance of debt securities (outstanding amount: EUR 18.4 billion) when they raise debt funding. Households, including nonprofit institutions serving households, receive their funding solely in the form of loans (EUR 188.9 billion; all figures as at the end of the second quarter of 2021). Most debtors of loans are domestic entities (EUR 409.3 billion), and only EUR 62.5 billion are owed by entities located in the rest of the euro area. In contrast, in the case of debt securities, non-Austrians (EUR 80.6 billion) dominated the issuer side, with domestic issuers accounting for only EUR 38 billion. In other words, loan funding largely remains within Austria and is dominated by the traditional banking sector, while debt security financing by Austrian creditors predominantly serves debtor entities from other euro area countries.
18 In contrast to the rest of the data, the information on open-end funds is based on investment fund statistics and not on financial accounts.
EUR billion
8
7
6
5
4
3
2
1
0
−1
−2
−3
−4
Net finance raised by nonfinancial corporations
Chart 4
Source: OeNB.
Domestic bank loans Euro area bank loans Domestic NBFI loans Euro area NBFI loansDebt securities Listed shares Unlisted shares Total (net)
2008 2009 2010 2011 2012 2013 2014 2015 2016 2017 2018 2019 2020 H1 21
At the end of the second quarter of 2021, banks accounted for an outstanding amount of EUR 446.1 billion vis-à-vis debtors in the euro area.17 All other nonbank financial entities together only account for a small fraction of the loan supply side, i.e. an amount of EUR 25.8 billion in total. Although the total volume of loans supplied by nonbank financial institutions rose from EUR 17.3 billion at end-2008 to EUR 25.8 billion at the end of the second quarter of 2021, this type of funding still only accounts for roughly 5% of total loan funding provided by the Austrian financial sector. By contrast, deposit-taking corporations still account for 95%, unchanged from 2018. The main debtors of bank loans are nonfinancial corporations (EUR 208.8 billion) and households (EUR 188.7 billion), while loans to other financial institutions (EUR 29.2 billion), general government (EUR 18.8 billion) and IFs, ICs and PFs (EUR 0.696 billion in total) only account for a much smaller amount. Altogether, loan financing still represents the largest part of funding by Austrian creditors, accounting for an outstanding amount of EUR 471.9 billion vis-à-vis debtors in the euro area at the end of the second quarter of 2021. At the same time, funding through bonds (held by Austrian financial entities) accounts for only EUR 118.6 billion.
With an investment amount of EUR 48.7 billion in debt securities, Austrian deposit-taking entities (excluding the central bank) are also the biggest creditors, providing most of their funding to the general government (EUR 41.4 billion).
17 The data used comprise only domestic and euro area counterparties. For non-euro area counterparties, only aggregated data are available in financial accounts.

Nonbank financial intermediation in Austria – an update
FINANCIAL STABILITY REPORT 42 – NOVEMBER 2021 67
However, overall debt security-based funding through nonbank financial institutions as creditors exceeds bond funding provided by the traditional banking sector: in line with the FSB’s definition of the narrow approach to NBFI, the IF figures only include open-end funds because closed-end funds have different risk characteristics. This adjustment, however, concerns only a small fraction of the Austrian IF population.18 Domestic open-end IFs and ICs provide a substantial amount of financing via investments in debt securities of euro area debtors (EUR 41.6 billion and EUR 26.3 billion, respectively), primarily through holding general government bonds (EUR 23.2 billion and EUR 17.7 billion, respectively). PFs and other financial intermediaries (including financial auxiliaries and captive financial institutions) account for a combined EUR 2.1 billion.
Regarding the debtor side, i.e. bonds issued by nonfinancial corporations, the holdings of both Austrian IFs (EUR 9 billion) and ICs (EUR 4.8 billion) account for the largest part, while the holdings of banks (EUR 4.1 billion) only represent a quarter of the total amount. Like for loans, debt security-based funding by the nonbank financial sector did not increase noticeably from 2008 onward. The total amount of bond funding by entities outside the traditional banking sector increased from EUR 49.6 billion to EUR 69.9 billion between the end of 2008 and the second quarter of 2021.
5.6 Funding: the debtor perspective
From a general debtor perspective (table 1), especially the funding of general government heavily depends on the issuance of bonds (at the end of the second quarter of 2021, EUR 82.8 billion of euro area government bonds were held by Austrian financial entities), while loans to the general government sector (of euro area countries including Austria) play a much smaller role (at the end of the second quarter of 2021, EUR 19.7 billion of loans were in the books of domestic financial entities). In contrast, nonfinancial corporations mainly use loans (EUR 228.4 billion) rather than the issuance of debt securities (outstanding amount: EUR 18.4 billion) when they raise debt funding. Households, including nonprofit institutions serving households, receive their funding solely in the form of loans (EUR 188.9 billion; all figures as at the end of the second quarter of 2021). Most debtors of loans are domestic entities (EUR 409.3 billion), and only EUR 62.5 billion are owed by entities located in the rest of the euro area. In contrast, in the case of debt securities, non-Austrians (EUR 80.6 billion) dominated the issuer side, with domestic issuers accounting for only EUR 38 billion. In other words, loan funding largely remains within Austria and is dominated by the traditional banking sector, while debt security financing by Austrian creditors predominantly serves debtor entities from other euro area countries.
18 In contrast to the rest of the data, the information on open-end funds is based on investment fund statistics and not on financial accounts.
EUR billion
8
7
6
5
4
3
2
1
0
−1
−2
−3
−4
Net finance raised by nonfinancial corporations
Chart 4
Source: OeNB.
Domestic bank loans Euro area bank loans Domestic NBFI loans Euro area NBFI loansDebt securities Listed shares Unlisted shares Total (net)
2008 2009 2010 2011 2012 2013 2014 2015 2016 2017 2018 2019 2020 H1 21

Nonbank financial intermediation in Austria – an update
68 OESTERREICHISCHE NATIONALBANK
6 Summary and conclusionsIn Austria, the bulk of nonbank finance is provided by open-end investment funds, followed by insurance corporations. A smaller part of nonbank finance in Austria is provided by other entities that belong to the OFI category, including leasing companies. Very active nonbank financial intermediaries are subject to financial regulation and supervision by the Austrian Financial Market Authority. Further-more, the Austrian Banking Act establishes a broad definition of core banking activities. This means that both deposit taking and lending are subject to full banking regulation and supervision unless otherwise specified (as is the case, e.g., for insurance corporations). While the relative importance of nonbank finance compared to traditional banking has somewhat increased in the past decade, there has been no structural shift in the Austrian financial system since 2018. The latter is still dominated by the bank finance model with a market share of 76%. By contrast, market-based finance continues to play a smaller role, with investment funds accounting for 13%, insurance corporations for 9% and pension funds for 2% of the overall market. The relatively small growth of nonbank financial assets is not seen as a concern in itself, as the risks from NBFI seem contained. Neither the structure nor the size of NBFI in Austria is currently considered to pose a threat to financial stability. Nevertheless, in view of the impact of COVID-19, general economic development is strongly influenced by these circumstances and corre-sponding public sector support measures. Based on the moderate developments in recent years, it remains to be seen whether NBFI will gain in importance in Austria over the next few years. However, diversifying their financing sources would help firms become more resilient and could make them less sensitive to adverse shocks.
Table 1
Funding via debt securities and loans
Creditor
Non-MMF investment funds
Deposit-taking corporations except the central bank
Other financial institutions
Insurance corporations
Pension funds Total
Debtor1 EUR million
Debt securities 41,576 48,684 1,517 26,279 556 118,611Nonfinancial corporations 9,022 4,125 409 4,796 65 18,416Non-MMF investment funds - 116 - - - 116Other financial institutions 8,784 2,766 468 2,885 53 14,957Insurance corporations 605 319 501 922 0 2,347Pension funds - - - - - 0General government 23,165 41,358 138 17,676 438 82,775Households2 - - - - - 0
Loans 119 446,084 19,074 6,579 45 471,901Nonfinancial corporations 119 208,795 17,299 2,131 39 228,383Non-MMF investment funds - 623 - 14 - 638Other financial institutions - 29,185 1,473 147 - 30,805Insurance corporations - 64 171 3,280 6 3,521Pension funds - 8 - - - 8General government - 18,752 - 899 - 19,651Households2 - 188,657 132 107 - 188,896
Source: Authors’ calculations.1 Including domestic as well as other euro area debtors.2 Including nonprofit institutions serving households according to ESA 2010.

Nonbank financial intermediation in Austria – an update
FINANCIAL STABILITY REPORT 42 – NOVEMBER 2021 69
Supervisors nevertheless need to continue monitoring whether nonbank financial intermediaries are likely to be affected by investors’ herding behavior, to what extent they can withstand losses and how the use of leverage is developing. As to the investment fund sector, the largest NBFI segment in Austria, concerns about underpricing risk are on the radar, given that the current environment is characterized by elevated market risk, subdued economic growth prospects and flattening yield curves. In the alternative investment fund sector, open-end real estate funds exhibit a substantial liquidity mismatch (see also FMSB, 2021). Nonetheless, judging from the sectoral holding and borrowing structure of investment funds in Austria, there are no signs of excessive risk taking in NBFI markets at present. In any case, nonbank financial markets are high up on the list of supervisory priorities in the EU. Together with the ESRB and the ECB, the national supervisory authorities will continue to closely monitor the respective systemic risks and to develop appropriate micro- and macroprudential policy responses.
ReferencesECB. 2021a. Non-bank financial intermediation in the euro area: implications for monetary policy
transmission and key vulnerabilities. Occasional Paper No 270. September. https://www.ecb.europa.eu/pub/pdf/scpops/ecb.op270~36f79cd6ca.en.pdf?f78feebf8d1405a1b52eed090775b20a
ECB. 2021b. Financial Stability Review. May. https://www.ecb.europa.eu/pub/financial-stability/fsr/html/index.en.html
ESMA. 2021. Report on Trends, Risks and Vulnerabilities No. 2. https://www.esma.europa.eu/sites/default/files/library/esma50-165-1842_trv2-2021.pdf
ESRB. 2016. Macroprudential policy beyond banking: an ESRB strategy paper. July. https://www.esrb.europa.eu/pub/pdf/reports/20160718_strategy_paper_beyond_banking.en.pdf?898505bd-7106c8a52161b83d7a52d482
ESRB. 2020. Recommendation (ESRB/2020/4) on liquidity risks in investment funds. https://www.esrb.europa.eu/pub/pdf/recommendations/esrb.recommendation200514_ESRB_on_liquidity_risks_in_investment_funds~4a3972a25d.en.pdf
ESRB. 2021. EU Non-bank Financial Intermediation Risk Monitor 2020 No. 6. August. https://www.esrb.europa.eu/pub/pdf/reports/nbfi_monitor/esrb.202108_eunon-bankfinancialinterme-diationriskmonitor2021_~88093a4a94.en.pdf
European Commission. 2020. A Capital Markets Union for people and businesses - new action plan. https://eur-lex.europa.eu/legal-content/EN/TXT/?uri=COM:2020:590:FIN
FMA. 2021. FMA Report on Asset Management in the Austrian Funds Market in 2020. https://www.fma.gv.at/en/fma-report-on-asset-management-in-the-austrian-funds-market-in-2020-net-asset-value-increases-by-e-7-5-bn-3-8-to-e-202-5-bn/
FMSB. 2021. 29th meeting of the Financial Market Stability Board. September. https://www.fmsg.at/en/publications/press-releases/2021/29th-meeting.html
FSB. 2018. Enhancing Resilience of Non-Bank Financial Intermediation. https://www.fsb.org/work-of-the-fsb/policy-development/enhancing-resilience-of-non-bank-financial-intermediation/
FSB. 2020. Global Monitoring Report on Non-Bank Financial Intermediation 2020. https://www.fsb.org/2020/12/global-monitoring-report-on-non-bank-financial-intermediation-2020/
FSB. 2021. Lessons learnt from the COVID-19 pandemic from a financial stability perspective: interim report. July.
OeNB. 2021. Financial Stability Report 41. https://www.oenb.at/en/Publications/Financial-Market/Financial-Stability-Report.html

Nonbank financial intermediation in Austria – an update
70 OESTERREICHISCHE NATIONALBANK
Pöchel, T., A. Schober-Rhomberg, A. Trachta and M. Wicho. 2019. Nonbank financial intermediation in Austria – developments since 2008. In: Financial Stability Report 38. OeNB. 74–86.
Schnabel, I. 2021. The rise of non-bank finance and its implications for monetary policy transmission. https://www.ecb.europa.eu/press/key/date/2021/html/ecb.sp210824~9ab47b501b.en.html
Wagner, J., M. Wicho and J. C. Zhan. 2017. Kreditintermediation des Nichtbanken-Finanzsektors. In: Statistiken – Daten und Analysen Q3/2017. OeNB. 46–57.

Annex: Key financial indicators

72 OESTERREICHISCHE NATIONALBANK
International financial markets Table
Short-term interest rates A1
Long-term interest rates A2
Stock indices A3
Corporate bond spreads A4
Austrian corporate and household sectors
Financial investment of households A5
Household income and savings A6
Financing of nonfinancial corporations A7
Insolvency indicators A8
Housing market indicators A9
Austrian financial intermediaries
Structural indicators A10
Total assets A11
Sectoral distribution of loans to domestic nonbanks A12
Loan quality A13
Exposure to CESEE A14
Profitability on a consolidated basis A15
Profitability of Austrian banks’ CESEE subsidiaries A16
Solvency on a consolidated basis A17
Market indicators of selected Austrian financial institutions A18
Key indicators of Austrian insurance companies A19
Assets held by Austrian mutual funds A20
Structure and profitability of Austrian fund management companies A21
Assets held by Austrian pension funds A22
Assets held by Austrian severance funds A23
Transactions and system disturbances in payment and securities settlement systems A24
Cutoff date for data: October 13, 2021
Conventions used:
x = no data can be indicated for technical reasons.
.. = data not available at the reporting date.
Revisions of data published in earlier volumes are not indicated.
Discrepancies may arise from rounding.
Annex: Key financial indicators

Annex: Key financial indicators
FINANCIAL STABILITY REPORT 42 – NOVEMBER 2021 73
International financial markets
Table A1
Short-term interest rates1
2015 2016 2017 2018 2019 2020 H1 20 H1 21
Three-month rate, period average, %
Euro area –0.02 –0.26 –0.33 –0.32 –0.36 –0.43 –0.35 –0.54USA 0.32 0.74 1.26 2.31 2.33 0.65 1.07 0.18Japan 0.17 0.08 0.06 0.07 0.07 0.07 0.07 0.07United Kingdom 0.57 0.50 0.36 0.72 0.81 0.29 0.53 0.07Switzerland –0.75 –0.75 –0.73 –0.73 –0.74 –0.71 –0.67 –0.75Czechia 0.31 0.29 0.41 1.27 2.12 0.86 1.38 0.38Hungary 1.61 0.99 0.14 0.12 0.19 0.70 0.69 0.81Poland 1.75 1.70 1.73 1.71 1.72 0.67 1.10 0.21
Source: Bloomberg, Eurostat, Macrobond.1 Average rate at which prime banks are willing to lend funds to other prime banks for three months.
Table A2
Long-term interest rates1
2015 2016 2017 2018 2019 2020 H1 20 H1 21
Ten-year rates, period average, %
Euro area 1.27 0.93 1.17 1.27 0.58 0.21 0.37 0.17USA 2.14 1.83 2.32 2.81 2.33 0.89 1.03 1.45Japan 0.37 –0.01 0.04 0.06 –0.08 0.00 –0.02 0.07United Kingdom 1.79 1.22 1.18 1.41 0.88 0.32 0.40 0.66Switzerland 0.05 –0.36 –0.09 0.03 –0.43 –0.50 –0.52 –0.28Austria 0.75 0.38 0.58 0.69 0.06 –0.23 –0.10 –0.11Czechia 0.58 0.43 0.98 1.98 1.55 1.13 1.24 1.65Hungary 3.43 3.14 2.96 3.06 2.47 2.22 2.22 2.64Poland 2.70 3.04 3.42 3.20 2.35 1.50 1.70 1.53
Source: ECB, Eurostat, Macrobond.1 Yields of long-term government bonds.
Table A3
Stock indices
2015 2016 2017 2018 2019 2020 H1 20 H1 21
Annual change in %, period average
Euro area: EURO STOXX 11.76 –9.67 17.16 –0.48 –0.37 –3.69 –3.23 22.20USA: S&P 500 6.71 1.63 16.92 12.13 6.09 10.45 6.79 34.54Japan: Nikkei 225 24.21 –11.90 19.41 10.44 –2.77 4.60 0.39 36.02United Kingdom: FTSE100 –1.38 –1.74 13.96 –0.21 –1.17 –13.75 –10.77 6.34Switzerland: SMI 4.23 –10.12 10.91 –0.16 9.56 4.01 6.25 11.36Austria: ATX 1.28 –5.42 34.83 7.56 –8.95 –20.45 –16.95 27.46Czechia: PX 50 0.83 –11.53 14.31 8.04 –3.16 –11.65 –10.09 15.78Hungary: BUX 17.15 28.96 31.47 5.51 10.14 –10.36 –6.97 17.08Poland: WIG –0.31 –9.87 30.11 –2.72 –1.27 –13.79 –16.47 21.82
Source: Macrobond.

Annex: Key financial indicators
74 OESTERREICHISCHE NATIONALBANK
Austrian corporate and household sectors
Table A4
Corporate bond spreads1
2015 2016 2017 2018 2019 2020 H1 20 H1 21
Percentage points, period average
Euro area
AA 0.73 0.80 0.73 0.70 0.79 0.86 1.00 0.61BBB 1.91 2.11 1.70 1.78 1.85 1.83 2.07 1.28
USA
AA 1.04 0.93 0.74 0.76 0.72 0.96 1.13 0.60BBB 2.13 2.21 1.54 1.59 1.73 2.05 2.40 1.23
Source: Macrobond.1 Spreads of seven- to ten-year corporate bonds against ten-year government bonds (euro area: German government bonds).
Table A5
Financial investment of households1
2015 2016 2017 2018 2019 2020 H1 20 H1 21
EUR billion, four-quarter moving sum
Currency 0.9 0.6 0.6 0.8 0.9 2.4 2.7 0.3Deposits 6.5 10.3 8.8 11.5 11.8 17.7 12.3 16.5Debt securities2 –3.5 –2.7 –2.7 –1.8 –1.1 –3.3 –2.2 –3.2Shares and other equity3 –0.3 1.1 –0.5 0.2 1.1 5.9 4.7 2.5Mutual fund shares 4.1 3.1 3.8 2.2 2.6 4.1 3.7 6.9Insurance technical reserves 1.3 1.0 0.6 0.4 0.8 –0.2 0.7 0.6Other accounts receivable 1.1 –0.2 1.8 0.9 0.7 1.9 2.2 0.3Total financial investment 10.1 13.2 12.4 14.2 16.8 28.5 24.1 23.9
Source: OeNB (financial accounts).1 Including nonprofit institutions serving households.2 Including financial derivatives.3 Other than mutual fund shares.
Table A6
Household1 income and savings
2015 2016 2017 2018 2019 2020 H1 20 H1 21
EUR billion, four-quarter moving sum
Net disposable income 193.1 201.3 208.3 215.2 222.5 220.9 216.8 223.1Savings 13.1 15.9 15.8 16.7 19.1 32.1 21.9 32.2Saving ratio in %2 6.7 7.8 7.5 7.7 8.5 14.4 10.0 14.4
Source: Statistics Austria (national accounts broken down by sectors).1 Including nonprofit institutions serving households.2 Saving ratio = savings / (disposable income + increase in accrued occupational pension benefits).

Annex: Key financial indicators
FINANCIAL STABILITY REPORT 42 – NOVEMBER 2021 75
Table A7
Financing of nonfinancial corporations
2015 2016 2017 2018 2019 2020 H1 20 H1 21
EUR billion, four-quarter moving sum
Debt securities1 0.0 0.7 –1.9 –1.5 –1.2 8.0 –0.4 5.7Loans 5.7 14.1 14.4 16.3 21.8 3.3 18.5 1.9Shares and other equity 2.5 2.8 11.9 –0.6 3.6 –3.6 2.9 –4.5Other accounts payable 4.5 5.6 3.3 7.6 –2.0 –0.4 0.3 –1.5Total external financing 12.7 23.2 27.7 21.8 22.2 7.3 21.3 1.6
Source: OeNB (financial accounts).1 Including financial derivatives.
Table A8
Insolvency indicators
2015 2016 2017 2018 2019 2020 H1 20 H1 21
Estimated default liabilities (opened insolvency proceedings, EUR million) 2,430 2,867 1,863 2,071 1,697 2,974 1,744 392Opened insolvency proceedings (number) 3,115 3,163 3,025 2,985 3,044 1,789 1,097 701Dismissed applications for insolvency proceedings (number) 2,035 2,063 2,054 1,995 1,974 1,228 831 358Total insolvencies (number) 5,150 5,226 5,079 4,980 5,018 3,017 1,928 1,059
Source: Kreditschutzverband von 1870.
Table A9
Housing market indicators
2013 2014 2015 2016 2017 2018 2019 2020
Residential property price index (2000=100)
Vienna 196.3 204.6 209.2 217.2 220.4 232.0 243.2 259.6Austria 156.0 161.4 168.1 180.4 187.2 200.1 208.0 222.6Austria excluding Vienna 141.1 145.4 152.9 166.7 174.9 189.8 194.8 209.4
Rent prices1 (2015=100)
Rents of apartments, excluding utilities (as measured in the CPI) 92.2 95.8 8.4 103.1 107.4 111.4 114.7 119.4
OeNB fundamentals indicator for residential property prices2
Vienna 12.7 13.3 13.4 14.4 16.5 19.2 20.8 19.9Austria –2.8 –3.1 –1.2 2.9 7.6 11.5 12.4 11.0
Source: OeNB, Vienna University of Technology (TU Wien).1 Free and regulated rents.2 Deviation from fundamental price in %.

Annex: Key financial indicators
76 OESTERREICHISCHE NATIONALBANK
Austrian financial intermediaries1
1 The OeNB’s financial indicators relate to all banks operating in Austria. For this reason, some of the figures presented here may deviate from the Financial Soundness Indicators published by the IMF.
Table A10
Structual indicators
2015 2016 2017 2018 2019 2020 H1 20 H1 21
End of period
Number of banks in Austria 738 672 628 597 573 543 572 542Number of bank branches 4,096 3,926 3,775 3,639 3,521 3,134 3,182 3,479Number of foreign subsidiaries 83 60 58 55 53 53 53 52Number of branches abroad 207 209 215 219 229 231 231 227Number of employees1 75,034 74,543 73,706 73,508 73,203 72,996 73,122 71,678
Source: OeNB.1 Number of persons, including part-time employees, employees on leave or military service, excluding blue-collar workers.
Table A11
Total assets
2015 2016 2017 2018 2019 2020 H1 20 H1 21
End of period, EUR million
Total assets on an unconsolidated basis 859,165 832,267 815,275 854,582 884,964 974,817 952,707 1,005,106Total assets on a consolidated basis 1,056,705 946,342 948,861 985,981 1,032,285 1,136,427 1,107,021 1,168,625Total assets of CESEE subsidiaries1 295,557 184,966 205,532 206,582 222,947 234,468 231,468 257,994
Source: OeNB.1 The transfer in ownership of UniCredit Bank Austria AG’s CESEE subsidiaries to the Italian UniCredit Group limits the comparability of f igures for 2015.
Table A12
Sectoral distribution of domestic loans to nonbanks
All currencies combined
2015 2016 2017 2018 2019 2020 H1 20 H1 21
End of period, EUR million
Nonbanks 333,743 335,644 341,149 355,869 371,790 385,384 380,376 393,600of which: nonfinancial corporations 137,151 135,569 143,758 153,028 162,905 169,795 168,551 175,107
households1 146,444 152,516 156,386 161,947 168,824 174,494 170,777 178,193general government 28,034 27,681 24,443 24,562 23,576 24,718 24,571 23,745other financial intermediaries 22,114 19,878 16,562 16,332 16,485 16,330 16,477 16,555
Foreign currencyNonbanks 33,948 30,088 22,182 20,564 19,618 16,527 18,722 15,388of which: nonfinancial corporations 5,291 4,296 3,397 3,538 3,321 2,628 3,143 2,801
households1 24,423 21,224 16,486 14,993 13,590 11,582 12,816 10,241general government 2,861 2,623 943 517 471 425 459 362other financial intermediaries 1,373 1,945 1,356 1,516 2,236 1,891 2,304 1,984
Source: OeNB.1 Including nonprofit institutions serving households.
Note: Figures are based on monetary statistics.

Annex: Key financial indicators
FINANCIAL STABILITY REPORT 42 – NOVEMBER 2021 77
Table A13
Loan quality1
2015 2016 2017 2018 2019 2020 H1 20 H1 21
End of period, %
Nonperforming loans in % of total loans (Austria2) 4.0 3.2 2.5 2.0 1.7 1.5 1.5 1.4Nonperforming loans in % of total loans (consolidated) 6.5 5.2 3.4 2.6 2.2 2.0 2.0 1.9Nonperforming loans in % of total loans (Austrian banks’ CESEE subsidiaries) 11.5 8.6 4.5 3.2 2.4 2.4 2.3 2.2Coverage ratio3 (Austria2) 47 59 60 62 61 68 68 71Coverage ratio4 (consolidated) 54 53 52 51 49 49 50 49Coverage ratio4 (Austrian banks’ CESEE subsidiaries) 59 67 61 64 67 67 68 64
Source: OeNB.1 As from 2017, data are based on Financial Reporting (FINREP) including total loans and advances. Data before 2017 only include loans to households and corporations.2 Austrian banks’ domestic business.3 Total loan loss provisions in % of nonperforming loans.4 Loan loss provisions on nonperforming loans in % of nonperforming loans.
Table A14
Exposure to CESEE
2015 2016 2017 2018 2019 2020 H1 20 H1 21
End of period, EUR million
Total exposure according to the BIS1 186,397 193,273 210,616 217,078 233,275 244,480 242,871 268,571Total indirect lending to nonbanks2,3 176,728 108,738 118,268 120,816 133,169 133,437 132,798 139,452Total direct lending4 40,866 32,976 28,507 27,526 23,992 25,656 27,268 24,722Foreign currency loans of Austrian banks’ CESEE subsidiaries3 69,317 32,576 31,027 29,836 29,766 29,376 30,455 28,755
Source: OeNB.1 As from mid-2017, comparability of data with earlier f igures is limited due to several methodological adjustments in data collection.2 Lending (net lending after risk provisions) to nonbanks by all fully consolidated bank subsidiaries in CESEE.3 The transfer in ownership of UniCredit Bank Austria AG’s CESEE subsidiaries to the Italian UniCredit Group limits the comparability of f igures for 2015.4 Cross-border lending to nonbanks and nonfinancial institutions in CESEE according to monetary statistics.

Annex: Key financial indicators
78 OESTERREICHISCHE NATIONALBANK
Table A15
Profitability on a consolidated basis1
2015 2016 2017 2018 2019 2020 H1 20 H1 21
End of period, EUR million
Operating income 28,064 22,408 22,837 24,023 24,997 24,750 11,902 12,783 of which: net interest income 18,336 14,604 14,536 15,210 15,589 15,458 7,824 7,814
fee and commission income 7,730 6,562 6,885 7,097 7,226 7,314 3,487 3,858 Operating expenses 17,612 16,687 14,752 15,661 16,733 16,530 8,629 7,854 of which: staff costs 8,959 8,774 8,415 8,602 8,740 8,461 4,246 4,182
other administrative expenses 6,830 5,820 5,571 5,630 5,673 5,835 2,977 3,022
Operating profit/loss 10,452 5,723 8,087 8,361 8,264 8,220 3,273 4,929 Risk provisioning 4,655 1,192 1,049 438 960 3,708 1,768 410 Net profit after taxes 5,244 4,979 6,577 6,916 6,713 3,668 887 3,746
%
Return on average (total) assets2 0.5 0.6 0.8 0.8 0.7 0.4 0.2 0.7Cost-to-income ratio 63 74 65 65 67 67 72 61Risk provisioning to operating profit 45 21 13 5 12 45 54 8
Source: OeNB.1 The transfer in ownership of UniCredit Bank Austria AG’s CESEE subsidiaries to the Italian UniCredit Group limits the comparability of f igures in 2015.2 Based on profits after tax, but before minority interests.
Table A16
Profitability of Austrian banks’ CESEE subsidiaries1
2015 2016 2017 2018 2019 2020 H1 20 H1 21
End of period, EUR million
Operating income 12,261 7,753 7,914 7,926 8,442 8,243 4,029 4,164 of which: net interest income 8,431 5,135 5,304 5,467 5,827 5,651 2,898 2,770
fee and commission income 3,358 2,184 2,315 2,241 2,393 2,327 1,064 1,225 Operating expenses 6,264 4,084 4,216 4,081 4,390 4,412 2,182 2,237 of which: staff costs 2,896 1,956 2,052 2,004 2,126 2,059 1,049 1,033
other administrative expenses 2,752 1,726 1,753 1,672 1,652 1,746 837 902
Operating profit/loss 5,998 3,668 3,698 3,845 4,053 3,831 1,847 1,927 Risk provisioning 3,025 720 340 221 472 1,326 665 161 Net profit after taxes 2,050 2,354 2,627 2,913 2,837 1,941 920 1,432
%
Return on average (total) assets 0.7 1.3 1.3 1.4 1.3 0.8 0.8 1.2 Cost-to-income ratio 51 53 53 51 52 54 54 54 Risk provisioning to operating profit 50 20 9 6 12 35 36 8
Source: OeNB.1 The transfer in ownership of UniCredit Bank Austria AG’s CESEE subsidiaries to the Italian UniCredit Group limits the comparability of f igures for 2015.

Annex: Key financial indicators
FINANCIAL STABILITY REPORT 42 – NOVEMBER 2021 79
Table A17
Solvency on a consolidated basis1
2015 2016 2017 2018 2019 2020 H1 20 H1 21
End of period, EUR million
Own funds 87,793 80,699 84,983 86,529 90,928 94,257 90,679 96,399 Total risk exposure (i.e. risk-weighted assets) 537,447 442,870 449,451 465,623 486,507 482,394 487,227 498,516
%
Total capital adequacy ratio 16.3 18.2 18.9 18.6 18.7 19.5 18.6 19.3Tier 1 capital ratio 12.9 14.9 15.9 16.0 16.3 17.2 16.3 17.1Common equity tier 1 (CET1) ratio 12.8 14.9 15.6 15.4 15.6 16.1 15.5 16.1Leverage ratio (transitional) x 6.9 7.3 7.5 7.6 7.4 7.1 7.7
Source: OeNB.1 The transfer in ownership of UniCredit Bank Austria AG’s CESEE subsidiaries to the Italian UniCredit Group limits the comparability of f igures for 2015.
Table A18
Market indicators of selected Austrian financial institutions
2014 2015 2016 2017 2018 2019 2020 Sep. 2021
Share prices % of end-2014 prices, end of period
Erste Group Bank 100 150 145 188 151 174 130 198Raiffeisen Bank International 100 109 139 241 177 179 133 181EURO STOXX Banks 100 95 87 97 65 72 55 75Uniqa 100 97 93 113 101 117 82 99Vienna Insurance Group 100 68 57 69 55 69 56 67EURO STOXX Insurance 100 116 109 120 109 134 116 128
Relative valuation: share price-to-book value ratio %, end of period
Erste Group Bank 80 108 95 115 89 97 69 100Raiffeisen Bank International 48 50 59 100 69 62 46 60EURO STOXX Banks 77 74 72 83 56 61 49 67Uniqa 78 74 69 86 81 83 57 71Vienna Insurance Group 98 79 62 71 57 64 52 61EURO STOXX Insurance 93 102 89 105 92 101 82 94
Source: Bloomberg.

Annex: Key financial indicators
80 OESTERREICHISCHE NATIONALBANK
Table A19
Key indicators of Austrian insurance companies
2015 2016 2017 2018 2019 2020 H1 20 H1 21
Business and profitability End of period, EUR million
Premiums 17,342 16,920 16,975 17,178 17,555 19,082 10,438 10,635Expenses for claims and insurance benefits 15,514 14,751 14,727 14,088 15,016 15,764 7,928 8,225Underwriting results 475 560 581 507 618 554 429 464Profit from investments 3,216 3,051 2,815 2,528 3,118 1,771 859 1,831Profit from ordinary activities 1,354 1,414 1,244 1,168 1,693 744 685 1,348Total assets 114,495 114,707 137,280 133,082 138,411 141,080 136,107 144,098
InvestmentsCurrency and deposits x 3,247 2,749 3,402 2,732 2,681 2,960 3,960Debt securities x 55,006 55,616 53,830 54,679 54,331 53,772 51,356of which: issued by domestic residents x 16,760 16,157 15,342 14,832 13,942 14,435 12,706
issued by euro area residents (other than domestic) x 27,101 27,442 27,001 28,269 29,461 28,391 28,073issued by non-euro area residents x 11,145 12,017 11,487 11,577 10,928 10,945 10,578
Shares and other equity x 22,474 21,258 19,677 19,413 21,178 17,688 23,599Investment fund shares (incl. money market funds) x 33,981 34,877 33,414 37,498 37,702 35,623 39,268Insurance techincal reserves and related claims x 3,568 3,128 2,683 2,713 2,994 3,148 3,458Risk capacity1 (median solvency capital requirement), % 375 x 276 255 238 220 199 221
Source: FMA, OeNB.1 A new reporting system based on Solvency II was introduced in 2017; therefore, some indicators cannot be compared with historical values.
Table A20
Assets held by Austrian mutual funds
2015 2016 2017 2018 2019 2020 H1 20 H1 21
End of period, EUR million
Domestic securities 52,970 54,382 54,824 52,480 54,114 56,278 52,354 60,377of which: debt securities 13,609 13,278 11,879 11,313 10,759 10,563 10,678 10,214
stocks and other equity securities 3,530 4,283 4,678 3,607 4,108 3,673 3,059 4,287Foreign securities 114,833 120,330 128,836 121,038 140,616 146,180 134,806 159,108of which: debt securities 70,326 69,911 70,353 67,956 72,949 74,332 72,354 75,201
stocks and other equity securities 18,521 20,145 22,924 20,747 27,983 31,535 25,542 39,569Net asset value 167,802 174,712 183,661 173,518 194,730 202,458 187,160 219,486of which: retail funds 91,626 94,113 97,095 89,923 101,536 105,467 97,092 115,164
institutional funds 76,177 80,599 86,572 83,600 93,194 96,938 90,041 104,322Consolidated net asset value 143,249 148,682 156,173 154,235 168,013 175,248 162,658 187,810
Source: OeNB.

Annex: Key financial indicators
FINANCIAL STABILITY REPORT 42 – NOVEMBER 2021 81
Table A21
Structure and profitability of Austrian fund management companies
2015 2016 2017 2018 2019 2020 H1 20 H1 21
End of period, EUR million
Total assets 745 691 674 655 716 706 663 724Operating profit 184 157 177 177 192 209 95 135Net commissions and fees earned 411 402 407 407 433 453 223 258Administrative expenses1 266 284 267 251 260 259 127 132Number of fund management companies 29 29 30 24 21 21 21 21Number of reported funds 2,077 2,029 2,020 2,017 1,935 1,953 1,955 1,950
Source: OeNB.1 Administrative expenses are calculated as the sum of staff and material expenses.
Table A22
Assets held by Austrian pension funds
2015 2016 2017 2018 2019 2020 H1 20 H1 21
End of period, EUR million
Total assets 19,646 20,839 22,323 21,494 24,341 24,976 23,213 23,977of which: direct investment 990 835 848 863 769 789 648 662
mutual funds 18,656 20,004 21,475 20,631 23,572 24,187 22,565 23,315
stocks 6,200 6,972 7,867 7,034 8,317 9,079 7,841 9,457debt 9,552 9,521 9,054 9,724 10,540 9,294 9,617 8,210real estate 690 754 1,165 978 1,142 1,369 1,209 1,266cash and deposits 1,850 1,863 2,192 1,632 1,711 1,973 1,834 1,652
Source: OeNB, FMA.
Table A23
Assets held by Austrian severance funds
2015 2016 2017 2018 2019 2020 H1 20 H1 21
End of period, EUR million
Total direct investment 1,565 1,682 1,893 2,416 2,621 2,916 2,791 2,497of which: euro-denominated 1,502 1,647 1,847 2,348 2,549 2,780 2,648 2,446
foreign currency-denominated 63 35 46 68 72 136 143 51accrued income claims from direct investment 14 15 13 12 9 9 8 7
Total indirect investment 6,741 7,745 8,720 9,674 10,686 11,733 10,722 13,052of which: total of euro-denominated investment
in mutual fund shares 5,790 6,743 7,429 7,989 8,724 9,803 9,046 10,263total of foreign currency-denominated investment in mutual fund shares 951 1,002 1,291 1,685 1,962 1,930 1,676 2,789
Total assets assigned to investment groups 8,294 9,412 10,597 12,052 13,288 14,563 13,488 15,462
Source: OeNB.
Note: Due to special balance sheet operations, total assets assigned to investment groups deviate from the sum of total indirect investments.

Annex: Key financial indicators
82 OESTERREICHISCHE NATIONALBANK
Table A24
Transactions and system disturbances in payment and securities settlement systems
Large-value payment system (domestic, operated by the OeNB)
2015 2016 2017 2018 2019 2020 H1 20 H1 21
Number of transactions in million, value of transactions in EUR billion
Number 1 1 1 1 1 1 1 1 Value 6,381 4,316 3,690 1,5361 1,412 1,651 623 969 System disturbances 1 4 0 3 0 0 0 1
Securities settlement systemsNumber 2 2 2 2 2 2 1 1 Value 315 335 7012 658 639 700 400 473 System disturbances 3 3 0 3 1 0 0 1
Card payment systemsNumber 901 963 1,061 1,178 1,299 1,350 641 700 Value 97 101 108 116 125 115 60 57 System disturbances 2 4 1 2 1 3 1 0
Participation in international payment systemsNumber 144 166 191 217 242 290 135 162 Value 2,420 3,029 3,242 3,831 3,304 2,252 1,138 1,050 System disturbances 0 0 0 0 0 0 0 0
Source: OeNB.1 Liquidity transfers from participants’ domestic accounts to their own TARGET2 accounts are no longer included under domestic transactions.2 Free-of-payment (FOP) transactions were first included in the value in 2017.