Financial Stability Report 2017
55
Financial Stability Report 2017 Presenter: Chunbo Liu July 31, 2017 Based on 《中国金融稳定报告2017》prepared by the Financial Stability Analysis group in People's Bank of China
Transcript of Financial Stability Report 2017

Financial Stability Report 2017
Presenter: Chunbo Liu
July 31, 2017
Based on 《中国金融稳定报告2017》prepared by the
Financial Stability Analysis group in People's Bank of
China

A flavor of the report

宏观经济 银行业
证券业 金融市场
其他主题
目录
保险业
01 02
03 04
05 06
Macro-economy Banking
Securities & Futures
Financial Markets
Insurance Firms Miscellaneous

I. The Macro-economic and Monetary Condition

China Economic Growth
- Norminal GDP in 2016 posted 74.41 trillion RMB, a 6.7% y-o-y increase.
- Composition of GDP: primary = 8.6%, secondary = 39.8%, tertiary = 51.6%

What drives the Chinese economy?
- Tangible asset investment increased by 7.9%. Question is from which sector. Real estate?
SOEs v.s. non-SOEs?
- Consumption increased by 10.4%, Total imports & exports decreased by 0.9%

Going abroad
- Starting from 2016, the Chinese
government initiated a more stringent
regulation on money outflow. Any money
outflow larger than 50,000 Yuan must be
reported.
- Recently press belonging to the
government has critizied companies that use
debt financing from domestic banks to do
overseas acquisitions which most likely
destroy value.
- RMB was added into the currency basket
of SDR by IMF on Nov. 30, 2015.

The Real Estate Market
- The housing market in 2016 has witnessed a large increase in sales and prices, as well as
voluminous money inflow.
- In total 1.57 billion squared meters of new housing has been sold in 2016, marking a
22.5% y-o-y increase. After the regulation in the 4th quarter, the increase in sales has been
slowed down.
- Housing price increases spread from major cities to secondary cities (such as Chengdu) in
the second quarter after regulations hit the former. The government then began to control the
housing price in secondary cities in October.
- Real estate loan balance / Total loan balance = 25%, New real estate loan issuance / Total
newly issued loans = 44.8%

Inflation
- In 2016, the CPI went up by 2.0% y-o-y, 0.6% higher than last year.
- PPI decreased by 1.4% and PPIRM by 2.0%. After being negative for 54 consecutive
months, PPI became positive in September and continued to increase afterwards.

Industrial firms
- In general, firm operational performance improved in 2016. According to the survey to 5,000 firms by PBC,
book leverage of firms declines to 61.8%, current ratio is equal to 101.6%, quick ratio 76.6% and interest
coverage 4.1.
- Implications of a joke “net profits of most listed companies are not enough to buy an apartment in
Shenzhen”
- Not surprising if you look at the data. Average ROA = 1.4%, median = 3%.

The household
- Unemployment rate = 4.02%, urban disposable income per capita = 33616 Yuan, Rural = 12363 Yuan.
- Household saving = 60.7 trillion (+9.9% y-o-y), household loan = 33.4 trillion (+23.5% y-o-y)
- Wealth management account balance = 29.1 trillion (+23.6% y-o-y), brokerage wealth management
business = 17.58 trillion (+48% y-o-y), A-share investment = 14.62 trillion.

Money supply
- M2 = 155.01 trillion, 11.3% y-o-y increase, 2% lower than 2015;
- M1 = 48.66 trillion, 21.4% y-o-y increase, 6.2% higher than 2015.

The high growth rate of M1
- M1 posted a 21.4% y-o-y increase compared to the 11.3% increase of M2.
- Contributing factor I: More demand deposits in the enterprise sector. The opportunity
cost of demand deposit becomes lower due to the low interest rate.
- Contributing factor II: Local government debt exchange program. Previously, local
government debt was mainly in the form of bank loans and trust loans, featuring short
maturity and high interest rates. In 2015, Ministry of Finance gave 1 trillion local
government bond quota to allow local governments to exchange various types of maturing
debt into standard long-term government bonds via private placements. Some argue that this
program is the Chinese version of QE.
- Contributing factor III: Voluminous transactions in the real estate market.

Financing decomposition
- Total financing = 155.99 trillion, a 12.8% y-o-y increase.
- Trust and entrusted loans (17.1% of total financing amount) increased significantly.
- Lending denominated in foreign currencies registered a second-year decline.

II. The Banking Sector

Bank assets and liabilities
- Total assets = 232.25 trillion (up 15.8%); total libilities = 214.82 trillion (up 16.04%)
- The fraction of top-five banks' assets = 37.29%. # city commercial banks = 134; # rural commerial banks =
1114; # rural cooperative banks = 40; # rural cooperatives = 1125; # village & town banks = 1443.

The growth of credit
- Total deposits = 140.42 trillion (up 12.53%); total lending = 106.6 trillion (up 12.53%).
- The increase of credit slows down.

Special-mention loans and NPLs of banking institutions
- NPLs = 2.19 trillion, NPLs/Total = 1.91% (down 0.02%)
- Special mention loans = 5.28 trillion; Over-due loans = 3.24 trillion (up 15.33%)
- Roll-overs could mask potential NPLs.
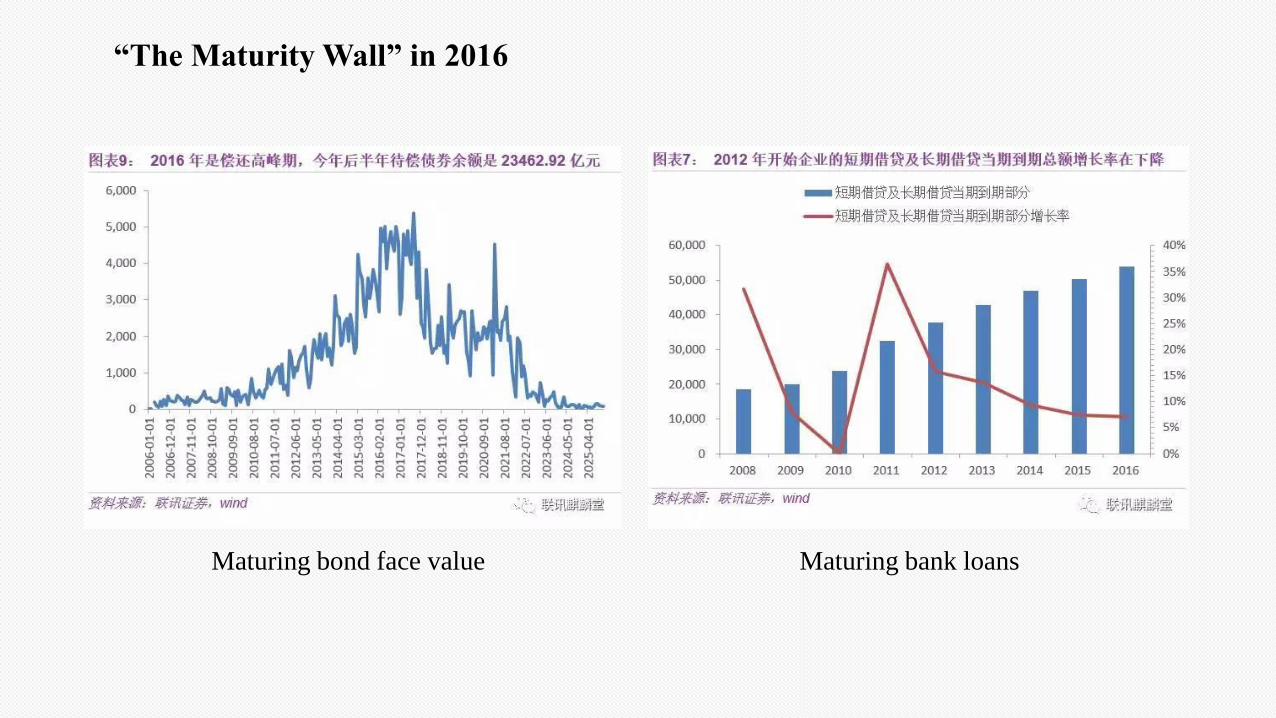
“The Maturity Wall” in 2016
Maturing bond face value Maturing bank loans

Deleveraging (降杠杆)
- A key component of it is the debt-for-equity swap which help firms reduce their mounting debt
but leave banks more strapped for capital.
- The Report has emphasized the dominant role of market in the debt-for-equity swap transaction.
- Leverage ratio in the enterprise and household
sector has increased enormously.
- Perhaps more dangerously, we have no data on
local government leverage.
- On October 10, 2016, the central gov. issued a
guideline to push forward the deleveraging of
industrial firms.

Capital adequacy ratio declines moderately
- Capital adequacy ratio = 13.28% (down 0.17%)
- Core tier-one capital adequacy ratio = 10.75%
- Core tier-one capital / total capital = 80.97%, indicating high capital quality.
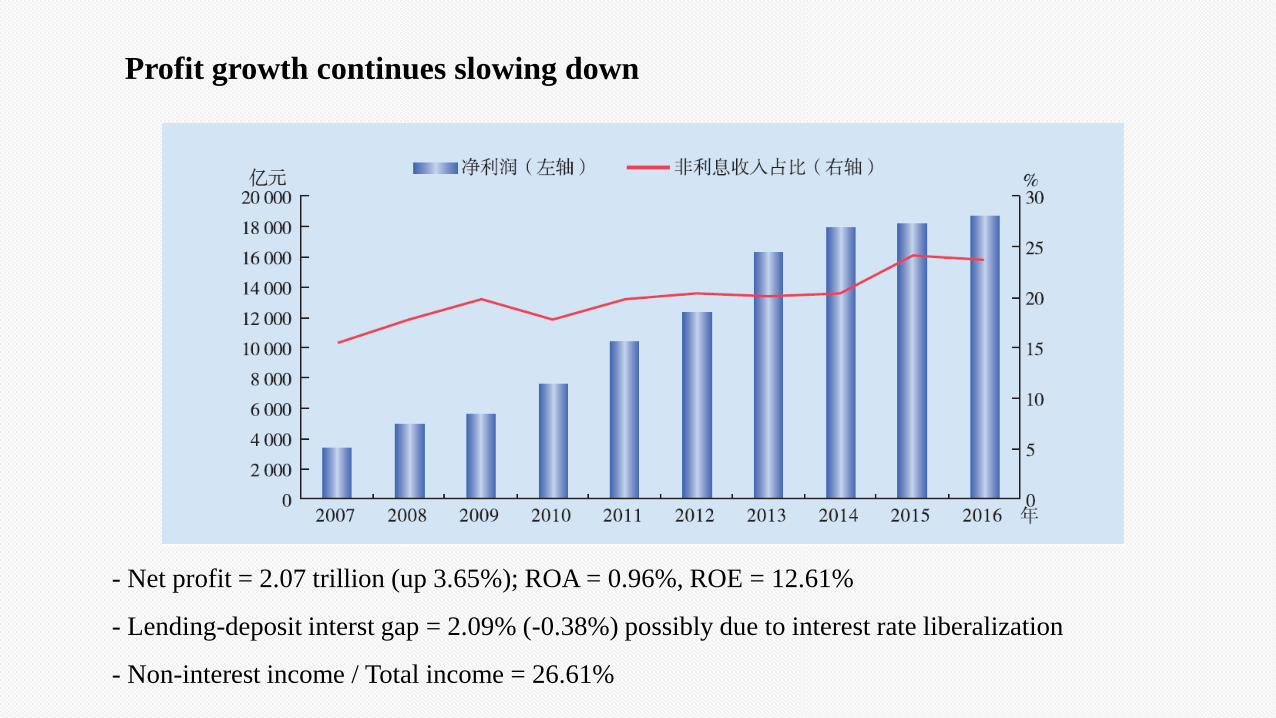
Profit growth continues slowing down
- Net profit = 2.07 trillion (up 3.65%); ROA = 0.96%, ROE = 12.61%
- Lending-deposit interst gap = 2.09% (-0.38%) possibly due to interest rate liberalization
- Non-interest income / Total income = 26.61%

Further assessment of the banking sector
- Credit risks: Credit risks concentrate in low-end manufacturing firms and industries with
capacity surplus. Leverage increases for non-financial firms. Some firms borrow new loans to
pay back maturing ones and even use new debt financing to pay interest. Zombie firms are still
receiving new credit.
- Operational and compliance risks: Weakness in internal control and corporate governance.
Fraud spreads from traditional business to inter-bank and off-balance sheet business, e.g.
Guangfa Bank fake guarantee agreement, Banker's Acceptance Bill Fraud.
- Real estate market bubble risks: New credit instruments such as loans backed by real estate
assets and loans for down payment have reinforced the increase of housing prices. Real estate
loan balance posted 5.7 trillion, taking up a proportion of 44.8% of new loans in 2016. Non-
performing real estate loan ratio is 0.77%.

Further assessment of the banking sector, contd.
- Risks in Off-balance-sheet business: Off-balance-sheet business reached 253.52 trillion
Yuan. Off-balance sheet asset value is as large as the value of assets on banks' balance sheet.
Guarantee = 19.03 trillion, Commitments = 16.08 trillion, Financial asset service = 164.63
trillion.
- Risks in internet finance and illegal fund-raising: Illegal fund-raising in P2P lending,
farmers' cooperative, real estate, PE, etc. Ponzi games such as 消费返利. Illegal exchange. Bit-
coin speculation.

III. Securities and Futures Sector

Brokerage firms
- 225 newly listed firms; Total market cap decreased by 50.77 trillion (due to the stock
market crash in mid2015)
- # Firms listed in 新三板 = 10163; # newly listed = 5034; Fund raised = 139 billion.

Size of the securities and futures sector
- Brokerage firms total assets = 4.37 trillion (-0.68%), Futures firms = 0.11 trillion (+17.68%)
- # PE firms = 17433, # PE funds = 46505, Amount committed = 10.24 trillion (+100.78%)
- Financial innovation: e.g., FOF
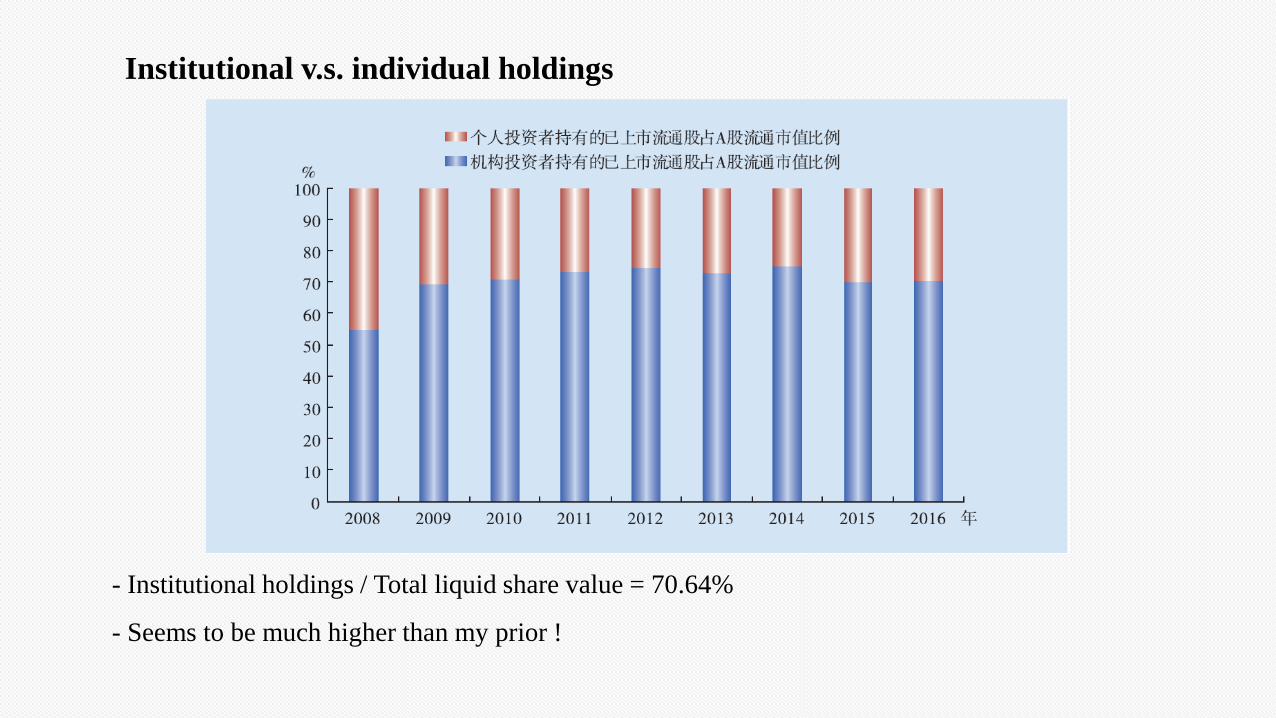
Institutional v.s. individual holdings
- Institutional holdings / Total liquid share value = 70.64%
- Seems to be much higher than my prior !

Regulations
Several new guidelines
- Listed Firm Stock Incentive Guidelines
- Listed Firm Major Asset Restructuring Guidelines
- Brokerage Firm Risk Management Indicator Guidelines: It is a result of reflecting abnormal
fluctuations of the stock market by the CSRC. Borrowing from Basel III, it has made changes on
several aspects: (i) improve the calculation of net capital and risk-based capital; (ii) leverage ratio has
been refined. new leverage ratio = core net capital / on- and off-balance-sheet assets; (iii) add liquidity
coverage ratio and net stable funds ratio into the regulation; (iv) refine indicators for specific segments;
(v) counter-cyclical regulation; (vi) include subsidiaries into the overall risk management framework.
Enforcement
- 302 cases (+23%) in year 2016, related to illegal disclosure, insider trading and market
manipulcation.

Soundness assessment
- Profitability of listed firms: Among 3212 listed firms, 241 of them report a loss.
- Brokerage firms: Brokerage firms have pretty robust capital ratio. However, due to the decline
in stock market transactions and the de-leveraging in asset management area, there is a massive
decline in profits. Aggregate operating income in 2016 = 327.994 billion, a 42.97% decline
compared to 2015.
- Brokerage business: 105.295 billion (down 60.87%)
- Underwriting: 51.999 billion (up 24.32%)
- Financial advisory business: 16.416 billion (up 19.02%)
- Investment consulting: 5.054 billion (up 12.86%)
- Asset management: 29.646 billion (up 7.85%)
- Security investment return: 56.847 billion (down 59.78%)
- Interest net income: 38.179 billion (down 35.43%)

The decomposition of brokerage firms' net income

Assessment, contd.
- Funds: Mutual funds net value posted 9.16 trillion, a 9.7% y-o-y increase.
Among all mutual funds, 7.71% are equity funds, 21.93% are hyrid funds (a 5.43%
decrease), 15.55% are bond funds (a 7.12% increase) and 46.77% are money market funds.
- Money market funds: There has been a rapid increase of the total size of MMFs.
However, MMFs are under substantial liquidity pressure as a consequence of credit risk
events in the bond market in 2016.

MMF net assets amount and fraction (2010-2016)
Milestone: Yu'e Bao went online in 2013

IV. The Financial Market

The money market
- Money market transaction volume reached historical high.
- Higher volatility of the money market interest rate. Money market inerest rates shoot up starting
from October, 61 bps higher than the 4th quarter of 2015.

The bond market
- Transaction volume increases massively, bond index showes a moderate increase.
Daily average inter-bank bond transaction dollar volume = 506 million Yuan, a 45.4% y-o-y
increase. Inter-bank bond index increases by 1.9%.
- Bond market experiences a strong start but a weak ending. At the end of 2016, the
yield of 1Y, 3Y, 5Y, 7Y and 10Y treasuries increases by 35, 24, 15, 16 and 19 bps. Treasury
futures hit the lower bound several times as a consequence.
- A more diversified investor base and higher participation by foreign institutions. The
inter-bank bond market accommodates 14127 qualified investors, a number that is 4491
larger than that in year 2015.

The stock market
- The stock market became more stable after a period of large fluctuations in early 2016.
- The A-share market triggered melt-down twice in the week right after the introduction of the melt-down
system. SSE Composite Index and Shenzhen Component Index declined by 16.95% and 26.54%, respectively.
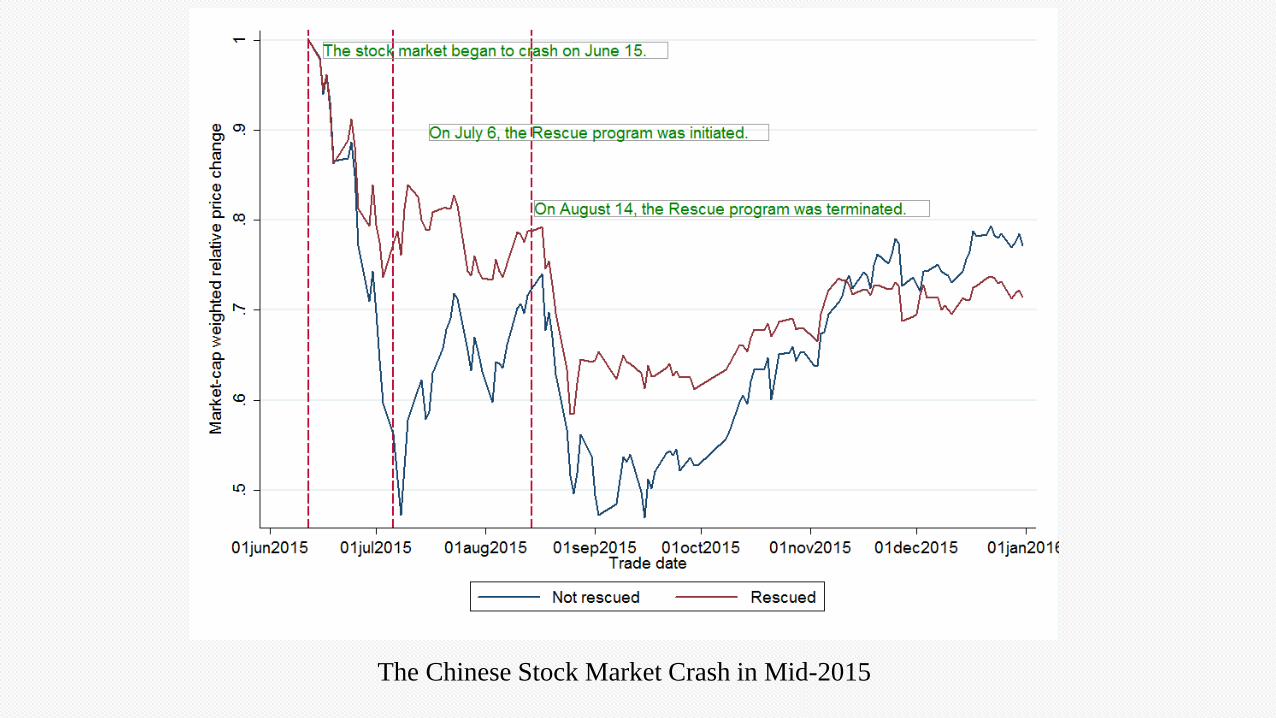
The Chinese Stock Market Crash in Mid-2015
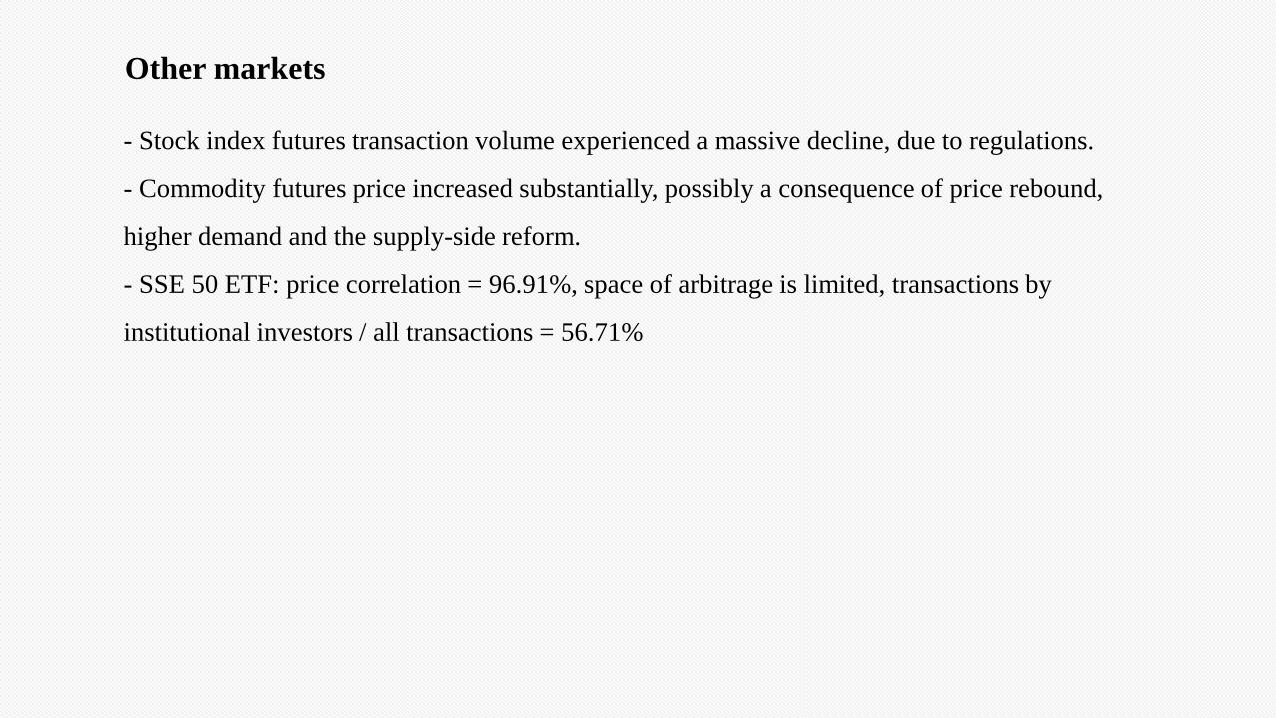
Other markets
- Stock index futures transaction volume experienced a massive decline, due to regulations.
- Commodity futures price increased substantially, possibly a consequence of price rebound,
higher demand and the supply-side reform.
- SSE 50 ETF: price correlation = 96.91%, space of arbitrage is limited, transactions by
institutional investors / all transactions = 56.71%

Debt market financing
- Local government bond issuance amount increased by 58% and inter-bank notes by 140%.
- Corporate bond issuance amount increased by 203% and enterprise bond by 45.6%.


Direct financing of non-financial firms

Sources of debt financing for non-financial firms

Assessment
- Bond yield increased significantly at the
end of 2016.
- The market pressure index, which is a
composite of interest rate risks, institutional
investor pressimistic expectations and credit
risks, shoot up in the second half of 2016.
The difference in yield between 1-year (5-year) MTN and 1-year (5-year) treasury is 121.4 bps
(146.5 bps), which is lower than that in 2015.
However, credit risks in the bond market might be under-estimated because of investors'
expectation of almost-certain bailout whenever there are defaults.

Default in the bond market
- Since 2016, there are 28 issuers that have defaulted on 65 of their publicly issued debt
instruments with the total face value exceeding 40 billion Yuan.
- The new phenomenon has many implications on the financial landscape in China.

V. Insurance Firms

The expansion of the insurance industry
- Total assets = 15.12 trillion (+22.3%); Total insurance premium = 3.1 trillion (27.5%)
- 9 more insurance companies

Insurance firms
- Risk-taking asset allocation: 18.55% allocation to bank deposit (-3.23%) and bonds (-
2.24%) and 36.02% allocation to alternative investment (+7.37%).
- Average return = 5.66%, lower than last year, still in line with the 10-year average.

Warnings on insurance money allocation
- Tilt toward equity investment: During year 2016, insurance companies have become the
major shareholder in more than 120 A-share listed firms.
- Maturity mis-match: Many of them focus on short-horizon investment, holding shares for less
than one quarter.
- Regulation arbitrage: Use complex products to mask underlying risks
- Illegal conduct: illegal transactions with affiliates, tunnelling and fake new equity financing.
- Source of financing is highly suspicious. A new type of insurance contract called universal
life insurance (万能险) has become the major source of income for many insurance companies,
especially mid- and small-sized ones.
- Anecdotes: Baoneng v.s. Vanke, Anbang Insurance Group
- Regulation: “保险业姓保 (Insurance firms should do what they are supposed to do).”

VI. Miscellaneous Topics

Asset management
Risks
- liquidity risks in fund pools
- Multi-layer products --> contagion
- Lack of regulation on shadow banking
- Almost certain bailout
Asset Managers Amount under management (trillion Yuan)
Bank in-balance-sheet 5.9
Bank off-balance-sheet 23.1
Trust companies 17.5
Mutual funds 9.2
PE 10.2
Brokerage firm asset management 17.6
Fund companies 16.9

Thanks for listening !
中国人民很行

The issuance of non-governmental bonds

Credit rating agencies
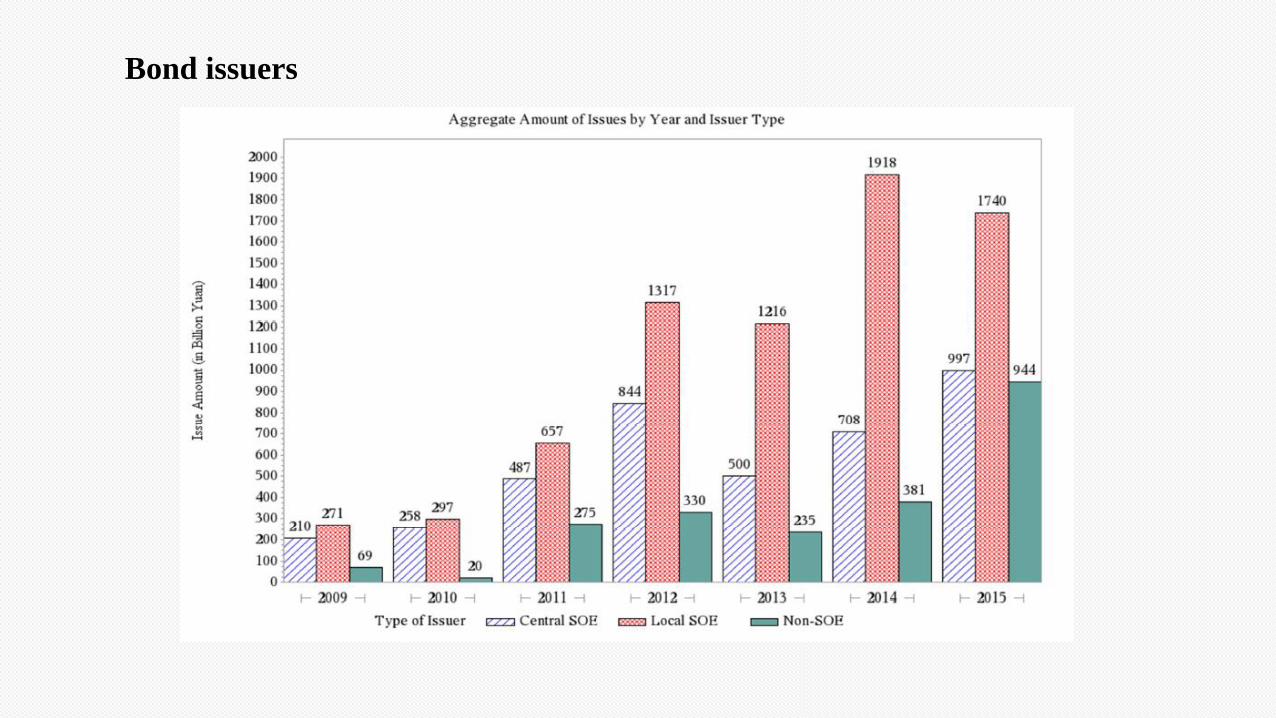
Bond issuers