Financial Soundness Indicators for Financial Sector … soundness indicators for financial sector...
45
ASIAN DEVELOPMENT BANK FINANCIAL SOUNDNESS INDICATORS FOR FINANCIAL SECTOR STABILITY IN VIET NAM
Transcript of Financial Soundness Indicators for Financial Sector … soundness indicators for financial sector...

ASIAN DEVELOPMENT BANKASIAN DEVELOPMENT BANK
FinAnciAl sounDness inDicAtors For FinAnciAl sector stABility inviet nAm

ASIAN DEVELOPMENT BANK
Financial SoundneSS indicatorS For Financial Sector Stability inViet nam

Creative Commons Attribution 3.0 IGO license (CC BY 3.0 IGO)
© 2015 Asian Development Bank6 ADB Avenue, Mandaluyong City, 1550 Metro Manila, PhilippinesTel +63 2 632 4444; Fax +63 2 636 2444www.adb.org; [email protected]; [email protected]
Some rights reserved. Published in 2015.Printed in the Philippines.
ISBN 978-92-9257-089-7 (Print), 978-92-9257-090-3 (e-ISBN)Publication Stock No. RPT157601-2
Cataloging-In-Publication Data
Asian Development Bank. Financial soundness indicators for financial sector stability in Viet NamMandaluyong City, Philippines: Asian Development Bank, 2015.
1. Financial sector. 2. Financial soundness indicators. 3. Encouraged indicators. 4. Asia and the Pacific.5. Investment climate.I. Asian Development Bank.
The views expressed in this publication are those of the authors and do not necessarily reflect the views and policiesof the Asian Development Bank (ADB) or its Board of Governors or the governments they represent.
ADB does not guarantee the accuracy of the data included in this publication and accepts no responsibility for anyconsequence of their use. The mention of specific companies or products of manufacturers does not imply that theyare endorsed or recommended by ADB in preference to others of a similar nature that are not mentioned.
By making any designation of or reference to a particular territory or geographic area, or by using the term “country”in this document, ADB does not intend to make any judgments as to the legal or other status of any territory or area.
This work is available under the Creative Commons Attribution 3.0 IGO license (CC BY 3.0 IGO)https://creativecommons.org/licenses/by/3.0/igo/. By using the content of this publication, you agreeto be bound by the terms of said license as well as the Terms of Use of the ADB Open Access Repositoryat openaccess.adb.org/termsofuse
This CC license does not apply to non-ADB copyright materials in this publication. If the material is attributedto another source, please contact the copyright owner or publisher of that source for permission to reproduce it.ADB cannot be held liable for any claims that arise as a result of your use of the material.
Attribution—In acknowledging ADB as the source, please be sure to include all of the following information: Author. Year of publication. Title of the material. © Asian Development Bank [and/or Publisher].https://openaccess.adb.org. Available under a CC BY 3.0 IGO license.
Translations—Any translations you create should carry the following disclaimer: Originally published by the Asian Development Bank in English under the title [title] © [Year of publication]Asian Development Bank. All rights reserved. The quality of this translation and its coherence with the original textis the sole responsibility of the [translator]. The English original of this work is the only official version.
Adaptations—Any adaptations you create should carry the following disclaimer: This is an adaptation of an original Work © Asian Development Bank [Year]. The views expressed here arethose of the authors and do not necessarily reflect the views and policies of ADB or its Board of Governors or thegovernments they represent. ADB does not endorse this work or guarantee the accuracy of the data included in thispublication and accepts no responsibility for any consequence of their use.
Please contact [email protected] or [email protected] if you have questions or comments with respectto content, or if you wish to obtain copyright permission for your intended use that does not fall within these terms,or for permission to use the ADB logo.
Photos in this publication are taken by ADB staffs.
Notes: In this publication, “$” refers to US dollars.ADB recognizes “China” as the People’s Republic of China and “Vietnam” as Viet Nam.”

iii
contents
Tables and Figures ............................................................................................................................................ ivAbbreviations ................................................................................................................................................... viForeword ........................................................................................................................................................... viiExecutive Summary .......................................................................................................................................... ix
1. Macroeconomic Developments...........................................................................................................11.1. Overview of Viet Nam’s Macroeconomy ..............................................................................................11.2. Fiscal Sustainability........................................................................................................................................51.3. Business Environment: Access to Finance by Small and Medium-Sized Enterprises .........6
2. Banking Sector ..................................................................................................................................... 12
3. Financial Soundness of Viet Nam’s Banking Sector ...................................................................... 163.1. Introduction to Financial Soundness Indicators ............................................................................. 163.2. Compilation and Dissemination in Viet Nam ................................................................................... 17
Conclusion ....................................................................................................................................................... 29
Appendix. List of Vietnamese Commercial Banks in the Study ............................................................. 30
References .........................................................................................................................................................31

iv
tables and Figures
tables Table 1: Domestic Credit Provided by Financial Sector in Selected Countries, 2000–2010 (% of GDP) ...............................................................................................................................6Table 2: Proportion of New Investments by Small and Medium-Sized Enterprises, 2009 and 2011 ...............................................................................................................................................8Table 3. Sources of Finance for Small and Medium-Sized Enterprises (% of surveyed enterprises with access to those sources) ..............................................................9Table 4: Small and Medium-Sized Enterprises Access to Formal Credit, 2007, 2009, and 2011 .............................................................................................................................. 10Table 5: Comparison between the Use of Formal and Informal Loans in 2011................................... 11Table 6: Domestic Credit Provided by Financial Sector in Selected Countries, 2000, 2005, and 2010 (% of GDP) ...................................................................................................... 15Table 7: Financial Soundness Indicators: The Core and Encouraged Sets for Deposit-Takers ...................................................................................................................................... 16Table 8: Financial Soundness Indicators of Viet Nam’s Banking Sector on International Monetary Fund Website, 2008–2012............................................................... 17Table 9: Nonperforming Loans to Total Gross Loans of Selected Banks, 2008–2012 (%) ............. 21Table 10: Distribution of Loans Based on Types of Currency and Maturity, 2011–2013 (%) .......... 22
Figures Figure 1: Annual Growth in GDP, 1986–2012 (%) ..............................................................................................1Figure 2: Quarterly Consumer Price Index, Q1 1996–Q3 2012 (Year-on-year, percent change, base year = 2005) .........................................................................2Figure 3: Total Investment, 1988–2012 (% of GDP) .........................................................................................2Figure 4: Balance of Payments Components, Q1 2005–Q3 2012 (% of GDP) .......................................3Figure 5: General Government Budget, 1998–2011 (VND billion) ............................................................3Figure 6: Monthly Outstanding Bonds, 2007–2013 ($ billion) .....................................................................4Figure 7: Viet Nam’s Public Debt and Foreign Debt, 2002–2014 (% of GDP) .........................................4Figure 8: State Budget Revenue/GDP Ratio in Selected Asian Countries, 2001–2012 (%) ..............5Figure 9: Viet Nam’s Structure of State Budget Expenditure, 2003–2013 (%) ........................................6Figure 10: The Most Problematic Factors for Doing Business in Viet Nam, 2012–2013 (% of responses) ....................................................................................................................7Figure 11: Number of New Small and Medium-Sized Enterprises, 2000–2010........................................8Figure 12: How Investment by Small and Medium-Sized Enterprises Was Financed in 2009 and 2011 .............................................................................................................9Figure 13: Small and Medium-Sized Enterprises Primary Formal Credit Institutions, 2009 .............. 10

v
Tabl
es a
nd F
igur
esFigure 14: Reasons Why Small and Medium-Sized Enterprises Did Not Apply for Loans, 2007, 2009, and 2011 (% surveyed) ................................................................................................... 11Figure 15: Proportion of Small and Medium-Sized Enterprises with Credit Constraints, 2007, 2009, and 2011 (%) ...................................................................................................................... 11Figure 16: Number of Banks in Viet Nam, 2006–2012 .................................................................................... 12Figure 17: Chartered Capital of 10 Largest Banks in Viet Nam, 2009–2012 (VND billion) .............. 13Figure 18: Deposits Market Share in Viet Nam, 2007–2012 (%) .................................................................. 13Figure 19: Credit Market Share in Viet Nam, 2007–2012 (%) ....................................................................... 14Figure 20: Domination of G12 Banks, 2012 (%) .................................................................................................. 14Figure 21: Regulatory Capital to Risk-Weighted Assets of G12 Banks, 2008–2012 (%) ..................... 19Figure 22: Capital Adequacy of Viet Nam’s Banking System, 2010–2013 (%) ........................................ 19Figure 23: Capital to Assets Ratio of G12 Banks, 2008–2012 (%) ............................................................... 20Figure 24: Nonperforming Loans Net of Provisions to Capital of Selected Banks, 2008–2012 (%) ............................................................................................................................................ 20Figure 25: Overdue Loans and Nonperforming Loans in Viet Nam’s Banking System, 2011–2013 (%) .............................................................................. 21Figure 26: Sector Distribution of Loans to Total Loans of Viet Nam’s Banking System, 2011–2013 (%) ............................................................................................................................................ 22Figure 27: Return on Assets of G12 Banks, 2008–2012 (%) .......................................................................... 23Figure 28: Return on Equity of G12 Banks, 2008–2012 (%) ........................................................................... 23Figure 29: Provisions to Nonperforming Loans of Viet Nam’s Banking System, 2011–2013 ............ 24Figure 30: Interest Margin to Gross Income of G12 Banks, 2008–2012 (%) ........................................... 24Figure 31: Vietnamese Banks’ Net Interest and Net Interest Margin, 2011–2013................................ 24Figure 32: Trading Income to Total Income of G12 Banks, 2008–2012 (%) ............................................ 25Figure 33: Noninterest Expenses to Gross Income of G12 Banks, 2008–2012 (%) .............................. 25Figure 34: Liquid Assets to Total Assets of G12 Banks, 2008–2012 (%) ................................................... 26Figure 35: Customer Deposits to Total (Noninterbank) Loans of G12 Banks, 2008–2012 (%) ....... 27

vi
abbreviations
ADB – Asian Development BankAFC – Asia’s financial crisisBCBS – Basel Committee for Banking SupervisionBIS – Bank for International SettlementsCPI – consumer price indexDMC – developing member countriesEBRD – European Bank of Reconstruction and DevelopmentERCD – Economic Research and Regional Cooperation DepartmentFDI – foreign direct investmentFSI – financial soundness indicatorsGDP – gross domestic productIMF – International Monetary FundNFSC – National Financial Supervisory CommissionSMEs – small-medium enterprisesSBV – State Bank of VietnamSOCB – state-owned commercial banksVAMC – Vietnam Asset Management CompanyVND – Viet Nam Dong

vii
Foreword
Since the outbreaks of the Asian financial crisis in the late 1990s and the global financial turmoil in 2007, assessing the strengths and weaknesses of a financial sector based on a set of financial indicators has become increasingly important. The assessment is needed mainly to identify any
potential problems that may lead to vulnerability in the financial sector and cause in a financial crisis. It is expected that by doing so a set of strategic policies and regulations, as well as actions, can be implemented to prevent the crisis.
Shortly after the Asian financial crisis in 1997, the Asian Development Bank (ADB) helped central banks of selected developing member countries identify, compile, and analyze about 30 monetary and financial statistics and macroprudential indicators to identify potential problems in the financial sector to prevent another crisis. This was followed by an initiative on an early warning system, with a prototype developed to detect region-wide economic and financial vulnerabilities among members of the Association of Southeast Asian Nations, the People’s Republic of China, Japan, and the Republic of Korea.
The development and analysis of a set of financial indicators should help policy makers identify the strengths and vulnerabilities of a financial system so that they can take preventive actions to avert a crisis. The International Monetary Fund (IMF) has initiated several initiatives in this area. In 1999, it initiated the collection and assessment of financial stability indicators by the joint IMF-World Bank Financial Sector Assessment Program, which was mainly to monitor financial system fragility. Following broad consultations in 2000, the IMF, in collaboration with the International Accounting Standards Board, the Bank for International Settlements, the Basel Committee for Banking Supervision, and other international and regional organizations, published a compilation guide on financial soundness indicators (FSIs), which were based on aggregate bank balance sheet and income statement information, and aggregate indicators of financial statements of nonfinancial firms and nonbank financial markets.
FSIs consist of two sets of indicators: core and encouraged indicators. The 12 core indicators measure potential vulnerabilities of deposit-taking institutions, covering capital adequacy, asset quality, earnings and profitability, liquidity, and sensitivity to market risks. Encouraged indicators are collected on a country-by-country basis to assess the soundness of other financial sectors such as other players (other financial corporations), borrowers (households and nonfinancial corporations), and related markets (securities and real estate). Currently, about 96 countries regularly report their FSIs to IMF, which maintains the data base.
This report is the outcome of the regional technical assistance on Strengthening Institutional Capacity to Compile and Analyze Financial Soundness Indicators for Investment Climate Assessment (RETA 7743), which is supported by the Investment Climate Facilitation Fund under
viiiFo
rew
ord
the Regional Cooperation and Integration Financing Facility. This report describes the development of FSIs for Viet Nam and analyzes FSIs to identify the key challenges faced by the financial sector that must be addressed to support the financial sector stability in the country.
As banks increasingly became involved in diversified operations, Viet Nam has experienced problems with high nonperforming loans and sluggish credit growth caused by governance and structural problems such as weak balance sheets, regulatory forbearance, connected lending and cross-ownership (including between banks and state owned enterprises), weak risk management, and special interest groups that influenced credit to be channeled to unprofitable and unproductive uses. The key challenges to comprehensively implementing reforms and to addressing the root causes of banking sector problems include (i) assessing banks’ recapitalization needs, (ii) revising classification criteria to guide resolution options, (iii) recapitalization and restructuring that may include foreign partnerships, (iv) strengthening the VAMC, (v) developing additional options to deal with nonperforming loans, (vi) tightening supervision to ensure a sound lending practice, (vii) revamping the architecture and procedures for crisis management, and (viii) strengthening financial safety nets during the reform process.
The results of this study can be used to strengthen the institutional and statistical capacities of Viet Nam to routinely collect, compile, analyze, and disseminate internationally comparable FSIs that will help improve the country’s financial surveillance, investment climate assessment, and policy-making process in the financial sector that is key for financial sector stability and performance.
The insights contained in this report are the results of the collaborative efforts of many. In particular, we would like to express our appreciation to the government and nongovernment institutions for their contributions and participations in various workshops and seminars conducted under the project. In particular, Nguyen Duc Thanh, Vu Minh Long, and Ngo Quoc Thai of Vietnam Institute for Economic and Policy Research for preparing a comprehensive assessment of the FSIs and investment climate in Viet Nam.
Guntur Sugiyarto, as the project leader, edited the report with the help from Josef T. Yap and John West. Douglas Brooks, as the direct manager in preparing the report, provided insightful comments and suggestions throughout the various versions of the drafts. Eric Suan helped organize the day-to-day project implementation, as well as prepare this publication, while Modesta De Castro provided administrative assistance. To ensure the accuracy and consistency of the report, Karen Williams acted as the copy editor/proofreader. ADB’s Department of External Relations (DER) helped in publishing the report, while Joe Mark Ganaban did the design, layout, and typesetting of the publication.
Rana Hasan Director Development Economics and Indicators Division Economic Research and Regional Cooperation Department

ix
executive Summary
This report describes the development of financial soundness indicators (FSIs) for Viet Nam and the analysis based on them to show how FSIs can be useful for identifying the key challenges to supporting financial sector stability in the country.
Since DoiMoi, the economic reforms initiated in 1986, Viet Nam has developed rapidly and entered the group of low-middle income countries. While economic growth was hit by the 1997 Asian financial crisis and the 2008 global financial crisis, it has stayed in the 4.0%–10.0% range of growth for over the two decades. However, inflation remains persistently high and has become increasingly volatile. The Vietnamese economy has become increasingly dependent on government investment which has a lower productivity than private investment or foreign direct investment (FDI). Viet Nam’s current account has remained in deficit despite huge amounts of FDI and exports have been adversely affected by recent economic weakness in Viet Nam’s trading partners. Government intervention to boost growth has led to an increasing and persistent budget deficit since 1999, especially in 2009, during the global financial crisis. As a result, government gross debt has risen continuously and remained around 35.0% of gross domestic product (GDP) for more than a decade. Therefore, maintaining a reasonable budget deficit and public debt is necessary for financial sector stability. However, the government still spends much money for a centralized planning system and on many public agencies and state-owned enterprises. On the other hand, raising taxes seems difficult because Vietnamese citizens are already burdened with an income tax that is 1.4 to 3 times higher than in other Asian countries.
The Vietnamese banking sector has experienced rapid credit growth since the early 2000s. As of 31 December 2012, Viet Nam’s banking sector comprised of 5 state-owned commercial banks, 34 joint stock commercial banks, 50 foreign bank branches, 4 joint venture banks, 5 wholly foreign-owned banks, 18 finance companies, 12 leasing companies, and 49 representative offices of foreign banks. While the state-owned commercial banks have long dominated the sector, joint stock commercial banks have recently had a larger share. The World Bank’s Doing Business Indices and the Global Competitiveness Report show that Viet Nam’s business environment is still very poor, and access to finance is the most problematic factor. In particular, Vietnamese small and medium enterprises have been faced with great financial constraints.
Despite the difficulty in accessing finance, Vietnamese enterprises have developed very fast in the last decade due to the development of credit and stock markets, which have become the two main channels for capitalization in the economy. The stock exchange has become an important channel for medium and long-term capital for more than a decade. Market capitalization increased tremendously, from 1.0% of GDP in 2000–2005 to 43.0% of GDP in 2007.

xEx
ecut
ive
Sum
mar
y
The FSIs were developed from bank financial statements in 2008-2012. However, some banks did not publicly disclose their reports, and Vietnamese banks’ financial statements did not fully conform to international standards. As a result, FSIs could not be computed for all banks and are not comparable internationally. The overall results show that the capital adequacy ratio exceeded the 8.0% minimum requirement of the Basel Committee, and even exceeded the 9.0% minimum requirement of the State Bank of Viet Nam (SBV). Asset quality has not remained secure because of high nonperforming loans. However, through the efforts of SBV and individual banks, the amount of nonperforming loans has decreased dramatically recently. Earnings and profitability, including return on assets, return on equity, interest margin to gross income, etc., all showed downward trends in 2012 and 2013 due to the increase in provisions to nonperforming loans and banks’ worse performance in trading activities. The average ratio of liquid assets to total assets was quite stable at around 20.0%–25.0% in 2008–2012, showing the sector’s high liquidity arising from the efforts of SBV’s policies to support liquidity and protect depositors. The indicators measuring banks’ sensitivity to market risks are not available; thus, we cannot draw any conclusion on this aspect.
To have more complete FSIs, the SBV and other financial monitoring agencies require banks (and other nonbank financial institutions) to prepare financial statements according to the international standards (i.e., following the IMF Compilation Guide). In addition, the FSI analysis should be complemented with other macroeconomic assessments to be able to identify early signs of vulnerabilities in order to prevent a crisis.

1
1. macroeconomic developments
1.1. Overview of Viet Nam’s Macroeconomy
Since DoiMoi 1986, Viet Nam has managed to maintain an annual economic growth of above 4.0% while implementing a series of reform measures and integrating further into the global economy.1 After macroeconomic conditions stabilized in 1989, the economy of Viet Nam
accelerated rapidly, growing an average 8.8% during the period 1992–1997. Growth dropped to 4.8% in 1999 due to spill-over effects from the 1997 Asian financial crisis. After signing a bilateral trade agreement with the United States and adopting the new Enterprise Law, coupled with a boost from both fiscal and monetary policy measures, the economy expanded until it reached 8.5% growth in 2005, then plateaued until 2007 (the year Viet Nam joined the World Trade Organization) before declining since 2008 as a consequence of the global financial crisis. The economy saw slower growth in 2011 and 2012 as a result of macrostabilization measures commencing in 2011.
Inflation remains persistently high and has become increasingly volatile over the past decade. Jumping to nearly 10.0% in the second half of 2004, the year-on-year CPI slowly rose to 6.5% in the first quarter of 2007, averaging 8.0% during the four-year period. The figure spiked in 2008, mainly due to increasing pressure accumulated over years of rapid expansion of credit and state investments (Figure 2).
The overheated economy cooled in 2009 as a consequence of the global economic slowdown. Weak demand caused inflation rates to plunge to below 5.0%. However, a stimulus introduced in
1 DoiMoi refers to the economic reforms initiated in Viet Nam in 1986 at the Sixth Party Congress with the goal of creating “socialist-oriented market economy.” The reforms aimed to (i) to develop the private sector; (ii) increase and stabilize agricultural output; (iii) shift the focus of investment from heavy to light industry; (iv) reduce the role of state owned enterprises; (v) focus upon export-led growth, based upon the experience of Viet Nam’s dynamic regional neighbors; and (vi) attract foreign direct investment, which were seen as essential for economic development (Phan Thi Nhiem et al., 2006).
Source: General Statistics Office. 2013.
0
2
4
6
8
10
12
1986
19
87
1988
19
89
1990
19
91
1992
19
93
1994
19
95
1996
19
97
1998
19
99
2000
20
01
2002
20
03
2004
20
05
2006
20
07
2008
20
09
2010
20
11
2012
Figure 1: Annual Growth in GDP, 1986–2012 (%)

Fina
ncia
l Sou
ndne
ss In
dica
tors
for F
inan
cial
Sec
tor S
tabi
lity i
n V
iet N
am2
2009 resulted in staggering double-digit inflation during the next two years, forcing the government to restrain both government spending and money supply growth since 2011. The program succeeded in stabilizing the macroeconomic environment but failed to kick off a new cycle of growth as the economy fell further into decline.
As the economy advanced, it became more and more dependent on investment. Investment, mostly from the state sector, has accounted for a major share of GDP (Figure 3). Total social investment, of which the state sector accounted for nearly 40.0%, climbed steadily to 43.0% of GDP in 2007. An economic downturn in 2009 caused total investment to fall to around 30.0% in the following years. However, the share of investment from the state sector remained almost unchanged, and still accounted for 40.0% of total investment.
According to many studies, government investments were less effective than those of the private sector and FDI sector. Recent studies prove that the state sector has an above average incremental capital-output ratio (ICOR), meaning it requires more and more investment for an increase in GDP (Nguyen Xuan Thanh and Dapice, D., 2009; Bui Trinh et al., 2012).2 Some pointed out that state investments neither fully responded to economic conditions nor led to increases in output, and therefore has a low correlation with output growth. Higher ICOR is not limited to the state-owned sector since it was recorded in the other two. While the nonstate sector has the lowest, albeit climbing, ICOR, the foreign sector logged the highest ICOR, not because it is
2 ICOR is the ratio of investment to growth, which is equal to one divided by the marginal product of capital. The higher the ICOR, the lower the productivity of capital. ICOR can be treated as a measure of the inefficiency with which capital is used.
–5.00
0.00 5.00
10.00 15.00 20.00 25.00 30.00
1996
Q1
1996
Q3
1997
Q1
1997
Q3
1998
Q1
1998
Q3
1999
Q1
1999
Q3
2000
Q1
2000
Q3
2001
Q1
2001
Q3
2002
Q1
2002
Q3
2003
Q1
2003
Q3
2004
Q1
2004
Q3
2005
Q1
2005
Q3
2006
Q1
2006
Q3
2007
Q1
2007
Q3
2008
Q1
2008
Q3
2009
Q1
2009
Q3
2010
Q1
2010
Q3
2011
Q1
2011
Q3
2012
Q1
2012
Q3
Source: General Statistics Office. 2013.
Figure 2: Quarterly Consumer Price Index, Q1 1996–Q3 2012 (Year-on-year, percent change, base year = 2005)
0 5
10 15 20 25 30 35 40 45 50
1988
19
89
1990
19
91
1992
19
93
1994
19
95
1996
19
97
1998
19
99
2000
20
01
2002
20
03
2004
20
05
2006
20
07
2008
20
09
2010
20
11
Est.
2012
Source: International Monetary Fund. World Economic Outlook. 2011.
Figure 3: Total Investment, 1988–2012 (% of GDP)

Mac
roec
onom
ic D
evel
opm
ents
3
the least efficient sector but due to transfer pricing. High ICOR for the Vietnamese economy also means that productivity has increased slowly. A series of research articles show that the fall in total productivity factor growth explains very well the fall in economic growth, which in the last several years could be attributed only to growth in capital and labor. The downtrend of productivity growth will affect the long-term trend of economic growth and hinder economic recovery (Nguyen Duc Thanh et al., 2013).
Viet Nam’s current account remained in deficit for most of the reported time due to the features and structure of the economy. The surplus in the financial account brought about by the huge amount of foreign direct investment has offset the deficit; however, the overall balance of payments has been fluctuating due to recently diminishing exports (Figure 4). The slowdown in the economy of Viet Nam’s major trading partners has led to a plunge in demand for goods made in Viet Nam, and exports have fallen as a consequence. Although exports have picked up recently due to turnovers in foreign manufacturing, a trade deficit remains imminent when import demand recovers, particularly in capital goods and industrial supplies, because of weakness in domestic firms and other foreign industries.
Structural budget balance refers to the general government budget balance adjusted for cyclical elements, which include temporary revenue or expenditure items. Therefore, this figure can be interpreted as an indicator of policy adjustments. The state’s intervention to boost growth has led to an increasing and persistent structural deficit since 1999, with a surge in 2009 and coinciding with a big stimulus to overcome growth slowdown (Figure 5). In the absence of tax reform and fiscal rule, the budget deficit will not improve in the foreseeable future.
–50 –40 –30 –20 –10
0 10 20 30 40 50
Q1
2005
Q
2 20
05
Q3
2005
Q
4 20
05
Q1
2006
Q
2 20
06
Q3
2006
Q
4 20
06
Q1
2007
Q
2 20
07
Q3
2007
Q
4 20
07
Q1
2008
Q
2 20
08
Q3
2008
Q
4 20
08
Q1
2009
Q
2 20
09
Q3
2009
Q
4 20
09
Q1
2010
Q
2 20
10
Q3
2010
Q
4 20
10
Q1
2011
Q
2 20
11
Q3
2011
Q
4 20
11
Q1
2012
Q
2 20
12
Q3
2012
Current account Financial account Overall balance of payments position
Source: International Monetary Fund—International Finance Statistics. 2013.
Figure 4: Balance of Payments Components, Q1 2005–Q3 2012 (% of GDP)
Source: International Monetary Fund—International Finance Statistics. 2013.
–1,000,000 –800,000 –600,000 –400,000 –200,000
0 200,000 400,000 600,000 800,000
1998 1999 2000 2001 2002 2003 2004 2005 2006 2007 2008 2009 2010 2011 General government revenue General government total expenditure
General government structural balance
Figure 5: General Government Budget, 1998–2011 (VND billion)

Fina
ncia
l Sou
ndne
ss In
dica
tors
for F
inan
cial
Sec
tor S
tabi
lity i
n V
iet N
am4
The deficit in government budget has been financed by government bonds as borrowing from foreign investors became more difficult. In the last six years, government bonds, of which treasury bonds and other bonds (mainly government-backed bonds issued by state banks) made up major shares, rose from $8 billion in August 2007 to a peak of $29 billion in March 2013 (Figure 6). Moreover, the rise in government bonds seems to crowd out corporate bonds, which declined to less than $1 billion in outstanding bonds from more than $2 billion in early 2011. It was not until 2012 that the State Bank of Viet Nam (SBV) issued central bank bills to perform sterilization of the Viet Nam dong.
As a result of the increase in borrowing, general government gross debt has risen continuously and the gross debt as percent of GDP has remained around 35.0% for more than a decade. It can be argued that the growth in government debt is on par with the growth of the Vietnamese economy.
Over the last decade, Viet Nam’s public debt to GDP ratio has increased from 38.2% in 2002 to about 51.3% in 2012. The IMF predicted that this figure would not change significantly in 2013 and 2014 (Figure 7).
In principle, to finance a budget deficit, a government can choose to raise taxes and/or borrow through bond issuance. Since the ability to increase the budget revenue seems to be difficult, Viet Nam has to borrow to compensate for that deficit. Borrowing through issuing bonds, on the one hand, would loosen the money supply if the issued bonds are repurchased through the discount window and open market operations. On the other hand, it would increase interest rates, crowd out private investment, and negatively affect the financial system, especially the banking sector.Thus,
Source: Asian Development Bonds Online. 2013.
–5 0 5
10 15 20 25 30 35
Aug
-07
Sep-
07
Oct
-07
Nov
-07
Dec
-07
Jan-
08
Feb-
08
Mar
-08
Apr
-08
May
-08
Jun-
08
Jul-
08
Aug
-08
Sep-
08
Oct
-08
Nov
-08
Dec
-08
Jan-
09
Feb-
09
Mar
-09
Apr
-09
May
-09
Jun-
09
Jul-
09
Aug
-09
Sep-
09
Oct
-09
Nov
-09
Dec
-09
Jan-
10
Feb-
10
Mar
-10
Apr
-10
May
-10
Jun-
10
Jul-
10
Aug
-10
Sep-
10
Oct
-10
Nov
-10
Dec
-10
Jan-
11
Feb-
11
Mar
-11
Apr
-11
May
-11
Jun-
11
Jul-
11
Aug
-11
Sep-
11
Oct
-11
Nov
-11
Dec
-11
Jan-
12
Feb-
12
Mar
-12
Apr
-12
May
-12
Jun-
12
Jul-
12
Aug
-12
Sep-
12
Oct
-12
Nov
-12
Dec
-12
Jan-
13
Feb-
13
Mar
-13
Apr
-13
May
-13
Jun-
13
Treasury Bonds Central Bank Bonds Others Corporate Bonds Total Outstanding Bonds
Figure 6: Monthly Outstanding Bonds, 2007–2013 ($ billion)
Source: International Monetary Fund (various years).
0
10
20
30
40
50
60
2002
2003
2004
2005
2006
2007
2008
2009
2010
2011
Est.
2012
Proj
201
3
Proj
201
4
Public debt (% GDP) External debt (% GDP)
Figure 7: Viet Nam’s Public Debt and Foreign Debt, 2002–2014 (% of GDP)

Mac
roec
onom
ic D
evel
opm
ents
5
maintaining a reasonable budget deficit and public debt would be necessary for the development and stability of the banking sector.
1.2. Fiscal Sustainability
As mentioned in the previous section, Viet Nam has generally had a budget deficit and high public debt since the last decade. Persistent budget deficits and steep public debt not only lead to sovereign risks but also negatively affect long- term macroeconomic stability. One of the important causes of budget deficits is the burden of spending and investment on the state-owned sector. This sector possesses low capital-use efficiency and many potential business risks. In some privileged monopolistic industries, losses may not occur if the opportunity cost of capital is not as high as in the private sector. Therefore, the value of investment items must increase to become higher than average, thus increasing the difference in savings-investment in the economy (Nguyen Duc Thanh, 2011).
To maintain a balanced annual budget, the government can either cut spending or increase revenues. Public spending, to a certain extent, can be controlled immediately just by tightening expenditure, which is very likely to be approved by the public. In contrast, raising revenue is probably much more difficult in Viet Nam. On average, Viet Nam’s state budget revenue in 2001–2012 was 24.8% of GDP, much higher than any of the other countries in the region (Figure 8). Although the figure trended downward in 2011 and 2012, it still reached 22.6%, which was just equal to that of China, slightly higher than that of Malaysia, and much higher than those of Thailand, Indonesia, Philippines and India. According to Pham The Anh (2011), the people of Viet Nam bore an income tax over income rate from 1.4 to 3 times higher than other Asian countries, due to severe trade protectionism and tax overlaps. Thus, raising taxes and fees to narrow the country’s budget deficit is clearly limited.
The increasing trend in import and export revenues, from 14.0% in 2007 to 20.4% in 2013, shows a rapid development of international trade, but also reflects high trade protection. Heavy dependence on these revenue sources may cause more serious budget deficits as Viet Nam cuts its tariff in the coming years, as committed to the World Trade Organization. Moreover, land and housing revenue, an unsustainable and gradually depleting source of assets, contribute less and less to the total budget revenue (from 8.4% in 2007 to 5.6% in 2013). Similarly, the earnings from selling crude oil are also unsustainable since resources are limited. Oil revenue has decreased recently, from 18.2% in 2007 to 12.1% in 2013. Hence, chances to raise revenues seem very small because many revenue sources are unsustainable and may slump or disappear in the future.
Source: Asian Development Bank. 2013.
5.0
10.0
15.0
20.0
25.0
30.0
2001 2002 2003 2004 2005 2006 2007 2008 2009 2010 2011 2012
Viet Nam Thailand China, Peoples Rep. of India Indonesia Philippines Malaysia
Figure 8: State Budget Revenue/GDP Ratio in Selected Asian Countries, 2001–2012 (%)

Fina
ncia
l Sou
ndne
ss In
dica
tors
for F
inan
cial
Sec
tor S
tabi
lity i
n V
iet N
am6
Viet Nam also has problems with the structure of state budget expenditure. The proportion of current expenditure has increased continuously over time, from 48.4% in 2003 to 67.4% in 2013 (Figure 9). It shows that the government still has to spend much money on maintaining a centralized planning system and many public agencies. Because current expenditure has increased, the proportion of expenditure for development investments fell sharply, from 30.2% in 2003 to 17.9% in 2013.
1.3. Business Environment: Access to Finance by Small and Medium-Sized Enterprises
For the last decade, Viet Nam’s financial sector’s importance in providing credit for the development of enterprises has been increasing. The proportion of domestic credit provided by Viet Nam’s financial sector to GDP has increased dramatically, from about 33.0% in 2000 to 125.0% in 2010, much higher than the average of lower middle income countries (Table 1). Thus, the financial system, especially the banking sector, is considered the economy’s blood stream. The stability of the banking sector is key to the development of the macroeconomy in general and the business environment in particular.
0% 10% 20% 30% 40% 50% 60% 70% 80% 90%
100%
2003
2004
2005
2006
2007
2008
2009
2010
2011
2012
(p
lann
ed)
2013
(p
lann
ed)
Staff streamlining expenditure Subsidies for petrol trading enterprises Brought forward expenditure Contingency Transfer to financial reserve fund
Expenditure for salary reform Current expenditure Debt repayment and aid Expenditure for development investment
Source: Viet Nam Ministry of Finance, 2013.
Figure 9: Viet Nam’s Structure of State Budget Expenditure, 2003–2013 (%)
Region/Country 2000 2005 2010Lower middle income countries 50.6 49.9 58.7Low and middle income countries 66.8 74.4 92.2High income countries 174.9 181.1 197.5China, People’s Republic of 119.7 134.3 146.3India 51.2 58.4 71.9Indonesia 60.7 46.2 36.4Viet Nam 32.6 65.4 124.7Uganda 12.2 8.6 17.1South Africa 152.5 185.9 191.7Russian Federation 24.9 22.1 37.5Brazil 71.9 74.5 96.3Source: World Bank. 2013.
Table 1: Domestic Credit Provided by Financial Sector in Selected Countries, 2000–2010 (% of GDP)

Mac
roec
onom
ic D
evel
opm
ents
7
Cross-country research shows that institutional and business environments—including well-defined property rights, both between private parties and protection against government expropriation; effective contract enforcement; competitive product, labor, and capital markets; and a legal framework that allows relatively easy entry and exit of enterprises—are important factors for economic development (Beck, 2010). The quality of business environment also varies between countries. This is evident from the World Bank’s Doing Business Indices, which rank countries based on their ease of establishing, running, and closing an enterprise; Viet Nam is currently ranked 99th out of 185 countries. The latest Global Competitiveness Report, published by the World Economic Forum, shows Viet Nam ranked 75th out of 144 countries and reports that the most problematic factor for doing business in the country is access to finance (Figure 10).
This section focuses on analyzing enterprises’ access to finance in Viet Nam to support our analysis of the performance of Viet Nam’s financial system later on. We will narrow our analysis further to small and medium-sized enterprises (SMEs) access to finance in Viet Nam, because SMEs account for a significant share of employment and GDP around the world, especially when taking into account the informal sector (Ayyagari, Beck and Demirgüç, 2007). In addition, several studies have found that SMEs create more jobs than large firms, both in developed and developing countries. Though SMEs also shed more jobs than large firms, job creation tends to outweigh job destruction thus, net job creation is still higher in SMEs compared with large firms (Aterido, Hallward-Driemeier and Pagés, 2009; Klapper and Richmond, 2009;Neumark et al., 2008). This reflects the innovative, competitive, and dynamic nature of SMEs. The fact that SMEs tend to be smaller in developing countries (Tybout, 2000; Sleuwaegen and Goedhuys, 2002; Snodgrass and Biggs, 1996) suggests that they face greater constraints to growth, including financial constraints.
Since the beginning of the past decade, Viet Nam has witnessed a significant development in the SMEs sector. Along with Viet Nam’s membership in the World Trade Organization at the end of 2007, the financial and capital markets have been opened and liberalized. Most of the barriers previously encountered by enterprises in business registration and financial services have been removed, thus facilitating business entities engaging not only in domestic but also international
Source: World Economic Forum. 2013.
18.2
0 5 10 15 20
Restrictive labor regulations Crime and theft
Poor public health Insufficient capacity to innovate
Government instability/coups Foreign currency regulations
Inefficient government bureaucracy Corruption
Tax rates Poor work ethic in national labour force
Tax regulations Policy instability
Inadequately educated workforce Inadequate supply of infrastructure
Inflation Access to finance
% Responses
Figure 10: The Most Problematic Factors for Doing Business in Viet Nam, 2012–2013 (% of responses)

Fina
ncia
l Sou
ndne
ss In
dica
tors
for F
inan
cial
Sec
tor S
tabi
lity i
n V
iet N
am8
financial markets. These entities have provided capital resources for Viet Nam’s businesses, which created more opportunities for the further development of the SME sector. Viet Nam has also facilitated all short-, medium-, and long-term components in both primary and secondary markets, ensuring liquidity and an efficient market mechanism for financial products. The quality of financial services has also improved, and the availability of various financial products has encouraged the development of the SMEs sector (Figure 11).
Along with the benefits from integration into the world economy, Viet Nam also had to face more difficulties and challenges from unfavorable externalities. Specifically, the global financial crisis in 2007–2008 has had a negative impact on SMEs’ employment, output, sales, and exports. Low profitability resulting from the crisis adversely affected SMEs’ creditworthiness. At the same time, Viet Nam’s financial institutions have become increasingly risk-averse in expanding financial access to SMEs and, in many cases, have tightened credit conditions, thus further worsening SMEs’ financial access.
According to SME surveys (CIEM, 2009 and 2011), the proportion of SMEs that made new investments since the last survey decreased slightly, from 60.9% in 2009 to 56.2% in 2011. The proportion of enterprises making new investments in all categories in 2011 was smaller than that in 2009, whether micro, small-, or medium-, firms (Table 2).
Source: Business-in-Asia.com.http://www.business-in-asia.com/vietnam/sme_in_vietnam.html
0
20,000
40,000
60,000
80,000
100,000
120,000
2000 2001 2002 2003 2004 2005 2006 2007 2008 2009 2010
Figure 11: Number of New Small and Medium-Sized Enterprises, 2000–2010
Table 2: Proportion of New Investments by Small and Medium-Sized Enterprises, 2009 and 2011
SME group
2009 2011
Sample No.
Proportion of new SMEs Sample
No.
Proportion of new SMEs
Investments (%) Investments (%)All 2,508 60.90 2,446 56.2Micro 1,682 53.6 1,686 49.8Small 664 73.5 616 67.4Medium 162 84.6 144 83.3Household 1,672 54.4 1,587 50.5Nonhousehold 836 73.8 859 66.7Urban 1,090 53.6 1,048 52.9Rural 1,418 66.5 1,398 58.7South 1,041 50.8 1,032 45.3North 1,467 68.0 1,414 64.1SMEs = Small and medium-sized enterprises.Source: Central Institute for Economic Management (CEIM), 2011. Small-Medium Enterprise Survey.

Mac
roec
onom
ic D
evel
opm
ents
9
Access to financial services such as credit, savings, insurance, and payment facilities, etc., can help firms start up and expand their businesses during their life cycle. Firms often rely on informal funding sources in the very early stages of their development. External sources, however, will be essential as firms become more mature and start expanding, and their availability can decisively determine the growth trajectory of SMEs (Klapper, Laeven and Rajan, 2006). These observations are also true in Viet Nam, as evidenced by the results from a survey conducted by Vo Tri Thanh et al. (2011) for SMEs operating in the textiles and garment, automotive components manufacturing, and electrical and electronics industries (Table 3).
While internal financing sources typically include entrepreneurs’ own savings, retained earnings, or funding through the sale of assets, external sources can be informal (from family or friends or supplier finance) and formal (debt and equity). The SME survey conducted by CIEM in 2009 and 2011 revealed three major sources of finance used by Vietnamese SMEs: retained earnings, formal loans and informal loans. From 2009 to 2011, the average amount of investments financed from retained earnings increased from about 35.0% to about 45.0%, while the average amount of investments financed by both formal loans and informal loans decreased (Figure 12). Firms found it more difficult to seek external finance during this period and switched to internal finance as a safer source of funding, implying that SMEs faced some obstacles in accessing credit.
Bank financing appears to be the largest and most important source of external finance for SMEs. They typically need a variety of additional financial services that only commercial banks are well-positioned to provide cash management, insurance, transfers, and other transactional products. Under sustainable finance, banks assist their SME clients along the road to environmentally sustainable business practices by offering specific financing instruments (Jeucken, 2005). Since the credit system in Viet Nam has not been well developed, the instruments offered by Vietnamese commercial banks are mostly financial loans with varying terms. Even though the development of the financial market has helped the private banking system grow dramatically and gain a larger share, Vietnamese enterprises still seek formal credit mostly from state-owned commercial banks
Table 3. Sources of Finance for Small and Medium-Sized Enterprises (% of surveyed enterprises with access to those sources)
Source of Finance For Start-upFor Business
OperationPersonal savings of business owner(s) 43.8 30.8Commercial or personal loans and credit lines from financial institutions including credit cards
37.9 53.3
Loans from individuals unrelated to the firm or its owner (“angels”) 21.9 10.7Loans from friends or relatives of business owner(s) 9.5Loans from employees 3Others 9.5 9.5Retained earnings 8.9 52.7Trade credit owing to suppliers 5.9 16Microcredit 3.6 6.5Leasing 2.4 5.9Credit from government lending agencies or government grants 0.6 5.9Source: Vo Tri Thanh et al. 2011.
0
10
20
30
40
50
60
Retainedearnings
Formalloans
Informalloans
2009 2011
Source: Central Institute for Economic Management (CEIM), various years. Small-Medium Enterprise Survey.
Figure 12: How Investment by Small and Medium-Sized Enterprises
Was Financed in 2009 and 2011

Fina
ncia
l Sou
ndne
ss In
dica
tors
for F
inan
cial
Sec
tor S
tabi
lity i
n V
iet N
am10
(SOCBs). Based on the data from the SME Survey 2009 (CIEM, 2009), nearly 69.0% of SMEs reported that their primary formal credit institutions were SOCBs followed by social policy banks (12.3%) and private/joint stock banks (10.0%). Foreign banks, development assistance funds, targeted programs and other sources of formal credit were much less favored by SMEs (Figure 13). These figures might be different at the moment, because joint-stock commercial banks (JSCBs) have operated actively and gradually grabbed more market share from SOCBs.
Financial constraints can appear when firms apply for formal loans from credit institutions. According to SME Surveys conducted by CIEM in 2007, 2009, and 2011, the number of SMEs applying for formal loans has decreased dramatically, from about 750 in 2007 and 2009 to nearly 600 in 2011 (Table 4). The proportion decreased as well (37.1% in 2007, 36.5% in 2009, and 29.9% in 2011). The proportion of SMEs encountering problems when they applied for formal loans has risen sharply, from about 20.0% in 2007 and 2009 to 28.0% in 2011. These figures clearly point out that SMEs’ access to formal credit has decreased over time.
In addition, the surveys revealed that SMEs that did not apply for formal credit may also have credit constraints. Figure 14 shows the main reasons why SMEs did not apply for loans. During 2007, 2009, and 2011, over 55.0% of SMEs did not apply for formal loans because they felt that they did not need them, about 15.0% did not want to incur debt, and 2.0% were already heavily indebted. SMEs citing these reasons cannot be classified as having credit constraints. In contrast, SMEs that cited other reasons for not applying for loans such as inadequate collateral, too difficult process, too high interest rate, or others, could certainly be classified as having credit constraints. The proportion of SMEs that have experienced credit constraints has increased gradually over time (Figure 15).
Table 4: Small and Medium-Sized Enterprises Access to Formal Credit, 2007, 2009, and 2011
2007 2009 2011Yes No Yes No Yes No
Enterprise that appliedNumber 751 1,275 740 1,286 597 1,401 (%) 37.1 62.9 36.5 63.5 29.9 70.1
Problems getting loanNumber 154 597 150 590 168 429 (%) 20.5 79.5 20.3 79.7 28.1 72.9
Note: Data in 2007 and 2009 are from the balanced sample (i.e., includes only enterprises present in both 2007 and 2009 surveys), with 2,026 enterprises. Data in 2011, with 1,998 enterprises, are also from the balanced sample, but are compared only with 2009 data. Since the difference between the two balanced samples is not too large, we can compare them for both phenomena and trends.Source: Central Institute for Economic Management (CEIM), various years. Small-Medium Enterprise Survey.
69%
10%
1%
12%
3% 1% 3% 1%
State Owned Commercial Banks (SOCBs) Joint Stock Commercial Banks (JSCBs) Foreign Banks Social Policy Bank Development Assistance Fund (DAF)
Targeted Programs
Others
Missing Information
Source: Central Institute for Economic Management (CEIM), various years. Small-Medium Enterprise Survey.
Figure 13: Small and Medium-Sized Enterprises Primary Formal Credit
Institutions, 2009

Mac
roec
onom
ic D
evel
opm
ents
11
SMEs could also use informal loans as another source of credit, although the use of informal loans does not necessarily mean that they had credit constraints when applying for formal loans. Table 5 summarizes the comparison between the uses of these two credit sources based on the survey conducted in 2011. It is clear that the proportion of SMEs obtaining informal loans (64.7%) was more than twice that of SMEs obtaining formal loans (29.0%). Moreover, more than half of SMEs, or 1,024 of 1,729, preferred informal financing, implying that SMEs still preferred this financing scheme.
To summarize, according to survey results from CIEM (2007, 2009, and 2011), Vietnamese SMEs have faced greater financial constraints recently. This is evidenced by the following: (i) fewer SMEs made new investments in 2011 compared to 2009; (ii) SMEs have tended to use retained earnings rather than new loans, both formal and informal, since 2009; and (iii) the number of SMEs having difficulties in applying for formal loans has also increased over time. Thus, it makes sense that SMEs still favored informal financing as another source of credit.
Source: Central Institute for Economic Management (CEIM), various years. Small-Medium Enterprise Survey.
0 10 20 30 40 50 60 70
Other
Already heavily indebted
Interest rate too high
Didn't need one
Process too difficult
Didn't want to incur debt
Inadequate collateral
2007 2009 2011
Figure 14: Reasons Why Small and Medium-Sized Enterprises Did Not Apply for Loans, 2007, 2009, and 2011 (% surveyed)
Source: Central Institute for Economic Management (CEIM), various years. Small-Medium Enterprise Survey.
0 5
10 15 20 25 30 35
2007 2009 2011
Figure 15: Proportion of Small and Medium-Sized Enterprises with
Credit Constraints, 2007, 2009, and 2011
(%)
Table 5: Comparison between the Use of Formal and Informal Loans in 2011
Loan Formal LoanYes No Total %
Info
rmal
Loa
n Yes (number) 560 1,024 1,584 –64.7 (%) –35.4 –64.6 –100.0No (number) 159 705 864 –35.3 (%) –18.4 –81.6 –100.0Total (number) 719 1,729 2,448 100.0 (%) –29.4 –70.6 –100.0
Source: Central Institute for Economic Management (CEIM), 2011. Small-Medium Enterprise Survey.

12
2. banking Sector
For years, Viet Nam’s financial market had been a mono-bank system, consisting only of the State Bank of Viet Nam (SBV), until a banking reform in 1988–1989 transformed it into a two-tier system. There has been a substantial and sharp increase in the number of financial intermediaries, including
commercial banks and nonbank institutions, since the reforms. Nevertheless, Viet Nam demonstrates specific features of a bank-based financial system where banks are dominant players.
Viet Nam’s financial intermediaries are relatively diversified in form and scale, including state-owned commercial banks (SOCBs), private commercial banks, foreign commercial banks, financial and leasing companies, credit funds, and other microcredit organizations. Commercial banks are the most important component of Viet Nam’s financial market, with more than 80.0% market share in credit supply and deposit mobilization. Due to the underdeveloped financial market, social capital is primarily allocated by commercial banks. Commercial banks are in charge of providing both short- and long-term loans to borrowers.
As of 31 December 2012, Viet Nam’s banking sector comprises 5 SOCBs, 34 joint-stock commercial banks, 50 foreign bank branches, 4 joint venture banks, 5 wholly foreign-owned banks, 18 finance companies, 12 leasing companies, and 49 representative office of foreign banks. This section will focus on Viet Nam’s commercial banking sector.
Until recently, Viet Nam made significant progress toward liberalizing its banking sector, which allowed foreign banks to operate in the Vietnamese market. Figure 16 partly shows the structure of the banking sector (excluding financing and leasing companies because of lack of data), which indicates that the number of foreign bank branches operating in Viet Nam has increased over time, but hey are still small compared to other countries in the region. By the end of 2012, there were only seven banks having chartered capital of VND 10,000 billion and above (Figure 17).
SOCB = state-owned commercial bank, JSCB = joint stock commercial banks, FB = foreign bank, JVB = joint Viet Nam bank.Source: State Bank of Viet Nam, 2013.
37
34
40
39
37
37
34
31
41
44
45
53
50
50
5
5
5
5
5
4
4
0 20 40 60 80 100 120
2006
2007
2008
2009
2010
2011
2012
SOCBs JSCBs FBs JVBs
Figure 16: Number of Banks in Viet Nam, 2006–2012

Bank
ing S
ecto
r
13
SOCBs have dominated the sector. In 2005, both their deposit market share and credit were approximately 75.0% of the whole sector (VCBS, 2011). However, their domination did not last long, since joint-stock commercial banks (JSCBs) have been operating more actively and have gradually grabbed a large market share. JSCBs’ credit market share has more than doubled since 2005, reaching 47.1% by 2012, while that of SOCBs decreased to 43.4% (Figure 19). The same trend was true for the sector’s deposits market share (Figure 18).
Despite their successful operation, JSCBs’ capital size is still much smaller than that of SOCBs (Figure 17). It is clear that Eximbank and Sacombank still lead the group, although their chartered capital did not change in 2012 and those of SOCBs grew dramatically. Although MBBank was the only bank that increased its chartered capital in 2012, it was still ranked behind Eximbank and Sacombank.
Agribank = Viet Nam Bank for Agriculture and Rural Development, ACB = Asia Commercial Joint Stock Bank, BIDV = The Joint Stock Commercial Bank for Investment and Development of Viet Nam, Eximbank = Viet Nam Export Import Commercial Joint Stock Bank, MBB = Military Commercial Joint Stock Commercial Bank, MSB = Maritime Joint Stock Commercial Bank, TechcomBank = Viet Nam Technological and Commercial Joint Stock Bank, VietinBank = Viet Nam Bank for Industry and Trade, VPBank = Viet Nam Prosperity Joint Stock Commercial Bank.Source: Author's calculation from bank's financial statements.
0 10,000 20,000 30,000
MBBank
Maritimebank
Techcombank
Asia Commercial Bank
Sacombank
Eximbank
BIDV
Vietcombank
Vietinbank
Agribank
2012 2011 2010 2009
Figure 17: Chartered Capital of 10 Largest Banks in Viet Nam, 2009–2012 (VND billion)
SOCB = state-owned commercial bank, JSCB = joint stock commercial banks, FB = foreign bank, JVB = joint Viet Nam bank.Source: Vneconomy. 2012.
30.4 33.1 40.8 46.7 47.1 47.1
8.8 8.1 7.5 6.6 7.6 7.2
0% 10% 20% 30% 40% 50% 60% 70% 80% 90%
100%
2007 2008 2009 2010 2011 2012 SOCBs JSCBs JVBs and FBs Others
Figure 18: Deposits Market Share in Viet Nam, 2007–2012 (%)

Fina
ncia
l Sou
ndne
ss In
dica
tors
for F
inan
cial
Sec
tor S
tabi
lity i
n Vi
et N
am14
SOCB = state-owned commercial bank, JSCB = joint stock commercial banks, FB = foreign bank, JVB = joint Viet Nam bank.Source: Vneconomy. 2012.
27.7 26.5 32 35.1 35.5 34.8
9.2 11 9.1 9 8.6 8.5 3.8 4.4 4.8 4.5 4.6 4.9
0% 10% 20% 30% 40% 50% 60% 70% 80% 90%
100%
2007 2008 2009 2010 2011 2012
SOCBs JSCBs JVBs and FBs Others
Figure 19: Credit Market Share in Viet Nam, 2007–2012 (%)
In Viet Nam, there a group of 12 banks dominates the sector—the so-called G12 (Figure 20). These banks account for over 85.0% of market share, including four SOCBs (Agribank, Vietcombank, Vietinbank, and BIDV) and eight JSCBs. Among the JSCBs, four banks (ACB, STB, Techcombank, and Eximbank) that are relatively. These banks dominate (over 75.0%) in all major categories, including total assets, loans and advances to customers, total liabilities, and deposits from customers.
Agribank = Viet Nam Bank for Agriculture and Rural Development, ACB = Asia Commercial Joint Stock Bank, BIDV = The Joint Stock Commercial Bank for Investment and Development of Viet Nam, Eximbank = Viet Nam Export Import Commercial Joint Stock Bank, MBB = Military Commercial Joint Stock Commercial Bank, MSB = Maritime Joint Stock Commercial Bank, STB = SaiGonThuong Tin Joint Stock Commercial Bank, TechcomBank = Viet Nam Technological and Commercial Joint Stock Bank, VCB = Joint Stock Commercial Bank for Foreign Trade, VIBank = Viet Nam International Commercial Joint Stock Bank, VietinBank = Viet Nam Bank for Industry and Trade, VPBank = Viet Nam Prosperity Joint Stock Commercial Bank.Source: Authors’ calculations from banks’ financial statements.
14%
12%
10%
12% 4% 4% 4%
4%
4%
3% 2% 3%
24%
Total Assets
Agribank BIDV VCB Vietinbank
ACB Eximbank STB Techcombank
MBB MSB VIBank VPBank
Other banks
19%
14%
10%
14%
4% 3%
4%
3%
3% 1% 2% 2%
21%
Loans
15%
12%
10%
13% 4% 4%
4% 4%
4% 3% 1%
3%
23%
Total Liabilities
18%
12%
11% 11% 5% 3% 4%
4%
5% 2% 1%
2%
22%
Deposits from Customers
Figure 20: Domination of G12 Banks, 2012 (%)

Bank
ing S
ecto
r
15
Moreover, the domination of the four SOCBs is clear. They accounted for nearly 50.0% of total assets and liabilities and over 50.0% of total loans and advances to and deposits from customers. Our analysis below on FSIs will mainly focus on the performance of these banks, which will strongly influence the whole sector.
Table 6 illustrates the significance of Viet Nam’s banking system. Domestic credit provided by Viet Nam’s financial sector, especially the banking system, has increased over time. In 2000, the ratio of domestic credit provided by the financial sector to gross domestic product (GDP) was only 32.6%, even lower than the average ratio of lower middle-income countries. However, in 2010 this ratio was approximately 125.0%, demonstrating the increasing importance of Viet Nam’s banking system as the bloodstream of the economy. Thus, the soundness of the banking system is necessary for the stability of the national financial system and macroeconomy.
Table 6: Domestic Credit Provided by Financial Sector in Selected Countries, 2000, 2005, and 2010
(% of GDP)
Region/Country 2000 2005 2010Lower middle-income countries 50.6 49.9 58.7Low- and middle-income countries 66.8 74.4 92.2High-income countries 174.9 181.1 197.5China 119.7 134.3 146.3India 51.2 58.4 71.9Indonesia 60.7 46.2 36.4Viet Nam 32.6 65.4 124.7Uganda 12.2 8.6 17.1South Africa 152.5 185.9 191.7Russian Federation 24.9 22.1 37.5Brazil 71.9 74.5 96.3Source: World Bank database (accessed April 2014).

16
3. Financial Soundness of Viet nam’s banking Sector
3.1. Introduction to Financial Soundness Indicators
Financial soundness indicators (FSIs) assess the current financial health and soundness of the financial institutions in a country, and of their corporate and household counterparts. These include both aggregated individual institution data and indicators that are representative of the
markets in which the financial institutions operate. FSIs are calculated and disseminated to support macroprudential analysis. This is the assessment and surveillance of the strengths and vulnerabilities of financial systems, with the objective of enhancing financial stability and, in particular, limiting the likelihood of failure of the financial system.
Table 7: Financial Soundness Indicators: The Core and Encouraged Sets for Deposit-Takers
Core SetCapital adequacy Regulatory capital to risk-weighted assets
Regulatory Tier 1 capital to risk-weighted assetsNonperforming loans net of provisions to capital
Asset quality Nonperforming loans to total gross loansSectoral distribution of loans to total loans
Earnings and profitability Return on assetsReturn on equityInterest margin to gross incomeNoninterest expenses to gross income
Liquidity Liquid assets to total assets (liquid asset ratio)Liquid assets to short-term liabilities
Sensitivity to market risk Net open position in foreign exchange to capitalEncouraged Set
Capital to assetsLarge exposures to capitalGeographical distribution of loans to total loansGross asset position in financial derivatives to capitalGross liability position in financial derivatives to capitalTrading income to total incomePersonnel expenses to noninterest expensesSpread between reference lending and deposit ratesSpread between highest and lowest interbank rateCustomer deposits to total (noninterbank) loansForeign currency-denominated loans to total loansForeign currency-denominated liabilities to total liabilitiesNet open position in equities to capital
Source: International Monetary Fund (IMF). 2006. Financial Soundness Indicators - Compilation Guide.

Fina
ncia
l Sou
ndne
ss o
f Vie
t Nam
’s Ba
nkin
g Sec
tor
17
3.2. Compilation and Dissemination in Viet Nam
Though FSIs have been compiled and disseminated in many countries, including both developed and developing ones, they have not received much attention from Vietnamese policymakers and researchers. Normally, this task should be performed by a government agency like the central bank (State Bank of Viet Nam [SBV]) or the national supervisory organization (National Financial Supervisory Commission [NFSC]). Indeed, we can find FSIs for Vietnamese banking sector on the IMF website (Table 8). These indicators might be provided by SBV to the IMF. Recently, NFSC has released an overview report on Viet Nam’s financial markets. Some FSIs are also analyzed in this report. However, because we still cannot access the original data from either SBV or NFSC, we attempted to calculate FSIs manually from available data. Since we cannot calculate FSIs for all banks (explained below), our FSIs for the whole sector will not be the same as the FSIs on the IMF website. In the analysis below, we will also compare Our analysis also compares our calculation with the IMF indicators. For some indicators that are not available, we will refer to the figures in NFSC’s report to support our analysis.
3.2.1. Sources of Data
In this study, we only compile and disseminate FSIs for Vietnamese deposit-takers, since Viet Nam’s credit institutions play a dominant role, accounting for 91.0% in credit market share and 89.0% in asset share of the whole sector. The data were collected from financial statements of 35 Vietnamese commercial banks, including SOCBs and JSCBs. The collection of these statements was difficult because some banks do not have high-quality websites. Fortunately, we can still find those statements in Vietstock, a finance and securities information portal founded in 2000.3
We attempt to collect the financial statements of all banks from 2008 to 2012 (excluding joint venture banks and foreign banks’ branches). However, we were unable to collect all those statements for this time horizon because some banks did not publicly disclose their reports in some years
3 http://vietstock.vn/
Table 8: Financial Soundness Indicators of Viet Nam’s Banking Sector on International Monetary Fund Website, 2008–2012
2008 2009 2010 2011 2012Regulatory Capital to Risk-Weighted Assets 13.88 12.03 11.33 12.90 11.85Regulatory Tier 1 Capital to Risk-Weighted Assets 13.74 11.89 10.41 11.89 12.86Nonperforming Loans Net of Provisions to Capital 7.92 6.91 7.29 10.17 14.77Nonperforming Loans to Total Gross Loans 2.15 1.80 2.09 2.79 3.44Return on Assets 1.38 1.61 1.55 1.49 0.79Return on Equity 15.34 18.37 17.74 16.36 8.18Interest Margin to Gross Income 69.06 67.34 71.96 79.30 79.63Noninterest Expenses to Gross Income 45.56 48.22 47.03 48.08 55.62Liquid Assets to Total Assets (Liquid Asset Ratio) 31.60 28.40 29.03 13.30 13.41Capital to Assets 8.97 8.60 8.87 9.30 9.93Gross Asset Position in Financial Derivatives to Capital 0.47 0.34 0.17 0.53 0.16Gross Liability Position in Financial Derivatives to Capital
0.01 0.42 3.16 0.09 0.06
Trading Income to Total Income 9.21 9.80 4.98 2.66 0.67Personnel Expenses to Noninterest Expenses 94.29 92.79 91.58 88.47 89.64Customer Deposits to Total (Noninterbank) Loans 107.31 98.54 97.75 94.35 99.94Foreign-Currency-Denominated Loans to Total Loans 21.87 16.49 11.41 9.53 8.01Commercial Real Estate Loans to Total Loans 10.67 7.78 7.48Source: International Monetary Fund—International Finance Statistics. 2014.

Fina
ncia
l Sou
ndne
ss In
dica
tors
for F
inan
cial
Sec
tor S
tabi
lity i
n Vi
et N
am18
(e.g., Agribank’s 2012 financial statements or SCB’s 2011 financial statements). Additionally, some banks were only established and will not have all financial statements since 2008 (e.g., Baovietbank).
3.2.2. Availability of Financial Soundness Indicators for Vietnamese Commercial Banks
To compile and disseminate FSIs, we need not only financial statements, but also their notes. These notes are often available in auditing reports (preferably from the Big 4 accounting firms). Because banks include those notes in their annual reports, while other banks do not. Since all financial statements and their notes are not available for all banks, some FSIs are only calculated for a small number of banks.
For the core set, all indicators reflecting earnings and profitability and one indicator reflecting liquidity (liquid assets to total assets) are available for all banks. The regulatory capital to risk-weighted assets (CAR) ratio cannot be compiled from the financial statements, because we do not have information about credit risk of assets, so it is impossible to calculate risk-weighted assets (see below). However, we were able to use the CAR ratio of some banks that computed and disclosed this ratio. The nonperforming loans ratio and the nonperforming loans net of provisions to capital ratio can only be compiled for some banks with financial statements’ notes that are available as well.
For the encouraged set, only four indicators can be compiled from Vietnamese commercial banks’ financial statements. these, three indicators are available for all banks, and the personnel expenses to noninterest expenses ratio is available for most banks.
3.2.3. Results of Selected Financial Soundness Indicators for Viet Nam
Based on the methodology introduced by IMF, we attempt to compute FSIs for Viet Nam’s deposit-takers and use them to analyze the strengths and vulnerabilities under the headings of capital adequacy, asset quality, earnings and profitability, liquidity, and sensitivity to market risk. This is commonly known as the CAMELS framework used by banking supervisors to assess the soundness of individual institutions, less—for FSI purposes—the “M”, which represents the quality of management.
As mentioned above, Viet Nam’s banking sector is dominated by G12 banks. Additionally, since the number of banks is too large, we can only draw figures of indicators for several selected banks, which we will choose from the G12 group. However, our analysis will also mention the calculated indicators of other banks, if possible. The indicators for the banking system are computed from the indicators of available banks, so that it can only capture a major part of the whole picture. Thus, we will compare our calculations with IMF’s and NFSC’s levels to truly measure the soundness of the whole system.
Capital Adequacy
The CAR ratio, which measures the capital adequacy of deposit-takers and is based on the definitions used in Basel Capital Accord, is one of the most important FSIs. To compute this ratio, we need regulatory capital and Tier 1 capital as numerators and risk-weighted assets as denominators. Regulatory capital and Tier 1 capital are both available in banks’ financial statements. However, as mentioned below, it is not possible to aggregate risk-weighted assets for Vietnamese commercial banks because of the lack of data and information. Theoretically, we can compute risk-weighted assets based on Circular No. 13/2010/TT-NHNN, issued by the SBV. The Circular introduced detailed instructions for categorizing banks’ assets according to risk coefficients. However, there are many

Fina
ncia
l Sou
ndne
ss o
f Vie
t Nam
’s Ba
nkin
g Sec
tor
19
differences between types of assets indicated in the Circular and the types of assets reported in banks’ financial statements. Thus, we cannot categorize banks’ assets based on the Circular’s instructions. NFSC’s staffs also said that they cannot compute risk-weighted assets for individual banks. What they have are only the numerator and the denominator for the whole system. However, some banks did calculate and disclose CAR ratios and reported them in their financial statements, which we can use instead. Figure 21 presents all available CAR ratios for G12 banks.
Before 2010, the minimum capital adequacy ratio required by SBV was 8.0%, as high as the Basel requirement. In October 2010, the SBV raised the minimum capital adequacy ratio to 9.0%. It seemed that G12 banks did not find it difficult to meet SBV’s requirements on CAR ratio. Despite being lower than 9% in 2008–2010, banks’ CAR ratios all increased to higher than 9.0% in 2011 and 2012. The same trends were also observed in small banks (not presented in Figure 20). According to data from the IMF website (Table 8) and NFSC’s report (Figure 22), the CAR ratio and the Tier 1 capital to risk-weighted assets of the whole sector were all stable at around 11.0%–13.0%, showing that Vietnamese banks were well prepared to absorb shocks on its balance-sheet items. However, the reliability of these figures needs to be reconsidered.
The capital to assets ratio is used to measure the extent to which assets are funded by own funds and is also a measure of the capital adequacy of the banking sector. This ratio is easily computed and available for all banks. It seems that the average level of the whole sector was quite stable at
ACB = Asia Commercial Joint Stock Bank, BIDV = The Joint Stock Commercial Bank for Investment and Development of Viet Nam, Eximbank = Viet Nam Export Import Commercial Joint Stock Bank, MBB = Military Commercial Joint Stock Commercial Bank, MSB = Maritime Joint Stock Commercial Bank, STB = SaiGonThuong Tin Joint Stock Commercial Bank, TechcomBank = Viet Nam Technological and Commercial Joint Stock Bank, VCB = Joint Stock Commercial Bank for Foreign Trade, VIBank = Viet Nam International Commercial Joint Stock Bank, VietinBank = Viet Nam Bank for Industry and Trade, VPBank = Vietnam Prosperity Joint Stock Commercial Bank.Source: Authors’ calculations from banks’ financial statements.
8%
9%
0%
5%
10%
15%
20%
25%
30%
BIDV
VCB
VietinBank
Eximbank
STB ACB
TechcomBank MBB
VIBank
VPBank MSB
2008 2009 2010 2011 2012
Figure 21: Regulatory Capital to Risk-Weighted Assets of G12 Banks, 2008–2012 (%)
Source: National Financial Supervisory Commission. 2014.
9%
10%
11%
12%
13%
14%
15%
Jun-10 Dec-10 Jun-11 Dec-11 Jun-12 Dec-12 Jun-13 Dec-13
Regulatory capital to risk-weighted assets Tier 1 capital to risk-weighted assets
Figure 22: Capital Adequacy of Viet Nam’s Banking System, 2010–2013 (%)
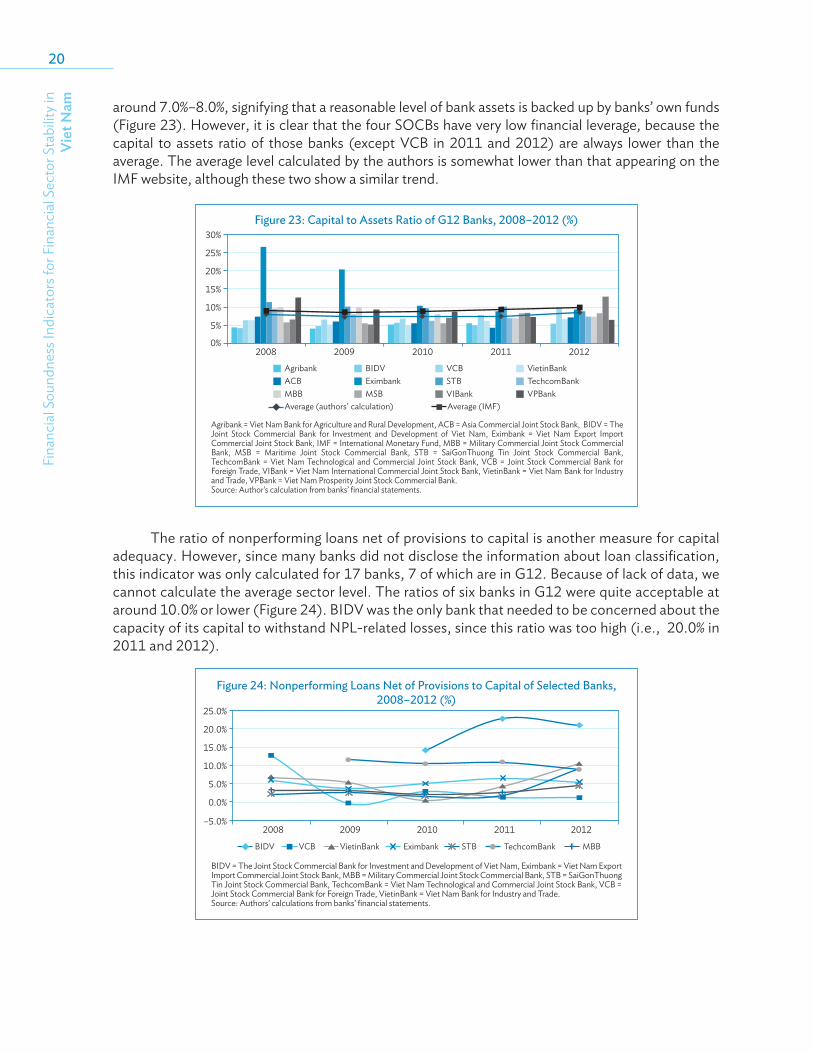
Fina
ncia
l Sou
ndne
ss In
dica
tors
for F
inan
cial
Sec
tor S
tabi
lity i
n Vi
et N
am20
around 7.0%–8.0%, signifying that a reasonable level of bank assets is backed up by banks’ own funds (Figure 23). However, it is clear that the four SOCBs have very low financial leverage, because the capital to assets ratio of those banks (except VCB in 2011 and 2012) are always lower than the average. The average level calculated by the authors is somewhat lower than that appearing on the IMF website, although these two show a similar trend.
The ratio of nonperforming loans net of provisions to capital is another measure for capital adequacy. However, since many banks did not disclose the information about loan classification, this indicator was only calculated for 17 banks, 7 of which are in G12. Because of lack of data, we cannot calculate the average sector level. The ratios of six banks in G12 were quite acceptable at around 10.0% or lower (Figure 24). BIDV was the only bank that needed to be concerned about the capacity of its capital to withstand NPL-related losses, since this ratio was too high (i.e., 20.0% in 2011 and 2012).
Agribank = Viet Nam Bank for Agriculture and Rural Development, ACB = Asia Commercial Joint Stock Bank, BIDV = The Joint Stock Commercial Bank for Investment and Development of Viet Nam, Eximbank = Viet Nam Export Import Commercial Joint Stock Bank, IMF = International Monetary Fund, MBB = Military Commercial Joint Stock Commercial Bank, MSB = Maritime Joint Stock Commercial Bank, STB = SaiGonThuong Tin Joint Stock Commercial Bank, TechcomBank = Viet Nam Technological and Commercial Joint Stock Bank, VCB = Joint Stock Commercial Bank for Foreign Trade, VIBank = Viet Nam International Commercial Joint Stock Bank, VietinBank = Viet Nam Bank for Industry and Trade, VPBank = Viet Nam Prosperity Joint Stock Commercial Bank.Source: Author’s calculation from banks’ financial statements.
0%
5%
10%
15%
20%
25%
30%
2008 2009 2010 2011 2012
Agribank BIDV VCB VietinBank ACB Eximbank STB TechcomBank MBB MSB VIBank VPBank Average (authors' calculation) Average (IMF)
Figure 23: Capital to Assets Ratio of G12 Banks, 2008–2012 (%)
BIDV = The Joint Stock Commercial Bank for Investment and Development of Viet Nam, Eximbank = Viet Nam Export Import Commercial Joint Stock Bank, MBB = Military Commercial Joint Stock Commercial Bank, STB = SaiGonThuong Tin Joint Stock Commercial Bank, TechcomBank = Viet Nam Technological and Commercial Joint Stock Bank, VCB = Joint Stock Commercial Bank for Foreign Trade, VietinBank = Viet Nam Bank for Industry and Trade.Source: Authors’ calculations from banks’ financial statements.
–5.0%
0.0%
5.0%
10.0%
15.0%
20.0%
25.0%
2008 2009 2010 2011 2012
BIDV VCB VietinBank Eximbank STB TechcomBank MBB
Figure 24: Nonperforming Loans Net of Provisions to Capital of Selected Banks, 2008–2012 (%)

Fina
ncia
l Sou
ndne
ss o
f Vie
t Nam
’s Ba
nkin
g Sec
tor
21
Asset Quality
The most important indicator to measure asset quality is the ratio of nonperforming loans (NPLs) to total gross loans. Similar to the ratio of NPLs net of provisions to capital, this indicator can only be calculated for 17 banks, of which 7 are G12 banks. Excepting the ratios for PG Bank and SHB in 2012, all other ratios were quite low, indicating that Vietnamese banks did not have many NPLs (Table 9). However, the reliability of these data can be a problem, as NPLs have been regarded as one of the most serious issues of the banking sector recently. In accordance with reports from the State Bank, nonperforming loans of most banks stood below the safe level of 5.0%, in line with international practices. However, many experts and international financial institutions such as the World Bank and IMF believe that the ratio has not reflected the essence of credit risks of banks because criteria on loan classification in Viet Nam are not compatible with international criteria. Moreover, “refunding” to make financial statements of banks appear more pleasing is common. According to Fitch Ratings, nonperforming loans of Viet Nam’s commercial banks was approximately 13.0% of their total loans, or
about VND 300 trillion. Many experts estimates that NPLs of banks may have reached 7.0%–8.0%, or even above 10.0% (Ho Ba Tinh, 2012). Nguyen Hong Son, et al. (2012) estimated that the NPLs ratio of the Vietnamese banking sector was 8.2% – 14.0%. If this estimate was accurate, then the real NPLs ratio of Vietnamese banks must be questionable.
According to NFSC’s report, the proportion of NPLs and overdue loans by the end of 2013 decreased dramatically compared to the end of 2012 (Figure 25). This reflects the outcome of banks’ efforts to address nonperforming loan problems. From 2012 to 2013, the amount of written-off NPLs was VND 105.9 thousand; of these, the Viet Nam Asset Management Company (VAMC) has helped banks to write off approximately VND 40 thousand (NFSC, 2014).
Source: National Financial Supervisory Commission. 2014.
10%
13% 11% 11%
9%
3% 5% 4% 5%
4%
0%
2%
4%
6%
8%
10%
12% 14%
Dec-11
Jun-12
Dec-12
Jun-13
Dec-13
Overdue loans Nonperforming loans
Figure 25: Overdue Loans and Nonperforming Loans in Viet Nam’s
Banking System, 2011–2013 (%)
Table 9: Nonperforming Loans to Total Gross Loans of Selected Banks, 2008–2012 (%)
BIDV VCB Vietin Bank Exim Bank STB Techcom Bank
MBB DongA Bank
HD Bank
2008 2.7 4.6 1.8 4.7 0.6 2.5 1.9 2.6 1.92009 2.8 2.5 0.6 1.8 0.6 2.5 1.7 1.3 1.12010 2.7 2.8 0.7 1.4 0.5 2.3 1.4 1.6 0.82011 3.0 2.0 0.8 1.6 0.6 2.8 1.6 1.7 2.42012 2.9 2.4 1.5 1.3 2.1 2.7 1.9 4.0 4.3
KienLong Bank
LienViet Postbank
MDB NaVi Bank Ocean Bank PG Bank PNB SHB
2008 0.6 0.0 0.8 2.9 1.4 1.4 2.3 1.92009 1.2 0.3 2.9 2.5 1.6 1.2 2.3 2.82010 1.1 0.4 1.3 2.2 1.7 1.4 1.8 1.42011 2.8 2.1 2.1 2.9 2.1 2.1 2.3 2.22012 2.9 2.7 0.0 5.6 3.5 8.4 3.0 8.8BIDV = The Joint Stock Commercial Bank for Investment and Development of Viet Nam, DongABank = DongA Joint Stock Commercial Bank, Eximbank = Viet Nam Export Import Commercial Joint Stock Bank, HDBank = Housing Development Commercial Joint Stock Bank, KienLongBank = Kienlong Commercial Joint Stock Bank, LienVietPostBank = Lien Viet Post Joint Stock Commercial Bank, MBB = Military Commercial Joint Stock Commercial Bank, MDB = Mekong Development Joint Stock Commercial Bank, NaViBank = Nam Viet Joint Stock Commercial Bank, OceanBank = Ocean Commercial Joint Stock Bank, PGBank = Petrolimex Group Joint Stock Commercial Bank, PNB = Southern Joint Stock Commercial Bank, SHB = Saigon Hanoi Joint Stock Commercial Bank, STB = SaiGonThuong Tin Joint Stock Commercial Bank, TechcomBank = Viet Nam Technological and Commercial Joint Stock Bank, VCB = Joint Stock Commercial Bank for Foreign Trade, VietinBank = Viet Nam Bank for Industry and Trade.Source: Author’s calculation from banks’ financial statements.

Fina
ncia
l Sou
ndne
ss In
dica
tors
for F
inan
cial
Sec
tor S
tabi
lity i
n Vi
et N
am22
Because many banks did not disclose full information on their loans, we cannot compute the indicators measuring distribution of loans. Fortunately, we can find them in NFSC’s report (Figure 26). It is clear that the sector distribution of loans changed slightly in 2011 – 2013. A high proportion of banks’ loans were still found in agriculture, manufacturing, and construction, while credit for trade, transportation, and telecommunications by the end of 2013 decreased, compared to the beginning of the year. The highest credit growth was observed in agriculture, due to the credit support policy documented in Resolution No. 01/NQ-CP on 7 January 2013. Moreover, the proportion of foreign-currency loans has decreased dramatically, from 22.0% in 2011 to 15.0% in 2013, which helped reduce exchange rate pressure. The distribution of loans based on maturity did not show any significant change during this period (Table 10).
Earnings and Profitability
Return on assets ROA indicate Vietnamese commercial banks’ worst performance in 2012. The average indicator for 35 banks had been quite stable at around 1.3% in 2008–2011, before falling to approximately 1.1% in 2012 (Figure 27). This trend is similar to the indicators on the IMF website and in the NFSC report, except for 2012. Among G12 banks, ACB, Techcombank, and MSB needed to be more concerned with their performance, because their ratios were much lower in 2012, compared to 2011 and before. For the whole sector, this indicator increased in 2012 for only 6 of 35 banks, including ABBank, BIDV, MHB, SaiGonBank, SHB, and VIBank.
The average return on equity (ROE) for the banking sector was quite stable in 2009–2011, about nearly 17.0%–18.0% (Figure 28). However, similar to the return on assets ratio, the year 2012 did not show any brighter prospect for Vietnamese commercial banks, and ROE dropped to 12.5%.
Source: National Financial Supervisory Commission. 2014.
30% 32% 29% 29% 28%
9% 9% 9% 9% 10%
22% 21% 20% 19% 19%
6% 5% 4% 4% 4%
25% 24% 28% 29% 28%
0%
20%
40%
60%
80%
100%
Dec-11 Jun-12 Dec-12 Jun-13 Dec-13 Agriculture Manufacturing Construction Trade
Transportation and telecommunications Other services
Figure 26: Sector Distribution of Loans to Total Loans of Viet Nam’s Banking System, 2011–2013 (%)
Table 10: Distribution of Loans Based on Types of Currency and Maturity, 2011–2013 (%)
December 2011
June 2012
December 2012
June 2013
December 2013
VND loans 78 78 81 83 85Foreign-currency loans 22 22 19 17 15Short-term loans 59 59 58 59 58Long-term loans 41 41 42 41 42Source: National Financial Supervisory Commission. 2014.

Fina
ncia
l Sou
ndne
ss o
f Vie
t Nam
’s Ba
nkin
g Sec
tor
23
This indicator decreased for all G12 banks, except BIDV, in that year. Among 35 banks studied, ROE decreased for 31, except BIDV, ABBank, MHB, and SHB. Some banks’ ROE even fell by more than 50.0% (ACB, BaoVietBank, HDBank, etc.). In one extreme case, NaViBank did not show any efficiency in using capital in 2012, since its ROE decreased to nearly zero. In 2008–2010, the average level computed by the authors is approximately equal to the level on the IMF website. However, in 2011–2012, the latter seems to be lower than the former, while still showing a similar trend. The figures in the NFSC report also shows a similar trend, although they seem to be lower than both the figures in the IMF website and author’s calculations.
Agribank = Viet Nam Bank for Agriculture and Rural Development, ACB = Asia Commercial Joint Stock Bank, BIDV = The Joint Stock Commercial Bank for Investment and Development of Viet Nam, Eximbank = Viet Nam Export Import Commercial Joint Stock Bank, IMF = International Monetary Fund, MBB = Military Commercial Joint Stock Commercial Bank, MSB = Maritime Joint Stock Commercial Bank, NFSC = National Financial Supervisory Committee, STB = SaiGonThuong Tin Joint Stock Commercial Bank, TechcomBank = Viet Nam Technological and Commercial Joint Stock Bank, VCB = Joint Stock Commercial Bank for Foreign Trade, VIBank = Viet Nam International Commercial Joint Stock Bank, VietinBank = Viet Nam Bank for Industry and Trade, VPBank = Viet Nam Prosperity Joint Stock Commercial Bank.Source: Author’s calculation from banks’ financial statements.
0% 5%
10% 15% 20% 25% 30% 35% 40%
2008 2009 2010 2011 2012
Agribank BIDV VCB VietinBank ACB Eximbank STB TechcomBank MBB MSB VIBank VPBank Average (authors' calculation) Average (IMF) Average (NFSC)
Figure 28: Return on Equity of G12 Banks, 2008–2012 (%)
Agribank = Viet Nam Bank for Agriculture and Rural Development, ACB = Asia Commercial Joint Stock Bank, BIDV = The Joint Stock Commercial Bank for Investment and Development of Viet Nam, Eximbank = Viet Nam Export Import Commercial Joint Stock Bank, IMF = International Monetary Fund, MBB = Military Commercial Joint Stock Commercial Bank, MSB = Maritime Joint Stock Commercial Bank, NFSC = National Financial Supervisory Committee, STB = SaiGonThuong Tin Joint Stock Commercial Bank, TechcomBank = Viet Nam Technological and Commercial Joint Stock Bank, VCB = Joint Stock Commercial Bank for Foreign Trade, VIBank = Viet Nam International Commercial Joint Stock Bank, VietinBank = Viet Nam Bank for Industry and Trade, VPBank = Viet Nam Prosperity Joint Stock Commercial Bank.Source: Author’s calculation from banks’ financial statements.
0.0%
0.5%
1.0%
1.5%
2.0%
2.5%
3.0%
2008 2009 2010 2011 2012
Agribank BIDV VCB VietinBank ACB Eximbank STB TechcomBank MBB MSB VIBank VPBank Average (authors' calculation) Average (IMF) Average (NFSC)
Figure 27: Return on Assets of G12 Banks, 2008–2012 (%)

Fina
ncia
l Sou
ndne
ss In
dica
tors
for F
inan
cial
Sec
tor S
tabi
lity i
n Vi
et N
am24
According to NFSC (2014), Vietnamese banks’ profits decreased in 2013 because provisions to NPLs increased (Figure 29) to VND 52,234 billion, 2.8% lower than the end of 2012. The ratio of provisions to NPLs to profits before loss provisions also decreased, from 61.3% in 2012 to 56.6% in 2013.
The whole banking sector showed an upward trend during 2008–2012 (Figure 30). After slightly decreasing in 2009, it bounced back to a 90.0% increase in 2011. In 2012, the ratio was 85.0%, which was still impressive compared to other regional countries (NFSC, 2014). The level on the IMF website also shows a similar trend, although somewhat lower. The results show that Vietnamese banks still rely on interest income from loans. Some banks even had to use such income to compensate for losses from performing in foreign exchange or stock markets like ACB (117.8%), MDB (101.9% in 2010), OceanBank (110.1%), and OricomBank (111.1%). For these banks, the indicator exceeded 100.0%, increasing their concern when performing noncredit services.
We could not compute the spread between lending and deposit rates (Figure 31) using banks’ financial statements. However, from NFSC’s report, Vietnamese banks’ net interest trended downward during 2011–2013 because the spread between lending and deposit rates decreased 5.5% in 2013 (NFSC, 2014). This showed that this encouraged indicator (spread between lending and deposit rates) could still be calculated with different data sources. Nevertheless, according to NFSC staff, this indicator is not as valuable as expected.
Source: National Financial Supervisory Commission. 2014.
30.0%
40.0%
50.0%
60.0%
70.0%
0
20
40
60
2011 2012 2013
Provisions to nonperforming loans (left hand scale - VND thousand billion)
Provisions to nonperforming loans/Profits before provisions (righ hand scale - %)
Figure 29: Provisions to Nonperforming Loans of Viet Nam’s Banking System,
2011–2013
Agribank = Viet Nam Bank for Agriculture and Rural Development, ACB = Asia Commercial Joint Stock Bank, BIDV = The Joint Stock Commercial Bank for Investment and Development of Viet Nam, Eximbank = Viet Nam Export Import Commercial Joint Stock Bank, IMF = International Monetary Fund, MBB = Military Commercial Joint Stock Commercial Bank, MSB = Maritime Joint Stock Commercial Bank, STB = SaiGonThuong Tin Joint Stock Commercial Bank, TechcomBank = Viet Nam Technological and Commercial Joint Stock Bank, VCB = Joint Stock Commercial Bank for Foreign Trade, VIBank = Viet Nam International Commercial Joint Stock Bank, VietinBank = Viet Nam Bank for Industry and Trade, VPBank = Viet Nam Prosperity Joint Stock Commercial Bank.Source: Author’s calculation from banks’ financial statements.
Agribank BIDV VCB VietinBank ACB Eximbank STB TechcomBank MBB MSB VIBank VPBank Average (authors' calculation) Average (IMF)
0% 20% 40% 60% 80%
100% 120% 140%
2008 2009 2010 2011 2012
Figure 30: Interest Margin to Gross Income of G12 Banks, 2008–2012 (%)
Source: Authors’ calculations from banks’ financial statements.
1.0%
2.0%
3.0%
4.0%
0
50
100
150
2011 2012 2013
Net interest (left hand scale - VND thousand) Net interest margin (right hand scale - %)
Figure 31: Vietnamese Banks’ Net Interest and Net Interest Margin, 2011–2013

Fina
ncia
l Sou
ndne
ss o
f Vie
t Nam
’s Ba
nkin
g Sec
tor
25
The ratio of trading income to total income decreased in 2008–2012, from 5.6% to 0.9%, showing poor performance of Vietnamese banks’ trading activities (Figure 32). The level the IMF website also supports this performance. Many banks that had negative figures for this indicator in 2012, such as ABBank, ACB, DongABank, etc. Among G12 banks, VIBank had the lowest ratio in 2012 (–32.0%). PNB, a non-G12 bank, was the most successful bank in performing trading activities. Its indicator increased continuously, from 15.4% in 2008 to 88.1% in 2012.
The ratio of noninterest expenses to gross income was quite stable at around 45.0%–50.0% in 2008–2012, similar that reported on the IMF website (Figure 33). However, this ratio increased for most banks in 2012, indicating an increase in administrative costs. On the other hand, this indicator decreased in only 4 of 35 banks in 2012, including BIDV (from 83.8% to 39.8%), MBB (from 36.5% to 34.5%), MHB (from 83.4% to 79.5%), and PNB (from 56.7% to 54.3%). According to NFSC (2014), pressured by decreasing profits, banks have tried to cut down their expenditures to enhance
Agribank = Viet Nam Bank for Agriculture and Rural Development, ACB = Asia Commercial Joint Stock Bank, BIDV = The Joint Stock Commercial Bank for Investment and Development of Viet Nam, Eximbank = Viet Nam Export Import Commercial Joint Stock Bank, IMF = International Monetary Fund, MBB = Military Commercial Joint Stock Commercial Bank, MSB = Maritime Joint Stock Commercial Bank, STB = SaiGonThuong Tin Joint Stock Commercial Bank, TechcomBank = Viet Nam Technological and Commercial Joint Stock Bank, VCB = Joint Stock Commercial Bank for Foreign Trade, VIBank = Viet Nam International Commercial Joint Stock Bank, VietinBank = Viet Nam Bank for Industry and Trade, VPBank = Viet Nam Prosperity Joint Stock Commercial Bank.Source: Author’s calculation from banks’ financial statements.
Agribank BIDV VCB VietinBank ACB Eximbank STB TechcomBank MBB MSB VIBank VPBank Average (authors' calculation) Average (IMF)
–35%
–25% –15%
–5% 5%
15% 25% 35%
2008 2009 2010 2011 2012
Figure 32: Trading Income to Total Income of G12 Banks, 2008–2012 (%)
Agribank = Viet Nam Bank for Agriculture and Rural Development, ACB = Asia Commercial Joint Stock Bank, BIDV = The Joint Stock Commercial Bank for Investment and Development of Viet Nam, Eximbank = Viet Nam Export Import Commercial Joint Stock Bank, IMF = International Monetary Fund, MBB = Military Commercial Joint Stock Commercial Bank, MSB = Maritime Joint Stock Commercial Bank, STB = SaiGonThuong Tin Joint Stock Commercial Bank, TechcomBank = Viet Nam Technological and Commercial Joint Stock Bank, VCB = Joint Stock Commercial Bank for Foreign Trade, VIBank = Viet Nam International Commercial Joint Stock Bank, VietinBank = Viet Nam Bank for Industry and Trade, VPBank = Viet Nam Prosperity Joint Stock Commercial Bank.Source: Author’s calculation from banks’ financial statements.
Agribank BIDV VCB VietinBank ACB Eximbank STB TechcomBank MBB MSB VIBank VPBank Average (authors' calculation) Average (IMF)
0% 10% 20% 30% 40% 50% 60% 70% 80%
2008 2009 2010 2011 2012
Figure 33: Noninterest Expenses to Gross Income of G12 Banks, 2008–2012 (%)

Fina
ncia
l Sou
ndne
ss In
dica
tors
for F
inan
cial
Sec
tor S
tabi
lity i
n Vi
et N
am26
performance. Indeed, noninterest expenses of Vietnamese banks decreased by 6.6% in 2013. However, the ratio of noninterest expenses to net trading income did not change much showing that banks’ performance in trading activities has not improved.
Finally, one encouraged FSI measuring earnings and profitability is the ratio of personnel expenses to noninterest expenses. This indicator was only calculated for 23 banks and it showed their stability during 2008–2012. On average, Vietnamese banks kept personnel expenses at around 50.0% of administrative costs. In 2012, many banks reduced this type of expense in their income statements, thus decreasing the average ratio for the whole sector to 48.0%, from 53.0% in 2011. Given the year’s worst performance in earnings and profitability, it is possible that banks had to lay off people, resulting in much lower expenses.
Liquidity
The most important indicators measuring liquidity of deposit-takers are liquid assets to total assets and liquid assets to short-term liabilities ratios. However, since Viet Nam’s accounting standard has not defined liquid assets, we assumed that liquid assets would include cash, marketable securities, government securities, interbank deposits, and short-term marketable securities. Based on this assumption, we computed the ratio of liquid assets to total assets for all banks, but not the ratio of liquid assets to short-term liabilities due to the lack of information in many banks’ financial statements. The average ratio of liquid assets to total assets was quite stable at around 20.0%–25.0% in 2008–2012, showing the sector’s high liquidity arising from the efforts of SBV’s policies to support liquidity and protect depositors (Figure 34). Additionally, banks attempted to restructure assets and liabilities, especially short- and medium-term liabilities, and short-and medium-term capital mobilization sources. Commercial banks governed by SBV also tried to issue commercial papers, manage the interest rate gap, and avoid investing in risky areas like stock or real estate markets. Noticeably, the average level computed by the authors and the level on the IMF website appear to be much different. After being stable in 2008–2010 at around 30.0%, the latter decreased steadily to about 13.5% in both 2011 and 2012.
On 13 February2012, the State Bank issued Directive No. 01/CT-NHNN to classify banks into four groups and put caps on their credit growth. Specifically, the ceiling rate of credit growth for group 1 is 17.0%; group 2, 15.0%; group 3, 8.0%; and group 4, 0.0%. This means that the credit growth rate in line with Directive No. 01 will be lower than 15.0%–17.0% for the whole system.
Agribank = Viet Nam Bank for Agriculture and Rural Development, ACB = Asia Commercial Joint Stock Bank, BIDV = The Joint Stock Commercial Bank for Investment and Development of Viet Nam, Eximbank = Viet Nam Export Import Commercial Joint Stock Bank, IMF = International Monetary Fund, MBB = Military Commercial Joint Stock Commercial Bank, MSB = Maritime Joint Stock Commercial Bank, STB = SaiGonThuong Tin Joint Stock Commercial Bank, TechcomBank = Viet Nam Technological and Commercial Joint Stock Bank, VCB = Joint Stock Commercial Bank for Foreign Trade, VIBank = Viet Nam International Commercial Joint Stock Bank, VietinBank = Viet Nam Bank for Industry and Trade, VPBank = Viet Nam Prosperity Joint Stock Commercial Bank.Source: Author’s calculation from banks’ financial statements.
0%
10%
20%
30%
40%
50%
60%
2008 2009 2010 2011 2012 Agribank BIDV VCB VietinBank ACB Eximbank STB TechcomBank MBB MSB VIBank VPBank Average (authors' calculation) Average (IMF)
Figure 34: Liquid Assets to Total Assets of G12 Banks, 2008–2012 (%)

Fina
ncia
l Sou
ndne
ss o
f Vie
t Nam
’s Ba
nkin
g Sec
tor
27
In addition, only within nearly a month in early 2012, the State Bank lowered the interest rate ceiling twice, from 14.0% to 13.0% on 13 March and to 12.0% on 11 April. Operating interest rates also fell correspondingly, beyond the expectation of the market following the commitment to “lowering interest rate by 1.0% every quarter” made by the State Bank in early March. The liquidity of the banking system improved in early 2012 owing to an increase in deposits plus a decrease in lending. At the same time, the fact that some activities in the real estate sector were removed from lending restrictions shows that the State Bank has started to loosen regulations on lending for real estate. The State Bank has also required banks to restructure maturity of loans for enterprises.
The fact that regulations on the deposit rate ceiling and credit growth for groups of banks continued to be applied has been more advantageous to big banks in terms of capital mobilization than small banks. Thus, big banks went from liquidity shortage to capital surplus. Banks cannot lend to “enterprises in need of money in any way” due to entereprises’ extremely high risks of insolvency. In addition to risks of capital loss, by lending to enterprises with bad financial situation, banks also had to worry that their bad debts would exceed the 3.0% limit required by the State Bank. Specifically, the very low bad debt rate limit will lower the credit ranking of commercial banks, which in turn can reduce credit growth rate and damage banks’ reputation. Hence, after fighting off the risks of illiquidity, commercial banks now struggle with the problem of capital surplus, especially in big banks. Besides, stagnant lending activities resulting from a weak demand in the economy—another consequence of protracted high inflation—combined with the impact of inflation control measures lead to low capital absorptive capacity of enterprises (Nguyen Hong Son, et al. 2012).
Another measure of banks’ liquidity is the ratio of customer deposits, including both resident and nonresident sectors, to total noninterbank loans, which can be calculated for all banks. The average ratio decreased from 115.0% in 2008 to 100.0% in 2011 before rising again to 113.0% in 2012 (Figure 35). This is slightly higher than the level reported on the IMF website, while still showing a similar trend. This performance was quite impressive compared to other regional countries. However, for the last 5 years more than 10 banks have had this indicator lower than 100.0%, which means those banks would have greater dependence on more volatile funds to cover the illiquid assets. Among SOCBs, VCB had the best performance, especially in 2012, with a ratio of over 250.0%, while the other three banks always had this ratio lower than the average level. Specifically, MDB’s figure seemed to be at an “alarming” level (only around 40.0% for 2011 and 2012). Banks with a high ratio of
ACB = Asia Commercial Joint Stock Bank, Agribank = Viet Nam Bank for Agriculture and Rural Development, BIDV = The Joint Stock Commercial Bank for Investment and Development of Viet Nam, Eximbank = Viet Nam Export Import Commercial Joint Stock Bank, IMF = International Monetary Fund, MBB = Military Commercial Joint Stock Commercial Bank, MSB = Maritime Joint Stock Commercial Bank, STB = SaiGonThuong Tin Joint Stock Commercial Bank, TechcomBank = Viet Nam Technological and Commercial Joint Stock Bank, VCB = Joint Stock Commercial Bank for Foreign Trade, VIBank = Viet Nam International Commercial Joint Stock Bank, VietinBank = Viet Nam Bank for Industry and Trade, VPBank = Viet Nam Prosperity Joint Stock Commercial Bank.Source: Author’s calculation from banks’ financial statements.
Agribank BIDV VCB VietinBank ACB Eximbank STB TechcomBank MBB MSB VIBank VPBank Average (authors' calculation) Average (IMF)
0%
50%
100%
150%
200%
250%
300%
2008 2009 2010 2011 2012
Figure 35: Customer Deposits to Total (Noninterbank) Loans of G12 Banks, 2008–2012 (%)

Fina
ncia
l Sou
ndne
ss In
dica
tors
for F
inan
cial
Sec
tor S
tabi
lity i
n Vi
et N
am28
customer deposits to total noninterbank loans, such as ABBank, HDBank, LienVietPostBank, MBB, MSB, OceanBank, VPBank, and WEB, does not mean they have been performing well, since they do not utilize their full capacity of lending while still having to pay interest to depositors.
Sensitivity to Market Risks
As banks become increasingly involved in diversified operations and take positions in financial instruments, they become more exposed to risk of losses arising from changes in market prices. The most relevant components of market risk are interest rate and exchange rate risks. Moreover, banks can also engage in proprietary trading in stock markets, which results in equity price risk. Interest rate risk can be assessed by measuring the mismatch in the duration of “average” life between assets and liabilities. The most common measure of foreign exchange exposure is the net open position in foreign exchange to capital ratio, while the measure of equity risk exposure is the net open positions in equity to capital. However, these indicators cannot be calculated widely in Viet Nam because of the lack of data. There are only a few banks that report the information needed to calculate those indicators, but they cannot reflect the whole picture of Vietnamese banking system’s sensitivity to market risks.

29
conclusion
FSIs serve to measure in a scientific, systematic and comprehensive way the financial soundness of an economy according to five areas of interests: capital adequacy, asset quality, earnings, liquidity, and sensitivity to market risk. They are methodological tools that help quantify and
qualify the soundness and vulnerabilities of financial systems. This paper tries to measure and analyze the stability and soundness of the Vietnamese banking system by using these indicators. We determined that the capital adequacy ratio was always higher than the 8.0% minimum requirement of the Basel Committee, and even well above the 9.0% minimum requirement of the State Bank of Viet Nam. Asset quality has not remained secure because of high nonperforming loans (NPLs). However, recent efforts of SBV and individual banks have dramatically decreased the number of NPLs. Measures of earnings and profitability, including return on assets, return on equity, interest margin to gross income, etc., all show downward trends in 2012 and 2013. Nevertheless, the reasons for the downtrend were increased provisions to NPLs and the banks’ worst performance in trading activities. The average ratio of liquid assets to total assets was quite stable at around 20.0%–25.0% in 2008–2012, showing the sector’s high liquidity arising from the efforts of SBV’s policies to support liquidity and protect depositors. The indicators measuring banks’ sensitivity to market risks are not available thus, we cannot draw any conclusion on this aspect.
This study cannot cover all indicators for all banks. First, banks’ financial statements were not always available because some banks did not release their statements. Moreover, even though some banks did make their financial statements public, they were just summaries of completed statements that cannot be used to compile and disseminate FSIs. Second, Vietnamese banks’ financial statements did not conform to international standards. Thus, we could not find some information to compute FSIs in those statements, making it impossible to compute the FSIs. Hence, to have full FSIs data, we suggest that the SBV and other financial monitoring agencies require banks to prepare financial statements according to international standards, as mentioned in the IMF Compilation Guide. The statements should then be released so that researchers and statisticians can have access to and compute the indicators based on those data.
Further research should complement this analysis with other macroeconomic variables to spot early signs of vulnerabilities and prevent a crisis. The financial system’s integration into the overall economy makes it significantly affected by certain macroeconomic developments including economic growth, current account balance, reserves, external debt, terms of trade, composition and maturity of capital flows, volatility of inflation, volatility of interest and exchange rates, and financial market correlation. Thus, further research of integration between FSIs and other macroeconomic variables will definitely enhance the usefulness of FSIs.

30
Abbreviations Name of BankABBank An Binh Commercial Joint Stock BankACB Asia Commercial Joint Stock BankAgribank Viet Nam Bank for Agriculture and Rural DevelopmentBaoVietBank Bao Viet Joint Stock Commercial BankBIDV The Joint Stock Commercial Bank for Investment and Development of Viet NamDaiABank DaiA Commercial Joint Stock BankDongABank DongA Joint Stock Commercial BankEximbank Viet Nam Export Import Commercial Joint Stock BankHDBank Housing Development Commercial Joint Stock BankKienLongBank Kienlong Commercial Joint Stock BankLienVietPostBank Lien Viet Post Joint Stock Commercial Bank MBB Military Commercial Joint Stock Commercial BankMDB Mekong Development Joint Stock Commercial BankMHB Mekong Housing Joint Stock Commercial BankMSB Maritime Joint Stock Commercial BankNamABank NamA Joint Stock Commercial BankNaViBank Nam Viet Joint Stock Commercial BankOceanBank Ocean Commercial Joint Stock Bank Oricombank Orient Joint Stock Commercial BankPGBank Petrolimex Group Joint Stock Commercial BankPNB Southern Joint Stock Commercial BankSaiGonBank Saigon Joint Stock Commercial BankSCB Saigon Commercial Joint Stock BankSeaBank Southeast Asia Joint Stock Commercial BankSHB Saigon Hanoi Joint Stock Commercial BankSTB SaiGonThuong Tin Joint Stock Commercial BankTechcomBank Viet Nam Technological and Commercial Joint Stock BankTrustBank Viet Nam Construction Joint Stock Commercial BankVCB Joint Stock Commercial Bank for Foreign TradeVIBank Viet Nam International Commercial Joint Stock BankVietABank Viet A Joint Stock Commercial BankVietCapitalBank Viet Capital Joint Stock Commercial Bank VietinBank Viet Nam Bank for Industry and TradeVPBank Viet Nam Prosperity Joint Stock Commercial BankWEB Western Joint Stock Commercial Bank
appendix: list of Vietnamese commercial banks in the StudyA
ppen
dix

31
Refe
renc
esreferences
ADB. 2013 Key Indicators for Asia and the Pacific 2012. Manila
Aterido, R., M. Hallward-Driemeier, and C. Pagés.2009. Constraints to Small Firms’ Growth? Business Environment and Employment Growth across Firms. World Bank Policy Research Working Paper 5032. World Bank, Washington, D.C.
Ayyagari, M., T. Beck, and A. Demirgüç-Kunt .2007. Small and Medium Enterprises across the Globe. Small Business Economics. 29 (4). pp. 415–434.
Beck, T. 2010. SME Finance: What Have We Learned and What Do We Need to Learn. Section 1.3 in World Economic Forum. Financial Development Report 2010. World Economic Forum, New York, USA.
Bui Trinh, Kobayashi, K., Pham Le Hoa, and Nguyen Viet Phong. 2012. Vietnamese economic structural change and policy implications. Global Journal of Human-Social Science Research. 12(9–C).
CIEM. 2007. Characteristics of the Vietnamese Business Environment: Evidence from a SME Survey in 2007. United Nation University-World Institute for Development Economics Research.
CIEM. 2009. Characteristics of the Vietnamese Business Environment: Evidence from a SME Survey in 2009. United Nations University – World Institute Development Economics Development.
CIEM. 2011. Characteristics of the Vietnamese Business Environment: Evidence from a SME Survey in 2011. United Nations University – World Institute Development Economics Development.
General Statistics Office. 2013. http://www.gso.gov.vn. (accessed November 2013).
Ho Ba Tinh. 2012. Sources of profit in 2011 and the unknown in 2012. Vietnam Economic Times. February.
International Monetary Fund. International Financial Statistics database (balance of payments and general government budget). http://elibrary-data.imf.org/DataExplorer.aspx (accessed 11 November 2013).
____. International Financial Statistics database (financial soundness indicators). http://elibrary-data.imf.org/DataExplorer.aspx (accessed 23 April 2014).
____. 2004, 2007, 2010, 2012. Vietnam: Article IV Consultation 2004, 2007, 2010 and 2012. New York, USA.
____. 2006. Financial Soundness Indicators - Compilation Guide. Washington D.C.
International Monetary Fund. Various Years.
Jeucken, M. 2005. Sustainability in Finance: Banking on the Planet. Delft: Eburon Academic Publishers.
Klapper, L., L. Laeven, and R. Rajan. 2006. Entry Regulation as a Barrier to Entrepreneurship. Journal of Financial Economics. 82. pp. 591–629.

32Re
fere
nces Klapper, L. and C. Richmond. 2009. Patterns of Business Creation, Survival, and Growth: Evidence from Africa.
Washington DC: World Bank.
Ministry of Finance of Vietnam website.2013. http://www.mof.gov.vn/ (Accessed November, 2013).
Government of Viet Nam. National Financial Supervisory Commission (NFSC). 2014. Overview Report on Vietnam’s Financial Markets 2013. Hanoi, Viet Nam.
Neumark, D., B. Wall, and J. Zhang. 2008. Do Small Businesses Create More Jobs? New Evidence from the National Establishment Time Series. NBER Working Paper Series. No. 13818. National Bureau of Economic Research. Cambridge, Massachusetts.
Nguyen Duc Thanh. 2010. Managing Vietnam’s macroeconomic and financial risks in the new global context, Chapter 2. In Kee-Cheok Cheong, Pham Minh Duc and Nguyen Thang, eds. From low-income to industrialized: Vietnam in the next decade and beyond. Washington, DC: World Bank.
Nguyen Duc Thanh, Ngo Quoc Thai, Vu Minh Long and Hoang Thi Chinh Thon. 2013. Overview of the Vietnamese Economy in 2012, Chapter 2.In Nguyen Duc Thanh, ed. Vietnam Annual Economic Report 2013: On a Bumpy Road to the Future.Hanoi: Viet Nam National University Publishing House.
Nguyen Hong Son and the research team of UEB-VNU, Hanoi. 2012. Viet Nam’s Commercial Banking System and Some Restructuring Issues, Chapter 4.In. Nguyen Duc Thanh, ed. Vietnam Annual Economic Report 2012: Facing the Challenges of Structural Reforms. The Gioi Publisher. Hanoi, Vietnam.
Nguyen Xuan Thanh and D. Dapice. 2009. Vietnam’s infrastructure constraints. UNDP-Harvard Policy Dialogue Paper. United Nations Development Programme in Vietnam, 2009. Hanoi, Viet Nam.
Pham The Anh. 2011. Public Debt of Vietnam: Risks and Challenges Chapter 6.In Nguyen Duc Thanh, ed. Vietnam Annual Economic Report 2011: The Economy at a Crossroads. Hanoi: Viet Nam National University Publisher.
Phan Thi Nhiem and C. Harvie. 2006. Vietnam’s Economic Transition: Policies, Issues and Prospects. ICFAI University Press. Hyderabad, India.
Sleuwaegen, L., and M. Goedhuys. 2002. Growth of Firms in Developing Countries, Evidence from Cote d’Ivoire. Journal of Development Economics. 68. pp.117–135.
Snodgrass, D. and T. Biggs. 1996. Industrialization and Small Firm: Patterns and Policies. Economic Center for International Growth. San Francisco, California.
State Bank of Vietnam. 2013. http://www.sbv.gov.vn/ (accessed December 2013).
Tybout, J. R. 2000. Manufacturing Firms in Developing Countries: How Well Do They Do, and Why? Journal of Economic Literature. 38. pp.11–44.
Vo Tri Thanh, Tran Tien Cuong, Bui Van Dung and Trinh Duc Chieu. 2011. Small and Medium Enterprises Access to Finance in Viet Nam. In Harvie, C., S. Oum, and D. Narjoko, eds. Small and Medium Enterprises (SMEs) Access to Finance in Selected East Asian Economies. ERIA Research Project Report 2010–14, Jakarta: ERIA. pp.152–192.

33
VCBS – Vietcombank Securities. 2011. Viet Nam Banking Sector Report. September. 2011. Hanoi, Vietnam.
Vneconomy. 2012. The competition in the banking market share. 18 July 2012. Hanoi, Vietnam.
World Bank. 2013 World Development Indicators Database, http://data.worldbank.org/products/wdi (accessed December 2013).
World Economic Forum. 2013. The Global Competitiveness Report 2012–2013. IMF, New York, USA.
Refe
renc
es

Financial Soundness Indicators for Financial Sector Stability in Viet Nam
Financial soundness indicators (FSIs) are methodological tools that help quantify and qualify the soundness and vulnerabilities of financial systems according to five areas of interests: capital adequacy, asset quality, earnings, liquidity, and sensitivity to market risk. With support from the Investment Climate Facilitation Fund under the Regional Cooperation and Integration Financing Facility, this report describes the development of FSIs for Viet Nam and analyzes the stability and soundness of the Vietnamese banking system by using these indicators. The key challenges to comprehensively implementing reforms and convincingly addressing the root causes of the banking sector problems include (i) assessing banks’ recapitalization needs, (ii) revising classification criteria to guide resolution options, (iii) recapitalization and restructuring that may include foreign partnerships, (iv) strengthening the VAMC, (v) developing additional options to deal with NPLs, (vi) tightening supervision to ensure a sound lending practice; (vii) revamping the architecture and procedures for crisis management, and (viii) strengthening financial safety nets during the reform process.
About the Asian Development Bank
ADB’s vision is an Asia and Pacific region free of poverty. Its mission is to help its developing member countries reduce poverty and improve the quality of life of their people. Despite the region’s many successes, it remains home to the majority of the world’s poor. ADB is committed to reducing poverty through inclusive economic growth, environmentally sustainable growth, and regional integration.
Based in Manila, ADB is owned by 67 members, including 48 from the region. Its main instruments for helping its developing member countries are policy dialogue, loans, equity investments, guarantees, grants, and technical assistance.
AsiAn Development BAnk6 ADB Avenue, Mandaluyong City1550 Metro Manila, Philippineswww.adb.org