FINANCIAL SECTOR REFORMS AND INTEREST RATE … · in Kenya. The study also examined the interest...
57
MARCH 1998 RESEARCH PAPER SEVENTY-TWO FINANCIAL SECTOR REFORMS AND INTEREST RATE LIBERALIZATION: THE KENYA EXPERIENCE R. W. NGUGI and J. W. KABUBO ARCHIV 113310 MIC RESEARCH CONSORTIUM UR LA RECHERCHE ECONOMIQUE EN AFRIQUE
Transcript of FINANCIAL SECTOR REFORMS AND INTEREST RATE … · in Kenya. The study also examined the interest...

MARCH 1998
RESEARCH PAPER SEVENTY-TWO
FINANCIAL SECTOR REFORMS AND INTEREST RATE LIBERALIZATION: THE KENYA EXPERIENCE
R. W. NGUGI and J. W. KABUBO
ARCHIV 113310
MIC RESEARCH CONSORTIUM
UR LA RECHERCHE ECONOMIQUE EN AFRIQUE
IDRC Lib. / / 3
/ ()
Financial sector reforms and interest rate liberalization: The
Kenya experience
A
(' (I,

Other publications in the AERC Research Papers Series:
Structural Adjustment Programmes and the Coffee Sector in Uganda by Germina Ssemogerere, Research Paper 1.
Real Interest Rates and the Mobilization of Private Savings in Africa by F.M. Mwega, S.M. Ngola and N. Mwangi, Research Paper 2.
Mobilizing Domestic Resources for Capital Formation in Ghana.' The Role of Informal Financial Markets by Ernest Aryeetey and Fritz Gockel, Research Paper 3.
The Informal Financial Sector and Macroeconomic Adjustment in Malawi by C. Chipeta and M.L.C. Mkandawire, Research Paper 4.
The Effects of Non-Bank Financial Intermediaries on Demand for Money in Kenya by S.M. Ndele, Research Paper 5.
Exchange Rate Policy and Macroeconomic Performance in Ghana by C.D. Jebuni, N.K. Sowa and K.S. Tutu, Research Paper 6.
A Macroeconomic-Demographic Model for Ethiopia by Asmerom Kidane, Research Paper 7.
Macroeconomic Approach to External Debt: the Case of Nigeria by S. Ibi Ajayi, Research Paper 8.
The Real Exchange Rate and Ghana's Agricultural Exports by K. Yerfi Fosu, Research Paper 9.
The Relationship Between the Formal and Informal Sectors of the Financial Market in Ghana by E. Aryeetey, Research Paper 10.
Financial System Regulation, Deregulation and Savings Mobilization in Nigeria by A. Soyibo and F. Adekanye, Research Paper 11.
The Savings-Investment Process in Nigeria: An Empirical Study of the Supply Side by A. Soyibo, Research Paper 12.
Growth and Foreign Debt: The Ethiopian Experience, /964-86 by B. Degefe, Research Paper 13.
Links Between the Informal and Formal/Semi-Formal Financial Sectors in Malawi by C. Chipeta and M.L.C. Mkandawire, Research Paper 14.
The Determinants of Fiscal Deficit and FiscalAdjustment in Cote d'Ivoire by 0. Kouassy and B.
Bohoun, Research Paper 15. Small and Medium-Scale Enterprise Development in Nigeria by D.E. Ekpenyong and M.0. Nyong,
Research Paper 16.
The Nigerian Banking System in the Context of Policies of Financial Regulation and Deregulation by A. Soyibo and F. Adekanye, Research Paper 17.
Scope, Structure and Policy Implications of Informal Financial Markets in Tanzania by M. Hyuha, 0. Ndanshau and J.P. Kipokola, Research Paper 18.
European Economic Integration and the Franc Zone.' The future of the CFA Franc after 1996. Part I: Historical Background and a New Evaluation of Monetary Cooperation in the CFA
Countries by Allechi M'bet and Madeleine Niamkey, Research Paper 19,
Revenue Productivity Implications of Tax Reform in Tanzania by Nehemiah E. Osoro, Research Paper 20.
The Informal and Semi-formal Sectors in Ethiopia: A Study of the Iqqub, Iddir and Savings and Credit Cooperatives by Dejene Aredo, Research Paper 21.
Inflationary Trends and Control in Ghana by Nii K. Sowa and John K. Kwakye, Research Paper 22.
Macroeconomic Constraints and Medium-Term Growth in Kenya: A Three-GapAnalysis by F.M.
Mwega, N. Njuguna and K. Olewe-Ochilo, Research Paper 23.
The Foreign Exchange Market and the Dutch Auction System in Ghana by Cletus K. Dordunoo, Research Paper 24.

Exchange Rate Depreciation and the Structure of Sectoral Prices in Nigeria Under an Alternative Pricing Regime, 1986-89 by Olu Ajakaiye and Ode Ojowu, Research Paper 25.
Exchange Rate Depreciation, Budget Deficit and Inflation - The Nigerian Experience by F.
Egwaikhide, L. Chete and G. Falokun, Research Paper 26.
Trade, Payments Liberalization and Economic Performance in Ghana by C.D. Jebuni, A.D. Oduro and K.A. Tutu, Research Paper 27.
Constraints to the Development and Diversification of Non-Traditional Exports in Uganda, 1981- 90 by G. Ssemogerere and L.A. Kasekende, Research Paper 28.
Indices of Effective Exchange Rates: A Comparative Study of Ethiopia, Kenya and the Sudan by
Asmerom Kidane, Research Paper 29. Monetary Harmonization in Southern Africa by C. Chipeta and M.L.C. Mkandawire, Research
Paper 30.
Tanzania's Trade with PTA Countries: A Special Emphasis on Non-Traditional Products by Flora Mndeme Musonda, Research Paper 31.
Macroeconomic Adjustment, Trade and Growth: Policy Analysis using a Macroeconomic Model of Nigeria by C. Soludo, Research Paper 32.
Ghana: The Burden of Debt Service Payment Under Structural Adjustment by Barfour Osei, Research Paper 33.
Short-Run Macroeconomic Effects of Bank Lending Rates in Nigeria, 1987-91: A Computable General Equilibrium Analysis by D. Olu Ajakaiye, Research Paper 34.
Capital Flight and External Debt in Nigeria by S. Ibi Ajayi, Research Paper 35. Institutional Reforms and the Management of Exchange Rate Policy in Nigeria by
Kassey Odubogun, Research Paper 36. The Role of Exchange Rate and Monetary Policy in the Monetary Approach to the Balance of
Payments: Evidence from Malawi by Exley B.D. Silumbu, Research Paper 37.
Tax Reforms in Tanzania: Motivations, Directions and Implications by Nehemiah E. Osoro, Research Paper 38.
Money Supply Mechanisms in Nigeria, 1970-88 by Oluremi Ogun and Adeola Adenikinju, Research Paper 39.
Profiles and Determinants of Nigeria's Balance of Payments: The Current Account Component, 1950-88, by Joe U. Umo and Tayo Fakiyesi, Research Paper 40.
Empirical Studies of Nigeria '.r Foreign Exchange Parallel Market 1: Price Behaviour and Rate Determination by Melvin D. Ayogu, Research Paper 41.
The Effects of Exchange Rate Policy on Cameroon 's Agricultural Competitiveness by Aloysius Ajab Amin , Research Paper 42.
Policy Consistency and Inflation in Ghana by Nii Kwaku Sowa, Research Paper 43. Fiscal Operations in a Depressed Economy: Nigeria, 1960-90 by Akpan H. Ekpo and John E. U.
Ndebbio, Research Paper 44. Foreign Exchange Bureaus in the Economy of Ghana by Kofi A. Osei, Research Paper 45. The Balance of Payments as a Monetary Phenomenon: An Econometric Study of Zimbabwe 's
Experience by Rogers Dhliwayo, Research Paper 46. Taxation of Financial Assets and Capital Market Development in Nigeria by
Eno L. Inanga and Chidozie Emenuga, Research Paper 47. The Transmission of Savings to Investment in Nigeria by Adedoyin Soyibo, Research Paper 48.
A StatisticalAnalysis of Foreign Exchange Rate Behaviour in Nigeria Auction by Genevesi 0. Ogiogio, Research Paper 49.
The Behaviour of Income Velocity In Tanzania 1967-1 994 by Michael O.A. Ndanshau, Research Paper 50.
Consequences and Limitations of Recent Fiscal Policy in Côte d'Ivoire, by Kouassy Oussou and Bohoun Bouabre, Research Paper 51.
Effects of Inflation on Ivorian Fiscal Variables: An Econometric Investigation, by Eugene Kouassi, Research Paper 52.
European Economic Integration and the Franc Zone: The Future of the CFA Franc after 1999, Part II, by Allechi M'Bet and Niamkey A. Madeleine, Research Paper 53.
Exchange Rate Policy and Economic Reform in Ethiopia, by Asmerom Kidane, Research Paper 54.
The Nigerian Foreign Exchange Market: Possibilities For Convergence in Exchange Rates, by P. Kassey Garba, Research Paper 55.
Mobilising Domestic Resources for Economic Development in Nigeria: The Role of the Capital Market, by Fidelis 0. Ogwumike and Davidson A. Omole, Research Paper 56.
Policy Modelling in Agriculture: Testing the Response of Agriculture to Adjustment Policies in
Nigeria, by Mike Kwanashie, Abdul-Ganiyu Garba and Isaac Ajilima, Research Paper 57. Price and Exchange Rate Dynamics in Kenya: An Empirical Investi gation(1970-1993)by Njuguna
S. Ndung'u, Research Paper 58. Exchange Rate Policy and Inflation: The case of Uganda, by Barbara Mbire, Research Paper 59. Institutional, Traditional andAsset Pricing Characteristics of African Emerging Capital Markets,
by Eno L. Inanga and Chidozie Emenuga, Research Paper 60. Foreign Aid and Economic Performance in Tanzania, by Timothy S. Nyoni, Research Paper 61. Public Spending, Taxation and Deficits: What is the Tanzanian Evidence? by Nehemiah Osoro,
Research Paper 62. Adjustment Programmes andAgricultural Incentives in Sudan: A Comparative Study, by Nasredin
A. Hag Elamin and Elsheikh M. El Mak, Research Paper 63. Intra-industry Trade between Members of the PTA/COMESA Regional Trading Arrangement, By
Flora Mndeme Musonda, Research Paper 64. Fiscal Operations, Money Supply and Inflation in Tanzania, by A.A.L. Kilindo, Research Paper
65. Growth and Foreign Debt: The Ugandan Experience, by Barbara Mbire, Research Paper 66. Productivity of the Nigerian Tax System: 1970—1990, by Ademola Ariyo, Research Paper 67. Potentials for divers Nigeria's Non-oil Exports to Non-Traditional Markets, by A. Osuntogun,
C.C. Edordu and B.0. Oramah, Research Paper 68. Empirical Studies of Nigeria's Foreign Exchange Parallel Market II: Speculative Efficiency and
Noisy Trading, by Melvin Ayogu, Research Paper 69. Effects of Budget Deficits on the Current Account Balance in Nigeria: A Simulation Exercise, by
Festus 0. Egwaikhide, Research Paper 70. Bank Performance and Supervision in Nigeria: Analysing the Transition to a Deregulated Economy,
by 0.0. Sobodu and P.O. Akiode, Research Paper 71.

Financial sector reforms and interest rate liberalization: The
Kenya experience
By
R.W. Ngugi and
J.W. Kabubo
University of Nairobi
AERC Research Paper 72 African Economic Research Consortium, Nairobi
March 1998

© 1998, African Economic Research Consortium.
Published by: The African Economic Research Consortium P.O. Box 62882 Nairobi, Kenya
Printed by: The Regal Press Kenya, Ltd. P.O. Box 46166 Nairobi, Kenya
ISBN 9966-900-46-2

Contents
Abstract
I. Introduction 1
II. Financial reforms 10 III. Interest rate determination 20 IV. Conclusions 35
Notes 37 References 38 Appendix 40

List of Tables
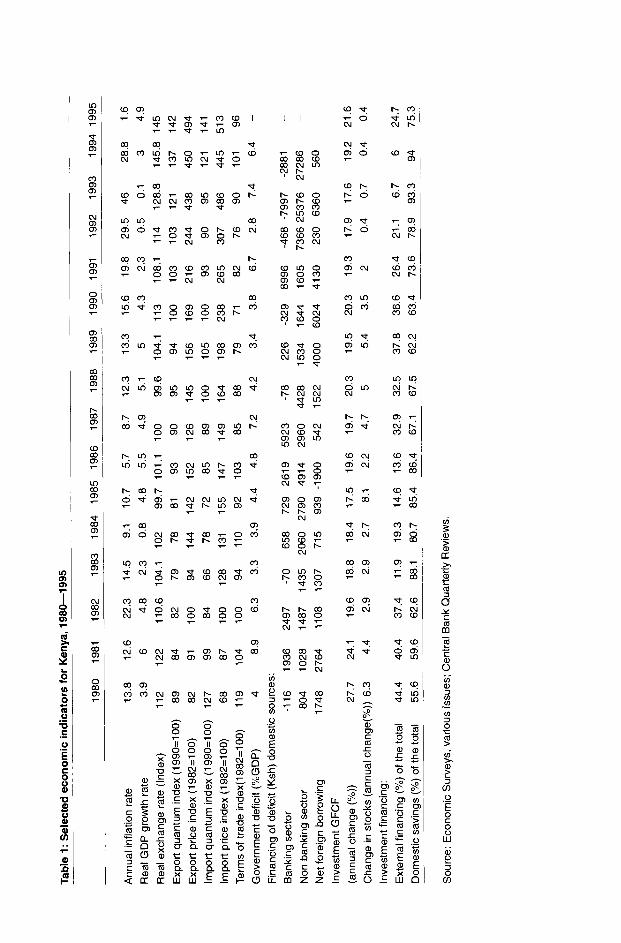
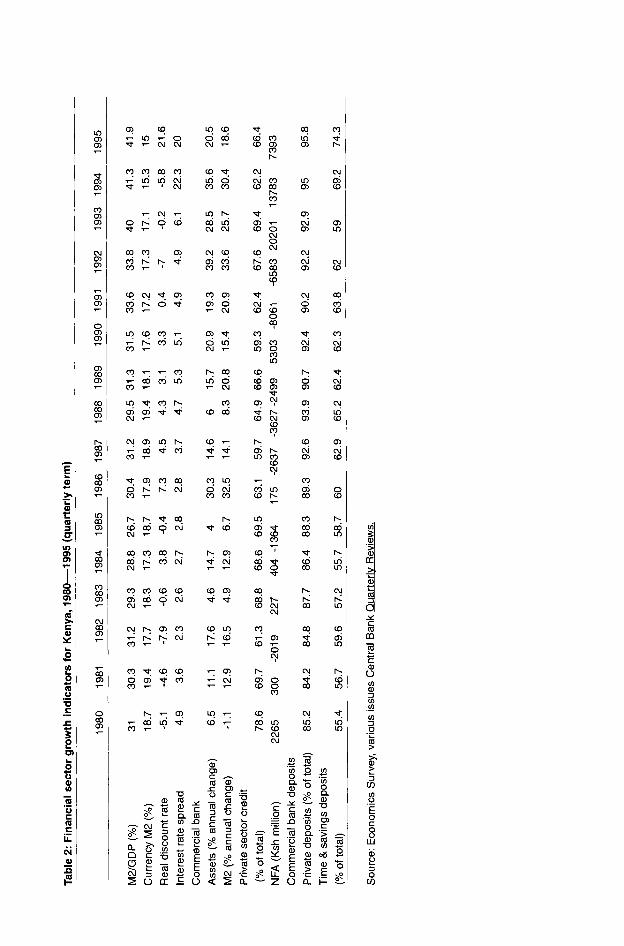
1. Selected economic indicators for Kenya, 1980—1995 2 2. Financial sector growth indicators for Kenya, 1980—1995 (quarterly term) 4 3. Real interest rates for selected principal interests for Kenya, 1991—1996 17 4. Unit root tests 30 5. Preferred model 31 6. The reduced results 34
List of Figures
1. M2/GDP ratio 5
2. Interest rate spreads 5
3. Liquid assets for commercial banks 18
4. Unit root tests 18
5. Recursive graphs 32 6a. Impact variables 32 6b. Interest rates response to impact variables 33 7. Fitted treasury bill rate results 33

Abstract
For financially repressed economies, financial liberalization was expected to allow for positive real interest rates, and for stimulating the mobilization and efficient allocation of domestic financial resources. At the same time, as the market becomes competitive the costs of intermediation go down, an indication of efficiency in the intermediation of financial assets. But, for successful liberalization, prerequisites must be put in place together with proper sequencing procedures.
The study explored the sequencing and actions so far taken in the liberalization process in Kenya. The study also examined the interest rate levels, spreads and determining factors, as an indicator of financial sector response to the reform process.
The study found that although much had been accomplished, the financial system was characterized by repression factors including negative real interest rates, inefficiency in financial intermediation and underdeveloped financial markets. This may indicate that the economy is facing secondary financial repression. Interest rates were more responsive to the policy activities during the period than to the fundamentals. Interest rates were a
monetary phenomenon with an adjustment speed of 77% to disequilibrium in the monetary sector. The study concluded that there are several loose knots that need to be tightened for the economy to experience significant positive effects of financial liberalization.


I. Introduction
Macroeconomic background
The impressive economic performance that Kenya experienced after independence (1963) has not been sustained, with external and internal shocks creating macro imbalances. The economy was hit twice by oil crise in 1973/74 and 1979, and by severe drought conditions in 1979, 1984 and 1992. As a result, terms of trade deteriorated with increased import prices. Earnings from exports went down with the declining export prices and reduced volumes of traditional exports. Balance of payments worsened as the current account deficit increased. At the same time, inflation rates accelerated, reaching double digits, while the shilling exchange rate depreciated. This resulted in increased costs of production and reduced investment with limited foreign exchange for importation of essential inputs. Consequently, GDP growth rate slowed.
During the first decade GDP growth rate averaged 6.6%, with inflation of 3%. However, the oil crisis resulted in increased inflation, recording 19.1% in 1975 and 22.3% in 1982. GDP growth fell to 3.1% in 1975 and went down further to 2.3% and 0.8% in 1983 and 1984. Terms of trade worsened, dropping by 22% between 1972 and 1975. Although there was an improvement with the coffee boom in 1976/77, terms of trade dropped again by 28% in 1980. As a result, the current account deficit as a ratio to GDP increased from about 4% in the early 1970s to 14% in 1980, reducing marginally to 12.5% in 1991. Table 1 summarizes the growth trends of selected economic indicators.
In an effort to contain the external shocks on balance of payments and inflationary pressure, various control measures were introduced. They comprised selective restrictions on bank lending, licensing of foreign exchange transactions, restrictions on most imports and price controls on goods. The controls were lifted with the implementation of structural adjustment programmes, however. The deteriorating economic performance squeezed the government's resources, with shortfalls in revenue relatively higher than expenditure. The situation worsened in the early 1980s with the overall deficit recording 8.9% of GDP in 1981, compared with less than 3% in the 1 960s. Budget rationalization introduced in 1985 aimed at cutting government expenditure. However, by 1987 the fiscal deficit was as high as in 1981, averaging 7.2%. Another attempt at tight fiscal policy was made beginning in 1990 to cut government expenditure, but by 1993 fiscal deficit was as high as in 1987.
Structural adjustment programmes were implemented beginning in the early 1 980s. The first phase was in 1980—1984 with the broad approach and the second phase 1985—
1991 with the sectoral approach. Although the aim was to revitalize the growth of the
Tab
le 1
: S
elec
ted
econ
omic
ind
icat
ors
for
Ken
ya,
1980
—19
95
1980
1981
1982
1983
19
84
1985
1986
1987
1988
1989
1990
1991
1992
1993
1994
1995
Annual in
flatio
n ra
te
13.8
12
.6
22.3
14
.5
9.1
10.7
5.
7 8.
7 12
.3
13.3
15
.6
19.8
29
.5
46
28.8
1.
6
Rea
l GD
P g
row
th r
ate
3.9
6 4.
8 2.
3 0.
8 4.
8 5.
5 4.
9 5.
1 5
4.3
2.3
0.5
0.1
3 4.
9
Rea
l ex
chan
ge r
ate
(Ind
ex)
112
122
110.
6 10
4.1
102
99.7
10
1.1
100
99.6
10
4.1
113
108.
1 11
4 12
8.8
145.
8 14
5
89
84
82
79
78
81
93
90
95
94
100
103
103
121
137
142
Exp
ortp
ricei
ndex
(198
2=10
0)
82
91
100
94
144
142
152
126
145
156
169
216
244
438
450
494
Impo
rtqu
antu
min
dex(
1990
=10
0)
127
99
84
66
78
72
85
89
100
105
100
93
90
95
121
141
lmpo
rtpr
icei
ndex
(198
2=10
0)
68
87
100
128
131
155
147
149
164
198
238
265
307
486
445
513
Ter
ms
of t
rade
ind
ex(1
982=
100)
11
9 10
4 10
0 94
11
0 92
10
3 85
88
79
71
82
76
90
10
1 96
Gov
ernm
entd
efic
it(%
GD
P)
4 8.
9 6.
3 3.
3 3.
9 4.
4 4.
8 7.
2 4.
2 3.
4 3.
8 6.
7 2.
8 7.
4 6.
4 —
Fin
anci
ng o
f de
ficit
(Ksh
) do
mes
tic s
ourc
es:
Ban
king
sec
tor
-116
19
36
2497
-7
0 65
8 72
9 26
19
5923
-7
8 22
6 -3
29
8996
-4
68
-799
7 -2
881
—
Non
ban
king
sec
tor
804
1028
14
87
1435
20
60
2790
49
14
2960
44
28
1534
16
44
1605
73
66
2537
6 27
286
—
Net
fore
ign
borr
owin
g 17
48
2764
11
08
1307
71
5 93
9 -1
900
542
1522
40
00
6024
41
30
230
6360
56
0 —
Inve
stm
ent
GF
CF
(ann
ual c
hang
e (%
))
27.7
24
.1
19.6
18
.8
18.4
17
.5
19.6
19
.7
20.3
19
.5
20.3
19
.3
17.9
17
.6
19.2
21
.6
Cha
nge
in s
tock
s (a
nnua
l cha
ngc(
%))
6.3
4.
4 2.
9 2.
9 2.
7 8.
1 2.
2 4.
7 5
5.4
3.5
2 0.
4 0.
7 0.
4 0.
4
Inve
stm
ent f
inan
cing
:
Ext
erna
l fin
anci
ng (
%)
of t
he t
otal
44
.4
40.4
37
.4
11.9
19
.3
14.6
13
.6
32.9
32
.5
37.8
36
.6
26.4
21
.1
6.7
6 24
.7
Dom
estic
sav
ings
(%
) of
the
tot
al
55.6
59
.6
62.6
88
.1
80.7
85
.4
86.4
67
.1
67.5
62
.2
63.4
73
.6
78.9
93
.3
94
75.3
Sou
rce:
Eco
nom
ic S
urve
ys,
vario
us is
sues
; C
entr
al B
ank
Qua
rter
ly R
evie
ws.

FINANCIAL SECTOR REFORMS AND INTEREST RATE LIBERALIZATION: THE KENYA EXPERIENCE 3
economy, the achievements were minimal. Inflation dropped marginally during the second phase, but more than doubled in the third phase, recording 46% in 1993. Government attributed the accelerated increase in the rate of inflation to several factors: increased money supply in excess of the targeted level, depreciation of the Kenya shilling, erratic weather conditions, price decontrols, and the activities of the multi-party election in 1992.
Government deficit also worsened during the third phase despite the tight fiscal policy. The re-emerging deficit was attributed to the significant proportion of the government budget spent during the 1992/93 multi-party elections, public management of the famine! drought relief, efforts and the administrative and security costs of managing the influx of refugees fleeing from civil wars in some neighbouring countries. The other major factor was domestic borrowing that saw the placement of government securities at increasing interest rates resulting in domestic payment growing by nearly twice as fast as the domestic debt. Investment as a percentage of GDP declined from 24.8% in 1980—1984 to 23.9% in 1983—1991 and 19.6% in 1992—1995. At the same time financing continued to rely heavily on domestic sources with reduced external financing. Similarly, financing of government deficit increasingly relied on domestic sources.
The external sector recorded improved performance in the 1990s, with exports increasing at a higher rate than imports. This resulted in reverting the merchandise and service accounts from a deficit of Ksh3,146 million in 1992 to a surplus of Ksh5,576 million in 1993. Exports increased by 25.8% during the third phase and imports increased by 11.8%. Export prices rose faster than import prices due to the large depreciation of the Kenya shilling. Terms of trade improved and the current account recorded a surplus in 1993 and 1994. The capital account also had a large surplus, reflecting substantial inflow of short-term and long-term capital. As a result, the overall balance of payments improved from a deficit of Ksh8,661 million in 1992 to a surplus of Ksh25,682 million in 1993.
Gross domestic product declined in 1990—1993 with an average rate of growth of 1.8% compared with 5.1% in 1985—1989 and 3.6% in 1980—1984. The deterioration was attributed to various factors including: unpredictable scenario with the first multi- party elections in 1992, eruption of ethnic clashes in one of the most agriculturally productive regions in the country and bad weather conditions with below average rainfall leading to low output of the agricultural sector. There was also uncertainty in the financial sector about mounting of reform policies and liberalization of interest rates, and the withholding of foreign aid by donor countries led to scarcity of foreign exchange. The consequent drop in importation of raw materials by manufacturers reduced the growth rate in capital formation in the manufacturing sector. An improved growth rate was recorded in 1994/1 995, however.
Financial sector growth
Kenya had a well developed financial system by 1996, made up of 51 commercial banks, 23 non-bank financial institutions, 5 building societies, 39 insurance companies, 3
Tab
le 2
: F
inan
cial
sec
tor
grow
th in
dica
tors
for
Ken
ya,
1980
—1
995
(qua
rter
ly t
erm
)
____
____
____
_
1980
19
81
1982
19
83
1984
19
85
1986
19
87
1988
19
89
1990
19
91
1992
19
93
1994
19
95
M2/
GD
P(%
) 31
30
.3
31.2
29
.3
28.8
26
.7
30.4
31
.2
29.5
31
.3
31.5
33
.6
33.8
40
41
.3
41.9
Cur
renc
y M
2(%
) 18
.7
19.4
17
.7
18.3
17
.3
18.7
17
.9
18.9
19
.4
18.1
17
.6
17.2
17
.3
17.1
15
.3
15
Rea
l dis
coun
t ra
te
-5.1
-4
.6
-7.9
-0
.6
3.8
-0.4
7.
3 4.
5 4.
3 3.
1 3.
3 0.
4 -7
-0
.2
-5.8
21
.6
Inte
rest
rat
e sp
read
4.
9 3.
6 2.
3 2.
6 2.
7 2.
8 2.
8 3.
7 4.
7 5.
3 5.
1 4.
9 4.
9 6.
1 22
.3
20
Com
mer
cial
ban
k
Ass
ets
(% a
nnua
l ch
ange
)
M2
(% a
nnua
l ch
ange
)
Priv
ate
sect
or c
redi
t
(% o
f to
tal)
NF
A (
Ksh m
illion)
Commercial b
ank
depo
sits
Priv
ate
depo
sits
(%
of to
tal)
85.2
84
.2
84.8
87
.7
86.4
88
.3
89.3
92
.6
93.9
90
.7
92.4
90
.2
92.2
92
.9
95
Tim
e & savings deposits
55.4
56.7
59
.6
57.2
55
.7
58.7
60
62
.9
65.2
62
.4
62.3
63
.8
62
Sou
rce:
Eco
nom
ics
Sur
vey,
var
ious
iss
ues
Cen
tral
Ban
k R
evie
ws.
6.5
11.1
17
.6
4.6
14.7
4
30.3
14
.6
6 15
.7
20.9
19
.3
39.2
28
.5
35.6
20
.5
-1.1
12.9
16.5
4.9
12.9
6.7
32.5
14.1
8.3
20.8
15.4
20.9
33.6
25.7
30.4
18.6
(% of total)
78.6
69
.7
61.3
68
.8
68.6
69
.5
63.1
59
.7
64.9
66
.6
59.3
62
.4
67.6
69
.4
62.2
66
.4
2265
30
0 -2
019
227
404
-136
4 17
5 -2
637
-362
7 -2
499
5303
-8
061
-658
3 20
201
1378
3 73
93
95.8
59
69.2
74
.3

FINANCIAL SECTOR REFORMS AND INTEREST RATE LIBERALIZATION: THE KENYA EXPERIENCE
Figure 1: M2/GPD ratio
.44
.4
36
• 32
.28
.24
.2
16
.12
.88
.04
0
1975 1980 1985 1990 1995 2000
M2GDP = M2\GDP; M2rate = M2 growth rate; GDPRate = GOP growth rate
Figure 2: Interest rate spreads
MONSIX = 6 - month deposit rate; MONTWEL = 12- month deposit rate; deprate = deposit rate; exrate =
exchange rate; lend = lending rate; tbill treasury bill rate 90 days.
5
TBILLS.......... aepr.ate=
NONSIX=...... MONTWEL= TBILLS=........... LEND
1995 1995 2000
80
60
40
20
48
40
32
24
16
LEND
_______
expa.te ..
2000

6 RESEARCH PAPER 72
reinsurance companies, 10 development financial institutions, I capital market authority. 20 securities and equities brokerage firms, 1 stock exchange, 12 investment advisory firms , 57 hire purchase companies, several pension funds, 13 foreign exchange bureaus, and 2,670 savings and credit cooperation societies (Development Plan, 1997/200 1). At independence Kenya inherited a financial system composed of the Currency Board of East Africa, a commercial bank sector dominated by foreign banks, and a small number of specialized financial institutions. The Currency Board, however, lacked monetary and financial independence. The government thus found it necessary to establish national monetary controls aimed at efficient operation of the monetary system. In May 1966, Central Bank of Kenya was established by an Act of Parliament with only 10 (mainly foreign owned) commercial banks. The set goal for the financial sector was to ensure its growth and stability so that it could stimulate growth in other sectors of the economy thus achieving a high economic growth rate. The narrow financial sector was characterized by government control on the allocation and pricing of financial resources.
The inherited financial system expanded and became more diversified in the 1970s and 1980s especially with the government policy to encourage local participation in the financial system and setting up of specialized institutions to collect savings and finance investment through issuing new bank and NBFIs licenses (Table 2 summarizes the growth indicators of the sector). The number of commercial banks increased from 9 to 15 in 1980, and by 1985 there were 23 commercial banks. In the 1960s, Kenya had fewer than 10 NBFIs, but the number of institutions expanded and their deposits and liabilities increased as they strove to compete with existing commercial banks. Their asset base rose from Ksh6.4 million in 1980 to Ksh69.5 million in June 1994. The NBFIs' total deposits as a percentage of those of commercial banks increased from 37.9% to 66.0% between 1980 and 1990, declining to 65.9% in 1993. Their total credit in the same period rose from 33.8% to 76%, reducing to 65.6% in 1993. Out of the total NBFIs, 38.5% were owned by commercial banks and 55.8% were independent institutions. Growth of the NBFIs was facilitated by the Banking Act 1968, which eased entry and minimum capital requirements. In the 1960s and 1970s, the government got actively engaged in the financial sector through establishment of several financial institutions. However, with the move toward divestiture, the two government-owned commercial banks (Kenya Commercial Bank and National Bank of Kenya) sold 40% of their shares to the public between 1988 and 1996)
As the banking sector expanded and reform measures were instituted, assets and liabilities continued to increase. The M2/GDP ratio increased during the period of liberalization from 30.1% in the first phase of structural adjustment to 30.6% and 39.3% in 1985—1991 and 1992_19952 (Figure 1). During the same periods deposit liabilities of commercial banks increased by 10.25%, 15.7% and 26.4%, respectively. There was a noted decline in government and other public sector deposits, however, as the average annual change dropped from 17.7% to 42.5% in 1985—1991 and 1992—1995. Demand deposits decreased as a percentage of the total deposits as the time and savings deposits gained higher returns. There was an expansion in liquidity held by commercial banks, reflecting an increase in commercial bank balances at the central bank, banks' balances abroad and treasury bill holdings, due to the substantial increase in holding of government

FINANCIAL SECTOR REFORMS AND INTEREST RATE LIBERALIZATION: THE KENYA EXPERIENCE 7
securities. The average liquidity ratio rose from 21.6% to 27.1% and 43.8% in 1980—
1984, 1985—1991 and 1992—1995. This was 7.1% above the minimum statutory requirements in 1985—1991 and almost double the statutory requirement in 1992—1995.
NBFIs acted as competitors to the commercial banks. Their deposits followed trends similar to those of commercial banks with the structure of deposits barely changing. Their deposits rose by 12.2% in 1992—1995 compared with 17.7% in 1985—1991. Deposits of the central and local governments declined by 6.8% in 1992—1995, while those of other public and private sectors decreased by 9.3%. The decline reflected a narrowing sector as NBFTs converted to commercial banks. NBFIs played an important role in mobilization of resources as reflected in the ratio of total liabilities of the NBFIs to total liabilities of the banking system, which stood at 61% in 1992 and 57% in 1993. Like the
commercial banks, the NBFIs experienced increased liquidity with the liberalization process. The average liquidity ratio rose to 41.8% in 1992—1995, almost double the minimum statutory requirement. The high liquidity ratio was a result of increased holdings of treasury bills, balances with banks abroad and certificates of deposits.
Challenges facing the financial sector
As Kenya's general economic condition deteriorated in the early 1980s, the financial sector performance also went down. Despite having a diversified financial system, financial savings remained at a low level. The share of domestic savings held as financial assets with the financial sector averaged 30% in 1984—1987, similar to the levels in the 1970s. Monetization of transactions fell from 34% to 30% and 29% in 1978—1980, 1980- 1984 and Although NBFIs were mushrooming in the 1980s, the financial system continued to be dominated by the commercial banks with about 70% of the total loans and advances in 1988. Four commercial banks accounted for 58% of bank deposits and 65% of bank assets. In the allocation of credit, the government took a substantial and rising share of loanable funds to finance the budget deficit and fund parastatals. The share of government net domestic credit rose from about 20% in 1978 to 38% in 1986. Funds were mobilized with the imposition of high liquidity requirements on banks and NBFIs. In 1986, the sector faced a crisis with most of the institutions experiencing undercapitalization problems.
The situation was attributed to the various constraints facing the sector and resulted in the mounting of a financial sector reform programme. Among the constraints were:
• central bank regulatory differences across financial institutions, especially between commercial banks and NBFIs, and among the financial instruments
• inadequate regulatory and legal frameworks for the financial system, together with weakness in prudential supervision
• weak monetary policy control by the central bank • segmentation of the financial sector by activities

8 RESEARCH PAPER 72
Central bank regulations
Different central bank regulations were applied to commercial banks and NBFIs. For example, commercial banks were subjected to lower loan rate ceilings, higher liquidity requirements and limits on private sector credit expansion. They could not levy non- interest fees and service charges, were governed by a variety of liquidity and prudential requirements and were supervised more closely by central bank. With the different regulations, the NBFI sector expanded rapidly in the 1980s. Commercial banks set up NBFIs to circumvent central bank regulation and supervision. However, the low entry barriers and inadequate supervision of NBFIs rendered many of them undercapitalized and poorly managed. As they increased their competition with the commercial banks, NBFIs invested in riskier assets, mismatched asset and liability maturities and offered higher interest rates on term deposits, squeezing their margins. By 1985/86 a credit squeeze resulted in the failure of four banking groups all owning NBFIs, and in 1987 the problems of liquidity and insolvency spread to more parts of the NBFIs sector.
The differences in effective loan and deposit rate ceilings contributed to the segmentation of the financial market by maturity and risk. The undifferentiated ceiling in terms of maturity or sector gave no incentive to the commercial banks to broaden their loan maturities or seek new clients. They concentrated on short-term financing mainly using the overdraft facility. NBFIs were subjected to a higher interest ceiling, and were able to mobilize longer-term liabilities by offering higher deposit rates and provide more long-term funds to a broader clientele including small-scale firms.4
For the financial instruments, debt financing benefitted from preferential tax treatment relative to equity financing, which was subjected to double taxation through both withholding tax on capital gains realized by individual investors and taxation of the premium realized by companies on sale of their shares. As a result, the demand for securities among investors dropped and the growth of the capital market was stunted. The rising costs of public issues reduced the incentive of firms to raise additional equity, encouraging them to become excessively leveraged.
Regulatory and legal framework and the prudential supervision
The regulatory powers of the central bank were limited under the Banking Act 1968,
while enforcement of banking regulations and supervision of financial institutions were hindered by lack of staff and adequate information. These factors resulted in the growth of NBFIs and building societies in the 1980s. Again, to promote indigenous financial institutions the sector was subjected to low entry barriers, and less liquidity, capital and reserve requirements. With little supervision the increasing number of new financial institutions faced liquidity and solvency problems due to poor financial practices, fraud and mismanagement. It was not until after the collapse of several financial institutions in

FINANCIAL SECTOR REFORMS AND INTEREST RATE LIBERALIZATION: THE KENYA EXPERIENCE 9
1985—1986 that the government took steps to improve central bank ability to regulate and supervise NBFIs and building societies and impose more stringent licensing requirements for new institutions.
Weak monetary policy
Before the liberalization, government concentrated on direct monetary control tools, mainly credit controls. Ceilings were put on commercial bank credit to the private sector.5
With these ceilings the central bank attempted to offset the effect of large fiscal deficits on monetary expansion. However, the ceilings were compounded by weak and selective enforcement which contributed to segmentation of the financial market. The ceilings did not apply to NBFIs, and they varied across commercial bank institutions with those government owned being particularly lax in their compliance. This resulted in government inability to control inflationary pressure stemming from expansionary fiscal policy, expansion of lending by NBFIs and government owned banks at a period of tight liquidity, and banks with tight ceilings pushing riskier clients to other banks and NBFIs.
Segmentation of the financial sector
To fill the gap in the financial market for long-term credit and equity, the government set up development finance institutions in the 1 960s and 197 Os. They were intended to provide equity and term loans to the industrial sector and long-term agricultural investments. However, the DFIs never managed to gain their independence in sourcing for funds and they continued to rely on government funding. As such, they constituted a
significant financial drain on budgetary resources. DFIs faced other constraints including serious portfolio problems, which were unprofitable with large spreads and high arrears and were therefore financially unsustainable. Their presence worsened segmentation of the financial sector. Financial institutions were segmented in terms of economic activities, sources of funding for institutions and asset holding, so that commercial banks concentrated on short-term loans and agricultural loans for seasonal credit for farmers. Mortgage banks concentrated on residential and commercial construction and development banks provided long-term loans.

II. Financial reforms
Theoretical issues in financial reform
Developing countries financial sectors were said to be characterized by unsound financial institutions with the absence of prudent regulations and supervision; uncompetitive financial markets with a few commercial banks dominating the sector; the existence of informal financing; and segmented financial institutions in terms of activities and economic sectors, sources of funding for institutions and type of assets to hold. Other characteristics are statutory interest rate ceilings, where interest rate levels were set administratively; accommodation of government borrowing; and weak monetary controls. In these systems the central bank typically has limited control on the sector, serving to finance government deficits, conduct foreign exchange transactions for the government and ensure that institutions do not enter into liquidity problems. Due to these factors, then, developing countries' financial systems were said to be financially repressed.
The concept of financial repression was popularized by McKinnon (1973) and Shaw (1973), to describe financial systems with policies that distort domestic financial markets, including inflexible interest rates, higher reserve requirements (that allowed the government to borrow at low costs) and credit controls. These authors argued that a
repressed financial system interferes with economic development as the intermediaries are not well developed for mobilization of savings, while the allocation of financial resources among competing uses is inefficient.
Developing countries operated with low interest rates aimed at increasing the level of investment, improving the allocation of resources among sectors and keeping financial costs down to avoid possible inflationary pressures. This supported the liquidity theory of interest in which Keynes argued for low interest rates to speed up the accumulation of capital.
However, McKinnon (1973) and Shaw (1973) argued that real interest rates kept below the market equilibrium increase the demand for investment but not the actual investment. Low interest rates are insufficient to generate savings, and even reduce savings especially if substitution effects dominate the income effect for households. On the other hand, low rates raise the expected profitability of investment projects by raising the net present value of future earnings from the project. The net effect is to raise the demand for funds without raising the supply of financial resources. The results are rationing of credit among the competing investors based on non-price methods as credit is allocated according to the quality of collateral, client's bargaining skills, political leverage and loan size rather than the expected productivity of the investment.

FINANCIAL SECTOR REFORMS AND INTEREST RATE LIBERALIZATION: THE KENYA EXPERIENCE 11
Thus, negative real deposit rates and lending rates adversely affect development, discouraging the accumulation of wealth in the financial form and limiting the rate of capital accumulation. With negative bank loan rates investors find it better to borrow and buy inflation hedges instead of investing, thus reducing the level of investment.
Administratively set interest rates are not only low but lack flexibility. They make it impossible for financial institutions to adjust their lending rates to the changing cost of funding or to narrow their profit margins. This makes it impossible for many lending institutions to absorb any loss that may be incurred in lending to higher risk projects. Consequently, financial systems in developing countries concentrated on low-risk established projects, leaving the high risk projects with no funding. The DFIs, meant to provide long-term credit, are faced with portfolio problems attributable to weak accountability and poor financial practices and the capital markets — the alternative source of long-term funding — are at an infancy stage and trading largely in existing shares. This then limits the alternative sourcing of investment funds.
Administratively set interest rates also expose depositors to low non-negotiable rates, and they cannot benefit from higher rates offered by banks competing for deposits in a
free market. Banks are left with no incentive to mobilize deposits or compete for loan customers. At the same time low interest rates inhibit entry of new financial institutions, stifling competition in the banking sector, and cause capital flight leading to foreign exchange shortages if international capital controls are relatively ineffective at preventing capital outflows. The empirical significance of all these effects depends on the degree to which controls force interest rates to deviate from their equilibrium value. In particular the effects are likely to be strongest when there is a low nominal interest rate ceiling combined with a high inflation rate, resulting in highly negative real interest rates (Caskey, 1992).
It is advocated that financially repressed systems abolish or relax interest rate controls; eliminate or greatly reduce controls on allocation of credit; switch to market based indirect methods of money supply control; and develop money and capital markets. Flexible interest rates promote genuine competition, with savers and borrowers getting the best return. They allow more diversity in interest rate structure where institutions are able to consider lending proposals involving higher levels of risk since they are able to charge higher rates reflecting the risk component. Flexible rates also mean that borrowers without access to loans can get credit, and credit increasingly flows toward more profitable projects, ensuring economic growth. Flexible interest rates allow credit control, which though sometimes effective and useful in the shortrun, is difficult to design and administer in an efficient and equitable way.
Financial liberalization theory, then, argues for improved economic growth through financial sector reforms. The supporters of financial liberalization base their arguments on the works of McKinnon and Shaw. According to the theory, positive real deposit rates raise the saving rate, thus increasing the flow of financial savings. Developing countries with repressed financial systems thus mounted financial reforms aiming at: mobilization of financial resources with increased amounts of domestic savings channeled through the formal financial sector, reducing the role of direct controls in determining the allocation of credit, increasing reliance on market based system of monetary control and broadening the range of domestic sources of finance.

12 RESEARCH PAPER 72
Liberalization of Kenya's financial sector
After successful economic growth with a relative degree of internal and external balance in the 1960s, Kenya experienced structural distortions in the 1970s with external shocks, financial imbalances and fiscal undiscipline. The country approached the IMF for financial assistance and terms for a standby agreement were agreed upon in August 1979. Disbursement was delayed, with the ceiling for government borrowing from central bank proving untenable. However, there was an urgent need for quick disbursement that coincided with the World Bank's decision to move into medium-term balance of payment support to help the country adjust to the oil price shock (Swamy, 1994). A planned industrial sector loan was converted into a structural adjustment loan in March 1980 with the hope of effecting quick response in exports. Very little was achieved and the economic condition worsened, forcing the government to go back to the World Bank in 1982.
The second SAL was signed in June 1982. This was expected to pick up the unfinished agenda on trade reform and address reform in marketing, interest rates, energy and family planning. The economy seemed to stabilize by 1984, but at the expense of growth and consumption and with little effort towards structural adjustment. This was caused by design and timing problems, lack of compliance and no commitment among a small coterie of top civil servants (Swamy, 1994).
With the combination of renewed macroeconomic imbalances and sluggish economic growth, the government re-examined the SAP implementation process and opted for a
change from the broad approach to a sectoral approach after 1984. The main objectives of the sectoral approach were to: minimize adjustment costs; ensure adequate preparation for proposed reforms; develop consensus to sustain the process: and avoid straining the government implementation capacity. Kenya received various facilities from the World Bank during the second phase of SAP (1985—199 1), including agricultural sector credit in 1988, a financial sector adjustment credit in 1989 and a health rehabilitation project in 1991.
Although the government recognized the constraints facing the financial sector as far back as the mid 1970s, no action was taken till the late 1980s. By the early 1980s there was growing pressure to maintain positive real interest rates, and to use the interest as a
tool to promote monetary stability and economic growth. In Sessional Paper No. 1
1986, various proposals were made to develop the financial sector including the establishment of secondary market, money market and capital market to improve competitiveness in the sector.
A comprehensive financial sector adjustment programme was launched in early 1989 (The Appendix summarizes the liberalization process of the financial sector). The main objective was to improve the mobilization and allocation of domestic resources. The reform constituted both institutional and policy reforms. Institutional reforms were designed to restore public confidence in the financial system and to upgrade the skills required to supervise and regulate financial institutions. They included strengthening prudential regulations and supervision of financial system, development and

FINANCIAL SECTOR REFORMS AND INTEREST RATE LIBERALIZATION: THE KENYA EXPERIENCE 13
implementation of specific restructuring programmes for weak and solvent financial institutions, development of a strong cadre of central bank and other banking professionals, and the development of a capital market (World Bank, 1992). The policy reforms involved reducing budget deficits and government reliance on domestic bank borrowing, developing more flexible monetary policy instruments, liberalizing interest rates, and improving efficiency of financial intermediation by removing distortions in financial resources mobilization and allocation.
Interest rate liberalization
Kenya, like many other developing countries, followed a policy of low interest rates, adjusting for inflation to maintain positive real rates. The main aim of this policy was to keep the costs of funds low, with the belief that cheap credit promoted development through increased investment. The use of interest rates to manage monetary conditions and mobilize and allocate financial resources in an efficient manner was neglected.
Interest rates remained under the administration of the government through a regime of fixing minimum savings rates for all deposit-taking institutions and maximum lending rates for commercial banks, NBFIs, and building societies. Interest rates were calculated on a reducing balance method and levying of extra charges on loans was not allowed. Deposit savings rates were too low compared with the lending rates, widening the spread between the two. The inflationary pressure created by the first oil crisis made the interest rate negative in real terms. As indicated in the 1974—1978 Development Plan, the government saw the need to review the interest rates to encourage savings through the banks and to create a disincentive to forestall speculation and uneconomic use of savings by borrowers. In the l980s, the interest rate policy was reviewed with the following objectives: (1) to keep the general level of interest rates positive in real terms in order to encourage savings and to contribute to the maintenance of financial stability; (2) to allow greater flexibility and encourage greater competition among the banks and non-bank financial institutions to enhance efficient allocation of financial resources — in particular, the policy strove to ensure that funds flowed into those areas that are most productive, with the biases against long term lending and lending to small business eliminated; and (3) to reduce the differential to maximize lending for banks and NBFIs. With liberalization, the interest rate policy aimed to harmonize the competitiveness among the commercial banks and NBFIs by removing the differential that had existed for maximum lending rates to allow greater flexibility and encourage greater competition in interest rate determination so that the needs of both borrowers and lenders could be better met through the cooperation of market forces and to maintain the general positive levels of interest rates in real terms in order to encourage the mobilization of savings and contribute to the maintenance of financial stability.
The first review of interest rates in the post independent period was in June 1974, a decade after independence. Further reviews were made in the 198 Os6 to allow commercial banks more room to compete and have flexibility in meeting the needs of customers, narrowing further the difference between NBFI and commercial bank rates. Also, it was

14 RESEARCH PAPER 72
aimed at making interest rates responsive to changes in international markets to provide protection against adverse movements of funds internationally. In 1989 the ceilings on savings deposit rates for both commercial banks and NBFIs were progressively raised, while the ceilings on long-term bank loans were brought to the same level with the ceiling for NBFI lending. These moves harmonized interest rates across the institutions, allowing banks greater flexibility in varying rates according to loan maturities. However, the gap between the lending and deposit rate was not narrowed. In 1990 institutions were allowed to include all lending related charges and fees, so that the effective rates on loans could exceed stipulated ceilings. Treasury bill rates were fully liberalized in mid November 1990. This made it possible for the central bank to use the bill rate to influence the level of other short-term interest rates. Interest rates were finally liberalized in July 1991. The immediate experience with interest rates was very promising, as they recorded positive real rates and the spread between the lending and the deposit rates narrowed. This was short lived, however, with the high inflationary conditions. A tight monetary policy was adopted to mop up the excess liquidity. Treasury bill rates increased, pushing up the interest rates. Commercial banks increased their deposit rates as they competed for deposits from the non-banking sector. The depreciation of the exchange rate and the increasing treasury bill rates worsened the inflationary condition. The interest rates became negative in real terms (Table 3) and the spread between the lending and deposit rates widened (Figure 2).With liberalization it is expected that the financial sector will grow and become efficient as information flows improve, while the low cost of intermediation leads to a closing gap between the lending and deposit rates. As efficiency improves and competition increases, then the spread is expected to narrow. So far, then, the results demonstrate a nonachievement of efficiency in banking intermediation. At the same time, the short-term deposit rates have continued to increase at a faster rate compared with the longer deposit rates so that the yield curve assumed a negative slope.
Despite the efforts to introduce competitiveness, the banking sector seemed to gain an oligopolistic structure, with only a few institutions controlling the sector. Four major commercial banks continued to dominate, with more than 70% of the total deposit liabilities and a similar share of the loans market. With such a structure it was even difficult for the banking system to respond to changes in other price indicators, e.g., the improved exchange rate condition. As the country experienced exchange rate appreciation in 1994, banking institutions failed to reflect this in their lending rates. The central bank responded by calling upon the banking institutions to reduce lending rates so as to increase the demand for imports and allow for absorption of available foreign exchange. The central bank felt that it was only logical for the lending rates to come down to reflect change in inflation and the downward trend in treasury bill rates. In October 1994, dominant commercial banks responded by lowering their base rate as a step toward reversing the steady appreciation of the shilling. The lending interest rate was
reduced by between 3% and 5%, sitting at a higher level than expected. The high lending rates7 discouraged borrowing from the banking sector and commercial banks accumulated more than minimum statutory requirements (Figure 3).
FINANCIAL SECTOR REFORMS AND INTEREST RATE LIBERALIZATION: THE KENYA EXPERIENCE 15
Other financial sector reforms
Interest rate liberalization was accompanied by other reforms including the floating of the exchange rate and trade liberalization. In the financial sector there was a move toward the use of indirect monetary policy instruments, including reserve ratios, variable liquidity ratios and liberalized market based interest rates. The government took measures to remove the policy and institutional constraints in the operations of treasury bill and treasury bond markets, including the attraction of auction, reforms in the lending mechanism and issue of a broader range of treasury bills. The period following the interest rate liberalization saw an upward review of cash ratio and liquidity ratio aimed at regulating the liquidity in banking institutions (Figure 4).
The government sought to strengthen the legal and technical capacity of the central bank to carry out its regulatory and supervisory functions. The revised Banking Act of 1989 enhanced the central bank's role in the inspection of institutions, establishment of reports, auditing and provisioning requirements, capital adequacy requirement and exposure units, and assessment of penalties against non compliant institutions. The act also subjected building societies to more stringent licensing and operating regulations similar to those of NBFIs while regulatory differences between NBFIs and commercial banks were reduced. With the 1991 amendment of bank laws, the central bank imposed stringent licensing requirements on banks and NBFIs, increased minimum capital requirements and tightened control on the use of government overdraft facilities offered by central bank. Further amendments were made to the Banking Act to strengthen the balance sheet of banks and NBFIs and to improve the framework for their supervision. The Central Bank Act Amendment of 27 October 1995 enhanced the ability of the bank to supervise the industry more effectively, protect small depositors, and foster financial prudence and discipline in the management of banking institutions. The amendments allowed locally incorporated financial institutions to expand branch networks outside Kenya, reduced credit to a single borrower to 25% of capital and institution from 10;
harmonized the calender year for all financial years of the various institutions; reduced the period within which to publish audited accounts to three months from six months, granted central bank powers to approve external auditors, raised membership of the deposit protection fund to seven from five and established disclosure requirements for institutions covered by the fund. The amendments also stressed the professional and moral suitability for managers of banking institutions and subordinated all other law other than the central bank act to the banking law (Central Bank).
Restructuring of the financial institutions intended to promote competition, reduce government ownership and control, balance the type of institutions (commercial banks, merchant, development and household savings banks), and upgrade services with ATMs and promissory notes. Following the bank failures in 1986, the central bank strategized to restructure the ailing institutions to preserve public confidence in the banking system. The exercise was planned in two phases. During the first phase the bank acted on 10
ailing institutions, which were merged to form the Consolidated Bank of Kenya in December 1989. This was assisted with pay outs from the Deposit Protection Fund,

16 RESEARCH PAPER 72
which had also been strengthened and recapitalized as part of the reform package. Also of assistance was the conversion of parastatal deposits into equity. The first phase was accomplished on schedule. The second phase also involved 10 institutions. It was designed to rely more on independent efforts by the shareholders of these institutions to inject capital and improve operational efficiency without upsetting the interest of depositors. This was not successful, however, due to the inability or unwillingness of the existing owners to take appropriate action and the inability or unwillingness of the bank to enforce its supervisory powers or come up with alternative solutions (World bank, 1992). As such, most of the institutions covered ran into serious liquidity problems. It is no wonder that by 1992, 11 commercial banks and 20 NBFIs were experiencing financial distress (Swamy, 1994). By 1996, 55% and 60% of the institutions were liquidated with the deposit protection fund. As a further step toward achieving competitiveness, and strengthening the monetary policy, in mid 1994 a move was made to converting NBFIs to commercial banks. It was argued that the majority of NBFIs had links through share ownership with the commercial banks and such situation permitted a great deal of inter- company deposits and loans and allowed conflicts of interest to arise. The situation limited the effectiveness of monetary policy and the ability to control inflation. This was also a strong case for a regulatory regime that allowed institutions to stand on their own feet.
The move was met with opposition from the banking sector, however. Insiders argued that while the rationale for putting NBFIs and commercial banks under the same umbrella was legitimate, the regulatory regime had no right to dictate to institutions how to organize their operations. They also argued that NBFJs should be left to retain their identity and maximize the comparative advantage they had evolved in the areas of consumer bills of exchange and term loans. It was estimated that the NBFIs lend approximately two shillings for every three lent by the commercial bank. Again, the decision to transform them came at a time when banking institutions were required to raise their paid up capital and reserve from Ksh37.5million to Ksh75 million.8 It was felt that such a move would knock a great number of indigenous banking institutions out of existence.
The central bank intended to promote stability in the system by solving the problem of under-capitalization, a common deficiency of indigenous banking institutions. This would allow growth of strong local institutions and induce local banking institutions to open up their shareholding to other investors, given that many of the ailing banks were individually owned. The Deposit Protection Fund Board was established to ensure stability of the financial market, thus protecting investors and depositors. By December 1996, 38% of NBFIs had converted into commercial banks, 9% had approval to commence operations; 17% merged with parent banks and 4% converted to mortgage finance (Central Bank).
Several policy and institutional measures were implemented to stimulate development of capital markets with the idea of broadening the existing market, increasing competition in the securities markets, encouraging secondary market development and improving the incentives for private capital. The reforms focused on enhancing the returns from equity investments, thereby reducing the bias favouring debt instruments. The measures implemented included: elimination of double conversion of dividends by converting withholding tax into final tax, exemption of withholding tax on the dividend income of

Tab
le 3
: R
eal
inte
rest
rat
es fo
r se
lete
d pr
inci
pal i
nter
ests
in K
enya
. 19
91-1
996
1991
19
92
1993
1 2
3 4
1 2
3 4
1
Dis
coun
t ra
te f
or
trea
sury
bill
s 7.
5 6.
4 5.
6 5.
4 -1
.9
-3.2
-5
.3
-5.7
2.
2
Adv
ance
d ag
ains
t
trea
sury
bill
s 9.
8 8.
7 7.
9 7.
7 -0
.3
-1.2
-3
.3
-6.1
4.
1
Bui
ldin
g so
ciet
ies
depo
sits
rat
e 4.
8 4.
1 3.
4 2.
9 -4
.3
-5.6
-7
.7
-10.
4 -1
3.6
Com
mer
cial
ban
k
depo
sit
rate
5.
3 4.
7 3.
2 2.
8 -4
-5
.7
-7.6
-9
.8
-12.
7
Com
mer
cial
ban
k
lend
ing
rate
9.
4 8.
7 6.
3 6.
4 -0
.8
-1.9
-3
.6
-6.1
-9
.2
Pos
t of
fice
savi
ngs
bank
rat
e 2
1.4
0.6
0.2
-6.7
-1
.8
-10.
1 -1
2.8
-15.
8
Infla
tion
8.8
9.5
10.3
10
.8
19.1
20
.8
23.5
27
.3
31.9
Sou
rce:
Cen
tral
Ban
k E
cono
mic
R
epor
t an
d Q
uart
erly
Eco
nom
ic R
evie
ws
Rea
l in
tere
st [(
I -
infla
tion)
/(1
+ in
flatio
n)]1
00
1994
19
95
2 3
4 1
2 3
4 1
2
26
16
-4.3
-1
.5
-13
-14.
4 -8
.8
-0.5
8.
9
29.7
20
.2
-0.7
-1
2.7
-11
-12.
4 -6
.8
1.7
11.4
-16
-16.
1 -2
0 -2
2 -2
2 -2
0.7
-6.6
0.
9 9.
8
-13
-11.
4 -1
4 -2
0.1
-22
-18.
2 -1
3 -4
,5
2.6
-8
-8.9
-9
.4
-13.
2 -1
2 -8
.2
-2.6
6.
6 15
.1
-18
-20.
4 -2
4 -2
7 -2
7 -2
3.2
-15
-8.6
-0
.6
35.3
39
.4
45.5
50
.6
50.1
43
.2
29.3
16
6.
6
1996
3 4
1 2
18.1
19
20
.8
14.9
20.9
21
.6
24.1
19
.8
14.3
15
.2
13.9
10
.3
8.7
10.9
11
.4
8.9
22.7
27
24
.7
22
3.5
4.3
3.2
0.7
2.4
1.6
2.7
5.2
3 161
21.4
8.3
6.9
19.7
-1 7.1

18
Figure 3: Liquid assets for commercial banks
RESEARCH PAPER 72
— 1991 1992 1993 1994 1995 1996 1997
Exliquid = excess liquidity/deposit liabilities; Miniliquid = minimum liquidity/deposit liabilities; Ministatu = minimum statutory liquidity; Totexliquid = total excess liquidity.
Figure 4: Unit root tests
1995 2000
exliq.id... ninhiqui .instatu=.. tote,.liqt
0
deposits=.... Iiqa�set
:00000
.02 DtbI 1 112.....
01
A IL.,
.15
.1
.05
0 A/b —.01
1995 2000
Dreal tra_
— £ 1995 £
Dtinflat_
r.-
-
-.05 —.—--—J
1995 2000
:: Art...... I.
1995 2000
FINANCIAL SECTOR REFORMS AND INTEREST RATE LIBERALIZATION: THE KENYA EXPERIENCE 19
corporate tax, tax exemption of bodies such as pension funds, elimination of corporate tax on dividend income of unit trusts, removal of capital issues committees' role in regulating share issues, abolition of stamp duties on retail share transactions, and tax deductability of all costs incurred in the issue of shares, debentures and bonds. The government also adopted a revised unit trust act to liberalize regulation for establishing and operating investment trusts. The Capital Market Authority was established in January 1990, after a legislation providing for establishment of a capital market authority was passed by the parliament in November 1989. The legislation defined the roles and responsibilities of various participants and provided for the implementation of investor protection measures. CMA's mandate included the development of a securities industry. The stock exchange trading floor was established in 1991/92.
Kenya pegged the exchange rate to the U.S. dollar before changing to a basket of currencies (SDR) in 1975. The system was modified in 1982 with the shilling pegged to a composite basket of currency representing the bulk of Kenya's external trade. In 1990 a dual exchange rate existed with the official exchange rate and the foreign exchange bearer certificates. By 1993, the dual system operated with an inter-bank rate and official exchange rate . The two were then unified in October 1993 as the exchange rate was floated.
III. Interest rate determination
Our analysis shows that a lot was happening during the liberalization period. Interest rates were liberalized and indirect monetary policy tools adopted. Steps were taken to establish financial markets, decontrol foreign exchange, liberalize trade and tighten prudential regulations. The role of the central bank was strengthened and monetary policy was tightened. All these were accompanied by declining economic performance. From the financial repression theory, a major achievement in the financial liberalization is the decontrol of interest rates. This is expected to have a positive impact on economic performance and also to indicate the direction the financial sector is taking with the liberalization process. The section thus looks at the interest determination in a liberalized financial market.
Theoretical framework
Traditional theories define interest rate as the price of savings determined by demand and supply of loanable funds. It is the rate at which savings are equal to investment assuming the existence of a capital market. The loanable fund theory argues that interest rate is determined by non-monetary factors. It assigns no role to quantity of money or level of income on savings, nor to institutional factors such as commercial banks and the government.
The liquidity theory, on the other hand, looks at the interest rate as the token paid for abstinence and inconveniences experienced for having to part with an asset whose liquidity is very high. It is a price that equilibrates the desire to hold wealth in the form of cash with the available quantity of cash, and not a reward of savings. Interest rate is a function of income. Its primary role is to help mobilize financial resources and ensure the efficient utilization of resources in the promotion of economic growth and development.
From the traditional theory, nominal interest rates adjust fully to the expected rate of inflation leaving real interest rates unchanged. In his works, Irving Fisher held the same sentiments. He believed that there is a positive relationship between expected future price increases and nominal interest rate. An increase in price increases the nominal value of trade, resulting in an increase in demand for money and leading to an increase in nominal interest rate. lrving Fisher's theory is controversial, however, particularly when it is interpreted as suggesting a constant real interest rate.
Earlier studies estimated the Fisher effect, i.e., the amount of change in nominal rates resulting from a change in the expected rate of inflation by basing their theoretical
FINANCIAL SECTOR REFORMS AND INTEREST RATE LIBERALIZATION: THE KENYA EXPERIENCE 21
expression on nominal interest rates as the sum of the real interest rates and expected inflation and a residual term.
I = nominal interest rates rr = real (ex-ante) rate of interest — expected real rate
= expected inflation rate
Real interest rates and expectations of inflation are not observable. Thus, specific hypotheses were maintained about real rates and formation of expectations. It was assumed, for example, that the real interest rate was a function of deeper economic variables like marginal rate of substitution and transformation and the rate of time preference, and because it moved or adjusted slowly, it was approximated as a constant.
Empirical studies testing the Fisher effect found its magnitude less than one, suggesting that nominal interest rates are extremely slow to adjust to inflation, so that there is a
tendency for the inflation rate to expand the gap between nominal and real interest rates. Tobin (1965) modified Fisher's conclusion by arguing that inflation reduces the demand for money balances, lowering the real rates of returns so that real interest rates are not a
constant. To Fisher, the influence of change in the purchasing power of money on nominal
interest rates depends on whether or not the change is foreseen. If it is not clearly foreseen, a change in purchasing power of money will at first affect the money interest rate. To the extent that changes in the purchasing power of money are foreseen, then theoretically it is possible to make allowance for the expected change in the unit value. To offset a foreseen appreciation, it is necessary that the rate of interest be correspondingly lower, while to offset unforeseen depreciation the rate of interest should be correspondingly higher. However, because of ignorance and indifference, depreciation and appreciation are never fully foreknown and therefore they are partially provided in interest rate. To Fisher, then, the change in value of money would not be fully reflected in nominal interest rate due to lack of foresight.
From the Keynesian framework, changes in monetary expansion induce changes in the nominal rate of interest through the portfolio allocation behaviour of asset holders. The analysis concludes an inverse relationship between money and nominal interest rates, so that monetary expansion leads to lower interest rates. Changes in the nominal rate of interest are then translated to changes in real rates of interests, given that the elasticity of the real rate of interest to money is positive. This implies that nominal rates and expected inflows respond differently to change in policy, with expectation adjusting slowly to the changing economic environment.
For monetarists the impact of a change in monetary policy on nominal rates of interest is influenced by the rate at which expectations adjust to new economic policy. With expansionary monetary policy the public expects a higher rate of inflation and the nominal rate of interest rises as lenders anticipate that demand will raise interest rates and borrowers will be willing to pay a higher rate.

22 RESEARCH PAPER 72
Also in Angeloni and Prati (1993), evidence from the UK is quoted as supporting the Keynesian argument where monetary expansion resulted in lower interest rates, contrary to the monetary business cycle model where monetary expansion increases nominal rates of interest through inflationary expectation. It is argued that, initially, liquidity shocks and short-term interest are negatively related, but in the long run the effect is more controversial as these rates are presumably more affected by expectations about future growth and inflation, with exchange rate forming the key link. In small open economies where domestic monetary shocks tend to be offset by reserve outflows with no effect on interest rates, an increase in money supply reduces the interest rates. If money demand is interest elastic and interest rates fluctuate in international financial markets, a liquidity effect may exist but may not call for active monetary policy.
Tanzi (1980) extended the Fisherian model to include influences of business cycle fluctuations. He argued that the divergence between realized and expected interest rates is influenced by business fluctuations. His results with only expected inflation found the value of the Fisher effect to be less than one, implying that not all changes in inflation are absorbed by nominal rates. Including the business cycle, he found that the explanatory power of the inflationary variable increased with the addition of a real output variable in the model.
His results on the role of real output in determination were, contrary to the findings of Eliot (1977). Eliot found no significant relationship between interest rates and real output. He did find a negative and significant relationship between interest rates and the current actual rate of inflation. To Fieldstien (1980), the Fisherian hypothesis would only hold if real interest rates, costs of capital to the firm and real return to savers are equivalent as in a market left free with no government interferences; otherwise with taxation policy the hypothesis will not hold. He developed a model to test for the role of taxation of interest rate income in determining the nominal rates. The argument was that in order to compensate the lender for the inflation, nominal rates should be set above Fisherian rates. Tanzi tested for the effect of income tax on the nominal interest rates, but found no significant results.
Edwards and Khan (1985) developed an interest rate model for a semi-open economy where both domestic and foreign factors were considered to be vital in determining nominal interest rates. They argued that although the capital account of the balance of payments may not be completely open, if there is trade with the rest of the world, then the open economy factors are expected to indirectly influence domestic interest rates. For example, terms of trade shocks can produce changes in real income and prices that will affect domestic demand for credit and thus the equilibrium rate of interest. To Edwards and Khan, expected real interest rates deviate from the long-run equilibrium due to monetary disequilibrium where excess demand (supply) of real money balances yields a
temporary higher (lower) real interest rate. As the money market goes back to equilibrium, the real rate of interest will equal the long-run rate so that conditions in the money market play no role in explaining the real rates of interest.
Angeloni and Prati (1993) expanded the domestic interest rate model to include the influence of foreign interest rates, expected rate of depreciation and the sterilization behaviour of the central bank. They examined the relationship between bank liquidity

FINANCIAL SECTOR REFORMS AND INTEREST RATE LIBERALIZATION: THE KENYA EXPERIENCE 23
and money market interest rates for Italy using daily data from January 1991 to July 1992. Their results strongly supported the existence of liquidity effects on money market interest rates. Interest rates were found to be driven almost entirely by exchange factors either directly or through the liquidity effects of central bank intervention.
Gupta and Gupta (1994) examined the relative importance of international capital market integration in determining interest rates in selected industrial and developing countries. They modeled real interest rate parity as:
(r1 - r1*) (j— j*)
— (B1 — B1*).
avoiding the weakness of covered and uncovered interest rate parities. To them the differences between nominal interest rates (i1
- j1*) are explained in the bonds market
while price differences (B1 are explained in the goods market. Open market factors were captured by the short-term current account balances (CAB) plus a country risk (CR) factor as a proxy for expected rate of change of exchange rate. For domestic monetary policies, they argued that the setting of the central bank discount rate (CDR) and policies targeting the domestic credit growth (MPV) are the most direct instrument for influencing domestic interest rates, if capital market integration is weak. They estimated the following equation for 15 countries, 6 industrial and 9 relatively open developing countries:
(I - F) = + z.cab + y.cdr + x.mpv + d.cr
The results indicated that domestic and world inflation rates are highly significant in
explaining cross-country differentials between domestic interest rates and world interest rates, while the country risk variable was insignificant. There was a considerable difference between industrial and developing countries in the relative significance and role of the CAB and domestic monetary policy variables in determining domestic interest rate differentials across the sample countries.
To conclude, both the empirical and the theoretical works show that interest rates are influenced by internal and external factors, including monetary factors and macroeconomic policies and other factors outside the money market.
Methodology
The interest rate model
The theoretical model of interest rate determination proposed by Edwards and Khan (1985) was adopted to analyse the interest rate market in Kenya. Kenya is a semi open economy, with imports and exports comprising about 20% of total GDP, and with restrictions in the capital account. Following the Edwards and Khan argument, if the capital account of the balance of payments is restricted, and the country is trading with the rest of the world, it is expected that both closed economy and open economy factors influence domestic interest rates.

24 RESEARCH PAPER 72
We start with the standard Fisherian equation of nominal interests:
i1 (1) (standard Fisherian equation)
= the nominal rate of interest rr = real (ex-ante) rate of interest it = the expected rate of inflation
Unlike Fisher's assumption of constant real rates of interest, the model assumed that the real interest rate deviates from its long-run value (p) with disequilibrium in the money market. Liquidity effects thus allow real interest rates to vary in the short run.
rr =p- EMS+w (2)
Substituting for the real interest rates in Equation 1,
= p-
EMS = excess money supply p = parameter ( X> 0)
= random error term
Although the condition in the money market can influence the inflation rate, the assumption made was that expected rate of inflation has no direct effect on real interest rates.
Expected inflation and excess money supply are unobservable variables. Expected inflation rate may be specified in several ways using adaptive expectation, rational expectation or adaptive aggressive habitual model. An assumption could also be made that actual and expected rates of inflation are equal assuming perfect foresight. There is
no compelling theoretical reasoning for preferring one method over another, however; the choice is ultimately an empirical one (Edwards and Khan, 1985).
Excess money supply was defined as:
= - (4)
where:
= actual stock of real money balance = desired equilibrium stock of real money balance
It is expected that with financial reforms, there is substitution between money and goods and money and other financial assets. In Kenya, for example, treasury bills are the most relevant alternative asset to money (Mwega, 1993).

FINANCIAL SECTOR REFORMS AND INTEREST RATE LIBERALIZATION: THE KENYA EXPERIENCE 25
Therefore, demand for money is a function of two opportunity cost variables, the expected rate of inflation and interest rate and a scale variable, the real income. The equilibrium demand for money was expressed in log form as:
= a0 + + a2(p + ,r)- a3 (5)
with long-run demand for money as a function of the equilibrium nominal rate of interest.
Assuming real money balances adjust according to:
/3 (log - log (6)
A = first difference operator /3 = coefficient of adjustment (0 <JJ < 1)
then Equation 6 introduces the process by which nominal interest rates return eventually to equilibrium.
Rewrite Equation 6 as:
log = /3 log + ( l-/3) log M11 (6a)
and combine equations 6a and 4 to obtain:
= (1 -/3) (log - log (7)
combine equations 1, 5, and 7 to derive the reduced form equation for nominal interest rates as:
+ + y3log,r,+ (8)
To introduce the open market factors, Edwards and Khan assumed an uncovered interest arbitrage relation assuming no impediments to capital flows. Domestic and foreign interest rates are closely linked, especially in a world with no transaction costs and risk- neutral agents.
(9)
= world interest rates = expected rate of change
There are possibilities that because of friction arising from transaction costs, or

26 RESEARCH PAPER 72
information lags, domestic interest rates respond with delay to any change in foreign rates or exchange rate expectation. Modeling in a partial adjustment framework then
z=O + - 1 (10)
and domestic nominal interest rate
= 0 + + (1-0) (rr + (11)
combining the closed and open economy extremes using the linear combination method. Then the following nominal interest rate model is specified, assuming a lag in response of domestic interest rate:
= + + (1-iy) (rr + ,re) (12)
= index measuring the degree of financial openness 1 = fully open 0 = fully closed
0 < <1 then semi-open
Although in an open economy the demand for money function should be generalized to allow for foreign interest rate and the expected change in the exchange rate, the effect of currency substitution was not considered in the model. From equations 4, 5 and 12 the following reduced form expression for nominal interest rates in a semi-open economy was derived:
= + + + a2 log + alog + + (13)
If we assume no lag in response of the domestic interest rate, then = 1 and the lagged interest rate term will drop from the model.
= a0 + + a2log + alog + V1 (14)
From the reduced form model, interest rates are influenced by inflationary conditions, open market factors including foreign interest rates, and the expected depreciation of local currency, monetary condition and output levels. Following the general-to-specific approach to modeling, or the data generating process, the vector of variables was defined for X as
X = e1, i, (m-p), (y-p), t + e)
where:
= expected inflation (rate of inflation)
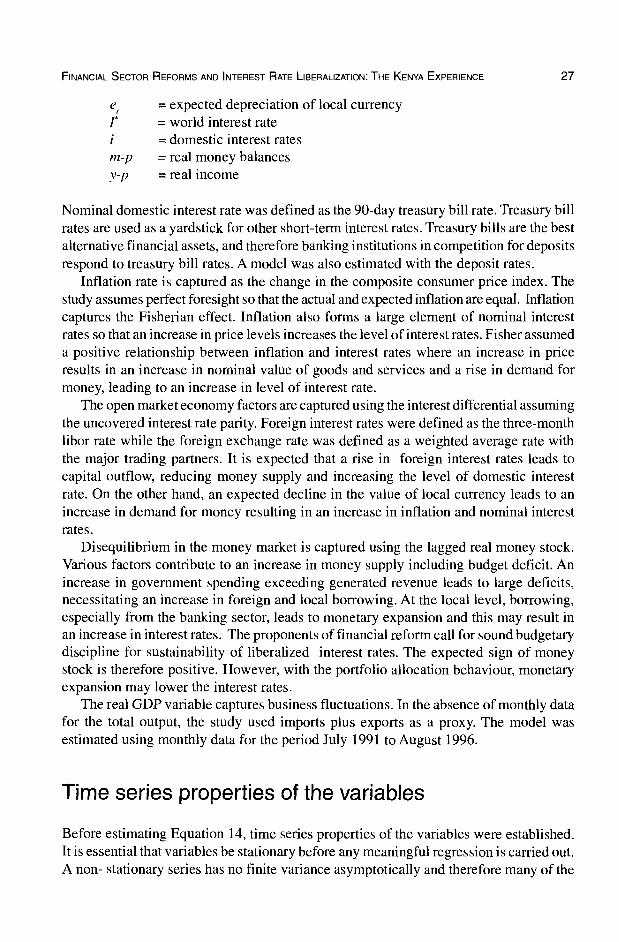
FINANCIAL SECTOR REFORMS AND INTEREST RATE LIBERALIZATION: THE KENYA EXPERIENCE 27
e, = expected depreciation of local currency I = world interest rate
= domestic interest rates rn-p = real money balances y-p = real income
Nominal domestic interest rate was defined as the 90-day treasury bill rate. Treasury bill rates are used as a yardstick for other short-term interest rates. Treasury bills are the best alternative financial assets, and therefore banking institutions in competition for deposits respond to treasury bill rates. A model was also estimated with the deposit rates.
Inflation rate is captured as the change in the composite consumer price index. The study assumes perfect foresight so that the actual and expected inflation are equal. Inflation captures the Fisherian effect. Inflation also forms a large element of nominal interest rates so that an increase in price levels increases the level of interest rates. Fisher assumed a positive relationship between inflation and interest rates where an increase in price results in an increase in nominal value of goods and services and a rise in demand for money, leading to an increase in level of interest rate.
The open market economy factors are captured using the interest differential assuming the uncovered interest rate parity. Foreign interest rates were defined as the three-month libor rate while the foreign exchange rate was defined as a weighted average rate with the major trading partners. It is expected that a rise in foreign interest rates leads to capital outflow, reducing money supply and increasing the level of domestic interest rate. On the other hand, an expected decline in the value of local currency leads to an increase in demand for money resulting in an increase in inflation and nominal interest rates.
Disequilibrium in the money market is captured using the lagged real money stock. Various factors contribute to an increase in money supply including budget deficit. An increase in government spending exceeding generated revenue leads to large deficits, necessitating an increase in foreign and local borrowing. At the local level, borrowing, especially from the banking sector, leads to monetary expansion and this may result in an increase in interest rates. The proponents of financial reform call for sound budgetary discipline for sustainability of liberalized interest rates. The expected sign of money stock is therefore positive. However, with the portfolio allocation behaviour, monetary expansion may lower the interest rates.
The real GDP variable captures business fluctuations. In the absence of monthly data for the total output, the study used imports plus exports as a proxy. The model was estimated using monthly data for the period July 1991 to August 1996.
Time series properties of the variables
Before estimating Equation 14, time series properties of the variables were established. It is essential that variables be stationary before any meaningful regression is carried out. A non- stationary series has no finite variance asymptotically and therefore many of the
28 RESEARCH PAPER 72
standard theorems of asymptotic analysis are invalid. If a series is non-stationary, one is likely to finish up with a model showing promising diagnostics test statistics even in the case where there is no sense in the regression analysis.
The order of integration of each variable is identified using the Dickey-Fuller (DF) class of unit root tests and the Sargan Bhargava Durbin Watson (SBDW) test. The DF method is a test on the size of the coefficient in the equation.
X=a0+4X1+u (15)
The DF tests the hypothesis = 1, the so-called unit root test. This is based on the estimation of an equivalent regression equation to (1) namely
(16)
with
Equation 16 tests for negativity of ö
H0: S=O
H0:
If the null hypothesis is rejected and the alternative hypothesis accepted, it implies that < 1 and that X, is integrated of order zero (stationary), i.e. X is I (0). If the null hypothesis cannot be rejected then the series has a unit root and is non-stationary in levels. It may be integrated of order higher than zero or may not be integrated at all.
The next step is to test whether the order of integration is one by differencing further until the order of integration is established or until it is established that X1 cannot be made stationary by differencing. A weakness of the DF test is that it does not consider the possibility of auto correlation in the error term. If is not white noise, then the OLS estimate will not be efficient. The augmented Dickey Fuller (ADF) test is used to overcome the problem.
The ADF equivalent of Equation 15 is the following:
(17)
Again the hypothesis is as in DF, so that when the null hypothesis is rejected and the alternative accepted the series is stationary at levels. If the null hypothesis cannot be rejected, the series is non-stationary in levels but could be stationary at higher levels or not stationary at all. The estimation procedure for ADF is similar to DF test.
The SBDW test is based on the standard Durbin Watson statistic but is applied to the levels of individual series. It is a quick guide to check whether a variable is integrated of order zero. The SBDW is defined as:
SBDW = - / - (18)

FINANCIAL SECTOR REFORMS AND INTEREST RATE LIBERALIZATION: THE KENYA EXPERIENCE 29
Unlike the DF tests, the test is against the null hypothesis that the series is 1(0) in which case the value of the DW statistic will tend towards a value of 2. If the statistic is
low, there is evidence of an 1(1) series. The unit root test results in Table 4 and Figure 4 show that the variables are 1(1) processes.
Before estimation, the data series was "deseasonalized" to save on the degrees of freedom and also because monthly data are subjected to seasonal variations and this was not the main focus of the study. For deseasonalization, the following regression is estimated:
= a +J31S1 +J32S2+ +J311S11 + (19)
where X1 is the data series, a is a constant, S the seasons and is an error term. The fitted values (Xe) from this equation become the "seasonal filter" and the residuals is
the seasonal adjusted series, which is then used in the analysis. However, Equation 19
can only be run if X, is stationary. If X, is trending, the equation must be run with on
the left-hand side as follows:
(20)
Given that the results are 1(1), the series were deseasonalized by running Equation 20 and the seasonally adjusted residuals obtained. To recover we add X0 to for each series = X0 + X).
Tests for cointegration were carried out and a cointegrating vector normalized with the interest rate variable. The following are the results:
- 0.15 Iforex + 0.48 income - 0.06 cpi + 0.02 M2 (21)
The next stage was to estimate the interest rate model. We started with a general over paramaterized statistical model. It was then reduced using the parsimonious method to get an interpretable model (preferred model). Given that parameters are likely to be unstable in the liberalization process, single shocks with an impulse dummy were modeled. This followed recursive test stability of the model (Figure 5) showing instability of the coefficient values in the period of study. The error-correction term was steady throughout and significantly different from zero. The results of the preferred model are given in Table 5. The preferred model was then solved to show the reduced results of the analysis (Table 6).
The statistical significance of the coefficient of the error-correction term (ECM- 1)
led to the conclusion that there is a long-run relationship among interest rates, inflation, money supply and income. The speed of adjustment of interest rates was 77% to disequilibrium in the market in the reduced results (Table 6). This conforms to the theory that as the money market returns to its equilibrium position, interest rates tend, towards the equilibrium position (see Edwards and Khan, 1985). It reflects Adams (1992a) results

30 RESEARCH PAPER 72
that there is a long-run relationship between money and income, therefore concluding that as an equilibrium is attained in the money market, so will the real market realize an equilibrium income.
Table 4: Unit Root Tests
Variables DF ADF RADF* Order of Lag integration length
CPI -68348 -2.9276 -1.697 1(1) 6 Tbills -1.445 -2.2421 -2.112 1(1) 6 Forex -1.320 -2.544 -2.889 1(1) 6
M2 -3.780 -2.877 -0.626 1(1) 6
Income -5.446 -2.321 -3.297 1(1) 6
* RADF is ADF estimated recursively in order to identify shocks or structural breaks. In all cases the variable had one or two shocks that were modelled, thus improving the power of the tests. This is because DF class of tests require that errors be serially correlated or homogenous. Shocks in the variables will contribute to the low power of this class of tests (Ndung'u, 1997).
Key: CPI = measured as the rated of change consumer price index Tbill = treasury bill rate (90 days) Forex = foreign factor (i + e)
M2 = broad money
Income = proxied by (X+M)
The dummy variables were introduced in the model to capture responses to shocks. It is clear from the results that interest rates responded more to the shocks than to the fundamentals. Interest rate liberalization was accompanied by inflationary conditions as a result of high money supply. To mop up the excess money supply, sale of treasury bills went up in 1993, increasing the treasury bill rate. This was coupled with devaluation of the Kenya shilling and high fiscal deficit. As expected this spurred inflation, which reached a peak in 1993, resulting in increased interest rates. Dummy variable D93-3 is
positive and significant, showing an increased level of interest rates by 3.3% with the experience. Although interest rates reduced after the floating of the exchange rate followed by appreciation of the Kenya shilling, dummy D93- 11 indicates that there was an overall increase in interest rates by 0.13%. This could be attributed to the increased cash ratio that accompanied the tight monetary policy adopted (Figures 6a and b). A general decline in interest rates was realized in 1994 even with increased cash ratio (D94- 1) following the trade liberalization activities and relaxation of the cash ratio (D94-9). A further decline in interest rates accompanied the tight prudential regulations beginning in 1995, and the realized decline in inflation rate. However, as inflation turned upward in 1996, interest rates increased.
Note that most of the fundamentals played an insignificant role in explaining the variations in interest rates. This is because the treasury bill rate was not used as a monetary

FINANCIAL SECTOR REFORMS AND INTEREST RATE LIBERALIZATION: THE KENYA EXPERIENCE 31
policy tool, but a tool to finance government deficit from the non-banking domestic sources. No wonder then the treasury bill rate was even higher than the lending rate in
1993/94 period. The foreign factor (forex) showing the impact of interest rate differential in the domestic interest rate indicates that as the gap widened between the domestic and foreign interest rate, there was an inflow of capital. This resulted in increased money supply and increased interest rates.
The estimated model was well fitted, with the errors having no memory so that the data are admissible, and the coefficient not equal to zero (Figure 7).
Table 5: Preferred model
Variable Coefficient t-value
Constant -.0003 -0.576 TbiIl-1 -.0364 5.951 TbilI-2 .1304 1.668 Forex .0942 7.665 Income -.0002 -0.332 M2 -0.0314 -3.876 M2-1 .0167 2.410 M2-2 .0205 2.590 CPI -.0454 -3.743 CPI-2 .0272 2.452 D941 -0.01 83 -6.326 D949 .0099 3.273 ECM-1 -.3902 -4.678 D933 .0169 5.258 D9311 -.0162 -5.619 D955 -.0074 -2.390 D962 .0062 2.248
R2 = .921021 F{16,41) = 29.883(0.000)
= 0.00266 OW = 1.86 RSS = 0.00029(17,58)
Diagnostic tests AR 1-4 F(4,370 = 1.1249 (0.3597)
ARCH 4 F(4,33) = 0.5532(0.6980) Normality X2 (2) = 1.4425 (0.486) Reset F(1,40) = 0.031418 (0.8602)

32 RESEARCH PAPER 72
Figure 5: Recursive graphs
Figure 6a: Impact variables
1995 2880 1995 2088
EXRATE = Exchange rate; MCR = Cash ratio; TBILLS = Treasury bill rate; MSM2 = Broad money supply (M2).
Res_I=______ 0
—.3
—.6
—.9
—1.2
—1.5
t 2*S.E.= —2 -
—2.5 -
—3 -
—3.5
—4
-4.5
—5 1994 1995 1996 1997
ResiS tep=... ± 2*S.E.=
2.5 -
1994 1995 1996 1997 it CHOKs_ 5X crit
2- 1.5 -
1
1994 1995
.5
1996 1997 1994 1995 1996 1997
48
42
36
38
24
tbi 11=
________
60
40
248000
200090
168000
120880
80008

FINANCIAL SECTOR REFORMS AND INTEREST RATE LIBERALIZATION: THE KENYA EXPERIENCE
Figure 6b: Interest rates response to impact variables
Figure 7: Fitted treasury bill rate results
33
:
2000
77
TBILLS=__ LEND= IIIFLAT___
63
56
49
1991 1992 1993
seathi Ft tted
- 04
- 02
0
4 Residual_
2
- - 02
1995 Frequency seat hi l.
.35
2000
.2
.15 -
I
-1
.0
.6
- 05
0
1995 Cunulative Density seathilHoenalr
.4
-4 —2 0 2 4
.2
0 —4 —3 —2 —1 0 1 2 3 4 5

34 RESEARCH PAPER 72
Table 6: The re duceci results
Variable Coefficient SE t-values
Constant Forex Income
M2
CPI
D941
D949
ECM-1
D933 D9311
D955 D962
-.0006
.1865 -.0004
.0116
-.0361
-.0361
.0195
.7722
.0334 -.0321
-.0147 .0122
.001
.033
.001
.031
.035
.007
.007
.248
.008
.007
.006
.006
0.60
5.65
0.40
0.37
1.03
5.16
2.79
3.11
4.18 4.59
2.45
2.03
Wald test X2 (11) = 77.153(0.0000)
IV. Conclusions
The study tracks down the financial liberalization process in Kenya and empirically tests for the interest rate determination in a liberalized market. Several conclusions were drawn from the analysis:
1. Although emphasis in the literature on sequencing of financial reforms is first of all on achieving macroeconomic stability and other sectoral liberalization before financial liberalization (Mirakhor and Villanueva, 1992; Edwards, 1984; Montiel, 1995), the process in Kenya shows that:
• Financial liberalization was followed by other reforms, including trade liberalization.
• Macroeconomic economic stability was not achieved before liberalizing interest rates. And even immediately after the liberalization of interest rates, inflationary pressure was increasing, making it impossible to achieve real interest rates.
• Fiscal deficit was growing and increasingly financed from the local market using treasury bills.
• Credit controls were relaxed when the banking sector was experiencing high liquidity and there were no prospective investment opportunities.
This shows that the prerequisites for financial liberalization and decontrol of interest rates were not put in place.
2. The expectation in theory is that with liberalization, interest rates will be positive in real terms and with increased efficiency in intermediation, the spread between the lending and deposit rates will narrow. The study shows that:
• Positive real interest rates were not achieved until 1996 when inflation rate took a downward trend. But, prospects of keeping them positive are narrow with the upward trending inflation rate beginning in 1997.
• The spread between lending and deposit rates widened with liberalization, while the short-term rates increased at a faster rate compared with long- term rates resulting in a negatively sloped yield curve.
• The treasury bill rate operated as the yardstick for short-term rates. Commercial banks increased deposit rates to compete for the deposits held
36 RESEARCH PAPER 72
by the non-banking public.
Clearly, efficiency has not been achieved in intermediation of financial assets. This was reinforced by the oligopolistic structure of the market, where the sector is dominated by a few commercial banks.
3. The theory of financial repression also argues for competitiveness in the market, with diversified financial assets. The results indicate:
• Attempts to introduce the money, secondary and capital markets • A widening range of financial assets with diversified basket of treasury
bills and introduction of certificates of deposits • Review of the Banking Act, strengthening the role of the central bank • Tightening of prudential regulations for the financial institutions
4. However, the financial markets are still in their infant stage, and the central bank has not yet gained independence in its operations. At the same time, the "political banks" make it difficult to successfully implement the prudential regulations.
5. With a free market, the fundamentals are expected to contribute substantially in explaining the variations in interest rates. However, the results indicate that the fundamentals played an insignificant role in explaining variations in interest rates. It is the monetary policy and fiscal policy activities that seem to have had significant impact on the levels of interest rates in the short run.
6. However, in the long run the fundamentals play a major role as indicated by the significant error-correction term. Both internal and external factors interact together to determine interest rates.
7. To conclude then, although lots of efforts have been put in the financial sector liberalization process, there are still some loose ends that need to be tightened if positive impacts are to be realized.
Notes:
1 Kenya Commercial Bank sold shares in 1988 (20%), 1990(10%) and 1996 (10%). National Bank of Kenya sold 20% in 1994 and 20% in 1996.
2 M2/GDP is used as a proxy for financial deepening. The higher the ratio, the higher the level of monetization of the economy.
3 As early as in the 1974—1978 Development Plan, the government recognized the weaknesses in the financial sector, stating that "the financial sector is under- developed and not serving the interest of national development."
4 In the 1984—1989 Development Plan the government states that the regulatory framework within which banks and NBFIs operated warranted review.
5 Credit guidelines were aimed at ensuring adequate flow of funds to targeted sectors, i.e., agriculture, manufacturing, export business and construction. Lending rates were set to facilitate the allocation and reinforced with the administrative mechanism for allocation of credit. The Banking Act limited commercial banks to invest 15% of funds to long-term immovable property in order to protect the liquidity of the banks.
6 The minimum saving deposit rate was raised from 3% to 5% in mid 1974; in June 1980 it was raised to 6%, June 19811 to 8%, September 1981 to 10%, December 1982 to 12.5% and June 1984 to 11%.
7 In the Central Bank Monthly Economic Review, September 1995, the following reasons were given for the high lending rates and the widening spread: inflationary expectations, inadequate competitiveness in banking, excess demand for loans, and the operations of monetary and fiscal policies.
8 In 1996 minimum paid up capital was raised: local banks — Ksh75 million; foreign incorporated banks — Ksh200 million; local mortgage Ksh200 million; foreign- KshSOO million with assigned capital amounting to a minimum of Kshl 65 million; local finance firms — Ksh 375 million together with unimpaired reserves of no less than 7.5% of their total deposit liabilities.

References
Adam, C.S. 1992a. "Recent Development in Econometric Methods: An Application to the Demand for Money in Kenya". Special Paper 15. Nairobi: African Economic Research Consortium.
Adam, C. S. 1992b. "On the Dynamic Specification of Money Demand in Kenya". Journal of African Economies, 1, no. 2.
Angeloni, I. and A. Prati. 1993. "Liquidity Effect and the Determinants of Short-Term Interest Rate in Italy (1991-1992)". Centre for Economic Policy Research Discussion Paper No. 788.
Caskey, P.J. 1992. "Macroeconomic Implications of Financial Sector Reform Programs in sub-Saharan Africa". Swathmore College. September.
Charemza, W.W. and D.F. Deadman. 1992. New Directions in Econometric Practice. Edward Elgar Publishing, Ltd.
Central Bank of Kenya. Quarterly Economic Review. Various issues. Central Bank of Kenya. Annual Reports. Various issues. Central Bank of Kenya. Monthly Reviews. Various issues. Cuthbertson, K., S .G. Hall and M.P. Tayor. 1992. Applied Econometric Technique. Phillip
Allan. Central Bureau of Statistics. Economic Survey 1993. Nairobi, Kenya. Edward, S. and M. Khan. 1985. Interest Rate Determination in Developing Countries: A
Conceptual Framework". IMF Staff Paper, 32, no. 3.
Edwards, 5. 1984. "The Order of Liberalization of External Sector in Developing Countries". Essay in International Finance, 156. Princeton University Press: Princeton, New Jersey.
Elliot, J.W. 1977. "Measuring the Expected Real Rate of Interest: An Exploration of Macroeconomic Alternatives". American Economic Review, 67.
Government of Kenya. Economic Survey. Various issues. Government of Kenya. National Development Plan 1994-1996. Government Printer
Nairobi, Kenya. Granger, C.W.J. 1986. "Development in the Study of Cointegrated Economic Variables".
Oxford Bulletin of Economics and Statistics, 48, no. 3: 213—228.
Gupta D. and B. Gupta. 1994. "Interest Rate in Open Economy". Policy Research Working Paper 1283. The World Bank.
Hall, S.G. 1986. "An Application of the Granger-Engel Two Step Estimation Procedure to United Kingdom Aggregate Wage Data". Oxford Bulletin of Economics and Statistics, 48, no 3.
Hylleberg, S. and G.E. Mizon. 1989. "Cointegration and Error Correction Mechanisms". The Economic Journal, 99: 113—125.

FINANCIAL SECTOR REFORMS AND INTEREST RATE LIBERALIZATION: THE KENYA EXPERIENCE 39
McNelis, P.D. and K. Schmidt-Hebbel. 1992. "Financial Liberalization and Adjustment in Chile and New Zealand". Working Paper Series no. 1026. The World Bank.
Mirakhor, A. and D. Villanueva. 1993. "Interest Rate Policies in Developing Countries". Finance and Development.
Montiel, P.J. 1995. "Financial Policies and Economic Growth: Theory, Evidence and Country Specific Experience from sub-Saharan Africa". AERC Special Paper 18.
Mwega, EM. 1990. "An Econometric Study of Selected Monetary Policy Issues in
Kenya". ODI Working Paper Series, no 42. Mwega, F.M. 1993. "Import Demand Elasticities and Stability During Trade
Liberalization: A Case Study of Kenya". Journal of African Economies, 2, no. 3.
Mwega, EM., S.M. Ngola and N. Mwangi. 1990. "Real Interest Rrate and the Mobilization of Private Savings in Africa". AERC Research Paper No. 2.
Mwega, F.M. and T. Killick. 1990. "Monetary Policy in Kenya, 1967-1988". EAER; 6,
no. 2.
Ndele, S.M. 1991. "The Effects of Non-Bank Financial Intermediaries on Demand for Money in Kenya". AERC Research Paper 5.
Oshikoya, T.W. 1992. "Interest Rate Liberalization, Savings, Investment and Growth: The Case of Kenya". Saving and Development, 3, vol. XVI.
Seek, D. andY.E. Nil. 1993. "Financial Liberalization in Africa" World Development, 21
no. 11.
Sergio, P. and V. Sundararajan. 1990. "Issues in Interest Rate Management and Liberalization". IMF Staff Paper. 37, No. 4.
Saracoglu, R. 1984. "Expectations of Inflation and Interest rate Determination". IMF Staff 31 no.1.
Tanzi, V. 1980. "Inflationary Expectations, Economic Activities, Taxes and Interest Rate". American Economic Review, 70, no. 1.
Swamy, G. 1994. "Kenya: Structural Adjustment in the 1980s". World Bank Policy Research Working Paper No. 1238.
Villanueva, D. and A. Mirakho. 1990. "Strategies for Financial Reform". IMF Staff Paper 37, no. 3.
World Bank. 1992. "Kenya Financial Sector Adjustment Project". Project completion report. December.

Appendix
Financial sector reform process 1989—1996
1989 Jun
Jul
Nov
Capital Market Authority established
Rate on one-year treasury bond increased by 0.5% to enhance attractiveness
Minimum saving deposit rate increased by 1% together with maximum lending rate for loans with maturities up to 3 years. Treasury bill rate increased by 1%
Requirement removed that ceilings on loan interest rate include all lending related charges and fees, permitting institutions to set their lending rates to reflect current market conditions
Treasury bill rate fully liberalized
Consolidated Bank of Kenya Act effected, providing for the transfer of assets and liabilities of banks and NBFIs with solvency problems to Consolidated Bank of Kenya
Jul - Interest rate fully liberalized
- FSAP credit approved
- FSAP credit effective and indirect monetary policy measures initiated
- Legislation providing for establishment of Capital Market Authority passed by parliament
- Minimum saving deposit rate payable by banks and NBFIs raised by 0.5% and maximum lending rate for loans and advances not exceeding three years raised to 15.5%
* During the year the Banking Act (1968) was revised, strengthening the activities of the central bank
1990 Jan -
Mar-
Apr-
Nov-
1991 June -

FINANCIAL SECTOR REFORMS AND INTEREST RATE LIBERALIZATION: THE KENYA EXPERIENCE 41
Oct Convertible foreign exchange bearer certificate (Forexcs) introduced, marking the first step to liberalization of the foreign exchange market
Nov Exchange control account partially relaxed by withdrawing the clause covering declaration of foreign currency held by incoming travelers
* During the year the trading flow for NSE established
1992 Jan - Minimum capital/assets ratio raised from 5.5% to 7.5% and prudential
guidelines prepared to encourage self- regulation; including code of conduct of directors, chief executive and other employees, duties and responsibilities of directors, chief executives and management, appointment duties and responsibilities of external auditors and provision of bad and doubtful advances and loans
Mar Ksh500 million in treasury bills acquired by CBK to replenish its stock of trading portfolio
Apr - Secondary market for Forexcs's established
May - Marginal cost raised by 1% for additional increments of Ksh5O million in advances and rediscount of treasury bills and other government securities to ensure that commercial banks with overdrafts with central bank exceeding Ksh 50 million are appropriately sanctioned
Aug Retention scheme introduced allowing 100% retention of foreign exchange earnings from non-traditional exports
Oct - Commercial banks allowed to borrow foreign exchange currency to finance tea and coffee purchases in auctions
- Banks allowed to send dollar accounts for coffee and tea buyers ad sellers
- New penalties announced for commercial banks failing to observe the mandatory cash and liquidity ratios
Nov - Retention scheme extended to cover traditional exports of goods at 50%
1993 Feb - Retention scheme extended to service sector at 50%
- Foreign exchange allocation by central bank abolished
Mar Foreign exchange certificate made redeemable at market exchange rate

42 RESEARCH PAPER 72
- Devaluation of 25% of official shilling exchange rate - Retention account suspended
Apr - Margin on central bank advances and discounts to banks increased - Cash ratio increased from 6% to 8% - Devaluation by 33% of official shilling exchange rate
May - Maturity life for securities to be eligible for rediscounting reduced to 45 days or less
- New penalty for banks failing to observe the mandatory cash ratio announced - Re-introduction of retention scheme — 50% of all foreign exchange - Further liberalization of foreign exchange system allowing commercial banks
to effect foreign payments for their private clients without referring to the Central Bank of Kenya
- Import licensing system abolished short-list of prohibited and restricted imports
- Revolution of restriction on importation of assembled commercial vehicles - Maximum import tariff reduced from 60% to 50% and tariff rate bands
from 9 to 7
Jun Introduction of one-way foreign exchange auction system - Cash ratio raised from 8% to 10%
Aug - Paper eligible for rediscounting restricted by lowering maturities a) Treasury bill (half way). b) Treasury bonds (45 days or less).
- Securities accepted as eligible as collateral for overnight loans - A two tier foreign auction system introduced - Nairobi clearing house new arrangements effected to eliminate automatic
provision of central bank credit to banks - Registration of foreign exchange certificate holders with banks in order to
buy them back at negotiated or market price
Sep Registration of foreign exchange certificate by banks with Central Bank
Oct Shilling exchange rate allowed to float freely - Cash ratio raised from 10% to 12% with balance above the minimum
requirement to earn interest at 35% per annum
Nov Central bank started daily foreign exchange transactions with commercial banks
- Commercial banks allowed to continue purchasing foreign exchange for oil
and petroleum products from the market and central bank. - Central bank continued entering into forward contracts for purchase of oil

FINANCIAL SECTOR REFORMS AND INTEREST RATE LIBERALIZATION: THE KENYA EXPERIENCE 43
and related products out at market rates - Credit guidelines abolished - Cash ratio raised from 12% to 14% with excess balances paid 35% interest
per annum - Restriction removed on remittance of profits, dividends and expatriate
earnings
Residents allowed to borrow abroad up to US$1 million
* During the year central bank operated with a tight monetary policy with high money supply. Treasury bill diversified to accommodate diverse liquidity preference of investors, so that the 30-, 60- and 180-day bills were introduced adding to the only 90-day bill in the market.
1994 Feb - Cash ratio increased from 14% to 16% with interest paid on bank balances
with bank in excess of 10% reduced from 25% to 20% - Foreign exchange retention raised to 100% - Residents allowed to open foreign currency accounts with banks in Kenya - Restriction on local borrowing by foreign controlled companies removed - Foreigners allowed to pay hotel bills and air tickets in either foreign or
Kenya currency
Mar - Liquidity ratio for commercial banks and non-bank financial institutions to
be maintained at 5 and 10 percentage points, respectively, above the current commercial bank cash ratio requirement
- Cash ratio raised from 16% to 20% and interest payment on commercial bank deposits at the bank withdrawn
Apr - Open market operations sale of Treasury bills to be at least 0.5 percent below the weekly average tender rate
- Commercial banks to borrow from the bank for a maximum of 4 consecutive days and no more than 10 days in any one month
Jun Kenya accepted obligations of Articles of Agreement of the International Monetary Fund
Sep - Foreign currency account holders encouraged to retain some of their funds overseas under the care of commercial banks
- Commercial banks required to back the funds retained overseas 100% by foreign assets
- Restated determination of the exchange rate by market forces - Cash ratio lowered 20% - 18%

RESEARCH PAPER 72
Dec - Announced requirement for NBFIs to open account with central bank for purposes of maintaining cash ratio
1995 Jan - Authorization and licensing of foreign exchange bureaus announced
- Foreign investors allowed to participate in stock exchange market under guided policy on ownership
- Reaffirmation that the regulatory body of the stock exchange would be Capital Market Authority
Mar - Commercial banks to observe foreign exchange exposure limit of 20% of the paid up capital plus unimpaired reserves
Apr - Newly converted NBFIs to observe half the mandatory 18% of the cash ratio
Jun - A bill minimum 5 days introduced. Firms listed by NSE allowed to issue commercial paper and treasury bill of 5 days maturity
Jul - Balance of the newly converted banks to be 0.135 of the institutions' total deposits from 31.5.95.
- NBFIs subjected to the mandatory cash ratio requirement; requirement initially set at 1.8% of eligible deposits and raised progressively to 18% by December 1995
- Tightened conditions for overnight loans and rediscounting at central bank by commercial bank
- Treasury bills held at 50% of life to maturity for overnight loans or 75% for rediscount were eligible. Also bills to have two clear working days to maturity. Banks lending in the inter-bank market not allowed to borrow overnight from central bank
- Commercial banks to submit weekly foreign currency exposure return every Monday; off balance sheet items excluded from computation of foreign currency exposure, aiming to minimize foreign currency exposure risk and enhance the stability of the financial system
- Investment compensation fund established to protect investors against losses arising from equity trading
- Foreign capital regulations revised to enable foreigners to own up to 40% of local company listed in NSE and equity participation by a single investor increased from 2.5% to 5.0%
- Liquidity ratio fixed at 25% for both banks and NBIFIs and 20% for mortgages finance companies
Aug - Minimum investment in treasury bills under OMO lowered to KshlOO,000 from Ksh 1000,000

FINANCIAL SECTOR REFORMS AND INTEREST RATE LIBERALIZATION: THE KENYA EXPERIENCE 45
- Procedure for renewal of licences by banks and NBFIs modified 1st year licenses of branches to be computed and charged on a pro-rated basis; thereafter full year licenses fees to be paid for the head office and all branches simultaneously
Sep - Commercial banks allowed to exclude deposits of financial institutions from cash ratio base
- Commercial banks to submit monthly breakdown of government and parastatal deposits in addition to monthly statistic returns
Oct - Central bank launches a redesigned treasury bill that conforms with the magnetic ink character recognition (MICR) cheque clearing system. The new instrument serves as a bill and a cheque
- Banking Act Amended (27th October)
Dec - Central bank starts paying 5% interest on all cash balances held by commercial banks and NBFIs at Central Bank to facilitate a reduction in banking lending rates
- NBFIs required to invest in treasury bills a minimum of 50% of their liquid asset withdrawn
- Repeal of Exchange Control Act - Cash ratio raised to 18%
1996 Jan - Central bank display DM0 rates on the Reuter screen, to encourage
independent decision on quotation for purchase of the treasury bills May - Measures taken to improve effectiveness of secondary trading in financial
instrument - Treasury bills for 30, 90, and 180 days replaced by 28, 91 and 182 days;
while 60 and 270 days were discontinued - Cash ratio requirement relaxed to allow fluctuations up to minimum 15%
but an average 18% for 14 days - 5% interest that commercial banks received on the cash balances with the
central bank discontinued
* During the year minimum capital paid up was raised.
Source: Central Bank Annual Reports, various issues; government reports: issues including budget speeches, Economic Surveys.
AFRICAN ECONOMIC RESEARCH CONSORTIUM
P.O. BOX 62882 NAIROBI, KENYA
TELEPHONE (254-2) 228057
TELEX 22480
FAX (254-2) 219308
E-MAIL aercpub@ form-net.com
The principal objective of the African Economic Research Consortium (AERC), established in August 1988, is to strengthen local capacity for conducting independent, rigorous inquiry into problems pertinent to the management of economies in Sub-Saharan Africa.
In response to special needs of the region, AERC has adopted a flexible approach to improve the technical skills of local researchers, allow for regional determination of research priorities, strengthen national institutions concerned with economic policy research, and facilitate closer ties between researchers and policy makers.
Since its establishment, AERC has been supported by private foundations, bilateral aid agencies and international organizations.
SPECIAL PAPERS contain the findings of commissioned studies in furtherance of AERCs programmes for research, training and capacity building.
RESEARCH PAPERS contain the edited and externally reviewed results of research financed by the AERC.
It is AERC's policy that authors of Special and Research Papers are free to use material contained therein in other publications. Views expressed in the Special and Research Papers are those of the authors alone and should not be attributed to the AERC's sponsoring Members, Advisory Committee, or Secretariat.
Further information concerning the AERC and additional copies of Special and Research Papers can be obtained by writing to: African Economic Research Consortium, P.O. Box 62882, Nairobi, Kenya.
ISBN 9966-900-46-2