Financial Sector Performance Review Report Publication/FSP/Financial...Financial Sector Performance...
14
Financial Sector Performance Review Report December 2018 1 Department of Financial Regulation and Supervision FINANCIAL SECTOR PERFORMANCE REVIEW REPORT December 2018 This report presents the performance of the Bhutanese financial sector on peer group basis (excluding National Pension & Provident Fund) for the period ended Q4FY’18 in comparison to the previous year’s corresponding quarter. This report has been prepared by the Department of Financial Regulation & Supervision of the Royal Monetary Authority of Bhutan (RMA) and the information contained in this report is based on the returns submitted by the Financial Institutions. DEPARTMENT OF FINANCIAL REGULATION & SUPERVISION ROYAL MONETARY AUTHORITY OF BHUTAN
Transcript of Financial Sector Performance Review Report Publication/FSP/Financial...Financial Sector Performance...

Financial Sector Performance Review Report December 2018
1 Department of Financial Regulation and Supervision
FINANCIAL SECTOR PERFORMANCE REVIEW REPORT December 2018
This report presents the performance of the Bhutanese financial sector on peer group basis (excluding National Pension & Provident Fund) for the period ended Q4FY’18 in comparison to the previous year’s corresponding quarter. This report has been prepared by the Department of Financial Regulation & Supervision of the Royal Monetary Authority of Bhutan (RMA) and the information contained in this report is based on the returns submitted by the Financial Institutions.
DEPARTMENT OF FINANCIAL REGULATION & SUPERVISION
ROYAL MONETARY AUTHORITY OF BHUTAN

Financial Sector Performance Review Report December 2018
2 Department of Financial Regulation and Supervision
Overview
The Table 1 below shows an overview of
performance of the financial sector as of
December 2018. The Risk Weighted Capital
Adequacy Ratio (RWCAR) has declined to
15.12% from 16.02% as compared to
December 2017 but it is above the minimum
regulatory requirement of 12.5% (including
the capital conservation buffer of 2.5%).
Similarly, the Gross NPL Ratio (NPL to loan
ratio) has also deteriorated which stood at
10.43%, which is a 2.45% increase from the
previous year 2017. With regard to the
earnings of the financial sector, the financial
institutions recorded a net profit (after tax)
of Nu. 474.78 million in December 2018
which has also decreased from Nu. 997.36
million in 2017.
Table 1
The asset base of the financial sector has
increased by 4.4% for the period ended
December 2018. The majority of the total
asset comprises of loans (net of provision
and interest in suspense) with 66.98%.
Financial sector’s total loans to the economy
stands at Nu. 120.24 billion, as compared to
Nu. 103.32 billion in December 2017,
showing an increase of 16.38%. Housing
sector has the highest loan exposure with
Nu. 28.89 billion, followed by Service &
Tourism and Trade & Commerce sectors
with Nu. 28.85 billion and Nu. 16.54 billion
respectively.
As depicted in Figure 1, the share of loan to
Medium enterprises constitutes 23% (Nu.
27.4 billion), followed by Large and Small
enterprises with 17% (Nu. 20.09 billion) and
10% (Nu. 12.5 billion) respectively. The
loans to Micro and Cottage enterprises
accounted for 5% only (Nu. 6.47 billion).
Remaining 45% (Nu. 53.78 billion) are loans
to non-enterprises.
Figure 1
Total deposit of the banks stood at Nu.
116.17 billion, which is an increase by 6.02%
as compared to December quarter of 2017.
Statutory Liquidity Requirement (SLR) for
banks and non-banks were maintained
Indicators Dec-17 Jun-18 Sep-18 Dec-18
Capital
RWCAR (12.5%) 16.02% 16.17% 16.26% 15.12%
Core CAR (7.5%) 13.31% 12.95% 12.61% 11.80%
Leverage Ratio (5%) 9.78% 9.81% 9.53% 9.43%
Asset Quality
Gross NPL Ratio 7.98% 11.52% 12.43% 10.43%
Net NPL to Net Loan 1.40% 4.34% 5.12% 2.07%
Single Largest Borrower 15.49% 15.08% 14.25% 13.56%
Provision to NPL 70.58% 54.16% 51.87% 68.59%
Ten Largest Borrower 15.20% 15.31% 14.13% 13.56%
NPL Nu. 8.24b Nu. 12.54b Nu. 14.2b Nu. 12.54b
Loan Nu. 103.32b Nu. 108.81b Nu. 114.25b Nu. 120.24b
Earning
Return on Asset (RoA) 0.67% 0.52% 0.56% 0.30%
Return on Equity (RoE) 4.80% 3.91% 4.30% 2.29%
Profit After Tax (PaT) Nu. 997.36m Nu. 802.72m Nu. 876.18m Nu. 474.78m
Liquidity
Loans to Deposits ratio 77.02% 78.86% 81.77% 85.69%
Statutory Liquidity Requirement ratio 27.37% 28.65% 26.03% 22.24%
Liquidity Position Nu. 12.02b Nu. 13.96b Nu. 10.49b Nu. 5.16b
Statutory Liquidity Requirement Nu. 25.43b Nu. 26.13b Nu. 26.52b Nu. 26.64b
Highlights of the Financial Institutions (Financial Sector Indicators for last 1 yr)

Financial Sector Performance Review Report December 2018
3 Department of Financial Regulation and Supervision
above the minimum regulatory requirement
of 20% and 10% respectively. For banks SLR
stood at 23.23% and for non-banks it stood
at 15.98%.
1. Assets/ Liabilities
As depicted in table 2, the total asset of the
financial sector has increased by 4.4% (Nu.
6.92 billion), which stood at Nu. 164.19
billion in December 2018 as compared to Nu.
157.28 billion in December 2017. Around
66.98% of the growth in total assets was
contributed by loans (net of specific
provision and interest in suspense). In terms
of asset composition, 87% of the total assets
are held by banks and the remaining 13% by
the non-banks.
1.1 Banks
Total assets of the banking sector have
increased by 6.36%, from Nu. 134.55 billion
in December 2017 to Nu. 143.11 billion in
December 2018. Rapid growth in loans (net
of specific provision and interest in
suspense) by Nu. 15 billion has contributed
significantly in the growth of assets of the
banking sector.
1.2 Non-Banks
Total assets of non-banking sector
decreased by 7.24% (Nu. 1.65 billion), from
Nu. 22.72 billion in December 2017 to Nu.
21.08 billion in December 2018. The
decrease in asset size was mainly due to
decrease in total loans (net of specific
provision and interest in suspense) by Nu.
1.47 billion.
Table 2
Asset Dec-18 (Nu.
millions) Dec-17 (Nu.
millions) Cash & Bank balances
36,738.38 40,343.90
Marketable securities
12,142.49 15,232.89
Loans & Advances (net of provisions)
109,971.57 96,436.04
Equity Investment
609.34 648.65
Fixed Assets 2,215.21 1,916.60
Other Assets 2,516.41 2,697.40
Total 164,193.40 157,275.49
On the liability side, substantial growth in
deposits by Nu. 6.6 billion was the major
contribution for the increase in liabilities of
the financial sector. Around 81% of the
banking sector liabilities was constituted by
the deposit liabilities. Likewise, the major
component of the non-banking sector was
the insurance fund with 38% followed by
current and other liabilities with 35%. As of
December 2018, the non-banking sector had
an Insurance Fund of Nu. 7.91 billion which
comprised of Life Insurance, General
Insurance and Group Insurance funds.
Table 3
Liabilities Dec-18 (Nu.
Millions) Dec-17 (Nu.
Millions) Paid up capital
9,517.25 8,949.25
Reserves 11,729.93 12,276.67
Deposit Liabilities
116,171.31 109,571.69
Bonds & borrowing
5,007.81 5,912.62
Interest provision
3,694.19 3,471.57
Insurance Fund
7,910.38 6,556.13
Other liabilities
10,162.53 10,537.56
Total 164,193.40 157,275.49
Financial Sector Performance Review Report December 2018
4 Department of Financial Regulation and Supervision
2. Capital and Reserves
Capital is the main source of financial
support and acts as a buffer that enables
financial institutions to absorb a level of
losses without the interest of creditors and
depositors being adversely affected, and
thus protects the interest of the creditors
and depositors in the event of liquidation.
Besides absorbing the unanticipated shocks,
it also signals that the institution will
continue to honor its obligations.
Capital fund1 of the financial sector for the
period ended December 2018 stood at Nu.
21.23 billion, as compared to Nu. 20.44
billion in December 2017, indicating an
increase of Nu. 789.69 million. The capital
fund of banking sector amounted to Nu.
19.66 billion and for non- banking sector, it
amounted to Nu. 1.57 billion in December
2018.
Figure 2
1In this case, the capital fund is the total capital fund without
deducting the NPL of related party. But for calculation of CAR
ratio, the NPL of related party needs to be deducted as required
under section 1.5 (iv) of Prudential Regulations 2017.
2With effect from September 2016, financial institutions are
required to maintain a minimum core capital of 7.5%.,
2.1 Capital Adequacy
Risk-Weighted Capital Adequacy Ratio
(RWCAR) of the financial sector in December
2018 stood at 15.12% as compared to
16.29% in December 2017 showing a
decrease of 1.17% (as depicted in Figure 2).
The decrease in RWCAR is primarily on
account of increase in NPL by Nu. 4.3 billion
which requires 150% risk weights.
Similarly, Core capital ratio2 of the financial
sector has also decreased from 13.31% in
December 2017 to 11.8% in December 2018.
2.2 Capital Adequacy, Banking and Non-
banking sectors
The RWCAR3 of the banking sector has
increased by 0.23% while the RWCAR for
non-banks has decreased by 7.09%. In
December 2018, the RWCAR of banking
sector stood at 16.71% while for non-banks,
the ratio stood at 6.89%.
Similarly, the core capital ratio for banks
stood at 13.2% while for non-banks it stood
at 4.55% during the period under review.
2.3 Leverage Ratio
Leverage ratio acts as a supplementary
measure to capital adequacy ratio by
ensuring that the financial institutions
maintain adequate levels of capital at all
times. The Leverage ratio for the financial
sector for the period ended December 2018
stood at 9.43%, maintaining 4.43% above
including a capital conservation buffer of 2.5% from Tier 1
capital.
3 The RWCAR signifies the availability of capital to support
the business of the financial institutions. The NPL of related
parties has been deducted from the capital fund when assessing
RWCAR.
Financial Sector Performance Review Report December 2018
5 Department of Financial Regulation and Supervision
the regulatory requirement of 5%. The
Leverage ratio of banking and non-banking
sectors stood at 10.15% and 4.57%
respectively.
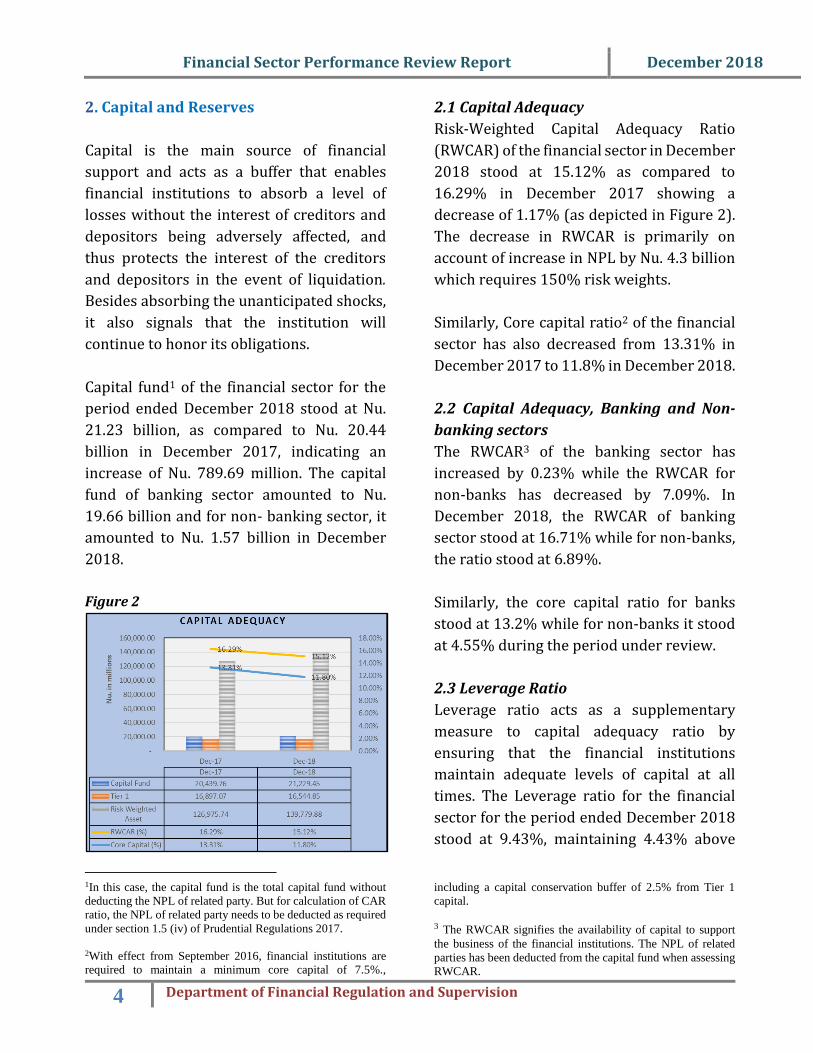
3. Asset Quality
Analysis on the loan classification of the
financial sector indicated that both loans and
NPL have increased by Nu. 16.9 billion and
Nu. 4.3 billion respectively. Financial
sector’s total loan to the economy amounted
Nu. 120.24 billion in December 2018 while
the NPL amounted to Nu. 12.54 billion. Gross
NPL ratio (NPL to total loans) of the financial
sector increased to 10.43% in December
2018 as compared to 7.98% in December
2017.
Figure 3
Gross NPL ratio of banking sector has
decreased by 1.39%, from 8.42% in
December 2017 to 7.03% during the period
4principal and interest overdue by more than 365 days with
100% provisioning.
5principal and interest payment overdue by 91 days to 180 days
with 20% provisioning.
under review. Whereas, the Gross NPL ratio
for non-banking sector has increased by
20.76%, from 6.03% in December 2017 to
26.79% in December 2018.
In December 2018, out of the total NPL of Nu.
12.54 billion, NPL classified under the loss
category4 (which includes the term expired
loans and loans under litigation cases)
comprised of 67.13% amounting to Nu. 8.42
billion followed by the Substandard
category5 with 18.14% amounting to Nu.
2.27 billion and Doubtful category6 with
14.73% (Nu. 1.85 billion).
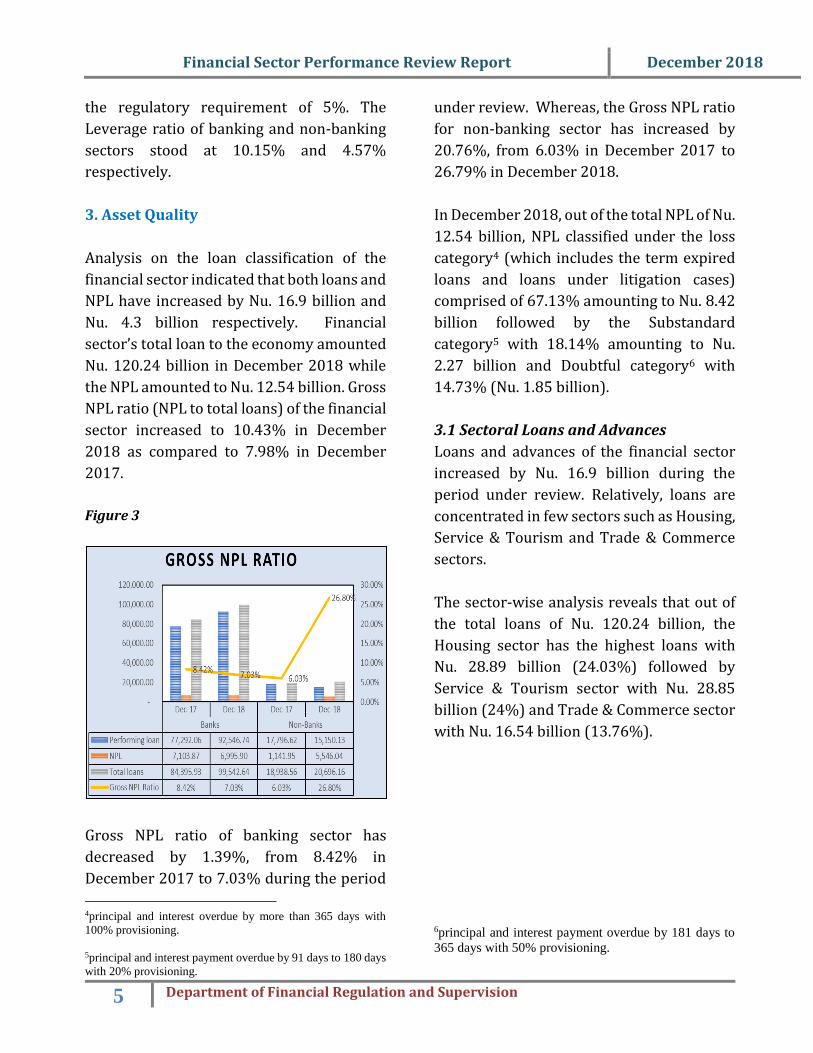
3.1 Sectoral Loans and Advances
Loans and advances of the financial sector
increased by Nu. 16.9 billion during the
period under review. Relatively, loans are
concentrated in few sectors such as Housing,
Service & Tourism and Trade & Commerce
sectors.
The sector-wise analysis reveals that out of
the total loans of Nu. 120.24 billion, the
Housing sector has the highest loans with
Nu. 28.89 billion (24.03%) followed by
Service & Tourism sector with Nu. 28.85
billion (24%) and Trade & Commerce sector
with Nu. 16.54 billion (13.76%).
6principal and interest payment overdue by 181 days to
365 days with 50% provisioning.
Financial Sector Performance Review Report December 2018
6 Department of Financial Regulation and Supervision
Figure 4
In terms of absolute increase in loans for the
period ended December 2018, the loans to
Service & Tourism sector experienced the
most rapid increase by Nu. 5.99 billion
followed by loans to Housing sector by Nu.
5.47 billion and Trade & Commerce sector by
Nu. 2.34 billion.
From the total loan outstanding, 83% (Nu.
99.54 billion) comprises of loans provided
by the banking sector and remaining 17%
(Nu. 20.7 billion) by non-banking sector.
The loans of both the banking and non-
banking sector has increased by Nu. 15.15
billion and Nu. 1.76 billion respectively.
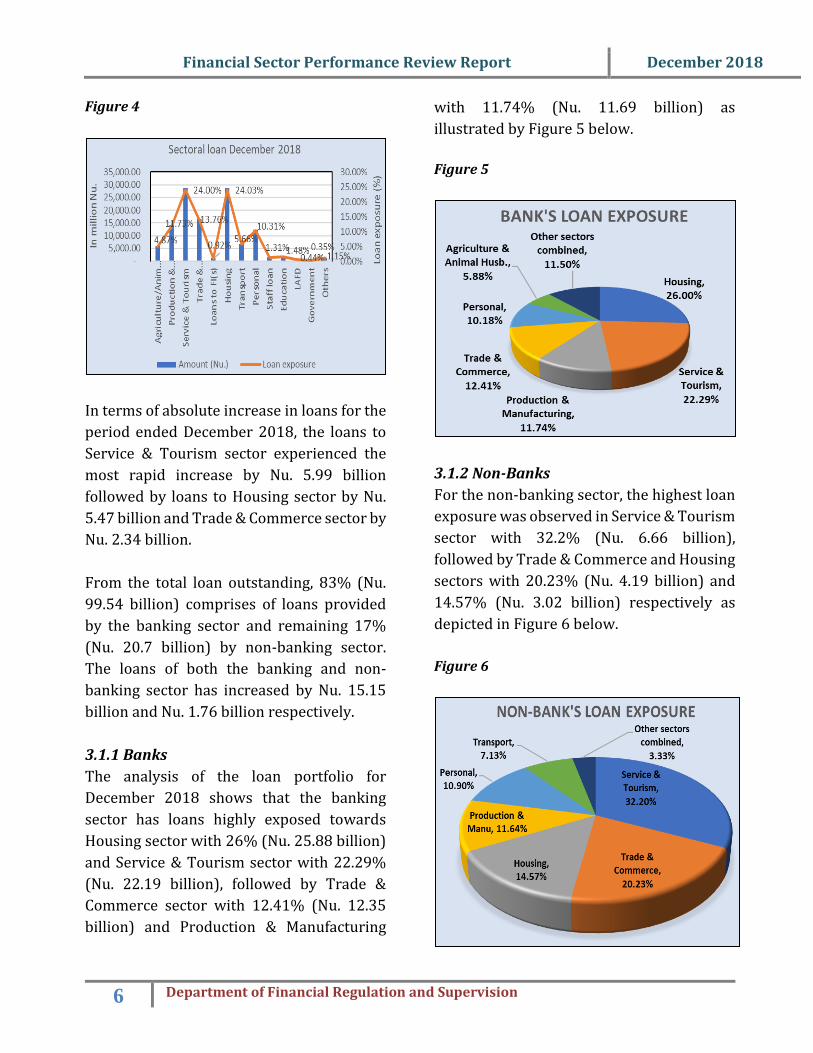
3.1.1 Banks
The analysis of the loan portfolio for
December 2018 shows that the banking
sector has loans highly exposed towards
Housing sector with 26% (Nu. 25.88 billion)
and Service & Tourism sector with 22.29%
(Nu. 22.19 billion), followed by Trade &
Commerce sector with 12.41% (Nu. 12.35
billion) and Production & Manufacturing
with 11.74% (Nu. 11.69 billion) as
illustrated by Figure 5 below.
Figure 5
3.1.2 Non-Banks
For the non-banking sector, the highest loan
exposure was observed in Service & Tourism
sector with 32.2% (Nu. 6.66 billion),
followed by Trade & Commerce and Housing
sectors with 20.23% (Nu. 4.19 billion) and
14.57% (Nu. 3.02 billion) respectively as
depicted in Figure 6 below.
Figure 6

Financial Sector Performance Review Report December 2018
7 Department of Financial Regulation and Supervision
4. Credit Quality/ Sectoral NPL of
Financial sector
The asset quality of the financial sector has
deteriorated with the increase in NPL from
Nu. 8.25 billion in December 2017 to Nu.
12.54 billion in December 2018, showing an
increase of Nu. 4.29 billion.
Analysis on the sectoral NPL of the financial
sector for December 2018 reveals that
Service & Tourism has the highest share with
28.22%, followed by Trade & Commerce
with 20.37%, Production & Manufacturing
with 12.2% and Housing (11.41%).
Figure 7
4.1 Banks
Non-Performing Loans of the banking sector
has decreased by Nu. 107.98 million, from
Nu. 7.1 billion in December 2017 to Nu. 6.99
billion in December 2018 against the loan
growth of Nu. 16.9 billion. As depicted in
Figure 8 for the banking sector, the highest
NPL was seen in Trade & Commerce with Nu.
1.4 billion (20.04%), followed by Service &
Tourism with Nu. 1.35 billion (19.26%) and
Agriculture & Animal Husbandry sectors
with Nu. 1.08 billion (15.43%).
Figure 8
4.2 Non-Banks
The NPL of the non-banking sector has
increased by Nu. 4.41 billion; from Nu. 1.14
billion in December 2017 to Nu. 5.55 billion
in December 2018. The highest NPL during
the period under review was recorded in
Service & Tourism sector with Nu. 2.19
billion (39.52%) followed by Trade &
Commerce sector with Nu. 1.15 billion
(20.8%) and Personal loan with Nu. 737.44
million (13.3%) as depicted in Figure 9.
Figure 9

Financial Sector Performance Review Report December 2018
8 Department of Financial Regulation and Supervision
5. Loans to Micro, Cottage, Small, Medium
and Large enterprises (MCSML)
MCSML sector contributes significantly
towards national GDP, employment
generation and export earnings.
Figure 10
Figure 10 depicts loans to Micro, Cottage,
Small, Medium and Large (MCSML)7
enterprises and loans to the non-
enterprises8. As of December 2018, the
loans to MCSML amounted to Nu. 66.46
billion and loan to non-enterprise stood at
Nu. 53.78 billion. The loan to MCSML has
increased to Nu. 66.46 billion in December
2018 from Nu. 57.33 billion in December
2017, showing a growth of 16% (↑Nu. 9.14
billion).
As depicted in Figure 10, from the total loans
of Nu. 120.24 billion provided by the
financial sector, the share of loans to
7MCSML comprise of Agriculture, Production &
Manufacturing, Trade & commerce, Service & Tourism
and Loans to FIs sector.
medium enterprises has the highest
exposure with 22.78% (Nu. 27.4 billion)
followed by large enterprise and small
enterprise with 16.71% (Nu. 20.09 billion)
and 10.4% (Nu. 12.5 billion) respectively.
The loan to micro and cottage enterprises
comprised of only 5.38% (Nu. 6.47 billion) of
the total loans.
5.1 Banks
For the banking sector, the loan to medium
enterprises constituted 19.12% (Nu. 13.03
billion) while loan to large enterprises
constituted 18.89% (Nu. 18.81 billion). The
loans to micro, cottage and small enterprises
constitutes of 15.43% (Nu. 15.36 billion).
5.2 Non-Banks
For the non-banking sector, loan to medium
and small enterprises constituted of 40.42%
(Nu. 8.36 billion) and 17.03% (Nu. 3.53
billion) respectively, while loan to large
enterprises constituted 6.22% (Nu. 1.29
billion). The loan to micro and cottage
enterprises have the minimum share of
0.06% (Nu. 11.71 million) and 0.38% (Nu.
79.18 million) respectively.
The analysis on the loan trend of MCSML and
non-enterprise reveals that all the loans to
MCSML and non-enterprise are on an
increasing trend over the years. The highest
increase in the trend was observed in Large
enterprise which has increased by Nu. 1.93
billion as compared to 2017. The increase
was mainly attributed to the significant
8Non-Enterprise sector comprises of Housing, Personal,
Transport, Staff loan, Education loan, Loan Against
Fixed Deposits, Loans to Government and others.

Financial Sector Performance Review Report December 2018
9 Department of Financial Regulation and Supervision
increase in loans to Service & Tourism by Nu.
1.86 billion.
However, the loan to Small enterprise has
decreased by Nu. 147.06 million as
compared to 2017, and it was mainly caused
by the decrease in loans to Agriculture sector
by Nu. 58.14 million.
Figure 11
Table 4
6. Access to Finance through Micro
Finance Institutions (MFIs)
Table 5
RMA issued registration certificates to five
Micro-Finance Institutions which include
Rural Enterprise Development Corporation
Ltd. (REDCL), RENEW Micro-Finance Pvt.
Ltd. (RENEW), Bhutan Care Credit Ltd.
(BCC), Bhutan Association of Women
Entrepreneurs (BAOWE) and Tarayana
Foundation. The MFIs currently operate in
all 20 Dzongkhags benefiting both the rural
and urban clients. As of December 2018, only
three out of five MFIs were operational with
a total loan of Nu. 613.31 million sanctioned
as depicted in Table 5.
The loan outstanding grew by Nu. 229.59
million from Nu. 216.9 million in December
2017 to Nu. 446.49 million in December
2018. Total Non-Performing Loan of MFIs in
December 2018 stood at Nu. 45.79 million
indicating an NPL to loan ratio of 10.26%.
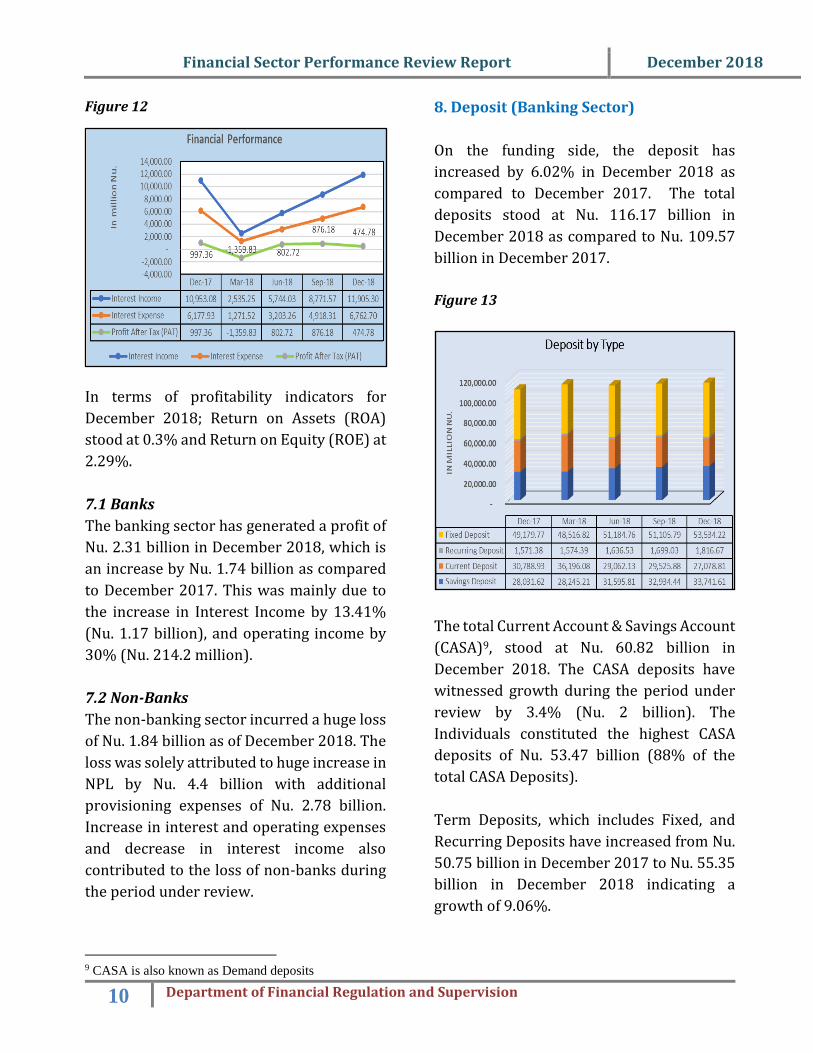
7. Financial Performance
The profit after tax of financial sector has
declined by Nu. 522.58 million as compared
to 2017, as depicted in the Figure 12 below.
The total profit (after tax) stood at Nu.
474.78 million.
Sl no Sector Micro Cottage Small Medium Large Total
% Share of
Total Loan
1Agriculture &
Animal Husb. 2,454.75 2,562.04 589.58 254.00 0.00 5,860.38 4.87%
2 Prod & Manu 48.69 92.23 1,913.34 5,141.99 6,902.58 14,098.84 11.73%
3 Service 73.66 309.37 3,793.10 14,301.26 10,376.32 28,853.71 24.00%
4Trade &
Commerce 295.81 636.04 6,206.68 7,698.62 1,704.22 16,541.37 13.76%
5 Loan to FI(s) 0.00 0.00 1,109.31 1,109.31 0.92%
Total 2,872.92 3,599.69 12,502.70 27,395.88 20,092.43 66,463.61 55.28%
In million Nu.Sectoral MCSML Loans (December 2018)
Sl no Particulars Dec-17 Dec-18
1 Total Loan Sanctioned Nu. 297.50m Nu. 613.31m
2 Total Loan Outstanding Nu. 216.90m Nu. 446.49m
3 Total NPL Nu. 30.54m Nu. 45.79m
4 Total no. of loan a/cs 3,630 5,758
5 NPL to loan ratio 14.08% 10.26%
Loan and NPL of MFIs
Financial Sector Performance Review Report December 2018
10 Department of Financial Regulation and Supervision
Figure 12
In terms of profitability indicators for
December 2018; Return on Assets (ROA)
stood at 0.3% and Return on Equity (ROE) at
2.29%.
7.1 Banks
The banking sector has generated a profit of
Nu. 2.31 billion in December 2018, which is
an increase by Nu. 1.74 billion as compared
to December 2017. This was mainly due to
the increase in Interest Income by 13.41%
(Nu. 1.17 billion), and operating income by
30% (Nu. 214.2 million).
7.2 Non-Banks
The non-banking sector incurred a huge loss
of Nu. 1.84 billion as of December 2018. The
loss was solely attributed to huge increase in
NPL by Nu. 4.4 billion with additional
provisioning expenses of Nu. 2.78 billion.
Increase in interest and operating expenses
and decrease in interest income also
contributed to the loss of non-banks during
the period under review.
9 CASA is also known as Demand deposits
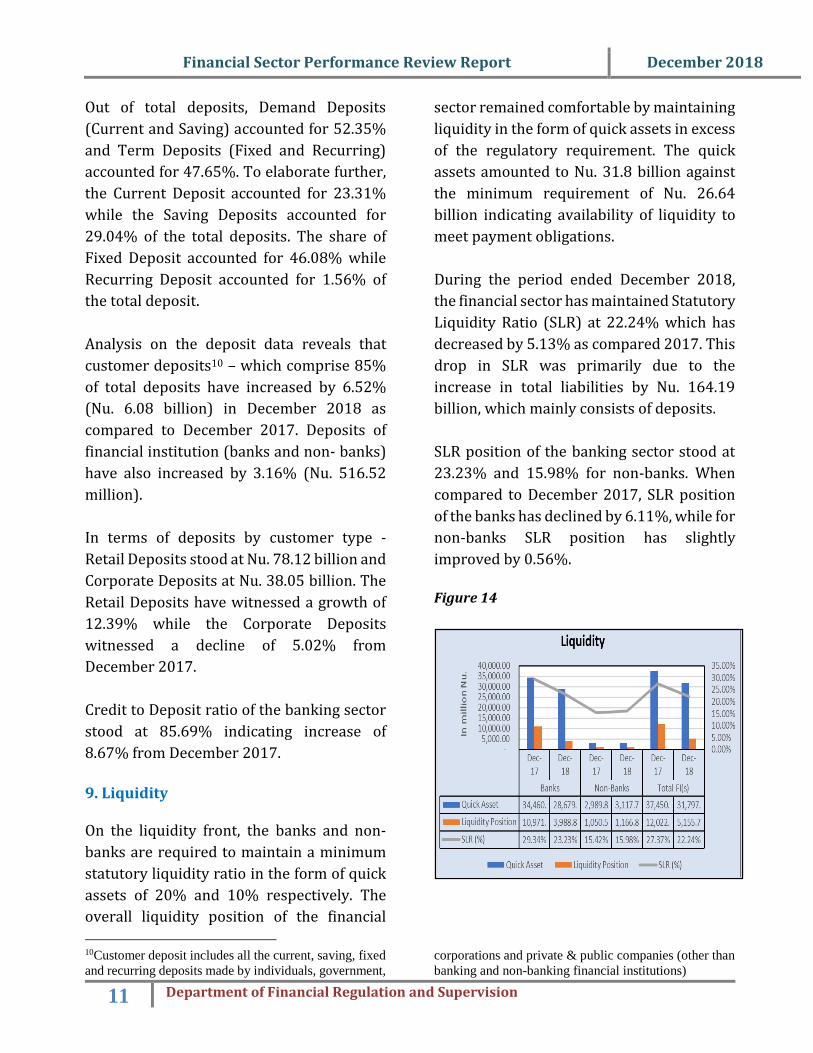
8. Deposit (Banking Sector)
On the funding side, the deposit has
increased by 6.02% in December 2018 as
compared to December 2017. The total
deposits stood at Nu. 116.17 billion in
December 2018 as compared to Nu. 109.57
billion in December 2017.
Figure 13
The total Current Account & Savings Account
(CASA)9, stood at Nu. 60.82 billion in
December 2018. The CASA deposits have
witnessed growth during the period under
review by 3.4% (Nu. 2 billion). The
Individuals constituted the highest CASA
deposits of Nu. 53.47 billion (88% of the
total CASA Deposits).
Term Deposits, which includes Fixed, and
Recurring Deposits have increased from Nu.
50.75 billion in December 2017 to Nu. 55.35
billion in December 2018 indicating a
growth of 9.06%.
Financial Sector Performance Review Report December 2018
11 Department of Financial Regulation and Supervision
Out of total deposits, Demand Deposits
(Current and Saving) accounted for 52.35%
and Term Deposits (Fixed and Recurring)
accounted for 47.65%. To elaborate further,
the Current Deposit accounted for 23.31%
while the Saving Deposits accounted for
29.04% of the total deposits. The share of
Fixed Deposit accounted for 46.08% while
Recurring Deposit accounted for 1.56% of
the total deposit.
Analysis on the deposit data reveals that
customer deposits10 – which comprise 85%
of total deposits have increased by 6.52%
(Nu. 6.08 billion) in December 2018 as
compared to December 2017. Deposits of
financial institution (banks and non- banks)
have also increased by 3.16% (Nu. 516.52
million).
In terms of deposits by customer type -
Retail Deposits stood at Nu. 78.12 billion and
Corporate Deposits at Nu. 38.05 billion. The
Retail Deposits have witnessed a growth of
12.39% while the Corporate Deposits
witnessed a decline of 5.02% from
December 2017.
Credit to Deposit ratio of the banking sector
stood at 85.69% indicating increase of
8.67% from December 2017.
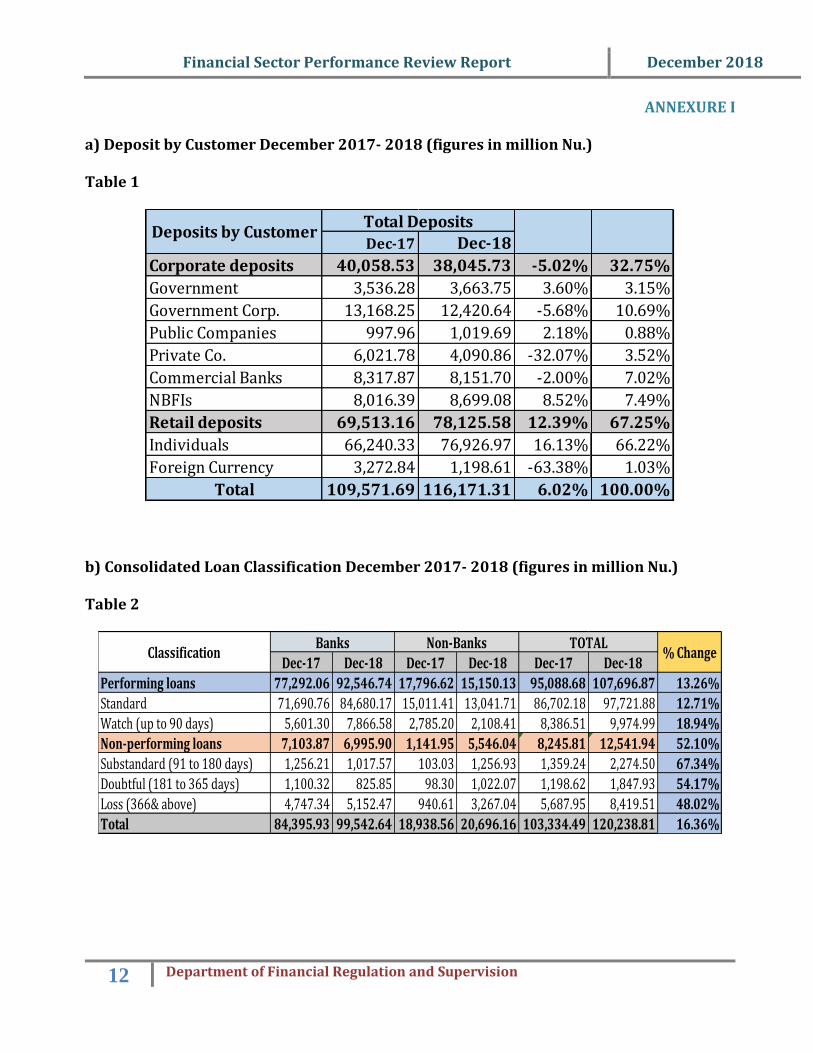
9. Liquidity On the liquidity front, the banks and non-
banks are required to maintain a minimum
statutory liquidity ratio in the form of quick
assets of 20% and 10% respectively. The
overall liquidity position of the financial
10Customer deposit includes all the current, saving, fixed
and recurring deposits made by individuals, government,
sector remained comfortable by maintaining
liquidity in the form of quick assets in excess
of the regulatory requirement. The quick
assets amounted to Nu. 31.8 billion against
the minimum requirement of Nu. 26.64
billion indicating availability of liquidity to
meet payment obligations.
During the period ended December 2018,
the financial sector has maintained Statutory
Liquidity Ratio (SLR) at 22.24% which has
decreased by 5.13% as compared 2017. This
drop in SLR was primarily due to the
increase in total liabilities by Nu. 164.19
billion, which mainly consists of deposits.
SLR position of the banking sector stood at
23.23% and 15.98% for non-banks. When
compared to December 2017, SLR position
of the banks has declined by 6.11%, while for
non-banks SLR position has slightly
improved by 0.56%.
Figure 14
corporations and private & public companies (other than
banking and non-banking financial institutions)
Financial Sector Performance Review Report December 2018
12 Department of Financial Regulation and Supervision
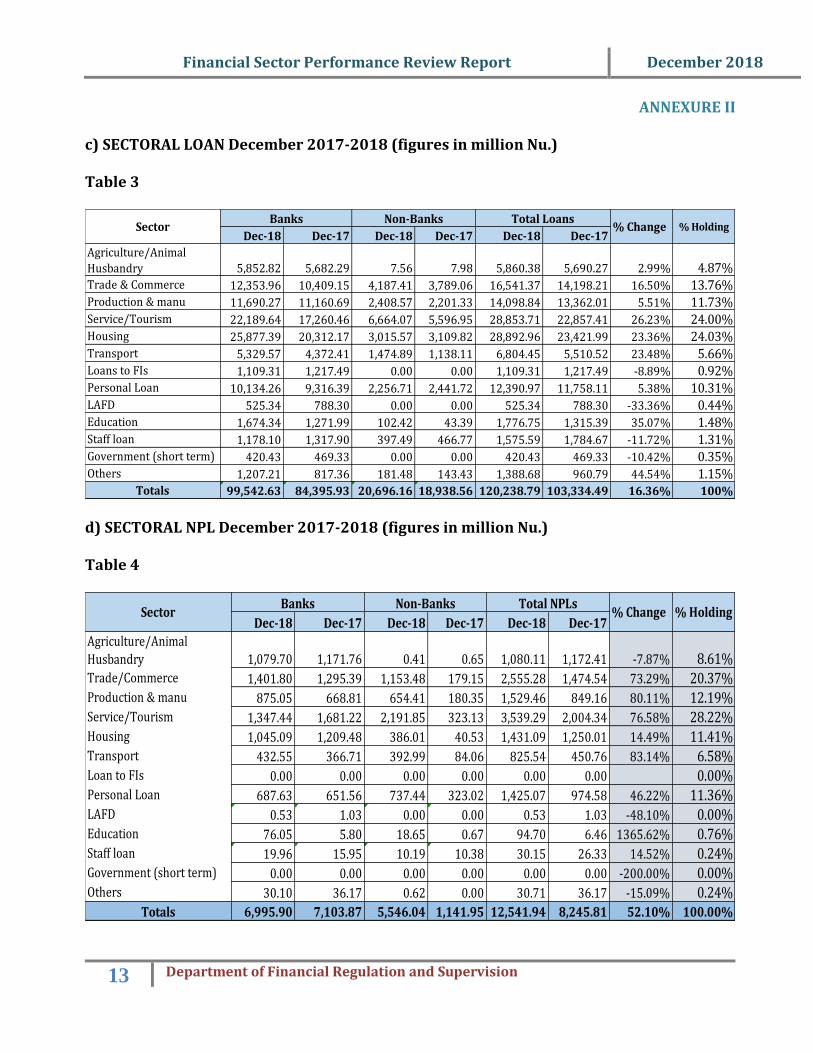
ANNEXURE I
a) Deposit by Customer December 2017- 2018 (figures in million Nu.)
Table 1
b) Consolidated Loan Classification December 2017- 2018 (figures in million Nu.)
Table 2
Dec-17 Dec-18
Corporate deposits 40,058.53 38,045.73 -5.02% 32.75%
Government 3,536.28 3,663.75 3.60% 3.15%
Government Corp. 13,168.25 12,420.64 -5.68% 10.69%
Public Companies 997.96 1,019.69 2.18% 0.88%
Private Co. 6,021.78 4,090.86 -32.07% 3.52%
Commercial Banks 8,317.87 8,151.70 -2.00% 7.02%
NBFIs 8,016.39 8,699.08 8.52% 7.49%
Retail deposits 69,513.16 78,125.58 12.39% 67.25%
Individuals 66,240.33 76,926.97 16.13% 66.22%
Foreign Currency 3,272.84 1,198.61 -63.38% 1.03%
Total 109,571.69 116,171.31 6.02% 100.00%
Total DepositsDeposits by Customer
Dec-17 Dec-18 Dec-17 Dec-18 Dec-17 Dec-18
Performing loans 77,292.06 92,546.74 17,796.62 15,150.13 95,088.68 107,696.87 13.26%
Standard 71,690.76 84,680.17 15,011.41 13,041.71 86,702.18 97,721.88 12.71%
Watch (up to 90 days) 5,601.30 7,866.58 2,785.20 2,108.41 8,386.51 9,974.99 18.94%
Non-performing loans 7,103.87 6,995.90 1,141.95 5,546.04 8,245.81 12,541.94 52.10%
Substandard (91 to 180 days) 1,256.21 1,017.57 103.03 1,256.93 1,359.24 2,274.50 67.34%
Doubtful (181 to 365 days) 1,100.32 825.85 98.30 1,022.07 1,198.62 1,847.93 54.17%
Loss (366& above) 4,747.34 5,152.47 940.61 3,267.04 5,687.95 8,419.51 48.02%
Total 84,395.93 99,542.64 18,938.56 20,696.16 103,334.49 120,238.81 16.36%
% ChangeBanks Non-Banks TOTAL
Classification
Financial Sector Performance Review Report December 2018
13 Department of Financial Regulation and Supervision
ANNEXURE II
c) SECTORAL LOAN December 2017-2018 (figures in million Nu.)
Table 3
d) SECTORAL NPL December 2017-2018 (figures in million Nu.)
Table 4
Dec-18 Dec-17 Dec-18 Dec-17 Dec-18 Dec-17
Agriculture/Animal
Husbandry 5,852.82 5,682.29 7.56 7.98 5,860.38 5,690.27 2.99% 4.87%Trade & Commerce 12,353.96 10,409.15 4,187.41 3,789.06 16,541.37 14,198.21 16.50% 13.76%Production & manu 11,690.27 11,160.69 2,408.57 2,201.33 14,098.84 13,362.01 5.51% 11.73%Service/Tourism 22,189.64 17,260.46 6,664.07 5,596.95 28,853.71 22,857.41 26.23% 24.00%Housing 25,877.39 20,312.17 3,015.57 3,109.82 28,892.96 23,421.99 23.36% 24.03%Transport 5,329.57 4,372.41 1,474.89 1,138.11 6,804.45 5,510.52 23.48% 5.66%Loans to FIs 1,109.31 1,217.49 0.00 0.00 1,109.31 1,217.49 -8.89% 0.92%Personal Loan 10,134.26 9,316.39 2,256.71 2,441.72 12,390.97 11,758.11 5.38% 10.31%LAFD 525.34 788.30 0.00 0.00 525.34 788.30 -33.36% 0.44%Education 1,674.34 1,271.99 102.42 43.39 1,776.75 1,315.39 35.07% 1.48%Staff loan 1,178.10 1,317.90 397.49 466.77 1,575.59 1,784.67 -11.72% 1.31%Government (short term) 420.43 469.33 0.00 0.00 420.43 469.33 -10.42% 0.35%Others 1,207.21 817.36 181.48 143.43 1,388.68 960.79 44.54% 1.15%
Totals 99,542.63 84,395.93 20,696.16 18,938.56 120,238.79 103,334.49 16.36% 100%
SectorBanks Non-Banks Total Loans
% Change % Holding
Dec-18 Dec-17 Dec-18 Dec-17 Dec-18 Dec-17
Agriculture/Animal
Husbandry 1,079.70 1,171.76 0.41 0.65 1,080.11 1,172.41 -7.87% 8.61%Trade/Commerce 1,401.80 1,295.39 1,153.48 179.15 2,555.28 1,474.54 73.29% 20.37%Production & manu 875.05 668.81 654.41 180.35 1,529.46 849.16 80.11% 12.19%Service/Tourism 1,347.44 1,681.22 2,191.85 323.13 3,539.29 2,004.34 76.58% 28.22%Housing 1,045.09 1,209.48 386.01 40.53 1,431.09 1,250.01 14.49% 11.41%Transport 432.55 366.71 392.99 84.06 825.54 450.76 83.14% 6.58%Loan to FIs 0.00 0.00 0.00 0.00 0.00 0.00 0.00%Personal Loan 687.63 651.56 737.44 323.02 1,425.07 974.58 46.22% 11.36%LAFD 0.53 1.03 0.00 0.00 0.53 1.03 -48.10% 0.00%Education 76.05 5.80 18.65 0.67 94.70 6.46 1365.62% 0.76%Staff loan 19.96 15.95 10.19 10.38 30.15 26.33 14.52% 0.24%Government (short term) 0.00 0.00 0.00 0.00 0.00 0.00 -200.00% 0.00%Others 30.10 36.17 0.62 0.00 30.71 36.17 -15.09% 0.24%
Totals 6,995.90 7,103.87 5,546.04 1,141.95 12,541.94 8,245.81 52.10% 100.00%
SectorBanks Non-Banks Total NPLs
% Holding% Change

Financial Sector Performance Review Report December 2018
14 Department of Financial Regulation and Supervision
Annexure III
e) Micro, Cottage, Small. Medium, Large (MCSML) and Non-enterprise loan for December 2018 (figures in million Nu.)
Figures in Nu. Million
Sl no. Sector Loan Outstanding NPL % share of each
category
% share of total
outstanding
Loan Outstanding NPL % share of each
category
% share of total
outstanding
Loan Outstanding NPL % share of
each category
% share of total
outstanding
AGRICULTURE 2,454.75 418.57 85.79% 2.47% - - 0.00% 0.00% 2,454.75 418.57 85.44% 2.04%PROD & MANU 48.10 15.22 1.68% 0.05% 0.60 0.00 5.09% 0.00% 48.69 15.22 1.69% 0.04%SERVICE 69.58 29.76 2.43% 0.07% 4.08 1.14 34.83% 0.02% 73.66 30.90 2.56% 0.06%TRADE&COMMERCE 288.78 94.47 10.09% 0.29% 7.04 3.72 60.08% 0.03% 295.81 98.20 10.30% 0.25%LOANS TO FIs 0.00 0.00 0.00% 0.00% - - 0.00% 0.00% - - 0.00% 0.00%
MICRO TOTAL 2,861.21 558.02 100.00% 2.87% 11.71 4.86 100.00% 0.06% 2,872.92 562.88 100.00% 2.39%
AGRICULTURE 2,560.15 519.07 72.72% 2.57% 1.90 0.41 2.40% 0.01% 2,562.04 519.48 71.17% 2.13%PROD & MANU 89.56 19.35 2.54% 0.09% 2.68 1.62 3.38% 0.01% 92.23 20.97 2.56% 0.08%SERVICE 285.56 96.23 8.11% 0.29% 23.81 5.98 30.07% 0.12% 309.37 102.21 8.59% 0.26%TRADE&COMMERCE 585.24 147.24 16.62% 0.59% 50.80 17.78 64.15% 0.25% 636.04 165.02 17.67% 0.53%LOANS TO FIs 0.00 - 0.00% 0.00% - - 0.00% 0.00% - - 0.00% 0.00%
COTTAGE TOTAL 3,520.51 781.89 100.00% 3.54% 79.18 25.78 100.00% 0.38% 3,599.69 807.67 100.00% 2.99%
AGRICULTURE 587.98 94.17 6.55% 0.59% 1.60 (0.00) 0.05% 0.01% 589.58 94.17 4.72% 0.49%PROD & MANU 1,652.97 373.03 18.41% 1.66% 260.37 79.72 7.39% 1.26% 1,913.34 452.75 15.30% 1.59%SERVICE 2,128.29 393.12 23.71% 2.14% 1,664.81 740.59 47.23% 8.04% 3,793.10 1,133.72 30.34% 3.15%TRADE&COMMERCE 4,608.38 564.50 51.33% 4.63% 1,598.30 451.51 45.34% 7.72% 6,206.68 1,016.00 49.64% 5.16%LOANS TO FIs - - 0.00% 0.00% 0.00 - 0.00% 0.00% - - 0.00% 0.00%SMALL TOTAL 8,977.62 1,424.81 100% 9.02% 3,525.08 1,271.82 100% 17.03% 12,502.70 2,696.64 100.00% 10.40%
AGRICULTURE 249.94 47.89 1.31% 0.25% 4.06 0.00 0.05% 0.02% 254.00 47.89 0.93% 0.21%PROD & MANU 3,628.83 404.32 19.07% 3.65% 1,513.17 309.59 18.09% 7.31% 5,141.99 713.90 18.77% 4.28%SERVICE 9,901.63 828.32 52.03% 9.95% 4,399.63 1,444.14 52.60% 21.26% 14,301.26 2,272.46 52.20% 11.89%TRADE&COMMERCE 5,250.79 595.60 27.59% 5.27% 2,447.83 680.46 29.26% 11.83% 7,698.62 1,276.06 28.10% 6.40%LOANS TO FIs - - 0.00% 0.00% - - 0.00% 0.00% - - 0.00% 0.00%
MEDIUM TOTAL 19,031.19 1,876.13 100% 19.12% 8,364.69 2,434.19 100% 40.42% 27,395.88 4,310.32 100.00% 22.78%
AGRICULTURE - 0.00 0.00% 0.00% - - 0.00% 0.00% - - 0.00% 0.00%PROD & MANU 6,270.82 63.14 33.35% 6.30% 631.76 263.48 49.09% 3.05% 6,902.58 326.62 34.35% 5.74%SERVICE 9,804.58 0.00 52.14% 9.85% 571.75 0.00 44.43% 2.76% 10,376.32 (0.00) 51.64% 8.63%TRADE&COMMERCE 1,620.77 0.00 8.62% 1.63% 83.44 0.00 6.48% 0.40% 1,704.22 (0.00) 8.48% 1.42%LOANS TO FIs 1,109.31 0.00 5.90% 1.11% - - 0.00% 0.00% 1,109.31 - 5.52% 0.92%LARGE TOTAL 18,805.48 63.14 100% 18.89% 1,286.95 263.48 100% 6.22% 20,092.43 326.62 100.00% 16.71%
HOUSING 25,877.39 1,045.09 55.83% 26.00% 3,015.57 386.01 40.59% 14.57% 28,892.96 1,431.09 53.73% 24.03%TRANSPORT 5,329.57 432.55 11.50% 5.35% 1,474.89 390.79 19.85% 7.13% 6,804.45 823.33 12.65% 5.66%PERSONAL 10,134.26 687.63 21.87% 10.18% 2,256.71 737.44 30.38% 10.90% 12,390.97 1,425.07 23.04% 10.31%STAFF LOAN 1,178.10 19.96 2.54% 1.18% 397.49 10.19 5.35% 1.92% 1,575.59 30.15 2.93% 1.31% Education Loan 1,674.34 76.05 3.61% 1.68% 102.42 18.65 1.38% 0.49% 1,776.75 94.70 3.30% 1.48%
Loan Against Fixed Deposits 525.34 0.53 1.13% 0.53% - - 0.00% 0.00% 525.34 0.53 0.98% 0.44% Loans to the Govt 420.43 0.00 0.91% 0.42% - - 0.00% 0.00% 420.43 (0.00) 0.78% 0.35%Others 1,207.21 30.08 2.60% 1.21% 181.48 0.62 2.44% 0.88% 1,388.68 30.70 2.58% 1.15%
Non- Enterprise TOTAL 46,346.63 2,291.90 100.00% 46.56% 7,428.55 1,543.69 100% 35.89% 53,775.18 3,835.59 100.00% 44.72%
99,542.63 6,995.89 20,696.16 5,543.83 120,238.79 12,539.72
Total FIs
(4)
ME
DIU
M
MCSML and Non enterprise Loan as of December 2018
GRAND TOTAL
(5)L
AR
GE
(1)
MIC
RO
No
n-E
nte
rpri
se
(3)
SM
AL
L(2
) C
OT
TA
GE
Non BanksBanks