Financial Section - Hitachi High-Tech · Other financial liabilities 15,27 7,038 3,478 Retirement...
54
Financial Section Annual Report 2017 Year ended March 31, 2017 Consolidated Statements of Financial Position Consolidated Statements of Profit or Loss and Consolidated Statements of Comprehensive Income Consolidated Statements of Changes in Equity Consolidated Statements of Cash Flows
Transcript of Financial Section - Hitachi High-Tech · Other financial liabilities 15,27 7,038 3,478 Retirement...

Financial SectionAnnual Report 2017Year ended March 31, 2017
Consolidated Statements of Financial Position
Consolidated Statements of Profit or Loss andConsolidated Statements of Comprehensive Income
Consolidated Statements of Changes in Equity
Consolidated Statements of Cash Flows
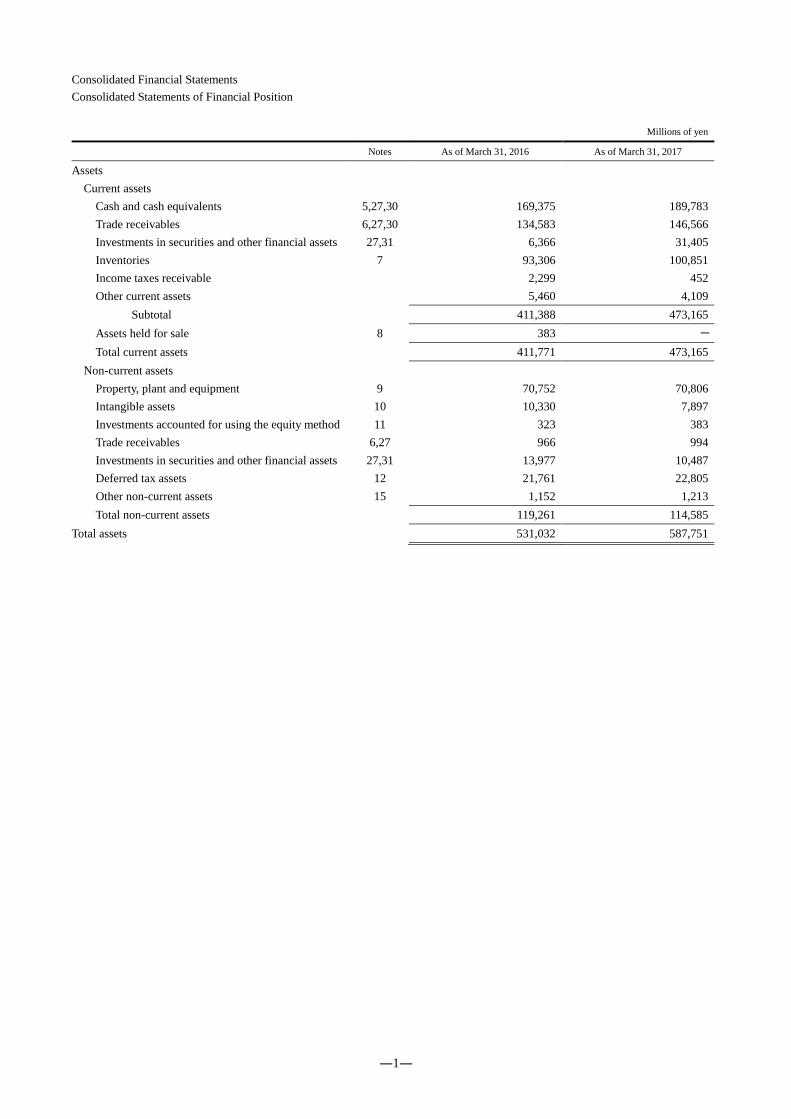
―1―
Consolidated Financial Statements
Consolidated Statements of Financial Position
Millions of yen
Notes As of March 31, 2016 As of March 31, 2017
Assets
Current assets
Cash and cash equivalents 5,27,30 169,375 189,783
Trade receivables 6,27,30 134,583 146,566
Investments in securities and other financial assets 27,31 6,366 31,405
Inventories 7 93,306 100,851
Income taxes receivable 2,299 452
Other current assets 5,460 4,109
Subtotal 411,388 473,165
Assets held for sale 8 383 -
Total current assets 411,771 473,165
Non-current assets
Property, plant and equipment 9 70,752 70,806
Intangible assets 10 10,330 7,897
Investments accounted for using the equity method 11 323 383
Trade receivables 6,27 966 994
Investments in securities and other financial assets 27,31 13,977 10,487
Deferred tax assets 12 21,761 22,805
Other non-current assets 15 1,152 1,213
Total non-current assets 119,261 114,585
Total assets 531,032 587,751

―2―
Millions of yen
Notes As of March 31, 2016 As of March 31, 2017
Liabilities
Current liabilities
Trade payables 13,27,30,31 109,975 121,342
Other financial liabilities 15,27 16,494 17,202
Income taxes payable 1,149 13,899
Accrued expenses 21,591 24,437
Advances received 15,486 18,549
Provisions 14 1,812 1,640
Other current liabilities 1,190 1,631
Total current liabilities 167,697 198,700
Non-current liabilities
Other financial liabilities 15,27 7,038 3,478
Retirement and severance benefits 15 33,067 26,106
Provisions 14 1,467 1,488
Deferred tax liabilities 12 87 21
Other non-current liabilities 623 752
Total non-current liabilities 42,282 31,846
Total liabilities 209,979 230,546
Equity
Hitachi High-Technologies Corporation stockholders’ equity
Common stock 16 7,938 7,938
Capital surplus 16 35,662 35,662
Retained earnings 16 267,903 303,136
Accumulated other comprehensive income 16 9,636 10,532
Treasury stock, at cost 16 (349) (356)
Total Hitachi High-Technologies Corporation stockholders’ equity
320,790 356,913
Non-controlling interests 264 292
Total equity 321,054 357,205
Total liabilities and equity 531,032 587,751

―3―
Consolidated Statements of Profit or Loss and Consolidated Statements of Comprehensive Income
Consolidated Statements of Profit or Loss
Years ended March 31, 2016 and 2017 Millions of yen
Notes 2016 2017
Revenues 30 628,984 644,545
Cost of sales 19,20 (487,993) (489,780)
Gross profit 140,991 154,765
Selling, general and administrative expenses 18,19,20 (93,945) (97,493)
Other income 22 4,969 680
Other expenses 19,21,22 (2,660) (4,845)
Operating profit 49,356 53,107
Financial income 23 312 664
Financial expenses 23 (1,510) (276)
Share of profits (losses) of investments accounted for using the equity method 51 141
EBIT (Earnings before interest and taxes) 48,209 53,636
Interest income 23 409 326
Interest expenses 23 (52) (43)
Income before income taxes 48,566 53,918
Income taxes 12 (12,575) (13,755)
Net income 35,991 40,164
Net income attributable to:
Hitachi High-Technologies Corporation stockholders 35,989 40,170
Non-controlling interests 1 (6)
Total 35,991 40,164
Earnings per share attributable to Hitachi High-Technologies Corporation stockholders
24
(Yen)
Basic and diluted earnings per share attributable to Hitachi High-Technologies Corporation stockholders
261.68
292.08

―4―
Consolidated Statements of Comprehensive Income
Years ended March 31, 2016 and 2017 Millions of yen
Notes 2016 2017
Net income 35,991 40,164
Other comprehensive income (OCI)
Items not to be reclassified into net income
Net changes in financial assets measured at fair value through OCI 25 (752) 2,684
Remeasurements of defined benefit plans 25 (6,951) 4,805
Total items not to be reclassified into net income (7,704) 7,489
Items that can be reclassified into net income
Foreign currency translation adjustments 25 (3,157) (666)
Net changes in cash flow hedges 25 1,132 (562)
Total items that can be reclassified into net income (2,025) (1,228)
Other comprehensive income (OCI) (9,729) 6,260
Comprehensive income 26,262 46,424
Comprehensive income attributable to:
Hitachi High-Technologies Corporation stockholders 26,295 46,444
Non-controlling interests (34) (20)
Total 26,262 46,424

―5―
Consolidated Statements of Changes in Equity
Millions of yen
Notes Common stock Capital surplus Retained earnings
Accumulated other comprehensive income
Net changes in financial assets
measured at FVTOCI
Remeasurements of defined benefit
plans
Foreign currency translation
adjustments
As of April 1, 2015 7,938 35,662 239,553 7,133 4,570 7,501
Net income 35,989
Other comprehensive income
(752) (6,951) (3,122)
Comprehensive income - - 35,989 (752) (6,951) (3,122)
Acquisition of treasury stock
16
(0)
Dividends 17 (6,877)
Acquisition (disposal) of non-controlling interests
Reclassified into retained earnings
(763) (5) 768
Total transactions with the owners
- (0) (7,639) (5) 768 -
As of March 31, 2016 7,938 35,662 267,903 6,375 (1,613) 4,379
Net income 40,170
Other comprehensive income
2,684 4,805 (653)
Comprehensive income - - 40,170 2,684 4,805 (653)
Acquisition of treasury stock
16
(0)
Dividends 17 (10,315)
Acquisition (disposal) of non-controlling interests
Reclassified into retained earnings
5,378 (5,378)
Total transactions with the owners
- (0) (4,936) (5,378) - -
As of March 31, 2017 7,938 35,662 303,136 3,681 3,191 3,726

―6―
Millions of yen
Notes
Accumulated other comprehensive income
Treasury stock, at cost
Total Hitachi High-Technologies
Corporation stockholders’
equity
Non-controlling interests
Total equity Net changes in
cash flow hedges
Total accumulated other
comprehensive income
As of April 1, 2015 (636) 18,567 (343) 301,378 319 301,696
Net income - 35,989 1 35,991
Other comprehensive income
1,132 (9,694) (9,694) (35) (9,729)
Comprehensive income 1,132 (9,694) - 26,295 (34) 26,262
Acquisition of treasury stock
16
- (6) (6) (6)
Dividends 17 - (6,877) (21) (6,898)
Acquisition (disposal) of non-controlling interests
- - -
Reclassified into retained earnings
763 - -
Total transactions with the owners
- 763 (6) (6,883) (21) (6,904)
As of March 31, 2016 496 9,636 (349) 320,790 264 321,054
Net income - 40,170 (6) 40,164
Other comprehensive income
(562) 6,274 6,274 (14) 6,260
Comprehensive income (562) 6,274 - 46,444 (20) 46,424
Acquisition of treasury stock
16
- (7) (7) (7)
Dividends 17 - (10,315) (20) (10,335)
Acquisition (disposal) of non-controlling interests
- - 68 68
Reclassified into retained earnings
(5,378) - -
Total transactions with the owners
- (5,378) (7) (10,321) 48 (10,273)
As of March 31, 2017 (66) 10,532 (356) 356,913 292 357,205

―7―
Consolidated Statements of Cash Flows
Years ended March 31, 2016 and 2017 Millions of yen
Notes 2016 2017
Cash flows from operating activities:
Net income 35,991 40,164
Adjustments to reconcile net income to net cash provided by operating activities
Depreciation and amortization 9,10 10,527 10,525
Impairment losses 21 1,889 4,119
Income taxes 12 12,575 13,755
Share of (profits) losses of investments accounted for using the equity method (51) (141)
Interest income 23 (409) (326)
Dividends income 23 (288) (329)
Interest expenses 23 52 43
Profits (losses) on sales of property, plant and equipment and intangible assets 22 (88) 327
Increase in trade receivables (943) (11,886)
Increase in inventories (4,112) (7,318)
Increase (decrease) in trade payables (7,682) 11,923
Increase (decrease) in advances received (2,893) 3,070
Decrease in retirement and severance benefits 15 (7,989) (5,206)
Other (2,803) 4,722
Subtotal 33,775 63,442
Interest received 406 292
Dividends received 346 408
Interest paid (51) (43)
Income taxes paid (16,201) (5,233)
Income taxes refund 267 1,653
Net cash provided by operating activities 18,541 60,519
Cash flows from investing activities:
Payments into deposits and time deposits (97) (37,500)
Proceeds from withdrawal of deposits and time deposits 12,597 12,500
Purchase of property, plant and equipment 9 (9,138) (10,011)
Purchase of intangible assets 10 (2,099) (2,002)
Proceeds from sale of property, plant and equipment 9 2,596 616
Proceeds from sale of intangible assets 10 2 231
Purchase of investments in securities and other financial assets 27 (935) (604)
Proceeds from sale and redemption of investments in securities and other financial assets
27 2,531 8,088
Purchase of investments in subsidiaries resulting in change in scope of consolidation
- (94)
Proceeds from transfer of business 641 -
Other 9 (132)
Net cash provided by (used in) investing activities 6,107 (28,908)
Cash flows from financing activities:
Proceeds from payments from non-controlling interests - 68
Dividends paid to Hitachi High-Technologies Corporation stockholders 17 (6,874) (10,306)
Dividends paid to non-controlling interests (40) (20)
Acquisition of common stock for treasury 16 (6) (7)
Other (199) (199)
Net cash used in financing activities (7,120) (10,464)
Effect of exchange rate changes on cash and cash equivalents (2,095) (739)
Net increase in cash and cash equivalents 15,433 20,408
Cash and cash equivalents at beginning of year 5 153,942 169,375
Cash and cash equivalents at end of year 5 169,375 189,783

―8―
Notes to the Consolidated Financial Statements
1. Reporting Entity
Hitachi High-Technologies Corporation (the Company) is a corporation domiciled in Japan, whose shares are publicly listed. The
registered address of its Head Office is 24-14, Nishi-shimbashi 1-chome, Minato-ku, Tokyo. The Company’s consolidated financial
statements for the year ended March 31, 2017, comprise those of the Company and its subsidiaries (the Group) and its interests in
associates. The Group’s businesses center on electronics and its reportable segments consist of Science & Medical Systems, Electronic
Device Systems, Industrial Systems and Advanced Industrial Products.
2. Basis of Presentation
(1) Compliance with IFRS
As the Company meets the requirements of a “Specified Company applying Designated International Financial Reporting
Standards” pursuant to Article 1-2 of the Ordinance on Terminology, Forms and Preparation Methods of Consolidated Financial
Statements, the consolidated financial statements of the Group have been prepared in accordance with International Financial
Reporting Standards (IFRS) issued by International Accounting Standards Board (IASB), as permitted by the provision of Article
93 of the Ordinance.
On June 23, 2017, Masahiro Miyazaki, Representative Executive Officer, President, and Chief Executive Officer, and Shunichi
Uno, Chief Financial Officer, Senior Vice President, and Executive Officer approved these consolidated financial statements.
(2) Basis of Measurement
The Group’s consolidated financial statements have been prepared on a historical cost basis, except for the financial instruments
and the liabilities and assets associated with defined benefit plans stated in Note 3 Summary of Significant Accounting Policies.
(3) Presentation Currency
The consolidated financial statements are presented in Japanese yen as the Company’s functional currency. The financial
information in Japanese yen is rounded to the nearest million.
(4) Use of Estimates and Judgments
Management has made a number of judgments, estimates and assumptions relating to the application of accounting policies,
reporting of revenues and expenses and assets and liabilities in the preparation of these IFRS-based consolidated financial
statements. However, actual results could differ from those estimates.
Estimates and assumptions are continually evaluated. The effect of a revision in accounting estimates, is recognized in the
reporting period in which the revision was made and in future periods.
The information regarding judgments used in applying accounting policies that could have a material effect on the Company’s
consolidated financial statements is included in the following notes:
• Note 3 (1) Basis of Consolidation
• Note 3 (5) Financial Instruments and Note 27 Financial Instruments
• Note 3 (16) Revenue Recognition
The information regarding uncertainties arising from assumptions and estimates that could result in material adjustments in the
subsequent consolidated financial statements is included in the following notes:
• Note 3 (10) Impairment of Non-financial Assets and Note 21 Impairment Losses
• Note 3 (12) Employee Benefits and Note 15 Retirement and Severance Benefits
• Note 3 (13) Provisions and Note 14 Provisions
• Note 3 (14) Contingencies and Note 33 Contingencies
• Note 3 (17) Income Taxes and Note 12 Deferred Taxes and Income Taxes
―9―
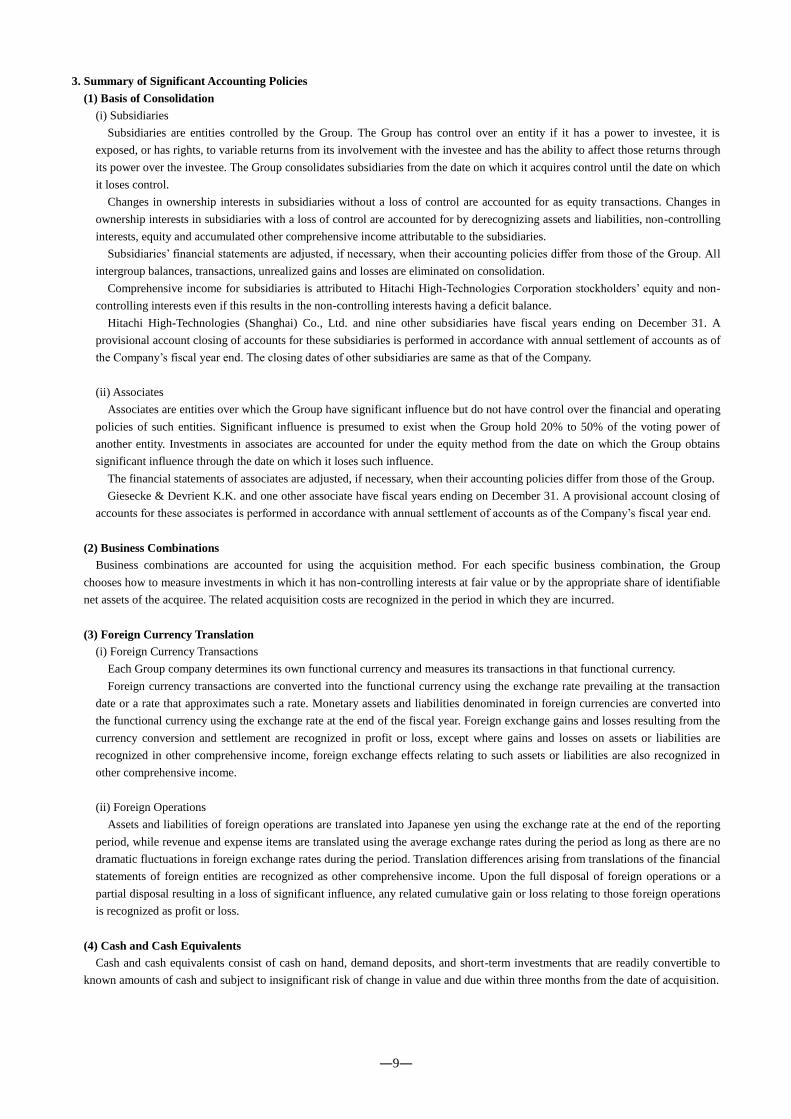
3. Summary of Significant Accounting Policies
(1) Basis of Consolidation
(i) Subsidiaries
Subsidiaries are entities controlled by the Group. The Group has control over an entity if it has a power to investee, it is
exposed, or has rights, to variable returns from its involvement with the investee and has the ability to affect those returns through
its power over the investee. The Group consolidates subsidiaries from the date on which it acquires control until the date on which
it loses control.
Changes in ownership interests in subsidiaries without a loss of control are accounted for as equity transactions. Changes in
ownership interests in subsidiaries with a loss of control are accounted for by derecognizing assets and liabilities, non-controlling
interests, equity and accumulated other comprehensive income attributable to the subsidiaries.
Subsidiaries’ financial statements are adjusted, if necessary, when their accounting policies differ from those of the Group. All
intergroup balances, transactions, unrealized gains and losses are eliminated on consolidation.
Comprehensive income for subsidiaries is attributed to Hitachi High-Technologies Corporation stockholders’ equity and non-
controlling interests even if this results in the non-controlling interests having a deficit balance.
Hitachi High-Technologies (Shanghai) Co., Ltd. and nine other subsidiaries have fiscal years ending on December 31. A
provisional account closing of accounts for these subsidiaries is performed in accordance with annual settlement of accounts as of
the Company’s fiscal year end. The closing dates of other subsidiaries are same as that of the Company.
(ii) Associates
Associates are entities over which the Group have significant influence but do not have control over the financial and operating
policies of such entities. Significant influence is presumed to exist when the Group hold 20% to 50% of the voting power of
another entity. Investments in associates are accounted for under the equity method from the date on which the Group obtains
significant influence through the date on which it loses such influence.
The financial statements of associates are adjusted, if necessary, when their accounting policies differ from those of the Group.
Giesecke & Devrient K.K. and one other associate have fiscal years ending on December 31. A provisional account closing of
accounts for these associates is performed in accordance with annual settlement of accounts as of the Company’s fiscal year end.
(2) Business Combinations
Business combinations are accounted for using the acquisition method. For each specific business combination, the Group
chooses how to measure investments in which it has non-controlling interests at fair value or by the appropriate share of identifiable
net assets of the acquiree. The related acquisition costs are recognized in the period in which they are incurred.
(3) Foreign Currency Translation
(i) Foreign Currency Transactions
Each Group company determines its own functional currency and measures its transactions in that functional currency.
Foreign currency transactions are converted into the functional currency using the exchange rate prevailing at the transaction
date or a rate that approximates such a rate. Monetary assets and liabilities denominated in foreign currencies are converted into
the functional currency using the exchange rate at the end of the fiscal year. Foreign exchange gains and losses resulting from the
currency conversion and settlement are recognized in profit or loss, except where gains and losses on assets or liabilities are
recognized in other comprehensive income, foreign exchange effects relating to such assets or liabilities are also recognized in
other comprehensive income.
(ii) Foreign Operations
Assets and liabilities of foreign operations are translated into Japanese yen using the exchange rate at the end of the reporting
period, while revenue and expense items are translated using the average exchange rates during the period as long as there are no
dramatic fluctuations in foreign exchange rates during the period. Translation differences arising from translations of the financial
statements of foreign entities are recognized as other comprehensive income. Upon the full disposal of foreign operations or a
partial disposal resulting in a loss of significant influence, any related cumulative gain or loss relating to those foreign operations
is recognized as profit or loss.
(4) Cash and Cash Equivalents
Cash and cash equivalents consist of cash on hand, demand deposits, and short-term investments that are readily convertible to
known amounts of cash and subject to insignificant risk of change in value and due within three months from the date of acquisition.

―10―
(5) Financial Instruments
The Group adopts IFRS 9 “Financial Instruments” (IFRS 9) (issued in November 2009, amended in October 2010).
(i) Non-Derivative Financial Assets
The Group recognizes financial assets measured at amortized cost on the date they arise and recognizes other financial assets at
the transaction when the Group becomes a party to the arrangement.
The classification and measurement model of non-derivative financial assets is summarized as follows:
Financial Assets Measured at Amortized Cost
Financial assets are subsequently measured at amortized cost when they meet the following requirements:
• The financial asset is held under a business model the objective of which is to hold the asset to collect contractual cash
flows.
• The contractual terms of the financial asset provide cash flows on specified dates that are solely payments of principal
and interest on the principal amount outstanding.
Financial assets measured at amortized cost are initially measured at fair value, including direct transaction costs. The
carrying amount of financial assets measured at amortized cost is subsequently measured using the effective interest
method.
Impairment of Financial Assets Measured at Amortized Cost
Impairment is deemed to have occurred when there is objective evidence of impairment resulting from one or more
event after initial recognition and when it is reasonably foreseeable that the future cash flows of the financial assets will be
affected.
Objective evidence of impairment includes historical credit loss experience, existence of overdue payments, extended
payment terms, negative evaluation by third party credit rating agencies, and deteriorated financial position and operating
results, such as a capital deficit.
Impairment losses are estimated based on estimated future cash flows discounted by the initial effective interest rate or
the estimated fair value using the observable market price.
In addition to the above impairment losses, the Group evaluates the potential risks of debtors or regions, etc., with
regard to the relevant financial assets and recognizes impairment losses based on credit loss ratios calculated taking into
consideration historical experience or other factors or estimates of collectible amounts.
Impairment losses directly or through bad debt provisions reduce the carrying amount of the assets, and the losses are
recognized in profit or loss. Thereafter, for trade receivables and other receivables, debt provisions are directly written off
from the carrying amount where the relevant financial assets are deemed uncollectible.
Financial Assets Measured at Fair Value through Profit or Loss (FVTPL Financial Assets)
Financial assets not classified as financial assets measured at amortized cost and not designated as FVTOCI financial
assets are classified as FVTPL financial assets.
FVTPL financial assets are measured at fair value when initially recognized and incurred transaction expenses are
recognized in profit or loss. After initial recognition, these assets are measured at fair value and the subsequent changes in
fair value are recognized in profit or loss.
Financial Assets Measured at Fair Value through Other Comprehensive Income (FVTOCI Financial Assets)
For equity instruments that the Group holds to maintain close business relations with investees, the Group chooses for
each financial asset whether or not it can be irrevocably designated as a FVTOCI financial asset upon initial recognition.
FVTOCI financial assets are initially recognized at fair value, including transaction expenses. After initial recognition,
they are measured at fair value, and subsequent changes in fair value are recognized as OCI. Amounts recognized as OCI
that are derecognized as financial assets are transferred to retained earnings. Dividends are recognized in profit or loss.
Derecognition of Financial Assets
The Group derecognizes financial assets when contractual rights to cash flows from the financial assets expire or when
the contractual rights to receive cash flows from the financial assets are transferred and the risks and economic rewards of
owning the financial assets are almost all transferred.
―11―
(ii) Non-Derivative Financial Liabilities
The Group classifies all non-derivative financial liabilities as financial liabilities measured at amortized cost and initially
recognizes them on the date they arise.
Financial liabilities measured at amortized cost are initially recognized at fair value, less transaction costs. They are
subsequently measured at amortized cost based on the effective interest method.
Financial liabilities are derecognized when contractual obligations are redeemed, discharged, canceled, or expired.
(iii) Derivatives and Hedge Accounting
The Group uses forward exchange contracts to hedge changes in cash flow relating to future foreign currency denominated
transactions. These contracts are designated as cash flow hedges where satisfying hedge accounting requirements and are initially
recognized at fair value. They are subsequently measured at fair value and portions for which hedging is deemed effective against
subsequent changes are recognized as OCI.
The Group documents risk management policies, including derivative usage objectives and strategies. In addition, a formal
assessment is made at the hedge’s inception and subsequently on a periodic basis, as to whether the derivative used in hedging
activities is highly effective in offsetting changes in fair value or cash flows of the hedged items.
Hedge accounting is discontinued if a hedge does not meet hedge accounting requirements or the hedging instruments have
expired, been sold, or terminated or if the hedge designation has been canceled. If an expected transaction is no longer likely to
occur, amounts recognized as OCI are promptly transferred to profit or loss.
(iv) Offsetting Financial Assets and Liabilities
Financial assets and liabilities are offset and reported as a net amount when the Group currently has a legally enforceable right
to set off the recognized amounts and intends to settle on a net basis or to realize the asset and settle the liability simultaneously.
(6) Inventories
The cost of inventories includes all costs of purchase, costs of conversion and other costs incurred in bringing the inventories to
their present location and condition.
Inventories are measured at the lower of cost or net realizable value. Cost is mainly determined by the moving average method for
finished goods and raw materials and by the specific identification method for work in process. Net realizable value is the estimated
selling price in the ordinary course of business less the estimated costs of completion and the estimated costs necessary to sell.
(7) Property, Plant and Equipment
The Group uses the cost model to measure property, plant and equipment. They are stated at cost, less accumulated depreciation
and accumulated impairment losses.
Acquisition cost includes direct costs of acquisition, costs of dismantling, removing and restoration of the assets.
Except for land and other assets that are not depreciated, property, plant and equipment are depreciated using the straight-line
method over the following estimated useful lives for major classes of assets:
• Buildings and structures 2 to 60 years
• Machinery, equipment and vehicles 2 to 17 years
• Tools, furniture and fixtures 2 to 20 years
Estimated useful lives and the method of depreciation are reviewed at the fiscal year end. Changes in estimated useful lives or
depreciation method are accounted for on a prospective basis as a change in accounting estimate.

―12―
(8) Intangible Assets
(i) Goodwill
Goodwill is stated at cost less any accumulated impairment losses, and is not amortized.
(ii) Intangible Assets
The Group applies the cost model to intangible assets and states such assets at cost less accumulated amortization and
impairment losses.
Intangible assets acquired separately are measured at cost at initial recognition, and the costs of intangible assets acquired
through business combinations are recognized at fair value at the acquisition date.
Intangible assets with finite useful lives are amortized generally using the straight-line method, while intangible assets with
indefinite useful lives are not amortized. The estimated useful lives for major classes of assets are as follows:
• Software 2 to 5 years
• Other 5 to 20 years
Estimated useful lives and the method of amortization are reviewed at the fiscal year end. Changes in estimated useful lives or
amortization method are accounted for on a prospective basis as a change in accounting estimate.
(9) Leases
(i) Lease Transactions
Whether an arrangement is or contains a lease is determined based on the nature of the arrangement. Leased assets are
recognized when fulfillment of the contract is dependent on the use of certain assets or asset groups, with the arrangements
providing rights to use the relevant assets.
(ii) Finance Leases
As Lessee
Leases for which all of the risks and economic rewards of ownership are transferred to the Group are classified as finance
leases.
Lease assets and liabilities are initially recognized as the lower of the fair value or the present value of the minimum lease
payments. After initial recognition, accounting is based on the accounting policies applied to the relevant assets and liabilities.
As Lessor
Leases for which all of the risks and economic value accompanying the asset ownership are transferred to the lessee are
classified as finance leases.
Lease receivables are recognized at amounts equivalent to the net investments in the leased assets and included in trade
receivables in the consolidated statements of financial position.
(iii) Operating Lease Transactions
Leases other than finance leases are classified as operating leases.
Operating lease payments are recognized in profit or loss on a straight-line basis throughout the lease terms.
(10) Impairment of Non-financial Assets
For each non-financial asset, the Group assesses whether there are any indications that assets may be impaired and tests for
impairment when events or circumstances indicate such impairment. For goodwill and intangible assets with indefinite useful lives,
the Group annually estimates recoverable amounts and tests for impairment regardless of whether or not there are indications of
impairment.
The Group uses the higher of the fair value less costs of disposal or value in use as the recoverable amount of an asset or a cash
generating unit. In estimating the value in use, estimated future cash flows are discounted to the present value, using pre-tax
discount rates that reflect the time value of money and the inherent risks of the relevant assets and cash generating units. If the
carrying amount of an asset or a cash generating unit exceeds the recoverable amount, the impairment loss of the asset is recognized
in profit or loss.
For an asset other than goodwill, the recoverable amount is subsequently estimated when there is a significant change in facts and
circumstances and there is an indication that an impairment loss previously recognized may no longer exist or has decreased. If the
estimated recoverable amount exceeds the carrying amount, the impairment loss recognized previously is reversed to the extent of
the carrying amount that would have been recorded, net of depreciation or amortization, if impairment had not been recognized
previously.

―13―
(11) Assets Held for Sale
An asset or disposal group for which the value is expected to be recovered through a sale rather than through continuing use is
classified as an asset or disposal group held for sale when the asset or disposal group could be sold immediately as is or it is highly
probable that the asset or disposal group will soon be sold.
Assets held for sale are measured at the lower of the carrying amount or the fair value less costs to sell. There is no depreciation
or amortization of assets after classification.
(12) Employee Benefits
(i) Retirement and Severance Benefits
Defined Benefit Plans
The Company and certain subsidiaries maintain defined benefit plans and / or severance lump-sum payment plans to provide
retirement and severance benefits to employees.
For each plan, the Group uses the projected unit credit method to calculate the present value of defined benefit obligations
and related retirement benefit costs. For a discount rate, a discount period is determined based on the period until the expected
date of benefit payment in each fiscal year and the discount rate is determined by reference to market yields for the period
corresponding to the discount period at the end of the fiscal year on high-quality corporate bonds.
Liabilities or assets for defined benefit plans are calculated by the present value of the defined benefit obligation, deducting
the fair value of any plan assets.
Remeasurements of defined benefit plan liabilities or assets are recognized as other comprehensive income in the period in
which incurred but are not subsequently transferred to profit or loss. Past service costs are recognized as profit or loss in the
period when incurred.
Defined Contribution Plans
The Company and certain subsidiaries maintain defined contribution plans.
Under a defined contribution plan, the employer contributes certain amounts to another independent entity, and there is no
legal or constructive obligation to pay more than the contributions.
Contributions to defined contribution plans are recognized in profit or loss during the periods in which employees provided
the relevant service.
(ii) Short-Term Employee Benefits
Short-term employee benefits are recognized in profit or loss during the periods in which employees provided the relevant
service.
When there is a legal and constructive obligation to pay bonuses and paid leave, and where it is possible to make reliable
estimates, the payments based on such plans are recognized as estimated obligations.
(13) Provisions
The Company recognizes provisions when it has a present obligation (legal or constructive) as a result of past events, it is
probable that an outflow of resources embodying economic benefits will be required to settle the obligation, and the amount of the
obligation can be reliably estimated.
When the time to settle an obligation is expected to be long, and thus the time value of money is material, the amount of a
provision is measured at the present value of the amount of expenditures expected to be required to settle the obligation. The present
value is calculated by using pre-tax discount rates that reflect the time value of money and the inherent risks of the relevant
obligations.
See Note 14 Provisions for a discussion about the nature of the provisions and the amounts recognized by the Group.

―14―
(14) Contingencies
(i) Contingent Liabilities
The Group discloses contingent liabilities in Note 33 Contingencies if it has possible obligations at the fiscal year end, whose
existence cannot be confirmed at that date, or if obligations do not meet the recognition criteria for provisions described above in
Note 3(13) Provisions, excluding those where the possibility of an outflow of resources embodying economic benefits is remote.
The Group has concluded financial guarantee agreements that require it to make repayments to compensate for a loss incurred
if a specified debtor defaults on a payment on the due date based on the terms of a debt instrument.
(ii) Contingent Assets
The Group discloses contingent assets in Note 33 Contingencies if an inflow of resources embodying economic benefits is
probable, but not virtually certain at the fiscal year end.
(15) Capital
(i) Common Stock and Capital Surplus
The issue prices of equity instruments that the Company issues are recorded in common stock and capital surplus. The direct
issuance costs are deducted from capital surplus.
(ii) Treasury Stock
Acquired treasury stock is recognized at cost and deducted from equity, while the difference between the carrying value of
treasury stock and its value at the time of sale is recognized in capital surplus.
(16) Revenue Recognition
Revenue is measured at the fair value of consideration received or receivable by the Group, less discounts, rebates or consumption
or other taxes. If there is more than one identifiable component in a single transaction, the components of the transaction are split
and the revenue recognized for each component. If the economic reality of multiple transactions cannot be presented without being
seen as integral, the revenue of multiple transactions is recognized integrally. The Group’s revenue recognition criteria and
presentation policies are as follows:
(i) Revenue Recognition Standards
Sale of Goods
Revenue from the sale of goods is recognized when the significant risks and rewards of ownership of the goods have been
transferred to the customer, the Group has neither continuing involvement nor effective control over the goods sold, the costs
incurred in respect of the transaction and the amount of revenue can be measured reliably, and it is probable that the economic
benefits associated with the transaction will flow to the Group. Specifically, revenue is recognized at such times as when goods
are transferred to a customer, the date of shipment, or the date of acceptance by the customer.
Rendering of Services
Revenue from repairs and support services associated with the sale of products is recognized when services are provided.
Revenue from maintenance or other fixed price service contracts is recognized evenly over the contractual period.
Construction Contracts
If the progress of construction can be reliably estimated, revenue is recognized using the percentage of completion method.
Revenue under this method is calculated by the latest estimate of the total selling price multiplied by the ratio of the cost
incurred to date to the estimated total cost of construction. Any anticipated losses on fixed-price contracts are expensed in profit
or loss when such losses are estimated.
If it is impossible to reliably estimate the outcome of a construction contract, revenue is recognized using the cost recovery
method. Revenue under the cost recovery method is recognized only to the extent that there is a high probability of cost
recovery, and costs are recognized in the period in which they are incurred.

―15―
(ii) Revenue Presentation Policy
If the Group is a party to a transaction, all of the revenue received from the customer is presented. If the Group participates in a
transaction as an agent for a third party, the commission paid by the customer, excluding the payment collected for the third party,
is presented as revenue.
The determination of whether the Group is a party or agent depends on such factors as whether or not it has the primary
responsibility for supplying the products and services and executing the order, whether it incurs inventory risks before or after the
customer places an order, during shipment, or upon returns, or whether the Group has the right to directly or indirectly set prices.
(17) Income Taxes
Income taxes comprise current and deferred taxes that are recognized in profit or loss, except for taxes recognized in equity or
directly in OCI and taxes related to business combinations.
Current income taxes are measured as amounts expected to be paid to or refunded from the taxation authorities. For the
calculation of taxes, the Group uses the tax rates and tax laws that have been enacted or substantively enacted by the end of the
fiscal year.
Deferred income taxes are calculated based on the temporary differences between the tax basis for assets and liabilities and the
carrying amount at the fiscal year end. Deferred tax assets are recognized for deductible temporary differences, carryforward of
unused tax credits and unused tax losses to the extent that it is probable that future taxable profit will be available against which they
can be utilized. Deferred tax liabilities are recognized for taxable temporary differences.
The deferred tax assets or liabilities are not recognized for the following temporary differences:
• The initial recognition of goodwill
• The initial recognition of assets or liabilities in transactions that are not business combinations and at the time of transaction,
affect neither accounting profit nor taxable profit or tax loss
• Taxable temporary differences arising from investments in subsidiaries and associates to the extent that the timing of the
reversal of the temporary difference is controlled and that it is probable that the temporary difference will not reverse in the
foreseeable future.
• Deductible temporary differences arising from investments in subsidiaries and associates to the extent that it is probable that
the temporary difference will not reverse in the foreseeable future and that it is not probable that future taxable profits will be
available against which they can be utilized
Deferred tax assets and liabilities are measured at the tax rates that are expected to apply to the fiscal year when those temporary
differences are reversed, based on tax rates that have been enacted or substantively enacted by the end of the fiscal year.
Deferred tax assets and deferred tax liabilities are offset if there is a legally enforceable right to offset deferred tax assets and
liabilities with current tax assets and liabilities, and where the same taxation authority imposes the same income tax on the same
taxable entity or even on a different taxable entity, where these taxable entities intend to settle current tax assets and liabilities on a
net basis or plan to realize these tax assets and liabilities simultaneously.
(18) Consumption Tax
Consumption tax collected and remitted to the taxation authorities is excluded from revenues, cost of sales and expenses.
(19) Earnings per Share
Basic earnings per share are calculated by dividing net income attributable to Hitachi High-Technologies Corporation
stockholders by the weighted average number of ordinary shares outstanding during the period, excluding treasury stock.
Basic and diluted earnings per share are the same, as there are no shares with dilutive potential.

―16―
(20) New Accounting Standards not yet Adopted by the Group
The following table lists the principal new accounting standards and interpretations issued or amended prior to the approval date
of the consolidated financial statements that have not been yet adopted as of the reporting date (March 31, 2017).
The Group is currently evaluating the potential impact of adopting these standards and amendments on the Group, and is unable
to estimate the impact at this time.
IFRSs Title Mandatory effective date
(Fiscal year beginning on or after) To be adopted by the
Group Description of new standards
and amendments
IFRS 9 Financial Instruments January 1, 2018 April 1, 2018
Amendments for hedge accounting (amended in November 2013)
Amendments for the classification and measurement of financial instruments, and adoption of
expected credit loss impairment model for financial assets (amended in July 2014)
IFRS 15 Revenue from Contracts with Customers
January 1, 2018 April 1, 2018 Revised accounting standard for
revenue recognition and disclosure
IFRS 16 Leases January 1, 2019 April 1, 2019 Changes in definitions and
accounting treatment of leases
―17―
4. Segment Information
(1) Overview of Reportable Segments
The Group’s reportable segments are components for which separate financial information is available and which the
Management Committee evaluates regularly in deciding how to allocate resources and in assessing performance.
The Group maintains business divisions at the head office in accordance with the nature of its products and services. Each
business division formulates comprehensive internal and external strategies and operates worldwide.
Please note that for the year ended March 31, 2016, the Group had five segments, namely “Electronic Device Systems,” “Fine
Technology Systems,” “Science & Medical Systems,” “Industrial & IT Systems” and “Advanced Industrial Products,” but starting
from the year ended March 31, 2017, “Industrial & IT Systems” and “Fine Technology Systems” are integrated into “Industrial
Systems” to strengthen and deepen the cultivation of a business platform in Social and Industrial Infrastructure. With this change,
business segments are now classified into the following four segments: “Science & Medical Systems,” “Electronic Device
Systems,” “Industrial Systems” and “Advanced Industrial Products.”
Segment information for the year ended March 31, 2016, reflects this change in segment classification.
The main products and services of each segment are as follows:
Science & Medical Systems
Manufacture, sales, installation and maintenance services of various analytical instruments including spectrophotometers,
chromatographs, fluorescent X-ray analysis and thermal analysis systems, and electron microscopes, biotechnology products and
clinical analyzers.
Electronic Device Systems
Manufacture, sales, installation and maintenance services of semiconductor–related manufacturing equipment such as etching
systems, CD-Measurement SEMs, and inspection systems.
Industrial Systems
Sales of automated assembly systems for LIBs and other products, HDDs, power generation and transformation facilities,
design and development solutions, videoconferencing systems, and telecommunications equipment. Manufacture, sales,
installation and maintenance services of instruments and control systems, and related systems, railway inspection equipment, HD
manufacturing equipment, factory automation equipment, and FPD manufacturing equipment.
Advanced Industrial Products
Sales of automated assembly systems in steel products, and non-ferrous metal products, components for circuits, plastics, cell
materials and components, automotive components, silicon wafers, optical telecommunications device materials and components,
optical storage device materials and components, electronic components such as semiconductors, and oil products.
(2) Reportable Segment Information
The accounting methods applied to the business segments reported are generally the same as those described in Note 3 Summary
of Significant Accounting Policies. Intersegment transactions are generally based on prevailing market prices. Segment income is
measured by earnings before interest and taxes (EBIT).
Corporate property, plant and equipment and intangible assets cannot be allocated to particular reportable segments and are not
included in the assets of those segments. The related depreciation and amortization are included in segment income because they
constitute part of the corporate expenses allocated to each reportable segment.
Information relating to reportable segments is as follows:

―18―
Year ended March 31, 2016
Millions of yen
Reportable segments
Others
(Note 1) Adjustment Consolidated
Science &
Medical
Systems
Electronic
Device
Systems
Industrial
Systems
Advanced
Industrial
Products
Total
Revenues
External customers 176,356 102,424 95,184 254,228 628,192 1,113 (321) 628,984
Intersegment
revenues 640 287 3,365 2,594 6,886 914 (7,799) -
Total 176,997 102,711 98,549 256,822 635,078 2,027 (8,121) 628,984
Segment income (loss)
EBIT 26,571 15,307 1,130 3,457 46,465 (1,525) 3,270 48,209
Interest income
(Note 2) 293 - - - 293 - 116 409
Interest charges
(Note 2) - (287) (136) (335) (757) (6) 711 (52)
Income before
income taxes 26,864 15,020 994 3,122 46,000 (1,531) 4,097 48,566
Other income and
expenses
Depreciation and
amortization (4,314) (4,297) (1,196) (631) (10,437) (90) - (10,527)
Impairment losses
(Note 3) (1,540) - (233) - (1,773) (102) (15) (1,889)
Share of profits of
investments
accounted for using
the equity method
(Note 4)
- - (15) 101 87 - (35) 51
Segment assets 83,992 71,702 45,721 96,904 298,319 333 232,380 531,032
Other assets
Investments
accounted for
using the equity
method (Note 5)
- - 98 98 196 - 127 323
Capital expenditures
(Note 3) 3,975 3,537 1,272 1,108 9,892 30 1,315 11,237
Segment liabilities 29,081 24,387 23,976 60,491 137,935 139 71,905 209,979
Notes
1. Others represent businesses segments not included in the reportable segments, and they include indirect-support businesses.
2.
Interest income and charges incurred at each business segment are interests of intracompany loans payable. These interest
income and charges are offset, and the net amount represented as either interest income or charges in accordance with the net
amount since it is recognized on a net basis for internal management purposes. The adjustments for interest income and
interest charges are mainly for the head office, which are not attributable to any business segments, and reversal of interests on
intracompany loans payable.
3. Impairment losses and capital expenditure in Adjustments are corporate amounts not attributable to any business segments.
4.
For management purposes, share of profits of investments accounted for using the equity method is equivalent to the income
before income taxes of equity method associates, and the difference between these amounts and the amounts shown on the
consolidated financial statements is included in Adjustment.
5.
For management purposes, investments accounted for using the equity method in each business segment are initial
investments in equity method associates, and the difference between these amounts and the amounts shown on the
consolidated financial statements is included in Adjustment.

―19―
Year ended March 31, 2017
Millions of yen
Reportable segments
Others
(Note 1) Adjustment Consolidated
Science &
Medical
Systems
Electronic
Device
Systems
Industrial
Systems
Advanced
Industrial
Products
Total
Revenues
External customers 185,415 124,214 88,544 247,149 645,322 969 (1,746) 644,545
Intersegment
revenues 705 269 3,067 3,056 7,097 913 (8,010) -
Total 186,120 124,483 91,612 250,204 652,419 1,882 (9,757) 644,545
Segment income (loss)
EBIT 27,103 27,044 2,129 2,272 58,548 (1,101) (3,811) 53,636
Interest income
(Note 2) 373 - - - 373 - (47) 326
Interest charges
(Note 2) - (5) (109) (206) (319) (7) 283 (43)
Income before
income taxes 27,476 27,039 2,020 2,066 58,602 (1,108) (3,575) 53,918
Other income and
expenses
Depreciation and
amortization (4,465) (4,125) (1,134) (762) (10,487) (39) - (10,525)
Impairment losses
(Note 3) (1,807) (22) - (49) (1,878) - (2,241) (4,119)
Share of profits of
investments
accounted for using
the equity method
(Note 4)
- - 2 206 208 - (67) 141
Segment assets 88,172 75,344 47,281 103,225 314,022 910 272,819 587,751
Other assets
Investments
accounted for
using the equity
method (Note 5)
- - 98 98 196 - 187 383
Capital expenditures
(Note 3) 5,635 4,842 721 1,339 12,537 5 (528) 12,013
Segment liabilities 31,068 31,048 23,456 66,440 152,012 168 78,366 230,546
Notes
1. Others represent businesses segments not included in the reportable segments, and they include indirect-support businesses.
2.
Interest income and charges incurred at each business segment are interests of intracompany loans payable. These interest
income and charges are offset, and the net amount represented as either interest income or charges in accordance with the net
amount since it is recognized on a net basis for internal management purposes. The adjustments for interest income and
interest charges are mainly for the head office, which are not attributable to any business segments, and reversal of interests on
intracompany loans payable.
3. Impairment losses and capital expenditure in Adjustments are corporate amounts not attributable to any business segments.
4.
For management purposes, share of profits of investments accounted for using the equity method is equivalent to the income
before income taxes of equity method associates, and the difference between these amounts and the amounts shown on the
consolidated financial statements is included in Adjustment.
5.
For management purposes, investments accounted for using the equity method in each business segment are initial
investments in equity method associates, and the difference between these amounts and the amounts shown on the
consolidated financial statements is included in Adjustment.
―20―
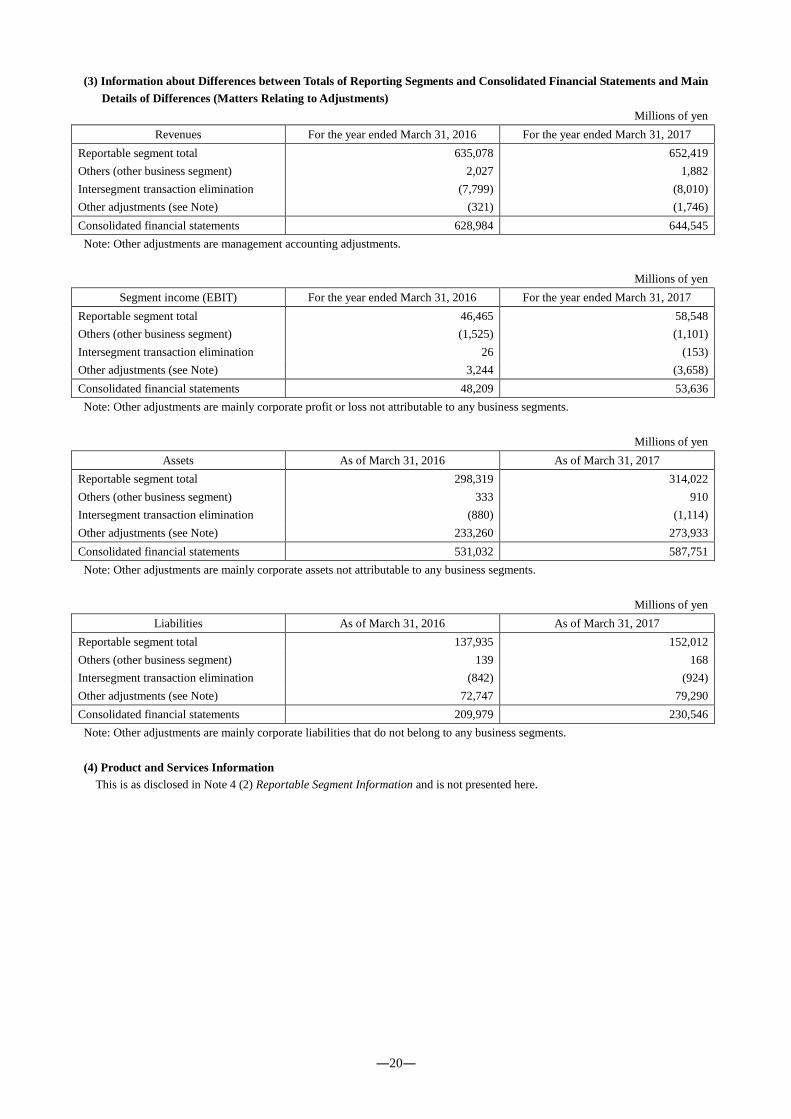
(3) Information about Differences between Totals of Reporting Segments and Consolidated Financial Statements and Main
Details of Differences (Matters Relating to Adjustments)
Millions of yen
Revenues For the year ended March 31, 2016 For the year ended March 31, 2017
Reportable segment total 635,078 652,419
Others (other business segment) 2,027 1,882
Intersegment transaction elimination (7,799) (8,010)
Other adjustments (see Note) (321) (1,746)
Consolidated financial statements 628,984 644,545
Note: Other adjustments are management accounting adjustments.
Millions of yen
Segment income (EBIT) For the year ended March 31, 2016 For the year ended March 31, 2017
Reportable segment total 46,465 58,548
Others (other business segment) (1,525) (1,101)
Intersegment transaction elimination 26 (153)
Other adjustments (see Note) 3,244 (3,658)
Consolidated financial statements 48,209 53,636
Note: Other adjustments are mainly corporate profit or loss not attributable to any business segments.
Millions of yen
Assets As of March 31, 2016 As of March 31, 2017
Reportable segment total 298,319 314,022
Others (other business segment) 333 910
Intersegment transaction elimination (880) (1,114)
Other adjustments (see Note) 233,260 273,933
Consolidated financial statements 531,032 587,751
Note: Other adjustments are mainly corporate assets not attributable to any business segments.
Millions of yen
Liabilities As of March 31, 2016 As of March 31, 2017
Reportable segment total 137,935 152,012
Others (other business segment) 139 168
Intersegment transaction elimination (842) (924)
Other adjustments (see Note) 72,747 79,290
Consolidated financial statements 209,979 230,546
Note: Other adjustments are mainly corporate liabilities that do not belong to any business segments.
(4) Product and Services Information
This is as disclosed in Note 4 (2) Reportable Segment Information and is not presented here.

―21―
(5) Geographical Information
(i) External Revenues
Millions of yen
For the year ended March 31, 2016 For the year ended March 31, 2017
Japan 255,743 249,795
North America 59,205 54,615
Europe 88,342 87,823
Asia 218,863 227,433
(China) 88,228 84,125
Others 6,831 24,880
Total 628,984 644,545
Note: Revenue information is based on customer location and classified by country or region.
(ii) Non-Current Assets
Non-current asset information is not presented as such assets are mostly located in Japan.
(6) Information about Major Customers
For the year ended March 31, 2016, two customer groups accounted for more than 10% of the Group’s net sales, with sales for all
segments to those customers amounting to ¥184,653 million. For the year ended March 31, 2017, two customer groups accounted
for more than 10% of the Group’s net sales, with sales for all segments to those customers amounting to ¥200,060 million.
―22―
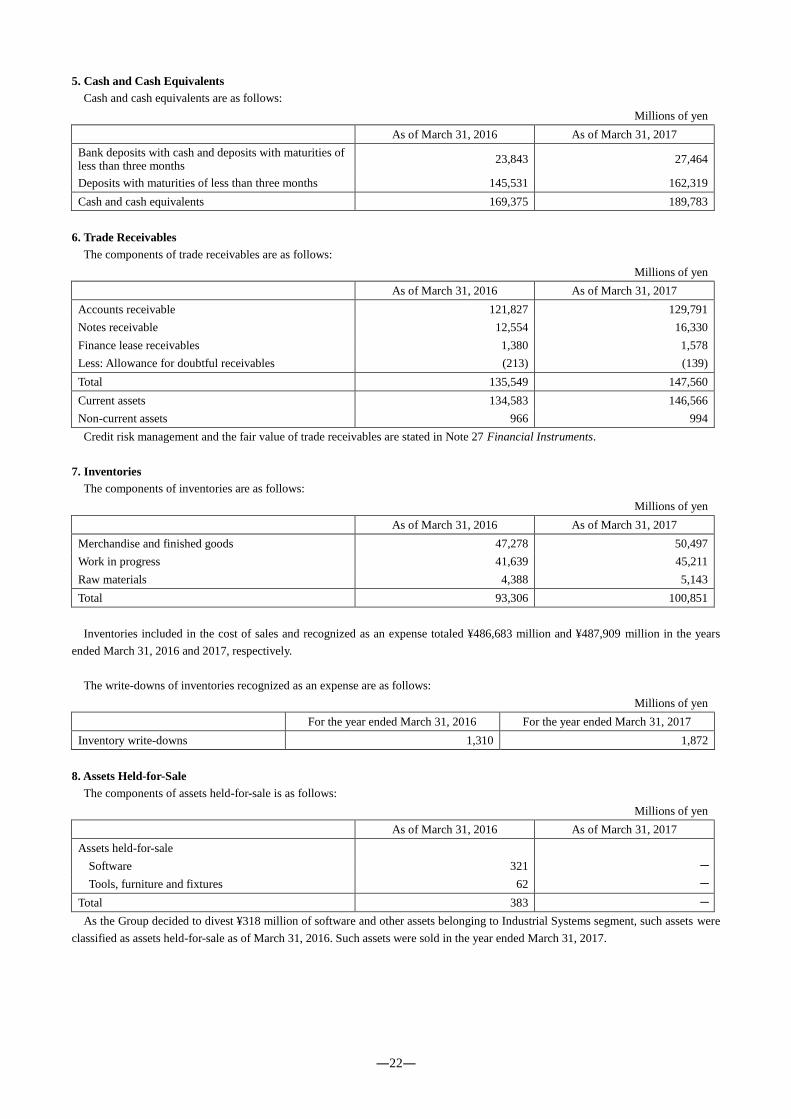
5. Cash and Cash Equivalents
Cash and cash equivalents are as follows:
Millions of yen
As of March 31, 2016 As of March 31, 2017
Bank deposits with cash and deposits with maturities of less than three months
23,843 27,464
Deposits with maturities of less than three months 145,531 162,319
Cash and cash equivalents 169,375 189,783
6. Trade Receivables
The components of trade receivables are as follows:
Millions of yen
As of March 31, 2016 As of March 31, 2017
Accounts receivable 121,827 129,791
Notes receivable 12,554 16,330
Finance lease receivables 1,380 1,578
Less: Allowance for doubtful receivables (213) (139)
Total 135,549 147,560
Current assets 134,583 146,566
Non-current assets 966 994
Credit risk management and the fair value of trade receivables are stated in Note 27 Financial Instruments.
7. Inventories
The components of inventories are as follows:
Millions of yen
As of March 31, 2016 As of March 31, 2017
Merchandise and finished goods 47,278 50,497
Work in progress 41,639 45,211
Raw materials 4,388 5,143
Total 93,306 100,851
Inventories included in the cost of sales and recognized as an expense totaled ¥486,683 million and ¥487,909 million in the years
ended March 31, 2016 and 2017, respectively.
The write-downs of inventories recognized as an expense are as follows:
Millions of yen
For the year ended March 31, 2016 For the year ended March 31, 2017
Inventory write-downs 1,310 1,872
8. Assets Held-for-Sale
The components of assets held-for-sale is as follows:
Millions of yen
As of March 31, 2016 As of March 31, 2017
Assets held-for-sale
Software 321 -
Tools, furniture and fixtures 62 -
Total 383 -
As the Group decided to divest ¥318 million of software and other assets belonging to Industrial Systems segment, such assets were
classified as assets held-for-sale as of March 31, 2016. Such assets were sold in the year ended March 31, 2017.

―23―
9. Property, Plant and Equipment
Changes in acquisition cost, accumulated depreciation, accumulated impairment losses and carrying amount of property, plant and
equipment are as follows:
(1) Acquisition cost Millions of yen
Buildings and
structures Machinery and
vehicles Tools, furniture
and fixtures Land
Construction in progress
Total
As of April 1, 2015 59,511 41,552 33,189 18,667 1,579 154,498
Acquisitions 243 661 580 - 7,496 8,980
Sales or disposals (595) (2,037) (1,872) (1) (3) (4,507)
Transfers from construction in progress
1,655 2,416 2,565 - (6,636) -
Currency translation effect (381) (577) (222) (4) (11) (1,195)
Other (5) (35) (266) - (769) (1,075)
As of March 31, 2016 60,428 41,982 33,974 18,663 1,656 156,702
Acquisitions 288 313 451 27 10,715 11,794
Increase due to business combination
1 17 5 - - 23
Sales or disposals (422) (2,133) (2,761) - (0) (5,317)
Transfers from construction in progress
2,650 3,105 3,530 321 (9,606) -
Currency translation effect (184) (14) (50) (11) (9) (268)
Other (172) (315) (1,244) (3) (678) (2,411)
As of March 31, 2017 62,589 42,954 33,905 18,997 2,078 160,524
(2) Accumulated depreciation and accumulated impairment losses Millions of yen
Buildings and
structures Machinery and
vehicles Tools, furniture
and fixtures Land
Construction in progress
Total
As of April 1, 2015 27,828 30,150 24,855 - - 82,833
Sales or disposals (504) (1,784) (1,821) - - (4,109)
Depreciation 2,168 3,238 2,551 - - 7,958
Impairment losses 16 19 69 - - 104
Currency translation effect (121) (309) (175) - - (605)
Other (2) (105) (125) - - (232)
As of March 31, 2016 29,385 31,210 25,354 - - 85,950
Increase due to business combination
0 7 2 - - 9
Sales or disposals (363) (1,950) (2,283) - - (4,595)
Depreciation 2,110 3,177 2,883 - - 8,171
Impairment losses 515 40 1 1,089 22 1,666
Currency translation effect (42) 35 (34) - - (41)
Other (138) (168) (1,137) - - (1,442)
As of March 31, 2017 31,469 32,351 24,787 1,089 22 89,717
(3) Carrying amount Millions of yen
Buildings and
structures Machinery and
equipment Tools, furniture
and fixtures Land
Construction in progress
Total
As of March 31, 2016 31,043 10,771 8,620 18,663 1,656 70,752
As of March 31, 2017 31,121 10,603 9,119 17,908 2,056 70,806
There are no ownership restrictions on property, plant and equipment.
Amounts for property, plant and equipment under construction are presented in construction in progress.
Details on impairment losses are stated in Note 21 Impairment Losses.
Commitments relating to acquisitions of property, plant and equipment are presented in Note 32 Commitments.
Depreciation is recognized in cost of sales and in selling, general and administrative expenses.

―24―
The carrying amounts of lease assets included in property, plant and equipment are as follows:
Millions of yen
Machinery and vehicles Tools, furniture and fixtures
As of March 31, 2016 267 150
As of March 31, 2017 177 109
10. Intangible Assets
Changes in acquisition cost, accumulated amortization, accumulated impairment losses and carrying amount of intangible assets are
as follows:
(1) Acquisition cost Millions of yen
Goodwill Software Other Total
As of April 1, 2015 4,286 22,576 6,780 33,641
Purchases - 1,018 16 1,034
Internal development - 1,065 - 1,065
Sales or disposals (60) (1,693) (51) (1,804)
Currency translation effect - (39) (49) (88)
Other - (744) (14) (758)
As of March 31, 2016 4,226 22,183 6,682 33,091
Purchases - 872 8 880
Internal development - 1,122 - 1,122
Increase due to business combination
265 1 14 281
Sales or disposals - (946) (33) (979)
Currency translation effect - (25) (3) (28)
Other - (2) - (2)
As of March 31, 2017 4,491 23,205 6,668 34,364
(2) Accumulated amortization and accumulated impairment losses Millions of yen
Goodwill Software Other Total
As of April 1, 2015 - 16,511 3,858 20,369
Sales or disposals - (1,389) (4) (1,393)
Amortization - 2,131 372 2,503
Impairment losses 1,540 154 90 1,785
Currency translation effect - (28) (33) (62)
Other - (427) (14) (441)
As of March 31, 2016 1,540 16,952 4,269 22,761
Sales or disposals - (913) (30) (943)
Amortization - 1,992 363 2,355
Impairment losses 2,310 - 8 2,318
Currency translation effect - (22) (1) (23)
Other - (0) - (0)
As of March 31, 2017 3,850 18,008 4,609 26,467
(3) Carrying amount Millions of yen
Goodwill Software Other Total
As of March 31, 2016 2,686 5,231 2,413 10,330
As of March 31, 2017 641 5,197 2,059 7,897

―25―
There are no ownership restrictions on intangible assets.
Details on impairment losses are stated in Note 21 Impairment Losses.
Amortization is recognized in the cost of sales and in selling, general and administrative expenses.
There are no significant intangible assets whose useful lives cannot be estimated.
The carrying amounts of internally generated intangible assets as of March 31, 2016 and 2017 were ¥1,808million and
¥2,135million, respectively, and recognized in the software account.
(4) Significant Intangible Assets
Significant intangible assets resulted from the acquisition of SII NanoTechnology Inc. (now named as Hitachi High-Tech
Science Corporation).
The carrying amounts of goodwill as of March 31, 2016 and 2017 were ¥2,686 million and ¥376 million, respectively.
The intangible assets related to such factors as technologies and customers identified through the business combination, and the
carrying amounts as of March 31, 2016 and 2017 were ¥2,121 million and ¥1,815 million, respectively.
Intangible assets are amortized using the straight-line method, and the remaining useful life is mainly five years.
(5) Tests for Impairment of Cash Generating Units including Goodwill
All significant goodwill in the Group is allocated to the Analytical Systems business of the Science & Medical Systems segment.
The carrying amount as of March 31, 2016 and 2017 were ¥2,686 million and ¥376 million, respectively.
Every year or when there are indications of impairment, the Company conducts the following impairment tests of cash
generating units to which goodwill is allocated.
The recoverable amount for the Analytical Systems business, a cash generating unit, is calculated by the value in use, with the
estimated future cash flows discounted to the present value, based on a three-year business plan that was prepared by reflecting
past experiences and external information approved by management. Management assumes a future cash flow growth rate of zero
beyond the three year business plan. The discount rate before taxes is based on the weighted average cost of capital of other
companies in the same industry, and this rate as of March 31, 2016 and 2017 was 6.0%.
If there is a reasonable change in major assumptions for tests for impairment, such as the decrease of future cash flows or the
hike of discount rate, it is likely that additional impairment losses will be recognized.
For the years ended March 31, 2016 and 2017, the Company recognized impairment losses, which are described in Note 21
Impairment Losses.
11. Investments Accounted for Using the Equity Method
The Group uses the equity method to account for its investments in the following associates.
Company name Principal business Segment Ownership percentage (%)
As of March 31, 2016 As of March 31, 2017
Giesecke & Devrient K.K.
Selling and developing IC cards and other Giesecke & Devrient products in the Japanese market
Advanced Industrial Products
49.0 49.0
Chorus Call Asia Corporation Providing video and audio conferencing services
Industrial Systems 49.0 49.0
Note: Summary financial information is not presented because it is insignificant.

―26―
12. Deferred Taxes and Income Taxes
(1) Details of the main components and changes in deferred tax assets and deferred tax liabilities are as follows:
Millions of yen
As of March 31,
2015 Recognized in profit or loss
Recognized in other
comprehensive income
Change in scope of consolidation
(see Note 1)
As of March 31, 2016
Deferred tax assets
Inventories 3,704 (458) - (37) 3,209
Depreciation and amortization 1,954 78 - 21 2,053
Impairment losses 910 (910) - - -
Accrued expenses 4,981 (440) - (20) 4,521
Retirement and severance benefits (see Note 2)
15,206
(2,667)
2,474
(436)
14,577
Carryforward of unused tax losses
24
(15)
-
(2)
8
Other 3,055 (378) (528) (95) 2,054
Total deferred tax assets 29,835 (4,789) 1,946 (569) 26,421
Deferred tax liabilities
Deferred profit on sale of properties
(724)
138
-
-
(586)
FVTOCI financial assets (3,408) - 588 16 (2,805)
Other (1,383) 27 - (1) (1,357)
Total deferred tax liabilities (5,515) 165 588 15 (4,747)
Notes: 1. Changes in foreign currency translation differences are included in the change in the scope of consolidation.
2. In the transition to defined contribution pension plans, the asset to be transitioned is recognized in retirement and
severance benefits.
Millions of yen
As of March 31,
2016 Recognized in profit or loss
Recognized in other
comprehensive income
Change in scope of consolidation
(see Note 1)
As of March 31, 2017
Deferred tax assets
Inventories 3,209 451 - 0 3,660
Depreciation and amortization 2,053 876 - 1 2,931
Accrued expenses 4,521 861 - (1) 5,380
Retirement and severance benefits (see Note 2)
14,577
(1,404)
(2,052)
2
11,124
Carryforward of unused tax losses
8
17
-
(0)
25
Other 2,054 747 29 (2) 2,828
Total deferred tax assets 26,421 1,548 (2,023) 1 25,948
Deferred tax liabilities
Deferred profit on sale of properties
(586)
41
-
-
(545)
FVTOCI financial assets (2,805) - 1,183 1 (1,621)
Other (1,357) 140 223 (4) (999)
Total deferred tax liabilities (4,747) 181 1,406 (3) (3,164)
Notes: 1. Changes in foreign currency translation differences are included in the change in the scope of consolidation.
2. In the transition to defined contribution pension plans, the asset to be transitioned is recognized in retirement and
severance benefits.

―27―
In recognizing deferred tax assets, the Group considers whether it can use all or part of future deductible temporary differences
or carryforward unused tax losses with respect to future taxable income. In evaluating the recoverability of deferred tax assets, the
Group considers the planned reversal of deferred tax liabilities, expected future taxable income, and tax planning. For recognized
deferred tax assets, the Group has determined that there is a high probability of materializing tax benefits based on historical
taxable income levels and on future taxable income projections for the period in which it can recognize deferred tax assets.
However, they would similarly be a decrease in deferred tax assets that the Group considers recognizable if future projected taxable
income declines during the period in which deductions are possible.
Deferred tax assets and deferred tax liabilities in the consolidated statements of financial position are as follows:
Millions of yen
As of March 31, 2016 As of March 31, 2017
Deferred tax assets 21,761 22,805
Deferred tax liabilities (87) (21)
(2) Future Deductible Temporary Differences and Carryforward of Unused Tax Losses for Unrecognized Deferred Tax
Assets
Future deductible temporary differences and carryforward of unused tax losses for unrecognized deferred tax assets are as
follows:
Millions of yen
As of March 31, 2016 As of March 31, 2017
Future deductible temporary differences 9,831 11,267
Carryforward of unused tax losses 4,885 4,551
Total 14,716 15,818
The carryforward of unused tax losses for unrecognized deferred tax assets will expire as follows:
Millions of yen
As of March 31, 2016 As of March 31, 2017
First year - -
Second year - -
Third year - -
Fourth year - 45
Fifth and subsequent years 4,885 4,506
Total 4,885 4,551
(3) Temporary Differences Relating to Investments in Subsidiaries for Unrecognized Deferred Tax Liabilities
On March 31, 2016 and 2017, future taxable temporary differences relating to investments in subsidiaries with unrecognized
deferred tax liabilities totaled ¥37,469 million and ¥41,285 million, respectively. Deferred tax liabilities are unrecognized because
the Group can control the timing of temporary difference reversals and because there is a high possibility that temporary
differences will not be eliminated in the foreseeable future.
(4) Income Taxes
Details of income taxes are as follows:
Millions of yen
For the year ended March
31, 2016 For the year ended March
31, 2017
Current tax expense 7,951 15,483
Deferred tax expense
Temporary differences and eliminations
3,043
(2,355)
Recoverability of deferred tax assets 741 626
Change in tax rates 840 -
Total deferred tax expenses 4,624 (1,728)
Income taxes 12,575 13,755

―28―
(5) Reconciliation of Effective Statutory Tax Rate
The reconciliation of the effective statutory tax rate with the actual tax rate is as follows:
For the year ended March
31, 2016 For the year ended March
31, 2017
Effective statutory tax rate 33.1 % 30.9 %
Non-deductible costs 0.7 % 0.9 %
Tax credit (4.6) % (7.9) %
Different tax rates applied to foreign subsidiaries (1.1) % (0.7) %
Downward revision in deferred tax assets due to tax rate change 1.7 % -
Change in recoverable deferred tax assets 1.5 % 1.2 %
Acquisition of subsidiary (6.1) % -
Other 0.6 % 1.2 %
Actual tax rate 25.9 % 25.5 %
The Company is subject mainly to corporate, inhabitant, and enterprise taxes. The effective statutory tax rates calculated based
on these taxes were 33.1% and 30.9% for the years ended March 31, 2016 and 2017, respectively. Foreign subsidiaries are subject
to income taxes at their locations, while the Company and domestic subsidiaries have adopted the consolidated taxation system.
The “Act for Partial Amendment of the Income Tax Act, etc.”(Act No.15 of 2016) and the “Act for Partial Amendment of the
Local Tax Act, etc.”(Act No.13 of 2016) were enacted on March 29, 2016. In line with this change, the effective statutory tax rate
used to calculate deferred tax assets and deferred tax liabilities decreased from 32.3% to 30.9% for the temporary differences
expected to be realized or settled, in the fiscal year starting on April 1, 2016 and the fiscal year starting on April 1, 2017 with the
effective statutory tax rate changing to 30.6%, for the temporary differences expected to be realized or settled from the fiscal year
starting on April 1, 2018.
13. Trade Payables
Details of trade payables are as follows:
Millions of yen
As of March 31, 2016 As of March 31, 2017
Accounts payable 109,432 111,387
Notes payable 543 9,955
Total 109,975 121,342
Liquidity risk management and the fair value of trade payables are stated in Note 27 Financial Instruments.

―29―
14. Provisions
Changes in the balance and components of provisions are as follows:
Millions of yen
Asset retirement obligations Product warranty provisions Total
As of March 31, 2016 748 2,531 3,279
Additions 130 1,064 1,193
Provisions used (13) (1,288) (1,301)
Provisions reversed - (50) (50)
Interest cost for discount 13 - 13
Currency translation effects 0 (6) (6)
As of March 31, 2017 878 2,250 3,128
Current liabilities 25 1,615 1,640
Non-current liabilities 853 635 1,488
(i) Asset Retirement Obligations
To settle the obligation of restoring and removing hazardous substances from plant facilities and premises that the Group uses,
the Group recognizes the estimated amount based on the estimated future expenditures calculated based on estimates from third
parties. These expenses are expected to be paid after one year or more, however, they may be affected by future business plans.
(ii) Product Warranty Provisions
To provide for the costs of after-sales service for the Group’s products, the Group recognizes estimated service costs within the
warranty period based on historical experience. These expenses are used over the warranty period (principally within three years).
15. Retirement and Severance Benefits
The Company and certain domestic subsidiaries have maintained defined benefit pension plans and severance lump-sum payment
plans as defined benefit corporate pension plans and transitioned in part to a defined contribution pension plan on October 1, 2015.
Some foreign subsidiaries have defined benefit pension plans, while some have defined contribution plans. Certain defined benefit
corporate pension plans adopt cash-balance plans.
In the transition to defined contribution pension plans, the Company recognized gain from the transition to defined contribution
pension plans during the year ended March 31, 2016.
The asset is scheduled to be transitioned for four years and the asset to be transitioned is recognized in other current liabilities and in
other non-current liabilities in the consolidated statements of financial position.
In the consolidated statement of cash flows, the net amount of the decrease in retirement benefit and the increase or decrease in other
financial liabilities related to the asset to be transitioned is recognized in decrease in retirement and severance benefits.
The benefits of defined benefit plans are predetermined based on conditions, such as points employees have gained in compensation
for each year of service, the payment rate in retirement, years of service and average salaries in their final years of service before
retirement. Some employees receive additional severance payments at the time of retirement.
Funded defined benefit plans are administrated by the fund that is a separate legal entity from the Company under the law. The
pension fund board and trustee of the plan are required by law to act in the best interests of the plan participants, and are responsible
for managing plan assets in accordance with the designated investment strategy.
Pursuant to the Japanese Defined Benefit Corporate Pension Plan Act, the Company endeavors to maintain the pension financing
balance for future benefits by regularly reviewing the financial condition of the pension plan and recalculating contributions.
The Company has future obligations to make contributions as defined by the fund. The contribution amount is periodically reviewed
to the extent legally allowed.
Severance lump-sum payment plans provide a lump-sum payment at the time of retirement, and the Company has an obligation to
pay benefits directly to beneficiaries.
These defined benefit plans expose the Group to actuarial risks.
The Group plans to allocate ¥1,883 million in contributions for the fiscal year ending March 31, 2018.
Defined contribution plans require a fixed amount of contribution over a participation period and plan participants themselves are
responsible for the management of plan assets. Benefits are paid by the trustees, and the Company’s responsibility is limited to making
contributions.

―30―
(1) Defined Benefit Plans
(i) Net Liabilities (Assets) of Defined Benefit Plans
Amounts recognized in the consolidated statements of financial position are as follows and the amounts recognized as defined
benefit pension plans are presented in other non-current liabilities in the consolidated statements of financial position:
Millions of yen
Present value of defined benefit plan obligations
Fair value of plan assets Net defined benefit plan
obligations (assets)
As of April 1, 2015 133,550 (89,578) 43,972
Amounts recognized in profit or loss
Service cost 4,499 - 4,499
Interest cost (income) 1,326 (983) 343
Gain on transition to defined contribution pension plans
(3,799) - (3,799)
Total 2,026 (983) 1,043
Amounts recognized in OCI
Remeasurement
Actuarial gains and losses arising from changes in demographic assumptions
528
-
528
Actuarial gains and losses arising from changes in financial assumptions
6,106
-
6,106
Actuarial gains and losses arising from actual adjustments
1,274
-
1,274
Return on plan assets (excluding interest income)
-
1,517
1,517
Total 7,909 1,517 9,425
Other
Contributions by the employer - (3,293) (3,293)
Benefits paid (5,876) 3,590 (2,286)
Reduction due to transition to defined contribution pension plans
(15,608) - (15,608)
Currency translation effects (719) 448 (271)
Total (22,203) 746 (21,457)
As of March 31, 2016 121,282 (88,299) 32,983
Amounts recognized in profit or loss
Service cost 4,070 - 4,070
Interest cost (income) 751 (591) 160
Total 4,821 (591) 4,230
Amounts recognized in OCI
Remeasurement
Actuarial gains and losses arising from changes in demographic assumptions
181
-
181
Actuarial gains and losses arising from changes in financial assumptions
(1,459)
-
(1,459)
Actuarial gains and losses arising from actual adjustments
(1,394)
-
(1,394)
Return on plan assets (excluding interest income)
-
(4,184)
(4,184)
Total (2,672) (4,184) (6,856)
Other
Contributions by the employer - (3,093) (3,093)
Benefits paid (4,736) 3,448 (1,288)
Currency translation effects 36 (59) (23)
Other (30) - (30)
Total (4,729) 295 (4,434)
As of March 31, 2017 118,701 (92,778) 25,923

―31―
The Company’s funding takes into account such factors as limits on tax deductions, the fund status of plan assets, and actuarial
assumptions. Contributions to plan assets are intended to cover future benefits as well as those for service that has already been
provided. In addition, the Company may contribute cash to a retirement allowance trust as a reserve for shortfalls in funding for
benefit obligations at the end of the fiscal year.
Management of the Company’s plan assets aims to secure the payment of benefits to beneficiaries (including future pension
beneficiaries) and optimize the value of plan assets within acceptable range of risks. The Company’s management of plan assets
factors in risks and returns for investment assets and includes formulating a policy asset mix that is optimal for the future,
selecting trustees, and monitoring asset allocation.
The Company periodically reviews the policy asset mix to accommodate changes in the market environment from initial
assumptions and changes in the funded status.
The Company targets an asset allocation mix of 19% for equities, 38% for bonds, and 43% for other instruments.
(ii) Main Plan Asset Components
Details of the major components of plan assets are as follows:
Millions of yen
As of March 31, 2016
With quoted market price
in an active market With no quoted market
price in an active market Total
Cash and cash equivalents 709 - 709
Equities 3,005 - 3,005
Bonds 1,100 1,729 2,829
Hedge funds - 25,746 25,746
Private assets - 4,590 4,590
Securitization products - 1,696 1,696
Life insurance general accounts - 1,594 1,594
Comingled funds (see Note) - 46,834 46,834
Other 116 1,181 1,297
Total 4,930 83,369 88,299
Note: Commingled funds comprised 35% in listed equities, 25% in national government bonds, 22% in other bonds, and 18% in
other assets.
Millions of yen
As of March 31, 2017
With quoted market price
in an active market With no quoted market
price in an active market Total
Cash and cash equivalents 2,040 - 2,040
Equities 3,428 - 3,428
Bonds 1,219 1,966 3,186
Hedge funds - 29,994 29,994
Private assets - 10,276 10,276
Securitization products - 1,256 1,256
Life insurance general accounts - 1,622 1,622
Comingled funds (see Note) - 39,683 39,683
Other 43 1,251 1,294
Total 6,730 86,048 92,778
Note: Commingled funds comprised 44% in listed equities, 18% in national government bonds, 23% in other bonds, and 15% in
other assets.

―32―
(iii) Actuarial Assumptions
The major actuarial assumptions at the end of reporting periods are as follows:
For the year ended March 31, 2016 For the year ended March 31, 2017
Discount rates 0.6 % 0.8 %
The weighted average duration of defined benefit plan obligations for the years ended March 31, 2016 and 2017 were 14.0
years and 13.9 years, respectively.
(iv) Sensitivity Analysis for Defined Benefit Plan Obligations
Based on the assumption that all other variables were held constant, the impacts on defined benefit plan obligations of a 0.5
percentage point increase or decrease in the discount rate as March 31, 2016 and 2017 are as follows. In reality, changes in other
assumptions may affect the outcome of the analysis.
Millions of yen
For the year ended March 31, 2016 For the year ended March 31, 2017
0.5 percentage point increase
0.5 percentage point decrease
0.5 percentage point increase
0.5 percentage point decrease
Effects of changes in discount rate (7,903) 7,382 (7,748) 8,548
(2) Defined Contribution Plans
The Company has recognized expenses (continuing operations) on defined contribution plans of ¥892 million and ¥1,409
million for the years ended March 31, 2016 and 2017, respectively.

―33―
16. Equity and Other Capital Items
(a) Changes in Total Number of Authorized Shares, Shares Issued, and Treasury Stock
Number of shares
For the year ended March 31, 2016 For the year ended March 31, 2017
Number of authorized shares
Balance at beginning of year 350,000,000 350,000,000
Changes - -
Balance at end of year 350,000,000 350,000,000
Total number of issued shares
Balance at beginning of year 137,738,730 137,738,730
Changes - -
Balance at end of year 137,738,730 137,738,730
Number of treasury stock
Balance at beginning of year 206,223 208,212
Changes (Note 3) 1,989 1,629
Balance at end of year 208,212 209,841
Notes:
1. The shares that the Company issues are ordinary shares with non-par value.
2. Issued shares are fully paid.
3. For the year ended March 31, 2016, the number of shares increased by 1,989, which consisted of purchase of 1,989 shares. For
the year ended March 31, 2017, the number of shares increases by 1,629, which consists of purchase of 1,629 shares.
(2) Capital Surplus
The main component of capital surplus is legal reserve.
Legal Reserve
The Japanese Company Law (JCL) requires that at least half of paid-in capital be appropriated as common stock and the rest be
appropriated as a legal reserve within capital surplus. Under the JCL, The legal reserve can be incorporated in common stock by
resolution at a shareholders’ meeting.
(3) Retained Earnings
Retained earnings comprise the following categories:
(i) Earned Reserves
The JCL requires that 10% of the retained earnings appropriated for dividends be retained until the total amount of earned
reserves included in legal reserve and earned reserves reaches a quarter of the nominal value of common stock. The accumulated
earned reserves can be appropriated for deficit disposition. In addition, earned reserves may be available for dividends by
resolution at the shareholders' meeting.
(ii) Other Retained Earnings
Other retained earnings are earned and undistributed by the Group.
(4) Accumulated Other Comprehensive Income
(i) Net Changes in Financial Assets Measured at Fair Value through OCI
These are the differences between the acquisition cost and fair value of FVTOCI financial assets.
(ii) Remeasurement of Defined Benefit Plans
Actuarial gains and losses are the effects of differences between actuarial assumptions at the beginning of the year and what has
actually occurred, and the effects of changes in actuarial assumptions.
(iii) Foreign Currency Translation Adjustments
These adjustments result from converting the financial statements of foreign operations into the Group’s presentation currency.
(iv) Net Changes in Cash Flow Hedges
These are the portions deemed effective of net changes in the fair value of derivative financial instruments designated as cash
flow hedges.

―34―
17. Dividends
(1) Dividend Payments
Decision Share class Appropriation
from Cash dividends
(Millions of yen) Cash dividends per share (Yen)
Record date Effective date
The Board of Directors on May 25, 2015
Common stock Retained earnings
3,438 25.00 March 31, 2015 June 3, 2015
The Board of Directors on October 26, 2015
Common stock Retained earnings
3,438 25.00 September 30,
2015 November 30,
2015
The Board of Directors on May 25, 2016
Common stock Retained earnings
5,501 40.00 March 31, 2016 June 3, 2016
The Board of Directors on October 27, 2016
Common stock Retained earnings
4,814 35.00 September 30,
2016 November 30,
2016
(2) Dividends on common stock for which the record date falls in the fiscal year ended March 31, 2017, and the effective date
falls in the following fiscal year are as follows:
Decision Share class Appropriation
from Cash dividends
(Millions of yen) Cash dividends per share (Yen)
Record date Effective date
The Board of Directors on May 24, 2017
Common stock Retained earnings
6,189 45.00 March 31, 2017 June 2, 2017
18. Selling, General and Administrative Expenses
Details of selling, general and administrative expenses are as follows:
Millions of yen
For the year ended March 31, 2016 For the year ended March 31, 2017
Personnel expenses (42,211) (42,041)
Research and development expenses (16,097) (19,287)
Depreciation and amortization (4,511) (4,199)
Other (31,126) (31,966)
Total (93,945) (97,493)
19. Personnel Expenses
Details of personnel expenses are as follows:
Millions of yen
For the year ended March 31, 2016 For the year ended March 31, 2017
Salaries (61,149) (61,106)
Employees’ bonuses (20,810) (22,043)
Retirement benefit expenses (5,734) (5,639)
Legal and employee benefits expense (12,078) (12,223)
Extra retirement payments (978) (620)
Total (100,750) (101,630)
Note: Personnel expenses are included in cost of sales, selling, general and administrative expenses, and other expenses.
20. Research and Development Expenses
Research and development expenses are as follows:
Millions of yen
For the year ended March 31, 2016 For the year ended March 31, 2017
Research and development expenses (20,163) (23,581)
Note: Research and development expenses are included in cost of sales and in selling, general and administrative expenses.

―35―
21. Impairment Losses
The components of impairment losses by asset category are as follows:
Millions of yen
For the year ended March 31, 2016 For the year ended March 31, 2017
Property, plant and equipment (104) (1,666)
Intangible assets (1,785) (2,318)
Other - (134)
Total (1,889) (4,119)
Impairment losses are included in other expenses.
The component of impairment losses by reportable segment is described in Note 4 Segment Information.
Information on main impairment losses recognized for the fiscal years ended March 31, 2016 and 2017 is as follows:
For the year ended March 31, 2016, the Company did not conclude that the profit as projected for the goodwill allocated to the
Analytical Systems business in the Science & Medical Systems segments was expected. The Company therefore recognized
impairment loss. The recoverable amount of this asset was measured at value in use. The value in use was calculated by discounting
the estimated future cash flows by 6.0%.
For the year ended March 31, 2017, the difference between recoverable amounts and book values of buildings, land and other assets
held by the Group which did not belong to any segment was recognized as impairment loss, as their usage is outside the scope of the
previously intended usage due to the decision to sell these assets and consequently recovery of the investment is no longer expected.
The recoverable amounts of these assets were based on the appraisal values provided by a licensed real estate appraiser and were
measured at the fair value after deducting estimated disposal costs.
The Company does not conclude that the profit as projected for the goodwill allocated to the Analytical Systems business in the
Science & Medical Systems segments is expected. The Company therefore recognized impairment loss. The recoverable amount of
these assets was measured at the value in use. The value in use was calculated by discounting the estimated future cash flows by 6.0%.
22. Other Income and Expenses
The components of other income are as follows:
Millions of yen
For the year ended March 31, 2016 For the year ended March 31, 2017
Gain on transition to defined contribution pension plans (Note 1)
3,799 -
Reversal of allowance for doubtful receivables 132 66
Gain on sale of property, plant and equipment, intangible assets (Note 2)
412 349
Other 627 264
Total 4,969 680
Notes:
1. Details of gain on transition to defined contribution pension plans are described in Note 15 Retirement and Severance Benefits.
2. Gain on sale of assets held-for-sale is included.
The components of other expenses are as follows:
Millions of yen
For the year ended March 31, 2016 For the year ended March 31, 2017
Impairment losses (Note) (1,889) (4,119)
Loss on sale and disposal of property, plant and equipment, and intangible assets
(324) (677)
Other (447) (49)
Total (2,660) (4,845)
Note: Details of impairment losses are described in Note 21 Impairment Losses.

―36―
23. Financial Income and Expenses
Interest income and interest charges are related to financial assets and liabilities measured at amortized cost.
The components of financial income, except interest income, are as follows:
Millions of yen
For the year ended March 31, 2016 For the year ended March 31, 2017
Dividends income
FVTOCI financial assets 288 329
Gain on sale of financial instruments
FVTPL financial assets 24 2
Foreign exchange gains - 333
Total 312 664
The components of financial expenses, except interest charges, are as follows:
Millions of yen
For the year ended March 31, 2016 For the year ended March 31, 2017
Loss on valuation of financial instruments
FVTPL financial assets (32) (30)
Foreign exchange losses (1,278) -
Other (201) (246)
Total (1,510) (276)
24. Earnings per Share
Basic earnings per share attributable to Hitachi High-Technologies Corporation stockholders is calculated based on the
following information:
For the year ended March 31, 2016 For the year ended March 31, 2017
Net income attributable to Hitachi High- Technologies Corporation stockholders (millions of yen)
35,989 40,170
Basic weighted average number of ordinary shares 137,531,377 137,529,777
Basic earnings per share attributable to Hitachi High-Technologies Corporation stockholders (yen)
261.68 292.08
Note: Basic and diluted earnings per share attributable to Hitachi High-Technologies Corporation stockholders are the same,
as there were no dilutive potential ordinary shares.

―37―
25. Other Comprehensive Income
Amounts arising, reclassification adjustment, and tax effect for each component of OCI for the years ended March 31, 2016 and
2017 are as follows:
Millions of yen
For the year ended March 31, 2016 For the year ended March 31, 2017
Items not to be reclassified into net income
Net changes in financial assets measured at FVTOCI
Amounts arising (1,340) 3,902
Before tax effect adjustment (1,340) 3,902
Tax effect 588 (1,217)
Net changes in financial assets measured at FVTOCI
(752)
2,684
Remeasurements of defined benefit plans
Amounts arising (9,425) 6,856
Before tax effect adjustment (9,425) 6,856
Tax effect 2,474 (2,052)
Remeasurements of defined benefit plans (6,951) 4,805
Total items not to be reclassified into net income (7,704) 7,489
Items that can be reclassified into net income
Foreign currency translation adjustments
Amounts arising (3,157) (666)
Net changes in cash flow hedges
Amounts arising 137 1,372
Reclassification adjustment 1,523 (2,185)
Before tax effect adjustment 1,660 (814)
Tax effect (528) 252
Net changes in cash flow hedges 1,132 (562)
Total items that can be reclassified into net income (2,025) (1,228)
OCI (9,729) 6,260
26. Non-Cash Transactions
Details of significant non-cash transactions are as follows:
Millions of yen
For the year ended March 31, 2016 For the year ended March 31, 2017
Property, plant and equipment acquired under finance leases
56
40

―38―
27. Financial Instruments
(1) Financial Risk Management Policy
The Group is exposed to financial risks (credit, liquidity, and market risks) in the course of business, and manages risks based on
a specific policy to avoid or reduce such risks.
The Group uses derivative transactions to avoid the risk of cash flow fluctuations resulting from fluctuations in foreign exchange
markets, and does not transact derivatives for speculative purposes.
(2) Credit Risk
The Group is exposed to customer credit risk for trade receivables acquired in the course of business. Investments in debt
securities held for managing cash surplus and equity securities held for strategic purposes are exposed to credit risk of the issuers.
Forward exchange contracts that the Group enters into to hedge against foreign-exchange market fluctuation risks are exposed to
credit risk of the counterparty financial institutions.
In accordance with our business criteria, the Company decides whether or not to engage in transactions and determines credit
limits and terms and conditions. The Company also undertakes conservation measures that include acquiring collateral. After
receivables are recognized, operating and administrative divisions share information on the status of transactions in managing
payments by due dates. The Company conducts periodic credit checks and reviews whether or not to continue transactions or
assesses whether credit limits and terms and conditions are adequate. In principle, the Company limits investments of cash
surpluses to bonds with issuer credit ratings of at least investment grade and to deposits with financial institutions. In principle,
forward exchange contracts are entered into only with internationally recognized financial institutions with at least an A rating. The
Company prevents a significant concentration of credit risk by engaging in transactions with multiple financial institutions. The
Company periodically confirms its reasons for holding equities and other instruments held for policy purposes and evaluates
issuers and their financial positions.
Except for guaranty obligations, the Group’s maximum exposure to credit risk if collateral held and other credit enhancements
are not included is equal to the financial assets’ carrying amount after impairment in the consolidated statements of financial
position. The maximum exposure to the credit risk from guaranty obligations is the guaranteed debt described in Note 33
Contingencies.
At March 31, 2016 and 2017, the Group considers that unimpaired financial assets were all collectible.
The analyses of the aging of trade receivables that are past due but not impaired as of March 31, 2016 and 2017 are as follows.
The financial assets include amounts considered recoverable through credit insurance and collateral.
Millions of yen
As of March 31, 2016 As of March 31, 2017
Past due within 30 days 2,344 2,383
Past due between 31 and 90 days 573 221
Past due between 91 days and 1 year 143 69
Past due over 1 year - 19
Total 3,060 2,693
Security deposits accepted as credit enhancements for trade receivables amounted to ¥2,572 million and ¥2,560 million as of
March 31, 2016 and 2017, respectively.
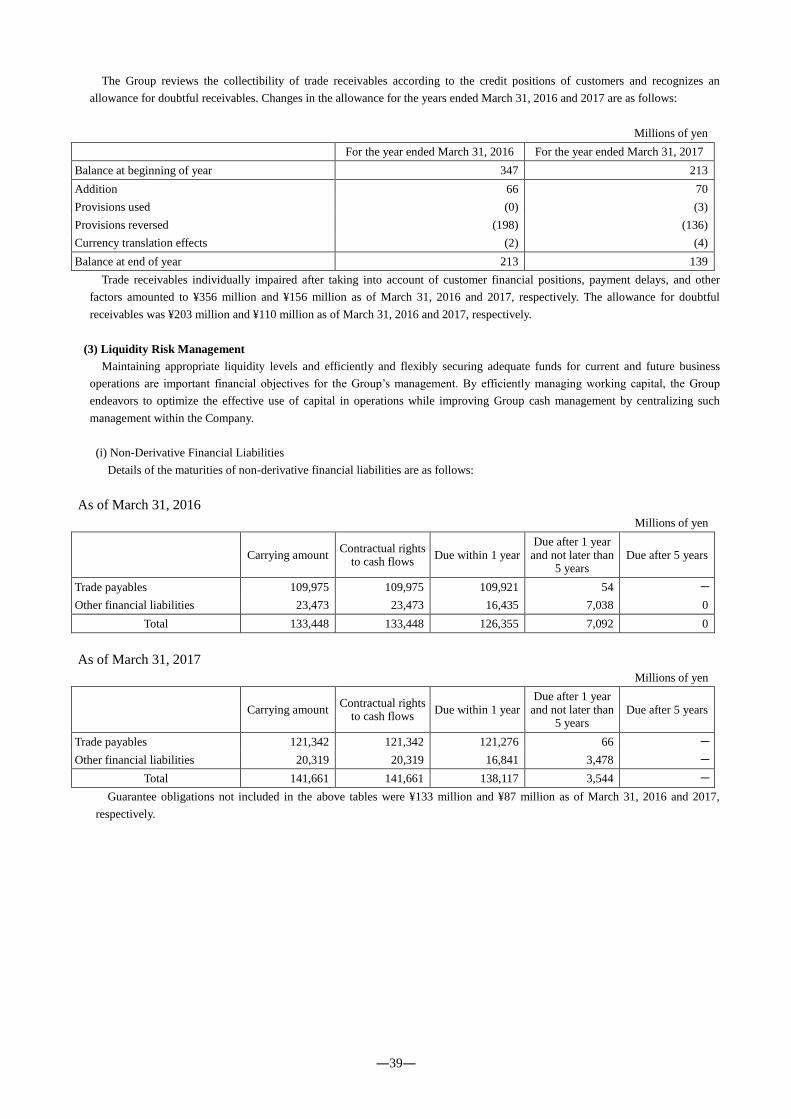
―39―
The Group reviews the collectibility of trade receivables according to the credit positions of customers and recognizes an
allowance for doubtful receivables. Changes in the allowance for the years ended March 31, 2016 and 2017 are as follows:
Millions of yen
For the year ended March 31, 2016 For the year ended March 31, 2017
Balance at beginning of year 347 213
Addition 66 70
Provisions used (0) (3)
Provisions reversed (198) (136)
Currency translation effects (2) (4)
Balance at end of year 213 139
Trade receivables individually impaired after taking into account of customer financial positions, payment delays, and other
factors amounted to ¥356 million and ¥156 million as of March 31, 2016 and 2017, respectively. The allowance for doubtful
receivables was ¥203 million and ¥110 million as of March 31, 2016 and 2017, respectively.
(3) Liquidity Risk Management
Maintaining appropriate liquidity levels and efficiently and flexibly securing adequate funds for current and future business
operations are important financial objectives for the Group’s management. By efficiently managing working capital, the Group
endeavors to optimize the effective use of capital in operations while improving Group cash management by centralizing such
management within the Company.
(i) Non-Derivative Financial Liabilities
Details of the maturities of non-derivative financial liabilities are as follows:
As of March 31, 2016
Millions of yen
Carrying amount Contractual rights
to cash flows Due within 1 year
Due after 1 year and not later than
5 years Due after 5 years
Trade payables 109,975 109,975 109,921 54 -
Other financial liabilities 23,473 23,473 16,435 7,038 0
Total 133,448 133,448 126,355 7,092 0
As of March 31, 2017
Millions of yen
Carrying amount Contractual rights
to cash flows Due within 1 year
Due after 1 year and not later than
5 years Due after 5 years
Trade payables 121,342 121,342 121,276 66 -
Other financial liabilities 20,319 20,319 16,841 3,478 -
Total 141,661 141,661 138,117 3,544 -
Guarantee obligations not included in the above tables were ¥133 million and ¥87 million as of March 31, 2016 and 2017,
respectively.

―40―
(ii) Derivatives
Details of the maturities derivatives are as follows:
As of March 31, 2016
Millions of yen
Due within 1 year Due after 1 year
and not later than 5 years
Due after 5 years Total
Forward exchange contracts In 1,000 - - 1,000
Out 59 - - 59
As of March 31, 2017
Millions of yen
Due within 1 year Due after 1 year
and not later than 5 years
Due after 5 years Total
Forward exchange contracts In 25 - - 25
Out 361 - - 361
(4) Market Risk Management
(i) Foreign Currency Fluctuation Risk
The Group holds assets and liabilities denominated in foreign currencies, and it is exposed to foreign currency fluctuation risk.
The Group addresses this risk by appropriately measuring the net future cash flows per currency and entering into forward
exchange contracts within that scope to fix future cash flows arising from assets, liabilities, commitments, and forecasted
transactions denominated in foreign currencies. The terms of forward exchange contracts are largely within one year.
The Company enters into forward exchange contracts based on its risk management policy and other internal management rules.
The chief financial officer receives periodic reports on forward exchange contract transactions, foreign currency denominated
assets and liabilities, and commitment and forecasted transaction positions.
The Company’s subsidiaries similarly enter into forward exchange contracts based on the risk management policy and other
internal management rules. The Company’s finance department receives periodic reports on the positions of these transactions,
and checks that they are undertaken in keeping with internal management rules.
Foreign Exchange Sensitivity Analysis
The sensitivity analysis for currency exchange rates indicates the impact on income from continuing operations, before
income taxes, and on other comprehensive income (before tax effect adjustment) of the Japanese yen appreciating 1% against
other currencies as of March 31, 2016 and 2017, while all other variables are held constant, as follows:
Millions of yen
For the year ended March 31, 2016 For the year ended March 31, 2017
Income before income taxes
US dollar 1 2
Euro (4) 9
RMB (23) (11)
Other 5 33
Other comprehensive income
US dollar 136 39
Euro 12 1
RMB (3) (1)
Other 14 25

―41―
(ii) Share Price Fluctuation Risk
The Group holds equity instruments (including shares and investment) to develop its business, and is exposed to share price
fluctuation risks. Management periodically confirms the market values of these equity instruments and the financial positions of
their issuers.
Share Price Sensitivity Analysis
The sensitivity analysis for the Group’s holdings of marketable equity instruments indicates the impact on other
comprehensive income (before tax effect adjustment) of share prices rising 10%, while all other variables are held constant, as
follows:
Millions of yen
For the year ended March 31, 2016 For the year ended March 31, 2017
Other comprehensive income 1,067 693

―42―
(5) Fair Value
(i) Carrying Amounts and Fair Value of Financial Assets and Financial Liabilities
The carrying amounts and fair values of financial assets and financial liabilities are as follows:
Millions of yen
As of March 31, 2016 As of March 31, 2017
Carrying amount Fair value Carrying amount Fair value
Assets measured at amortized cost
Current assets
Cash and cash equivalents 169,375 169,375 189,783 189,783
Trade receivables 134,583 134,583 146,566 146,566
Investments in securities and other financial assets
5,366
5,366
31,380
31,380
Bank deposits with maturities exceeding three months
-
-
25,000
25,000
Other receivables 5,305 5,305 6,279 6,279
Loans 61 61 100 100
Non-current assets
Trade receivables 966 966 994 994
Investments in securities and other financial assets
2,234
2,234
2,350
2,350
Investments in securities and other investments
1,867
1,867
1,947
1,947
Loans 367 367 404 404
Assets measured at fair value
FVTPL financial assets
Current assets
Investments in securities and other financial assets
1,000
1,000
25
25
Other financial assets (derivatives) 1,000 1,000 25 25
Non-current assets
Investments in securities and other financial assets
914
914
882
882
Other investments 914 914 882 882
FVTOCI financial assets
Non-current assets
Investments in securities and other financial assets
10,829
10,829
7,254
7,254
Securities 10,829 10,829 7,254 7,254
Liabilities measures at amortized cost
Current liabilities
Trade payables 109,975 109,975 121,342 121,342
Other financial liabilities 16,435 16,435 16,841 16,841
Lease payables 181 181 140 140
Deposits 3,332 3,332 3,281 3,281
Other payables 12,922 12,922 13,420 13,420
Non-current liabilities
Other financial liabilities 7,038 7,038 3,478 3,478
Lease payables 248 248 156 156
Other payables 6,790 6,790 3,322 3,322
Liabilities measured at fair value
FVTPL financial liabilities
Current liabilities
Other financial liabilities (derivatives) 59 59 361 361
(ii) Fair Value Measurements
The following methods and assumptions are used to measure the fair value of financial assets and liabilities. In measuring the
fair value of financial instruments, quoted market prices are used if available. If these prices are unavailable, management uses
the discounted future cash flow method or other appropriate evaluation methods.

―43―
a) Cash and Cash Equivalents
The carrying amount approximates the fair value because of the short maturities of these instruments.
b) Trade Receivables and Payables
The carrying amount approximates the fair value because of the short settlement periods of these instruments.
c) Investments in Securities and Other Financial Assets and Other Financial Liabilities Measured at Amortized Cost
The carrying amounts of bank deposits with maturities exceeding three months, other receivables, deposits, other payables,
and short-term loans approximate the fair value because of the short maturities of these instruments.
For securities, long-term loans, lease payables, long-term other payables, and other investments, the Company measures
future cash flow at a discounted rate on the assumption that the contracts are newly executed.
d) Investments in Securities and Other Financial Assets Measured at Fair Value
These are described in (iii) Fair Value Hierarchy below.
(iii) Fair Value Hierarchy
Financial instruments are classified into the following fair value hierarchy:
Level 1: Quoted prices (unadjusted) for identical assets or liabilities in active markets
Level 2: Valuations measured by direct or indirect observable inputs other than Level 1
Level 3: Valuations measured by significant unobservable inputs
When several inputs are used for a fair value measurement, the level is determined based on the input with the lowest level in
the fair value measurement as a whole. Transfers between fair value hierarchy levels are deemed arising at the beginning of each
quarter.
Equity Securities
Equity securities are classified as Level 1 financial instruments, as they can be measured at fair market value. Equity securities
classified as Level 1 are listed shares. If the significant indicators for measuring the fair value of unlisted shares and other
similar financial instruments are unobservable, they are classified as Level 3 investments. The Group measures fair value by
using price information supplied by financial institutions and other parties, similar company comparisons, the discounted cash
flow method, the valuation models based on net assets, and other methods.
Derivatives
FVTPL financial assets and liabilities are measured based on forward exchange rates at the end of the fiscal year.
The Group classifies these instruments as Level 2, as it only enters into foreign exchange contracts.
Financial Assets and Liabilities Measured at Amortized Cost
The financial assets and liabilities measured at amortized cost are mainly classified as Level 2.
The financial assets and liabilities measured at fair value and classified by level are as follows:
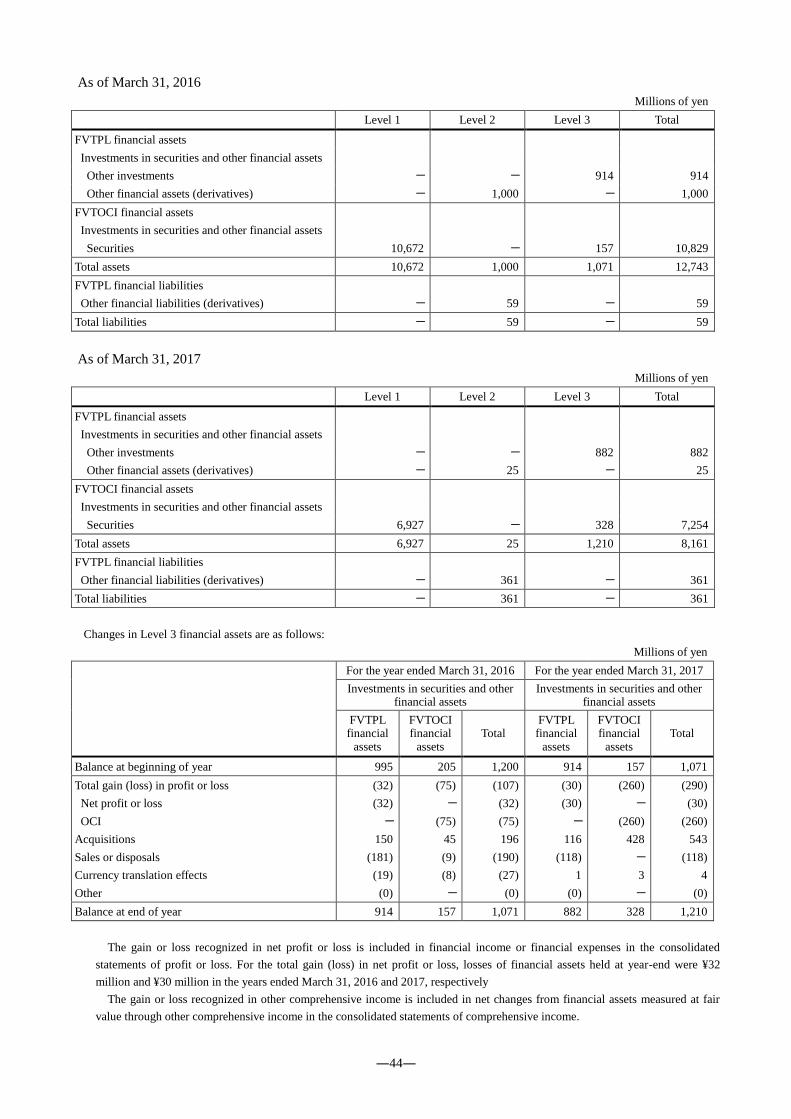
―44―
As of March 31, 2016
Millions of yen
Level 1 Level 2 Level 3 Total
FVTPL financial assets
Investments in securities and other financial assets
Other investments - - 914 914
Other financial assets (derivatives) - 1,000 - 1,000
FVTOCI financial assets
Investments in securities and other financial assets
Securities 10,672 - 157 10,829
Total assets 10,672 1,000 1,071 12,743
FVTPL financial liabilities
Other financial liabilities (derivatives) - 59 - 59
Total liabilities - 59 - 59
As of March 31, 2017
Millions of yen
Level 1 Level 2 Level 3 Total
FVTPL financial assets
Investments in securities and other financial assets
Other investments - - 882 882
Other financial assets (derivatives) - 25 - 25
FVTOCI financial assets
Investments in securities and other financial assets
Securities 6,927 - 328 7,254
Total assets 6,927 25 1,210 8,161
FVTPL financial liabilities
Other financial liabilities (derivatives) - 361 - 361
Total liabilities - 361 - 361
Changes in Level 3 financial assets are as follows:
Millions of yen
For the year ended March 31, 2016 For the year ended March 31, 2017
Investments in securities and other financial assets
Investments in securities and other financial assets
FVTPL financial
assets
FVTOCI financial
assets Total
FVTPL financial
assets
FVTOCI financial
assets Total
Balance at beginning of year 995 205 1,200 914 157 1,071
Total gain (loss) in profit or loss (32) (75) (107) (30) (260) (290)
Net profit or loss (32) - (32) (30) - (30)
OCI - (75) (75) - (260) (260)
Acquisitions 150 45 196 116 428 543
Sales or disposals (181) (9) (190) (118) - (118)
Currency translation effects (19) (8) (27) 1 3 4
Other (0) - (0) (0) - (0)
Balance at end of year 914 157 1,071 882 328 1,210
The gain or loss recognized in net profit or loss is included in financial income or financial expenses in the consolidated
statements of profit or loss. For the total gain (loss) in net profit or loss, losses of financial assets held at year-end were ¥32
million and ¥30 million in the years ended March 31, 2016 and 2017, respectively
The gain or loss recognized in other comprehensive income is included in net changes from financial assets measured at fair
value through other comprehensive income in the consolidated statements of comprehensive income.

―45―
(6) FVTOCI Financial Assets
The Group classifies equity instruments held to maintain and strengthen business relations FVTOCI financial assets, in view of
the holding purpose.
(i) Fair Values of Principal Equity Instruments
The fair values of principal FVTOCI financial assets are as follows:
As of March 31, 2016
Millions of yen
Principal FVTOCI financial assets Fair value
Hitachi Capital Corporation 5,698
Horiba, Ltd. 2,165
Shin-Etsu Chemical Co., Ltd. 810
Komatsu Ltd. 770
Dexerials Corporation 487
Aica Kogyo Co., Ltd. 437
Enplas Corporation 137
Sanyo Special Steel Co., Ltd. 109
As of March 31, 2017
Millions of yen
Principal FVTOCI financial assets Fair value
Horiba, Ltd. 3,077
Shin-Etsu Chemical Co., Ltd. 1,342
Komatsu Ltd. 1,166
Aica Kogyo Co., Ltd. 542
Dexerials Corporation 481
Sanyo Special Steel Co., Ltd. 125
PT. SKY ENERGY INDONESIA 123
Enplas Corporation 101
(ii) Derecognition of FVTOCI Financial Assets
The Group sold some FVTOCI financial assets following reviews of business relationships or for other reasons. The FVTOCI
financial assets that were derecognized for the years ended March 31, 2016 and 2017 are as follows:
Millions of yen
For the year ended March 31, 2016 For the year ended March 31, 2017
Fair value at time of sale 263 7,907
Accumulated gains at time of the recognition 3 7,779
Accordingly, the accumulated gains transferred from accumulated other comprehensive income to retained earnings were ¥5
million and ¥5,378 million in the years ended March 31, 2016 and 2017, respectively.
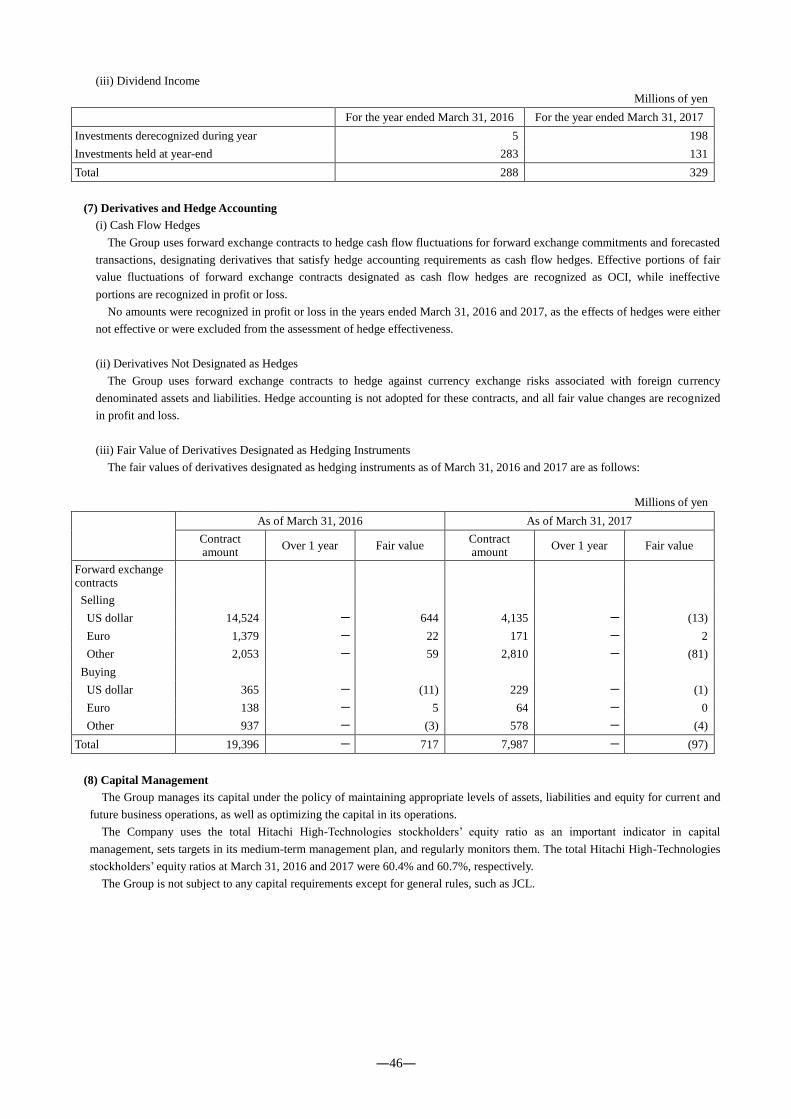
―46―
(iii) Dividend Income
Millions of yen
For the year ended March 31, 2016 For the year ended March 31, 2017
Investments derecognized during year 5 198
Investments held at year-end 283 131
Total 288 329
(7) Derivatives and Hedge Accounting
(i) Cash Flow Hedges
The Group uses forward exchange contracts to hedge cash flow fluctuations for forward exchange commitments and forecasted
transactions, designating derivatives that satisfy hedge accounting requirements as cash flow hedges. Effective portions of fair
value fluctuations of forward exchange contracts designated as cash flow hedges are recognized as OCI, while ineffective
portions are recognized in profit or loss.
No amounts were recognized in profit or loss in the years ended March 31, 2016 and 2017, as the effects of hedges were either
not effective or were excluded from the assessment of hedge effectiveness.
(ii) Derivatives Not Designated as Hedges
The Group uses forward exchange contracts to hedge against currency exchange risks associated with foreign currency
denominated assets and liabilities. Hedge accounting is not adopted for these contracts, and all fair value changes are recognized
in profit and loss.
(iii) Fair Value of Derivatives Designated as Hedging Instruments
The fair values of derivatives designated as hedging instruments as of March 31, 2016 and 2017 are as follows:
Millions of yen
As of March 31, 2016 As of March 31, 2017
Contract amount
Over 1 year Fair value Contract amount
Over 1 year Fair value
Forward exchange contracts
Selling
US dollar 14,524 - 644 4,135 - (13)
Euro 1,379 - 22 171 - 2
Other 2,053 - 59 2,810 - (81)
Buying
US dollar 365 - (11) 229 - (1)
Euro 138 - 5 64 - 0
Other 937 - (3) 578 - (4)
Total 19,396 - 717 7,987 - (97)
(8) Capital Management
The Group manages its capital under the policy of maintaining appropriate levels of assets, liabilities and equity for current and
future business operations, as well as optimizing the capital in its operations.
The Company uses the total Hitachi High-Technologies stockholders’ equity ratio as an important indicator in capital
management, sets targets in its medium-term management plan, and regularly monitors them. The total Hitachi High-Technologies
stockholders’ equity ratios at March 31, 2016 and 2017 were 60.4% and 60.7%, respectively.
The Group is not subject to any capital requirements except for general rules, such as JCL.

―47―
28. Leases
(1) Lessee
The Company and certain subsidiaries use leased tools, furniture and fixtures under finance leases.
The following table shows the undiscounted amounts and present value of minimum lease payments under finance leases as of
March 31, 2016 and 2017.
Millions of yen
Future minimum lease payments Present value of future minimum lease payments
As of March 31, 2016 As of March 31, 2017 As of March 31, 2016 As of March 31, 2017
Within 1 year 191 143 181 140
After 1 year and not later than 5 years
258
159
248
156
More than 5 years 0 - 0 -
Total 449 303 429 296
Finance charges (21) (7) - -
Present value of future minimum lease payments
429
296
429
296
The Company and certain subsidiaries use leased buildings and structures, machinery and vehicles under operating leases.
The following table shows the future minimum lease payments for non-cancelable operating leases as of March 31, 2016 and
2017.
Millions of yen
As of March 31, 2016 As of March 31, 2017
Within 1 year 1,002 1,101
After 1 year and not later than 5 years 1,901 1,821
More than 5 years 442 333
Total 3,345 3,255
Minimum lease payments for operating leases recognized as expenses in the years ended March 31, 2016 and 2017 are as
follows:
Millions of yen
For the year ended March 31, 2016 For the year ended March 31, 2017
Minimum lease payments 5,245 5,186
Minimum lease payments are posted in cost of sales and selling, general and administrative expenses.
(2) Lessor
The Company and certain subsidiaries lease tools, furniture, and equipment under finance lease contracts.
The following table shows the future minimum lease payments receivable for finance leases as of March 31, 2016 and 2017.
Millions of yen
As of March 31, 2016 As of March 31, 2017
Within 1 year 414 584
After 1 year and not later than 5 years 870 935
More than 5 years 96 59
Total 1,380 1,578

―48―
29. Major Subsidiaries
The Group’s consolidated financial statements include the financial statements of the following principal subsidiaries.
Company name Location Principal businesses Ownership (%)
As of March 31, 2016 As of March 31, 2017
Hitachi High-Tech Solutions Corporation
Chuo-ku, Tokyo
Industrial Systems 100.0 100.0
Hitachi High-Tech Materials Corporation
Minato-ku, Tokyo
Advanced Industrial Products
100.0 100.0
Hitachi High-Tech Fielding Corporation
Shinjuku-ku, Tokyo
Science & Medical Systems, Electronic Device Systems, and Industrial Systems
100.0 100.0
Hitachi High-Tech Fine Systems Corporation
Kamisato, Kodama-gun,
Saitama Prefecture
Industrial Systems 100.0 100.0
Hitachi High-Tech Manufacturing & Service Corp.
Hitachinaka City, Ibaraki Prefecture
Science & Medical Systems and Electronic Device Systems
100.0 100.0
Hitachi High-Tech Science Corporation
Minato-ku, Tokyo
Science & Medical Systems
100.0 100.0
Hitachi High Technologies America, Inc.
U.S.A.
Science & Medical Systems, Electronic Device Systems, Industrial Systems, and Advanced Industrial Products
100.0 100.0
Hitachi High-Technologies Europe GmbH
Germany
Science & Medical Systems, Electronic Device Systems, Industrial Systems, and Advanced Industrial Products
100.0 100.0
Hitachi High-Technologies (Singapore) Pte. Ltd.
Singapore
Science & Medical Systems, Electronic Device Systems, Industrial Systems, and Advanced Industrial Products
100.0 100.0
Hitachi High-Technologies (Thailand) Ltd. (Note)
Thailand Industrial Systems and Advanced Industrial Products
100.0 100.0
Hitachi High-Technologies (Shanghai) Co., Ltd.
China
Science & Medical Systems, Electronic Device Systems, Industrial Systems, and Advanced Industrial Products
100.0 100.0
Hitachi High-Technologies Hong Kong Limited
China Industrial Systems and Advanced Industrial Products
100.0 100.0
Note: Hitachi High-Technologies (Thailand) Ltd. is a wholly owned subsidiary of Hitachi High-Technologies (Singapore)
Pte. Ltd.

―49―
30. Related Party
(1) Parent Company
Company name Principal business Location Ownership (%)
As of March 31, 2016 As of March 31, 2017
Hitachi, Ltd. Manufacturing and sales of electrical machinery and equipment
Chiyoda-ku, Tokyo
51.8 51.8
(2) Related Party Transactions
The Group’s significant transactions (excluding those eliminated from the consolidated financial statements) with related parties
are as follows:
(i) For the year ended March 31, 2016
Millions of yen
Category Company name Details of related party
transactions Transaction
amount Outstanding balances
Parent company Hitachi, Ltd.
Sales of information equipment and power-
related parts, etc. 13,796
Trade receivables 9,446
Advances received 2,087
Deposits of funds 7,398 Deposits (including for
more than three months) 136,451
Entities with same parent company
Hitachi Capital Corporation
Factoring transactions 36,737 Trade payables 6,290
Hitachi Europe Ltd. Deposits of funds 43 Deposits 7,691
Notes:
1. Transaction amounts that exclude those for factoring transactions do not include consumption taxes. Factoring transaction
amounts and outstanding balances include consumption taxes.
2. Deposits of funds and refunds are conducted daily. Transaction amounts represent amounts subtracted from the end of the
previous fiscal year.
(ii) For the year ended March 31, 2017
Millions of yen
Category Company name Details of related party
transactions Transaction
amount Outstanding balances
Parent company Hitachi, Ltd.
Sales of railway related parts, information
equipment and power- related parts, etc.
17,763
Trade receivables 12,173
Advances received 399
Deposits of funds 42,181 Deposits (including for
more than three months) 178,632
Sale of securities 7,907 - -
Entities with same parent company
Hitachi Europe Ltd. Proceeds of funds 773 Deposits 6,919
Notes:
1. Transaction amounts do not include consumption taxes. Outstanding balances include consumption taxes.
2. Deposits of funds and refunds are conducted daily. Transaction amounts represent amounts subtracted from the end of the
previous fiscal year.
3. The securities are classified as FVTOCI financial assets. The sale price of securities is determined in accordance with the Share
Transfer Agreement with Hitachi Ltd.
(3) Compensation for Directors and Executive Officers
The compensation for directors and executive officers for the years ended March 31, 2016 and 2017 are as follows:
Millions of yen
For the year ended March 31, 2016 For the year ended March 31, 2017
Short-term employee benefits 595 687

―50―
31. Collateral
Assets pledged as collateral and the secured liabilities are as follows:
Millions of yen
As of March 31, 2016 As of March 31, 2017
Assets pledged as collateral
Investments in securities and other financial assets
311 384
Secured liabilities
Trade payables 56 121
Notes:
1. Assets pledged as collateral do not give assignees the right to sell or repledge the collateral.
2. Under assets pledged as collateral as at March 31, 2016, ¥288 million of investments in securities and other financial assets is
measured at fair value and ¥353 million is the maximum guaranteed amount.
Under assets pledged as collateral as at March 31, 2017, ¥347 million of investments in securities and other financial assets is
measured at fair value and ¥421 million is the maximum guaranteed amount.
32. Commitments
Commitments related to the acquisition of assets subsequent to March 31, 2016 and 2017 are as follows:
Millions of yen
As of March 31, 2016 As of March 31, 2017
Purchase of property, plant and equipment 1,037 1,594
33. Contingencies
(1) Contingent Liabilities
The Group provides the following guarantees to financial institutions with respect to the home loans of Group employees and the
operationally contracted guarantees for the office lease of a subsidiary:
Millions of yen
As of March 31, 2016 As of March 31, 2017
Employee guarantees 133 87
Total 133 87
(2) Contingent Assets
None
(3) Litigation
Although the Group is subject to litigation in the natural course of business and claims that do not lead to litigation, none of
these matters materially affect the operations of the Group.

―51―
34. Subsequent Events
At a meeting of the Board of Directors held on April 26, 2017, the Company resolved to acquire shares of subsidiaries of Oxford
Instruments plc (hereinafter, “OI”) based in England and take over the business of the subsidiaries relating to a part of the industrial
measuring equipment business involving, atomic spectrometric products (X-ray fluorescence analyzers, magnetic induction
measurement instruments, optical emission spectrometers, and laser induced breakdown spectrometers; hereinafter, “targeted
business”). The Group concluded an acquisition agreement on the same day as follows.
i ) Reason for stock purchase and business acquisition
The Group has embraced the following as its Corporate Vision: “To consistently aim to be Global Top in high-tech solutions.”
Guided by this vision, the Group is pushing ahead with businesses with the mission to turn its customers into fast-moving,
cutting-edge business. In April 2016, the Company formulated its Mid-Term Management Strategy running through fiscal 2018
with the basic policy of maintaining profits earned by its main business and promoting resource strengthening and investments.
Concrete strategies and measures are being implemented to accelerate further growth toward 2020.
In the Scientific Systems Business, the Group’s core business, the Company has adopted the business vision of aiming to be a
global major player in analytical instruments markets based on its Mid-Term Management Strategy. With this in mind, the Group
has been working to bolster its technologies, products and sales networks through alliances and M&A activities, in addition to in-
house development.
OI is a global scientific analytical instruments company that was spun out from Oxford University. The Company has reached
an agreement with OI to acquire the targeted business.
OI manufactures and markets an expansive lineup of atomic spectroscopy products, including both benchtop and handheld
models. Notably, handheld models and other portable equipment are increasingly being used in a broad range of fields as on-site
quality assurance tools. Our Scientific Systems Business has strengths in benchtop atomic spectroscopy product models.
Through the acquisition of the targeted business, the Group will bolster its lineup by bringing in OI’s handheld atomic
spectroscopy product models, where OI is strong. This will enable the Group to address customer needs by supporting various
sample types and measuring settings ranging from precision analysis in the laboratory to on-site analyses. In addition, the Group
will incorporate the sales network established by OI worldwide into its organization, enabling it to strengthen its sales network
further.

―52―
ii) Ownership ratio
100%
iii) Acquisition price
GBP80 million (Approximately JPY11,200 million) *
* The above value represents business fair value. The acquisition price is scheduled to be adjusted when the transaction is
executed, in consideration of net interest-bearing debt, operating capital and other factors. The value has been converted into
yen at the exchange rate as of March 31, 2017 (1GBP = ¥140).
iv ) Stock purchase and business acquisition execution date
July 3, 2017 (planned)
This stock purchase and business acquisition transaction will be completed after OI has completed the reorganization of OI
Group subsidiaries and after the completion of the filing of notifications and the acquisition of the necessary approvals from the
government authorities pertaining to the anti-trust laws and investment control laws of each country.
The impact on the consolidated financial statements is not described as the calculation of the fair value of assets acquired and
liabilities assumed on the stock purchase and business acquisition execution date is in process.