Financial Section - DNP · 2 Synopsis of Performance 6 essage to ... Transport and Tourism. ......
36
72 DNP Annual Report 2017 74 Management’s Discussion and Analysis 84 Selected Financial Data (unaudited) 86 Consolidated Financial Statements 107 Independent Auditors’ Report CONTENTS Financial Section
Transcript of Financial Section - DNP · 2 Synopsis of Performance 6 essage to ... Transport and Tourism. ......

72
DNPAnnualReport
2017
74 Management’s Discussion and Analysis
84 Selected Financial Data (unaudited)
86 Consolidated Financial Statements
107 Independent Auditors’ Report
CONTENTS
FinancialSection

Large-scale digital signage using an OLED display, at DNP Gotanda Building
74
DNPAnnualReport
2017
Operating Results
■ Business EnvironmentJapan’s economy gradually recovered during the fiscal year through March 2017, with employment and income conditions improving as a result of the economic policies of the Japanese government and the monetary easing policies of the Bank of Japan. However, the economy has still not reached a full-fledged recovery, due partly to a stronger yen, sluggish consumer spending, and overseas economic slowdowns in China and elsewhere.
The printing industry continued to face a tough business environment as a result of lower demand for printed media, including published printed materials, and lower order prices due to stiffer competition. A discussion of the business environment affecting each of DNP’s business segments in the current fiscal year is provided below.
Information Communication・ In the Publishing & Media Services business, publication sales in Japan fell by
4.2% year on year to ¥1,441.0 billion in the fiscal year through March 2017, according to Japan’s Research Institute for Publications. Publication sales have decreased by about 45% from a peak of ¥2,656.3 billion in 1996. Within this, book sales fell 2.5% year on year to ¥725.1 billion, and magazine sales slumped 5.8% to ¥715.9 billion on a decline in circulation and increase in discontinued publications. The sales value of magazines fell below the sales value of books.
・ In the Education and Publications Distribution business, the sale of published materials continues to decline, and the number of bookstores also continues to decline at an annual rate of around 3% from a peak of roughly 22,000 stores in 1999. Meanwhile, the domestic e-book market expanded substantially by 27.1% year on year to ¥190.9 billion in the fiscal year through March 2017, according to Japan’s Research Institute for Publications.
・ In the Marketing business, domestic advertising demand showed modest overall growth of 2.1% in the fiscal year through March 2017, according to Japan’s Ministry of Economy, Trade and Industry. Direct mail advertising decreased from the previous year, but internet advertising expanded, and advertising in the four media of newspapers, magazines, television, and radio was generally on par with the previous year.
・ In the Information Security business, major financial institutions expanded their outsourcing of a full range of operations to other companies, including various notifications. There was also growth for SIM cards used in smartphones and for smart cards used by financial institutions and for electronic money.
・ In the Imaging Communication business, the volume of photo printing is declining worldwide, due partly to the spread of photo sharing services that can be accessed using smartphones and other devices. However, the market for dye-sublimation thermal transfer printing media for photo printers continued to expand as a result of demand shifting from silver halide printing.
Management’s Discussion and Analysis

75
2 Synopsis of Performance
6 Message to Shareholders
54 How DNP Works to Achieve Sustainable Development
14 Special Feature
40 Segment Information
108 Appendix
30 DNP in Brief
72 Financial Section
Lifestyle and Industrial Supplies・ In the Packaging business, production value in the domestic package printing
industry rose 2% year on year in the fiscal year through March 2017, according to Japan’s Ministry of Economy, Trade and Industry. However, the market environment remained difficult, as sales of seasonal products fluctuated due to unseasonable weather and price competition intensified.
・ In the Living Spaces business, domestic new housing starts increased by 5.8% year on year during the fiscal year through March 2017. However, rental housing that uses a low amount of construction material per unit increased by 11.4% while condominiums that use a large amount of construction material decreased by 5.1%. As a result, domestic demand for construction material showed only modest growth, according to Japan’s Ministry of Land, Infrastructure, Transport and Tourism.
・ In the Industrial Supplies business, domestic shipment volume of photovoltaic cells (as converted to power generation capacity) fell by 11% year to year to 6,341 megawatts in the fiscal year through March 2017, according to the Japan Photovoltaic Energy Association. This reflects a decrease in purchase prices for photovoltaic energy as a result of revisions to Japan’s feed-in tariff (FIT) scheme for electric power generated from renewable energy sources. Domestic demand for photovoltaic cells continued a downward trend, primarily for residential use. Overseas, photovoltaic module inventories increased on account of FIT scheme revisions in China, resulting in a decline in module prices in the overall global market. However, markets related to lithium-ion batteries showed firm growth.
Electronics・ In the LCD panel market, volume rose slightly for panels used in TVs.
Notebook PC and monitor displays have reached a mature period in the product life cycle, and tablet displays have also slowed sharply as a result of competition with smartphones. Automotive displays were firm, but growth slowed for smartphone displays. The organic light-emitting diode (OLED) panel market was brisk, and smartphones that use OLEDs as a high-value-added product among small- and medium-sized displays were strong in terms of both volume and display area.
・ In the Electric Devices business, there is a noticeable trend toward the in-house production of photomasks by semiconductor manufacturers, and products made internally by manufacturers accounted for over 60% of the overall market in 2016. Accordingly, conditions remain difficult for outside manufacturers of photomasks.
Beverages・ The soft drink industry continued to face a tough market environment as a
result of manufacturers competing hard for market share and competition between national brands and private brands heating up.

76
DNPAnnualReport
2017
■ OverviewDNP has identified the four growth areas of “Knowledge and Communication,” “Food and Healthcare,” “Lifestyle and Mobility,” and “Environment and Energy,” and focused on creating new value to help solve various social issues in Japan and overseas based on P&I innovations that combine its strengths in printing and information.○ In Knowledge and Communication, DNP launched a joint initiative in April
2016 with Cybertrust Japan Co., Ltd., which excels in electronic authentication, to provide various authentication services with the aim of expanding online identity authentication services that are safe, secure, and convenient. Additionally, DNP formed a capital and business alliance with Future Link Network Co., Ltd. in September 2016 to fully enter a regional revitalization business using community information portal sites and community currency points.
○ In Food and Healthcare, DNP concluded an agreement with SIG Combibloc Group AG, a major global manufacturer of paper containers for food and beverages, to cooperate in the Japanese market.
○ In Lifestyle and Mobility, DNP pursued the development of new products with superior functionality, including non-electric dimming blind glass that works by sliding two sheets of glass manually to switch between transparent and dim views; and curved surface resin glass for automobiles that is lightweight and demonstrates excellent weather and wear resistance.
○ In Environment and Energy, DNP focused on developing a variety of products and services that contribute to reducing burdens on the environment. As part of these efforts, DNP Lighting Film, which helps reduce power consumption by effectively reflecting and dispersing natural light from windows in a room, was awarded the 26th Grand Prize for Global Environment Award, Japan Business Federation Chairman’s Prize, in February 2017.
In addition to initiatives in these growth areas, DNP also implemented groupwide structural reforms to bolster business competitiveness, including the reorganization and consolidation of business divisions and Group companies.
Despite these activities, consolidated net sales fell 3.1% year on year to ¥1,410,173 million during the fiscal year through March 2017. Consolidated operating income fell 30.9% to ¥31,411 million, and the consolidated operating income margin decreased by 0.9 percentage points to 2.2%. By segment, the operating income margin decreased by 1.2 percentage point to 2.4% in Information Communication, increased by 0.4 percentage point to 3.7% in Lifestyle and Industrial Supplies, decreased by 0.6 percentage point to 9.7% in Electronics, and increased by 2.6 percentage points to 4.3% in Beverages.
2017.3 2016.3 2015.3
Net sales (¥ million) ¥ 1,410,173 ¥ 1,455,916 ¥ 1,462,118
Gross profit margin (%) 18.9% 19.4% 19.1%
Operating income margin (%) 2.2% 3.1% 3.3%
Ordinary income margin (%) 2.6% 3.6% 3.7%
Net income margin (%) 1.8% 2.3% 1.8%
Net income per share (¥) ¥ 40.79 ¥ 53.10 ¥ 41.82
Net Sales by Segment(Year ended March 31, 2017)
Lifestyle andIndustrial Supplies
27.4%
InformationCommunication56.6%
Beverages4.0%
Electronics12.0%

77
2 Synopsis of Performance
6 Message to Shareholders
54 How DNP Works to Achieve Sustainable Development
14 Special Feature
40 Segment Information
108 Appendix
30 DNP in Brief
72 Financial Section
■ Net SalesNet sales totaled ¥1,410,173 million in the current fiscal year, down 3.1%, or ¥45,743 million, from the previous year.
Information CommunicationIn the Publishing & Media Services business, book sales were on par with the previous year, aided by aggressive sales activities, but magazines decreased and overall sales were below the previous year.
In the Education and Publications Distribution business, the number of outsourcing libraries in the library outsourcing business showed strong growth, rising by 115 libraries year on year to 1,206 libraries at the end of March 2017. However, overall sales in this business decreased, due to the large impact of Bunkyodo Group Holdings Co., Ltd. becoming an equity-method affiliate as a result of transferring a portion of its stock to Nippon Shuppan Hanbai Inc. in October 2016.
In the Marketing business, sales decreased for advertising flyers, but overall sales increased from the previous year on growth for catalogs, pamphlets, and sales promotion tools such as point-of-purchase (POP) materials for retailers.
In the Information Security business, overall sales increased on growth for SIM cards used in smartphones and smart cards used by financial institutions and for electronic money, and firm outsourcing demand from financial institutions for Information Processing Services (IPS).
In the Imaging Communication business, sales decreased on a winding down of printer replacement demand in the North American market and large impact of a strong yen.
Overall segment sales fell 2.5% year on year to ¥801,204 million.
Lifestyle and Industrial SuppliesIn the Packaging business, sales increased from the previous year on strong sales of paper cups, mainly for food applications, and sharply higher sales for PET plastic bottle aseptic filing systems.
In the Living Spaces business, overall sales rose slightly, buoyed by strong sales for EB floor coverings, which are well regarded for scratch resistance and are one of the environmentally conscious products that use DNP’s propriety electron beam (EB) coating technology.
In the Industrial Supplies business, sales of photovoltaic module components decreased from the previous year as a result of lower volume in the domestic market and decline in module prices in overseas markets. For lithium-ion battery components, volume increased for mobile device applications, but due to a decrease in prices for mobile device applications and only modest growth in automotive applications, overall sales were down slightly.
Overall segment sales grew 1.4% year on year to ¥388,195 million.
ElectronicsLCD color filter sales decreased on declines for both small- and medium-sized filters for smartphones and tablets and large filters for TVs. For metal masks used in the production of OLED displays, which have attracted attention as next-generation displays, sales increased on high demand for smartphone applications. For optical films, sales decreased for smartphone polarizing plate applications. In the Electric Devices business, sales decreased from the previous year for semiconductor photomasks, affected by a slump in the domestic semiconductor market and by foreign exchange. Sales also decreased for lead
DNP’s Overseas Sales(¥ billion)
202.5
234.6
0
100
50
150
200
250230.2
216.5195.6
13 161514 17

78
DNPAnnualReport
2017
frames amid poor sales for high-value-added products used in mobile devices in support of miniaturization.
Overall segment sales fell 15.0% year on year to ¥169,408 million.
BeveragesSales of unsweetened teas increased, but sales to other group bottlers decreased, and were also down for the Coca-Cola brand.
Overall segment sales fell 2.5% year on year to ¥56,620 million.
■ Cost of SalesThe cost of sales totaled ¥1,143,164 million, down 2.6%, or ¥30,039 million, from the previous year. The gross profit margin was 18.9%, down 0.5 percentage point from 19.4%.
Global crude oil prices continued a gradual upward trend during the current fiscal year after bottoming out in March 2016, and petroleum product prices also increased at a time lag of three to six months from the rise in crude oil prices. However, DNP was not affected by higher prices. Additionally, domestic demand for printing paper continued to contract, and prices also trended downward. As a result of these factors, the impact of higher raw material prices was just around ¥500 million in the current fiscal year, down sharply from ¥3.3 billion in the previous year. Moreover, DNP was able to negotiate with corporate customers to pass on the entire impact of higher raw material prices.
■ Selling, General and Administrative ExpensesSelling, general and administrative expenses totaled ¥235,598 million in the current fiscal year, down 0.7%, or ¥1,643 million, from the previous year. Selling, general and administrative expenses equated to 16.7% of net sales, up 0.4 percentage point from the previous year.
■ Operating IncomeOperating income totaled ¥31,411 million in the current fiscal year, down 30.9%, or ¥14,061 million, from the previous year. The operating income margin was 2.2%, down 0.9 percentage point from 3.1% in the previous year.
Information CommunicationOperating income benefited from higher sales of SIM cards used in smartphones, smart cards used by financial institutions and for electronic money, and Information Processing Services for financial institutions. However, operating income was affected by higher costs related to retirement benefits and upfront investment in new business, and by a stronger yen, especially in the Imaging Communication business. Segment operating income totaled ¥18,884 million, down 35.7%, or ¥10,480 million, from the previous year. The operating income margin was 2.4%, down 1.2 percentage point from 3.6% in the previous year.
Lifestyle and Industrial SuppliesSegment operating income totaled ¥14,434 million, up 14.6%, or ¥1,837 million, from the previous year, aided by higher sales in the Packaging business and lower costs for raw materials, energy, and other items. The operating income margin was 3.7%, up 0.4 percentage point from 3.3% in the previous year.
Operating Income Margin(%)
13 14 15 16 17
4
3
1
2
0
3.53.3
3.1
2.52.2
16
12
8
4
SGA Expenses to Net Sales(%)
13 14 15 16 17
20
0
15.5 15.4 15.8 16.3 16.7
20
15
10
5
Gross Profit Margin(%)
13 14 15 16 17
25
0
18.0 18.8 19.1 19.4 18.9

79
2 Synopsis of Performance
6 Message to Shareholders
54 How DNP Works to Achieve Sustainable Development
14 Special Feature
40 Segment Information
108 Appendix
30 DNP in Brief
72 Financial Section
ElectronicsSegment operating income totaled ¥16,484 million, down 19.6%, or ¥4,025 million, from the previous year, due to a decline in overall segment sales. The operating income margin was 9.7%, down 0.6 percentage point from 10.3% in the previous year.
BeveragesSegment operating income totaled ¥2,430 million, up 145.1%, or ¥1,439 million, from the previous year, due to rigorous cost-cutting efforts, mainly a reduction in cost of sales, and to changing the depreciation method for vending machines from declining balance depreciation to straight-line depreciation and extending the service life from 5–6 years to nine years. The operating income margin was 4.3%, up 2.6 percentage points from 1.7% in the previous year.
■ Nonoperating Income (Expenses) and ■ Extraordinary Income (Losses)Nonoperating income totaled ¥13,678 million in the current fiscal year, down 7.3%, or ¥1,073 million, from the previous year; and nonoperating expenses totaled ¥8,349 million, up 10.3%, or ¥778 million. As a result, net nonoperating income totaled ¥5,329 million, down from ¥7,180 million in the previous year.
Ordinary income totaled ¥36,740 million, down 30.2%, or ¥15,911 million, from the previous year.
Extraordinary income totaled ¥49,631 million, up ¥33,140 million from the previous year, as gain on sales of investment securities increased to ¥46,205 million from ¥15,111 million in the previous year. Extraordinary losses totaled ¥46,541 million, up ¥32,240 million from the previous year, as repair costs and repair reserve provisions increased to ¥37,738 million from ¥7,672 million in the previous year. As a result, net extraordinary income totaled ¥3,090 million, up from ¥2,190 million in the previous year.
As a result of the above, income before income taxes and non-controlling interests totaled ¥39,831 million, down 27.4%, or ¥15,010 million, from the previous year.
■ Net Income Attributable to Parent Company ShareholdersNet income attributable to parent company shareholders totaled ¥25,226 million in the current fiscal year, down 24.9%, or ¥8,362 million, from the previous year. Net income per share was ¥40.79, down ¥12.31 from the previous year.
13 14 15 16 17
4
3
2
1
0
2.8 2.7
3.2
ROE(%)
2.22.5
80
DNPAnnualReport
2017
Liquidity and Capital Resources
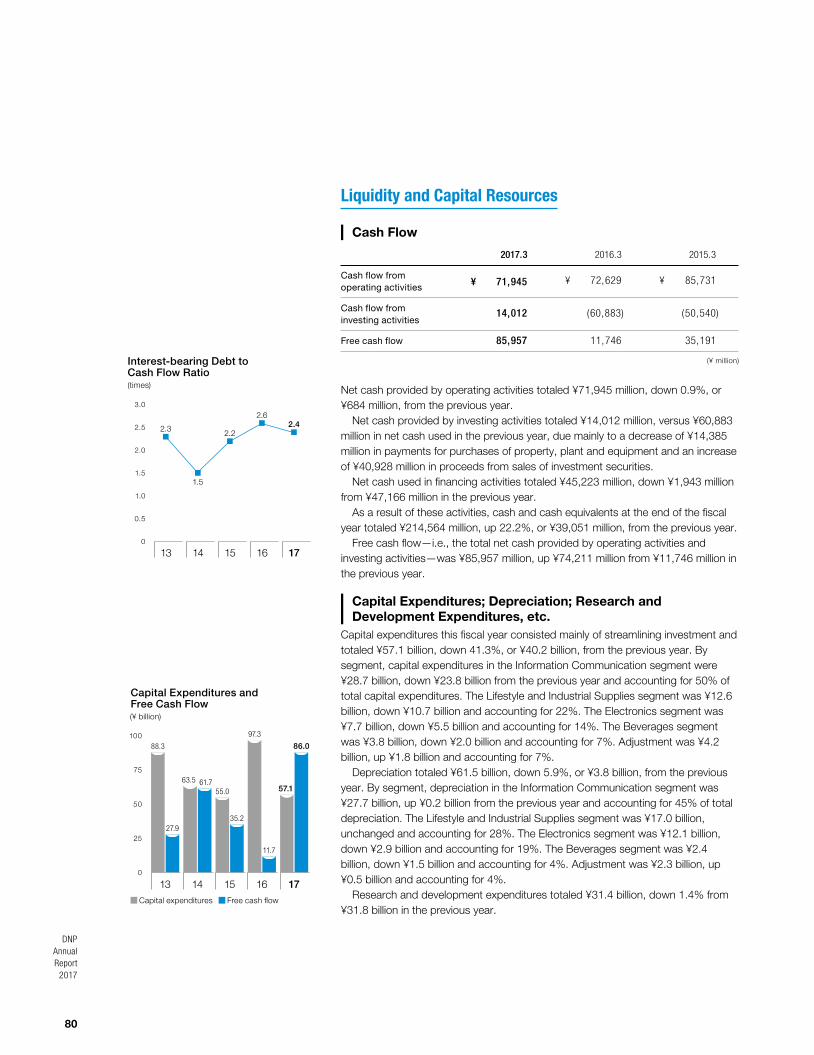
■ Cash Flow
2017.3 2016.3 2015.3
Cash flow from operating activities ¥ 71,945
¥ 72,629 ¥ 85,731
Cash flow from investing activities
14,012 (60,883) (50,540)
Free cash flow 85,957 11,746 35,191
(¥ million)
Net cash provided by operating activities totaled ¥71,945 million, down 0.9%, or ¥684 million, from the previous year.
Net cash provided by investing activities totaled ¥14,012 million, versus ¥60,883 million in net cash used in the previous year, due mainly to a decrease of ¥14,385 million in payments for purchases of property, plant and equipment and an increase of ¥40,928 million in proceeds from sales of investment securities.
Net cash used in financing activities totaled ¥45,223 million, down ¥1,943 million from ¥47,166 million in the previous year.
As a result of these activities, cash and cash equivalents at the end of the fiscal year totaled ¥214,564 million, up 22.2%, or ¥39,051 million, from the previous year.
Free cash flow—i.e., the total net cash provided by operating activities and investing activities—was ¥85,957 million, up ¥74,211 million from ¥11,746 million in the previous year.
■ Capital Expenditures; Depreciation; Research and ■ Development Expenditures, etc. Capital expenditures this fiscal year consisted mainly of streamlining investment and totaled ¥57.1 billion, down 41.3%, or ¥40.2 billion, from the previous year. By segment, capital expenditures in the Information Communication segment were ¥28.7 billion, down ¥23.8 billion from the previous year and accounting for 50% of total capital expenditures. The Lifestyle and Industrial Supplies segment was ¥12.6 billion, down ¥10.7 billion and accounting for 22%. The Electronics segment was ¥7.7 billion, down ¥5.5 billion and accounting for 14%. The Beverages segment was ¥3.8 billion, down ¥2.0 billion and accounting for 7%. Adjustment was ¥4.2 billion, up ¥1.8 billion and accounting for 7%.
Depreciation totaled ¥61.5 billion, down 5.9%, or ¥3.8 billion, from the previous year. By segment, depreciation in the Information Communication segment was ¥27.7 billion, up ¥0.2 billion from the previous year and accounting for 45% of total depreciation. The Lifestyle and Industrial Supplies segment was ¥17.0 billion, unchanged and accounting for 28%. The Electronics segment was ¥12.1 billion, down ¥2.9 billion and accounting for 19%. The Beverages segment was ¥2.4 billion, down ¥1.5 billion and accounting for 4%. Adjustment was ¥2.3 billion, up ¥0.5 billion and accounting for 4%.
Research and development expenditures totaled ¥31.4 billion, down 1.4% from ¥31.8 billion in the previous year.
Capital expenditures Free cash flow
25
50
75
Capital Expenditures and Free Cash Flow(¥ billion)
88.3
27.9
63.5 61.755.0
35.2
97.3
11.7
57.1
86.0
0
100
13 14 15 16 17
2.0
1.5
1.0
0.5
2.5
Interest-bearing Debt to Cash Flow Ratio(times)
13 14 15 16 17
3.0
0
2.3
1.5
2.2
2.62.4

81
2 Synopsis of Performance
6 Message to Shareholders
54 How DNP Works to Achieve Sustainable Development
14 Special Feature
40 Segment Information
108 Appendix
30 DNP in Brief
72 Financial Section
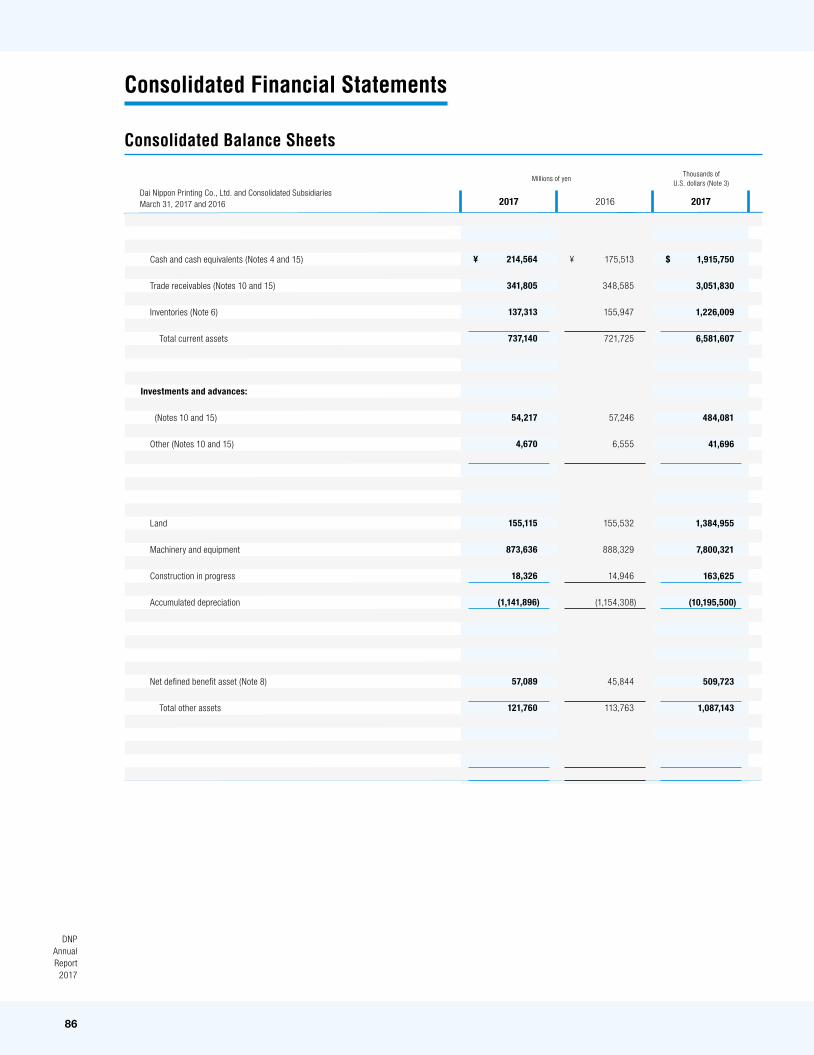
■ The Balance Sheet
2017.3 2016.3 2015.3
Total assets (¥ million) ¥ 1,741,904 ¥ 1,718,636 ¥ 1,809,462
Current ratio (%) 178% 170% 175%
Working capital/net sales (%) 23% 20% 22%
Debt-to-equity ratio (%) 16% 19% 17%
Net assets per share (¥) ¥ 1,680.55 ¥ 1,618.66 ¥ 1,675.63
DNP’s total assets at the end of this fiscal year amounted to ¥1,741,904 million, up 1.4%, or ¥23,268 million, from the previous year.
Among current assets, cash and cash equivalents and time deposits totaled ¥215,455 million, up 21.9%, or ¥38,761 million, from the previous year. Trade receivables totaled ¥341,805 million, down 1.9%, or ¥6,780 million. Inventories of merchandise and finished products, work in process, raw materials and supplies totaled ¥137,313 million, down 11.9%, or ¥18,634 million. As a result, current assets totaled ¥737,140 million, up 2.1%, or ¥15,415 million.
Among long-term assets, property, plant and equipment totaled ¥497,167 million, down 3.1%, or ¥15,990 million, from the previous year. Intangible assets totaled ¥34,436 million, down 3.8%, or ¥1,366 million. Investments and other assets totaled ¥473,160 million, up 5.6%, or ¥25,208 million. As a result, long-term assets totaled ¥1,004,764 million, up 0.8%, or ¥7,852 million.
Current liabilities totaled ¥415,199 million, down 1.9%, or ¥8,115 million, from the previous year. Long-term liabilities totaled ¥245,419 million, up 5.7%, or ¥13,339 million. As a result, total liabilities amounted to ¥660,618 million, up 0.8%, or ¥5,224 million.
Additionally, net assets totaled ¥1,081,286 million, up 1.7%, or ¥18,044 million.As of March 31, 2017, the number of treasury shares totaled 48,287,110, or
7.28% of total shares outstanding of 663,480,693 shares. Treasury shares decreased by 3,632,467 shares from the previous year, reflecting an increase of 13,222,000 shares from the purchase of treasury shares based on a resolution by the Board of Directors, an increase of 112,066 shares from the purchase of shares held by untraceable shareholders, an increase of 32,154 shares from the purchase of odd-lot shares, an increase of 1,313 shares from changes in equity ownership rates of equity-method affiliates, and a decrease of 17,000,000 shares from the cancellation of treasury shares based on a resolution by the Board of Directors.
150
100
50
Current Ratio(%)
200
0
164175 175 170
178
13 14 15 16 17
Equity Ratio(%)
13 14 15 16 17
80
60
40
20
0
56.6 59.2 59.6 59.2 59.4

82
DNPAnnualReport
2017
Business Risks
DNP’s earnings performance and other aspects of its business could possibly be significantly affected by a variety of factors that might arise in the future. DNP recognizes these potential risk factors and works to minimize their impact.
DNP considers the following factors to be key risks, as of the publication date of this annual report.
■ Japanese and overseas economies and ■ consumption trendsDNP engages in a wide range of businesses with an extremely large number of corporate customers, and it pursues stable business activities supported by a business base that does not rely on specific customers. DNP does most of its business in the Japanese market, but if consumer spending and other components of domestic demand slump, owing to domestic economic fluctuations in connection with global economic trends, its performance could be affected by a drop in order volume, decline in unit prices, and other factors.
Additionally, DNP could be directly or indirectly affected by market trends in various industries in Japan or overseas. In particular, electronics-related industries are susceptible to changes in production and demand in emerging markets and to global declines in unit prices, and DNP’s performance could be affected by major changes in market trends.
■ Overseas business activitiesDNP conducts overseas business activities mainly in the U.S., Europe, Southeast Asia, and elsewhere, and these activities face risks including social and political turmoil caused not only by economic factors such as unexpected changes in laws and regulations, stricter laws and regulations related to the environment and other areas, fragility of industrial infrastructure, and difficulty of hiring and securing personnel, but also by terrorism, war, and other factors. DNP’s performance could be affected if its overseas business activities are obstructed as a result of these risks materializing.
■ Development of new products and servicesDNP leverages its strengths in printing, information, and other fields to develop products and services that solve social problems and deliver new value to companies and consumers. These development efforts face an accelerating pace of technological innovation and diversification of needs. Going forward, amid expectations for development competition to intensify in Japan and overseas, DNP’s performance could possibly be affected by a greater-than-expected shortening of product life cycles and by changes in market trends.
■ Strategic business and capital alliances and ■ corporate acquisitionsDNP engages in strategic business and capital alliances and corporate acquisitions, and its performance could be affected if it is unable to achieve initially expected synergies and results due to deterioration in the business environment affecting the companies and businesses involved in these alliances and acquisitions.
■ Fluctuations in raw materials procurementDNP works to secure stable volume and maintain optimal pricing in procuring raw materials, including by purchasing printing paper and film materials from multiple suppliers in Japan and overseas. However, there is risk of imbalances between supply and demand due to sharp fluctuations in petroleum prices, sudden surges in demand from emerging markets, the impact of major disasters, the depletion of natural resources, and climate change. DNP will respond during such times by negotiating with client companies and business partners, but its performance could be affected if raw materials procurement becomes extremely difficult, if purchasing prices rise sharply, or if other such events occur.
■ Currency fluctuationsAmid the aggressive pursuit of global business expansion, DNP expects the impact of foreign exchange to steadily increase. DNP uses foreign exchange forward contracts and other means to hedge against the risk of fluctuations in currency markets, but its performance could be seriously affected in the event of sharp volatility in foreign exchange rates.
■ Environmental protection and ■ stricter environmental regulationsDNP’s business is affected by legal regulations in Japan and other countries related to energy conservation, climate change prevention (e.g., reduction of greenhouse gas emissions), reduction of the use of harmful substances, air pollution prevention, water quality protection, waste treatment, and product recycling. These regulations could conceivably be strengthened or changed in the future. DNP’s performance could be substantially affected by responding to these types of conditions and by a strengthening of measures to reduce environmental loads.
83
2 Synopsis of Performance
6 Message to Shareholders
54 How DNP Works to Achieve Sustainable Development
14 Special Feature
40 Segment Information
108 Appendix
30 DNP in Brief
72 Financial Section
■ Information security and ■ personal information protectionGlobal computer networks and information systems have become essential tools for conducting business, and there are now greater risks of software and hardware defects, global cyberattacks, computer virus infections, and personal data leaks. DNP regards information security and personal data protection as a top management priority, and is making every effort to maintain and manage systems and data by strengthening its organization and training employees. However, its business activities could be affected in the event of a malicious cyberattack, accident, or other such events.
■ Response to changes in legal regulationsDNP conducts its business based on strict compliance with laws and social ethics. It is subject to a variety of legal regulations in Japan and overseas, including product liability laws, antimonopoly laws, personal data protection laws, patent laws, tax regulations, and import and export rules. These regulations could conceivably be strengthened in the future. On the other hand, market and industry trends could change substantially as a result of deregulation. In this event, DNP’s business activities could be affected by greater limitations on its business activities and a prospective increase in the burden and cost of responding to regulatory changes.
■ DisastersDNP takes steps to protect production equipment and other major facilities from fires and earthquakes, seeks to decentralize and reorganize production facilities, and has prepared a Business Continuity Plan (BCP) to minimize any production shutdowns and product supply disruptions caused by disasters. DNP also uses various types of insurance to transfer risk. Nevertheless, DNP’s performance could be substantially affected in the event of major earthquakes, natural disasters such as rainstorms or flooding caused by climate change, disease outbreaks, or other unexpected events that cause production shutdowns or significantly damage or impair social infrastructure.
■ Lawsuits and finesDNP seeks to establish corporate ethics throughout the Group, and works to earn the trust of society by each and every employee complying with laws and regulations in conducting business activities, maintaining higher ethical standards than required by society, and contributing to maintaining and advancing orderly and freely competitive markets with a consistently fair attitude. Nevertheless, DNP’s performance could be affected in the event of being subject to lawsuits and resulting fines in Japan or overseas.

84
DNPAnnualReport
2017
Statements of Operations Data (¥ million)
Net sales
Cost of sales
Gross profit
Selling, general and administrative expenses
Operating income
Ordinary income
Income (loss) before income taxes and non-controlling interests
Net income (loss) attributable to parent company shareholders
Balance Sheet Data (¥ million)
Total assets
Property, plant and equipment—net
Long-term liabilities
Total liabilities
Stockholders’ equity
Total net assets
Other Selected Data (¥ million)
Capital expenditures
Depreciation expenses
R&D expenditures
Common Share Data (¥, shares)
Earnings (loss) per share—primary
Earnings (loss) per share—fully diluted
Dividends paid per share
Book value per share
No. of common shares outstanding (exc. treasury shares)
Financial Ratios (%)
As a percentage of net sales:
Gross profit
Selling, general and administrative expenses
Operating income
Income (loss) before income taxes and non-controlling interests
Net income (loss) attributable to parent company shareholders
Return on equity
Current ratio
D/E ratio
2017
¥ 1,410,173
1,143,164
267,009
235,598
31,411
36,740
39,831
25,226
¥ 1,741,904
497,167
245,419
660,618
884,829
1,081,286
¥ 57,085
61,461
31,376
¥ 40.79
40.78
32.00
1,680.55
615,193,583
18.93%
16.71
2.23
2.82
1.79
2.46
178
16
2016
¥ 1,455,916
1,173,203
282,713
237,241
45,472
52,651
54,841
33,588
¥ 1,718,636
513,157
232,080
655,394
894,752
1,063,242
¥ 97,265
65,310
31,827
¥ 53.10
53.07
32.00
1,618.66
628,561,116
19.42%
16.29
3.12
3.77
2.31
3.20
170
19
2015
¥ 1,462,118
1,182,954
279,164
230,990
48,174
53,759
51,062
26,924
¥ 1,809,462
512,791
249,965
685,370
902,217
1,124,092
¥ 55,024
67,034
31,749
¥ 41.82
41.44
32.00
1,675.63
643,833,079
19.09%
15.80
3.29
3.49
1.84
2.67
175
17
2014
¥ 1,448,550
1,176,077
272,473
222,374
50,099
53,285
48,608
25,642
¥ 1,574,754
528,538
179,946
598,369
892,110
976,385
¥ 63,465
73,459
30,820
¥ 39.82
39.65
32.00
1,447.96
643,893,863
18.81%
15.35
3.46
3.36
1.77
2.81
175
20
Selected Financial Data (unaudited)
Dai Nippon Printing Co., Ltd. and Consolidated Subsidiaries Years ended March 31

85
2 Synopsis of Performance
6 Message to Shareholders
54 How DNP Works to Achieve Sustainable Development
14 Special Feature
40 Segment Information
108 Appendix
30 DNP in Brief
72 Financial Section
2010 2009 20082013 2012 2011
¥ 1,616,053
1,327,872
288,181
201,077
87,104
86,502
88,469
45,172
¥ 1,601,193
639,343
106,691
561,058
990,122
1,040,135
¥ 116,139
109,902
35,556
¥ 67.08
—
36.00
1,516.35
661,366,377
17.83%
12.44
5.39
5.47
2.80
4.35
157
8
¥ 1,584,844
1,324,522
260,322
214,145
46,177
47,390
(27,842)
(20,933)
¥ 1,536,557
604,904
126,671
596,471
917,348
940,086
¥ 96,156
106,883
34,112
¥ (32.35)
—
32.00
1,393.91
644,357,076
16.43%
13.51
2.91
-1.76
-1.32
-2.20
144
14
¥ 1,583,383
1,286,682
296,701
230,187
66,514
68,841
49,496
23,278
¥ 1,618,854
616,848
190,045
661,990
921,775
956,864
¥ 119,063
91,695
33,850
¥ 36.13
—
32.00
1,422.34
644,238,930
18.74%
14.54
4.20
3.13
1.47
2.57
157
18
¥ 1,446,607
1,186,558
260,049
224,269
35,780
40,318
35,152
19,218
¥ 1,578,976
538,455
184,136
641,921
887,194
937,055
¥ 88,315
80,200
30,820
¥ 29.84
29.79
32.00
1,386.86
643,990,364
17.98%
15.50
2.47
2.43
1.33
2.18
164
25
¥ 1,507,228
1,246,878
260,350
226,335
34,015
36,843
2,673
(16,356)
¥ 1,608,806
579,567
251,414
694,593
888,650
914,213
¥ 98,189
95,829
31,690
¥ (25.39)
—
32.00
1,352.71
644,062,928
17.27%
15.02
2.26
0.18
-1.09
-1.84
177
26
¥ 1,589,373
1,287,581
301,792
233,973
67,819
62,786
52,696
25,033
¥ 1,649,784
614,827
249,575
697,343
925,702
952,441
¥ 102,173
97,977
33,147
¥ 38.86
—
32.00
1,410.44
644,142,530
18.99%
14.72
4.27
3.32
1.57
2.74
177
25
86
DNPAnnualReport
2017
20172017 2016Dai Nippon Printing Co., Ltd. and Consolidated SubsidiariesMarch 31, 2017 and 2016
Assets
Current assets: Cash and cash equivalents (Notes 4 and 15)
Time deposits (Note 15)
Trade receivables (Notes 10 and 15)
Allowance for doubtful receivables
Inventories (Note 6)
Prepaid expenses and other current assets (Notes 5, 10 and 13)
Total current assets
Investments and advances: Non-consolidated subsidiaries and associated companies
(Notes 10 and 15)
Investment securities (Notes 5 and 15)
Other (Notes 10 and 15)
Total investments and advances
Property, plant and equipment, at cost (Note 7): Land
Buildings and structures
Machinery and equipment
Leased assets
Construction in progress
Total
Accumulated depreciation
Net property, plant and equipment
Other assets Net defined benefit asset (Note 8)
Other (Notes 7 and 13)
Total other assets
Total assets
1,915,750 7,955
3,051,830 (14,536)
1,226,009 394,599
6,581,607
484,081 2,919,196
41,696 3,444,973
1,384,955 5,068,411 7,800,321
217,179 163,625
14,634,491 (10,195,500)
4,438,991
509,723 577,420
1,087,143
15,552,714
175,513
1,181
348,585
(1,349)
155,947
41,848
721,725
57,246
306,190
6,555
369,991
155,532
584,014
888,329
24,644
14,946
1,667,465
(1,154,308)
513,157
45,844
67,919
113,763
1,718,636
214,564 891
341,805 (1,628)
137,313 44,195
737,140
54,217 326,950
4,670 385,837
155,115 567,662 873,636 24,324 18,326
1,639,063 (1,141,896)
497,167
57,089 64,671
121,760
1,741,904
¥
¥
¥
¥
$
$
Millions of yenThousands of
U.S. dollars (Note 3)
Consolidated Financial Statements
Consolidated Balance Sheets

87
2 Synopsis of Performance
6 Message to Shareholders
54 How DNP Works to Achieve Sustainable Development
14 Special Feature
40 Segment Information
108 Appendix
30 DNP in Brief
72 Financial Section
The accompanying notes are an integral part of these consolidated financial statements.
20172017 2016Dai Nippon Printing Co., Ltd. and Consolidated SubsidiariesMarch 31, 2017 and 2016
Liabilities and Net Assets Current liabilities:
Short-term bank loans (Notes 7 and 15)
Current portion of long-term debt (Notes 7 and 15)
Trade payables (Notes 10 and 15)
Accrued expenses (Note 10)
Income taxes payable (Note 13)
Reserve for repair
Other current liabilities (Notes 7, 10 and 13)
Total current liabilities
Long-term liabilities:
Long-term debt (Notes 7 and 15)
Net defined benefit liability (Note 8)
Other long-term liabilities (Notes 7 and 13)
Total long-term liabilities
Contingent liabilities (Note 17)
Net assets Stockholders’ equity
Common stock -
Authorized: 1,490,000,000 shares;
Issued: 663,480,693 shares;
Capital surplus (Note 9)
Retained earnings (Note 9)
Treasury stock, at cost
48,287,110 shares in 2017 and 51,919,577 shares in 2016 (Note 9)
Total stockholders' equity
Accumulated other comprehensive income
Valuation difference on available-for-sale securities
Net deferred gains (losses) on hedges
Foreign currency translation adjustments
Remeasurements of defined benefit plans (Note 8)
Total accumulated other comprehensive income
Stock acquisition rights Non-controlling interests Total net assets
Total liabilities and net assets
384,250 69,643
2,210,375 363,509
63,866 166,786 448,705
3,707,134
1,056,241 313,830 821,170
2,191,241
1,022,000 1,288,214 6,211,795
(621,750)7,900,259
1,335,491 (27)
(19,821)15,027
1,330,670 –
423,410 9,654,339
15,552,714
55,316
8,755
255,586
45,735
6,014
–
51,908
423,314
125,750
34,167
72,163
232,080
114,464
144,283
717,030
(81,025)
894,752
123,478
(7)
3,051
(3,850)
122,672
16
45,802
1,063,242
1,718,636
43,036 7,800
247,562 40,713
7,153 18,680 50,255
415,199
118,299 35,149 91,971
245,419
114,464 144,280 695,721
(69,636)884,829
149,575 (3)
(2,220)1,683
149,035 –
47,422 1,081,286
1,741,904
¥
¥
¥
¥
$
$
Millions of yenThousands of
U.S. dollars (Note 3)

88
DNPAnnualReport
2017
The accompanying notes are an integral part of these consolidated financial statements.
20172017 2016Dai Nippon Printing Co., Ltd. and Consolidated SubsidiariesYears ended March 31, 2017 and 2016
Net sales (Note 18) Cost of sales (Note 18)
Gross profit
Selling, general and administrative expenses (Notes 11 and 18) Operating income
Other income (expenses) (Note 12): Interest and dividends income
Interest expenses
Equity in earnings of affiliates
Foreign exchange transaction gain (loss)
Net loss on sale or disposal of property, plant and equipment
Net gain on sales of investment securities
Loss on devaluation of investment securities
Production restructuring costs
Repair costs
Repair reserve provisions
Other
Income before income taxes and non-controlling interests
Income taxes (Note 13): Current
Deferred
Net income Net income attributable to non-controlling shareholders Net income attributable to parent company shareholders
12,590,830 10,206,821 2,384,009 2,103,554
280,455
45,580 (19,661)26,920 (5,223)
(43,804)412,545
(1,446)–
(51,723)(285,223)
(2,786)75,179
355,634
120,901 (8,696)
112,205 243,429
18,197 225,232
1,455,916
1,173,203
282,713
237,241
45,472
5,227
(2,439)
3,696
(497)
(1,609)
15,111
(924)
(2,265)
(7,672)
–
741
9,369
54,841
13,349
6,788
20,137
34,704
1,116
33,588
1,410,173 1,143,164
267,009 235,598
31,411
5,105 (2,202)3,015 (585)
(4,906)46,205
(162)–
(5,793)(31,945)
(312)8,420
39,831
13,541 (974)
12,567 27,264 2,038
25,226
¥
¥
¥
¥
$
$
Millions of yenThousands of
U.S. dollars (Note 3)
Consolidated Statements of Income

89
2 Synopsis of Performance
6 Message to Shareholders
54 How DNP Works to Achieve Sustainable Development
14 Special Feature
40 Segment Information
108 Appendix
30 DNP in Brief
72 Financial Section
The accompanying notes are an integral part of these consolidated financial statements.
20172017 2016Dai Nippon Printing Co., Ltd. and Consolidated SubsidiariesYears ended March 31, 2017 and 2016
Net income Other comprehensive income
Valuation difference on available-for-sale securities
Net deferred gains (losses) on hedges
Foreign currency translation adjustments
Remeasurements of defined benefit plans
Share of other comprehensive income in associates
accounted for using the equity method
Total other comprehensive income
Comprehensive income Attributable to:
Parent company shareholders
Non-controlling shareholders
243,429
232,794 (9)
(34,589)61,536
(26,955)232,777 476,206
460,679 15,527
34,704
(24,502)
22
(5,236)
(26,118)
1,325
(54,509)
(19,805)
(20,351)
546
27,264
26,073 (1)
(3,874)6,892
(3,019)26,071 53,335
51,596 1,739
¥
¥
¥
¥
$
$
Millions of yenThousands of
U.S. dollars (Note 3)
20172017 2016
Net assets per common share
Net income per common share primary
Net income per common share fully diluted
15.00
0.36
0.36
1,618.66
53.10
53.07
1,680.55
40.79
40.78
¥
¥
¥
¥
¥
¥
$
$
$
Yen U.S. dollars (Note 3)
Consolidated Statements of Comprehensive Income

90
DNPAnnualReport
2017 The accompanying notes are an integral part of these consolidated financial statements.
Thousands of U.S. dollars (Note 3)
Millions of yen
Dai Nippon Printing Co., Ltd. andConsolidated SubsidiariesYears ended March 31, 2017 and 2016
Stockholders’ equity Accumulated other comprehensive income
Remeasure-ments of defined
benefitplans
Foreigncurrency translation
adjustments
Net deferredgains (losses)
on hedges
Valuation difference on
available-for-sale securities
Treasurystock,at cost
Retained earnings
Capitalsurplus
Commonstock
Number of sharesissued
(in thousands)
Stock acquisition
rights
Non-controllinginterests
700,480
– – – – (20,000)
–
–
–
– – – (20,000) 680,480 680,480
680,480
– – – – – (17,000)
–
–
–
– – – – (17,000) 663,480
114,464
– – – – –
–
–
–
– – – – 114,464 114,464
114,464
– – – – – –
–
–
–
– – – – – 114,464
144,898
– – – – –
–
–
–
– (615) – (615) 144,283 144,283
144,283
– – – – – –
–
–
–
– – (3) – (3) 144,280
737,241
33,588 (20,376) – (1) (33,422)
–
–
–
– – – (20,211) 717,030 717,030
27 717,057
25,226 (19,919) (78) – – (26,565)
–
–
–
– – – – (21,336) 695,721
(94,386)
– – (20,067) 2 33,422
–
–
–
– – 4 13,361 (81,025) (81,025)
(81,025)
– – – (15,174) – 26,565
–
–
–
– – – (2) 11,389 (69,636)
147,914
– – – – –
(24,436)
–
–
– – – (24,436) 123,478 123,478
123,478
– – – – – –
26,097
–
–
– – – – 26,097 149,575
(0)
– – – – –
–
(7)
–
– – – (7) (7) (7)
(7)
– – – – – –
–
4
–
– – – – 4 (3)
7,247
– – – – –
–
–
(4,196)
– – – (4,196) 3,051 3,051
3,051
– – – – – –
–
–
(5,271)
– – – – (5,271) (2,220)
21,450
– – – – –
–
–
–
(25,300) – – (25,300) (3,850) (3,850)
(3,850)
– – – – – –
–
–
–
5,533 – – – 5,533 1,683
16
– – – – –
–
–
–
– – – – 16 16
16
– – – – – –
–
–
–
– (16) – – (16) –
45,248
– – – – –
–
–
–
– 554 – 554 45,802 45,802
1 45,803
– – – – – –
–
–
–
– – 1,619 – 1,619 47,422
680,480
680,480
– – – – – (17,000)
–
–
–
– – – – (17,000) 663,480
1,022,000
1,022,000
– – – – – –
–
–
–
– – – – – 1,022,000
1,288,241
1,288,241
– – – – – –
–
–
–
– – (27) – (27) 1,288,214
6,402,054
241 6,402,295
225,232 (177,848) (696) – – (237,188)
–
–
–
– – – – (190,500) 6,211,795
(723,438)
(723,438)
– – – (135,482) – 237,188
–
–
–
– – – (18) 101,688 (621,750)
1,102,482
1,102,482
– – – – – –
233,009
–
–
– – – – 233,009 1,335,491
(63)
(63)
– – – – – –
–
36
–
– – – – 36 (27)
27,241
27,241
– – – – – –
–
–
(47,062)
– – – – (47,062) (19,821)
(34,375)
(34,375)
– – – – – –
–
–
–
49,402 – – – 49,402 15,027
143
143
– – – – – –
–
–
–
– (143) – – (143) –
408,946
9 408,955
– – – – – –
–
–
–
– – 14,455 – 14,455 423,410
Balance at March 31, 2015 Changes of items during the period Net income attributable to parent company shareholders Cash dividends paid Purchases of treasury stock Disposal of treasury stock Retirement of treasury stock Changes in valuation difference on available-for-sale securities Changes in deferred gains (losses) on hedges Changes in foreign currency translation adjustments Changes in remeasurements of defined benefit plans Changes in non-controlling interests Other Total changes of items during the period Balance at March 31, 2016 Balance at April 1, 2016 Cumulative effects of changes in accounting policiesRestated balance at April 1, 2016 Changes of items during the period Net income attributable to parent company shareholders Cash dividends paid Change of scope of consolidation Purchases of treasury stock Disposal of treasury stock Retirement of treasury stock Changes in valuation difference on available-for-sale securities Changes in deferred gains (losses) on hedges Changes in foreign currency translation adjustments Changes in remeasurements of defined benefit plans Changes in share acquisition rights Changes in non-controlling interests Other Total changes of items during the period Balance at March 31, 2017
Balance at April 1, 2016 Cumulative effects of changes in accounting policiesRestated balance at April 1, 2016 Changes of items during the period Net income attributable to parent company shareholders Cash dividends paid Change of scope of consolidation Purchases of treasury stock Disposal of treasury stock Retirement of treasury stock Changes in valuation difference on available-for-sale securities Changes in deferred gains (losses) on hedges Changes in foreign currency translation adjustments Changes in remeasurements of defined benefit plans Changes in share acquisition rights Changes in non-controlling interests Other Total changes of items during the period Balance at March 31, 2017
Consolidated Statements of Changes in Net Assets

91
2 Synopsis of Performance
6 Message to Shareholders
54 How DNP Works to Achieve Sustainable Development
14 Special Feature
40 Segment Information
108 Appendix
30 DNP in Brief
72 Financial Section
20172017 2016Dai Nippon Printing Co., Ltd. and Consolidated SubsidiariesYears ended March 31, 2017 and 2016
Millions of yenThousands of
U.S. dollars (Note 3)
The accompanying notes are an integral part of these consolidated financial statements.
Cash flows from operating activities : Income before income taxes and non-controlling interests
Adjustments to reconcile income before income taxes and
non-controlling interests to net cash provided by operating activities:
Depreciation
Impairment loss on fixed assets
Allowance for doubtful receivables
Net defined benefit asset (net)
Net defined benefit liability (net)
Equity in earnings of affiliates
Amortization of goodwill
Interest and dividends income
Interest expenses
Net gain on sales of investment securities
Loss on devaluation of investment securities
Net loss on sale or disposal of property, plant and equipment
Repair costs
Repair reserve provisions
Changes in assets and liabilities
Trade receivables
Inventories
Trade payables
Other assets and liabilities
Sub-total
Payments for repair costs
Extra retirement payments
Payments of income taxes
Net cash provided by operating activitiesCash flows from investing activities :
Net decrease in time deposits
Payments for purchases of property, plant and equipment
Proceeds from sales of property, plant and equipment
Payments for purchases of investment securities
Proceeds from sales of investment securities
Payments for purchases of intangible assets
Payments for acquisition of subsidiaries’ shares, resulting in consolidation scope change
Proceeds from acquisition of subsidiaries’ shares, resulting in consolidation scope change
Interest and dividends received
Other investing
Net cash provided by (used in) investing activitiesCash flows from financing activities :
Net increase in short-term bank loans
Proceeds from long-term debt
Repayments of long-term debt
Proceeds from issuance of debentures
Payments for redemption of debentures
Interest paid
Dividends paid
Dividends paid to non-controlling shareholders
Payments for purchases of treasury stocks
Payments for purchase of stock in subsidiaries not resulting
in a change in the scope of consolidation
Other financing
Net cash used in financing activitiesEffect of exchange rate changes on cash and cash equivalents Net increase (decrease) in cash and cash equivalents Cash and cash equivalents at beginning of year Increase in cash and cash equivalents resulting from change of scope of consolidation Cash and cash equivalents at end of year
355,634
548,759 8,000
(13,929)(13,723)11,089
(26,920)20,688
(45,580)19,661
(412,545)1,446
44,375 51,723
285,223
39,679 29,080
(884)61,688
963,464 (206,688)
(929)(113,482)642,365
2,152 (446,705)
44,563 (6,179)
543,554 (100,116)
– 11,509 71,009
5,321 125,108
(62,152)59,643
(62,348)35,116 (4,955)
(19,723)(177,848)
(3,018)(135,554)
– (32,938)
(403,777)(15,196)
348,500 1,567,080
170 1,915,750
54,841
65,310
110
(1,393)
(15,312)
(8)
(3,696)
2,201
(5,227)
2,439
(15,111)
924
1,665
7,672
–
17,881
(10,532)
(4,726)
(3,912)
93,126
(3,582)
(991)
(15,924)
72,629
38
(64,416)
2,792
(5,664)
19,950
(8,702)
(8,981)
–
6,179
(2,079)
(60,883)
2,131
5,803
(10,553)
4,718
(1,050)
(2,436)
(20,381)
(453)
(20,068)
(152)
(4,725)
(47,166)
(1,829)
(37,249)
212,762
–
175,513
39,831
61,461 896
(1,560)(1,537)1,242
(3,015)2,317
(5,105)2,202
(46,205)162
4,970 5,793
31,945
4,444 3,257
(99)6,909
107,908 (23,149)
(104)(12,710)71,945
241 (50,031)
4,991 (692)
60,878 (11,213)
– 1,289 7,953
596 14,012
(6,961)6,680
(6,983)3,933 (555)
(2,209)(19,919)
(338)(15,182)
– (3,689)
(45,223)(1,702)39,032
175,513 19
214,564
¥
¥
¥
¥
$
$
Consolidated Statements of Cash Flows

92
DNPAnnualReport
2017
Notes to Consolidated Financial Statements
1. Basis of Presenting the Consolidated Financial StatementsDai Nippon Printing Co., Ltd. (hereinafter referred to as the “Company”) and its domestic subsidiaries maintain their books of account and prepare their financial statements in conformity with accounting principles and practices generally accepted in Japan (“Japanese GAAP”), and its foreign subsidiaries in conformity with the Company’s group accounting policies based on International Financial Reporting Standards (“IFRS”) or accounting principles generally accepted in the United States of America (“US GAAP”). The accompanying consolidated financial statements have been compiled from the consolidated financial statements filed with the Financial Services Agency of Japan as required by the Financial Instruments and Exchange Act of Japan. Certain reclassifications of accounts and modifications have been made in the accompanying consolidated financial statements to facilitate understanding by readers outside Japan. Certain reclassifications have also been made in the 2016 financial statements to conform with current classifications. In addition, the notes to the consolidated financial statements include additional information which is not required for disclosure under accounting principles and practices generally accepted in Japan.
2. Significant Accounting Policies Consolidation
The accompanying consolidated financial statements include the accounts of the Company and its significant majority-owned subsidiaries. All significant intercompany accounts and intercompany transactions have been eliminated in consolidation. Consolidated financial statements include the accounts of the Company and 106 consolidated subsidiaries. Some subsidiaries are consolidated with their fiscal year ends that differ from that of the Company. Significant transactions that took place between their fiscal year ends and the Company’s fiscal year end are reflected in the consolidated financial statements. Investments in non-consolidated subsidiaries are stated at cost and, for valuation of such investments, the equity method has not been applied since these investments are considered immaterial in the aggregate. However, investments are devalued if the decline in value is judged to be other than temporary. Investments in 20% to 50% associated companies are principally accounted for by the equity method. The differences between costs and underlying net assets at the date of investment in consolidated subsidiaries are included in other assets and are amortized over a period mainly for five years.
Translation of foreign currency accountsMonetary assets and liabilities denominated in foreign currencies of the Company and its domestic subsidiaries are translated into Japanese yen at the exchange rates at the balance sheet date. Revenues and expenses denominated in foreign currencies are translated at the exchange rates prevailing during the year. The resulting translation gains (or losses) are included in other income (or expenses). The translation of foreign currency financial statements of foreign consolidated subsidiaries into Japanese yen has been made for consolidation purposes in accordance with the translation method prescribed in the accounting standard for foreign currency transactions. The balance sheet accounts of the foreign consolidated subsidiaries are translated at the exchange rates in effect at the balance sheet date, except for common stock and capital surplus, which are translated at historical rates. Revenue and expense accounts are translated at the average exchange rates during the year. The resulting translation adjustments are presented as “foreign currency translation adjustments” and “non-controlling interests” as reported in a separate component of accumulated other comprehensive income in the consolidated balance sheets.
Cash and cash equivalentsCash and cash equivalents include all highly liquid investments, generally with original maturities of three months or less, that are readily convertible to known amounts of cash and are so near maturities that they present insignificant risk of changes in value because of changes in interest rates.
InventoriesInventories are stated at cost which is determined substantially by the average method being written-down to reflect the decline of profitability.
Marketable securities and investment securitiesDebt securities that are held to maturity with positive intent and ability (“held-to-maturity debt securities”) are stated at amortized cost. Available-for-sale securities with available fair market values are stated at fair value. Unrealized gains and losses on available-for-sale securities, net of applicable taxes, are reported in a separate component of accumulated other comprehensive income in the consolidated balance sheets. Non-marketable securities are stated at cost determined by the average method. For other than temporary declines in fair value, investment securities are reduced to net realizable value by a charge to income.
Property, plant and equipment and depreciationThe Company and its domestic consolidated subsidiaries mainly use the declining-balance method. However, depreciation of buildings (excluding facilities attached to buildings) acquired on or after April 1, 1998 and of facilities attached to buildings and structures acquired on or after April 1, 2016 are computed by the straight-line method. Assets with an acquisition cost of ¥100,000 ($893) or more but less than ¥200,000 ($1,786) are depreciated equally over three years. Foreign consolidated subsidiaries mainly use the straight-line method.
The estimated useful lives are summarized as follows:
Dai Nippon Printing Co., Ltd. and Consolidated Subsidiaries March 31, 2017 and 2016
Buildings and structures 3 to 50 yearsMachinery and equipment 2 to 13 years

93
2 Synopsis of Performance
6 Message to Shareholders
54 How DNP Works to Achieve Sustainable Development
14 Special Feature
40 Segment Information
108 Appendix
30 DNP in Brief
72 Financial Section
Leased assetsLeased assets with transfer of ownership are depreciated using the same depreciation method applied to owned fixed assets. Finance leases which do not transfer ownership are capitalized. Depreciation for leased assets is computed on a straight-line basis over the lease period with a residual value of zero.
Intangible assetsIntangible assets included in other assets are carried at cost less accumulated amortization calculated by the straight-line method over their estimated useful lives. Software for internal use included in intangible assets are amortized by the straight-line method over five years.
Impairment of fixed assetsThe Company and its subsidiaries review fixed assets for impairment whenever events or changes in circumstance indicate the carrying amount of an asset or asset group may not be recoverable. An impairment loss would be recognized if the carrying amount of an asset or asset group exceeds the sum of the undiscounted future cash flows expected to result from the continued use and eventual disposition of the asset or asset group. The impairment loss would be measured as the amount by which the carrying amount of the asset exceeds its recoverable amount, which is the higher of the discounted cash flows from the continued use and eventual disposition of the asset or the net selling price at disposition.
Employees’ retirement benefitsThe Company and domestic significant consolidated subsidiaries applied the accounting standard for employees’ retirement benefits. Under the accounting standard, accrued pension and liability for employees’ retirement benefits has been provided based on the estimated amounts of projected pension and severance obligation and fair value of plan assets at the end of the fiscal year. Benefit formula basis is applied for the method of attributing expected retirement benefits to periods. Prior service cost is being amortized as incurred by the straight-line method over the period within the average remaining service periods (primarily 6 years) of the eligible employees. Actuarial gains and losses have been amortized from the following fiscal year by the declining-balance method over the periods within the average remaining service periods (primarily 9 years) of the eligible employees.
Research and development expensesResearch and development expenses are charged to income as incurred.
Income taxesThe asset and liability approach is used to recognize deferred tax assets and liabilities for the expected future tax consequences of temporary differences between the carrying amounts and the tax bases of assets and liabilities. Deferred taxes are measured by applying currently enacted tax laws to the temporary differences.
Derivatives and hedging activitiesThe Company and certain consolidated subsidiaries use derivative financial instruments (“derivatives”) for foreign currency forward contracts, interest rate swaps and currency swaps to manage the risk arising from fluctuation in foreign currency exchange rate and interest rates. The Company and its subsidiaries do not enter into derivatives contracts for speculative purposes. Derivatives are carried at fair value and changes in fair value are recognized as gains or losses, unless the derivatives are used for hedging purposes. If derivatives meet certain hedging criteria, recognition of gains or losses resulting from changes in the fair value of derivatives is deferred until the related gains or losses on hedged items are recognized. In cases where foreign currency forward contracts or currency swap contracts meet certain hedging criteria, the hedged items are stated by the contracted rates (“alternative method”). In addition, if interest rate swap contracts meet certain hedging criteria, the net amount to be paid or received under the interest rate swap contracts is added to or deducted from interest on the assets or liabilities for which the interest rate swap contracts were executed (“exceptional accrual method”).
Net assets and income per common shareNet assets per common share were computed based on the number of shares outstanding after deducting treasury stock at March 31, 2017 and 2016, respectively. Net income per share was computed based on the average number of shares of common stock outstanding after deducting treasury stocks during each year. Necessary adjustments were made on the net income or the number of shares for diluted net income per share in order to reflect dilutive effects.
Change in accounting policies(Application of the Implementation Guidance on Recoverability of Deferred Tax Assets)Effective from the consolidated fiscal year ended March 31, 2017, the Company has applied the “Implementation Guidance on Recoverability of Deferred Tax Assets” (Accounting Standards Board of Japan (hereinafter, “ASBJ”) Guidance No. 26, March 28, 2016 (hereinafter, “Implementation Guidance” )). As a result, accounting treatment related to the recoverability of deferred tax assets has been partially revised. With respect to application of the Implementation Guidance, the transitional treatment as stipulated in Paragraph 49 (4) of the Implementation Guidance was applied, and difference between deferred tax assets and deferred tax liabilities calculated by applying Paragraph 49 (3) Section 1 through 3 of the Implementation Guidance, and deferred tax assets and deferred tax liabilities as of March 31, 2016 has been added to retained earnings as of April 1, 2016. The effect of this change on the consolidated financial statements as of April 1, 2016 is immaterial.
(Application of the Practical Solution on a Change in Depreciation Method due to Tax Reform 2016)Effective from the consolidated fiscal year ended March 31, 2017, the Company and certain domestic consolidated subsidiaries have applied the “Practical Solution on a Change in Depreciation Method due to Tax Reform 2016” (ASBJ Practical Issue Task Force No. 32, June 17, 2016 (hereinafter, “Practical Solution” )) in conjunction with changes in corporation tax laws. As a result, the depreciation method of facilities attached to buildings and structures acquired on and after April 1, 2016 has been changed from the declining-balance method to the straight-line method. The effect of this change on the consolidated financial statements for the year ended March 31, 2017 is immaterial.

94
DNPAnnualReport
2017
3. Basis of Translating Financial StatementsThe consolidated financial statements are expressed in Japanese yen in accordance with accounting principles generally accepted in Japan. The Japanese yen amounts have been translated into U.S. dollar amounts, solely for the convenience of the readers, at the rate of ¥112=U.S. $1, the approximate exchange rate on the Tokyo Foreign Exchange Market at March 31, 2017. Such translations should not be construed as representations that the Japanese yen at that or any other rate could be converted into U.S. dollars.
4. Cash and Cash EquivalentsCash and cash equivalents as of March 31, 2017 and 2016 were comprised of the following:
5. Marketable Securities and Investment SecuritiesThe carrying amount and aggregate fair value of marketable and investment securities classified as held-to-maturity debt securities as of March 31, 2017 and 2016 were as follows:
The acquisition cost and aggregate fair value of marketable and investment securities classified as available-for-sale securities including those with no fair value as of March 31, 2017 and 2016 were as follows:
20172017 2016
Cash and deposits (excluding time deposits with a maturity over three months) ¥ ¥ $
Millions of yenThousands of
U.S. dollars (Note 3)
1,915,750 175,513 214,564
DifferenceCarrying amount Fair value
Others (0) 201 201 ¥ ¥ ¥
Millions of yen
March 31, 2017
DifferenceCarrying amount Fair value
Others (0) 1,795 1,795 $ $ $
Thousands of U.S. dollars (Note 3)
March 31, 2017
Carrying amount
Others (0) 201 201 ¥ ¥ ¥
Millions of yen
March 31, 2016 DifferenceFair value
Fair valueUnrealized gains Unrealized losses
Stocks
Others
Total
326,567 182
326,749
2,599 –
2,599
214,887 14
214,901
¥
¥
¥
¥
¥
¥
March 31, 2017 Acquisition cost
114,279 168
114,447
¥
¥
Millions of yen
Fair valueUnrealized gains Unrealized losses
Stocks
Others
Total
305,735
263
305,998
4,324
0
4,324
179,660
14
179,674
¥
¥
¥
¥
¥
¥
March 31, 2016 Acquisition cost
130,399
249
130,648
¥
¥
Millions of yen
Fair valueUnrealized gains Unrealized losses
Stocks
Others
Total
2,915,777 1,625
2,917,402
23,205 –
23,205
1,918,634 125
1,918,759
$
$
$
$
$
$
March 31, 2017 Acquisition cost
1,020,348 1,500
1,021,848
$
$
Thousands of U.S. dollars (Note 3)

95
2 Synopsis of Performance
6 Message to Shareholders
54 How DNP Works to Achieve Sustainable Development
14 Special Feature
40 Segment Information
108 Appendix
30 DNP in Brief
72 Financial Section
The proceeds from sales of available-for-sale securities for the years ended March 31, 2017 and 2016 were ¥59,966 million ($535,411 thousand) and ¥19,632 million, respectively. The gross realized gains on these sales for the years ended March 31, 2017 and 2016 were ¥44,915 million ($401,027 thousand) and ¥15,136 million, respectively, and the gross realized losses on these sales for the years ended March 31, 2017 and 2016 were ¥979 million ($8,741 thousand) and ¥1 million, respectively.
The redemption schedules for securities with maturities at March 31, 2017 and 2016 were as follows:
6. InventoriesInventories at March 31, 2017 and 2016 consisted of the following:
20172017 2016
Merchandise and finished products
Work in process
Raw materials and supplies
752,554 260,089 213,366
1,226,009
101,240
29,686
25,021
155,947
84,286 29,130 23,897
137,313
¥
¥
¥
¥
$
$
Millions of yenThousands of
U.S. dollars (Note 3)
Over five yearsDue in one year or lessDue after one year through five years
Corporate bonds 80201–¥ ¥ ¥
Millions of yen
March 31, 2017
Over five yearsDue in one year or lessDue after one year through five years
Corporate bonds 7141,795–$ $ $
Thousands of U.S. dollars (Note 3)
March 31, 2017
Due in one year or less
Corporate bonds 8020148¥ ¥ ¥
Millions of yen
March 31, 2016 Over five yearsDue after one year through five years
Fair valueUnrealized gains Unrealized losses
Stocks
Others
Total
326,567 182
326,749
2,599 –
2,599
214,887 14
214,901
¥
¥
¥
¥
¥
¥
March 31, 2017 Acquisition cost
114,279 168
114,447
¥
¥
Millions of yen
Fair valueUnrealized gains Unrealized losses
Stocks
Others
Total
305,735
263
305,998
4,324
0
4,324
179,660
14
179,674
¥
¥
¥
¥
¥
¥
March 31, 2016 Acquisition cost
130,399
249
130,648
¥
¥
Millions of yen
Fair valueUnrealized gains Unrealized losses
Stocks
Others
Total
2,915,777 1,625
2,917,402
23,205 –
23,205
1,918,634 125
1,918,759
$
$
$
$
$
$
March 31, 2017 Acquisition cost
1,020,348 1,500
1,021,848
$
$
Thousands of U.S. dollars (Note 3)
96
DNPAnnualReport
2017
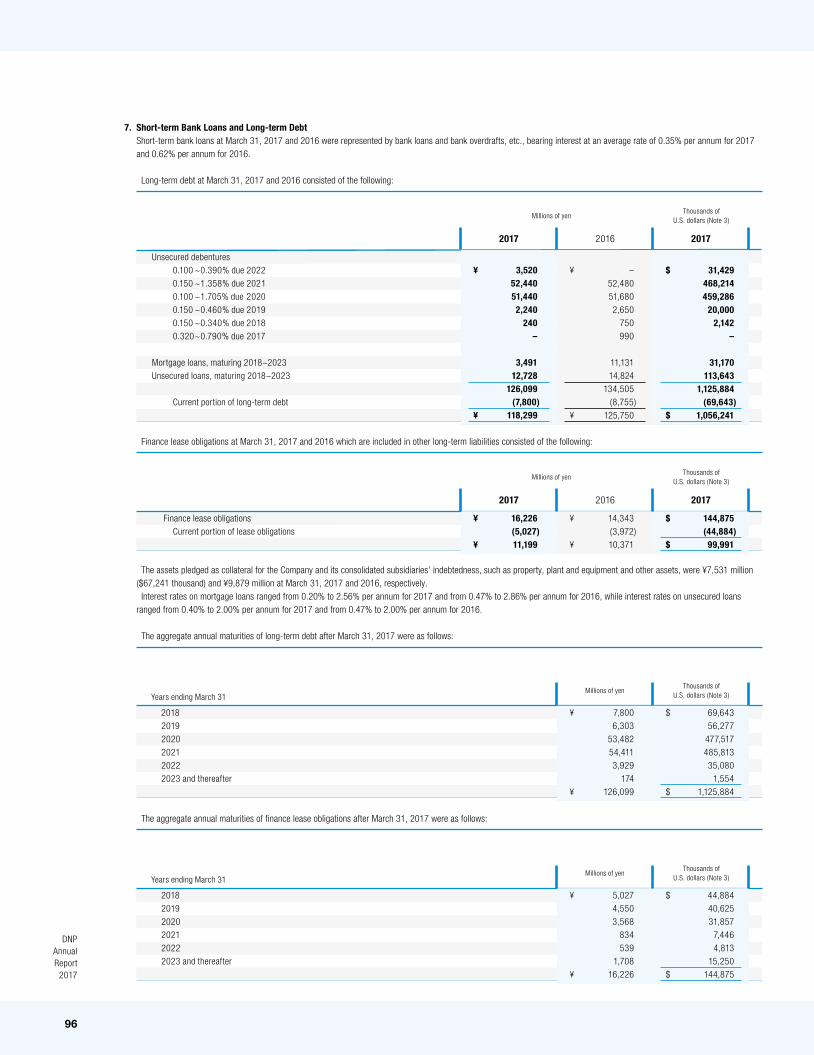
7. Short-term Bank Loans and Long-term DebtShort-term bank loans at March 31, 2017 and 2016 were represented by bank loans and bank overdrafts, etc., bearing interest at an average rate of 0.35% per annum for 2017 and 0.62% per annum for 2016.
Long-term debt at March 31, 2017 and 2016 consisted of the following:
Finance lease obligations at March 31, 2017 and 2016 which are included in other long-term liabilities consisted of the following:
The assets pledged as collateral for the Company and its consolidated subsidiaries’ indebtedness, such as property, plant and equipment and other assets, were ¥7,531 million ($67,241 thousand) and ¥9,879 million at March 31, 2017 and 2016, respectively. Interest rates on mortgage loans ranged from 0.20% to 2.56% per annum for 2017 and from 0.47% to 2.86% per annum for 2016, while interest rates on unsecured loans ranged from 0.40% to 2.00% per annum for 2017 and from 0.47% to 2.00% per annum for 2016.
The aggregate annual maturities of long-term debt after March 31, 2017 were as follows:
The aggregate annual maturities of finance lease obligations after March 31, 2017 were as follows:
20172017 2016
Unsecured debentures
0.100 ~0.390% due 2022
0.150 ~1.358% due 2021
0.100 ~1.705% due 2020
0.150 ~0.460% due 2019
0.150 ~0.340% due 2018
0.320 ~0.790% due 2017
Mortgage loans, maturing 2018~2023
Unsecured loans, maturing 2018~2023
Current portion of long-term debt
31,429 468,214 459,286
20,000 2,142
–
31,170 113,643
1,125,884 (69,643)
1,056,241
–
52,480
51,680
2,650
750
990
11,131
14,824
134,505
(8,755)
125,750
3,520 52,440 51,440 2,240
240 –
3,491 12,728
126,099 (7,800)
118,299
¥
¥
¥
¥
$
$
Millions of yenThousands of
U.S. dollars (Note 3)
20172017 2016
Finance lease obligations
Current portion of lease obligations
144,875 (44,884)99,991
14,343
(3,972)
10,371
16,226 (5,027)11,199
¥
¥
¥
¥
$
$
Millions of yenThousands of
U.S. dollars (Note 3)
2018
2019
2020
2021
2022
2023 and thereafter
69,643
56,277
477,517
485,813
35,080
1,554
1,125,884
7,800
6,303
53,482
54,411
3,929
174
126,099
¥
¥
$
$
Millions of yenThousands of
U.S. dollars (Note 3)Years ending March 31
2018
2019
2020
2021
2022
2023 and thereafter
44,884
40,625
31,857
7,446
4,813
15,250
144,875
5,027
4,550
3,568
834
539
1,708
16,226
¥
¥
$
$
Millions of yenThousands of
U.S. dollars (Note 3)Years ending March 31

97
2 Synopsis of Performance
6 Message to Shareholders
54 How DNP Works to Achieve Sustainable Development
14 Special Feature
40 Segment Information
108 Appendix
30 DNP in Brief
72 Financial Section
8. Retirement BenefitsThe Company and its subsidiaries have several retirement plans covering all of their employees, i.e. defined benefit corporate pension plan, a governmental welfare contributory pension plan, lump-sum retirement plan and defined contribution pension plan. Upon retirement or termination of employment for reasons other than the cause of dismissal, employees are entitled to lump-sum payments based on the current rate of pay, length of services and accumulated number of points determined based on the employment services. Under the Defined Benefit Pension Plan Law, the Company has established new defined benefit pension plans on March 1, 2005 under which most of the retirement benefit liability of the Company and its subsidiaries is covered by the employees’ pension fund.
The reconciliation of beginning and ending balance of the projected benefit obligation at March 31, 2017 and 2016 were as follows:
The reconciliation of beginning and ending balance of the plan assets at March 31, 2017 and 2016 were as follows:
The reconciliation of projected benefit obligation and plan assets to net defined benefit liability and asset recognized in the consolidated balance sheets as of March 31, 2017 and 2016 were as follows:
20172017 2016
Balance at the beginning of year
Service cost
Interest cost
Actuarial gain/loss
Benefits paid
Prior service cost
Change of scope of consolidation
Increase due to change from simplified method to principle method
Other
Balance at the end of year
2,222,723 126,750
9,750 (16,589)(72,018)
1,304 (5,795)
– (214)
2,265,911
225,153
12,678
1,667
15,230
(8,359)
2,543
143
209
(319)
248,945
248,945 14,196 1,092
(1,858)(8,066)
146 (649)
– (24)
253,782
¥
¥
¥
¥
$
$
Millions of yenThousands of
U.S. dollars (Note 3)
Change in projected benefit obligation:
20172017 2016
Balance at the beginning of year
Expected return on plan assets
Actuarial gain/loss
Contributions by the employer
Benefits paid
Other
Balance at the end of year
2,326,982 58,607 54,929 80,866
(59,839)259
2,461,804
258,736
6,494
(13,401)
14,945
(6,261)
109
260,622
260,622 6,564 6,152 9,057
(6,702)29
275,722
¥
¥
¥
¥
$
$
Millions of yenThousands of
U.S. dollars (Note 3)
Change in plan assets:
20172017 2016
Funded projected benefit obligation
Plan assets
Unfunded projected benefit obligation
Net amount of liabilities and assets recognized in consolidated balance sheets
Net defined benefit liability
Net defined benefit asset
Net amount of liabilities and assets recognized in consolidated balance sheets
1,960,759 (2,461,804)
(501,045)305,152
(195,893)
313,830 (509,723)(195,893)
215,598
(260,622)
(45,024)
33,347
(11,677)
34,167
(45,844)
(11,677)
219,605 (275,722)
(56,117)34,177
(21,940)
35,149 (57,089)(21,940)
¥
¥
¥
¥
¥
¥
$
$
$
Millions of yenThousands of
U.S. dollars (Note 3)

98
DNPAnnualReport
2017
The components of net periodic benefit costs for the years ended March 31, 2017 and 2016 were as follows:
Remeasurements of defined benefit plans, before income-tax effect, recorded under accumulated other comprehensive income at March 31, 2017 and 2016 consisted of:
20172017 2016
Unrecognized actuarial gain/loss
Unrecognized prior service cost
Total
37,027 (17,554)19,473
(4,687)
(2,443)
( 7,130)
4,147 (1,966)2,181
¥
¥
¥
¥
$
$
Millions of yenThousands of
U.S. dollars (Note 3)
The major categories of plan assets as of March 31, 2017 and 2016 were as follows:
20162017
Bonds
Stocks
Alternative
Other
Total
22%
45%
22%
11%
100%
19%46%26%
9%100%
Assumptions used for the years ended March 31, 2017 and 2016 were set forth as follows:
20162017
Discount rate
Long-term expected rate of return on plan assets
0.6%
mainly 2.5%
0.8%mainly 2.5%
9. Net AssetsJapanese companies are subject to the Companies Act of Japan (the “Companies Act”). The significant provisions in the Companies Act that affect financial and accounting matters are summarized below:
(a) DividendsUnder the Companies Act, companies can pay dividends at any time during the fiscal year in addition to the year-end dividend upon resolution at the stockholders meeting. For companies that meet certain criteria such as; (1) having the Board of Directors, (2) having independent auditors, (3) having the Board of Corporate Auditors, and (4) the term of service of the directors is prescribed as one year rather than two years of normal term by its articles of incorporation, the Board of Directors of such company may declare dividends (except for dividends in kind) at any time during the fiscal year if the company has prescribed so in its articles of incorporation. The Company meets all the above criteria. However, its articles of incorporation have not stipulated that the Board of Directors may declare dividends at any time during the fiscal year. The Companies Act permits companies to distribute dividends-in-kind (non-cash assets) to stockholders subject to a certain limitation and additional requirements. Semiannual interim dividends may also be paid once a year upon resolution by the Board of Directors if the articles of incorporation of the company so stipulate. The Companies Act provides certain limitations on the amounts available for dividends or the purchase of treasury stock. The limitation is defined as the amount available for distribution to the stockholders, but the amount of net assets after dividends must be maintained at no less than ¥3 million. Cash dividends of ¥16.00 ($0.1) per share, aggregating ¥9,852 million ($87,964 thousand) were approved at the general stockholders’ meeting held in June 29, 2017 with respect to the year ended March 31, 2017.
(b) Increases/decreases and transfer of common stock, reserve and surplusThe Companies Act requires that an amount equal to 10% of dividends must be appropriated as a legal reserve (a component of retained earnings) or as additional paid-in capital (a component of capital surplus) depending on the equity account charged upon the payment of such dividends until the total of aggregate amount of legal reserve and additional paid-in capital equals 25% of the common stock. Under the Companies Act, the total amount of additional paid-in capital and legal reserve may be reversed without
20172017 2016
Service cost
Interest cost
Expected return on plan assets
Actuarial gain/loss
Amortization of prior sevice cost
Amortization due to change from simplified method to principle method
Net periodic benefit costs of the defined benefit plan
126,589 9,750
(58,607)7,205 5,857
– 90,794
12,626
1,667
(6,494)
(7,038)
880
208
1,849
14,178 1,092
(6,564)807 656
– 10,169
¥
¥
¥
¥
$
$
Millions of yenThousands of
U.S. dollars (Note 3)

99
2 Synopsis of Performance
6 Message to Shareholders
54 How DNP Works to Achieve Sustainable Development
14 Special Feature
40 Segment Information
108 Appendix
30 DNP in Brief
72 Financial Section
20172017 2016
Trade receivables
Other current assets
Investment securities
Long-term loan receivables
Other investments
Trade payables
Accrued expenses
Other current liabilities
38,563 1,375
476,554 1,607 5,920
37,321 3,491 8,848
5,133
230
56,464
180
602
4,420
579
973
4,319 154
53,374 180 663
4,180 391 991
¥ ¥ $
Millions of yenThousands of
U.S. dollars (Note 3)
20172017 2016
Salaries and allowances
Accrued bonuses
Provision for retirement benefits
Depreciation
Research and development expenses
Other
610,232 54,831 21,339
143,411 280,143 993,598
2,103,554
68,621
6,048
(616)
15,880
31,827
115,481
237,241
68,346 6,141 2,390
16,062 31,376
111,283 235,598
¥
¥
¥
¥
$
$
Millions of yenThousands of
U.S. dollars (Note 3)
20172017 2016
Interest and dividends income
Rent income on facilities
Rent expense
402 1,223 (250)
76
148
(114)
45 137 (28)
¥ ¥ $
Millions of yenThousands of
U.S. dollars (Note 3)
10. Accounts with Non-consolidated Subsidiaries and Associated Companies Account balances with non-consolidated subsidiaries and associated companies as of March 31, 2017 and 2016 were summarized as follows:
11. Selling, General and Administrative Expenses Selling, general and administrative expenses for the years ended March 31, 2017 and 2016 consisted of the following:
12. Other Income (Expenses) The following types of income (expenses) from non-consolidated subsidiaries and associated companies were included in other income.
13. Income TaxesThe Company and its domestic consolidated subsidiaries are subject to a number of different taxes based on income, which, in the aggregate, resulted in a normal effective statutory tax rate of approximately 30.9% and 33.1% for the years ended March 31, 2017 and 2016, respectively. The actual effective tax rate reflected in the accompanying consolidated statements of income differs from the normal effective statutory tax rate primarily due to the effect of permanently non-deductible expenses, current operating losses and different tax rates applicable to foreign subsidiaries, etc.
limitation. The Companies Act also provides that common stock, legal reserve, additional paid-in capital, other capital surplus and retained earnings can be transferred among the accounts under certain conditions upon resolution of the stockholders.
(c) Treasury stock and treasury stock acquisition rightsThe Companies Act also provides for companies to purchase treasury stock and dispose of such treasury stock by resolution of the Board of Directors. The amount of treasury stock purchased cannot exceed the amount available for distribution to the stockholders which is determined by a specific formula. Under the Companies Act, stock acquisition rights are presented as a separate component of net assets. The Companies Act also provides that companies can purchase both treasury stock acquisition rights and treasury stock. Such treasury stock acquisition rights are presented as a separate component of net assets or deducted directly from stock acquisition rights. At present, the Company has not issued such stock acquisition rights. Upon approval by the resolution of the Board of Directors, the Company purchased 13,222 thousand shares of common stocks at an aggregate cost of ¥15,000 million ($133,929 thousand) during the year ended March 31, 2017. Furthermore, the Company retired 17,000 thousand shares of common stocks at an aggregate cost of ¥26,565 million ($237,188 thousand) during the year ended March 31, 2017.

100
DNPAnnualReport
2017
No reconciliation of the differences between the normal effective statutory tax rate and the actual effective tax rate for the year ended March 31, 2017 was shown because the difference was less than five percent of the statutory tax rate, although the difference for 2016 was shown as follows.
Net deferred tax assets (liabilities) at March 31, 2017 and 2016, resulting from temporary differences between the carrying amounts and the tax bases of assets and liabilities were reflected on the accompanying consolidated balance sheets under the following captions:
Significant components of deferred tax assets and liabilities at March 31, 2017 and 2016 were as follows :
20162017
Normal effective statutory tax rate
Expenses not deductible for income tax purposes
Amortization of consolidation goodwill
Change in valuation allowance
Equity in earnings of affiliates
Loss on business integration
The effective income tax rate change
Other
Actual effective tax rate
33.1%
3.4
0.9
(0.3)
(2.2)
–
1.8
0.0
36.7%
–––––––––
20172017 2016
Prepaid expenses and other current assets
Other assets
Other current liabilities
Other long-term liabilities
Net deferred tax assets (liabilities)
136,741 65,054
(143)(590,598)(388,946)
10,744
6,732
(20)
(48,884)
(31,428)
15,315 7,286
(16)(66,147)(43,562)
¥
¥
¥
¥
$
$
Millions of yenThousands of
U.S. dollars (Note 3)
20172017 2016
Deferred tax assets:
Net defined benefit liability
Loss on devaluation of investment securities
Excess provision for doubtful receivables
Accrued bonuses
Loss on write-down of inventories
Operating loss carryforwards
Impairment loss on fixed assets
Other
Total deferred tax assets
Less: valuation allowance
Total
Deferred tax liabilities:
Unrealized gain on available-for-sale securities
Reserve for special depreciation
Undistributed earnings of subsidiaries
Net defined benefit asset
Other
Total
Net deferred tax assets (liabilities) :
134,670 25,018 11,884 46,848 10,723
278,929 86,920
198,106 793,098
(439,009)354,089
(564,223)(607)
(7,143)(155,973)
(15,089)(743,035)
(388,946)
14,281
2,967
2,044
5,323
1,068
35,062
10,356
18,645
89,746
(51,858)
37,888
(52,409)
(90)
(806)
(14,028)
(1,983)
(69,316)
(31,428)
15,083 2,802 1,331 5,247 1,201
31,240 9,735
22,188 88,827
(49,169)39,658
(63,193)(68)
(800)(17,469)(1,690)
(83,220)
(43,562)
¥
¥
¥
¥
¥
¥
¥
¥
¥
¥
$
$
$
$
$
Millions of yenThousands of
U.S. dollars (Note 3)

101
2 Synopsis of Performance
6 Message to Shareholders
54 How DNP Works to Achieve Sustainable Development
14 Special Feature
40 Segment Information
108 Appendix
30 DNP in Brief
72 Financial Section
14. Leases Operating Leases
The amounts of outstanding future payments under non-cancelable operating leases as of March 31, 2017 and 2016 were also summarized as follows:
20172017 2016
One year or less
More than one year
47,036 142,179 189,215
5,107
16,088
21,195
5,268 15,924 21,192
¥
¥
¥
¥
$
$
Millions of yenThousands of
U.S. dollars (Note 3)
Future lease payments:
(1) Cash and deposits
(2) Trade receivables
(3) Short-term and long-term investment securities
(4) Long-term loan receivables
Allowance for doubtful receivables*1
Assets
(1) Trade payables
(2) Short-term bank loans
(3) Long-term debts
Liabilities
Derivatives*2
[1] Hedge accounting is not applied
[2] Hedge accounting is applied
Total
– –
17,140
422 17,562
– –
4,162 4,162
– – –
215,455 341,805 347,403
4,359
4,359 909,022 247,562 43,036
130,261 420,859
(107)(14)
(121)
215,455 341,805 330,263
4,390 (453)
3,937 891,460 247,562 43,036
126,099 416,697
(107)(14)
(121)
¥
¥¥
¥
¥
¥
¥
¥¥
¥
¥
¥
¥
¥¥
¥
¥
¥
Millions of yen
Differences
Carrying amountsreported in theconsolidated
balance sheet
Fair value
March 31, 2017
(1) Cash and deposits
(2) Trade receivables
(3) Short-term and long-term investment securities
(4) Long-term loan receivables
Allowance for doubtful receivables*1
Assets
(1) Trade payables
(2) Short-term bank loans
(3) Long-term debts
Liabilities
Derivatives*2
[1] Hedge accounting is not applied
[2] Hedge accounting is applied
Total
– –
153,036
3,768 156,804
– –
37,161 37,161
– – –
1,923,705 3,051,830 3,101,813
38,920
38,920 8,116,268 2,210,375
384,250 1,163,045 3,757,670
(955)(125)
(1,080)
1,923,705 3,051,830 2,948,777
39,197 (4,045)35,152
7,959,464 2,210,375
384,250 1,125,884 3,720,509
(955)(125)
(1,080)
$
$$
$
$
$
$
$$
$
$
$
$
$$
$
$
$
Thousands of U.S. dollars (Note 3)
Differences
Carrying amountsreported in theconsolidated
balance sheet
Fair value
March 31, 2017
15. Financial Instruments 1. Management policyThe Company and its consolidated subsidiaries manage fund surpluses through financial assets that have high levels of safety, and raise funds through bank loans and bond issuances. The Company and its subsidiaries also utilize derivative financial instruments to hedge the risk of exchange rate and interest rate fluctuations and do not enter into derivatives for trading or speculative purposes. The trade receivables are exposed to credit risk of customers and the Company and its subsidiaries minimize the credit risk in accordance with internal customer credit management rules. Long-term investments are mainly equity securities. Listed stocks are stated at fair value based on market prices quarterly.
2. Fair value of financial instrumentsFair value and difference compared to the carrying amounts reported in the consolidated balance sheets as of March 31, 2017 and 2016 were as follows:

102
DNPAnnualReport
2017
(1) Cash and deposits
(2) Trade receivables
(3) Short-term and long-term investment securities
(4) Long-term loan receivables
Allowance for doubtful receivables*1
Assets
(1) Trade payables
(2) Short-term bank loans
(3) Long-term debts
Liabilities
Derivatives*2
[1] Hedge accounting is not applied
[2] Hedge accounting is applied
Total
–
–
13,459
1,059
14,518
–
–
5,665
5,665
–
–
–
176,694
348,585
319,048
6,772
6,772
851,099
255,586
55,316
140,170
451,072
700
(17)
683
176,694
348,585
305,589
6,793
(1,080)
5,713
836,581
255,586
55,316
134,505
445,407
700
(17)
683
¥
¥
¥
¥
¥
¥
¥
¥
¥
¥
¥
¥
¥
¥
¥
¥
¥
¥
Millions of yen
Differences
Carrying amountsreported in theconsolidated
balance sheet
Fair value
March 31, 2016
Unlisted equity securities
Other
445,929 1,045
49,944 117
¥ $
Carrying amountsCarrying amountsMarch 31, 2017
Millions of yenThousands of
U.S. dollars (Note 3)
Unlisted equity securities
Other
56,934
140
¥
Carrying amountsMarch 31, 2016
Millions of yen
*1. Allowance for doubtful receivables associated with long-term loan receivables is deducted.*2. Derivative assets and liabilities are on a net basis.
Note A: Fair value of financial instruments, marketable securities and derivatives
Assets(1) Cash and deposits and (2) Trade receivablesThe carrying amounts approximate fair value because of the short maturities of these instruments.
(3) Marketable and investment securitiesThe fair values of equity securities are measured at the quoted market price of the stock exchange and the fair values of debt securities are measured at the quoted price provided by financial institutions.
(4) Long-term loan receivablesThe fair values of long-term loans are mainly determined based on the present value of the future cash flows discounted by government bonds rates plus certain credit risk premiums by categories according to the internal ratings.
Liabilities(1) Trade payables and (2) Short-term bank loansThe carrying amounts approximate fair value because of the short maturities of these instruments.
(3) Long-term debtsThe fair values of bonds issued by the Company and its subsidiaries are measured based on market price, if available. The fair values of bonds without market price are measured at the present value of total principal and interest discounted by using a rate which reflects its remaining period and credit risk. The fair values of long-term debts are based on the present value of total principal and interest discounted by using the current borrowing rate for similar debt.
DerivativesInformation about the fair value for derivatives is included in Note 16.
Note B: Financial instruments whose fair value is extremely difficult to measure
The above are not included in “(3) Marketable and investment securities” because there is no market value and it is extremely difficult to measure the fair value.

103
2 Synopsis of Performance
6 Message to Shareholders
54 How DNP Works to Achieve Sustainable Development
14 Special Feature
40 Segment Information
108 Appendix
30 DNP in Brief
72 Financial Section
16. Derivative Financial InstrumentsNature of Derivative Financial Instruments:The Company and certain consolidated subsidiaries enter into derivatives for foreign currency forward contracts, currency swap contracts, and interest rate swaps to manage the risk arising from fluctuation in foreign currency exchange rates and interest rates. Derivatives related to currency are utilized to hedge foreign exchange risks associated with certain accounts receivable, accounts payable and other debts, including forecasted transactions, denominated in foreign currencies. Interest rate swaps are utilized to hedge interest rate risks on interest-bearing debts. The Company and its subsidiaries do not hold derivatives for speculative purposes. Derivatives are subject to market risks and credit risks. Because the counterparties to those derivatives are limited to major international financial institutions, the Company and its subsidiaries do not anticipate any losses arising from credit risks. The Accounting Department controls and executes derivatives based on the internal policies of the Company.
Fair value of derivatives:The contracted amount and fair value of derivatives at March 31, 2017 and 2016 were as follows:
Derivative transactions to which the Company and its subsidiaries did not apply hedge accounting
Unrealized gain (loss)Contracted amount Fair value
Millions of yen
March 31, 2017
Unrealized gain (loss)Contracted amount Fair value
Thousands of U.S. dollars (Note 3)
March 31, 2017
Unrealized gain (loss)Contracted amount Fair value
Millions of yen
March 31, 2016
Foreign currency forward contracts
Receivables:
U.S. dollars
Euro
Payables:
U.S. dollars
(108)1
(0)(107)
(108)1
(0)(107)
17,345 1,859
24 19,228
¥
¥
¥
¥
¥
¥
Foreign currency forward contracts
Receivables:
U.S. dollars
Euro
Payables:
U.S. dollars
(964)9
(0)(955)
(964)9
(0)(955)
154,866 16,598
215 171,679
$
$
$
$
$
$
Foreign currency forward contracts
Receivables:
U.S. dollars
Euro
Payables:
U.S. dollars
690
10
0
700
690
10
0
700
19,805
1,605
182
21,592
¥
¥
¥
¥
¥
¥

104
DNPAnnualReport
2017
Derivative transactions to which the Company and its subsidiaries applied hedge accounting
The fair values of foreign currency forward contracts and currency swap contracts subject to alternative method are included in trade receivables, trade payables and long-term loan payables as hedged items. The fair values of interest rate swap contracts subject to exceptional accrual method are included in long-term loan payables as hedged items. Fair value of derivatives is based on forward exchange rates or information provided by financial institutions at the end of the fiscal year.
Fair valueHedged items Contracted amount
Millions of yen
March 31, 2017
Foreign currency forward contracts
Receivables:
U.S. dollars
Euro
Payables:
U.S. dollars
Sterling pound
Euro
Japanese yen
Interest rate swaps
Receive floating and pay fixed
(0)0
(13)(0)(1)0
(14)
–
192 8
1,481 2
164 67
1,914
70
Trade receivables
Trade receivables
Trade payables
Trade payables
Trade payables
Trade payables
Long-term loan payables
¥
¥
¥
¥
¥
¥
Fair valueHedged items Contracted amount
Thousands of U.S. dollars (Note 3)
March 31, 2017
Foreign currency forward contracts
Receivables:
U.S. dollars
Euro
Payables:
U.S. dollars
Sterling pound
Euro
Japanese yen
Interest rate swaps
Receive floating and pay fixed
(0)0
(116)(0)(9)0
(125)
–
1,714 72
13,223 18
1,464 598
17,089
625
Trade receivables
Trade receivables
Trade payables
Trade payables
Trade payables
Trade payables
Long-term loan payables
$
$
$
$
$
$
Fair valueHedged items Contracted amount
Millions of yen
March 31, 2016
Foreign currency forward contracts
Receivables:
U.S. dollars
Payables:
U.S. dollars
Sterling pound
Euro
Interest rate swaps
Receive floating and pay fixed
–
(13)
(3)
(1)
(17)
–
131
2,220
92
331
2,774
5,202
Trade receivables
Trade payables
Trade payables
Trade payables
Long-term loan payables
¥
¥
¥
¥
¥
¥

105
2 Synopsis of Performance
6 Message to Shareholders
54 How DNP Works to Achieve Sustainable Development
14 Special Feature
40 Segment Information
108 Appendix
30 DNP in Brief
72 Financial Section
17. Contingent LiabilitiesThe Company and its consolidated subsidiaries were guarantors of bank loans of other companies, amounting to approximately ¥3 million ($27 thousand) and ¥7 million at March 31, 2017 and 2016, respectively. It is common practice in Japan for companies, in the ordinary course of business, to receive promissory notes in settlement of trade accounts receivable and to subsequently discount such notes at banks. At March 31, 2017 and 2016, the Company and its consolidated subsidiaries were contingently liable on trade notes discounted in the amount of ¥626 million ($5,589 thousand) and ¥628 million, respectively.
Millions of yenReportable segment
For 2017 :
Net sales and operating income
Net sales
Outside customers
Intersegment
Total
Segment income
Segment assets
Others
Depreciation and amortization
Amortization of goodwill
Impairment loss
Increase in property, plant and equipment
and intangible assets
1,410,173 –
1,410,173 31,411
1,741,904
61,461 2,317
896
57,085
¥
¥
¥
Consolidated
– (5,254)(5,254)
(20,821)120,956
2,322 – –
4,197
¥
¥
¥
Adjustment
1,410,173 5,254
1,415,427 52,232
1,620,948
59,139 2,317 896
52,888
¥
¥
¥
Total
56,581 39
56,620 2,430
47,526
¥2,367 – 1
3,805
¥
¥
¥
Beverages
169,402 6
169,408 16,484
258,120
12,083 –
61
7,729
¥
¥
¥
Electronics
387,143 1,052
388,195 14,434
439,303
17,028 1,213
–
12,619
¥
¥
¥
Lifestyle andIndustrialSupplies
797,047 4,157
801,204 18,884
875,999
27,661 1,104
834
28,735
¥
¥
¥
InformationCommunication
Thousands of U.S. dollars (Note 3)Reportable segment
For 2017 :
Net sales and operating income
Net sales
Outside customers
Intersegment
Total
Segment income
Segment assets
Others
Depreciation and amortization
Amortization of goodwill
Impairment loss
Increase in property, plant and equipment
and intangible assets
12,590,830 –
12,590,830 280,455
15,552,714
548,759 20,688
8,000
509,688
$
$
$
Consolidated
– (46,911)(46,911)
(185,902)1,079,964
20,732 – –
37,473
$
$
$
Adjustment
12,590,830 46,911
12,637,741 466,357
14,472,750
528,027 20,688
8,000
472,215
$
$
$
Total
505,188 348
505,536 21,696
424,339
21,134 – 9
33,973
$
$
$
Beverages
1,512,518 54
1,512,572 147,179
2,304,643
107,884 –
545
69,009
$
$
$
Electronics
3,456,633 9,393
3,466,026 128,875
3,922,348
152,036 10,831
–
112,670
$
$
$
Lifestyle andIndustrialSupplies
7,116,491 37,116
7,153,607 168,607
7,821,420
246,973 9,857 7,446
256,563
$
$
$
InformationCommunication
Millions of yenReportable segment
For 2016 :
Net sales and operating income
Net sales
Outside customers
Intersegment
Total
Segment income
Segment assets
Others
Depreciation and amortization
Amortization of goodwill
Impairment loss
Increase in property, plant and equipment
and intangible assets
1,455,916
–
1,455,916
45,472
1,718,636
65,310
2,201
110
97,265
¥
¥
¥
Consolidated
–
(5,798)
(5,798)
(17,989)
64,703
1,821
–
–
2,393
¥
¥
¥
Adjustment
1,455,916
5,798
1,461,714
63,461
1,653,933
63,489
2,201
110
94,872
¥
¥
¥
Total
58,063
32
58,095
991
45,800
3,941
1
8
5,781
¥
¥
¥
Beverages
199,330
20
199,350
20,509
273,403
15,008
–
–
13,277
¥
¥
¥
Electronics
381,648
999
382,647
12,597
441,761
17,026
607
–
23,277
¥
¥
¥
Lifestyle andIndustrialSupplies
816,875
4,747
821,622
29,364
892,969
27,514
1,593
102
52,537
¥
¥
¥
InformationCommunication
18. Segment Information Outline of reportable segments:
The Company and its consolidated subsidiaries' reportable segments are components of the group whose operating results are regularly reviewed by the Board of Directors to make decisions about resources to be allocated to the segments and assess their performance, for which discrete financial information is available. The group's reportable segments consist of Information Communication, Lifestyle and Industrial Supplies, Electronics, and Beverages, based on a classification by commonality in manufacturing and marketing method of products.
Information on sales and profit, identifiable assets and other items by reportable segment
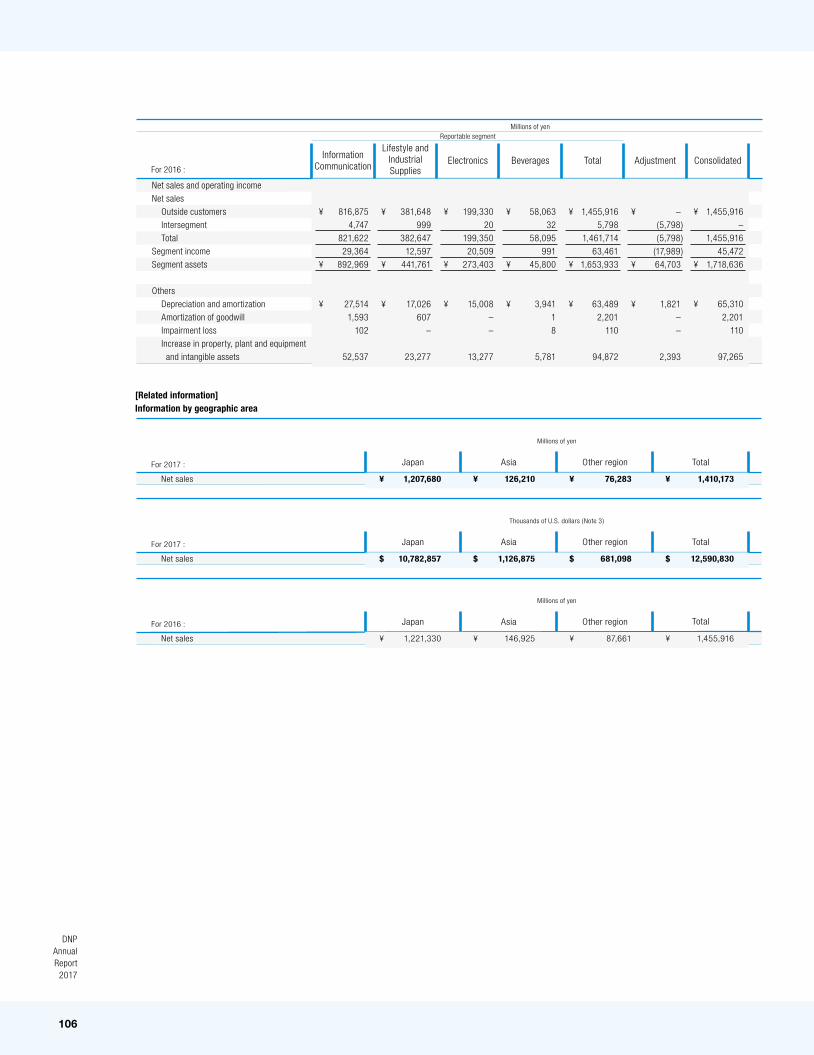
106
DNPAnnualReport
2017
[Related information] Information by geographic area
Millions of yenReportable segment
For 2017 :
Net sales and operating income
Net sales
Outside customers
Intersegment
Total
Segment income
Segment assets
Others
Depreciation and amortization
Amortization of goodwill
Impairment loss
Increase in property, plant and equipment
and intangible assets
1,410,173 –
1,410,173 31,411
1,741,904
61,461 2,317
896
57,085
¥
¥
¥
Consolidated
– (5,254)(5,254)
(20,821)120,956
2,322 – –
4,197
¥
¥
¥
Adjustment
1,410,173 5,254
1,415,427 52,232
1,620,948
59,139 2,317 896
52,888
¥
¥
¥
Total
56,581 39
56,620 2,430
47,526
¥2,367 – 1
3,805
¥
¥
¥
Beverages
169,402 6
169,408 16,484
258,120
12,083 –
61
7,729
¥
¥
¥
Electronics
387,143 1,052
388,195 14,434
439,303
17,028 1,213
–
12,619
¥
¥
¥
Lifestyle andIndustrialSupplies
797,047 4,157
801,204 18,884
875,999
27,661 1,104
834
28,735
¥
¥
¥
InformationCommunication
Thousands of U.S. dollars (Note 3)Reportable segment
For 2017 :
Net sales and operating income
Net sales
Outside customers
Intersegment
Total
Segment income
Segment assets
Others
Depreciation and amortization
Amortization of goodwill
Impairment loss
Increase in property, plant and equipment
and intangible assets
12,590,830 –
12,590,830 280,455
15,552,714
548,759 20,688
8,000
509,688
$
$
$
Consolidated
– (46,911)(46,911)
(185,902)1,079,964
20,732 – –
37,473
$
$
$
Adjustment
12,590,830 46,911
12,637,741 466,357
14,472,750
528,027 20,688
8,000
472,215
$
$
$
Total
505,188 348
505,536 21,696
424,339
21,134 – 9
33,973
$
$
$
Beverages
1,512,518 54
1,512,572 147,179
2,304,643
107,884 –
545
69,009
$
$
$
Electronics
3,456,633 9,393
3,466,026 128,875
3,922,348
152,036 10,831
–
112,670
$
$
$
Lifestyle andIndustrialSupplies
7,116,491 37,116
7,153,607 168,607
7,821,420
246,973 9,857 7,446
256,563
$
$
$
InformationCommunication
Millions of yenReportable segment
For 2016 :
Net sales and operating income
Net sales
Outside customers
Intersegment
Total
Segment income
Segment assets
Others
Depreciation and amortization
Amortization of goodwill
Impairment loss
Increase in property, plant and equipment
and intangible assets
1,455,916
–
1,455,916
45,472
1,718,636
65,310
2,201
110
97,265
¥
¥
¥
Consolidated
–
(5,798)
(5,798)
(17,989)
64,703
1,821
–
–
2,393
¥
¥
¥
Adjustment
1,455,916
5,798
1,461,714
63,461
1,653,933
63,489
2,201
110
94,872
¥
¥
¥
Total
58,063
32
58,095
991
45,800
3,941
1
8
5,781
¥
¥
¥
Beverages
199,330
20
199,350
20,509
273,403
15,008
–
–
13,277
¥
¥
¥
Electronics
381,648
999
382,647
12,597
441,761
17,026
607
–
23,277
¥
¥
¥
Lifestyle andIndustrialSupplies
816,875
4,747
821,622
29,364
892,969
27,514
1,593
102
52,537
¥
¥
¥
InformationCommunication
TotalAsia Other region
Net sales 1,410,173 76,283 126,210 ¥ ¥ ¥
Millions of yen
For 2017 :
TotalAsia Other region
Net sales 12,590,830 681,098 1,126,875 $ $ $
Thousands of U.S. dollars (Note 3)
For 2017 :
Asia
Japan
Japan
Japan
Net sales 1,455,916 87,661 146,925 ¥
1,207,680 ¥
10,782,857 $
1,221,330 ¥ ¥ ¥
Millions of yen
For 2016 : TotalOther region

107
2 Synopsis of Performance
6 Message to Shareholders
54 How DNP Works to Achieve Sustainable Development
14 Special Feature
40 Segment Information
108 Appendix
30 DNP in Brief
72 Financial Section
Independent Auditors’ Report
To the Board of Directors of Dai Nippon Printing Co., Ltd.:
Report on the Consolidated Financial Statements
We have audited the accompanying consolidated balance sheet of Dai Nippon Printing Co., Ltd. and consolidated subsidiaries as of March 31, 2017 and the related consolidated statements of income, comprehensive income, changes in equity, and cash flows for the year then ended, and a summary of significant accounting policies and other explanatory information (all expressed in Japanese yen).
Management’s Responsibility for the Consolidated Financial Statements
Management is responsible for the preparation and fair presentation of these consolidated financial statements in conformity with accounting principles generally accepted in Japan, and for such internal control as management determines is necessary to enable the preparation of consolidated financial statements that are free from material misstatements, whether due to fraud or error.
Auditor’s ResponsibilityOur responsibility is to express an opinion on these consolidated financial statements based on our audit. We conducted our audit in conformity with auditing standards generally accepted in Japan. Those standards require that we plan and perform the audit to obtain reasonable assurance about whether the consolidated financial statements are free from material misstatement.
An audit involves performing procedures to obtain audit evidence about the amounts and disclosures in the consolidated financial statements. The procedures selected depend on the auditor’s judgment, including the assessment of the risks of material misstatement of the consolidated financial statements, whether due to fraud or error. In making those risk assessments, the auditor considers internal control relevant to the entity’s preparation and fair presentation of the consolidated financial statements in order to design audit procedures that are appropriate in the circumstances, but not for the purpose of expressing an opinion on the effectiveness of the entity’s internal control. An audit also includes evaluating the appropriateness of accounting policies used and the reasonableness of accounting estimates made by management, as well as evaluating the overall presentation of the consolidated financial statements.
We believe that the audit evidence we have obtained is sufficient and appropriate to provide a basis for our audit opinion.
Opinion
In our opinion, the consolidated financial statements referred to above present fairly, in all material respects, the consolidated financial position of Dai Nippon Printing Co., Ltd. and consolidated subsidiaries as of March 31, 2017, and the consolidated results of their operations and their cash flows for the year then ended in conformity with accounting principles generally accepted in Japan.
Convenience Translation
Our audit also comprehended the translation of Japanese yen amounts into U.S. dollar amounts and, in our opinion, such translation has been made in conformity with the basis stated in Note 3 to the consolidated financial statements. Such U.S. dollar amounts are presented solely for the convenience of readers outside Japan.
Tokyo, JapanJune 29, 2017
ARK MEIJI AUDIT & Co.