Financial S R novembeR 2017 - NBS · portant aspect of its contribution to financial stability is...
52
FINANCIAL STABILITY REPORT NOVEMBER 2017
Transcript of Financial S R novembeR 2017 - NBS · portant aspect of its contribution to financial stability is...

Financial
Stability RepoRt
novembeR 2017

Published by:© Národná banka Slovenska 2017
Address:Národná banka SlovenskaImricha Karvaša 1813 25 BratislavaSlovakia
Telephone:+421 2 5787 2146
Fax:+421 2 5787 1128
http://www.nbs.sk
All rights reserved.Reproduction for educational and non-commercial purposes is permitted provided that the source is acknowledged.
ISSN 1338-6352 (online)

3NBS
Financial Stability RepoRtNovemBer 2017
Contents
FOREWORD 4
OVERVIEW 5
1 MACROECONOMIC ENVIRONMENT AND FINANCIAL MARKETS 9
1.1 The global economy is recovering against a backdrop of low financial market volatility 10
1.2 Slovakia’s economy is growing, and its labour market is thriving 14
2 FINANCIAL SECTOR TRENDS AND RISKS 17
2.1 Household credit growth has remained strong 18
2.2 Household debt has increased faster than economic fundamentals would imply 21
Box 1 Future impact of excessive household indebtedness on financial stability and economic growth 21
Box 2 A comparison of retail lending volume and economic fundamentals – an econometric analysis 24
2.3 As lending to non-financial corporations (NFCs) has increased, so too has NFC debt 27
Box 3 NFC financing in the capital market 292.4 Risks in the commercial real estate
(CRE) sector 31
2.5 In the low interest rate environment, banks are becoming increasingly sensitive to adverse effects 32
2.6 The financial sector will continue to face significant regulatory risks 35
2.7 Liquidity risk in the banking sector has increased 37
3 FINANCIAL SECTOR RESILIENCE 403.1 The financial sector’s profitability
and capital position are satisfactory 413.1.1 Financial position of the banking
sector 413.1.2 Profitability in other financial market
segments 423.1.3 Solvency and leverage 423.2 Macroprudential policy
responsiveness 433.2.1 Countercyclical capital buffer 443.2.2 Prudential lending principles fully
implemented in law 453.3 Regulatory changes that may affect
financial sector resilience 47
ABBREVIATIONS 49
LIST OF CHARTS 51
LIST OF TABLES 52

4NBS
Financial Stability RepoRtNovemBer 2017
Foreword
The financial sector is deemed to be stable when it is able to smoothly fulfil its core functions, even amid substantial adverse shocks in the external or domestic economic and financial environ-ment. At the same time, financial sector stability is perceived as a necessary condition for sound functioning of the real economy. Národná ban-ka Slovenska (NBS) contributes to the stability of the whole financial system in Slovakia, in par-ticular through its role as the financial market su-pervisory authority.
Národná banka Slovenska believes that an im-portant aspect of its contribution to financial stability is to keep the public regularly informed about financial sector stability and about any trends which could jeopardise that stability.
Awareness and discussion of such issues is es-sential, particularly since financial stability is af-fected not only by financial sector institutions, but also by the behaviour of non-financial corpo-rations and individuals. NBS therefore publishes a biannual Financial Stability Report (FSR), the main purpose of which is to report on the prin-cipal risks to the stability of the Slovak financial sector.
The aim of the FSR is to provide clear and easy to follow information about the development of factors affecting financial stability in Slovakia, with particular attention paid to the most signif-icant risks to stability. The FSR includes a section on the implementation of macroprudential pol-icy in Slovakia.

5NBS
Financial Stability RepoRtNovemBer 2017
overview
AgAinst the bACkdrop oF An improving world eConomy, severAl risks Are building up And Could threAten FinAnCiAl stAbility in the medium term The pick-up in global economic activity, includ-ing an upward trend in the euro area, has become more pronounced during 2017. The external en-vironment has therefore diminished as a source of risks to financial stability. On the other hand, amid the favourable situation in the economy and also financial markets, certain trends that support the build-up of imbalances are gaining momentum. The most significant such trend is the continuing growth in the both public and private sector indebtedness. In several countries the rate of debt growth is outstripping econom-ic growth, or the rate of increase in household income or in corporate sales. Investor demand in financial markets is increasingly gravitating towards riskier assets. There are increasing signs that the current broad-based price growth in eq-uity and bond markets may in several cases be running ahead of economic fundamentals. The decline in risk premia to ten-year lows and the unusual degree of stability in financial markets could lead investors into underestimating risks.
From a medium-term perspective, financial sta-bility risks may be seen as increasing. As for what may cause a materialisation of these risks, one of the main factors could be a worse than expected deterioration in macroeconomic trends. Much attention is currently being directed towards de-velopments in China, where the increase in the debt burden in the past ten years has been great-er than anywhere else. Another source of risk could be any escalation in geopolitical tension or a stepping-up of protectionist policies. From the view of financial market developments, it is im-portant that the monetary policy normalisation of the major central banks proceeds smoothly.
The Slovak economy has so far in 2017 main-tained steady growth of around 3.1%, driven by domestic demand and, to a lesser extent, foreign demand. Unemployment is at all-time low lev-els, but maintaining that trend over the longer term may not be possible if foreign demand falls. The trend is expected to continue, and in the next period may be a factor in overheating of
the economy. That prospect is largely related to the labour market, with some economic sectors already reporting shortages of skilled labour. In this situation, wages are increasing faster than at any other time in the post-crisis period.
the prinCipAl trend weighing on the stAbility oF the slovAk FinAnCiAl seCtor Continues to be the strong growth in household indebtedness
The stock of loans to households as at September 2017 showed an increase of 13.6% year on year. The growth in housing loans was due in part to expectations surrounding the impact of a new NBS Decree. Credit growth accelerated sharply in the first quarter of 2017, amid media-stoked pub-lic concerns that credit sources could dry up. The rate subsequently returned to a more stable level.
The strong growth in retail loans has resulted in Slovakia having the highest retail credit-to-GDP ratio in the central and eastern European (CEE) region, and this ratio is rising faster in Slovakia than in any other euro area or CEE country. While this rate of increase is partly explained by the real convergence of the Slovak economy, it is above what economic fundamentals would im-ply and may therefore be considered excessive. An important factor in Slovakia is the marked fall in interest rates. By contrast, developments in other macroeconomic indicators (e.g. the rate of decrease in unemployment) have not been sig-nificantly different from those in other countries of the region.
The most significant risk arising from the rap-id growth in household debt is the increase in households’ vulnerability to any worsening of the economic situation. The debt burden of Slo-vak households is now twice as high as it was in the pre-crisis period. Several empirical stud-ies have confirmed that excessive debt growth makes financial crises more likely, amplifies their effects, and reduces the potential for further eco-nomic growth.
Furthermore, although the default rate for con-sumer loans stopped increasing in 2017, its up-ward trend of previous years has left it at an el-evated level.
6NBS
Financial Stability RepoRtNovemBer 2017
O V E R V I E W
národná bAnkA slovenskA is proACtively supporting prudentiAl ApproAChes to the setting oF lending Conditions, so As to ensure thAt borrowers’ debt burdens Are CompAtible with their FinAnCiAl resourCes An NBS Decree laying down conditions for the provision of housing loans (Decree No 10/2016) entered into force on 1 January 2017. Its main purpose is to introduce statutory limits on the debt-service to income (DSTI) ratio for housing loans (to be phased in up to mid-2018) and the loan-to-value ratio for such loans. From the be-ginning of 2018, NBS’s prudential recommenda-tions for lending conditions will also become le-gally binding in respect of consumer loans, while at the same taking into account specific aspects of these loans.
Despite the measures taken, debt levels re-main under strong upward pressure. The main reasons for this are the extremely low level of interest rates, the easing of credit standards and the strength of economic growth, all of which could lead to economic overheating. NBS will continue to closely monitor lending conditions and household debt trends, and will be ready to respond to any imbalances that build up.
the FAvourAble eConomiC situAtion And low interest rAte environment hAve Also been reFleCted in strong growth in lending to non-FinAnCiAl CorporAtions (nFCs)NFC credit growth in Slovakia in the first three quarters of 2017 averaged 9% year on year, which was far higher compared with most other EU countries. The increase in the stock of loans to NFCs was broad-based across loan types, economic sectors and banks. Besides increasing their borrowing from domestic banks, NFCs have also increased the amount of financing they ob-tain from foreign sources and from the issuance of bonds. Hence the indebtedness of NFCs has increased as a ratio to their equity, their sales, and Slovakia’s gross domestic product.
Favourable economic outlooks were also reflect-ed in the commercial real estate (CRE) sector during the first three quarters of 2017. Although banks’ lending to the CRE sector did not increase further, rates of growth in demand and supply in the CRE market accelerated. The positive senti-
ment also spurred growth in lending to the con-struction sector. At the same time, however, the CRE sector represents a significant risk to the do-mestic financial sector owing mainly to the fol-lowing factors: high concentration in the sector; the sector’s pronounced sensitivity to economic trends; the increasing risk that overlending to the sector will amplify the adverse impact of any economic cooling; and the experience from the previous crisis of high losses incurred on CRE lending. This sector, moreover, is financed not only by banks, but to an increasing extent also by investment funds or directly by retail investors. The risk therefore concerns the entire financial system.
AFter deduCtions For one-oFF inCome items in 2016, bAnks’ proFitAbility hAs remAined stAble The continuing strong growth in both house-hold and NFC credit has served to mitigate the adverse impact of falling interest margins on banks’ profitability. Leaving aside extraordinary revenues earned in 2016, the banking sector’s aggregate profit has remained largely the same, year on year, and concerns have receded that it will decline in the years ahead. This, however, presupposes that credit loss provisioning will remain at a low level. In response to falling in-terest margins – and under pressure from parent institutions – banks are increasingly seeking to maintain profitability by increasing lending at the expense of higher risk exposure.
in CompensAting FAlling interest mArgins by meAns oF inCreAsed lending, bAnks Are mAking themselves more vulnerAble to potentiAl Adverse developments in the Future, And in A number oF AreAs The first area is in their profitability or solvency. For example, a deterioration in the risk parame-ters of banks’ loan books will imply that future losses will be greater than today, since they will be incurred on a larger volume of loans. Banks’ sensitivity to a further decline in interest margins will also increase. This applies in particular to small and medium-sized banks, which at present are reporting significantly reduced profits and high credit loss provisioning costs.
On the positive side, the banking sector’s total capital ratio increased during the first half of 2017, largely because the share of their 2016 profits that banks paid as dividends was low-

7NBS
Financial Stability RepoRtNovemBer 2017
O V E R V I E W
er compared with the share of previous profits. From the perspective of financial stability, a no-table change may also be observed in the meth-od of credit loss provisioning for loans showing a significant deterioration in credit quality. Fol-lowing the implementation of IFRS 9, banks will have to provision against such loans based on expected credit losses over the lifetime of the loans.
In response to banks’ mounting vulnerabilities to potential shocks, NBS responded by increas-ing the countercyclical capital buffer (CCyB) rate to 0.5%. In view of the continuing trends in the credit market and the widening of several imbal-ances, the CCyB has been further raised to 1.25% with effect from 1 August 2018. A further hike of the CCyB rate will be considered if credit market pressures continue to increase.
The second area is liquidity risk. Owing to strong credit growth, the maturity mismatch between assets and liabilities, and its coverage by liquid assets, is increasing. This trend is significantly worse in Slovakia than in most other EU coun-tries. Furthermore, loan-to-deposit ratios are also deteriorating. The increasing risk could be partly mitigated by the implementation of a new statutory framework for the issuance of cov-ered bonds, which is due to enter into force in 2018. Its effect will be to make mortgage backed bond significantly more attractive to investors, thereby helping banks to secure cheaper and more accessible sources of long-term funding. On the other hand, the increase in liquidity risk in the Slovak banking sector is related with the replacement of the country’s own requirements for liquidity risk coverage with less stringent Eu-rope-wide regulations.

8NBS
Financial Stability RepoRtNovemBer 2017
O V E R V I E W
Table 1 Principal risks to financial stability in Slovakia
Area Risk NBS regulatory measures and recommendations
Risk
s aris
ing
from
the
exte
rnal
env
ironm
ent
Low interest rates and the impact of accommodative monetary policies
Adverse impact on the business models of banks and insurers, increasing riskiness of pension fund portfolios. Banks’ business models becoming much more vulnerable in the current low interest rate environment Price bubbles forming in riskier assets Increasing market risks in financial institutions’ portfolios
Macroeconomic developments in the domestic economy and global economy
Increasing credit risk costs in the event of adverse macroeconomic developments
A capital conservation buffer – fully phased in since 1 October 2014An additional capital buffer applied to the largest banks on grounds of their systemic importance – being phased in between 2016 and 2018The introduction of a non-zero countercyclical capital buffer rate–set at 0.5% from 1 August 2017 in response to growth in both retail and NFC loans and due to be raised to 1.25% from 1 August 2018An NBS Decree laying down prudential rules for the provision of housing loans (the ‘Housing Loan Decree’) – in force since 1 January 2017 An NBS Decree laying down prudential rules for the provision of consumer loans (the ‘Consumer Loan Decree’) – entering into force on 1 January 2018
Banks’ increasing vulnerability to adverse property market developments in the event of an economic downturn
An LTV ratio limit for housing loans imposed by the Housing Loan Decree –in force since 1 January 2017
Regulatory environment
In the context of the Banking Union, potential easing of regulatory rules for bank subsidiaries of foreign banks in the areas of liquidity, capital and large exposuresThe impact of the implementation of the minimum requirement for own funds and eligible liabilities (MREL)
Risk
s aris
ing
from
the
dom
estic
fina
ncia
l mar
ket
Household indebtedness
The household sector being weakened by its increasing indebtedness and therefore heightening the banking sector's sensitivity to any deterioration in the macroeconomic situation
The Housing Loan Decree – in force since 1 January 2017The Consumer Loan Decree – entering into force on 1 January 2018 The introduction of a non-zero countercyclical capital buffer rate–set at 0.5% from 1 August 2017 in response to growth in both retail and NFC loans and due to be raised to 1.25% from 1 August 2018
Liquidity
Maturity mismatch between assets and liabilities; decline in the volume of liquid assets
An amendment to the liquid asset ratio requirements, effective from 1 December 2014, as a result of which the requirements for the coverage of net cash outflows are stricter than the corresponding rules adopted at the European level. The replacement of the national liquidity coverage ratio with the international liquidity coverage ratio as from 1 January 2018A new legislative framework for the issuance of covered bonds, which is due to enter into force on 1 January 2018 and may increase the stability of banks’ long-term funding
Concentration, financial market interlinkages, and contagion
Relatively high concentration in (part of ) the portfolio, or higher intra-group exposure, in certain institutions or funds
A recommendation that banks take a prudential approach to assessing close economic links between customers and to managing concentration risk in both lending and deposit business. An additional capital buffer applied to the five largest banks on grounds of their systemic importance – being phased in between 2016 and 2018
Business practices of financial institutions
Potential strategic risk from increasing linkages between financial undertakings and financial agents
An LTV ratio limit for housing loans imposed by the Housing Loan Decree– in force since 1 January 2017
Potential imbalances resulting from the asymmetric relationship between financial undertakings and their customersIn regard to consumer protection, reputational risk in the banking and insurance sectors
In 2015 NBS assumed responsibility for the supervision of non-bank lenders and, at the same time, its supervisory powers in the area of financial consumer protection were significantly strengthened
Source: NBS.

1
MACROECONOMIC ENVIRONMENT AND FINANCIAL MARKETS
C H A P T E R 1

10NBS
Financial Stability RepoRtNovemBer 2017
C H A P T E R 1
Chart 1 GDP and global trade (annual percentage changes)
Source: IMF.
1 mACroeConomiC environment And FinAnCiAl mArkets
1.1 THE GLOBAL ECONOMY IS RECOVERING AGAINST A BACKDROP OF LOW FINANCIAL MARKET VOLATILITY
Key trends in the external environment
• Favourable trends in global macroeconom-ic indicators are containing the immediate risks to financial stability
• Increasing demand for riskier assets is making the financial system more vulner-able from a longer-term perspective
• The continuing build-up of debt lies at the core of financial stability risks
• A wave of repricing in financial markets could be triggered by monetary policy tightening, unforeseeable macroeconomic developments, or an escalation in geopo-litical tensions
FAvourAble trends in globAl mACroeConomiC indiCAtors Are ContAining the immediAte risks to FinAnCiAl stAbility
The global economic recovery that began in the second half of 2016 has gained momen-tum during the course of 2017. Growth in ad-vanced economies in particular has surprised on the upside in the recent period, but emerg-ing market economies (EMEs) have also made a significant contribution to global GDP growth. A leading factor behind the acceleration of glob-al growth has been the increase in investment demand, stemming from the pick-up in busi-ness confidence in the context of exceptional-ly favourable financial conditions. Investment growth has consequently pushed up industrial production in all parts of the world. A related de-velopment has been global trade growth, which for the whole of 2017 is expected to be almost twice as high as its rate in the previous year. Out-looks are also relatively bright, at least for the near future. A broad range of leading indicators and confidence indicators suggest that the solid
economic situation at the global level will con-tinue in the period ahead.
The euro area has also contributed to the overall picture of robust economic activity growth. The IMF’s latest projection for the euro area’s annual GDP growth in 2017 is 2.1%, which is higher than both the previous year’s rate and the IMF’s original projection for this year. The economic situation in the euro area is better now than at any time since 2010. This improvement is even more impressive given that it has occurred at a time when the euro is facing serious politi-cal risks. Another positive aspect of this cyclical recovery is that it has been broad-based across euro area countries. Since the growth rate is sur-passing the economy’s potential output, spare capacity is gradually diminishing and unem-ployment is falling. When the cyclical catch-up after previous crises has run its course, however, the determining factors of euro area economic performance will be demographics and labour productivity, which provide fewer grounds for optimism.
GDP – advanced economiesGDP – emerging market economiesGDP – euro areaGlobal trade (right-hand scale)
8
6
4
2
0
-2
16
11
6
1
4 2011 2012 2013 2014 2015 2016 20172010

11NBS
Financial Stability RepoRtNovemBer 2017
C H A P T E R 1
Chart 2 Financial market volatility indicators
Source: Bloomberg.
The notable recovery and the closing of output gaps in advanced economies is pro-viding scope for the gradual normalisation of monetary policy. That process is furthest advanced in the United States. The Federal Re-serve System’s Federal Open Market Committee has raised the target range for the federal funds rate by a cumulative 100 basis points, includ-ing three 25 point hikes made since December 2016. In addition, the US central bank initiated its balance sheet normalisation programme in October 2017 by not reinvesting the proceeds of all maturing bonds. In the United Kingdom, in November, the Bank of England increased interest rates for the first time in many years. The European Central Bank is still in an expan-sionary phase and interest rates are expected to remain at historical lows for the foreseeable future. From early 2018, however, the ECB is ex-pected to gradually ease the pace of its monthly bond purchases. Only in Japan is no monetary policy tightening envisaged. The broad setting of monetary policy in advanced economies, and indirectly at the global level, may therefore be seen as significantly accommodative. Further-more, any tightening should be very gradual, given that inflation rates are only slowly return-ing to target levels.
inCreAsing demAnd For riskier Assets is mAking the FinAnCiAl system more vulnerAble From A longer-term perspeCtive
The focus of financial stability risks is shifting to the medium term. The short-term outlook for financial stability has taken a favourable turn in recent months, thanks mainly to the strengthen-ing of global economic activity. As regards medi-um-term risks, however, the situation is different: they are mounting. The continuing environment of unprecedentedly low interest rates will appar-ently continue to stimulate risk appetite in the financial sector and prolong the financial cycle upswing. In an adverse scenario, the imbalanc-es already present in the system could build up until such time that a sharp correction becomes inevitable, triggering a new wave of the financial crisis.
Low volatility has been a feature of finan-cial markets in the recent period. Following a period when they experienced several bouts of turbulence, financial markets have been ex-
ceptionally stable since the beginning of 2017. Financial asset volatility fell to historically low levels, comparable to those observed before the onset of the global financial crisis. This trend was seen in virtually all asset classes and in all signif-icant stock markets across the world. Not only is realised volatility low, but so is implied volatility derived from option prices, meaning that inves-tors expect markets to remain calm in the period ahead.
The recent unusual degree of stability in the financial markets may eventually accentuate risks in the financial sector. On the positive side, the current low volatility of asset prices stems to some extent from a more stable and improving macroeconomic environment. On the other hand, however, the lack of market fluctuation seemingly reflects the implemen-tation of monetary policy, including expanded bond purchase programmes. Financial market participants have in recent years come to ex-pect that central banks will seek to quell any sign of market stress by applying non-standard measures. In consequence, however, there is a blunting of the market mechanisms needed to ensure the effective functioning of financial markets over the long term. Thus low volatility over an extended period can lead to the distor-
120
100
80
60
40
20
0
250
200
150
100
50
0
Equity volatility (VIX Index)Bond volatility (MOVE Index; right-hand scale)
Dec.
2004
Dec.
2005
Dec.
2006
Dec.
2007
Dec.
2008
Dec.
2009
Dec.
2010
Dec.
2011
Dec.
2012
Dec.
2013
Dec.
2014
Dec.
2015
Dec.
2016

12NBS
Financial Stability RepoRtNovemBer 2017
C H A P T E R 1
Chart 3 Price-to-earnings ratio for the S&P 500 Index
Source: Shiller.Note: The chart shows the Shiller P/E ratio.
tion of risk perceptions and the underestima-tion of risks, thereby encouraging the taking of steps that result in the build-up of risks in the financial system. Historical experience also sug-gests that the periods of apparent greatest sta-bility are exactly when the seeds of major future crises are sown.
The prolonged period of low interest rates in conjunction with falling volatility and favour-able outlooks for the real economy has so far in 2017 had an upward impact on financial asset prices. In several cases, asset prices have reached levels that are difficult to justify, even after taking the ongoing cyclical recovery into account. This is particularly true of the S&P 500 Index, which in recent months has kept hitting all-time highs. The average price-to-earnings (P/E) ratio of the index constituents is well above the long-run average. Historically, the P/E ratio was higher in only two periods, each of which led to a stock market crash that had broader ramifi-cations for financial markets and the real econo-my. Liquidity inflows, demand for yield, and low risk aversion among investors has also pushed up bond prices across the world, including in the euro area. Credit and market risk premia fell to ten-year lows. The premia experiencing the greatest compression have been those on
lower-rated bonds. It is furthermore necessary to note the increasing duration of bond portfo-lios, which is making their pricing increasingly sensitive to any movements in interest rates and premia. Besides financial assets, property mar-kets in some countries are also showing signs of overheating. Increasing risk appetite is also apparent in the revival of capital flows to EMEs, including those at the lower end of the income spectrum.
the Continuing build-up oF debt lies At the Core oF FinAnCiAl stAbility risks
Accommodative financial conditions have been supporting debt growth across the world. The combination of liquidity flows from central banks and increasing investor risk ap-petite has meant that firms in the real economy have had little difficulty in issuing large volumes of new debt. The aggregate debt of G20 coun-tries has increased over the past ten years from USD 75 trillion to USD 135 trillion. This debt has also increased as a ratio to the aggregate GDP of these economies. Indebtedness has increased most strongly in the government and NFC sec-tors, and to a lesser extent in the household sec-tor. These trends have been observed in most of the principal economies, although there are exceptions. Besides the amount of debt, another key indicator of vulnerability is the cost of ser-vicing that debt. Falling interest rates during the period under review partly dampened the im-pact of debt growth; nevertheless, the debt ser-vice-to-income (sales) ratio in the private non-fi-nancial sector increased in several countries. In the current constellation of historically low interest rates and solid macroeconomic trends, borrowers who are approaching the limits of their debt servicing capacity could come under pressure to default in the event of any income or interest-rate shock.
A continuing risk to the euro area is the bank-sovereign nexus. The problem of exces-sive indebtedness in the euro area is most ap-parent in the government sector. Although the average government debt-to-GDP ratio for the euro area is no longer rising, it remains at an el-evated level of around 90%. In the current mar-ket conditions, euro area sovereigns – including those with the largest debt burden – have no difficulty in meeting their liabilities. If, however,
50
45
40
35
30
25
20
15
10
5
0
1882
1887
1892
1897
1902
1907
1912
1917
1922
1927
1932
1937
1942
1947
1952
1957
1962
1967
1972
1977
1982
1987
1992
1997
2002
2007
2012
2017

13NBS
Financial Stability RepoRtNovemBer 2017
C H A P T E R 1
risk premia or key interest rates increased, the servicing of government debt would become more expensive. In that case, questions would be raised about sovereign debt sustainability, thereby putting further upward pressure on sov-ereign bond yields. In the more vulnerable coun-tries, such a scenario would have repercussions for the banking sector, since domestic banks are highly exposed to their sovereigns. Although the resilience of the euro area banking sector is greater than it was at the peak of the sovereign debt crisis, the bank recovery process has still to be completed in some countries. Therefore a re-turn of the ‘doom loop’ between sovereigns and banks would be a risk.
The country whose debt burden has increased the most over the past ten years is clearly Chi-na. The deviation of the current indebtedness of the Chinese economy from its long-term trend (expressed by the credit-to-GDP gap) exceeded 20% of GDP, which is a very high level in interna-tional comparison. The Chinese authorities have recently been taking steps to cool lending activ-ity, but without having too much impact on risks arising from the debt that has already built up. Most of these risks are ultimately spilling over to the domestic banking sector, whose assets now are now three times higher than China’s GDP. The situation is further complicated by structural factors. Recent years have seen banks, particu-larly smaller ones, making much greater use of regulatory arbitrage, offering customers alterna-tive products and off-balance sheet schemes in preference to standard loans. The result has been a deterioration in transparency and an increase in interlinkages within the system. At the same time, these banks are heavily reliant on regular flows of short-term financing. Another increas-ing risk is that financing is partly going to ineffi-cient firm whose viability is dependent on exter-nal borrowing.
A wAve oF repriCing in FinAnCiAl mArkets Could be triggered by monetAry poliCy tightening, unForeseeAble mACroeConomiC developments, or An esCAlAtion in geopolitiCAl tensions
In order that the current financial market boom does not suddenly give rise to se-vere turbulence, it is essential, among other things, that monetary policy normalisation should proceed smoothly. If carried out in
harmony with the given country’s economic conditions, the unwinding of extremely ac-commodative monetary policy positions is good news for financial stability. This requires, however, that the tightening of financial condi-tions be carried out in a gradual and predicta-ble way. Central banks are doing their utmost to ensure that their measures do not trigger market shocks. These efforts notwithstanding, in the United States, for example, investors are anticipating that the Federal Reserve will raise its key interest rate far more slowly that its for-ward guidance would suggest. This raises the risk that financial markets will at some point see an upward jump in the expected path of inter-est rates, particularly longer-term rates, which could set off a mass rebalancing of positions and a fall in prices of riskier assets. A similar sce-nario could arise in relation to the ECB’s steps, whether now, in the context of the tapering of bond purchases, or later, when the key interest rate is increased.
The divergence between expected and actual macroeconomic trends could also become a cause of financial market turbu-lence. If the economic situation turned out to be less favourable than currently envisaged, it in particular could give rise to an adverse sce-nario for financial markets. On the other hand, it cannot be entirely ruled out that if, unex-pectedly, the Phillips curve slope turned neg-ative again and inflation increased, the central banks would be required to take a more ag-gressive approach.
The calm in financial markets could also be disrupted by events of a non-economic na-ture. Although the level of political and ge-opolitical risks has diminished in 2017, they remain relatively elevated. In Europe, the dis-pute between Catalonia and the Spanish cen-tral government may be seen as a source of tension, while early elections in Italy next year will probably attract significant attention. The negotiations on the details of the United King-dom’s withdrawal from the European Union are proceeding slowly and the whole process remains shrouded in uncertainty. At the global level, much will depend on the extent to which the US administration pursues protectionist policies.

14NBS
Financial Stability RepoRtNovemBer 2017
C H A P T E R 1
Chart 4 GDP growth and its components (annual percentage changes)
Sources: SO SR and NBS.
1.2 SLOVAKIA’S ECONOMY IS GROWING, AND ITS LABOUR MARKET IS THRIVING
Key trends in the domestic environment
• The Slovak economy is experiencing an upswing. GDP growth is being driven mainly by domestic demand, with foreign demand making a lower positive contri-bution. Looking ahead, the economy is expected to begin overheating at some point
• Unemployment is at historically low lev-els, and some industries are experiencing shortages of skilled labour
the slovAk eConomy is buoyAnt, with the business CyCle Currently in An upswing. looking AheAd, eConomiC growth Could ACCelerAte still Further. the eConomy’s perFormAnCe is suCh thAt it is supporting the build-up oF imbAlAnCes in the FinAnCiAl mArket Most EU countries, including Slovakia, are now experiencing an expansionary phase of the business cycle. The Slovak economy main-tained stable growth in the first half of 2017, in-creasing by 3.1% year on year in both the first and second quarters. Unlike in 2016 Slovakia’s GDP growth in the first half of the year was not among the highest in the EU, since thirteen other Member States reported a higher rate. Nevertheless, Slovakia’s economic growth re-mained significantly – almost one percentage point – higher than the EU average. Slovakia’s GDP growth in the first half of 2017 was driv-en largely by domestic demand and only to a lesser extent by foreign demand. Household consumption expenditure reflected the favour-able labour market situation, as households’ improved financial situation supported stable growth in their consumption, which reached its highest level in the post-crisis period. With their balance sheets strengthening and consumption increasing, households are showing greater de-mand for loans. Government consumption ex-penditure had a broadly neutral impact on GDP growth in the first half of 2017. In this catego-ry, the strongest growth was in expenditure on wages and compensation of public sector em-ployees; by contrast, expenditure on health care remained flat. The only component of GDP that
had a negative impact on economic growth was investment. Growth in both private and public investment fell notably, owing largely to the slow start to the absorption of EU funds under the new programming period and to the related weakening of growth trends in public infrastruc-ture construction and other public investment. Although net exports had a positive impact on Slovakia’s GDP growth in the first half of 2017, their contribution was lower compared with the previous year. The slowdown in export growth stemmed mainly from the retooling process for new production in some plants in the automo-tive industry. As the new car production comes on stream, export growth is expected to accel-erate again.
Current expectations indicate that the expan-sionary phase of the business cycle should continue in the period head. At the same time, the economy is expected to begin gradually overheating. Slovakia’s annual GDP growth for each of the next two years is expected to exceed 4.5%. The domestic economy should continue to benefit from strengthening household con-sumption, but also from a pick-up in investment growth owing to planned investments in the automotive industry and to the launch of infra-structure projects supported by the expected ac-celeration in the absorption of EU funds.1 Besides
1 In particular the realisation of a PPP project involving the construction of a bypass around Bratislava, specifically the D4 motorway and R7 expressway.
Household consumption expenditureGeneral government nal consumption expenditureGross xed capital formationNet exportsChanges in inventoriesGDP
8
6
4
2
0
-2
-4
-6
3.1%
3.4%3.7%
4.0% 4.2%
3.7% 3.5%
3.1% 2.9%
3.1%
Q1 20
15
Q2 20
15
Q3 20
15
Q4 20
15
Q1 20
16
Q2 20
16
Q3 20
16
Q4 20
16
Q1 20
17
Q2 20
17

15NBS
Financial Stability RepoRtNovemBer 2017
C H A P T E R 1
Chart 5 The unemployment rate (percentages) and sectoral contributions to annual employment growth (percentage points)
Sources: SO SR and NBS.Notes: Employment according to ESA methodology, seasonally adjusted data. Rate of unemployment according to the Labour Force Survey, seasonally adjusted data.
domestic demand, exports are also expected to contribute significantly to economic growth, following the launch of new production in the car industry. Hence in the next period macroe-conomic trends will support the upswing in the financial cycle. At the same time, risks related to economic overheating are expected to build up. Any future drop in economic growth could weigh on borrowers’ financial situation and their debt servicing capacity, particularly where the borrowers are less creditworthy and where the loans were provided under more relaxed condi-tions.
the lAbour mArket situAtion is pArtiCulArly FAvourAble, And some industries Are AlreAdy beginning to FACe shortAges oF skilled lAbour Slovakia’s economic growth has had a par-ticularly favourable impact on the labour market. Headcount employment in 2017 was higher than at any time since the country’s es-tablishment in 1993. In the first half of the year alone, more than twenty-three thousand people joined the workforce. Around two thirds of all the new jobs were added in industry, and most of the rest were in services and trade. High em-ployment was mirrored in the unemployment rate, which fell to historically low levels, ending the second quarter at 8.4%. The labour market is already beginning to show signs of overheat-ing, with a number of sectors now facing short-ages of skilled labour. Such increasing pressures are pushing up annual nominal wage growth, which in the second quarter of 2017 acceler-ated to 4.7%, its highest level in the post-crisis period. With inflation relatively subdued, real wage growth also increased, to average almost 3% in the second quarter. Going forward, em-ployment and wages are expected to continue their upward trends, although employment growth should decelerate as the job-filling rate falls. At the same time, the pressures on the la-bour market are expected to be partly mitigated by increases in labour participation (particularly among people of pensionable age), in the num-ber of foreign workers, in the numbers of Slovak citizens returning from employment abroad, and in the number of hours worked. Both now and in the period ahead, the labour market will be put-ting upward pressure on the financial market. As historically high employment and wages boost their confidence, households are showing an in-creasing propensity to borrow.
in both slovAkiA And the euro AreA As A whole, priCes oF most goods And serviCes hAve inCreAsed in 2017After three years in negative territory, goods and services inflation turned positive in 2017 due to both cost-push and demand-pull factors. At the end of the first half of 2017 the price level of goods and services showed a year-on-year in-crease of 1%. Most components of the consum-er price index are increasing with the exception of energy prices, which remain on a downward path. The highest increases are in prices of food and services. The current inflation outlook envis-ages that amid a strong labour-market impulse and demand-pull pressures, inflation may grad-ually approach its target level. Since the inflation outlook for the euro area as a whole is similar, such development could allow scope for mone-tary ,policy tightening with a consequent impact on financing costs.
non-FinAnCiAl CorporAtions Are experienCing An upswing. this is inCreAsing their Appetite For Credit, in pArtiCulAr loAns oF An investment nAture
The favourable economic situation is also reflected in the financial situation of NFCs, with the majority of economic sectors recording
AgricultureWholesale and retail tradePublic administration, defence, education,human health and social work activitiesProfessional, scienti�c and administrative activities Unemployment rate (right-hand scale)
IndustryConstructionServicesTOTAL
3.0
2.5
2.0
1.5
1.0
0.5
0.0
-0.5
14
12
10
8
6
4
2
0
Q1 20
15
Q2 20
15
Q3 20
15
Q4 20
15
Q1 20
16
Q2 20
16
Q3 20
16
Q4 20
16
Q1 20
17
Q2 20
17

16NBS
Financial Stability RepoRtNovemBer 2017
C H A P T E R 1
a year-on-year increase in aggregate sales in the first half of 2017. The largest such increases were in the sectors of services, trade and industry. Con-struction was the only sector in which sales in the first quarter of 2017 declined year on year, the likely cause being a fall in the absorption of EU funds. Most sectors also recorded an aggregate profit in the first half of 2017. Only agriculture failed to do so, and the construction sector posted a loss for the first quarter. The favourable financial condition of firms, together with their improving expectations, is increasing their demand for cred-it, especially loans of an investment nature.
the eConomiC situAtion Could be undermined by FAlling Foreign demAnd The external environment is the source of the principal ongoing risk, namely the risk of a de-cline in global demand. This risk lies mainly in the possibility of certain countries setting off a wave of increasing protectionism, thereby triggering a beggar-thy-neighbour spiral. On the domes-tic front, the risks to the economic growth out-look are mainly on the upside. At the same time, however, the financial system is expected to face mounting risks related to gradual overheating of the economy.
2
FINANCIAL SECTOR TRENDS
AND RISKS
C H A P T E R 2

18NBS
Financial Stability RepoRtNovemBer 2017
C H A P T E R 2
Chart 6 Increases in the index of factors supporting credit supply and credit demand
Sources: NBS and SDW.Notes: The demand-side index is calculated as the average of in-dices of the following: the unemployment rate; interest rates on new housing loans; housing affordability; and the annual rate of change in flat prices. The supply-side index is calculated as the average of indices of the following: interest margins on housing loans; and the non-per-forming loan ratio for housing loans. The indices are indexed to 100 in 2003.
180
160
140
120
100
80
60
40
20
0
Index of demand-side factorsIndex of supply-side factors
Dec.
2003
Dec.
2004
Dec.
2005
Dec.
2006
Dec.
2007
Dec.
2008
Dec.
2009
Dec.
2010
Dec.
2011
Dec.
2012
Dec.
2013
Dec.
2014
Dec.
2015
Dec.
2016
crisis
2 FinAnCiAl seCtor trends And risks 2.1 HOUSEHOLD CREDIT GROWTH HAS
REMAINED STRONG
Key trends concerning household indebted-ness
• The stock of housing loans has continued to hit historical highs; at the same time, regulatory changes have led to volatility in volume growth
• Consumer credit has continued to show steady volume growth amid significant falls in interest rates
• Prices of existing properties have contin-ued to grow, and the rate of that growth has stabilised
• Indicators of consumer credit risk remain elevated, but have stopped deteriorating
Credit growth hAs remAined strong, while volAtility in the Credit mArket hAs been inCreAsed by regulAtory ChAnges
Retail credit growth remained strong during the first three quarters of 2017. Expectations also emerged regarding the impact of a new NBS Decree on housing loans. Ongoing macroeconom-ic and financial trends supported growth in both the supply of retail loans and demand for them. The stock of retail loans as at the end of September 2017 showed a year-on-year increase of 13.6%, in line with the long-term trend. However, the intro-duction of regulatory changes in the market and the expectations surrounding these changes in-creased volatility in the rate of retail credit growth.
The credit growth is attributable to, among other things, favourable developments in the labour market, in the supply of loans, and in the housing market. Continuing growth in em-ployment and wages are important preconditions for the increase in consumer demand for loans. Another factor is that the environment of low inter-est rates and heightened competition are making loans more available than ever before. For banks, on the other hand, the retail loan book is a pillar of their profitability. Finally, the supply of and demand for loans are meeting at increasing real estate pric-es, resulting in demand for larger housing loans.
The rate of growth in the stock of housing loans was affected by expectations about the impact of an NBS Decree that entered into force at the beginning of the year. Most of the rules laid down in the Decree were being observed by mar-ket participants even before 2017. Nevertheless the public, influenced by media articles, became concerned that sources of housing loans could dry up after 1 March 2017. As a result of these concerns, credit growth accelerated sharply in the first two months of 2017. This ‘frontloading’ was followed by a slowdown in credit growth in the second quarter of 2017. The situation stabilised in the third quarter, although signs of decline in housing loan growth were present. Whether these signs stemmed from the impact of the ear-lier frontloading or from the gradual tightening of credit standards under the NBS Decree, cannot yet be ascertained. In either case, even that poten-tially slightly lower housing loan growth was still clearly higher compared with the corresponding rate in any other euro area country.

19NBS
Financial Stability RepoRtNovemBer 2017
C H A P T E R 2
Chart 8 Volatile housing loan growth and no change in the growth trend for consumer loans (year-on-year changes in EUR billions)
Source: NBS.
Chart 7 Housing loan growth in 2017 was volatile, but remained strong(annualised growth in the stock of housing loans; percentages)
Source: NBS.Notes: The bars show the annualised quarter-on-quarter growth in the stock of housing loans. The red line shows the annualised housing loan growth for the first three quarters of the given year.
18
16
14
12
10
8
6
4
2
0 2013 2014 2015 2016 2017
Q1Q2
Q3Q4
Q1 to Q3
3.5
3.0
2.5
2.0
1.5
1.0
0.5
0.0
0.6
0.5
0.4
0.3
0.2
0.1
0.0
Housing loansConsumer loan (right-hand scale)
Jan.
201
2M
ay 20
12Se
p. 20
12Ja
n. 2
013
May
2013
Sep.
2013
Jan.
201
4M
ay 20
14Se
p. 20
14Ja
n. 2
015
May
2015
Sep.
2015
Jan.
201
6M
ay 20
16Se
p. 20
16Ja
n. 2
017
May
2017
Sep.
2017
Low interest rates in Slovakia – the lowest in the region – have continued to increase the availability of housing loans. Over the twelve months to the end of September 2017 the aver-age interest rate fell by just 0.2 percentage point, which is, apart from one particular exception, by far the lowest rate of decrease since 2009. This slowdown occurred after the interest rate on housing loans fell sharply in 2016, owing to a legislative amendment. The current rate of 1.8% means the availability of housing loans in total is greater than it has ever been and is also greater compared with other central and east-ern European countries. Even in 2016, interest margins on housing loans were lower in Slovakia than in any other CEE country.
As regards consumer loans, the trends have remained virtually unchanged, with the sta-ble increases in the stock of loans being re-flected in its falling relative growth rate. The stock of consumer loans has for several years been increasing by around €550 million per year. As the loan book has expanded, so its rate of growth has fallen. The growth rate as at Septem-ber 2017 stood at 12.9% year on year. Despite that nominal slowdown, however, Slovakia is
among the euro area countries with the highest rate of consumer credit growth. In contrast to the average interest rate on housing loans, the rate on consumer loans has continued to fall notably. For the 12 months to end-September it dropped by as much as 1.5 percentage points, to 8.7%. This trend also increased the incentive to refinance consumer loans, since borrowers, on average, were able to refinance loans at an inter-est rate that was fully 1.1 percentage points low-er than the previous rate. In only two other CEE countries (Croatia and Slovenia) is the average interest on new consumer loans lower. Still, the consumer loan interest rate in all CEE countries is higher than the euro area average.
The rate of increase in prices of existing flats is showing signs of stabilising in certain seg-ments. Although prices of existing flats contin-ued to rise in the first three quarters of 2017, they stopped accelerating and maintained a stable growth rate of between 11% and 12% year on year. In some segments, prices even remained flat in the latter months of the period under re-view. This stabilisation was most evident in the cities of Bratislava and Žilina, but similar trends were apparent in the other principal towns and

20NBS
Financial Stability RepoRtNovemBer 2017
C H A P T E R 2
Chart 10 In terms of their credit quality, consumer loans are showing signs of stabilising (net and gross default rates in the main retail loan categories)
Source: NBS.Notes: The gross default rate measures the volume of newly default-ed loans and the net default rate measures the change in volume of non-performing loans (i.e. it takes into account repayments, trans-fers back to standard loans and reclassifications). Both indicators are adjusted to take account of write-downs and sell-offs.
Chart 9 The average price of flats (EUR/flat) continued to increase, but in some segments prices flattened (for example, in Bratislava city)(Index: January 2007 = 100)
Source: CMN.
170
160
150
140
130
120
110
100
SlovakiaBratislava
Jan.
2007
July
2007
Jan.
2008
July
2008
Jan.
2009
July
2009
Jan.
2010
July
2010
Jan.
2011
July
2011
Jan.
2012
July
2012
Jan.
2013
July
2013
Jan.
2014
July
2014
Jan.
2015
July
2015
Jan.
2016
July
2016
Jan.
2017
July
2017
5
4
3
2
1
0
-1
Net default rateGross default rate
Mar
. 201
5Ju
ne 20
15Se
p. 20
15De
c. 20
15M
ar. 2
016
June
2016
Sep.
2016
Dec.
2016
Mar
. 201
7Ju
ne 20
17Se
p. 20
17
Mar
. 201
5Ju
ne 20
15Se
p. 20
15De
c. 20
15M
ar. 2
016
June
2016
Sep.
2016
Dec.
2016
Mar
. 201
7Ju
ne 20
17Se
p. 20
17
Housing loansConsumer loans
cities of Slovakia’s regions. A similar flattening was observed, for example, in prices of three-room and larger flats. The number of existing flats advertised for sale continued to fall within the category of one- to three-room flats – i.e. the most numerous sizes – and since the decline was homogeneous, their relative shares on the mar-ket remained unchanged. The trend in flat sales is in line with market supply.
The growth in the number of new builds on the market in Bratislava moderated during the period under review, but the prices of these properties continued to increase. The historically favourable labour market condi-tions and lower interest rates continued to have a positive impact on the residential segment. Al-though the growth in demand for and supply of these properties was lower than the high rate re-corded in 2016, it remained above average. The prices for which new builds were being sold and advertised continued to increase, but there were also signs in 2017 that prices in this market could be stabilising.
Non-performing loan trends are continu-ing, and the default rate for consumer loans shows signs of stabilising. Housing loans continue to record a zero net default rate. In the category of consumer loans, this indicator ceased increasing during the summer and the volume of newly defaulted loans has been fall-ing since May 2017.
The importance of mortgage brokers in the provision of housing loans has increased in 2017. In the third quarter, the volume of new housing loans mediated by external mortgage brokers increased as a share of the total vol-ume of new housing loans, to 58.2%, an all-time high. This further illustrated the potential strategic risk that the increasing interlinkage between financial entities and mortgage bro-kers represents, in that it may increase pressure to ease credit standards. A new development in 2017 was the gradual increase in the share of broker-mediated loans in the loan books of large banks, while the share reported by other retail banks fell.

21NBS
Financial Stability RepoRtNovemBer 2017
C H A P T E R 2
Chart 11 Household credit to GDP ratio (percentages)
Source: ECB.
Box 1
Minimum-maximum range for CEE countriesSlovakia Median for CEE countriesMedian for euro area countries with a rating of BBB or lowerMedian for euro area countries with a rating of AA or higher
90
80
70
60
50
40
30
20
10
020
02
2003
2004
2005
2006
2007
2008
2009
2010
2011
2012
2013
2014
2015
2016
2.2 HOUSEHOLD DEBT HAS INCREASED FASTER THAN ECONOMIC FUNDAMENTALS WOULD IMPLY
The most significant risks associated with household debt growth
• Slovakia’s household credit to GDP ratio has been the highest in the CEE region in 2017
• At the same time, the rate of increase in this ratio has been higher in Slovakia than in any other euro area or CEE country
• While this rate of increase is partly ex-plained by the real convergence of the Slo-vak economy, it is above what economic fundamentals would imply
• Falling interest rates have had a significant upward impact on indebtedness
• A sizeable share of new loans to households are provided to highly indebted borrowers
the Continuing inCreAse in household debt is Among the most signiFiCAnt trends And, At the sAme time, Among the mAjor risks From the perspeCtive oF FinAnCiAl stAbility
Slovakia’s household credit to GDP ratio has been the highest in CEE region in 2017. At the same time, the rate of increase in this ratio over the 12 months to end-September has been higher in Slovakia than in any other euro area or CEE country. Slovakia remained in 2017 as the only EU country in which household debt has increased each year since 2005.
The long-term upward trend in household debt is increasing households’ aggregate
leverage and thereby making Slovak house-holds increasingly vulnerable to any shocks. The rising indebtedness of households is in-creasing their sensitivity to any deterioration in macroeconomic developments. This risk is accentuated if macroeconomic trends become more volatile.
The vulnerability of Slovak households has also been heightened by a reduction in the scope for dealing with the worsening of loan repayment conditions in recent years (the possibility for ma-turity extensions or reducing the cost of borrow-ing). The increasing indebtedness of households may therefore be creating risks to the financial system. The way in which these risks are trans-mitted is described in Box 1.
FUTURE IMPACT OF EXCESSIVE HOUSEHOLD INDEBTEDNESS ON FINANCIAL STABILITY AND ECONOMIC GROWTH
An increasing number of empirical studies indicate that the benefits of debt to GDP growth will gradually diminish when ag-gregate leverage is rising. A similar conclu-
sion was reached in a recently published IMF analysis2, according to which excessive lever-age could undermine economic growth in the future.
2 Valckx, N. et al., “Household debt and financial stability”, Global Financial Stability Review, IMF Report, October 2017.

22NBS
Financial Stability RepoRtNovemBer 2017
C H A P T E R 2
Furthermore, disproportionately high pri-vate sector credit, including household debt, may increase the medium-term like-lihood of a financial crisis and could lead to lower economic growth. Hence in reality there is a certain trade-off between the short-term benefits of rising debt to GDP growth and its medium-term costs to macroeconomic and financial stability. In the short term, an increase in the household debt to GDP ratio is typical-ly associated with higher economic growth and lower unemployment, but the effects are reversed in three to five years. These adverse effects are usually stronger when household debt is higher and are therefore usually more pronounced for advanced economies.
Overleveraging can be a risk to financial stability and a source of macroeconomic and financial imbalances and crises. Dis-proportionate increases in household lever-age are associated with a higher likelihood of financial crises, and financial stability may be adversely affected through several channels. One channel is the adverse impact of exces-sive debt on economic growth, employment, and disposable income, all of which reduces households’ debt servicing capacity. Overlev-eraging may therefore stifle credit demand by giving households that wish to borrow no scope to do so. Another channel is the deteri-oration in household sentiment in response to worsening economic developments, and the consequent decline in households’ propensity to borrow. A third channel of the adverse im-pact on the financial sector is a reduction in the value of collateral, which may lead to diffi-culties in debt servicing and deleveraging and to a debt deflation spiral.
Although it is difficult to define the point at which debt becomes excessive, the IMF analysis finds that the association between household debt and future real GDP growth turns negative at relatively low levels of household debt, i.e. exceed-ing 30% of GDP. When household debt is at 60% of GDP, its increase correlates quite strongly with the increasing likelihood of a financial crisis. This suggests that low-lev-eraged emerging market economies have some scope to stimulate economic growth by increasing households’ access to credit, while advanced economies have usually ex-hausted this possibility. The household debt to GDP ratio in Slovakia is currently around 40% of GDP. At the same time, however, the indebtedness of Slovak households is in-creasing sharply (its level having more than doubled over the past ten years), which in-dicates that the scope for increasing house-holds’ access to credit is diminishing quite rapidly. According to the IMF’s estimations2, the median coefficient for the three-year ahead impact of an increase in debt on GDP growth is -0.5 for advanced economies and -0.13 for emerging market economies.
The risks associated with increasing household debt may, however, be miti-gated by certain factors in the economy, the strength of institutions, and the im-plementation of macroprudential policy. Sound institution, high-quality regulation and supervision, less dependence on exter-nal financing, flexible exchanges rates, and lower income inequality can attenuate the risks associated with increasing household debt.
3 Measured as per capita GDP in purchasing power parity.
Another CAuse oF inCreAsing leverAge is reAl ConvergenCe, As the eConomiC level in slovAkiA is still only CAtChing up with the AverAge level in the euro AreA As A whole In 1995 Slovakia’s economic performance was half that of the EU average3, while in 2016 it was already up to 78%. Other CEE countries are similarly converging towards the EU level. These trends result mainly from the structural econom-
ic changes implemented in the countries of this region, since these changes have boosted the countries’ productivity and overall economic output.
The convergence process is predicated on the strengthening of economic fundamentals (growth in GDP, employment and disposable income), which consequently has an impact

23NBS
Financial Stability RepoRtNovemBer 2017
C H A P T E R 2
Chart 13 Changes in the household credit to GDP ratio and in per capita GDP between 2013 and 2017 (percentages)
Source: ECB and Eurostat.Notes: The arrows denote the indicators’ movement between June 2013 and June 2017. There is no overlapping between the groups of countries.
Chart 12 Labour market and disposable income trends in Slovakia and the EU
Sources: Eurostat and NBS.Notes: Annualised employment data for the 15-64 age cohort. Un-employment rate for the 15-64 age cohort, percentage of the ac-tive population. Annualised data for household gross disposable income at current prices. Indexed to 100 at 2006:Q1. The solid lines show developments in Slovakia, the dashed lines developments in the EU.
Employment (SK)Employment (EU)Unemployment rate (SK), right-hand scaleUnemployment rate (EU), right-hand scaleGross disposable income (SK)Gross disposable income (EU)
165
155
145
135
125
115
105
95
16
15
14
13
12
11
10
9
8
7
2006
2007
2008
2009
2010
2011
2012
2013
2014
2015
2016
2017
(%) 80
70
60
50
40
30
20
10
0
0
5,000
10,00
0
15,00
0
20,00
0
25,00
0
30,00
0
35,00
0
40,00
0
GDP per capita
Hou
seho
ld c
redi
t to
GD
PSlovakia
CEE countries
Countries rated BBB or lower
Countries rated AA or higher
on the pace of household debt growth. In the past ten years, Slovakia has recorded one of the highest levels of convergence towards the EU average.
At the same time, however, several macroeco-nomic fundamentals in Slovakia are displaying increased volatility and therefore also greater degrees of correction compared with neigh-bouring countries. The volatility in macroeco-nomic fundamentals is creating private sector debt risks, since fluctuations in macroeconomic developments can subsequently spill over to the financial system via fundamentals affecting pri-vate sector indebtedness (employment, dispos-able income, sales).
household debt is rising FAster thAn gdp If we compare the household credit to GDP ratio and per capita GDP in Slovakia with the same indicators in other EU countries, it appears that the current strong growth in Slovak household debt probably goes beyond natural convergence. Although debt levels are catching up with the EU average, it is
questionable whether that level is sustainable in Slovakia, particularly given that per capita GDP in Slovakia is far lower than the EU average and is generally increasing more slowly than debt. Another risk is pace of convergence. The faster that debt in Slovakia converges towards the EU average, the greater may be the concen-tration of that debt in younger age groups (i.e. the groups most active in terms of borrowing), which makes these groups more vulnerable compared with the same groups in more ad-vanced EU economies.
FAlling interest rAtes hAve hAd A mAjor upwArd impACt on debt in slovAkiA A comparison between Slovakia and other CEE countries suggests that the greater in-crease in the debt of Slovak households is closely linked to significant declines in inter-est margins and interest rates. Credit growth in Slovakia, and the related increase in house-hold debt, has been fostered by exceptionally favourable macroeconomic conditions, above all the significant improvement in the labour market. Household debt growth in Slovakia has,

24NBS
Financial Stability RepoRtNovemBer 2017
C H A P T E R 2
Chart 14 Slovakia’s ranking among 11 CEE countries in terms of selected indicators
Sources: ECB and Eurostat.Note: The higher a country’s position in the coloured parts of the chart, the more conducive are the conditions for household debt growth.
Box 2
123456789
1011
June
201
0
June
201
7
June
201
0
June
201
7
June
201
0
June
201
7
June
201
0
June
201
7
June
201
0
June
201
7
Hou
seho
ldcr
edit
to G
DP
Inte
rest
mar
gin
on h
ousin
g lo
ans
Une
mpl
oym
ent
rate
GD
P pe
r cap
ita
Net
�na
ncia
lpo
sitio
n to
GD
P
Slov
akia
’s ra
nkin
g in
the
grou
p of
CEE
cou
ntrie
s MarginsIndebtedness Economic fundamentals
however, been far higher than that in other CEE countries. It is therefore important to compare the extent to which the marked disparity in these rates is attributable to differential trends in economic fundamentals. A comparison of 11 CEE countries including Slovakia4 shows that Slovakia’s ranking in terms of selected funda-mentals has remained largely unchanged. In other words, the fundamentals in the other countries have been similarly favourable to those in Slovakia.
4 Slovakia, the Czech Republic, Poland, Hungary, Slovenia, Croatia, Estonia, Latvia, Lithuania, Romania and Bulgaria.
5 Net financial position is defined as the difference between households’ financial assets and their financial liabilities.
On the one hand, Slovakia has since 2007 been among the three highest ranked CEE countries in terms of GDP per capita; on the other hand, it has long ranked among the worst for unemploy-ment (7th to 11th place), and also for the ratio of households’ net financial position to GDP5 (fall-ing gradually to 11th place). So while Slovakia has moved up to first place for household debt, its ranking for the selected fundamentals has re-mained largely unchanged.
Besides reporting the highest household in-debtedness among the eleven CEE countries surveyed, Slovakia also has the lowest interest margins on housing loans. Their compression in Slovakia has to a large extent mirrored the in-crease in household debt in excess of the trends observed in the CEE regions. That compression has been reflected in declines in interest rates and in the annual percentage rate of charge (APRC) for housing loans. In August 2017 interest margins in Slovakia were lower than in any oth-er CEE country, as were servicing costs on new housing loans. The national rankings therefore show that the increase in household debt in Slo-vakia is more strongly linked to declines in inter-est margins and interest rates than to economic fundamentals.
Household debt is increasing excessively, since its pace is running ahead of what mac-roeconomic fundamentals would imply. The increase in household leverage appears to have been caused by rapidly falling interest rates and the resulting substantial increase in loan afforda-bility.
A COMPARISON OF RETAIL LENDING VOLUME AND ECONOMIC FUNDAMENTALS – AN ECONOMETRIC ANALYSIS
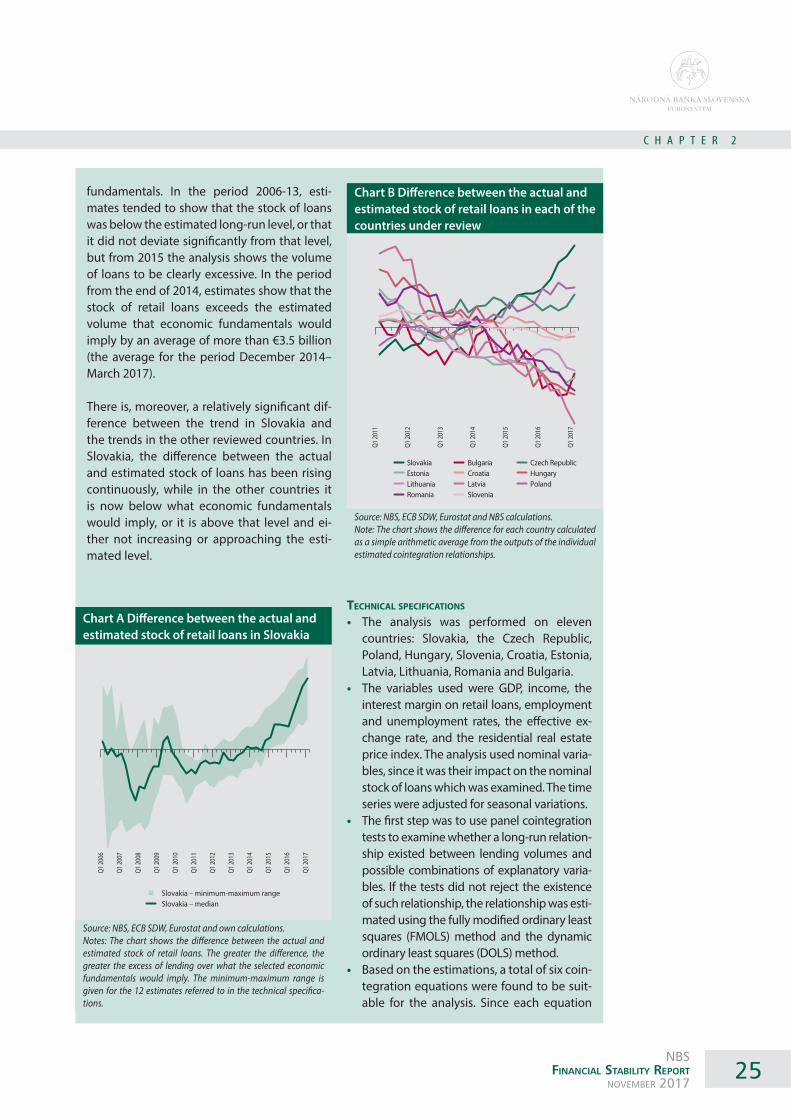
the stoCk oF household loAns in slovAkiA is greAter thAn eConomiC FundAmentAls would imply On the basis of an econometric analysis, this Box further addresses the question of whether the stock of retail loans (and therefore house-hold debt) in Slovakia is consistent with eco-nomic fundamentals or potential explanatory variables. Eleven CEE countries, including Slo-
vakia, were examined to see whether the vol-ume of retail lending in the country showed a long-term relationship with the selected macroeconomic and financial factors. The technical specifications are given below.
A robust result of the estimates is that since around the end of 2014, the volume of loans in Slovakia is above what is justified by economic
25NBS
Financial Stability RepoRtNovemBer 2017
C H A P T E R 2
Chart A Difference between the actual and estimated stock of retail loans in Slovakia
Source: NBS, ECB SDW, Eurostat and own calculations.Notes: The chart shows the difference between the actual and estimated stock of retail loans. The greater the difference, the greater the excess of lending over what the selected economic fundamentals would imply. The minimum-maximum range is given for the 12 estimates referred to in the technical specifica-tions.
Chart B Difference between the actual and estimated stock of retail loans in each of the countries under review
Source: NBS, ECB SDW, Eurostat and NBS calculations.Note: The chart shows the difference for each country calculated as a simple arithmetic average from the outputs of the individual estimated cointegration relationships.
Slovakia – minimum-maximum rangeSlovakia – median
Q1 20
06
Q1 20
07
Q1 20
08
Q1 20
09
Q1 20
10
Q1 20
11
Q1 20
12
Q1 20
13
Q1 20
14
Q1 20
15
Q1 20
16
Q1 20
17
Slovakia Estonia Lithuania Romania
Bulgaria Croatia Latvia Slovenia
Czech RepublicHungary Poland
Q1 20
11
Q1 20
12
Q1 20
13
Q1 20
14
Q1 20
15
Q1 20
16
Q1 20
17
fundamentals. In the period 2006-13, esti-mates tended to show that the stock of loans was below the estimated long-run level, or that it did not deviate significantly from that level, but from 2015 the analysis shows the volume of loans to be clearly excessive. In the period from the end of 2014, estimates show that the stock of retail loans exceeds the estimated volume that economic fundamentals would imply by an average of more than €3.5 billion (the average for the period December 2014–March 2017).
There is, moreover, a relatively significant dif-ference between the trend in Slovakia and the trends in the other reviewed countries. In Slovakia, the difference between the actual and estimated stock of loans has been rising continuously, while in the other countries it is now below what economic fundamentals would imply, or it is above that level and ei-ther not increasing or approaching the esti-mated level.
teChniCAl speCiFiCAtions
• The analysis was performed on eleven countries: Slovakia, the Czech Republic, Poland, Hungary, Slovenia, Croatia, Estonia, Latvia, Lithuania, Romania and Bulgaria.
• The variables used were GDP, income, the interest margin on retail loans, employment and unemployment rates, the effective ex-change rate, and the residential real estate price index. The analysis used nominal varia-bles, since it was their impact on the nominal stock of loans which was examined. The time series were adjusted for seasonal variations.
• The first step was to use panel cointegration tests to examine whether a long-run relation-ship existed between lending volumes and possible combinations of explanatory varia-bles. If the tests did not reject the existence of such relationship, the relationship was esti-mated using the fully modified ordinary least squares (FMOLS) method and the dynamic ordinary least squares (DOLS) method.
• Based on the estimations, a total of six coin-tegration equations were found to be suit-able for the analysis. Since each equation

26NBS
Financial Stability RepoRtNovemBer 2017
C H A P T E R 2
Chart 15 Distribution of loans provided in 2017:Q3 by DTI ratio (percentages)
Source: NBS.Note: Two per cent of the loans had a DTI ratio of more than 12.
Chart 16 Illustrative limits applied in selected countries and converted into a ratio of the numerator (stated in the chart) to net annual income
Sources: National central banks, Eurostat and own calculations.Notes: In Norway, the borrower’s total debt is monitored only when housing loans are provided. In Ireland, the share of new loans with a DTI ratio > 3.5 may not exceed 20%. In the UK, the share of new loans with a DTI ratio > 4.5 may not exceed 15%. In Norway, the share of new loans with a DTI ratio > 5 may not exceed 10%. The limit in each country is the same for different household cate-gories. Differences in the size of limit arise solely from differences in the conversion from gross income to net income.
100
90
80
70
60
50
40
30
20
10
0
12
10
8
6
4
2
0
Share of new loans in 2017:Q3 provided in the givenDTI band (right-hand scale)
0.5 1.0 1.5 2.0 2.5 3.0 3.5 4.0 4.5 5.0 5.5 6.0 6.5 7.0 7.5 8.0 8.5 9.0 9.5 10.0
10.5
11.0
11.5
12.0
60% of loans with a DTI of up to 6
81% of loans with a DTI of up to 8
88% of loans with a DTI of up to 9
93% of loans with a DTI of up to 1098% of loans with a DTI of up to 12
Household of two adults and two children, with one average salaryHousehold of two adults and two children, with two average salariesOne applicant without children, with two-thirds of the average salaryOne applicant without children, with the average salary
8
7
6
5
4
3
2
1
0Ireland United Kingdom Norway
Total debt limit Housing loan size limit
was estimated using two different methods (FMOLS) and (DOLS), a total of 12 estima-tions of the long-run relationship were ob-tained. The explanatory variable combina-tion included in these equations comprised GDP, the employment or unemployment rate, interest margins, income, and residen-tial real estate prices.
• The variables included in the equations were generally those with an expected impact (the higher the GDP, income or real estate prices, the greater the expected stock of loans; the higher the interest margins, the lower the ex-
pected stock of loans). The exceptions were the unemployment and employment rates, which were included in the equations with an opposite sign, probably owing to the fact that, in the estimation, the countries differed far more in their structural characteristics (countries with a higher unemployment rate may at the same time have a higher volume of loans) than in the impact of the changes in these variables over time. These variables ap-pear to have a rather marginal impact in the estimated equations and therefore do not skew the estimations to a significant extent.
borrowers in slovAkiA Are beComing more leverAged thAn would be possible under limits set AbroAd A proportion of loans have been provided to borrowers whose debt-to-income (DTI) ratio, net of loan servicing, is high. The DTI ratio is an important indicator of a household’s indebted-ness (Chart 15).
An international comparison shows that in respect of new business volumes, Slovak banks provide a large proportion of loans to
borrowers whose DTI ratios exceed DTI limits introduced in other countries. DTI limits have now been introduced by some countries (the United Kingdom, Ireland and Norway) and are being considered by several others (including

27NBS
Financial Stability RepoRtNovemBer 2017
C H A P T E R 2
the Czech Republic). The methodology of these ratios differs between countries (net income vs gross income, mortgage debt vs total debt, etc.). The limits are to some extent comparable if the definition of income is harmonised (by conver-sion to net income, the term used for the pur-poses of Slovak legislation in this area). In the comparison with Slovakia, Norway is particular-ly important, since, like Slovakia, it applies the concept of the borrower’s total debt (the UK and Ireland have put a limit only on the housing loan itself, mainly owing to the lack of credit registries suited for the monitoring of a borrower’s total debt). In Norway, a borrower’s total debt must not be more than five times the borrower’s gross annual income, or, in terms of net income, be-tween six and seven times higher depending on the category of family. Norway allows up to 10% of new loans to be exempted from that limit. Of loans provided by Slovak banks in the third quar-ter of 2017, fully 29% of new loans were to bor-rowers whose DTI ratio was higher than seven. Unlike Slovakia, however, Norway only monitors DTI ratios in regard to housing loans, not to loans provided for possible subsequent consumption purposes. It is, though, also the case in Slovakia that high DTI ratios are almost always associated with housing loans. High DTI ratios are seen in re-lation to consumer loans only where the borrow-er is already servicing a housing loan or where the borrower takes out a housing loan and con-sumer loan simultaneously.
nbs is tAking steps to mitigAte risks AssoCiAted with high household debt growth Since 2014 NBS has been adjusting limits on credit standards, first through recommenda-tions and subsequently through binding leg-islation. The primary purpose of these measures is to ensure that the sizes of loans are compati-ble with the financial position of the borrowers. Thanks to the synergies between the different partial constraints imposed under these meas-ures, both borrowers and the financial system as a whole have become more resilient to adverse developments.
Nevertheless, household debt remains on a relatively strong growth path, supported to a large extent by extremely low interest rates, downward pressure on credit standards, and the continuing strength of the economy’s growth. It may also be expected that at least
the GDP growth trend will maintain its trend go-ing forward. The medium-term macroeconomic outlook envisages a steadily increasing positive output gap, indicating gradual overheating of the economy6. Upward pressure on debt is also coming from the continuing growth in residen-tial real estate prices.
In general, the trends conducive to increasing leverage are continuing and, at the same time, they are reducing the impact of the measures that NBS has already adopted. Such a situation could lead to excessively high household debt, thereby increasing the likelihood of a future fi-nancial crisis or decline in economic growth. NBS is monitoring these trends closely and stands ready to respond to them.
2.3 AS LENDING TO NON-FINANCIAL CORPORATIONS (NFCS) HAS INCREASED, SO TOO HAS NFC DEBT
Key trends concerning NFC credit growth
• The corporate credit market is in the ex-pansionary phase of its cycle
• Against a backdrop of good economic times and low interest rates, lending to NFCs has been showing a clearly stable and broad-based growth trend
• Besides their stock of loans from domestic banks, firms’ other liabilities have also in-creased, and therefore so has the NFC sec-tor’s aggregate indebtedness
• The non-performing loan ratio for lending to NFCs has continued to fall, albeit more slowly than before
the CorporAte Credit mArket is in the expAnsionAry phAse oF its CyCle, given the highly FAvourAble eConomiC situAtion And low interest rAte environment
NFC credit growth has continued in 2017 at the stable pace observed towards the end of 2016. For the first three quarters of 2017, lend-ing to non-financial corporations increased by 9% year on year. The growth was largely attributable to private sector borrowing, which after picking up at the beginning of 2015 has been consistently driving NFC credit growth. That stability, however, has been predicated on the economic situation, which at present is particularly favourable.
6 NBS’s September 2017 Medi-um-Term Forecast (MTF-2017Q3).

28NBS
Financial Stability RepoRtNovemBer 2017
C H A P T E R 2
Chart 18 Contribution to annual NFC credit growth by the total borrowing category (EUR millions)
Source: NBS. Note: The total volume of lending to each NFC determines the cate-gory into which that credit is included.
Chart 17 Annual NFC credit growth
Source: NBS.
PublicPrivateNFCs in total (right-hand scale)Investment loans (right-hand scale)Small and medium-sized enterprises (right-hand scale)
2.0
1.5
1.0
0.5
0.0
-0.5
-1.0
-1.5
-2.0
16
12
8
4
0
-4
-8
-12
-16
(%)
Jan.
2013
Apr. 2
013
July
2013
Oct. 2
013
Jan.
2014
Apr. 2
014
July
2014
Oct. 2
014
Jan.
2015
Apr. 2
015
July
2015
Oct. 2
015
Jan.
2016
Apr. 2
016
July
2016
Oct. 2
016
Jan.
2017
Apr. 2
017
July
2017
up to €0.25 mil.over €0.25 mil.over €1 mil.
over €10 mil.over €100 mil.
1,500
1,000
500
0
-500
-1,000
Dec.
2009
June
2010
Dec.
2010
June
2011
Dec.
2011
June
2012
Dec.
2012
June
2013
Dec.
2013
June
2014
Dec.
2014
June
2015
Dec.
2015
June
2016
Dec.
2016
June
2017
The good economic times have also had an impact on the composition of NFC credit growth. This increase has been broad-based across virtually all categories, including loan purpose, loan maturity, and ownership or size of borrower, as well as in the breakdowns by eco-nomic sector and bank. Underlying this trend has been strengthening confidence in the busi-ness sector, which, in conjunction with the low interest rate environment, has translated into an expansion of business activity. The result has been increased need for financing to support this expansion (whether through short-term or operating loans) and for investment, which has supported growth in investment credit with longer maturities. Strong domestic consumption and favourable trends in the property market have revived lending to the services, retail trade and construction sectors. These sectors have therefore been strongly supporting what, from a credit market perspective, are the principal sectors: industry, energy supply and commercial real estate.
Most of the increase in lending to NFCs dur-ing the period under review consisted of credit to existing borrowers, but there was also an increase in the number of new bor-rowers. From the perspective of financial stabil-
ity, it is important to monitor the concentration of credit flows. In this context, the majority of the lending growth comprised credit to existing bor-rowers, especially to firms with total borrowing of more than €100 million. Exposure increased, however, in all categories of total borrowing. On the one hand, it is welcome that lending to SMEs has also increased; on the other hand, the above-mentioned development has caused an increase in loan book concentration.7 There was also a moderate increase in the number of new corporate borrowers.8 Given the low volumes of this lending, the borrowers appear to have been mainly small enterprises.
Not only demand-side factors, but also supply-side factors are supporting credit growth. Inter-bank competition and favourable assessments of the economic situation contin-ued to generate credit supply during the peri-od under review. These factors were reflected in a moderate drop in interest rates on NFC loans. In addition there was a slight easing of credit standards. Given the prevalent optimism in the credit market, banks are expected to be closely monitoring their credit standards with regard to the corporate loan book’s sensitivity to eco-nomic developments as well as to interest rate movements.
7 Measured using the Herfind-ahl-Hirschman Index.
8 Borrowing firms that have not taken out a loan for more than 12 months.

29NBS
Financial Stability RepoRtNovemBer 2017
C H A P T E R 2
Chart 20 NFCs’ external financing and their indebtedness
Source: NBS.
Chart 19 NFC credit growth by country (percentages)
Source: NBS and ECB SDW.
Box 3
Year-on-year NFC credit growthChange in year-on-year growth
12
10
8
6
4
2
0
-2
-4
-6
-8
-10
4%
1%1%
-3%
-2%
1%
3%2%
0% 0%1%
6%6%
-6%
2%
0%
2%
5%
-5%
-1%
1%
11%
3%
4%
7%
Irelan
dCy
prus
Portu
gal
Italy
Gree
ceSp
ainM
alta
Croa
tiaEu
ro ar
eaLa
tvia
Austr
iaRo
man
iaNe
ther
lands
Lithu
ania
Slove
nia
Bulg
aria
Denm
ark
Germ
any
Swed
enFr
ance
Esto
nia
Belg
ium
Finlan
dHu
ngar
yCz
ech
Repu
blic
Slova
kiaPo
land Bonds
Foreign loansIntercompany loansDomestic loansDebt-to-equity ratio (right-hand scale)Debt-to-GDP ratio (right-hand scale)
10.0
7.5
5.0
2.5
0.0
-2.5
-5.0
100
90
80
70
60
50
40
30 M
ar. 2
010
June
2010
Sep.
2010
Dec.
2010
Mar
. 201
1Ju
ne 20
11Se
p. 20
11De
c. 20
11M
ar. 2
012
June
2012
Sep.
2012
Dec.
2012
Mar
. 201
3Ju
ne 20
13Se
p. 20
13De
c. 20
13M
ar. 2
014
June
2014
Sep.
2014
Dec.
2014
Mar
. 201
5Ju
ne 20
15Se
p. 20
15De
c. 20
15M
ar. 2
016
June
2016
Sep.
2016
Dec.
2016
Mar
. 201
7Ju
ne 20
17
(%) (EUR billions)
The sizeable and broad-based growth in lending to NFCs suggests that this part of the credit market is in an expansionary phase. The lending growth in the domestic banking sector is also significant in comparison with lending growth in other EU countries, with Slo-vakia, Poland and the Czech Republic reporting the highest levels of NFC credit growth.
Other sources of corporate financing also in-creased year on year, and therefore so did NFC indebtedness. Looking at the year-on-year growth in corporate financing in absolute terms, loans from domestic banks were only its third largest component. Foreign loans and bond is-sues recorded greater growth. Another contribu-tor to the overall growth was intercompany credit.
Since all of the NFC sector’s main liability items increased during the period under review, nat-urally so did its aggregate indebtedness. Signs of a worsening financial position may be seen in the increase in the sector’s total debt to equity ratio as well as in the increase in the total debt to GDP ratio. Another important factor is the increase in the sector’s debt to annual sales ra-tio, which occurred despite the good economic times. This ratio reached levels comparable to those following the outbreak of the crisis, when sales were falling sharply. Likewise the debt bur-den ratio shows that sales growth is not keeping pace with credit growth. The only factor easing the debt burden is the continuing downward path of interest rates, albeit the pace of their fall has moderated in the recent period.
NFC FINANCING IN THE CAPITAL MARKET
Recent years have seen relatively strong growth in corporate financing9 in the capital market via the issuance of debt securities. The stock of these securities was more than 30% higher at the end of June 2017 than at the end of 2014. Bonds held by non-residents have the highest share, which constitute more
9 For the purposes of this analysis, the following ESA 2010 sectors and subsectors are included: S11 (non-financial corporations); and S125, S126 and S127 (other finan-cial corporations).
than two-thirds of all the bonds issued by NFCs. The stock of bonds owned by domestic entities recorded its largest increases in 2014 and 2015 and currently stands at €2.3 billion.
Looking at domestic financial institutions’ hold-ings of bonds issued by Slovak and Czech firms,

30NBS
Financial Stability RepoRtNovemBer 2017
C H A P T E R 2
Chart A Stock of bonds issued by Slovak firms (EUR billions)
Source: NBS.
Chart B Corporate bonds issued by firms as a share of the aggregate assets of different types of financial institution (percentages)
Source: NBS.
Chart C Corporate bond holdings in Slovakia broken down by sector of holder (EUR billions)
Source: NBS.
9
8
7
6
5
4
3
2
1
0
ResidentsNon-residents
Dec. 2014 Dec. 2015 Dec. 2016 June 2017
BanksPFMCsInsurers
SPMCsInvestment funds
4.5
4.0
3.5
3.0
2.5
2.0
1.5
1.0
0.5
0.0Dec. 2013Dec. 2012 Dec. 2014 Dec. 2015 Dec. 2016 June 2017
Financial institutionsHouseholdsNon-�nancial institutionsOther
2.5
2.0
1.5
1.0
0.5
0.0Dec. 2014 Dec. 2015 Dec. 2016 June 2017
banks hold the largest share. At the same time, however, investment funds’ share has been in-creasing since 2015 and now makes up almost 4% of domestic funds’ aggregate net assets.
In the case of investment funds, both the growth in their bond holdings and actual amount of those holdings are relatively con-centrated, with a few funds accounting for more than 50% of the segment’s total hold-ings (worth €166 million). The bonds held by these funds comprise mainly bonds issued by JOJ Media house, Tatry Mountain Resorts, J&T Finance Group, and Eurovea.
Households’ holdings of bonds increased substantially as well. Households’ holding of bonds issued by firms amounted to more than €1 billion as at June 2017, which is two times the amount held as of end 2014. More than half of that amount comprised bonds issued by the financial groups J&T and Penta.
Households’ increasing participation in NFC financing raises questions about, among oth-er things, financial literacy, i.e. about whether households are aware of the risks associated with such investment activity.

31NBS
Financial Stability RepoRtNovemBer 2017
C H A P T E R 2
Chart 21 Lending to the CRE sector and lending for building construction (percentages)
Source: NBS.
30
25
20
15
10
5
0
-5
-10
-15
Lending to the CRE sectorLending to the construction sector for building construction
Jan.
2014
Apr. 2
014
July
2014
Oct. 2
014
Jan.
2015
Apr. 2
015
July
2015
Oct. 2
015
Jan.
2016
Apr. 2
016
July
2016
Oct. 2
016
Jan.
2017
Apr. 2
017
July
2017
The non-performing loan ratio for NFC loans continued to fall during the period under review, owing to the favourable economic situation. It stopped falling, however, towards the end of the third quarter. The combination of good economic times and still declining interest rates continued to have a favourable impact on the quality of the corporate loan book. The ag-gregate NPL ratio fell to 5.6% and was at that lev-el at the end of September.
2.4 RISKS IN THE COMMERCIAL REAL ESTATE (CRE) SECTOR
Key trends in the CRE sector
• Both demand and supply in the CRE mar-ket showed increasing growth rates in the first three quarters of 2017
• Although lending to the CRE sector stopped growing, positive sentiment in the market spurred growth in lending to the construction sector
• Trends conducive to the potential emer-gence of imbalances in the CRE sector be-came more pronounced
given the FAvourAble eConomiC situAtion And outlook For Further growth, existing trends in the Cre seCtor beCAme more pronounCed in the First three quArters oF 2017. henCe there wAs An inCreAse in the risk thAt imbAlAnCes will emerge And hAve An Adverse impACt on the FinAnCiAl seCtor The highly favourable situation in both the domestic and foreign economy was reflected in increasing optimism among participants in the CRE market. Developments in the resi-dential segment may be described as positive, although growth rates moderated somewhat from the high levels observed in the second half of 2016 (see also the section discussing house-hold credit growth). Household consumption, the main pillar of Slovak GDP growth during the period under review, supported activity in the area of retail and logistics premises. The good times also supported the performance of the NFC sector: firms’ improving economic situa-tion stimulated their expansion activity and so
boosted demand for office and logistics prem-ises.
In this context, however, CRE market indi-cators maintained trends that point to an acceleration of the market’s expansionary phase. Strong demand for commercial real es-tate, evidenced by an increase in net absorp-tion, is keeping the vacancy rate at historically low levels. As a result, office and industrial new builds, announced in 2016, are reaching pre-cri-sis levels. Therefore, on the one hand, firms’ de-mand for such premises is covered for around two years, but, on the other hand, there is a risk that the supply could turn excessive if the econ-omy cools. The buoyancy of the CRE market is reflected in the prime yields on investment in the market, which continued to fall in the first three quarters of 2017. Even so, the market in Slovakia still offers more attractive yields com-pared with the markets in neighbouring coun-tries.
Lending to the CRE sector stopped growing in 2017, but lending to the construction sector increased significantly. In contrast to the situa-tion in the CRE market and to the significant drop in non-performing loans, lending to the CRE

32NBS
Financial Stability RepoRtNovemBer 2017
C H A P T E R 2
sector remained flat in the first three quarters of 2017. After rising sharply in 2016, the stock of loans to the CRE sector remained unchanged and therefore its year-on-year growth rate de-clined, to 6% at end-September 2017 (from 15% at the start of 2017).
That decline may be caused by the fact that some banks’ exposure to particular property developers was approaching internal or regu-latory limits on exposure size. In this context, the growing concentration in the CRE loan books of certain banks is an adverse result.
Besides loans, investments in bonds issued by property developers are also increasing the banking sector’s exposure to the CRE sector, since this form of financing has being increasing in the recent period.
Another factor behind the slowdown in lending may be, however, that several major proper-ty developments were announced in 2016 (in both the residential and commercial segments), while no similar level of unveilings is expected in 2017.
The CRE sector represents a significant risk to the domestic financial sector. Concentra-tion is the main structural indicator that is in-creasing risk in the sector, whether in regard to the size of the aggregate loan book or to the size of particular loans. Loans to the CRE sec-tor and loans for building construction (a sub-sector of the construction industry) together make up a quarter of the total stock of NFC loans, and almost 40% of all non-performing NFC loans.
Furthermore, historical experience shows the high sensitivity of the CRE and construction sectors to economic developments, and there-fore the riskiness of these sectors. Indeed, they accounted for a major share of both cred-it growth and credit losses in the 2006–09 pe-riod.
The optimism stemming from the particularly good macroeconomic times is accentuating sev-eral trends that increase the risk of imbalances emerging in the CRE sector. Given this sector’s
strong sensitivity to economic developments, it is essential that banks be rigorous in setting and monitoring credit standards.
The low interest rate environment, together with the search-for-yield phenomenon, is encourag-ing developers to pursue non-loan sources of funding. A major source of such funding is the issuance of corporate bonds, the main buyers of which are banks, institutional investors and households. As a result, however, the entire financial system is becoming increasingly ex-posed to the CRE sector.
2.5 IN THE LOW INTEREST RATE ENVIRONMENT, BANKS ARE BECOMING INCREASINGLY SENSITIVE TO ADVERSE EFFECTS
Risk assessment summary
• If credit growth in the years ahead contin-ues at the elevated levels of 2017, banks could maintain relatively stable profitabil-ity
• Generating the same profit on a substan-tially increasing stock of loans is, however, increasing banks’ sensitivity to any adverse changes in the rate of return on, or credit quality of, their loan book
• The main risk is that credit risk will not be maintainable at its current historically low levels
• This sensitivity is most pronounced among less significant banks
As noted in previous Financial Stability Re-ports, banks’ profitability is under increasing pressure from the persistent low interest rate environment. This pressure is most clearly seen in the continuing decline in the aggregate net interest margin, which at end-September 2017 showed a year-on-year drop from 2.6% to 2.4%. This trend is expected to continue in the period ahead. If other conditions remain unchanged, a 0.1 percentage point decline in the net inter-est margin reduces banks’ profitability by around 10%.

33NBS
Financial Stability RepoRtNovemBer 2017
C H A P T E R 2
Table 2 Changes in the assumptions of the baseline scenario for banks’ profitability up to 2020
Year-on-year rate of change in stock of item
Change in average interest rate, or return, on item
Consumer loans Positive rate moderating gradually from 14.0% to 13.0%
Linear decrease from 9.8% to 4.8%
Housing loans Positive rate moderating gradually from 14.0% to 13.3%
Linear decrease from 2.3% to 1.5%
NFC loans Positive rate increasing from 8.0% to 9.0% Unchanged at 2.5%Securities holdings Negative rate unchanging at -5% Gradual decrease from 2.7% to 1.9%Retail deposits – time accounts Negative rate moderating from -8% to -5% Gradual decrease from 0.9% to 0.1%Retail deposits – current accounts Positive rate unchanging at 16% Unchanged at 0.0%NFC deposits Positive rate increasing from 7% to 10% Decrease from 0.0% to -0.1% Securities issued Positive rate unchanging at 13% Decrease from 1.7% to 0.5%Additional assumptions:
The credit risk cost ratio increases gradually for both retail loans (from 0.66% to 0.75%) and NFC loans (from 0.64% to 0.73%)Source: NBS.Notes: The most recent data available are for August 2017. The scenario covers the period from September 2017 to December 2020.
Chart 22 Simulation of banks’ net profit for the years from 2017 to 2020 and the factors affecting its year-on-year change (EUR millions)
Source: NBS.Notes: Banks’ profit for 2016 is net of extraordinary and one-off effects. Their net profit for the years 2017 to 2020 is simulated under the baseline scenario assumptions set out in Table 2. The bars show each factor’s contribution to the overall year-on-year change.
Retail portfolio (right-hand scale)NFC portfolio (right-hand scale)Securities (right-hand scale)Credit risk (right-hand scale)Other factors (right-hand scale)Net pro�t (left-hand scale)
700
500
300
100
-100
-300
-500
-700
150
100
50
0
-50
-100
-1502016 2017 20202018 2019
The potential trend in bank profits is here an-alysed on the basis of their simulation under an updated baseline scenario. This scenario takes into account the current favourable eco-nomic situation. Given the economy’s upward path, as well as the growth in bank lending re-corded in the first three quarters of 2017, the assumption for credit growth has been revised up from that made in the May 2017 Financial Stability Report. Details of the scenario are given in Table 2.
The simulation shows that the impact of the low interest rate environment was moderat-ed in the first three quarters of 2017 by ac-celerating growth in lending activity, espe-cially in loans to non-financial corporations. Through this credit growth, banks were able to largely offset the above-mentioned adverse impact of falling interest margins on profit-ability. Under the scenario set out above for developments in the years from 2017 to 2020, the profitability simulation shows aggregate bank profits (net of extraordinary effects) to be slightly lower in 2017 than in 2016 and there-after to remain broadly stable at that level. In the simulation exercise, as Chart 22 shows, the main contributor to banks’ aggregate profit is growth in net interest and non-interest income from their NFC portfolios, contingent on accel-erating growth in loans to NFCs. The sustaina-bility risk to banks’ business models, which was
described in previous Financial Stability Re-ports, is therefore partly reduced. The banking sector, however, remains exposed to the risk that profits will fall if lending growth moder-ates significantly.
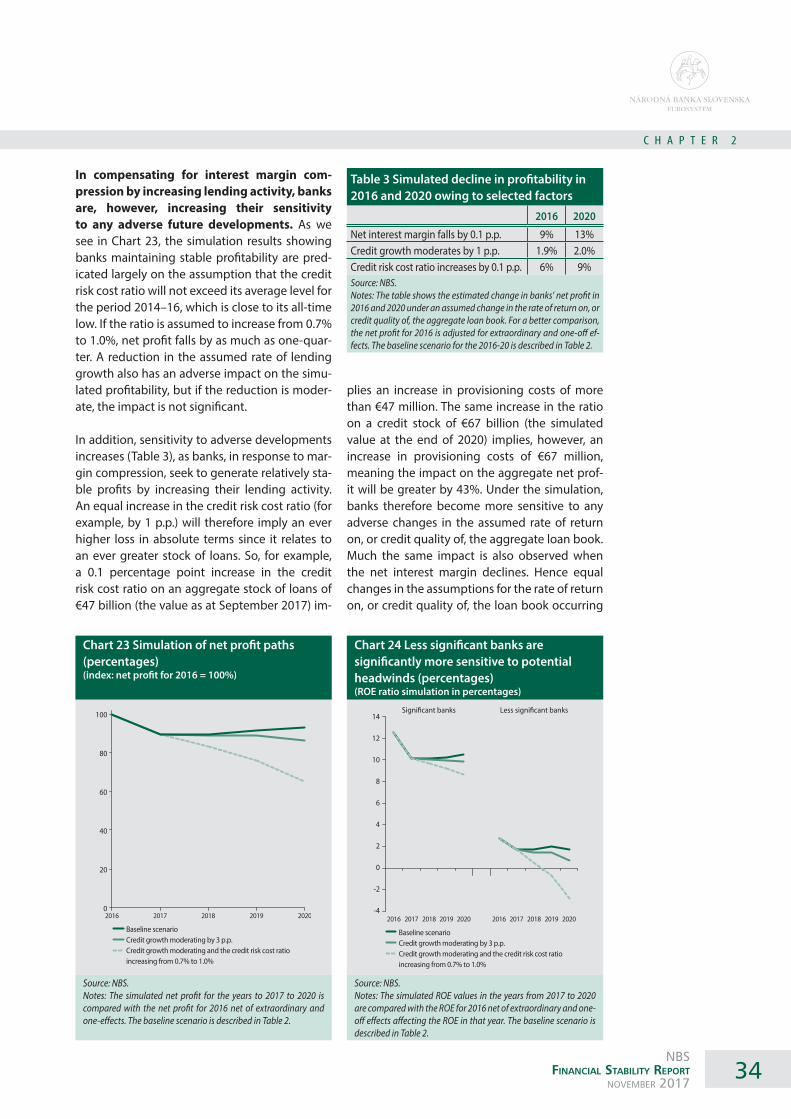
34NBS
Financial Stability RepoRtNovemBer 2017
C H A P T E R 2
Chart 24 Less significant banks are significantly more sensitive to potential headwinds (percentages)(ROE ratio simulation in percentages)
Source: NBS.Notes: The simulated ROE values in the years from 2017 to 2020 are compared with the ROE for 2016 net of extraordinary and one-off effects affecting the ROE in that year. The baseline scenario is described in Table 2.
Chart 23 Simulation of net profit paths (percentages)(index: net profit for 2016 = 100%)
Source: NBS.Notes: The simulated net profit for the years to 2017 to 2020 is compared with the net profit for 2016 net of extraordinary and one-effects. The baseline scenario is described in Table 2.
Table 3 Simulated decline in profitability in 2016 and 2020 owing to selected factors
2016 2020
Net interest margin falls by 0.1 p.p. 9% 13%Credit growth moderates by 1 p.p. 1.9% 2.0%Credit risk cost ratio increases by 0.1 p.p. 6% 9%Source: NBS.Notes: The table shows the estimated change in banks’ net profit in 2016 and 2020 under an assumed change in the rate of return on, or credit quality of, the aggregate loan book. For a better comparison, the net profit for 2016 is adjusted for extraordinary and one-off ef-fects. The baseline scenario for the 2016-20 is described in Table 2.
Baseline scenarioCredit growth moderating by 3 p.p.Credit growth moderating and the credit risk cost ratioincreasing from 0.7% to 1.0%
100
80
60
40
20
02016 2017 2018 2019 2020
Baseline scenarioCredit growth moderating by 3 p.p.Credit growth moderating and the credit risk cost ratioincreasing from 0.7% to 1.0%
14
12
10
8
6
4
2
0
-2
-4 2016 2017 2018 2019 2020 2016 2017 2018 2019 2020
Signi�cant banks Less signi�cant banks
In compensating for interest margin com-pression by increasing lending activity, banks are, however, increasing their sensitivity to any adverse future developments. As we see in Chart 23, the simulation results showing banks maintaining stable profitability are pred-icated largely on the assumption that the credit risk cost ratio will not exceed its average level for the period 2014–16, which is close to its all-time low. If the ratio is assumed to increase from 0.7% to 1.0%, net profit falls by as much as one-quar-ter. A reduction in the assumed rate of lending growth also has an adverse impact on the simu-lated profitability, but if the reduction is moder-ate, the impact is not significant.
In addition, sensitivity to adverse developments increases (Table 3), as banks, in response to mar-gin compression, seek to generate relatively sta-ble profits by increasing their lending activity. An equal increase in the credit risk cost ratio (for example, by 1 p.p.) will therefore imply an ever higher loss in absolute terms since it relates to an ever greater stock of loans. So, for example, a 0.1 percentage point increase in the credit risk cost ratio on an aggregate stock of loans of €47 billion (the value as at September 2017) im-
plies an increase in provisioning costs of more than €47 million. The same increase in the ratio on a credit stock of €67 billion (the simulated value at the end of 2020) implies, however, an increase in provisioning costs of €67 million, meaning the impact on the aggregate net prof-it will be greater by 43%. Under the simulation, banks therefore become more sensitive to any adverse changes in the assumed rate of return on, or credit quality of, the aggregate loan book. Much the same impact is also observed when the net interest margin declines. Hence equal changes in the assumptions for the rate of return on, or credit quality of, the loan book occurring
35NBS
Financial Stability RepoRtNovemBer 2017
C H A P T E R 2
at the end of a three- or four-year horizon have a significantly greater impact on banks’ net profit than do the same changes applied in 2016.
This increase in sensitivity is more evident among less significant banks. Under a deteri-oration in the assumptions for rate of return or credit quality, the aggregate ROE for significant banks remains at relatively solid levels (falling only slightly), but the aggregate ROE for less sig-nificant banks turns negative.
2.6 THE FINANCIAL SECTOR WILL CONTINUE TO FACE SIGNIFICANT REGULATORY RISKS
signiFiCAnt impACt oF regulAtory ChAnges on FinAnCiAl stAbility
Developments in the regulatory environment have a relatively significant impact on the behaviour of financial institutions. NBS has already on a number of occasions noted the im-pact of regulatory activity on the profitability of banks and insurers. In the case of banks, direct regulatory costs (in particular the bank levy and fund contributions) are equivalent to around one-fifth of their aggregate profit. Among small banks, the share is even higher.
The indirect impact of the introduction of a stat-utory cap on early repayment fees for housing loans has also been relatively substantial. This legislative measure resulted in heightened inter-bank competition, accompanied by an easing of credit standards and increasing indebtedness. At the same time, the cap has had a major impact on banks’ aggregate profit.
The increasing impact of regulatory activity is also seen in interest rates on consumer loans. The total charge on such loans may not be more than twice the market average, which is gradu-ally decreasing in the low interest rate environ-ment. In coming years the banking sector will also face the challenge of ensuring that banks meet the minimum requirement for own funds and eligible liabilities (MREL) so as to be able to absorb losses in times of difficulty.
At the level of European Union legislation, the proposed revisions of the CRR, CRD IV, BRRD and SRMR will be particularly important. Since the
amendments to these regulations and directives are being introduced in a single package of re-form aimed at reducing risk in the banking sector, it is crucial to look at their potential overall impact on the Slovak banking sector and their interre-lationship. The proposals continue the trend of weakening the position of subsidiaries and host supervisors in the EU. The main risk they pose to the financial stability of the Slovak banking sector is in allowing capital waivers to be granted to sub-sidiary banks and, at the same time, the setting of single point of entry (SPE) resolution strategies10 for the groups these banks belong to.
A Commission regulAtion11 due to enter into ForCe on 1 jAnuAry 2018 will implement internAtionAl FinAnCiAl reporting stAndArd (iFrs) 9
Summary assessment of the impact of IFRS 9
• The biggest change concerns provisioning, which will be based on an expected credit losses model
• For loans showing heightened credit risk, including non-performing loans, banks will have to provision for the expected credit loss over the lifetime of the loan
• For Slovak banks, the transition to the new standard is expected to increase their pro-visioning by around 14%, or almost 0.7% of their own funds as at June 2017
• The increase in provisioning resulting from the transition to the new standard will not af-fect the sector’s profitability in 2018. The im-pact on own funds is expected to be gradual
The new standard introduces changes in two main areas – in the classification and meas-urement of financial assets, and in the report-ing of financial asset impairment losses. Un-der the standard currently applied, International Accounting Standard (IAS) 39, financial assets are classified in one of the following four catego-ries: financial assets at fair value through profit or loss (FV); available-for-sale financial assets (AFS); held-to-maturity investments (HTM); and loans and receivables. These assets are measured either at fair value (FV and AFS) or at amortised cost (HTM and loans and receivables). IFRS 9 in-troduces three categories for the classification of financial assets: assets measured at amortised cost; assets measured at fair value through oth-
10 Under the SPE resolution strategy there is only one resolution entity for the given financial group.
11 Commission Regulation (EU) 2016/2067 of 22 November 2016 amending Regulation (EC) No 1126/2008 adopting certain international accounting standards in accordance with Regulation (EC) No 1606/2002 of the European Parliament and of the Council as regards International Financial Reporting Standard 9.

36NBS
Financial Stability RepoRtNovemBer 2017
C H A P T E R 2
er comprehensive income (FVOCI); and assets measured at fair value through profit or loss (FVPL).
The second major area where financial institu-tions will be subject to changes is the reporting of impairment losses. Under IAS 39, provisions are created only for incurred losses. These pro-visions cover losses for which there is objective evidence (for example, the borrower has default-ed) or losses that the financial institution has incurred but is unable to recognise. Provisions for incurred but not reported losses are mostly created for assets measured on a portfolio basis. (For example, in a mortgage portfolio it may be assumed that a proportion of borrowers have been made redundant, and so there is an objec-tive reason for these borrowers to default during the course of the next year. At present, of course, the bank does not know the identity of these borrowers, but using statistical techniques it can estimate the size of the incurred losses relative to the mortgage portfolio and provision accord-ingly.)
By contrast, IFRS 9 requires banks to follow an ex-pected credit losses (ECL) model. Loans on which credit risk has not significantly increased since initial recognition (Stage 1 loans) are required to be measured through a loss allowance at an amount equal to the 12-month expected credit losses. Loans on which credit risk has significantly increased since initial recognition (Stage 2 loans) are required to be measured through a loss al-lowance at an amount equal to the full lifetime expected credit losses. If loans subsequently be-come non-performing (Stage 3), a change takes place in how interest revenue is calculated. Un-der Stages 1 and 2, interest revenue is calculated on the gross carrying amount, whereas under Stage 3 it is calculated on the amortised cost, i.e. basically the net value of the loan.
the new stAndArd mAy Also bring ChAnges ConCerning mACroprudentiAl poliCy A positive aspect of the new standard is that banks will have to provision on the basis of expected losses, which should be a more ob-jective way of covering future losses. Further-more, for loans on which credit risk significantly increases, banks will create provisions based on the credit risk over the full lifetime of the loan. Therefore provisioning under the new standard
should provide an improved, more transparent view of the level of risk in banks’ loan books. At the same time, however, the new standard could have an impact on the cyclical behaviour of banks, and therefore also on macroprudential policy. There are studies12 showing that a sig-nificant increase in provisioning at the onset of a recession or downswing in the financial and business cycle may amplify the cycle, since fi-nancial institutions are significantly less able and willing to lend to the real economy. This as-pect of the new accounting standard must also be taken into account in macroprudential policy decisions (for example, through a higher calibra-tion of the countercyclical capital buffer, which, under the new standard, will have to cover an earlier and greater increase in loan loss provi-sioning).
ACCording to survey results, most bAnks Are AlreAdy in the testing phAse oF iFrs 9 implementAtion, And All oF them Are expeCted to be reAdy For the trAnsition by no lAter thAn 31 deCember 2017 or 1 jAnuAry 2018The degree of Slovak banks’ preparation for the transition to the IFRS 9 standard was as-certained by a survey. Changes concerning classification and measurement are expected to have their greatest impact on debt securities in the AFS portfolio. Under the new standard, most of the assets in this portfolio will be measured at fair value through other comprehensive income, but in some banks they will be measured at am-ortised cost or at fair value through profit or loss (FVPL). Assets in the HTM portfolio and loans should be measured at amortised cost and as-sets in the FV portfolio at FVPL.
When reclassifying loans from Stage 1 to Stage 2, banks will consider many qualitative and quan-titative factors. The criteria most frequently ap-plied are the absolute or relative change in the borrower’s probability of default, the days past due (30 days), and whether the borrower is sub-ject to restructuring or whether the internal rat-ing of the borrower has deteriorated.
An increase in provisions is expected to arise mainly from the introduction of Stage 2 loans. Banks’ responses show that the need to provi-sion for lifetime expected credit losses on Stage 2 loans is expected to increase aggregate pro-visions by around 14% (or almost 0.7% of own
12 For example, Abad, J. and Suarez, J., “Assessing the cyclical implica-tions of IFRS 9 – a recursive model”, Occasional Paper Series, No 12, ESRB, July 2017.

37NBS
Financial Stability RepoRtNovemBer 2017
C H A P T E R 2
funds as at June 2017). This result is largely in line with results of a survey conducted by the European Banking Authority (EBA).13 The EBA’s survey sample covered around 50 large bank-ing groups across Europe. According to their re-sponses, the estimated increased in provisions compared with the current levels of provisions under IAS 39 is 13% on average. In the case of Slovak banks, the increase in provisions is ex-pected to be greater for retail loans (20% on av-erage) and less for loans to non-financial corpo-rations (10% on average). This difference stems mainly from the longer maturities of retail loans (in particular housing loans), which increase the expected probability of default over the lifetime of the loan. The results are relatively heteroge-neous across banks due to existing differences between banks in the composition of their port-folios.
The new standard enters into force on 1 January 2018, but its impact on banks will be gradual since a five-year transition period for its imple-mentation is planned. The details of how the new standard will be phased in are still under discussion. The initial increase in provisions re-sulting from the transition to IFRS 9 on 1 January 2018 will affect only the sector’s own funds – it is not expected to weigh on the sector’s profit for 2018. Given its estimated impact and its phas-ing-in for banks, the transition to IFRS 9 is not likely to have a significantly adverse impact on the banking sector.
the potentiAl impACt oF the speCiAl levy on non-liFe insurAnCe hAs inCreAsed owing to A new interpretAtion oF the lAw; solvenCy will not be AFFeCted
A new levy on non-life insurance premiums (‘the levy’) was introduced on 1 January 2017 under an Insurance Act amendment adopted at the end of 2016. Under the original draft of the amendment, the levy was to apply to all ex-isting non-life insurance contracts. This would have directly affected insurers’ profits, and NBS, among others, drew attention to such impact. In the end, the amendment was watered down and the levy was applied only to insurance contracts signed after 31 December 2016. Insurers’ were therefore able to take appropriate account of the levy when setting premiums for insurance con-tracts signed in 2017.
13 EBA Report on results from the Second EBA Impact Assessment of IFRS 9, available at:
https://www.eba.europa.eu/documents/10180/1720738/EBA+Report+on+results+-from+the+2nd+EBA+IFRS9+IA.pdf
A feature of non-life contracts, however, is that they are usually concluded for a one-year period and then renewed for another year. The question therefore arose as to whether renewals of con-tracts signed before 1 January 2017 were to be treated as new contracts for the purpose of the levy. The insurance sector interpreted the law to mean that renewals do not constitute a new con-tract and are therefore not subject to the levy. Such contracts could therefore be repeatedly renewed without being retrospectively subject to the levy.
At the end of September 2017 the Financial Di-rectorate of the Slovak Republic issued explana-tory information about the levy, including a no-tice that contract renewals are to be treated as new contracts and are therefore subject to the levy.
It remains to be seen to what extent the levy burden on policy renewals will be passed on to policyholders in the cost of the premiums.
2.7 LIQUIDITY RISK IN THE BANKING SECTOR HAS INCREASED
Risk assessment summary
• The maturity mismatch between assets and liabilities reached an all-time high in 2017
• The stability of short-term liabilities is in-creasingly important for the banking sec-tor, while the most stable of these liabilities (deposits) are increasing more slowly than loans
• The new Europe-wide liquidity regulation framework will result in the easing of li-quidity risk requirements, even while the level of this risk in Slovakia is increasing
liquidity risk in the slovAk bAnking seCtor is inCreAsingly determined by the stAbility oF short-term liAbilities The ratio of the banking sector’s liquidity gap to its total assets increased to an all-time high in 2017. The main cause of the increasing maturity mismatch between assets and liabil-ities has been the continuing combination of

38NBS
Financial Stability RepoRtNovemBer 2017
C H A P T E R 2
Chart 26 Loan-to-deposit ratio and ratio of liquid assets to short-term liabilities (percentages)
Source: ECB.
Chart 25 Decline in the ratio of liquid assets to short-term liabilities in the Slovak banking sector (percentages)
Source: ECB.
80
70
60
50
40
30
20
10
0
EU – interquartile rangeSlovakiaCEE countries – medianEU – median
Dec.
2005
Dec.
2006
Dec.
2007
Dec.
2008
Dec.
2009
Dec.
2010
Dec.
2011
Dec.
2012
Dec.
2013
Dec.
2014
Dec.
2015
Dec.
2016
crisis
70
60
50
40
30
20
10
0 0 50 100 150
Loan-to-deposit ratio
Ratio
of l
iqui
d as
sets
to sh
ort-
term
liab
ilitie
s
AT
BE
BG
CY
CZ
DE
EE
ES
FI
GR
HR
IE
IT
LI
LU
LV
MT
NL
PLPT
RO
SI
SK
upward trends in long-term illiquid assets and in short-term liabilities. (The increase in liabili-ties with a maturity of less than seven days has had the greatest impact.) The increasing liquid-ity gap stems mainly from the low interest rate environment as well as from the business model of the Slovak banking sector. Although devel-opments surrounding the liquidity gap in 2017 were somewhat mixed, its historically high level is evidence of the banking sector’s increased vul-nerability.
The increase in short-term liabilities was also related to the decline in the ratio of liquid assets to short-term liabilities. This trend is in marked contrast to the situation in other EU countries. As with the liquidity gap, the increase in this ratio is largely determined by the increase in short-term liabilities. While the ratio of liquid asset to total assets is falling only slowly, the ratio of short-term liabilities to total assets has been increasing for an extended period of time. This means that the liquid asset coverage of short-term liabilities has continued to fall. The stability of short-term liabilities is therefore increasingly important for the Slovak banking sector. The cur-rent trend is not in itself problematic, but the rel-ative shortage of liquid assets raises the question of whether banks have sufficient stable sources of funding. Put another way, if banks become
less able to use liquid sales to cover the risk of short-term deposits being withdrawn, they will increasingly have to rely on the stability of the short-term deposits themselves.
The most stable funding sources in the Slo-vak financial sector are retail deposits and, to a lesser extent, NFC deposits. Therefore the con-tinuing rise in the aggregate loan-to-deposit ratio (up to an all-time high in September 2017) is un-favourable in terms of liquidity risk. The banking sector in Slovakia is in a relatively more vulnerable position compared with banking sectors in other EU countries. On the one hand, its low ratio of liq-uid assets to short-term liabilities is increasing its need for stability of funding sources; on the other hand, it has the sixth highest loan-to-deposit ratio in the EU, and unlike the ratio in most EU coun-tries, the one in Slovakia is increasing.
the new liquidity regulAtion FrAmework will result in the eAsing oF liquidity requirements An important issue in the area of liquidity is the approaching end of the liquidity coverage re-quirement currently applied in Slovakia under an NBS Decree. In various modified forms since 2003, this requirement has set a limit on short-term liquidity in the domestic banking sector; from January 2018, however, it will be replaced by the Europe-wide harmonised liquidity coverage

39NBS
Financial Stability RepoRtNovemBer 2017
C H A P T E R 2
ratio (LCR) in accordance with Regulation (EU) No 575/2013. The LCR’s parameters are less conserva-tive compared with the parameters of the require-ment currently applied by NBS. Although the new definition of liquid assets is more precise, the pa-rameters of the net outflows calculation represent a significant relaxation of the rules.
In order to meet the LCR, the Slovak banking sector will need a smaller volume of liquid assets. Given domestic banks’ increasing sen-sitivity to liquidity risk, the easing of regulatory requirements for short-term liquidity is not a fa-vourable development.
3
FINANCIAL SECTOR
RESILIENCE
C H A P T E R 3
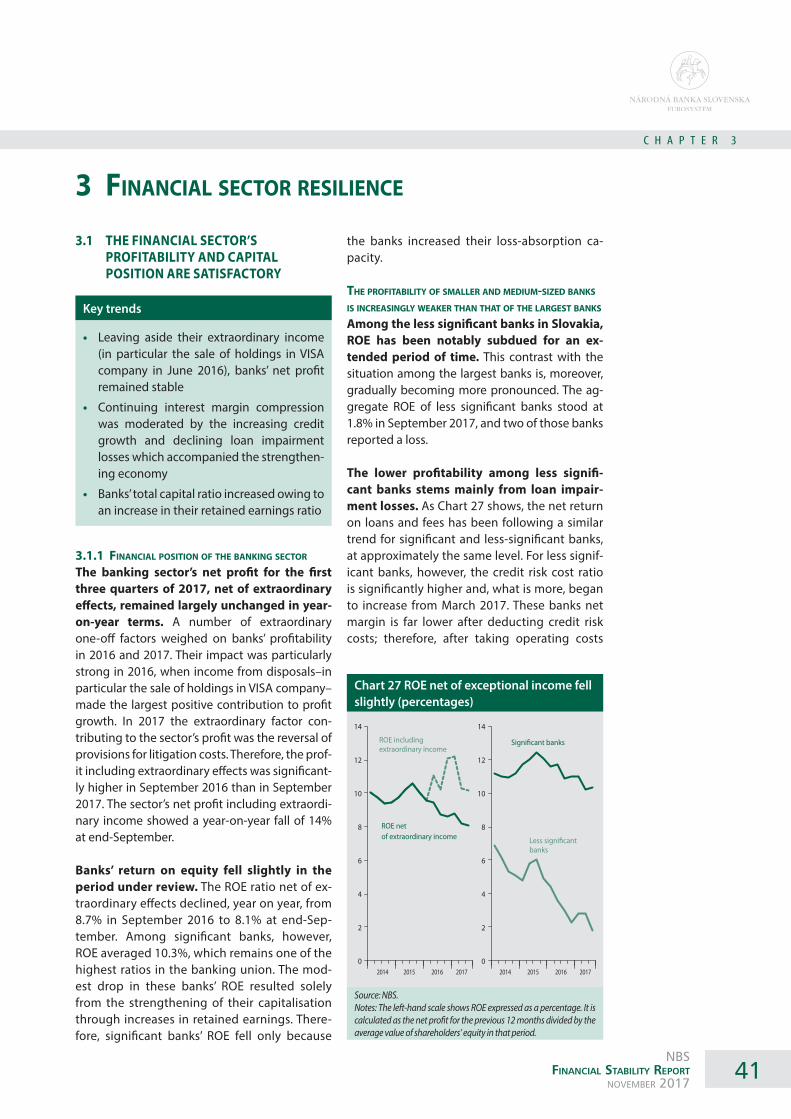
41NBS
Financial Stability RepoRtNovemBer 2017
C H A P T E R 3
Chart 27 ROE net of exceptional income fell slightly (percentages)
Source: NBS.Notes: The left-hand scale shows ROE expressed as a percentage. It is calculated as the net profit for the previous 12 months divided by the average value of shareholders’ equity in that period.
14
12
10
8
6
4
2
0 2014 2015 2016 2017
ROE net of extraordinary income
ROE includingextraordinary income
14
12
10
8
6
4
2
0 2014 2015 2016 2017
Signi�cant banks
Less signi�cantbanks
3 FinAnCiAl seCtor resilienCe
3.1 THE FINANCIAL SECTOR’S PROFITABILITY AND CAPITAL POSITION ARE SATISFACTORY
Key trends
• Leaving aside their extraordinary income (in particular the sale of holdings in VISA company in June 2016), banks’ net profit remained stable
• Continuing interest margin compression was moderated by the increasing credit growth and declining loan impairment losses which accompanied the strengthen-ing economy
• Banks’ total capital ratio increased owing to an increase in their retained earnings ratio
3.1.1 FinAnCiAl position oF the bAnking seCtor The banking sector’s net profit for the first three quarters of 2017, net of extraordinary effects, remained largely unchanged in year-on-year terms. A number of extraordinary one-off factors weighed on banks’ profitability in 2016 and 2017. Their impact was particularly strong in 2016, when income from disposals–in particular the sale of holdings in VISA company–made the largest positive contribution to profit growth. In 2017 the extraordinary factor con-tributing to the sector’s profit was the reversal of provisions for litigation costs. Therefore, the prof-it including extraordinary effects was significant-ly higher in September 2016 than in September 2017. The sector’s net profit including extraordi-nary income showed a year-on-year fall of 14% at end-September.
Banks’ return on equity fell slightly in the period under review. The ROE ratio net of ex-traordinary effects declined, year on year, from 8.7% in September 2016 to 8.1% at end-Sep-tember. Among significant banks, however, ROE averaged 10.3%, which remains one of the highest ratios in the banking union. The mod-est drop in these banks’ ROE resulted solely from the strengthening of their capitalisation through increases in retained earnings. There-fore, significant banks’ ROE fell only because
the banks increased their loss-absorption ca-pacity.
the proFitAbility oF smAller And medium-sized bAnks is inCreAsingly weAker thAn thAt oF the lArgest bAnks Among the less significant banks in Slovakia, ROE has been notably subdued for an ex-tended period of time. This contrast with the situation among the largest banks is, moreover, gradually becoming more pronounced. The ag-gregate ROE of less significant banks stood at 1.8% in September 2017, and two of those banks reported a loss.
The lower profitability among less signifi-cant banks stems mainly from loan impair-ment losses. As Chart 27 shows, the net return on loans and fees has been following a similar trend for significant and less-significant banks, at approximately the same level. For less signif-icant banks, however, the credit risk cost ratio is significantly higher and, what is more, began to increase from March 2017. These banks net margin is far lower after deducting credit risk costs; therefore, after taking operating costs

42NBS
Financial Stability RepoRtNovemBer 2017
C H A P T E R 3
Chart 28 The lower profit of less significant banks is largely attributable to higher credit risk costs (percentages)
Source: NBS.Notes: The net return on loans and fees is calculated as net interest and non-interest income for the previous 12 months divided by the average stock of loans during that period.
7
6
5
4
3
2
1
0 2014 2015 2016 2017 2014 2015 2016 2017
Credit risk cost ratio
Signi�cant banks Less signi�cant banks
Net return on interestand fees
into account, their net profitability remains sig-nificantly lower.
The main drag on banks’ profitability is the compression of net interest margins. This caused banks’ interest income for the first three quarters of 2017 to fall by 3% year on year. That decline would have been greater but for banks’ increasing efforts, supported in several cases by parent institutions, to offset falling interest margins with increasing lending to the retail sector and NFCs. Such a trend, however, is in-creasing banks’ sensitivity to potential future headwinds.
Banks’ profitability was supported by a low credit risk cost ratio. The ratio declined grad-ually from the end of 2014 (0.95%) to June 2017 (0.57%). This downward trend stopped in the third quarter of 2017, when the credit risk cost ratio for retail loans increased slightly (to 0.67%) owing to the fact the default rate for consumer loans has been steadily increasing since mid-2015. The credit risk cost ratio for NFC loans also remained low, with only a very
modest increase (from 0.62% in September 2016 to 0.64% in September 2017). The sec-tor’s profitability further benefited from some banks’ reversal of provisions for legal risk, al-though that may rather be considered to be an extraordinary effect.
3.1.2 proFitAbility in other FinAnCiAl mArket segments Leaving aside the impact of extraordinary ef-fects, the insurance sector’s gross profit for the first half of 2017 remained largely unchanged in year-on-year terms, showing an increase of 2%. The sector’s net profit actually declined year on year, by fully 10%, with a number of factors continuing to weigh on insurers’ profitability. One such factor is the situation in life insurance, where the average rate of return on investments in the first half of the year (3.75%) continued to outpace only slightly the average guaranteed re-turn (3.4% as at end-2016). Another factor is the loss ratio in motor insurance, where claims paid are exceeding premiums earned, more so after including additional levy.
Profitability of asset management companies increased in both the pension fund sector and investment fund sector. This growth was driv-en mainly by increases in fee and commission income. As regards fees related to fund perfor-mance, the largest increase was in fees related to the performance of growth funds holding a higher proportion of equities. This was more pronounced in the sector of supplementary pen-sion management companies (third pillar of the pension system).
3.1.3 solvenCy And leverAge
thAnks to An inCreAse in its retAined eArnings rAtio, the bAnking seCtor sAw An inCreAse in its CApitAlisAtion
The banking sector’s capital position strengthened during the first half of 2017. The main reason for this was a substantial rise in its retained earnings ratio, from an average of below 10% for the period 2014–16, to 42% for the period under review. The sector’s total capital ratio increased during that period, from 18.0% to 18.6%. The aggregate common equi-ty Tier 1 (CET1) capital ratio rose from 15.8% to

43NBS
Financial Stability RepoRtNovemBer 2017
C H A P T E R 3
16.1%. Capital ratio increases were observed across EU countries. In Slovakia, the levels of the total capital ratio and CET1 ratio as at March 2017 were slightly lower compared with the median values for the other national banking sectors in the EU, which in the case of the to-tal capital ratio was 19.0%, and the CET1 ratio, 16.3%.
In order to continue to meet strengthen-ing regulatory capital requirements, banks will have to maintain a more conservative dividend policy. In 2017 banks’ have reduced dividend rates and thereby largely offset the increasing capital charges arising from their rapidly growing lending activity. At the same time, banks’ own funds are enough to meet the increasing countercyclical capital buffer (CCyB) rate, which was raised from 0.0% to 0.5% from 1 August 2017 and is set to be tightened further from 1 August 2018, to 1.25%. If they are to main-tain lending growth, some banks will therefore be constrained to continue their conservative dividend policy in coming years. Some smaller and medium-sized banks reporting subdued profits may have to increase capital through sources other than earnings.
Besides solvency ratios, the leverage ratio also increased. The banking sector’s aggregate leverage ratio increased during the first half of 2017 from 8.1% to 8.3%, which is well above the regulatory minimum ratio of 3%.
the insurAnCe seCtor’s solvenCy Fell slightly The insurance sector’s Solvency Capital Re-quirement (SCR) coverage ratio fell by 5% in the first half of 2017, the main cause being redemptions of capital at certain insurers. Other insurers also saw their capital decline, however, albeit in some cases only owing to the ordinary volatility of capital ratios. Nevertheless, the in-surance sector remained adequately capital-ised. As at June 2017 the market averages for the two ratios that measure solvency in the in-surance sector–the SCR coverage ratio and the Minimum Capital Requirement (MCR) coverage ratio–were relatively high above the minimum level of 100%. The SCR coverage ratio stood at 220% and the MCR coverage ratio at 540%.
Even at the level of individual insurer’s, the low-est SCR coverage ratio was 60% higher than the minimum, and the lowest MCR coverage ratio was 40% higher.
speCiFiCities oF the regulAtion oF insurers’ CApitAl AdequACy The capital position of the insurance market is one of the key elements in the regulation of insurers, as is indicated by name of the re-spective EU Directive – Solvency II. Neverthe-less, there appear to be some areas that could affect stability, most notably the composition of insurers’ regulatory capital, the insurers’ option to meet minimum regulatory requirements, and, last but not least, the correct evaluation of liabil-ities and equity.
A specific area of insurance sector solvency is the inclusion in Tier 1 capital of unstable items, namely expected profits in future pre-miums (EPIFP). In life insurance in particular there is scope for the inclusion of expected profit that will be paid over the duration of what are generally longer-term policies (tens of years). Such a capital component has only very limited capacity to absorb unexpected losses over the short term, for which capital requirements are designed. Furthermore, the amount of EPIFP may be overestimated (owing to, for example, the underestimation of tech-nical provisions or the adoption of erroneous assumptions). NBS will be monitoring devel-opments in this area and will respond to them where necessary.
3.2 MACROPRUDENTIAL POLICY RESPONSIVENESS
Countercyclical capital buffer (CCyB)
• The CCyB rate was increased from zero to 0.5% with effect from 1 August 2017 and will be raised again, to 1.25%, from 1 Au-gust 2018
• A further hike in the CCyB rate will be con-sidered if credit market pressures continue to increase

44NBS
Financial Stability RepoRtNovemBer 2017
C H A P T E R 3
Chart 29 Domestic credit-to-GDPtrend gap (percentages)
Source: NBS.
Chart 30 Cyclogram
Source: NBS.
Benchmark bu�er rate (right-hand scale)Domestic credit to GDPtrend gap (right-hand scale)Domestic credit to GDPtrend ratio – �lteredDomestic credit to GDPtrend ratioBu�er trigger (right-hand scale)
70
60
50
40
30
20
10
0
8
7
6
5
4
3
2
1
0
-1
-2
-3De
c. 19
93De
c. 19
94De
c. 19
95De
c. 19
96De
c. 19
97De
c. 19
98De
c. 19
99De
c. 20
00De
c. 20
01De
c. 20
02De
c. 20
03De
c. 20
04De
c. 20
05De
c. 20
06De
c. 20
07De
c. 20
08De
c. 20
09De
c. 20
10De
c. 20
11De
c. 20
12De
c. 20
13De
c. 20
14De
c. 20
15De
c. 20
16
Credit risk lossesIndebtedness and debt service ratioHousing marketCredit marketMacroeconomyDomestic credit to GDPtrend gapHistorical median of the CyclogramCET1 capital ratio (right-hand scale)
9
8
7
6
5
4
3
2
1
0
25
20
15
10
5
0
Dec.
2003
Dec.
2004
Dec.
2005
Dec.
2006
Dec.
2007
Dec.
2008
Dec.
2009
Dec.
2010
Dec.
2011
Dec.
2012
Dec.
2013
Dec.
2014
Dec.
2015
Dec.
2016
(%)
NBS Decrees on credit standards
• A Decree laying down binding require-ments for housing loans entered into force on 1 January 2017, with its measures to be phased in with gradual tightening by 1 July 2018
• A Decree laying down binding require-ments for consumer loans will enter into force on 1 January 2018, with the most im-portant requirement being a financial buff-er requirement similar to that laid down for housing loans
3.2.1 CounterCyCliCAl CApitAl buFFer
the CCyb rAte in slovAkiA is grAduAlly being rAised The CCyB rate in Slovakia was raised from zero to 0.5% with effect from 1 August 2017. Banks and foreign bank branches in the Slo-vak market have therefore been required since August of this year to apply to their domes-tic exposures a countercyclical capital buffer equivalent to 0.5% of their total risk-weighted exposures. This first ever increase in the CCyB rate to a non-zero level was a response to the financial cycle’s strengthening expansionary phase, manifested in growing credit market pressures and in the acceleration of private sec-tor debt growth.
In July 2017 the NBS Bank Board approved a further increase of CCyB rate, from 0.5% to 1.25% with effect from 1 August 2018. This rate hike was a response to persisting trends in the credit market and to the fact that sever-al imbalances had become more pronounced in the period since the adoption of the deci-sion to set a non-zero CCyB rate. Growth in the stock of loans to the private non-financial sector had been gradually accelerating in the first half of 2017, with annual growth in loans to NFCs joining the rate for household loans in double figures. The rates of both household and NFC credit growth in Slovakia in the first half of 2017 were higher than those in all oth-er EU countries. Private sector credit growth is exceeding growth rates for GDP, household disposable income, and corporate sales, and therefore private sector debt is increasing. The domestic credit to GDPtrend gap, an indicator of
credit market overheating, has been increas-ing continuously for three years and its bench-mark buffer rate implies a CCyB rate of 1.75%.
Likewise, an indicator of the financial cycle’s phase (the Cyclogram), points to increasing momentum in the cycle’s upswing. Towards mid-2017 its level was approaching the histor-ical highs of 2008. For around a year, all of its

45NBS
Financial Stability RepoRtNovemBer 2017
C H A P T E R 3
components either were increasing, or remained unchanged; none fell. Persistently low inter-est rates, favourable economic developments, strong credit market competition, and property market trends are the main causes of the increas-ing indebtedness and of the financial cycle’s strengthening expansionary phase.
On a quarterly basis Národná banka Slovenska issues a decision on the setting of the countercy-clical capital buffer rate. A further raising of the CCyB rate will be considered if credit market pressures continue to increase.
3.2.2 prudentiAl lending prinCiples Fully implemented in lAw
From jAnuAry 2018 the existing requirements For the provision oF housing loAns will be Complemented by requirements For the provision oF Consumer loAns In response to the increasing significance of risks associated with household debt growth, NBS has been phasing in the implementation of prudential lending requirements. On 1 Jan-uary 2017 NBS Decree No 10/201614 entered into force, laying down requirements for the provision of housing loans. On 1 January 2018 NBS Decree No 10/201715 will enter into force, laying down minimum requirements in the area of consumer loans. The issuance of these Decrees completes the transformation of NBS Recommendation No 1/201416 into binding law, while at the same time harmonising lending rules for both types of loan and for all lenders, including non-bank lenders.
The main purpose of these Decrees is to ensure that borrowers’ debt service burden is com-mensurate with their financial situation. It is im-portant that at a time when their indebtedness is rapidly increasing, borrowers do not become over-leveraged. The Decrees will ensure that lending conditions are set in such a way that they are not an impediment to sound and sustainable retail credit growth. The limits set under the Decrees are there-fore designed to prevent a build-up of pressures which support excessive borrowing and which at present stem mainly from the environment of historically low interest rates. It should be stressed that all the incoming rules apply only to the provi-sion of new loans or to top-up loans. The Decrees do not apply to existing loans that are not being topped up. It is also important to point out that the Decrees set only minimum credit standards; the re-
14 Decree No 10/2016 of Národná banka Slovenska of 13 Decem-ber 2016 laying down detailed provisions on the assessment of borrowers’ ability to repay housing loans.
15 Decree No 10/2017 of Národná banka Slovenska of 14 Novem-ber 2017 laying down detailed provisions on the assessment of borrowers’ ability to repay consum-er loans.
16 Macroprudential Policy Recom-mendation No 1/2014 of Národná banka Slovenska on risks related to market developments in retail lending.
sponsibility for laying down specific lending condi-tions and for setting up the loan approval process remains fully within the remit of the lenders.
ChAnges in the AreA oF Consumer loAns resulting From nbs deCree no 10/2017 The Decree will extend existing binding pru-dential lending requirements to the area of consumer loans. The necessity of this step is continuing to increase since significantly greater risk is associated with consumer loans than with housing loans. The Decree was approved by the NBS Bank Board on 14 November 2017 and, as mentioned above, is based largely on the terms of NBS Recommendation No 1/2014. At the same time, though, it introduces several chang-es whose main purpose is to harmonise lending rules for housing loans and consumer loans.
The Decree’s most significant provision re-quires loan applicants to have a financial buff-er, in the same way that applicants for housing loans are required to have one. Without such re-quirement, borrowers have been able to use the financial buffer required for a housing loan to service a consumer loan, thereby rendering the regulation ineffectual. The aim is to ensure that loan applicants’ net income is such as to constitute a financial buffer, after deducting from the net income all debt servicing expenditure (with the applicant’s floating rate loans–whether the loan applied for or existing loans–subject to a stressed interest rate that is two percentage points high-er than the current rate) and the applicant’s total minimum subsistence amount (including the minimum subsistence amounts of the applicant’s co-debtors and dependent children, if any). As is the case for housing loans, the buffer is set at 15% of the difference between the applicant’s net in-come and total minimum subsistence amount. From 1 July 2018 this buffer will increase to 20%, as will the buffer required of housing loan applicants. Phasing in the buffer requirement in this way will avert a substantial shock to consumer loan market.
The buffer requirement for consumer loans takes into account, however, the riskiness of these products, particularly in terms of the borrower’s total indebtedness. This requirement therefore does not apply to consumer loan appli-cants if their total indebtedness, including the con-sumer loan applied for, does not exceed their net income over a 12-month period or, in the case of

46NBS
Financial Stability RepoRtNovemBer 2017
C H A P T E R 3
Figure 1 Summary of limits applicable to the provision of housing loans and consumer loans (as from 1 January 2018)
Limit Limit levels and additional conditions
LTV ratio limit
The share of new loans with an LTV ratio > 90% may not exceed 10%.New loans may not have an LTV ratio > 100%.The share of new loans with an LTV ratio > 80% may not exceed 40%.All these limits apply only to loans secured by immovable property.
Minimum financial buffer
After deducting all debt servicing expenditure and the applicant’s total minimum substance amount (including the minimum substance amounts of the applicant’s co-debtors and dependent children, if any), loan applicants must have a financial buffer amounting to at least 15% of the difference between the applicant’s net income and the total minimum subsistence amount. The buffer will be increased to 20% from 1 July 2018.The buffer requirement does not apply to applicants who have low indebtedness, i.e. if their total debt, including the loan applied for, does not exceed their monthly net income over a 12-month period (or an 18-month period in the case of leasing contracts). For housing loan applicants, the minimum subsistence amount of the applicant’s spouse is always deducted from the applicant’s net income when calculating the financial buffer, but for consumer loan applicants it is deducted only if the spouse is a co-applicant. When calculating a loan applicant’s financial buffer, the applicant’s servicing expenditure on floating rate loans (whether the loan applied for or existing loans) is subject to a stressed interest rate that is two percentage points higher than the current rate over the lifetime of the loan(s) (subject to a cap of 6%). Where a loan has an interest rate fixation period of over ten years, it is subject to a stressed interest rate that is one percentage point higher than the current rate. In the case of mort-gage loans for young people entitled to a state interest subsidy, the loan is subject to a stressed interest rate equivalent to what the rate would be without the subsidy plus 2 p.p. Where the applicant for a consumer loan already has a housing loan, the buffer calculation does not include an interest rate stress element if the consumer loan will be repaid before the next resetting of the interest rate on the applicant’s housing loan.
Maximum term
Of new loans secured by immovable property, the share whose term > 30 years may not exceed 10%. New loans not secured by immovable property may not have a term > 8 years. This does not apply if the new loan not secured by immovable property is provided by a home savings bank. Unsecured housing loans may have a term of up to 30 years; however, the share of such loans whose term > 20 years may not exceed 20%, and the share whose term > 30 years may not exceed 10%.
Source: NBS. Notes: The summaries of the individual limits are simplified for the purposes of clarity. The provisions are set out in full in NBS Decree No 10/2016 of 13 December 2016 laying down detailed provisions on the assessment of borrowers’ ability to repay housing loans, and in NBS Decree No 10/2017 of 14 November 2017 laying down detailed provisions on the assessment of borrowers’ ability to repay consumer loans.
leasing contracts requiring a minimum down pay-ment of 20%, an 18-month period. On the other hand, for applicants with a higher debt burden, in particular with an existing housing loan, the buff-er requirement applies in full. The provisions for exemption from the financial buffer requirement are not the only way in which the requirements for consumer loans are more relaxed than those for housing loans. When calculating the financial buffer for consumer loan applicants, the minimum subsistence amount of the applicant’s spouse is deducted from the applicant’s net income only if the spouse is a co-applicant, whereas in the case of housing loan applicants, it is always deducted. For both consumer loan and housing loan applicants,
however, the servicing expenditure on the spouse’s joint debts is deducted in full. Another difference is that the stressed interest rate assumption is not applied in the buffer calculation for consumer loan applicants if the loan applied for will be repaid be-fore the next resetting of the interest rate on the applicant’s housing loan. These exemptions will ensure that the scope and extent of the require-ments for assessing an applicant’s ability to repay a consumer loan are commensurate with the risk and amount of the loan provided.
Figure 1 summarises the most important limits applicable to the provision of housing loans and consumer loans as from 1 January 2018.

47NBS
Financial Stability RepoRtNovemBer 2017
C H A P T E R 3
3.3 REGULATORY CHANGES THAT MAY AFFECT FINANCIAL SECTOR RESILIENCE
new legAl FrAmework For Covered bond issuAnCe is Closer to eu stAndArds
A new legal framework for bond issuance will enter into force for Slovak banks from 1 Jan-uary 2018 and the terms ‘housing loan’ and ‘mortgage loan’ will be unified.17 As Slovak law currently stands, only banks with a mortgage li-cence may provide mortgage loans. At the same time, they are required to finance at least 90% of the total stock of these mortgage loans with mortgage bonds (this limit may be reduced to 70%). On the other hand, mortgage bonds must be backed by mortgage loans whose loan-to-value (LTV) ratio does not exceed 70%.
The new legal framework replaces the current mortgage banking regime with a covered bond programme, which includes all the rights and obligations related to the management of the cover pool and the issuance of covered bonds. The framework reflects recommendations laid down by the European Banking Authority (EBA)18, as well as the liquidity requirements laid down by Commission Delegated Regulation (EU) 2015/61 in order to harmonise covered bond market conditions across EU countries.
The main features of the new framework are as follows19:• It defines the ‘covered bond programme’ as
the sum of all the rights and obligations that a bank issuing covering bonds has in respect of the management of the cover pool and the issuance of covered bonds. Under the cov-ered bond programme, the bank issues all of its covered bonds which are covered by the same type of primary cover assets.
• Under the new framework, the only insti-tutions allowed to issue covered bonds are banks established in Slovakia that have ob-tained prior approval for the issuance from Národná banka Slovenska. This means that a bank may issue covered bonds irrespective of whether it has a mortgage licence or not; the bank must, however, demonstrate to NBS that it meets the technical and legal require-ments for such issuance.
• The provision and funding of mortgage loans is not conditional on the issuance of covered
17 Under an Act approved by the Slovak Parliament on 12 October 2017, which amends Act No 483/2001 Coll. on banks (and amending certain laws), as amend-ed, and amends certain other laws.
18 In the EBA Report on Covered Bonds: Recommendations on harmonisation of covered bond frameworks in the EU of 20 Decem-ber 2016, available on the EBA’s website at
https://www.eba.europa.eu/documents/10180/534414/EBA+Report+on+EU+Cov-ered+Bond+Frameworks+and+-Capital+Treatment.pdf
19 Further details about the new legal framework may be found in the following article, in the Slovak lan-guage: Krčmár, M., “Hypotekárne záložné listy verzus kryté dlhopisy II, Aktuálny stav legislatívneho rámca a dôvody jeho novelizácie”, Biatec, Vol. 25, No 5, Národná banka Slovenska, 2017.
bonds. Covered bonds may only be issued by banks established in Slovakia and not by branches of foreign banks.
• Covered bonds are covered by a ‘cover pool’, and the coverage indicator (i.e. the value of the cover pool over the value of the out-standing liabilities) must be at least 105%. The assets eligible for inclusion in the cover pool are the following: i) the primary cover assets (see next point), which must represent at least 90% of the total value of the cover pool; ii) substitution assets; iii) hedging derivatives; and iv) liquid assets.
• The primary cover assets of the cover pool are mortgage loans with a maximum term of 30 years, provided to consumers, and secured by residential immovable property. For each of these loans, the LTV ratio may not be higher than 80% at the time of its registration in the covered bonds register.
• The term ‘mortgage loan’ is redefined to cov-er any loan that is both provided by a credit institution and secured by residential immov-able property; therefore, all loans currently categorised as ‘housing loans’ will be eligible as primary cover assets of a cover pool.
• Substitution assets serve to ensure that the coverage indicator is maintained at a level not lower than 105%. Hedging derivatives are used mainly to hedge interest rate risk and exchange rate risk within the covered bond programme.
• The liquid asset buffer covers net negative cash flows over the next 180 days.
From the perspective of the Slovak banking sector’s financial stability, the new covered bond framework is to be welcomed. Mortgage bonds currently constitute only 6% of banks’ to-tal liabilities, which means they cannot be treat-ed as a genuine alternative to other sources of funding. The new regime allows banks to be, for various reasons, more active in managing the funding of their activities, and it ensures clearer conformity with the prudential requirements of the EU regulatory regime. Banks are not com-pelled to issue covered bonds but may choose to issue them when they see demand and other ap-propriate conditions for such issues. Therefore, the issues may be larger in volume compared with previous mortgage bond issues and may receive a higher credit rating. This implies, on the one hand, increased demand from non-resident

48NBS
Financial Stability RepoRtNovemBer 2017
C H A P T E R 3
investors and, on the other hand, a better price for the bonds. Due to its expected favourable impact on the stability of the banking sector’s funding sources, the new legislation is likely to benefit the sector’s liquidity position over the medium term.
An Amendment oF the lAws on housing loAns And Consumer loAns will enAble nbs to CAp borrowers’ totAl debt From May 2018, lenders will assess the in-debtedness of borrowers, and NBS may set a maximum level of that debt. This is among the provisions laid down in an amendment to
the Banking Act (No 483/2001 Coll.). As regards macroprudential policy, the key change in the laws is the introduction of a total debt to income ratio for borrowers. Although this is a new indica-tor, the monitoring of it is not expected to place an additional burden on lenders. Information on borrowers’ indebtedness is available from the respective credit registers, while information on their income is already used in the calculation of debt service to income ratios. Under the new provision, lenders will be required to set an up-per limit for the total debt to income ratio, and NBS may, by a decree, set a maximum limit to be observed by all lenders.

49NBS
Financial Stability RepoRtNovemBer 2017
AbbreviAtions
AFS available for sale (portfolio)BRRD Bank Recovery and Resolution Directive (Directive 2014/59/EU of the European Parliament
and of the Council of 15 May 2014 establishing a framework for the recovery and resolu-tion of credit institutions and investment firms and amending Council Directive 82/891/EEC, and Directives 2001/24/EC, 2002/47/EC, 2004/25/EC, 2005/56/EC, 2007/36/EC, 2011/35/EU, 2012/30/EU and 2013/36/EU, and Regulations (EU) No 1093/2010 and (EU) No 648/2012, of the European Parliament and of the Council)
APRC annual percentage rate of chargeCMN Cenová mapa nehnuteľností / Real Estate Price MapCRD IV Capital Requirements Directive IV (Directive 2013/36/EU) of the European Parliament and of
the Council of 26 June 2013 access to the activity of credit institutions and the prudential supervision of credit institutions and investment firms, amending Directive 2002/87/EC and repealing Directives 2006/48/EC and 2006/49/EC)
CRR Capital Requirements Regulation (Regulation (EU) No 575/2013 of the European Parliament and of the Council of 26 June 2013 on prudential requirements for credit institutions and investment firms and amending Regulation (EU) No 648/2012)
DOLS dynamic ordinary least squares (methodology)DSTI debt service-to-income (ratio)EBA European Banking AuthorityECB European Central BankEPIFP expected profits in future premiums EU European UnionEU-SILC European Union Statistics on Income and Living ConditionsFVOCI fair value through other comprehensive incomeFVPL fair value through profit or lossGDP gross domestic productHICP Harmonised Index of Consumer PricesHTM held to maturity (portfolio)IAS 39 International Accounting Standard 39IFRS 9 International Financial Reporting Standard 9IMF International Monetary FundLTV loan-to-value (ratio)MREL minimum requirement for own funds and eligible liabilities MTPL motor third party liability (insurance)NBS Národná banka Slovenska / National Bank of SlovakiaO-SII other systemically important institutionsPFMC pension fund management companyRCA recapitalisation amountROE return on equitySCR solvency capital ratioSO SR Statistical Office of the Slovak RepublicSPE single point of entry (resolution strategy)SPMC supplementary pension management company

50NBS
Financial Stability RepoRtNovemBer 2017
SRMR Single Resolution Mechanism Regulation (Regulation (EU) NO 806/2014 of the European Parliament and of the Council of 15 July 2014 establishing uniform rules and a uniform pro-cedure for the resolution of credit institutions and certain investment firms in the framework of a Single Resolution Mechanism and a Single Resolution Fund and amending Regulation (EU) No 1093/2010
51NBS
Financial Stability RepoRtNovemBer 2017
list oF ChArts
Chart 1 GDP and global trade 10Chart 2 Financial market volatility indicators 11Chart 3 Price-to-earnings ratio for the
S&P 500 Index 12Chart 4 GDP growth and its components 14Chart 5 The unemployment rate and sectoral
contributions to annual employment growth 15
Chart 6 Increases in the index of factors supporting credit supply and credit demand 18
Chart 7 Housing loan growth in 2017 was volatile, but remained strong (annualised growth in the stock of housing loans) 19
Chart 8 Volatile housing loan growth and no change in the growth trend for consumer loans (year-on-year changes in EUR millions) 19
Chart 9 The average price of flats (EUR/flat) continued to increase, but in some segments prices flattened (for example, in Bratislava city) (Index: January 2007 = 100) 20
Chart 10 In terms of their credit quality, consumer loans are showing signs of stabilising (net and gross default rates in the main retail loan categories) 20
Chart 11 Household credit to GDP ratio 21Chart 12 Labour market and disposable
income trends in Slovakia and the EU 23
Chart 13 Changes in the household credit to GDP ratio and in per capita GDP between 2013 and 2017 23
Chart 14 Slovakia’s ranking among 11 CEE countries in terms of selected indicators 24
Chart 15 Distribution of loans provided in 2017:Q3 by DTI ratio 26
Chart 16 Illustrative limits applied in selected countries and converted into a ratio
of the numerator (stated in the chart) to net annual income 26
Chart 17 Annual NFC credit growth 28Chart 18 Contribution to annual NFC credit
growth by the total borrowing category 28
Chart 19 NFC credit growth by country 29Chart 20 NFCs’ external financing and their
indebtedness 29Chart 21 Lending to the CRE sector and
lending for building construction 31Chart 22 Simulation of banks’ net profit for
the years from 2017 to 2020 and the factors affecting its year-on-year change 33
Chart 23 Simulation of net profit paths (index: net profit for 2016 = 100%) 34
Chart 24 Less significant banks are significantly more sensitive to potential headwinds (ROE ratio simulation in percentages) 34
Chart 25 Decline in the ratio of liquid assets to short-term liabilities in the Slovak banking sector 38
Chart 26 Loan-to-deposit ratio and ratio of liquid assets to short-term liabilities 38
Chart 27 ROE net of exceptional income fell slightly 41
Chart 28 The lower profit of less significant banks is largely attributable to higher credit risk costs 42
Chart 29 Domestic credit-to-GDPtrend gap 44Chart 30 Cyclogram 44
list oF ChArt in boxes
Box 2
Chart A Difference between the actual and estimated stock of retail loans in Slovakia 25
Chart B Difference between the actual and estimated stock of retail loans in each of the countries under review 25
52NBS
Financial Stability RepoRtNovemBer 2017
list oF tAbles
Table 1 Principal risks to financial stability in Slovakia 8
Table 2 Changes in the assumptions of the baseline scenario for banks’ profitability up to 2020 33
Table 3 Simulated decline in profitability in 2016 and 2020 owing to selected factors 34
Box 3
Chart A Stock of bonds issued by Slovak firms 30
Chart B Corporate bonds issued by firms as a share of the aggregate assets of different types of financial institution 30
Chart C Corporate bond holdings in Slovakia broken down by sector of holder 30