SKF Kompetenscentrum | SKF Tekniska Gymnasium Welcome to SKF!

Industrial and Financial Economics Master Thesis No 2000:14
Financial Risk Management -Case Studies with SKF and Elof Hansson
Vika Brucaite & Shanhong Yan

ii
Graduate Business School School of Economics and Commercial Law Göteborg University ISSN 1403-851X Printed by Novum Grafiska

iii
Abstract The increased volatility of international markets generates increased financial risk to the companies. Exchange rate change is one of the financial risks where the increased volatility is reflected to the greatest extent. Big multinational companies are particularly exposed to exchange rate fluctuation; therefore, special attention should be paid to exchange rate management. There are a lot of ways that exchange rate risk management analysis might be set. In our thesis, transaction exposure is our chosen method of analysis. Business transactions are what profit seeking companies’ activity is based upon, and transaction exposure management is an activity that observes the whole life span of business transaction from “birth” to “death”. Thus, we stress, that such a whole period exposure analysis of the company’s most fundamental activity would give the clearest picture of the topic. In our thesis, we investigate how theoretical transaction exposure management is executed in practice. We analyse the transaction exposure management of two multinational companies from different industrial clusters as a descriptive example. The results of the companies’ transaction exposure management are compared. Our investigation has resulted in a set of interesting observations, together with transaction exposure management suggestions for the companies. Some of the observations give rise to more questions than answers, and it might, therefore, be a good starting point for further research in this field.
Key words Financial risk, exchange rate risk, currency risk, economic exposure, transaction exposure, hedging exposure, quotation exposure, backlog exposure, billing exposure, pricing strategy, netting system, financial instruments, forecast, operating diversification

iv
Acknowledgement We would like to express our deep gratitude to our tutor, Professor Göran Bergendahl, who made a great contribution to our work. We also would like to thank the companies SKF and Elof Hansson for their kind assistance. Without their help, our thesis could not contain such extensive information. We also want to thank Professors Ted Lindblom and Clas Wihlborg for their generous help, and Ann McKinnon for the all support she has given us.

v
1. INTRODUCTION .................................................................. 1
1.2 Exposure management overview..................................................6 1.2.1 Financial risks ..........................................................................6 1.2.2 Overview of existing classifications and terminologies of financial risks ....................................................................................9
1.3 Problem discussion ......................................................................12 1.3.1 Exchange rate exposure..........................................................13 1.3.2 Accounting practice and economic reality .............................14 1.3.3 Translation exposure ..............................................................15 1.3.4 Operating exposure ................................................................16 1.3.5 Transaction exposure .............................................................20
1.4 Purpose .........................................................................................25
1.5 Methodology.................................................................................28 1.5.1 Literature study ......................................................................28 1.5.2 Case study ..............................................................................29
1.6 Limitation.....................................................................................30
2. EXPOSURE MANAGEMENTS STRATEGIES ....................31
2.1 Why hedge?..................................................................................31
2.2 Financial instruments used in hedging ......................................34 2.2.1. Forward rate contracts...........................................................34 2.2.2 Interest rate contracts .............................................................35 2.2.3 Options contracts....................................................................35
vi
2.3 Operating management hedging strategies ...............................35 2.3.1 Matching ................................................................................35 2.3.2 Risk sharing............................................................................37 2.3.3 Netting....................................................................................37
2.4 Practical strategies.......................................................................39 2.4.1 Pricing strategy.......................................................................39 2.4.2 Diversification........................................................................40
2.5 Survey results...............................................................................40
3. CASE STUDY IN SKF.........................................................42
3.1 Overview of SKF..........................................................................42
3.2 Main products, suppliers, customers, competitors and net sales distribution.........................................................................................42
3.3 Overview of the company’s latest years activity and future plans....................................................................................................44
3.4 Financial objectives .....................................................................45
3.5 An analysis of SKF’s financial risk management .....................46
3.6 Observations and suggestions for SKF......................................54
4. CASE STUDY IN ELOF HANSSON....................................60
4.1 Overview of Elof Hansson...........................................................60
4.2 Main business areas, suppliers, customers, competitors and sales distribution................................................................................60
4.3 Overview of the company’s latest years activity and future plans....................................................................................................62

vii
4.4 Elof Hansson’s financial objectives............................................63
4.5 An analysis of Elof Hansson’s financial risk management ......64
4.6 Observations and suggestions for Elof Hansson.......................68
5. CONCLUSION.....................................................................72
6. BIBLIOGRAPHY .................................................................78
7. APPENDIX ..........................................................................82
viii
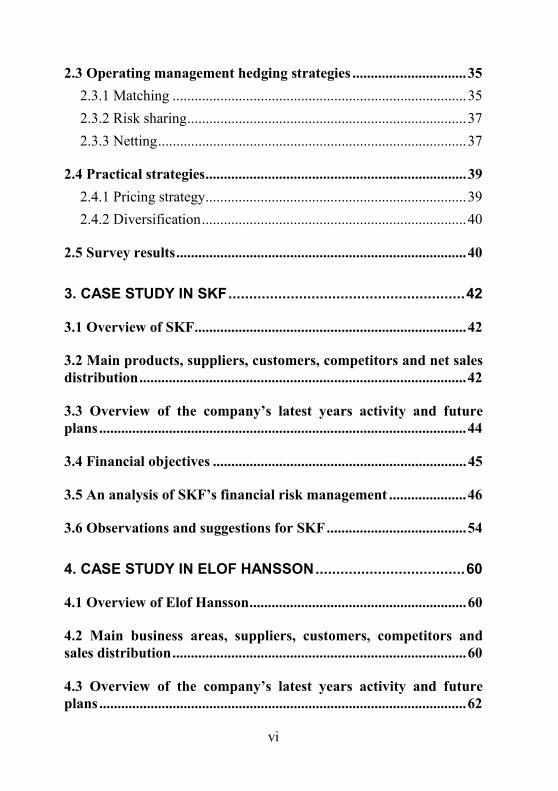
Figure No.1 Firm’s transaction life span 2 Figure No.2 Different exposure concepts 21 Figure No.3 Translation, operating and transaction exposure 24 Figure No.4 Hedging effect 32 Figure No.5 SKF net sales by customer segment 1999 43 Figure No.6 SKF net sales by geographical area 1999 44 Figure No.7 SKF treasury department operating 47 Figure No.8 Elof Hansson business volume by products 1999 61 Figure No.9 Elof Hansson business volumes by market 1999 62 Example No.1 How exchange rate change effects a firm’s accounting
record............................................................................................3 Example No.2 Firm’s cash flow statement .........................................19 Example No.3 Netting transaction exposure .......................................38 Example No.4 How SKF use netting system........................................48 Table No.1 Direct and indirect exposure ............................................23 Table No.2 SKF key data on size and performance............................44 Table No.3 SKF financial derivative instruments figure .....................51 Table No.4 SKF currency flows...........................................................51 Table No.5 Elof Hansson key data on size and performance ..............62 Table No.6 Elof Hansson currency flows ............................................66 Table No.7 Summary of companies’ financial risk management ........74

1
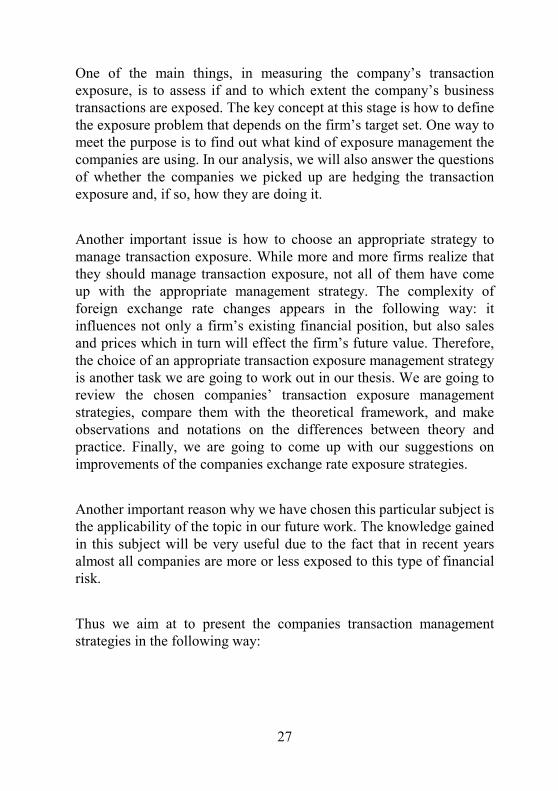
1. Introduction 1.1 Financial risk faced by the companies Today, the economic environment in which most firms operate is highly volatile and uncertain. One of the main factors effecting this process is the increasing market globalisation and internationalisation, which is reflected in increased exchange, interest, inflation rates fluctuations as well as in high competition, demand levels etc. Consequently, the firm will be exposed to the risks, which Duma (1978) identifies as “what one has on risk” or, in other words, as the amount which is exposed. Many firms may act as buyers and sellers simultaneously on the international market. We shall begin by seeing how the above mentioned factors influence the firms’ on going business, before talking about different types of risk exposure concepts. Figure No.1 (Eiteman 1995, p. 186) gives us a clear picture of how different kinds of risk are associated with the firms’ business transactions, based on the “life span” of the firm’s transaction from the seller’s point of view.

2
Figure No.1 Firm’s transaction life span Time 1 Time 2 Time 3 Time 4 Quotation exposure Backlog exposure Billing exposure The firm is already exposed to risk, in terms of quotation risk, before this particular business transaction begins. Quotation risk exposure is created at the moment Time 1, when the seller quotes the price, for the buyer is presented in written or verbal form. In the case of the unfavourable/favourable exchange rate change, sellers’ inflows in the home currency might decrease/increase. The other important point is the competitors price level, which might change as well. Both these factors might cause the tender cancellation risk. The tender price might be changed before the contract is signed resulting in a cancellation of the tender, and anticipated foreign currency inflows. This risk is usually called antenatal risk, which may not be reflected in the firm’s accounting numbers. At this moment, the exposure will only be estimation; neither the size, nor the time of the exposure may be known at this time. If the price, and all the other transaction’s conditions, fit the buyer, they will then set an order to the seller at the price agreed at Time 1. At that moment (Time 2) the backlog exposure appears and this will last until the moment when the seller ships the product to the buyer (Time 3). The risk is not usually shown at this stage in accounting numbers, but the firm already starts to include lots of costs and funds in order to generate that product. Thus, the later
Seller quotes a pricefor buyer
Buyer placesfirms’ orderwith seller atprice offeredat Time 1
Seller shipsproduct andbills buyer
Buyer settles A/Rwith cash inamount ofcurrency quoted attime Time 1

3
period’s risk may influence the firm’s future cash flow. Then, coming up to Time 3, which is usually the point in time when most firms begin appropriate accounting records, this becomes billing exposure, which means that the customer may become insolvent or even become bankruptcy. He will then not be able to fulfil the contract condition causing the seller’s expected income to go into uncertainty. That risk is usually called insolvency risk or credit risk, and will last until the final payment for that particular transaction in the specific foreign currency be made. Another example is to have a detailed look on how one specific factor, such as exchange rate change, influences the firm’s accounting record. Oxelheim and Wihlborg (1997) have designed a model to test the effect of exchange rate change on a firm’s cash flow. The following example (example no. 1), based on the scenario analysis showed in their book, gives us a clear picture of how the exchange rate change might effect the firm’s sales volume, prices and costs, resulting in the cash flow exposure measurement explanation. Example No.1 How exchange rate change effects a firm’s accounting record Data: a Swedish company, which produces 100 units’ products in Sweden, while selling its products both in Sweden and United States, each with 50 units respectively. They have major competitors in the United States and Germany. The firm uses a marking-up pricing strategy. Ignore taxes. Basic case: Sales, 100 units Unit price=2*(COGS imported + COGS domestic + wages)

4
In Sweden: 50 units * 800 SEK SEK 40,000 In United States: 50 units * 100 US$ * 8 SEK/US$ SEK 40,000 Total SEK 80,000
Costs of goods sold In Sweden: 100 units * 150 SEK SEK 15,000 Imports from United States: 100 units * 18.75 US $ * 8 SEK/US$ SEK 15,000 Wages: 100 units * 100 SEK SEK 10,000 Total SEK 40,000
Operating cash flow (Sales-COGS) SEK 40,000 Second case: SEK 5% depreciation, so 1 US$ = 8.4 SEK. Sales volume unchanged. Sales, 100 units Unit price=2*(COGS imported + COGS domestic + wages) In Sweden: 50 units * 800 SEK SEK 40,000 In United States: 50 units * 100 US$ * 8.4 SEK/US$ SEK 42,000

5
Total SEK 82,000
Costs of goods sold In Sweden: 100 units * 150 SEK SEK 15,000 Imports from United States: 100 units * 18.75 US $ * 8.4 SEK/US$ SEK 15,750 Wages: 100 units * 100 SEK SEK 10,000 Total SEK 40,750
Operating cash flow (Sales -COGS) SEK 41,250 In the second case, if no sales volume takes place, then, in comparison with the first case, the cash flow will change SEK 1,250. (41,250-40,000). However, in reality it does not always happen like this. The exchange rate change might increase the Swedish firm’s sales price only in cases where competitors won’t change their price, but, if they do, the Swedish firm’s sales volume will be effected, assuming moderate price sensitivity (price elasticity = 1), cash flow will fall by another SEK 2,062.5 (41,250*5%) and result in reduction of sales. So the total cash flow change will be SEK –812.5. (41,250-40,000-2,062.5). From above analysis, we can say that today’s economic environment sets much higher requirements for the financial managers than it did ten years ago. Today’s financer should have excellent qualifications in order to manage market dictated risks in an appropriate way. More and

6
more firms have to take macroeconomic environment fluctuation challenge, and try to solve such critical problems as:
• How to manage risks associated with exchange rate, interest rate, and inflation rate changes?
• How to build effective links between firm’s financial strategy and its microeconomic environments?
1.2 Exposure management overview 1.2.1 Financial risks A company’s activities face different kinds of risks. In order to be able to introduce financial risks, a general definition of risk conception is needed. Risk, according to Oxelheim and Wihlborg (1997, p.18), is “a measure of unanticipated changes”. In our paper, we brake down every type of risk that a company might face into two groups: financial and non-financial. We will leave non-financial risks, as we are not concern with them, and concentrate on financial ones. Financial risk is the likelihood and magnitude of unanticipated changes in interest, exchange and inflation rate risks. As one might expect, financial risk might be broken down into the interest rate, exchange rate and inflations rate risks. According to Oxelheim and Wihlborg (1997, p.27-28) the above-mentioned risks are defined in the following way:
• Interest rate risk refers to the magnitude and likelihood of unanticipated changes in interest rates that influence both the costs of different capital sources in a particular currency denomination and the demand for the product.
• Exchange rate risk refers to the magnitude and likelihood of unanticipated changes in exchange rate.
• Inflation rate risk refers to the magnitude and likelihood of unanticipated changes in inflation rate.

7
• Inflation and exchange rate risk taken together gives currency risk.
Exchange, interest and inflation changes in the market are very interrelated and usually have a high degree of correlation. The main reason why these three factors recently became of major concern is the effect they were having on the firms’ value. The above mentioned factors are the main causes of the company’s financial risk exposure and value volatility. In other words, they might influence the company’s value in a positive way, when the company is worth more than expected (upside risk), or in the negative way - the amount the company’s value decreasing more than it was expected (downside risk). Not mentioning the downside risk, which lacking the right management strategy might cause financial distress, the smoothening of the upside risk gives the company value in the terms of lower taxation. Most countries have a convex corporate taxation system (Dhanini, 2000, p. 33) - the higher the profit, the higher the tax percentage applicable. Therefore, during the periods when the company earns high profit, it pays higher taxes, although at times when low or even negative profit are generated no compensation is given. The main danger is the financial distress, which is very costly, and according to Copeland study: “the average indirect bankruptcy cost were 17,5% (Copeland, 1999, p. 69) of the company’s value one year prior to bankruptcy”. Exchange, interest and inflation rates changes lead to the exchange, interest and inflation rates risks respectively, which aggregated form financial risk. Each of the financial risk additive parts is handled using a certain financial or commercial instruments. Exchange rate risk could be managed using financial (futures, forwards, options) or commercial (foreign currency cash flows maturities and amounts matching) instruments and pricing strategy. Interest rate risk is usually manageable using interest rate swaps or assets and liabilities management (ALM). The later tool might be used for the inflation rate risk management, but in the long run we believe it can be offset by the exchange and interest rate change. All mentioned financial or commercial instruments are going to be described in more detail in later chapters.

8
The reader may wonder why instead of a decisive beginning using the exchange rate risk, we include such a long introduction describing all kinds of financial risks. The point is that the consisting parts of financial risk are very correlated among themselves, and often offset each other. If we had perfectly efficient markets then, according to the International Fisher Parity (IFP), exchange rates would just reflect the changes in interest rates among different currencies and exchange rate risk would be zero. In the real life, we have a lot of shifts from IFP that induce exchange rate risk. All of the above-described financial risks, “… currency risk and, specifically, exchange rate risk have received the most attention. As noted, most current approaches in managing these risk presume implicitly or explicitly that exchange rate variability is independent of variability of other macroeconomic factors”(Oxelheim and Wilhborg, 1997, p. 28). In general, the majority of our viewed theoretical sources presume, and believe, that every single financial risk is independent, though one should be very careful separating and calculating them. Just imagine the situation when the exchange rate between USD and SEK changed because of the lift in SEK interest rates. The negligence of interdependence between interest rate changes and exchange rate changes would cause the same exposure being measured twice. Therefore, the measurement of the effect of financial risks on company’s cash flows should be made in recognition of the interdependence among them. One more reason why exchange rate risk has received particular attention is that it, more than any other financial risk, follows changes in the market and, less than the others, depends on non-market economy factors such as government or central bank interference. In other words, exchange rate risk is more predictable than others and therefore more manageable. Although we should emphasis that it is predictable and manageable approximately as much as the market by itself.

9
1.2.2 Overview of existing classifications and terminologies of financial risks In order to give a reasonable basis for our choice, as well as to provide the reader with an appropriate grasp of the topic, we will now give an overview of the existing classification and terminology of financial risks. One of the pioneers in financial risks definition process was Ankrom (1974), who first used the expressions translation, transaction and economic risks, defined as follows:
• Translation risk recognize only items already on an accounting balance sheet,
• Transaction risk comes from future sales and purchases certain to take place, but before the company will be able to adjust prices in line with exchange rate movements,
• Economic risk, Ankrom defines as, the sum of 1 and 2 after eliminating double counting in inventory. The author does not cover real exchange rate movements’ threats.
Shapiro (1996), whose concepts we used a lot in our work, gives a series of definitions that form a good starting point. He describes:
• Currency risk, in general, as the degree to which a company is affected by exchange rate changes,
• Accounting exposure is a measure of currency risk arising from the need to convert the financial statements of foreign operations from local currencies to home currency; the restatement of assets, liabilities, revenues and expenses at new exchange rates will result in exchange gains and losses,
• Economic exposure is another measure of currency risk based on the extent to which the value of the company – as measured

10
by the present value of its expected future cash flows – will change when exchange rates change.
Shapiro subdivides economic exposure into:
• Transaction exposure, which is the possibility of incurring gains or losses, upon settlement at a future date, on transactions already entered into and denominated in a foreign currency, and
• Real operating exposure, which arises because currency fluctuations together with price changes can alter the amounts and riskiness of a company’s future revenue and cost streams, i.e. operating cash flows.
Another economist who tried to penetrate the same field was Buckley (1986), who classifies currency risk into:
• Transaction exposure, • Translation (=accounting) exposure, • Economic exposure.
Buckley defines the three concepts in terms similar to Shapiro’s with the difference in terms economic exposure, which Shapiro called operating exposure. Both authors relate economic and transaction exposure with cash flows. Though Buckley does not go as far as did Shapiro in identifying economic exposure in respect to deviations from purchasing power parity. Other writers such as Walker (1978) and Wihlborg (1980) used definitions broadly similar to those used by Shapiro and Buckley. The main difference between Kenyon’s (1981) and previous writers definitions is the way in which he defined financial currency risk.

11
Changes in nominal exchange rate will influence the values of the company’s existing assets, liabilities and other commercial commitments. Financial risks were subdivided into:
• Trading risk = mismatch between currencies of cost and of sale,
• Balance sheet risk= mismatch between assets and liabilities in a given currency.
Kenyon (1990) was citing his previous book as follows: “Kenyon further suggested that any of these financial risks could be viewed and managed either in accounting terms, i.e. as accounting or translation risk, or in cash terms, i.e. as transaction risks, but that these two concepts referred to different ways in which management looks at the same risks, rather than two different risks. One contrast between Shapiro and Kenyon’s (1981) classifications stands out: Shapiro regards the main division as being between the accounting model and the economic or cash flow model, whereas Kenyon (1981) gives primacy to the contrast between risks from the real and nominal exchange rates, a contrast also stressed by Shapiro.” We found that Shapiro’s point of view of currency risks was mainly grounded in the following reasons:
• Appropriate reasoning of his deep belief in to purchasing power parity in respect to economic exposure and;
• Grounded explanations showing why none of the existing accounting systems were able to reflect economic or cash flow streams;
• Best grasp of the connection between the transaction exposure and operating exposure, both of which are the key issues in exchange rate exposure calculation.

12
1.3 Problem discussion Among the above-mentioned financial exposures, it is especially the exchange rate risk exposure that becomes more and more important in light of world markets globalisation and internationalisation. Foreign exchange exposure (FEE) comes from the international trade and financial activities, such as foreign loans, guarantees etc. As an example, one big multinational company buys its raw material in the domestic market and sells it’s final product in both domestic and foreign markets. Assume that the situation in the markets changes, and as a consequence the foreign currency becomes cheaper in relation to the domestic one. What will happen to such a company? If the company can’t increase the price, its products to be sold in the foreign market, will generate less income than earlier, because the domestic currency as well as the final product, will become more expensive in comparison with the foreign currency and prices level. Following the same logic, it is not difficult to realize, that the foreign competitors of our company will get the competitive advantage, being able to offer the lower price for the same product in our domestic market. Therefore, the company will incur double losses: it will lose part of the domestic market and part of the foreign market. Not only big multinational companies, but also small firms having only domestic trade operations, become increasingly dependant on the world market main currencies fluctuations. With common outsourcing trends, even these types of firm find themselves more and more related to their exchange rate risk exposure partners. Different firms have different targets to achieve, such as profit, economic value, shareholder’s wealth, book value. In turn, the personal manager’s risk attitude causes a different choice of targets. For example, if the firm’s target is to maximize the profit, then the manager may be more concerned about the level of profit over a particular time period. On the other hand, if the target is shareholder’s wealth maximization, then the manager might be more concerned about the probability of bankruptcy, in this case he might be more

13
willing to sacrifice some level of profit in order to reduce the variability of company’s value and cash flows. Since shareholders are the owners of joint venture companies, their interests should be of primary concern. This is the attitude that recently received a lot of attention in risk management literature, as well as in the joint venture companies’ annual reports. Since, according to financial theory, the firm’s value is the net present value of its future cash flow, it is emphasized much more in the firms’ economic value, so our exchange rate exposure analysis will be based on economic exposure calculation and management, presuming that the management is risk averse. 1.3.1 Exchange rate exposure Let’s start with a simple example, which hopefully will make the introduction of some main concepts clearer. One Swedish company that buys raw material in Germany pay in DEM, and has 90 days deferred payment. The company’s main activity is in Sweden, and the biggest part of its cash inflows is in SEK. It is not difficult to realize that if the DEM suddenly and unexpectedly increases in price just before the maturity of the payment to the German supplier, the company incurs losses, as it is forced to pay more SEK than was expected for the same amount of DEM. In other words, the company is exposed to DEM price changes. We arrive at the main definition in this chapter, i.e. exchange rate exposure, which according to A.C.Shapiro (1996, p. 277) is “the degree to which a company is affected by exchange rate change”. Following the Shapiro way of exchange rate exposure classification in the coming chapters, we will present it, describing accounting versus economic exposure and then breaking down exchange rate exposure into translation, transaction and operating exposures providing the description of every single one of them.

14
1.3.2 Accounting practice and economic reality Accounting exposure arises from the need, for purpose of reporting and consolidation, to convert the financial statements of foreign operations from local currencies (LC) involved to the home currency (HC) (Shapiro, 1996, p. 237). Big multinational companies usually have foreign subsidiaries and a lot of foreign operations. As a consequence, foreign currency denominated assets and liabilities as well as revenues and expenses take place in their values. However, the investors and the other interested part of society need values expressed in one currency in order to get a clear understanding about the company’s overall financial results. Therefore, in accordance with accounting standards at the end of accounting period (quarter, year) all foreign subsidiaries’ values are translated in to HC. Assets and liabilities might be translated in current (post change) exchange rate and are considered to be exposed, or at historical (pre-exchange) rate, and are regarded as not exposed. In some literature accounting exposure is named as translation exposure, that’s why we would like to stress that that it is the same thing and we are introducing both terms, not to confuse the reader, but to give the full overview of the terminology used in the different sources of the literature. “Translation exposure is simply the difference between exposed assets and exposed liabilities” (Shapiro, 1996, p. 238). The difference between exposed assets and exposed liabilities are increasing or decreasing company’s earnings and are reposted as foreign exchange gains or losses. There are four different translation methods: current/non current, monetary/non-monetary, temporal and current rate methods. Economic exposure is based on the extent to which the value of the firm - as measured by the present value of its expected future cash flows - will change when exchange rates change (Shapiro, 1996, p. 277). Economic exposure measurement is based on the company’s all future cash flows while accounting contains only part of them. Moreover, accounting numbers are not adjusted to reflect the distorting effect of inflation and relative price changes on their associated future cash flows.Economic exposure, in turn, might be able to be separated into operating and transaction exposures.

15
Accounting measures of exposure focus on the effect of currency changes on previous decisions of the firm, as reflected in the book values of assets acquired and liabilities incurred in the past. However, book values (which represent historical cost) and market values (which reflect future cash flows) of assets and liabilities typically differ. Therefore, retrospective accounting techniques, no matter how refined, cannot truly account for the economic (that is, cash flow) effects of a devaluation or revaluation in the value of a firm because these effects are primarily prospective in nature. (Shapiro, 1996, p. 247). Basing on this, more and more companies are starting to rely on economic exposure measurement. Although it is hard work to persuade the person, who may have been basing his decisions on accounting numbers for the past 30 years, that there is a better way of doing the same things, but that is the objective, and hopefully with our thesis we will also contribute to it. 1.3.3 Translation exposure The best definition of Translation exposure we found in Eiteman’s book (1997, p. 187). The later follows Shapiro’s point of view and states that translation exposure also called accounting exposure, is the potential for accounting derived changes in owner’s equity to occur because of the need to “translate” foreign currency financial statements of foreign affiliated into a single reporting currency to prepare worldwide consolidated financial statements. Translation exposure can be seen as a measure of a latent risk. In the short term, translation gains or losses on exposure have no cash flows effects, i.e. they are not realized over the reporting period. Cash flow gains and losses occur, however, if the company is liquidated, or in the future when assets and liabilities produce cash flows. Thus, ideally, translation exposure should capture the sensitivity of economic value, in a form of either liquidation value or present value of future cash flows, to exchange rate changes (Wihlborg 1989, p. 39).

16
Among the translation methods mentioned in the chapter 2.3.1 the most popular internationally are monetary/non-monetary, current and current/non-current methods. Under the monetary/non-monetary method, monetary balance sheet items (cash, bank-holdings, most claims and debts) are translated at the closing date, non-monetary balance sheet items (inventories, machine, real estate) at historical (the rate applying when the asset was acquired). According to this method only monetary items are supposed to be exchange rate exposed. Under the current method all assets and liabilities on the balance sheet are translated at the closing of the accounts rate. Under current method all asset position are supposed to be exchange rate exposed. According to the third current/non-current method – current assets and short-term debt of the balance sheet of foreign subsidiaries are translated at the closing rate, while fixed assets and ling term debt at historical rate. One should take into account that different translation methods result in different translation exposure. For example, the monetary/non-monetary method always yields a more positive result that the current method in any year during which a foreign currency has been devaluated. Looking from the economic point of view, translation exposure is less important in comparison with the other two mentioned, because translation losses are only book losses while operating and transaction are expected and real cash losses respectively. 1.3.4 Operating exposure Operating exposure, in some sources of literature “also called as economic exposure, competitive exposure, or strategic exposure,” measures the change in the present value of the firm resulting from any change in the future operating cash flows of the firm caused by an unexpected change in the exchange rates. So, sometimes it might be

17
called “cash flow exposure”. The changed value depends on the effect of the exchange rate change of future sales volume, prices, or costs (Eiteman, 1997, p. 186). Although in order to have a clear distinction between operating and economic exposures in our paper, we define operating and transaction exposures we define as consisting parts of economic exposure. Operating exposure of the firm requires forecasting and analysing all of the firm’s future individual transaction exposures together with the future exposures of all of the firm’s competitors and potential competitors worldwide. 1.3.4.1 Cash flow Usually, from accounting point of view, “cash flow” or “net cash flow” means the difference between contracted cash inflows and cash outflows, although accounting cash flow definitions varies as follows:
• The total receipts minus payments. • Net profit before depreciation within some specific periods. • A measure of the company’s ability to fund its capital
expenditure and debt repayment out of its own resources (Boyadjian and Warren, 1987, p.92) which equal the net profit adding back the depreciation then plus or minus changes in inventories, receivables and payables.
From the economic point of the view cash flow was defined in a following way:
• The total net dividends, which can be paid to the stockholders over future years.
• Any available cash for stockholders i.e. earnings before depreciation minus capital expenditure minus increases in working capital.

18
• The future earnings of the firm including the overseas subsidiaries. It is much more similar to the accounting concept 2, when we speak about the cash flow later, it always will be referred to this concept.
1.3.4.2 Cash flow exposure Cash flow exposure, might be defined as the extent to which the present value of a firm’s future cash flow is changed by a given currency appreciation or depreciation. In general, it arises because of currency fluctuations, in combination with price changes, which alter the amounts and riskiness of a company’s future revenue and cost streams. As we can see, the cash flow exposure has a multidimensional effect, involving the interaction among the firm’s strategy in financing, marketing and production. The firm’s cash flow in the future will depend on its competitive ability. “The later exposure computation requires a long term prospective, viewing the firm as an ongoing concern with operations whose cost and price competitiveness could be affected by exchange rate change” (Shapiro, 1982, p. 111). Let us take a look what firm’s cash flow statement looks like from the economic point of view. Usually, a multinational firm’s cash flow statement is divided into two parts, i.e. operating cash flow and financial cash flow. Example No.2 shows what the firm’s cash flow statement looks like. Operating cash flow results from accounts receivable, accounts payable, rent, lease payment for the use of facilities and equipment, royalties and license fees for the use of technology and intellectual property, as well as assorted management fees for services provided, which could appear between unrelated company and subsidiary of the firm. Financial cash flows are payments for the use of loans (principal and interest), stockholder equity (new equity investment and dividends) and firm’s financial instruments such as forward contract, option swap etc. Each of these cash flows can occur at different time intervals, in different

19
amounts, in different currencies of denomination, and may have a different predictability of occurrence. Example No.2 Firm’s cash flow statement Commercial cash flows: + Sales revenues (domestic and foreign subsidiaries) - Costs of goods (domestic and foreign subsidiaries) - Wages and salaries (domestic and foreign subsidiaries) - Rent, lease payment etc. administration expenses (domestic and foreign Subsidiaries) - Depreciation (domestic and foreign subsidiaries) +/- Change in accounts receivable +/- Change accounts payable Financial cash flows: +/- Change in loan amount (principal and interest) +/- Change in stockholder equity value (new investment and dividends) +/- Income from financial instruments such as: forward, swap, option. Usually, there are two ways to examine the firm’s cash flow exposure, scenario analysis and regression analysis. The scenario analysis is more related to the fundamental factors such as sales volumes, prices, and costs effect on the firm’s cash flow. The case we mentioned in the chapter 1.1 is a good example to analyse the firm’s cash flow exposure. Another method is to use historical data to forecast future effects, which is termed regression analysis. Two different variables need to be taken into account. One is an independent variable, which can be the exchange rate, interest rate values during a certain period or any other that is likely to affect the company’s cash flows. Another one is dependent variable, which could be anything that the company is

20
concerned about, such as revenues, book value, market value and so on. Oxelheim and Wihlborg (1997) have presented a good example to show how the effect of exchange rate change on a firm’s cash flow. 1.3.5 Transaction exposure In his excellent book, “Currency risk management”, Alfred Kenyon uses the metaphors “conception, birth, anniversaries, death” to describe the life cycle of transaction exposure. “Conception” concerns the major price quotation problem area - “when we commit ourselves to the mismatch”(Kenyon, 1981, p. 65). “Birth” is the moment when the contract is signed and the exposure becomes certain; “when the commitment becomes a commercial or contractual reality, it has ceased to be unilateral”. “Anniversaries” refer to the covering of the risk; “any annual reporting dates at which interim gains or losses may be ascertained” (Kenyon, 1981, p. 65). “Death” refers to when settlement is made - “the end of the exposure when we are free to convert the receipt or payment into the other currency and thus measure the final cash gain or loss” (Kenyon, 1981, p. 65). So, using Donaldson (1980)’s words, transaction exposure can be explained as “revenues in nature and exist for relative short periods”. He says that a sale from seller to buyer in another currency must be in the currency of, at best, one of them, and the another one has an exposure, but only when there is a period of delay in payment for the goods, and most transaction exposure arise from the granting of credit. Therefore, summing up, transaction exposure arises from:
• Purchasing or selling goods or services whose prices are stated in foreign currencies in credit,
• Borrowing or lending funds when repayment is to be made in foreign currency,
• Being a party to an unperformed foreign exchange forward contract, and
• Otherwise acquiring or incurring liabilities denominated in foreign currencies. (Eiteman, 1997, p. 186)

21
Now we will go back to the example that we present in chapter one to explain how those exposures fit into the firm’s transaction “life span”. Below (figure No. 2), we present a basic framework of one business transaction, which starting at Time 1 ends at Time 4, repeating the cycle again. Figure No.2 Different exposure concepts Short term financing months Time 1 Time 2 Time 3 Time 4 Quotation exposure Backlog exposure Billing exposure
Seller quotes a pricefor buyer
Buyer placesfirm’s orderwith seller atprice offeredat Time 1
Seller shipsproduct andbills buyer
Buyer settles A/Rwith cash inamount ofcurrency quoted attime Time 1
Operating exposure
Translation exposure
Interest rate exposure
Transaction exposure

22
Before the buyer signs the contract with the seller (Time 1), the seller is already exposed to the risk, even though, in this period, the exposure is not reflected in the accounting numbers and, at this moment, the exposure will only be an estimation. Neither size nor time of the exposure may be known at this time. From this point of view, some companies will identify the estimated sales volumes as a transaction exposure, others may treat it as economic exposure (Bergendahl, 1997, p. 10). Usually, firms can estimate their sales volume on the base of the historical performance. Basic on the transactions from long-term contracts with permanent customers, companies forecast the future sales volumes, keeping in mind possible deviations. The transaction will start in Time 1 and will not end until the transaction cycle is finished (Time 4). The economic exposure for one transaction is equal to the transaction exposure, though from the whole company’s value point of view economic exposure can be broken down into transaction and translation exposures. In Time 2, the risk is not shown in accounting numbers as well, but it is at this point that the firms began to put into lots of costs and funds to generate that product, so this period risk may influence the firm’s future cash flow. Therefore, from this period, operating exposure will occur until the transaction end up in Time 4. Consequently, these will follow the translation exposure. Still, during Time 2 to Time 4, in order to fulfil the contract, the firm may need short term financing; they may get a loan from a bank at Time 2 with a certain interest rate, and then repay the loan at Time 4 with another interest rate. So, during this period they may have interest rate exposure. Consequently, they may have credit exposure as we mentioned before.
Economic exposure (Translation + Transaction )
Credit exposure

23
Again we will go back to the example of how the exchange rate change effected the firm’s accounting record and look at how different exposure fits into that process. Firstly, the basic idea behind that example is operating cash flow=Sales-COGS (cost of goods sold), since both the sales amount and COGS will be changed because of the changed exchange rate, even though in the first case we assume there have no simultaneous change of the sales amount. So in this case, the firm may have operating exposure. Secondly, if we cancell the first assumption and leave valid only the second one, that is with moderate price sensitivity (price elasticity = 1), we get the estimate that the cash flow will fall by another SEK 2,037.5. In this case, since we can only estimate future sales volume and sales amount, it appears that the firm are faced with the economic exposure and transaction exposure. From the above analysis, we can see that both the transaction exposure and economic exposure focus on the aggregate effect of both the direct effect and indirect effect. Direct exposure, captured by transaction and translation exposure, potentially exists whenever a firm sells or buys it’s productions or sources in a foreign currency. Indirect exposure exists when a firm has a supplier, customer or competitor that is exposed. (Pringle J.1995). The following table (table 1) shows the effect of the home country currency appreciation or depreciation. From the table we can see the exchange rate change impact on the company. Table No.1 Direct and indirect exposure Direct exposure Home currency
strengthens Home currency weakens
Sales abroad Unfavourable Favourable Source abroad Favourable Unfavourable Earn profits abroad Unfavourable Favourable

24
Indirect exposure Home currency
strengthens Home currency weakens
Competitors sources abroad
Unfavourable Favourable
Suppliers source abroad
Favourable Unfavourable
Customers sells abroad
Unfavourable Favourable
Customers sources abroad
Favourable Unfavourable
The following figure (figure no. 3) will give us a clear picture of the relationship between transaction, translation and operating exposures (Eiteman, 1997, p. 187). Figure No.3 Translation, operating and transaction exposure Moment in time when exchange rate change Translation exposure Accounting-based changes in Consolidated financial statements caused by a change in exchange rates
Operating exposure Change in expected cash flows arising because of an unexpected change in exchange rates
Transaction exposure Impact of having outstanding obligations, that were set before change in exchange rates, but to be settled after change in exchange rate change Time

25
Another important concept of FEE is the time horizon. FEE might be broken down into short and long-term exposures. Short-term exposure is related to the cash flow management, while long term to capital investment management. In our paper, we focus on the short-term exposure management, since we believe that during long run purchasing power parity offsets exchange rate exposure. So, summing up the above problem discussion, we would like to stress the following issues:
• Assuming that the transaction exposure management is the most important one among the above-mentioned concepts, how do the firms actually manage transaction exposure?
• Since transaction exposure goes through the whole life span of firm’s business transaction, is there a general strategy that every firm can use in transaction exposure management?
• When the firms are managing FEE, how do they choose the time horizon? Does there exist any general rule to find an optimal time horizon?
1.4 Purpose Based on the above problem analysis, we found out that both transaction and operating exposures measure the exchange rate change effect on the firms’ cash flows. The main differences between operating and transaction exposures are the following:
• Operating exposure is more focused on accounting cash flows, while transaction exposure focused on expected cash flows;
• Operating exposure is usually related to the near future, while transaction is with more farseeing strategies.
26
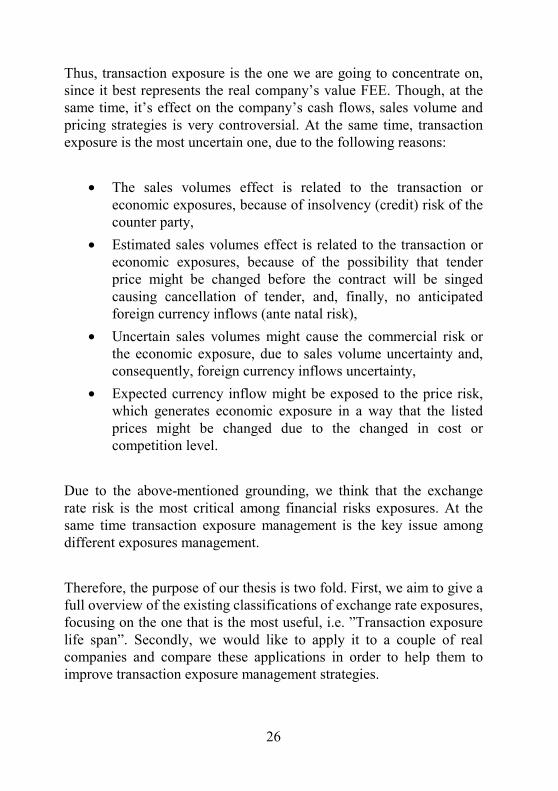
Thus, transaction exposure is the one we are going to concentrate on, since it best represents the real company’s value FEE. Though, at the same time, it’s effect on the company’s cash flows, sales volume and pricing strategies is very controversial. At the same time, transaction exposure is the most uncertain one, due to the following reasons:
• The sales volumes effect is related to the transaction or economic exposures, because of insolvency (credit) risk of the counter party,
• Estimated sales volumes effect is related to the transaction or economic exposures, because of the possibility that tender price might be changed before the contract will be singed causing cancellation of tender, and, finally, no anticipated foreign currency inflows (ante natal risk),
• Uncertain sales volumes might cause the commercial risk or the economic exposure, due to sales volume uncertainty and, consequently, foreign currency inflows uncertainty,
• Expected currency inflow might be exposed to the price risk, which generates economic exposure in a way that the listed prices might be changed due to the changed in cost or competition level.
Due to the above-mentioned grounding, we think that the exchange rate risk is the most critical among financial risks exposures. At the same time transaction exposure management is the key issue among different exposures management. Therefore, the purpose of our thesis is two fold. First, we aim to give a full overview of the existing classifications of exchange rate exposures, focusing on the one that is the most useful, i.e. ”Transaction exposure life span”. Secondly, we would like to apply it to a couple of real companies and compare these applications in order to help them to improve transaction exposure management strategies.
27
One of the main things, in measuring the company’s transaction exposure, is to assess if and to which extent the company’s business transactions are exposed. The key concept at this stage is how to define the exposure problem that depends on the firm’s target set. One way to meet the purpose is to find out what kind of exposure management the companies are using. In our analysis, we will also answer the questions of whether the companies we picked up are hedging the transaction exposure and, if so, how they are doing it. Another important issue is how to choose an appropriate strategy to manage transaction exposure. While more and more firms realize that they should manage transaction exposure, not all of them have come up with the appropriate management strategy. The complexity of foreign exchange rate changes appears in the following way: it influences not only a firm’s existing financial position, but also sales and prices which in turn will effect the firm’s future value. Therefore, the choice of an appropriate transaction exposure management strategy is another task we are going to work out in our thesis. We are going to review the chosen companies’ transaction exposure management strategies, compare them with the theoretical framework, and make observations and notations on the differences between theory and practice. Finally, we are going to come up with our suggestions on improvements of the companies exchange rate exposure strategies. Another important reason why we have chosen this particular subject is the applicability of the topic in our future work. The knowledge gained in this subject will be very useful due to the fact that in recent years almost all companies are more or less exposed to this type of financial risk. Thus we aim at to present the companies transaction management strategies in the following way:

28
• To present the real companies’ transaction exposure management systems and compare them with the theoretical framework.
• To make observations on the differences between the theory and practice along with possible reasons, and to come up with the suggestions on the transaction management strategies improvements.
1.5 Methodology The literature study and case study are our two main methods. The first one is used in order to fulfil the first part of our purpose, i.e. to give a short, but full overview of the existing theoretical definitions on exchange rate exposure, emphasizing the one we found most reasonable. In order to reach the second part of our purpose, a real companies case study method is used. We chose two Swedish companies (SKF & Elof Hansson), which are from different industries as our case study. Since the purpose of the case study is to connect theory with practice, the second method is the best in applying theoretical knowledge to real companies transaction exposure management strategies. Usually companies are managing the risk by themselves and they do not connect with each other. Therefore another purpose of our case study is to compare companies strategies each other. We hope that from the comparison, the companies can learn from each other, and therefore, improve their financial risk management strategies. 1.5.1 Literature study In order to get a clearer picture of the exchange rate risk management, we start with the extensive literature study and overview the main theoretical classification. We feel this is the appropriate starting point as we can get a better understanding of the problem from the literature study, as well as give the readers a better grasp of what exchange rate risk management is, why it matters, how to define the exposure, etc.

29
We began our literature study from a survey of books and from articles related to the topic, though it appeared to be somewhat difficult since this topic is debatable. We needed to collect as much literature as possible in order to get a clear understanding and find out what the most important factors are that influence the result of our later case study. From the literature study, we not only get a deeper understand of the theory, but also some good examples on how to handle different kind of information. Since a lot of different factors influence the company’s performance, the right information collection and analysis becomes the second important reason for literature study. We found a lot of different opinions on how the exchange rate influence on the firm’s performance should be evaluated. From these opinions we picked some we found the most grounded and we are going to present these in more detail later. 1.5.2 Case study As a descriptive example, we chose two Swedish firms, - SKF and Elof Hansson. Both firms have sufficiently big open foreign currency positions, although they belong to different industries. According to our prepared questionnaire, which is based on the previous study, we will ask both firms questions related to our topic along with the request to provide us with some additional financial data. We are going to interview the representatives of those companies and analyse the data in order to find out the way they calculate FEE. We will compare their financial risk management strategies, operating characteristics, etc. basisng on our theoretical and literature studies, we will put the firm’s real business transaction into the theoretical transaction life span and try to find out if, in reality, the companies use the transaction exposure management as the theory suggests. Finally, we are going to make observations on the differences between theoretical framework and real life practice along with our suggestions on the exposure management strategy improvements.

30
1.6 Limitation There are a lot of factors effecting the firm’s financial risk management, such as interest rate changes and fiscal policy changes. For different firms different measurements might be used, such as the stock price movement or cash flow change. To overview all the possible factors influencing company’s financial risk management we found too broad to be analysed in such type of academic paper as a thesis. Therefore we will focus only on the transaction exposure or economic exposure management. We base risk management strategy evaluation on the short-term exchange rate risk management relative to the international cash management evaluation. Another limitation is that since the exchange rate changes effect firm’s business, not only in financial aspects such as pricing, sales volume and cost, but also in a broader competition, organization sense, it is not possible to discuss all possible effects in the thesis. Therefore, we are going to concentrate on the financial aspects of exchange rate change effect.
31
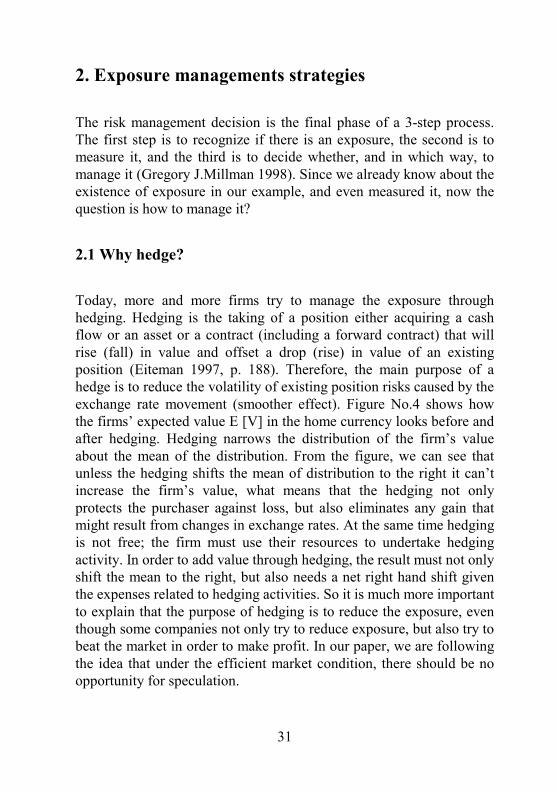
2. Exposure managements strategies The risk management decision is the final phase of a 3-step process. The first step is to recognize if there is an exposure, the second is to measure it, and the third is to decide whether, and in which way, to manage it (Gregory J.Millman 1998). Since we already know about the existence of exposure in our example, and even measured it, now the question is how to manage it? 2.1 Why hedge? Today, more and more firms try to manage the exposure through hedging. Hedging is the taking of a position either acquiring a cash flow or an asset or a contract (including a forward contract) that will rise (fall) in value and offset a drop (rise) in value of an existing position (Eiteman 1997, p. 188). Therefore, the main purpose of a hedge is to reduce the volatility of existing position risks caused by the exchange rate movement (smoother effect). Figure No.4 shows how the firms’ expected value E [V] in the home currency looks before and after hedging. Hedging narrows the distribution of the firm’s value about the mean of the distribution. From the figure, we can see that unless the hedging shifts the mean of distribution to the right it can’t increase the firm’s value, what means that the hedging not only protects the purchaser against loss, but also eliminates any gain that might result from changes in exchange rates. At the same time hedging is not free; the firm must use their resources to undertake hedging activity. In order to add value through hedging, the result must not only shift the mean to the right, but also needs a net right hand shift given the expenses related to hedging activities. So it is much more important to explain that the purpose of hedging is to reduce the exposure, even though some companies not only try to reduce exposure, but also try to beat the market in order to make profit. In our paper, we are following the idea that under the efficient market condition, there should be no opportunity for speculation.

32
Figure No.4 Hedging effect
hedged
unhedged
Thereby, to hedge or not to hedge is a continuously debatable topic in multinational financial management. The proponents of the hedging reason it in the following way:
• As we mentioned before, firms with a smoother value position can reduce the probability of business disruption costs. According to Altman study, the average indirect bankruptcy cost are 17,5% (Altman, 1984) of the company’s value one year prior the bankruptcy.
• Hedging will stabilise the cost accounting and price setting. Firms with smoother value position can gain business opportunities and improve the planning capability so as to gain competitive advantage over other companies in their industry. For example, if the firm can more accurately predict future cash flows, it may be able to undertake specific investment or maintain the R&D budgeting. Thus they can introduce the new products and take an advantage of it.
• Firms with smoother value position can reduce the amount of taxes they pay since most countries have convex corporate taxation system (Dhanani, A. Mar 2000), - the higher the profit the higher the tax percentage applicabl. Therefore, for the
E [V]

33
periods the company earns a high amount of profit, it will pay higher taxes, although the periods it generate low or even negative profit, no compensation will be given.
• Firms with smooth value position can increase their debt capacity. Lenders are more willing to lend to the companies that have stable cash flows and enough guarantee funds. When the firm‘s financial position is stable and cash flow predictable, it has better borrowing and investment options.
• Compared to individual stockholders, the firm’s manager has an advantage in accessing different kinds of information. The depth and the width of knowledge concerning the company’s real risks and returns gives the manager the ability more precisely than anybody else decide to hedge or not to hedge.
• Compared to individual stockholders, the firm’s manager has an advantage in tracing market disequilibria, which could be caused by structural and institutional imperfections, as well as unexpected external shocks (oil crisis, war). Thus, the manager is in a better position than stockholders recognizing market disequilibria and, therefore, has an advantage in decision-making ability concerning the firm’s value protection through selective hedging.
Hedging opponents provide the following reasons for not hedging:
• The stockholders can diversify currency risk in their portfolio in accordance with their personal risk attitude. Therefore, the manager’s activity spending company’s resources for hedging is useless.
• As mentioned before, hedging is not a tool with which you could increase the firm’s value. In other words, hedging not only protects against loss, but also eliminates the possibility to earn from it. Additionally, we should not forget that hedging is not free, the firm must use their resources to undertake hedging activity.

34
• Usually, the manager is more risk averse than stockholders because he concerned about his career and reputation. Therefore, the manager can conduct hedging activity at the stockholders expense, while it is beneficial only for him, but not for stockholders. So, if the firm‘s target is only stockholder wealth maximization (which may not be the case), then part of hedging activity might be not in the stockholders interests.
• Managers cannot forecast the market perfectly. Therefore, when a market is in equilibrium with respect to parity conditions, the expected net present value of the hedging is zero. Thereby, manager’s mistakes in forecasting could result in unnecessary hedging.
• One reason that leads the firm’s manager to hedging is the “account veil”, because, in the income statement, foreign exchange loss is a separate line, which is highly visible, while the hedging costs are hidden in operating or interest expenses. That’s why manager prefer some additional hedging costs instead of having foreign exchange losses.
2.2 Financial instruments used in hedging 2.2.1. Forward rate contracts Forward contract is the most common instrument used in hedging, mostly related to the transaction exposure. For example, if a Swedish firm is expecting to receive US$10,000 in six months and during this time US$ is depreciating, then the expected receivable is decreasing in value and vice versa. Therefore, in order to reduce this kind of exposure, the firm can go into the forward market and take a short position to sell US dollar 10,000 forward in six months, then there will show up minus US$10,000 which will balance the firm’s US dollar cash inflow and cash outflow.

35
2.2.2 Interest rate contracts Money market instruments are quite similar to the forward contract; they also involve a contract and a source of funds to fulfil that contract. The firm can borrow money in one currency and then exchange them to another one. After that, it can use the money generated from it’s business operations to repay the loan. The difference between forward and money market contracts is that the money market contract cost is predetermined by the different interest rate, while the forward contract cost is predetermined by the forward rate quotation. In efficient markets, interest rate parity should ensure that these costs remain nearly the same, but not all markets are efficient at all times (Eiteman, 1997, p. 151). 2.2.3 Options contracts A foreign currency option is a contract, which gives the purchaser (buyer) an option (right), but not an obligation, to buy or to sell a certain amount of foreign currency or other securities at a fixed price per unit on a specific date or during a certain time period (Eiteman, 1997, p. 150). During past years, more and more firms started to use options as a tool to hedge. We also noticed this trend from the later surveys’ results. A number of banks in the United States and other capital markets offer flexible foreign currency options on transactions of 1 million USD or more (Eiteman, 1997, p. 151). 2.3 Operating management hedging strategies 2.3.1 Matching Matching, also called “natural hedging”, is a way to decrease currency exposure by covering cash outflows by inflow in the same currency. The firm can use natural hedging in several ways.

36
In the example given in 2.2.1, where Swedish firm has expected USD cash inflow, if it would acquire the same amount in debts (including interest) in the United States market for the same period. In order to have US dollar outflows on inflow day, it would have had an opportunity to pay it’s debt, including the principal and interest, without any hedging need need. It is similar to the money market hedge mentioned before. Another way is based on the operating strategy changes. The company can set a foreign subsidiaries basing on the market concentration. Let’s say that the Swedish firm from the previous example, which has a lot of cash inflows in USD, can open a manufacturing subsidiary in USA, which would incur cash outflows in USD (subsidiary’s cost). The Swedish company’s exposure to USD dollars would thereby be effectively covered. In the later case study, we found out that one of the companies (SKF) is trying to follows the later pattern. This activity is relatively effective in eliminating currency exposure when the firms’ cash flow can be constantly predicted over time. Thus, the main advantage of natural hedging is that transaction exposure can be effectively covered without any transaction cost. Another advantage is that the matching strategy offers a particular advantage to companies, which are subject to exchange rate control regulation that constrains their activities in the foreign exchange market. For example, it provides an acceptable solution to the problem where it is apparent that an exposure exists but there is no “coverable exposure” as such defined for purposes of exchange control (Donaldson, 1981, p66). Even though the concept of matching is simple, there are a number of complexities associated with using the technique. For example, the time periods used by companies in the management of their exposures will vary with the nature of their business. If a chosen period is too short, then the number of time periods will quickly escalate, adding work to the data collectors and increasing the number of specific decisions. It is likely, therefore, that the exposures being matched out will be those arising over a period as long as a month, or even more (Donaldson, 1981, p. 66).
37
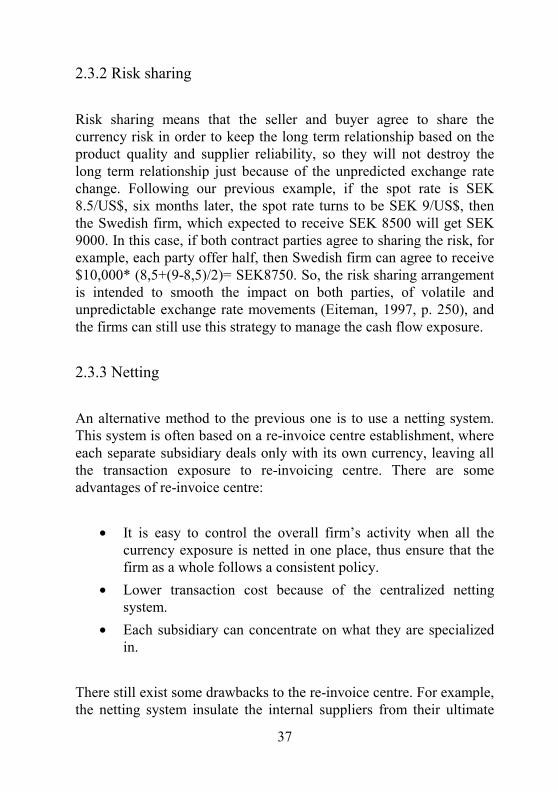
2.3.2 Risk sharing Risk sharing means that the seller and buyer agree to share the currency risk in order to keep the long term relationship based on the product quality and supplier reliability, so they will not destroy the long term relationship just because of the unpredicted exchange rate change. Following our previous example, if the spot rate is SEK 8.5/US$, six months later, the spot rate turns to be SEK 9/US$, then the Swedish firm, which expected to receive SEK 8500 will get SEK 9000. In this case, if both contract parties agree to sharing the risk, for example, each party offer half, then Swedish firm can agree to receive $10,000* (8,5+(9-8,5)/2)= SEK8750. So, the risk sharing arrangement is intended to smooth the impact on both parties, of volatile and unpredictable exchange rate movements (Eiteman, 1997, p. 250), and the firms can still use this strategy to manage the cash flow exposure. 2.3.3 Netting An alternative method to the previous one is to use a netting system. This system is often based on a re-invoice centre establishment, where each separate subsidiary deals only with its own currency, leaving all the transaction exposure to re-invoicing centre. There are some advantages of re-invoice centre:
• It is easy to control the overall firm’s activity when all the currency exposure is netted in one place, thus ensure that the firm as a whole follows a consistent policy.
• Lower transaction cost because of the centralized netting system.
• Each subsidiary can concentrate on what they are specialized in.
There still exist some drawbacks to the re-invoice centre. For example, the netting system insulate the internal suppliers from their ultimate

38
external customer market, which will mislead the firm to set sub-optimal pricing and other commercial decisions. A firm’s re-invoice centre can measure the transaction exposure on daily, monthly or even quarterly basis depending on the firm’s exposure management policy. As we mentioned before, most firms act simultaneously as buyers and sellers on the international markets for commodities (so they have to manage both the accounts payable and accounts receivable in a single foreign currency) (Bergendahl, 1997, p. 7). In the later case study, we found out that both of SKF and Elof Hansson use this strategy to hedge the transaction exposure. The following example (example no. 3) will explain how the re-invoice centres measure transaction exposure based on the weekly data with respect to different foreign currency. In the following case, we see that the transaction exposure is basicly gap between the firms’ accounts receivable and accounts payable. However, different companies can use different information based on the firm’s special condition, such as the call, order or import and export data to measure exposure. Example No.3 Netting transaction exposure Week 1 Week 2 Week 3 Accounts receivable FC 200 FC 250 FC 180 Accounts payable FC 130 FC 200 FC 250
Net exposure before hedge FC +70 FC +50 FC –70 Using financial instrument to hedge FC –70 FC –50 FC +70
Net exposure FC 0 FC 0 FC 0

39
This kind of transaction exposure management can very quickly provide the firm with an overview of the short period exchange rate risk. So, if one currency appreciated (depreciated) at a certain percentage than the net exposure before hedge will appreciated (depreciated) at the same percentage. Thus, the firm can, based on this information, to find the way out in the financial market. On the other hand, the above mentioned example is the most simple version of netting strategy, based on assumption that the accounts receivable and accounts payable are all due on the same period. However that’s not always the case. If the firm have a large number of transactions due in the different period, when the measure and the hedging of netting exposure depends on each transaction time horizon, on a separate or aggregate contract’s specificity ect, then the calculation of the best netting period as well as hedging amount becomes quite complicated. In the later case study, we will discuss this issue in more detail. 2.4 Practical strategies 2.4.1 Pricing strategy The case that we presented in chapter one explained how the exchange rate change affect the firm’s cash flow. Pricing strategy and demand sensitivity to competitors’ price are two important factors, which affect the firm’s exchange exposure. Therefore, it would be logical to presume that if we set a flexible pricing strategy, then the firm can handle the exchange rate exposure easily. However that’s not always the case. As a matter of fact, some industries such as chemical, petroleum and mining businesses have few pricing decisions to make relative to the currency risk, since those industries are very large depend on economies of scale which means they are pricing taker instead of pricing setter. For example, in the SKF case, the compy whose activity we are going to analyse later, the price is dictated by the buyer not the seller. Additionally, there still exists some costs associated with pricing changing policy; such as: long term customer relationship, the customer’s loyalty to the firm, and so on.

40
2.4.2 Diversification From above mentioned Pringle’s amanysis, we may get an impression that the firms can manage the currency exposure through diversification of both operating and financial policies. From the first sight, we may say that diversification of both strategies gives a lot of choices. The firm can diversify its operations through, such branches of it’s activity as, sales, location of production facilities, raw material sources, while financial policy diversification can be done using funds in more than one capital market and in more than one currency. However, it’s not always an easy way. Some industry may require large economies of scale that it are not feasible to diversify its production location, maybe some firm are too small to be known by the international investors or lenders. Thereby, especially operating strategy’s diversification can be used mostly depend on the firm’s characteristic. In the later case study, we will look if this kind of strategy is feasible. 2.5 Survey results There are a lot of articles, that introduce different kind of survey results regarding the firms’ currency exposure management strategy. Gordon M. Bodnar made a series of surveys on financial risk management practice and financial derivatives use by non-financial corporations in the Unite States. The third one (1998) extends the previous two surveys by asking new questions about certain aspects of derivatives used in currency risk management practice. The report compares responses taken from the various surveys and points out the changes in responses over time. The results demonstrated that the percentage of firms that used derivatives has remained constant over time; however, the intensity of usage appeared to be increasing among those firms. This indicates that these firms are generally finding derivatives useful for their business.
41
Jonathan Batten survey (1993) concentrates on foreign exchange risk management practice and product usage of seventy-two large firms, operating in Australia. The results demonstrate that the firms tend to use options and swaps, in addition to the more physical products, such as spot and forward transactions. The results also show that the size of the firm, as measured by foreign turnover, has the most important effect. However, no significant statistical relationship between the degree of centralization and the size of the firm’s foreign exchange exposure was found. In a similar study, made in 1996 by Jalihand, 159 large Canadian companies were investigated. The study showed that 116 firms or 75% used derivative products. The companies empathized that the most important objective for using derivatives was to manage the volatility of cash flows. Another important factor of this study was the treasury department’s organization. Most companies organized their treasury departments as cost centres or service centres, except five companies, which made them profit centres.
42
3. Case study in SKF 3.1 Overview of SKF SKF is a company with a long history behind. It was founded in 1907. It started as a manufacturing company and soon became the leading manufacturer in the bearing industry and has maintained this position ever since. Reasently, service business is also becoming an increasingly important part of the SKF Group’s operations. SKF’s central office is in Gothenburg. The company has a network made up of its own sales companies in some 50 countries, plus more than 7000 independent distributors and dealers worldwide. SKF manufactures its products at some 80 production sites in 22 countries. The SKF business is organized in six Divisions and one area covering operations related to the aviation industry. SKF is a one of the biggest joint ventures in Sweden. Nearly 44,3 % shares representing 22,6% of voting rights were owned by foreigners (30/12/1999). The biggest Swedish shareholder is “Investor AB” having 14,2% of the shares representing 28,8 voting rights. 3.2 Main products, suppliers, customers, competitors and net sales distribution The main products of the company are bearings, seals, and special steel and steel components. SKF has 15-17% of the world market and 30% of Europe’s market for ball bearings. Principal competitors have the greater part of their production capacity in the following regions: four competitors in Japan (about 25-30% of the worlds market), two competitors in USA and two competitors in Europe. SKF’s main raw material is steel, and 50% of the steel the company uses, is making by SKF itself. SKF’s manufacturing is widely spread geographically, but with a concentration to continental Europe, USA and Sweden. Though

43
especially during the latest 10-15 the situation changed from the manufacturing being concentrated in continental Europe to almost evenly spread among European, USA and emerging Asian markets. The company is quite successfully trying to reach that the subsidiaries would have less difference between export and import or, in other words, that most of cash outflows would be covered by cash inflows in foreign currency. This, as it will be explained later is a very favourable condition for the natural hedging strategy. During the latest 10-15 years the difference between import and export in the main USA, European and Asian markets from being 25-30 % decreased to 20%. The following figures (figure 5&6) describe the net sales distribution by geographical areas and customer segments. Figure No.5 SKF net sales by customer segment 1999
Net sales by customer segment 1999
26%
7%
8%5%19%
6%
5%
9%
15%
Industrial distributionCustomizes engineeringSpecialized industryElectrical industryCarsTrucksAerospaceVehicle replacementGeneral machinery

44
Figure No.6 SKF net sales by geographical area 1999
Ne t sa le s b y g e o g rap h ical are a 1999
2%11%
3%
26%
5%5%
48%
Middle Eas t and A f r ica A s iaCentral and Eas tern EuropeNorth A meric aLatin A meric aSw edenWes tern Europé exc l Sw eden
3.3 Overview of the company’s latest years activity and future plans As an introduction, we would like to give some key data on the size and performance of the company, as follows (table 2): Table No.2 SKF key data on size and performance Key figure 1999 1998 1997 Net sales MSEK 36 693 37 688 36 922 Operating profit/loss, MSEK
2 520 -999 2 949
Return on capital employed, %
11.2 -2.8 13.0
Cash flow from operations
3 020 1 301 2 068
Total assets MSEK 34 823 39 015 38 440

45
*All above given and the other numbers presented in this chapter are taken from the company’s Annual Report of 1999. During 1999, SKF increased it’s earnings due to the inventory, real estate and employees reduction carried out in the context of weak market demand. The Group’s net sales decreased by 2,6 % owning to volume (–5%), currency effects (+2%) and price/mix (+0,5%). The improvements in the price/mix factor, and part of the decline in volume; are attributed to the new strategy initiated in 1998, which prioritized profitability and discontinued unprofitable business. Capacity utilization to the low demand and inventory reduction was unsatisfactory last year. In the future, the company is going to pay more attention to the new technologies and to use them as an instrument to create more profitable business for the Group. The Group is now focusing on expanding its activities in several different areas especially emphasizing service and maintenance. The latest two areas have high priority and are growing both organically and by acquisitions. The company is also going to go on with the reshaping program, selling out unprofitable business and looking for new perspective areas. 3.4 Financial objectives The financial objective the company set itself, as it was indicated in annual report, is value creation for its shareholders. The financial risk management objective, the representative of the company defined as: “not to have any unexpected surprises” or in other words cash flows smoothing. The Group’s financial policy defines currency, interest rate and credit risks, establishes responsibility and authority for managing these risks. The policy states that the objective is to eliminate or minimize risk and to contribute to a better return through an active management of risks.

46
SKF’s financing policy is that the financing of the Groups operations should be long term (maturities exceeding three years). As of December 1999, the average maturity of SKF’s loan was 4.5 years. SKF should have an additional payment capacity in the form of surplus liquidity and/or long term credit facilities, amounting to approximately MUSD 350. The group has been assigned “BBB+” rating for long term credits by Standard & Poor’s and “Baa2” rating by Moody’s Investors Service. 3.5 An analysis of SKF’s financial risk management The management of the financial risk, and the responsibility for all treasury operations, are largely centralized in the SKF Treasury Centre (see figure7.), the Group’s internal bank. This means that all the currency exchange operations inside the company or with the other companies, exposure measurement (partly), hedging and financing operations are made there. For example, if SKF subsidiary in France sells something to the German buyer (if we exclude the possibility of settling the payment in EUR), then the buyer might set a requirement of settling the payment in DEM. If the payment is deferred, the subsidiary informs the center about the currency exposure and at the payment day makes the DED/FRF currency exchanges in the internal bank. If the payment is made at sight, then only the currency exchange takes place. Thereby the French unit of the company all the payments gets in FRF. Thereby the subsidiaries (as shown below) have no currency risk. Every unit of the company pays and gets payments only in it’s local currency.
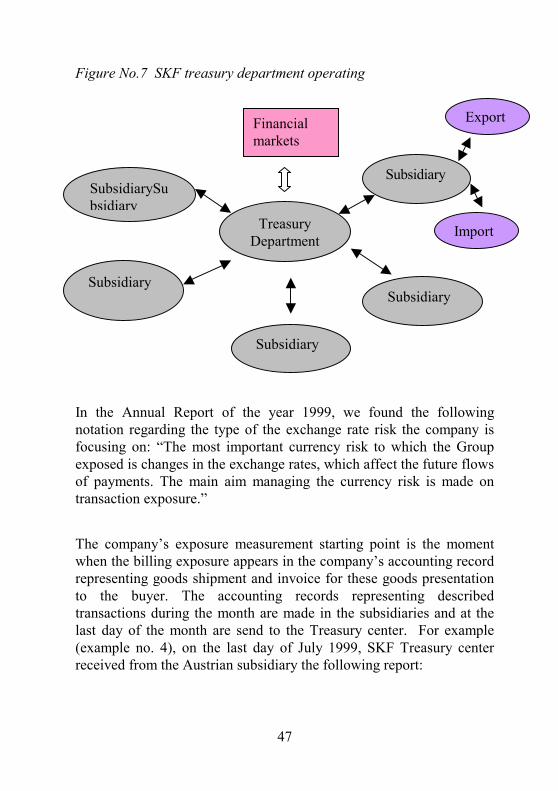
47
Figure No.7 SKF treasury department operating In the Annual Report of the year 1999, we found the following notation regarding the type of the exchange rate risk the company is focusing on: “The most important currency risk to which the Group exposed is changes in the exchange rates, which affect the future flows of payments. The main aim managing the currency risk is made on transaction exposure.” The company’s exposure measurement starting point is the moment when the billing exposure appears in the company’s accounting record representing goods shipment and invoice for these goods presentation to the buyer. The accounting records representing described transactions during the month are made in the subsidiaries and at the last day of the month are send to the Treasury center. For example (example no. 4), on the last day of July 1999, SKF Treasury center received from the Austrian subsidiary the following report:
Treasury Department
Subsidiary
Subsidiary
SubsidiarySubsidiary
Subsidiary
Subsidiary
Financial markets
Export
Import

48
Example No.4 How SKF use netting system In Austrian Schilling EXPORT 99,782 IMPORT 59,213 Net Positions -40,569 *“export” and “import” are expressed on the base of subsidiary’s sent and received invoices amounts Based on the information received from the foreign subsidiaries and Swedish units of the company, Treasury center makes the overall company’s exchange rate exposure report by each currency. The company has a special internal rule regarding the company’s exchange rate exposure period, saying that the company’s billing exposure period (representing the trade transaction within the Europe) can not be longer than 10 days. For the trade transactions among different continents, the period should not exceed 40 days. Therefore, the company’s exchange rate exposure for one transaction does not exceed 40 days. Since 90% of the trading transactions are made in Europe, 90% of the payments for goods are settled within 10 days. The period of the majority of trading transactions is 3-6 months. The company’s exchange rate exposure measurement is made on the monthly basis (as described above) at the last day of the month. The Company’s exposure hedging horizon is three months. The hedging activity takes place four times a year as follows: in the beginning of January for the first quarter, in the beginning of April for the second, etc. The hedging volume is based on so called “Prognos”, which is the forecast of invoicing amount for the coming quarter basing on the last years performance. The forecast is calculated in the following way:

49
Example No.5 “Prognos” Company’s exposure is US dollars: The performance for last year: (January+February+March+April+…December)= 200 000 The performance for last month (December)=20 000*12=240 000 The performance for last three months: (October+November+December)=(13000+12000+20000)*4=170 000 The performance for last six months:(July,August,…,December) =(9000+17000+18000+13000+12000+20000)*2=178 000 “Prognos”=180 000 (roughly equal to last years’ US dollars net position and might be adjusted to the coming years company’s strategy; for example, shutting down part of the production or signing a big long lasting contract with the new customer in a particular subsidiary). “Prognos”, or the forecast, is made for the one-year period and might be adjusted if any significant deviations from the forecast in the real invoicing amount take place. Otherwise, according to our example, the “Prognos” for the first quarter the company is going to have 45 000 USD excess inflows than outflows. Then the company, at the beginning of January, will sell 45 000 USD three months forward. To the question if the company is looking back and checking if the forecast was right, the representative answered positively, not identifying the real numbers. To the question how often the “Prognos” needs to be adjusted, the representative answered, that not often. Due to the fact that approximately 50 % of the company’s customers are permanent and the business cycles are comparatively predictable, it seems quite reasonable to presume that the invoicing forecast for the coming quarters might be quite accurate. The company’s objective is to have zero currency risk and according to the representative they are close to it. As we can observe, the company is hedging 100% of its exposure. The currency of denomination is Swedish Krona.

50
Speaking about the hedging, the season of the year should be taken in to account. During summer or Christmas holiday less attention to the hedging position adjustment needed. Talking about the exposure hedging time period, we should point out that the company’s hedging period policy changed due to Swedish Krona devaluation, which was in the end of 1992. Before, the company was hedging on the yearly basis, but starting from 1994 changed to quarterly. One more important thing to mention is transaction costs. SKF treasury department is costs center and, to our knowledge, is not accounting or anyhow recording transactions cost. The main company’s exposure management strategy is netting. Company’s exposure management system, as it is today hasn’t been changed in the last 5-6 years. The representative of the company expressed his full satisfaction with it. Although, keeping in mind the latest 10-15 years company’s strategy of foreign currencies inflows and outflows balance, more and more natural hedging is taking place. Forwards are the main instruments the company uses for exposure hedging. Options are sometimes used as well, but only in the cases when it is big probability that the particular currency will increase (decrease) below (above) certain limit. Options are used more widely for currency trading purposes. Though, as we can see below, the trading portfolio in the company is comparatively small. For the better grasp of the magnitude of financial derivative instruments the company use, the following numbers in MSEK are given (table 3):

51
Table No.3 SKF financial derivative instruments figure Type of instruments 1999 1998 1997 Forward exchange contract
12 869 17 306 25 192
Currency options 425 886 2114 Purpose Hedging of: -Firm commitments 4 239 5 719 6 272 -Anticipated transactions
1 822 1 746 10 109
-Net equity invests - - 300 Trading 139 2 719 1 716 Interest rate management
3 528 5 347 5 355
The yearly currency flows are shown in the following table (table 4): Table No.4 SKF currency flows Yearly currency flows (MSEK) (- = outflow) USD 2 000 EUR 600 GBP 550 SEK - 4 600 Others 1 450 One more specific factor related to the SKF business exchange rate exposure management should be mentioned; SKF has a comparatively mall pricing strategy changing capability based on its specific

52
consumer situation. The biggest part of SKF prices are locked in the big volumes, long term contracts with the car industries, original equipment manufacturers (30% of productions), or the paper industry (26% of production). Only 44% of the SKF productions are sold to distributors selling bearings for replacement. The latter cluster of the customers is the only one SKF could use its pricing strategy on, in the case of drastic exchange rates changes. Let’s take the company’s most common business transaction and try to fit it into the transaction life span as it was described in the figure no.1. A majority of SKF transactions take place according to the long term contracts, meaning that the same transactions follows each other for 5-6 years under already signed contracts. But, for the very first one, transaction life span starts exactly as it was described in the figure, when SKF quotes the price for the buyer. It is clear that, starting from that moment, the company already starts to have exchange rate exposure. In other words, if, after that moment, the exchange rate would drastically change, the company would risk to incur losses if it follows the tender price or might lose the buyer in the case it would decide to increase prices. Therefore, the company is already exposed to the “Quotation exposure” or part of the transaction exposure, though still without any effects on the cash flows. SKF is not measuring or managing Quotation exposure. Backlog exposure starts from the contract signing moment. From that moment SKF starts to produce steel and bearings and the expenses starts to increase. One important thing to mention is that almost all the bearings are produced in Sweden from steel, which the company is producing by itself as well in Sweden. Therefore, only cash inflows for the production sold are exchange rate exposed and almost no costs are exposed. In the case of unfavourable exchange rate changes, the company will generate less cash inflow than expected, while the fixed costs are already made, creating cash flow exposure (part of the transaction exposure). Under the transactions, financed from the external sources (bank loans etc.) in order to buy the raw materials and start the production, if unfavourable interest rate change would take place (drop down) the company would have to pay the higher than in the market interest rate. Thereby, from Time 2 the interest rate exposure starts. The more expenses made (raw

53
material, steel production, bearing production) the more loan or credit line from the bank is used, the higher interest rate exposure incurred. Meaning that the interest rate exposure increases during Time 1-Time 2. During Time 2-Time 4 the company produces and sends the production along with the bill to the buyer. The accounting record is made showing the amount of the bill as “account receivable”. Expenses are made and the risk of incurring losses appears, creating the credit risk, in the case the buyer won’t pay the bill. To our knowledge, during Time 1-Time 2, SKF is making only some kind of interest and credit exposures management, but since interest rate and credit risk exposure are out of our concern we are not going to go deeper into that topic. At Time 3 SKF ships the goods and bills the buyer. Starting from that moment the amount of cash flow receivables appears in the SKF accounting books. All above described exposures, which appeared at Time 1 and Time 2 increase by shipment and any other cost related with the transporting (in the case the SKF is paying). SKF is measuring only part of transaction exposure within Time 3-Time 4. In 1998, the company stopped the hedging of the translations exposure. In 1994, the company was hedging the translation exposure for 100 %, although during the 1995-1997 the company was decreasing the percentage hedged and starting from 1998 stopped to hedge translation exposure. The reason for leaving the translation exposure unhedged, according to the representative of the company, was the single EURO currency system. At the beginning of every month, subsidiaries’ net currency position (the excess of import of export) are pooled into one pot. Forward contracts are the financial instruments are mostly used for the hedging company’s exposure position. In the example given in the beginning of the chapter, the Austrian subsidiary is exporting 40.569 ATS more than importing; therefore the whole SKF is exposed to ATS. To hedge that exposure, 40.569 ATS forward had to be sold to insure the company against the exchange rate risk on the same amount of ATS inflow.

54
3.6 Observations and suggestions for SKF After the analysis of the SKF’s actual transaction exposure management system, we made the following observations and suggestions. Starting moment of the exposure management Observation: The first one is concerned with the starting moment of the transaction exposure hedging, in respect to the theoretical transaction “life span”. In the case of SKF, we found out that SKF start to hedge transaction exposure from Time 3, even though they have signed the contracts with the customers in the second period. Suggestions: Based on the knowledge we received, we recommend that the company should at least start to hedge during the period when they signed the contract. In Kenyon’s book, he said “we can take action to hedge the risks as soon as we are sure to have landed out contract, this is usually at signature, sometimes later sometimes earlier”(Kenyon, 1981, p. 82), otherwise they are bearing the currency risk during that period. It is obvious that once a quotation has been submitted, the exposure appears and the firm needs to consider how to manage that exposure. Another interesting things is that, being a big international manufacturing companies, SKF, have a large percentage of long-term contracts and permanent customers. Therefore, a big part of SKF prices are locked in the big volume, long term contracts with the car industries original equipment manufacturers (30% of productions) or paper industry (26% of production). Whether or not to hedge the potential exposure during the period of quotation is an important issue. From the moment the firm starts to be exposed, hedging decision will be accompanied with transaction cost. Prior to that point, the evaluation of the contract signing probability should be made. If the chances of winning the contract are low, then attempting to cover the risk would seem more like speculation than hedging. At this point, the firm need to consider theirs historical performance carefully. So

55
summing up above mentioned problem, we would like to make the following suggestions: The company could evaluate the customers and set them into different clusters depending on the historical performance, which is the performance of theirs’ contracts fulfilling: permanent, less permanent and un-permanent. Depending on the cluster the customer belongs, to set different hedging percentage. For example, for those customers, whom belong to the permanent customer category, the firm can hedge 100% expected transaction exposure at the quotation period. For those customers who belong to the less permanent customer category, 80% hedging of the contract’s volume after the moment that contract has been signed; and finally those customers, who belong to the un-permanent category, 50% hedging. We think that the latter way of customer grouping would help the company to avoid big fluctuations resulted from different types of customers. Inter-company indirect transaction risk Observation: The second observation is about the inter-company indirect sales transaction risk. As we described before, SKF’s treasury department dealing with the company’s whole financial exposure management, while the subsidiaries do not take any exchange rate risk at all. Suggestions: In fact, if we look deeper into SKF group’s internal transactions, we might find that there exists currency exposure in subsidiaries. From the representative of the treasury department, we found out that the company has set an internal forward rate usage for next quarter invoices rule. Since we have not received any other information from the subsidiaries, we will set up an example to explain how the exchange rate change effect the group’s internal transactions. Assume that the final price of the subsidiary’s production in the United States’ market is decided by the director of the United States’ subsidiary (it is common that the pricing decision is taken at the

56
country where the goods are sold to outside customers). The forward rate is 1US$=8 SEK, and the inter-company’s price is 280 SEK/unit, which costs the United States’ subsidiary 35US$/unit, with a minimum gross margin of 12,5% of selling price, which means the final price in the United States’ markets is 40US$/unit. Now with the exchange rate change, say that the forward rate change to 1US$=8,75 SEK, then the costs for the United States’ subsidiary will turn to be 32US$/unit, still the final price is 40US$/unit, then the united states’ subsidiary will have a gross margin of 20%. It seems to be well enough, though on the other hand the United States’ subsidiary have an alternative to use the windfall cost reduction in selling price reduction in order to get extra sales and market shares. The third alternative is to adopt a halfway position in terms of usage of part of the saving for a price reduction and part for the profit margin enlargement. As we can see from the example, the exposure, which SKF probably didn’t consider, still exist in the subsidiaries. Thus, theoretically, if the inter-company price between SKF and its subsidiary in United States were fixed to the US dollar, then above mentioned exposure would not happen. Risk sharing Observation: as was mentioned above, about 50 % of the company’s contracts are long term (3-5 years) with the permanent contractual parties. Production prices in such contracts are based on tender prices and usually are fixed. The company is not using any exchange rates clauses in the contracts, but takes all the risk on theirs behalf or some kind of exchange rate changes expectation includes in to the price. Suggestion: Let’s take an example and presume that the company is signing a contract for selling 1 million bearings in 5 years for fixed price based on the tender. The contract is in US dollars. It means that during that period, if the exchange rate changes, in the way that USD value will increase in comparison with SEK, then the swedish company will incur losses. Another important point is that the longer the validity period of the contract the bigger the uncertainty about the exchange rate changes. In our example, it is 5 years plus tender period.

57
Since the company’s financial risk objective is to have zero exchange rate risk, we think that the best solution of this problem is to share the exchange rate changes risk using so called currency clauses or pricing strategy element, such as: floating price setting. The mentioned ways of risk sharing usually are used as follows:
• To share the exchange rate risk by so called “currency clause”, meaning that if USD/SEK (following our example) exchange rate changes the contractual party, which are getting advantage of that change compensating half of the advantage to the other party;
• To set a floating production price, which would float in accordance with the exchange rate changes.
Hedging period and transactions cost balancing Observation: SKF’s Treasury department is the cost center unit. The company is not accounting or recording hedging transactions cost. Suggestion: As we know from the basic economic theory, forward price is about 3% of the transaction amount. Therefore the bigger the amount, the higher the transaction costs. SKF is big multinational company operating with big exposed amounts, therefore it would be reasonable to presume that the transactions costs compose a significant amount. The more seldom exposure is hedged, the less transactions and consequently less transaction costs will incur. Since SKF is hedging four times a year, if any unexpected exchange rate changes take place, the transactions cost might seem not be so significant. On the other hand, in our turbulent word of changes, one should be very careful making a decision about the hedging period, since the longer the period, the bigger the probability of unexpected exchange rate changes. Depending on the hedging transactions volume and frequency, the transactions cost might reach a level from which it might be more costly than useful to hedge. Therefore, due to the above-mentioned reasons as well as for the further possible surveys, we think that it
58
would be very useful if the company would start to record transactions costs. The other crucial issue is transaction costs and hedging period balance. As was discussed above, the more often and the bigger amounts one hedges, the more transaction costs one will have and the other way round. Though the more frequent exposure is hedged, the less variability in cash flows and the less probability of unexpected exchange rate changes will occur. Therefore, the appropriate balance of the hedging period and transactions costs should be made. For that kind of balance the transaction costs and the hedging period should be known. Unfortunately the company has no transaction costs records. Thus, the only thing we can suggest is to start to record transaction costs and then have both transaction costs and hedging frequency try to find out if the hedging costs are not getting higher than the level and when hedging starts to be more expensive than useful. Hedging horizon and financial risk Observation: SKF’s hedging period is three months. Hedging volume is determined by the forecast (Prognos), which on its turn is based on the historical performance. Forecast is adjusted during that period, if any changes appear. Suggestion: The length of the hedging period is a debatable question, although one of the factors that effects it is hedging transaction cost and period balance. Another factor is the firm’s readiness to take a certain amount of risk. As it was mentioned before, SKF is hedging its transaction exposure every three months. For example, at the beginning of January, they are hedging for January, February and March. At the beginning of April, they are hedging for April, May and June. If any big fluctuations in the first quarters exchange rate appears or significant deviations from the billing forecast would takes place, the forecast amount would be adjusted in the second quarter accordingly. However, if any changes would take place in the first

59
quarter no action is going to be made. For example, if in the middle of January a big change in the main currencies exchange rate occurs, adjustment to the forecast would be made only in the beginning of April. Thereby, it might result in a comparatively large, 2,5 month un-hedged period, that might dramatically deteriorate SKF’s net position. Thus, we think, that in order to avoid such kind of un-hedged periods, adjustments should be made every month. For example, at the beginning of January, they can hedge for one quarter, that is January, February and March and in the beginning of February, they can hedge for another three months, that is February, March and April. In this way, they can avoid unexpected fluctuation caused by the short period exchange rate changes.

60
4. Case study in Elof Hansson 4.1 Overview of Elof Hansson Elof Hansson is a trading company with an even longer history than the SKF’s one. The company was founded by the merchant Elof Hansson in 1897. The Board of Directors and Managing Director gives the following presentation of the company (in annual report of the fiscal year 1999): Elof Hansson, whose registered office is in Gothenburg, is the parent company of the Elof Hansson Group. The company undertakes international trading in three business areas – Forest, Industrial and Consumer Products. Sales are handled via subsidiaries, branch officers and agents in more than one hundred countries. Elof-Hanson AB is owned to 99.9 % by Elof Hansson’s Stiftelse (The Elof Hnasson Foundation) or, in other words, is family owned business. 4.2 Main business areas, suppliers, customers, competitors and sales distribution Forest products area accounts for the largest proportion of the business operations of the Group, which is explained by the fact that merchant Elof Hansson, who founded the company, did his first deals in paper and pulp. The largest customers of the paper products are found in Latin America, several African countries, Asia, the Middle East and the Far East. The suppliers are primarily located in Scandinavia and North America, but also in Russia and South America. Traditionally, paper pulp suppliers are found in Scandinavia and North America, however the incidence of new suppliers for company’s customers in Asia, the Middle East and North Africa, has risen. The industrial area is the second largest, comprising of steel, pipes, forgings and castings. Industrial Products Division supplies mentioned products mostly within Sweden. The customers of the industrial products are found in

61
Central America, the Caribbean and Mexico. Customer’s products are the third largest field of business activity and the consumers of these products are settled in some fifteen European countries, primarily in Scandinavia and the Baltic region. The main suppliers countries are China, India, Pakistan, Rumania, Taiwan, Hong Kong and Turkey. Due to the specificity of the business competitors might be not only the other trading houses, but also company’s suppliers and customers. Since Elof Hansson is the middleman, the cases when the previous suppliers stars to sell their production directly to the previous customers, makes the latter a competitor. According to the representative of the company, Mr.Henrik Jerner, the main competitors in Sweden are the following trading houses: Ekman and Co., Cellmark. One of the main foreign competitors is Japanese’s trading house “Sumitomo”. The following figures, No.8 and No.9, describe the net sales distribution by geographical areas and customer segments. Figure No.8 Elof Hansson business volume by products 1999
Business volume by product 1999
42%
34%
6%
11%7% Pulp
Paper
Industry
Building materials
Customers

62
Figure No.9 Elof Hansson business volumes by market 1999 4.3 Overview of the company’s latest years activity and future plans Following the SKF’s data presentation order, an introduction some key figures on the size and performance of the company will be presented in the following table: Table No.5 Elof Hansson key data on size and performance Key figure 1999 1998 1997 Business volume MSEK 5 786.3 5 568.7 6 458.3 Operating profit/loss MSEK 13.8 43.9 43.5 Return on capital employed, % 1.1 6 6.2 Cash flow from operations -29 848 -13 554 22 591 Total assets KSEK 1 629 724 1 499 353 1 513 660
Business volume by market 1999
17%
4%
9%
20%8%
42%
Sweden
Rest of Scandinavia
Rest of Europé
North and SouthAmericaAfrica
Asia and Australia

63
*All above given and the other numbers presented in this chapter are taken from the company’s annual report of 1999. Operating profit, as well as the business volume of the company in 1999, was the lowest during the last five years. The Chairman of the Board of Directors in the company’s annual report explained it through weak demand and subsequent shortage of quantities during the latter half a year. Though taking into account several strategically important activities were undertaken the financial results COE found acceptable. The representative of the company on the interview as the main factor, which diminished business volume and income for 1999, indicated Asian crisis. The company’s nearest future activity is going to be concentrated on the main forest products area, since the trend in this area remains positive. The trade in forest products in future will also have a dominant role within the company. Demand for paper is evaluated as remaining high with the world consumption rising annually by 1-2%, that is, by five-seven million tons. Among forest products, timber and downgraded paper has a strong standing on this market, and will be further reinforced in the current year. Downgraded paper through a continuing expansion in Asia. In the coming years, marketing will intensify and include non-Swedish markets, primarily the rest of Scandinavia and the Baltic region. 4.4 Elof Hansson’s financial objectives Since the company is basically owned by one family, the representative of the company indicated that the main financial operating objective is as it usually is for private business enterprises: profit. Financial risk management objective was defined as cash flows smoothing as well as the advantage of the exchange rate changes taking speculating with the available liquid assests. Financial policy of the Group defines exchange rates, interest and credit risks. The company is managing them actively.

64
Group’s financial policy regarding company’s operations financing is predetermined by the specificity of the operations, which mostly are short term. Thereby the biggest part of the loans the company has is from 6 months to 1 year. 4.5 An analysis of Elof Hansson’s financial risk management The organization of the exchange rate risk management is based on the centralization principle and is fully centralized for the Swedish divisions of the company. The most important currency risk to which the Group is exposed is exchange rate exposure. Transaction exposure was defined as one of the highest concerns. As well as in SKF, in Elof Hansson (EH) in all the currency exchange operations inside the company or with the other companies, exposure measurement (European), hedging and financing operations are made in the internal bank, although there are some significant differences. One of the main ones is that EH is measuring and managing its exposure every day, while at SKF is once a month. EH hedges for every single contract’s (order’s) period, SKF for 90 days. The specificity of EH commercial operations - no manufacturing, just trading - causes the difference in the treasury departments structure and main activities. EH being a mostly profit seeking middleman has much bigger trading portfolio. Unfortunately, due to the confidentiality of the information, both companies refused to give any real numbers describing trading portfolio. The only information we received was that the portfolio is comparatively big, while in SKF it is comparatively small. The treasury department’s main concern in EH is commercial and trading portfolio management, while in SKF just commercial transactions hedging. No trading transactions among subsidiaries are taking place in EH and, therefore, no exchange operations among them are needed. Otherwise the trade with the other companies is organized in the same way as in SKF; every unit of the company pays and gets payments only in it’s local currency. Exchange is made in the internal bank (Treasury Department).

65
As opposite to SKF, a majority of EH contracts are short or middle terms, and majority of suppliers and customers are temporal. That requires a stricter management attitude. Therefore, EH measures and manages exchange rate exposure on the daily basis. Every day the treasury center measures exchange rate risk exposure in the similar way as the SKF does in the end of the month. The main company’s exposure management strategy is netting. Basing on the during the day received foreign exchange orders from the subsidiary’s, treasury department net the numbers and buys on the spot or forward markets the required amounts. At the end of the day all the exchange rates orders are added together and the one-day’s exposure is calculated. As with SKF, EH hedges 100% of the currency exposure. Internally, for every currency it is set 2,5 % value at risk (VAT) factor, representing the foreign currency transaction magnitude allowed during the day. Trading, loans and commercial portfolios reports are made representing all the foreign currencies’ transactions made during the day in the case the 2,5 % per day value at risk requirement is exceeded. The company’s exposure management system, as it is today, hasn’t been changed for latest 4 years. The representative of the company expressed his full satisfaction with it. Forwards are the main instruments the company uses for exposure hedging. Though the representative expresses his willingness to introduce options in to subsidiary’s hedging activity more widely. The company’s subsidiaries’ commercial activity within Europe is hedged in the same way as the company’s units in Sweden. The Treasury department nets and hedges the exposed amounts according to the received exchange rate orders. The North American and Latin American subsidiaries, due to the big time difference, net and hedge their exposed cash flows in the local financial markets by themselves, providing the center with the financial reports at the end of the month. The currency of denomination is Swedish Krona.

66
The Treasury Department in EH, as well as in SKF, is the cost center. Although in EF the Treasury Department’s dealers are sometimes having so called “realised” and “unrealised” profit, which appears due to the fact that quite often the exposure bought from the subsidiary for one price (for example in the morning) is hedged later (in the afternoon) for another one. 70% of the company’s sales are in foreign currency. The main currencies are USD and EUR. The yearly currency flows for 1999 are shown in the following table: Table No.6 Elof Hansson currency flows Yearly currency flows (MSEK) (- = outflow) USD 532,722 DEM -16,526 EUR -5,4382 FIM -22,672 FRF 158,433 NLG -0,5 NOK 5,8841 The pricing strategy the company uses is “currency clauses”, according to which, in the majority of cases, contractual parties sharing the exchange rate changes risk. No quantity affect strategy takes place. Let’s take the company’s most common business transaction and try to fit it into the transaction life span as it was described in the figure no.1. EH finds the supplier, which is willing to sell the product for the lower price and the final buyer willing to buy the product for the higher price. Usually, EH is provided with 1-3 month deferred

67
payment and is giving 3-9 month deferred payment to the final buyer. The subsidiary gets the order from the buyer and the same day has to send it to the internal bank for hedging. The quotation exposure starts. Due to the same reasons described in the SKF case, at that moment exchange rate exposure or transaction risk starts. EH, as SKF, is not measuring or managing that risk. If all the parties are satisfied with the business transaction conditions, the final buyer places an order with EH and the Backlog exposure starts. Starting from this moment, cash flow, interest rate and credit risk exposure starts. At this point, we should mention one significant difference between SKF and EH; EH’s both cash outflows for imported production as well as cash inflows for the exported production are exchange rate exposed. This means that if the exchange rate changes unfavourably and the company will get less for the production sold, the amount EH has to pay for the supplier should decrease as well, if the time lag between the moments when productions was bought and sold is small and the currency is the same. Thereby, in the described case, EH is naturally hedged. Although if time lag is big (6-9 months) and the currencies EH buying and selling the production are different then if the exchange rate change appears the cash inflow might be smaller and the outflow bigger than expected. Therefore the expected profit might be squeezed to unexpected loss. At the same time, in SKF only cash inflows for production are exposed, because the bigger part of raw material (steel) the company produces by themselves. As we see, EH has to be more attentive and careful with exchange rate risk, since it is exposed to the higher exchange rate risk. EH starts to measure transaction exposure starting from the Time 2 basing on the historical performance. EH is exposed to interest rate risk in the same way as it was described in SKF, therefore, we are not going to describe it. In summary, we could say that EH starts to measure and manage their exchange rate exposure form Time 2 to Time 4 though is not measuring or managing for Time 1. The company does not consider translation risk as important and, therefore, does not hedge it.
68
4.6 Observations and suggestions for Elof Hansson Different approaches for the initial moment of the exposure management Observation: In the case of Elof Hansson, we found that they start to hedge the contracts in the Time 2. This means they hedge the contracts (orders) after the contracts (orders) have been confirmed. Suggestion: we have mentioned transactions exposure starting moment in our paper for several times in order to emphasize its’ importance. An interesting coincidence is that the Elof Hansson transaction exposure hedging starting point is exactly at the same Time 2 that we have suggested for SKF. Although we should keep in mind that the companies are from different industry clusters and, thereby, the most fitting exposure managing moment for one does not necessary means the same for other. Elof Hansson, in comparison with SKF, has a small percentage of long-term customer relationship cases, thus, it turns to be difficult for them to forecast the number of contract signed or deals set. Thereby, we suggest that they should start to hedge starting from the Time 1 for a lower percentage in the quotation period basing on the customer’s historical performance and hedge 100% after the contracts have been signed, which is in Time 2. Since the company has no historical hedging transactions costs, we were unable to come up with a hedging percentage suggestion. Different approaches for the choice of hedging period and transactions cost Observation: Both companies’ Treasury departments are cost centers. They are not accounting or recording hedging transactions cost. Suggestion: The first observation suggests that EH is more exposed to the exchange rate changes than SKF. Therefore, EH’s exposure should
69
be hedged more frequently. That’s the way it actually is. The exposure is measured and managed every day, while in SKF it was once a month. Thus, EH should have much more hedging transactions and as a result higher transactions costs. But, the more frequent the exposure is hedged, the less variability in cash flows and the less probability of unexpected exchange rate changes should occur, which is critical issue for EH. Since, as it was mentioned earlier, EH is more exposed, meaning higher risk of cash flows variability resulted from the exchange rates changes. However the amounts the company are hedging are comparatively smaller than in SKF and that factor should reduce the transactions costs. But, is it the best hedging frequency for the company? It might be possible to get some kind of guidance if we would have historical performance records of hedging transaction costs. Unfortunately, that’s not the case. In order to be able to come up with the best fitting hedging period, reasonable basis for the calculation is needed. Therefore, we suggest that the company should start to record their hedging transactions costs. Hedging period and netting strategy Observation: Elof Hansson is hedging on a daily basis. Suggestion: As it was mentioned, EH is hedging every day and is using a netting strategy to manage the transaction exposure. As we know from the basic theory the biggest use of the netting strategy is when there are a lot of opposite way exchange rate transactions; e.i. when one subsidiary requires to sell the same amount and currency the other needs to buy. The longer the period, the bigger the probability of opposite exchange rate transactions and the bigger the use of netting strategy. As was mentioned earlier, the more often we hedge, the more hedging transactions costs we will have. Thus, is it really necessary to hedge transaction exposure every day? In order to get the answer to the question, one would need to measure and compare hedging transactions costs spent with the possible transactions cost if it were hedged just once a week or once a month, and the gain from the avoided transactions costs on the opposite way exchange rate

70
transactions. Especially in cases where a lot of opposite way transactions take place, hedging frequency decreasing might be an important issue to think about. Risk sharing, billing currency, VAT Since the risk sharing EH does in the right way we could suggest and the billing currency question does not exist for EH at all, we just will make a summary comparison of the later issues between the companies. The biggest part of the EH contracts are short or medium term for comparatively small amounts and the opposite is at SKF. Production prices in such kind of contracts in EH are floating depending on the changes in the market, while SKF uses mostly fixed prices. EH is widely using currency clauses while SKF is not. Therefore, to our point of view, EH is exploring available pricing strategy, while SKF is not so active in this sphere. Although we should keep in mind that due to the specificity of the SKF’s industry, the company has small pricing setting capability, meaning, that there are small chances that the buyers would accept currency clauses or especially floating prices. Since EF is the middleman and does not have any manufacturing the billing currency question is not so important, while in SKF that is one more thing to be improved. The last issue worth to be mentioned is VAT. To our knowledge, only EH is using VAT exchange rate deals limits, which we found an appropriate exchange rate deal for one day control tool. Hedging frequency related to different industries Observation: Elof Hanson as a trading company is taking the role of the middleman, both buying and selling at the same time. That will consequently incur double exposure in terms of import, as well as export exposures, while at SKF, most of the raw materials are

71
produced by the company themselves and, therefore, most exposure happens in the export section. Suggestion: For Elof Hanson, it IS more important to control the exposure, since they are exposeD from both sides. The company needs more intensive and careful management of the exchange rate risk. Elof Hansson measures the exposure daily, demonstrating that they are paying a great deal of attention to the exchange rate exposure. While, on the other hand, most of the merchandise the company is buying and selling at the same time. As we know, if the company is buying and selling in the same currency and at the same time, then it might appear in the situation of “natural hedging”. In that case, the frequency of hedging should decrease, since we know that the hedging is not costless.

72
5. Conclusion In the final part of our work we would like to make a short summary of the main issues we have analysed and the results we have achieved. In order to fulfil the first part of our purpose we overviewed the existing classifications and terminologies of financial risk and it’s consisting parts, emphasising the one we found most useful, i.e. transaction exposure life span. We think that transactions exposure is the most important one for the companies due to the following reasons:
• Transaction exposure observes the whole life span of the companies’ business transactions from pricing quotation to the final settlement.
• Transactions exposure covers the biggest part of the company’s exposure since it deals with business transactions, the most fundamental issue in the profit seeking companies’ activity.
After the analysis of the chosen companies we can conclude that there are no general rules for setting the hedging period. Each company’s specific characteristics dictate the hedging period requirements. Two big Swedish multinational companies with large open currency positions were chosen in order to fulfil the second part of the purpose. First we overviewed the main characteristics of the companies exchange rate risk management systems in order to be able to apply the theoretical transaction life span on the specific company business transaction. One was SKF, belonging to the ball bearing manufacturing industry, while the other was Elof Hansson (EH), representing the trading sector. Differences between the companies result in different levels of exchange rate risk and, thus, differences in exchange rate management

73
strategies. The industries, that the companies belong to predetermine the following differences:
• In SKF the biggest part of the bearings are produced from the self-made Swedish steel. Thereby, it is exchange rate exposed only from the sales, but not costs side, while EH is exposed from both sides;
• About 50% of SKF’s contracts are long term with long standing customers, while this is the opposite for EH;
• SKF, in comparison with EH, has small price setting capability.
Nevertheless the companies have some significant similarities concerning exchange rate exposure management:
• Both companies’ financial risk management policy defines exchange rate risk exposure as the main; managing the exchange rate exposure main focus is made on the transaction exposure management;
• In both companies, exchange rate risk exposure management is centralised in the headquarters’ treasury department, so called internal bank, where all the currency exchange operations take place. Subsidiaries deal only with their local currency and don’t have any currency risk;
• The companies use exposed amounts netting strategy and not record their hedging transactions costs.
• Forward contract is both companies’ main hedging instrument;
However, there are more differences than similarities between the companies exchange rate management systems such as:
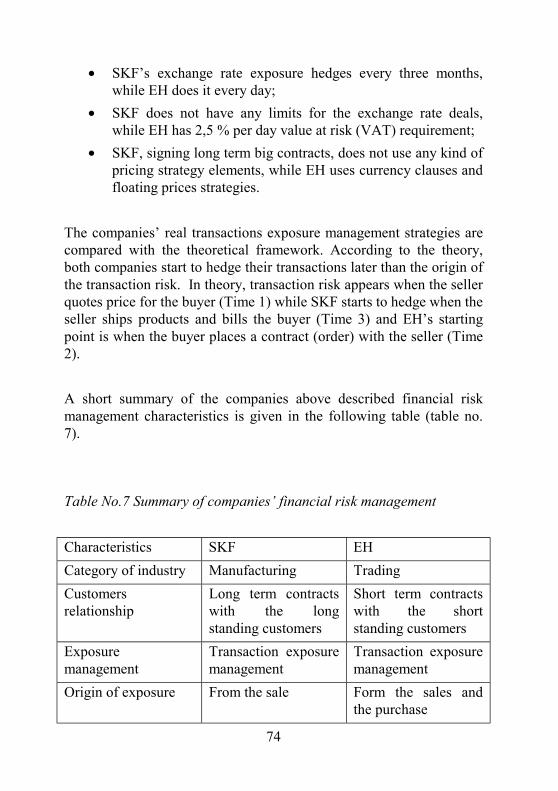
74
• SKF’s exchange rate exposure hedges every three months, while EH does it every day;
• SKF does not have any limits for the exchange rate deals, while EH has 2,5 % per day value at risk (VAT) requirement;
• SKF, signing long term big contracts, does not use any kind of pricing strategy elements, while EH uses currency clauses and floating prices strategies.
The companies’ real transactions exposure management strategies are compared with the theoretical framework. According to the theory, both companies start to hedge their transactions later than the origin of the transaction risk. In theory, transaction risk appears when the seller quotes price for the buyer (Time 1) while SKF starts to hedge when the seller ships products and bills the buyer (Time 3) and EH’s starting point is when the buyer places a contract (order) with the seller (Time 2). A short summary of the companies above described financial risk management characteristics is given in the following table (table no. 7). Table No.7 Summary of companies’ financial risk management Characteristics SKF EH Category of industry Manufacturing Trading Customers relationship
Long term contracts with the long standing customers
Short term contracts with the short standing customers
Exposure management
Transaction exposure management
Transaction exposure management
Origin of exposure From the sale Form the sales and the purchase

75
Responsibility and coordination
Treasury department Treasury department
Initial moment of exposure management
Time 3 of transaction life span
Time 2 of transaction life span
Hedging period Hedging every 90 days
Hedging every day
Pricing strategy Small price setting capacity
Currency clause and floating prices
Major hedging instrument
Forward rate contracts
Forward rate contracts
Special requirement of exposure management
None Value at risk 2,5%
At this stage, the first important step for the firm is to confirm the starting moment of the hedging strategy, based on the firm’s operating characteristics. Since SKF has a big percentage of long-term contracted relationship, it becomes very important to set a certain hedging percentage in the quotation period and use 100 percent hedging after the contract’ signing. Otherwise, they are exposed to exchange rate risk during these periods. Since EH has small percentage of fixed long term contracted relationships, the hedging after the contract (order) has been confirmed is the most important one. The possibility to forecast future cash flows before that moment is very small. That’s why the hedging before the contract is placed might turned out to be more costly then useful, although in theory the company is incurring risk from Time 1 to Time 2. So in this sense, different firms might have different most fitting starting moment of hedging depending on this net of specific features. One more important conclusion we made is about natural hedging possibilities. EH can reach a natural hedge of transaction exposure, as a middleman if it buys and sells in the same currency at the same time,

76
while SKF can reach it through the operations diversification among foreign subsidiaries. The third important conclusion concerns the hedging period and the transaction cost balancing. Neither SKF nor EH recognized the importance of transaction cost recording. Since the longer the hedging period, the less transaction cost will incur; while on the other hand, there will appear a bigger possibility of the firms’ cash flows fluctuation, which, as a consequence, will effect the firms’ future value. So, it is very important to keep a record of transaction costs, because that gives the possibility to compare different period’s hedging transactions costs in order to find the breakeven point for the most fitful hedging period. The hedging period, especially for SKF, has one more aspect. The company is hedging every three-months. So, at the end on the hedged period they are faced with the big risk of being exposed to exchange rate changes, if any. Therefore, the conclusion and suggestion at the same time is that, in the case of SKF, they would have less risk if they were to hedge every month. EH hedges transaction exposure every day using the netting strategy. Too high hedging frequency might result in a loss of netting system advantage. Therefore, we think that EH should consider the hedging period revision, especially if one day one-way foreign exchange deals are requited and the second day the backwards streams are coming. One more important thing to mention is the one-day currency exchange deals limit in order to avoid the big fluctuation in firms’ cash outflow and inflow. In EH’s value at risk (VAT) one day limit, we have a very good example of how a firm’s speculative currency position might be controlled. On the other hand, it will raise other question as to how to set such a limit, which might be an interesting question for further research in this field.

77
Our last conclusion is about the pricing strategy. Even if it is difficult for the firm (SKF) to implement pricing strategy elements, from the theoretical point of view, it is a useful tool to decrease transaction exposure. Such pricing strategy’s elements as risk sharing or floating price clauses might be very useful when the firm’s planning to enter a new market in developing countries, where the risk is very high. Therefore, at least a trial to implement mentioned pricing strategy tools might end up with a significant exchange rate risk decrease. Finally, we would like to point out the main knowledge we gained from this work is that there is no general transaction exposure management rule that could be applicable to all the companies. Every company has its own specific characteristic, which depends on a lot of different macroeconomic factors. The comparison of the companies’ transaction management strategies provides the companies with the exceptional opportunity to get a clear and detailed picture of the other company’s transaction management strategy. Such information is usually not publicly announced; therefore, the companies have an excellent chance to learn from each other. We hope that the comparison of the companies’ transaction exposure management similarities along with our suggestions on the companies’ specific characteristics will make a significant contribution to the companies transaction exposure management improvement.

78
6. Bibliography Books: Boyadjian H.J. and Warren J.F., (1987) Risks, Reading Corporate Signals, Wiley Donaldson, J.A. Corporate Currency Risk, Financial Times Business Information Eiteman D.K., Stonehill A.I., Moffett M.H. (1997), Multinational Business Finance, New York: Addison-Wesley Publishing Company Kenyon A.(1981), Currency Risk Management, John Wiley & Sons Kenyon A.(1990), Currency Risk & Business Management, Basil Blackwell Oxelheim, L.& Wihlberg,C. (1997), Managing In The Turbulent World of Economy, John Wiley & Sons Shapiro A.C. (1982), Multinational Financial Management, Allyn Bacon, Inc. Shapiro A.C. (1996), Multinational Financial Management, NJ 07458: Prentice Hall, Upper Saddle River Articles: Andresky Fraser J. (October, 1998), The Art of Cash Management. Boston

79
Bartov E. and Bodnar G.M, Firm Valuation (Dec. 1994(, Earnings Expectations and The Exchange – Rate Exposure Effect. The Journal Of Finance Batten J., Mellor T. and Wan V. (Fall 1993), Foreign Exchange Risk Management Practices and Products Used By Australian Firms. Journal Of International Business Studies Bergendahl G. (1985 and 1996), The Management of Foreign Exchange Exposures and Interest Rate Exposures in a number of British and Swedish firms, FE-rapport 1997:358, Department of Business Administration, Göteborg University Binder B. F. (April, 1997), Managing Financial Risk Into The 21st Century. CMA-The Management Accounting Magazine, V71 N3 P Bodnar G.M, Hayt G.S and Richard C (Winter 1998), Wharton Survey of Financial Risk Management by US Non-Financial Firms. Financial Management.Tampa Capel J. A. (1997), Real Options Approach to Economic Exposure Management. Journal of International Financial Management And Accounting 8:2 Chow E.H; Lee W.Y and Solt M.E (Summer 1997), The Economic Exposure Of U.S. Multinational Firms. The Journal Of Financial Research. Tempe. Copland T. and Copland M. (Autumn 1999), Managing Corporate FX risk: A Value maximizing Approach. Financial Management, Vol. 28 Issue 3

80
Copeland T. and Joshi Y. (May, 1996), Why Derivatives Do Not Reduce FX Risk. Corporate Finance Dhanani A. (March, 2000), To hedge or not to hedge. Management Accounting. London. Dumas, B. (June, 1978) The Theory of The Trading Firm Revisited. Journal of Finance Jalihand A., Switzer J.A. and Tang C. (1997), Risk Management Policies and Practices, Evidence on Canadian Non-financial Corporations, second draft Martin A.D. (May, 1999), Economic Exchange Rate Exposure of U.S.-Based MNCs Operating in Europe. Financial review, Vol. 34 Issue No.2 Millman G.J. (1998), The How of Dow, Managing Currency Risk. Financial Executive, Vol.14, No.6, Pringle J. (1995), A Look at Indirect Foreign Currency Exposure. Journal of Applied Corporate Finance, Vol.8, No.3 Smith C.W. and Stulz R.M. (Dec, 1985), The Determinants Of Firms’ Hedging Policies. Journal Of Financial And Quantitative Analysis V20 N4 Students’ thesis: L. Hong & M. Wannfors Euro Cash Pooling and Shared Financial Services

81
Annual reports: SKF Annual report 1999 Elof Hansson 1999 Annual report and consolidated accounts Interviews: SKF – Borje Lindeberg, Deputy Managing Director Elof Hansson – Hernrik Jerner, Treasurer

82
7. Appendix Questionnaire to the firm: 1. The company’s general characteristics:
• What is the company’s ownership? • What are the company’s size, main products, and major
markets? • What are the company’s main competitors in the local and in
the world market? • What are the firms’ top five markets, measured by the sales
volume and sales amounts?
Top five markets (outputs)
Sales amounts Sales volume
• What are the firm’s major suppliers?
Top five markets (inputs) Input amounts

83
2. Exchange rate risk exposure measurement.
• Has the company ever measured the exchange rate exposure? • If yes, how does the company measure the exposure? • What is the main purpose of exchange rate risk exposure
measurement (hedging, taking the advantage of exchange rate changes, any others)?
• What is the company’s currency of denomination? • Which kind of exposures (Transaction, translation,
accounting, Economic) is the company is measuring? 3. Exchange rate risk management strategy.
• Is the firm hedging the exchange rate risk exposure? • How often the company is measuring exchange rate risk
exposure (daily, weekly or monthly)? • What is the average period the company is hedging its foreign
exchange rate risk (90, 180, 360 days)? • What kind of instruments is the company using for hedging
(financial, natural, certain pricing strategies)? • What is the percentage of the exposure the company is usually
using for hedging? • Do they use a pricing strategy? If yes, how often the company
reviewing the pricing strategy period?

84
4. The monthly transaction exposure in the major currency Items January February Acc. Rec. Acc. Pay. Net Acc. Rec. Acc. Pay. SEK DEM JPY … 5. The monthly movements in the currency exchange rate during the last two years. For one US dollar:
Items Jan. Feb. Mar. April … SEK DEM JPY …
6. The firm’s accounting data of commercial cash flows and financial cash flows, total cash flows, sales revenues based on the monthly period during the last two years. (In the denominated currency) Items Jan. Feb. Mar. April … Commercial cash flow Financial cash flow Total cash flow Sales revenue
7. What are the main problems relative to this topic the firm is facing?