Financial Results Q1 FY18 - Jet Airways · Becomes the first Indian airline to partner with Airbnb...
14
-
Upload
nguyenlien -
Category
Documents
-
view
218 -
download
3
Transcript of Financial Results Q1 FY18 - Jet Airways · Becomes the first Indian airline to partner with Airbnb...
Financial Results Q1 FY18
12 September 2017
2
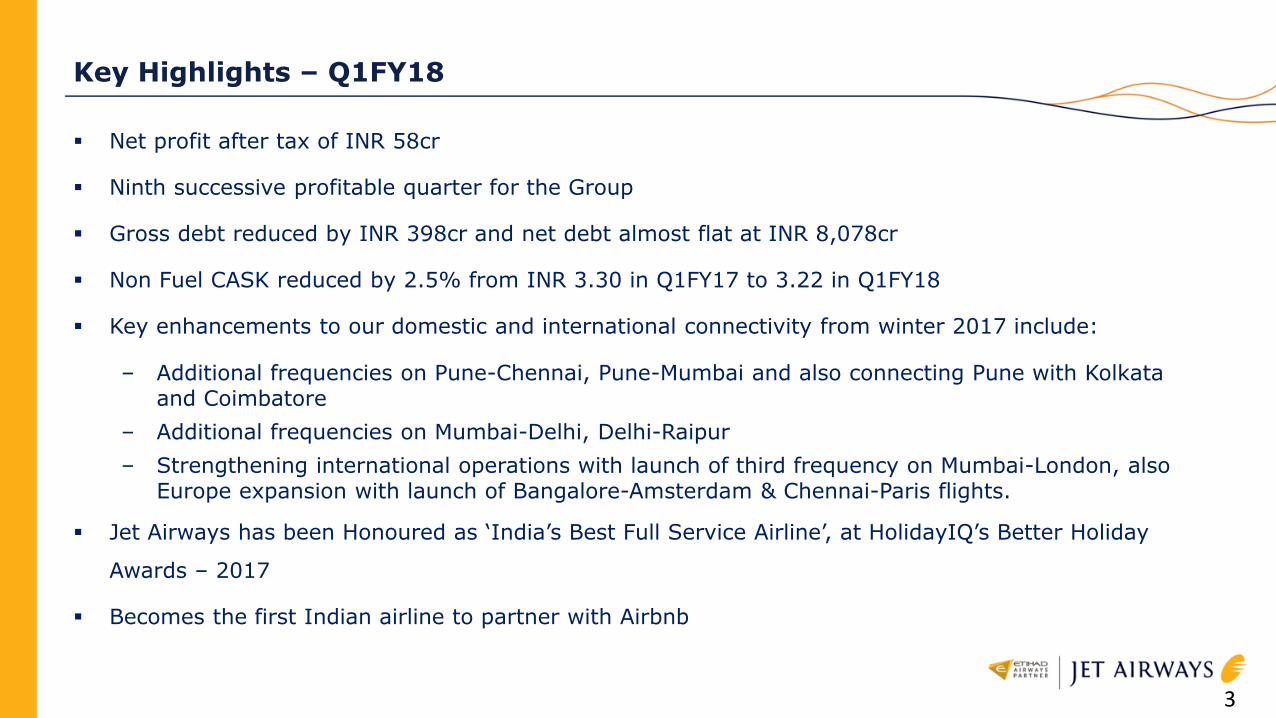
Key Highlights – Q1FY18
Net profit after tax of INR 58cr
Ninth successive profitable quarter for the Group
Gross debt reduced by INR 398cr and net debt almost flat at INR 8,078cr
Non Fuel CASK reduced by 2.5% from INR 3.30 in Q1FY17 to 3.22 in Q1FY18
Key enhancements to our domestic and international connectivity from winter 2017 include:
‒ Additional frequencies on Pune-Chennai, Pune-Mumbai and also connecting Pune with Kolkata and Coimbatore
‒ Additional frequencies on Mumbai-Delhi, Delhi-Raipur
‒ Strengthening international operations with launch of third frequency on Mumbai-London, also Europe expansion with launch of Bangalore-Amsterdam & Chennai-Paris flights.
Jet Airways has been Honoured as ‘India’s Best Full Service Airline’, at HolidayIQ’s Better Holiday
Awards – 2017
Becomes the first Indian airline to partner with Airbnb
3
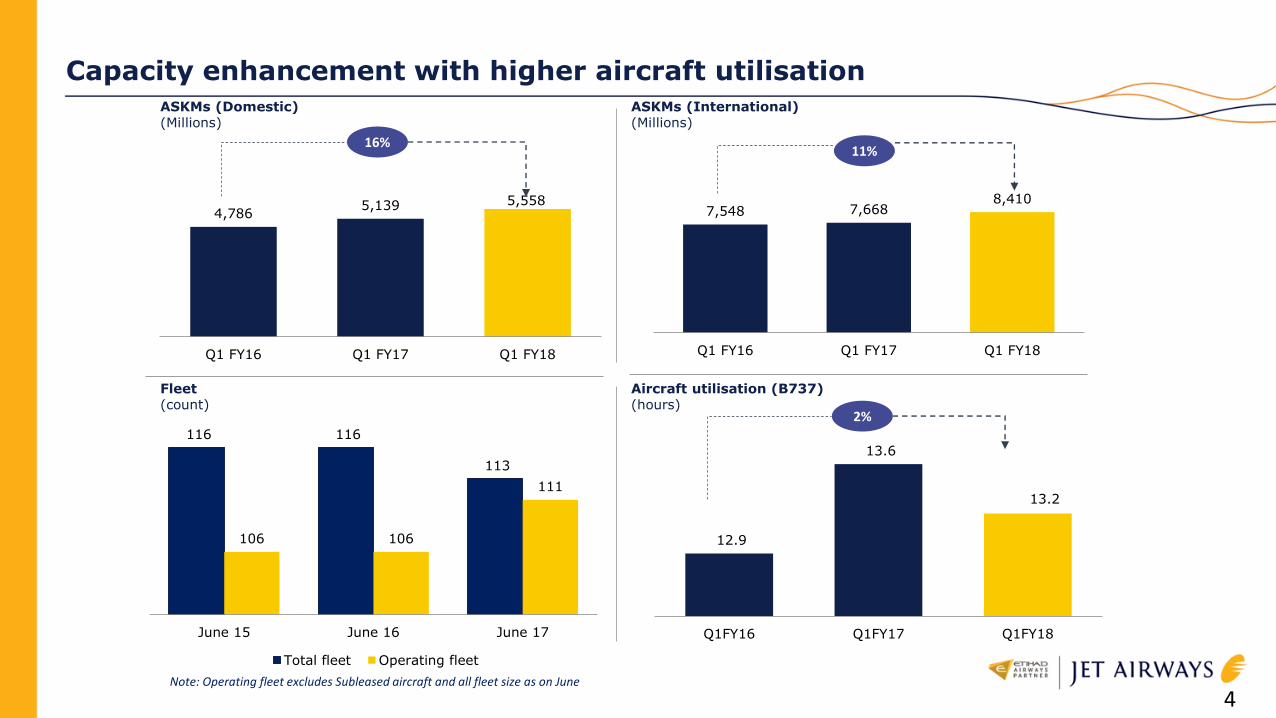
4,786 5,139 5,558
Q1 FY16 Q1 FY17 Q1 FY18
Capacity enhancement with higher aircraft utilisationASKMs (Domestic)(Millions)
ASKMs (International)(Millions)
Fleet(count)
Aircraft utilisation (B737)(hours)
16%11%
2%
7,548 7,668 8,410
Q1 FY16 Q1 FY17 Q1 FY18
116 116
113
106 106
111
June 15 June 16 June 17
Total fleet Operating fleet
4
12.9
13.6
13.2
Q1FY16 Q1FY17 Q1FY18
Note: Operating fleet excludes Subleased aircraft and all fleet size as on June
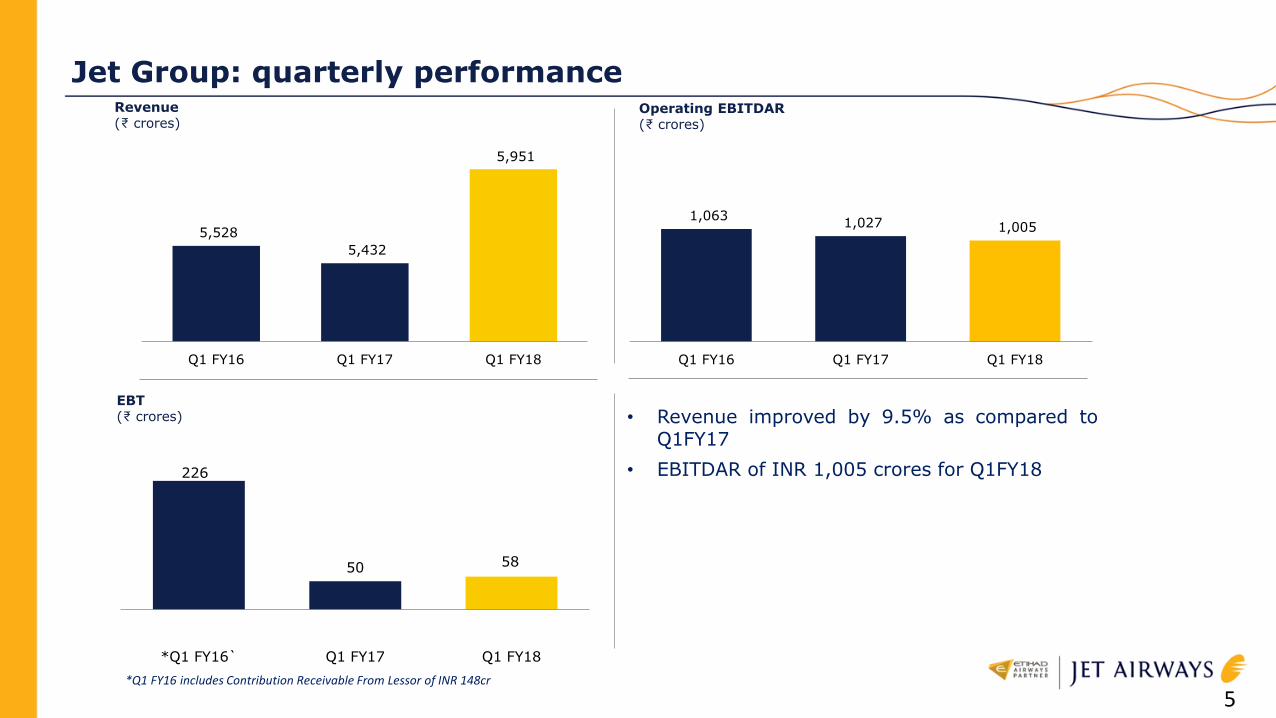
1,063 1,027 1,005
Q1 FY16 Q1 FY17 Q1 FY18
5,528
5,432
5,951
Q1 FY16 Q1 FY17 Q1 FY18
Jet Group: quarterly performance
5
Revenue(₹ crores)
Operating EBITDAR(₹ crores)
EBT(₹ crores)
226
50 58
*Q1 FY16` Q1 FY17 Q1 FY18
• Revenue improved by 9.5% as compared toQ1FY17
• EBITDAR of INR 1,005 crores for Q1FY18
*Q1 FY16 includes Contribution Receivable From Lessor of INR 148cr
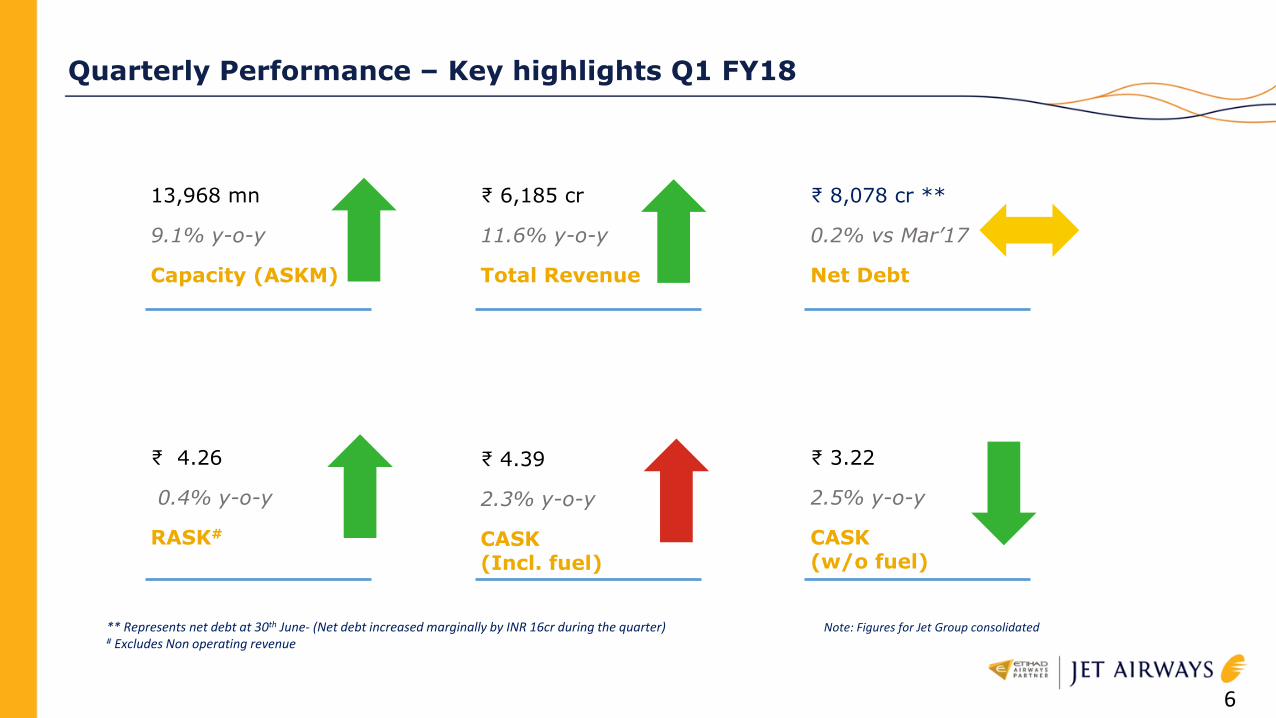
Quarterly Performance – Key highlights Q1 FY18
13,968 mn
9.1% y-o-y
Capacity (ASKM)
₹ 6,185 cr
11.6% y-o-y
Total Revenue
₹ 8,078 cr **
0.2% vs Mar’17
Net Debt
₹ 4.26
0.4% y-o-y
RASK#
₹ 4.39
2.3% y-o-y
CASK(Incl. fuel)
₹ 3.22
2.5% y-o-y
CASK (w/o fuel)
Note: Figures for Jet Group consolidated** Represents net debt at 30th June- (Net debt increased marginally by INR 16cr during the quarter)# Excludes Non operating revenue
6
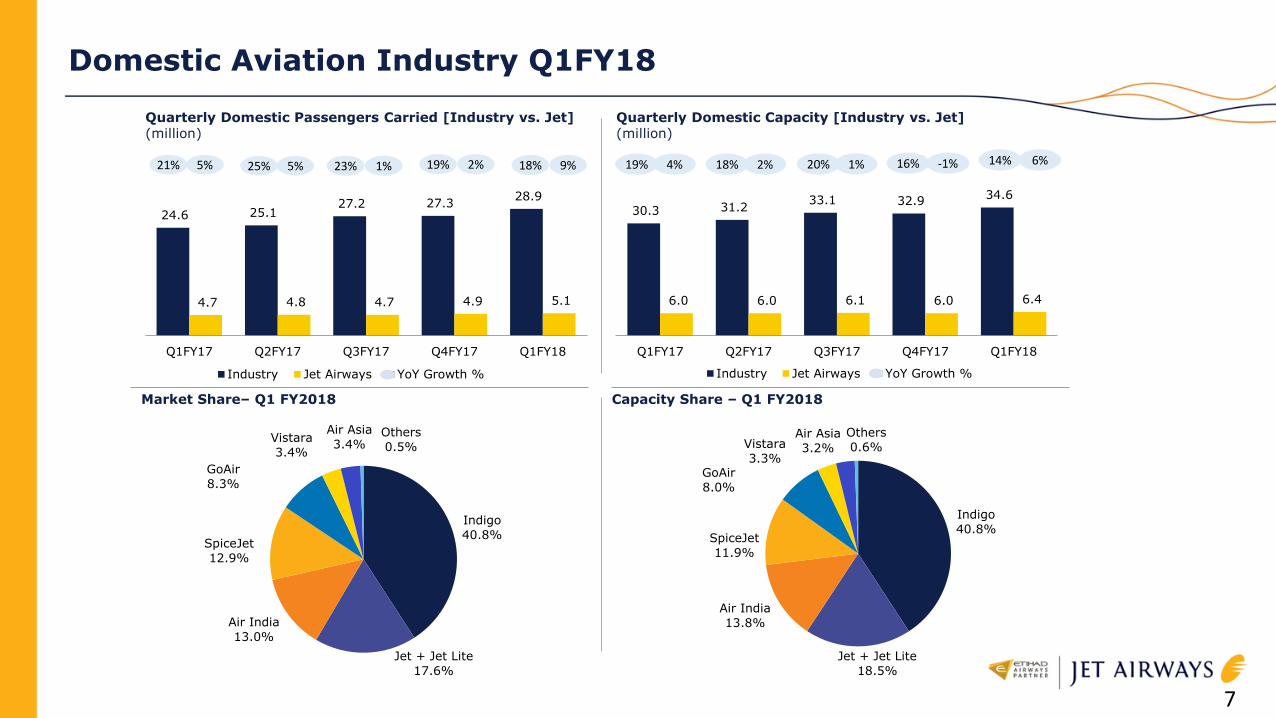
Domestic Aviation Industry Q1FY18
Indigo
40.8%
Jet + Jet Lite
18.5%
Air India
13.8%
SpiceJet
11.9%
GoAir
8.0%
Vistara
3.3%
Air Asia
3.2%
Others
0.6%
Quarterly Domestic Passengers Carried [Industry vs. Jet](million)
24.6 25.1 27.2 27.3
28.9
4.7 4.8 4.7 4.9 5.1
Q1FY17 Q2FY17 Q3FY17 Q4FY17 Q1FY18
Industry Jet Airways YoY Growth %
Capacity Share – Q1 FY2018
19% 2%
Quarterly Domestic Capacity [Industry vs. Jet](million)
30.3 31.2 33.1 32.9
34.6
6.0 6.0 6.1 6.0 6.4
Q1FY17 Q2FY17 Q3FY17 Q4FY17 Q1FY18
Industry Jet Airways YoY Growth %
16% -1%
Indigo
40.8%
Jet + Jet Lite
17.6%
Air India
13.0%
SpiceJet
12.9%
GoAir
8.3%
Vistara
3.4%
Air Asia
3.4%Others
0.5%
Market Share– Q1 FY2018
21% 5% 25% 5% 19% 4% 18% 2%
7
23% 1% 20% 1%18% 9% 14% 6%
Jet Group - Performance Highlights
8
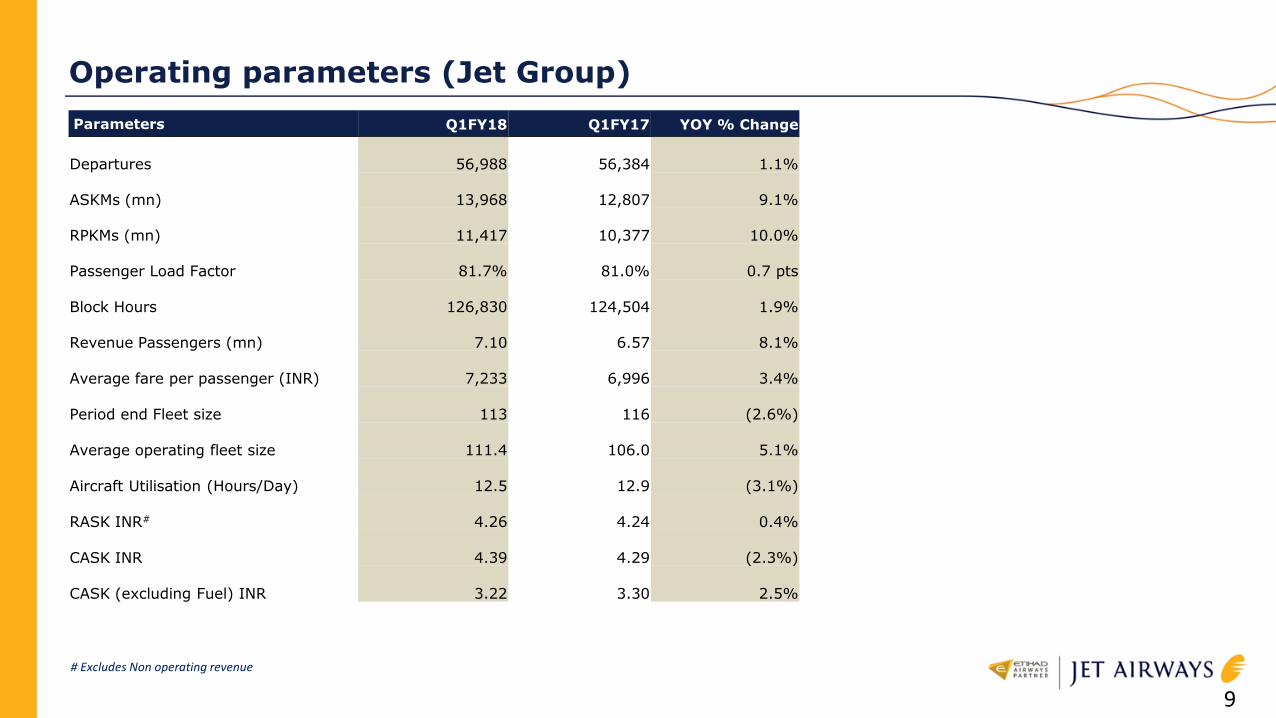
Operating parameters (Jet Group)
# Excludes Non operating revenue
9
Parameters Q1FY18 Q1FY17 YOY % Change
Departures 56,988 56,384 1.1%
ASKMs (mn) 13,968 12,807 9.1%
RPKMs (mn) 11,417 10,377 10.0%
Passenger Load Factor 81.7% 81.0% 0.7 pts
Block Hours 126,830 124,504 1.9%
Revenue Passengers (mn) 7.10 6.57 8.1%
Average fare per passenger (INR) 7,233 6,996 3.4%
Period end Fleet size 113 116 (2.6%)
Average operating fleet size 111.4 106.0 5.1%
Aircraft Utilisation (Hours/Day) 12.5 12.9 (3.1%)
RASK INR# 4.26 4.24 0.4%
CASK INR 4.39 4.29 (2.3%)
CASK (excluding Fuel) INR 3.22 3.30 2.5%
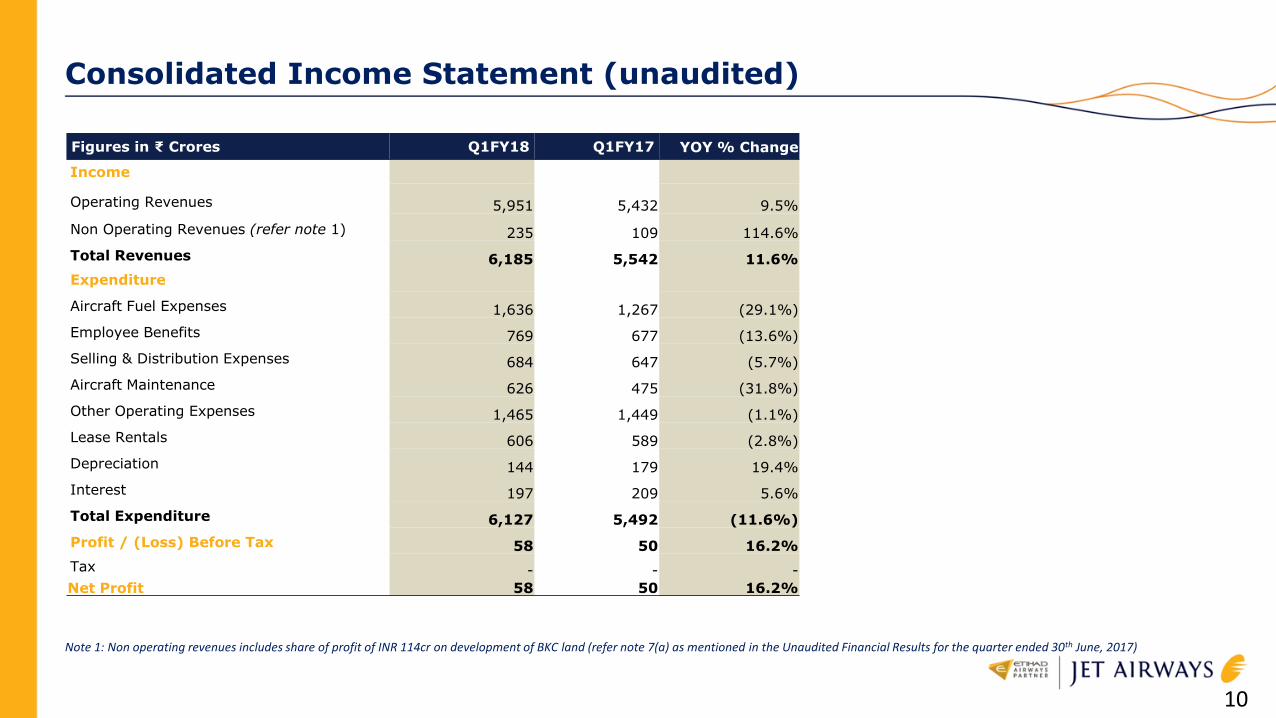
Consolidated Income Statement (unaudited)
10
Figures in ₹ Crores Q1FY18 Q1FY17 YOY % Change
Income
Operating Revenues 5,951 5,432 9.5%
Non Operating Revenues (refer note 1) 235 109 114.6%
Total Revenues 6,185 5,542 11.6%
Expenditure
Aircraft Fuel Expenses 1,636 1,267 (29.1%)
Employee Benefits 769 677 (13.6%)
Selling & Distribution Expenses 684 647 (5.7%)
Aircraft Maintenance 626 475 (31.8%)
Other Operating Expenses 1,465 1,449 (1.1%)
Lease Rentals 606 589 (2.8%)
Depreciation 144 179 19.4%
Interest 197 209 5.6%
Total Expenditure 6,127 5,492 (11.6%)
Profit / (Loss) Before Tax 58 50 16.2%
Tax - - -
Net Profit 58 50 16.2%
Note 1: Non operating revenues includes share of profit of INR 114cr on development of BKC land (refer note 7(a) as mentioned in the Unaudited Financial Results for the quarter ended 30th June, 2017)
Jet Airways - Standalone Performance Highlights
11
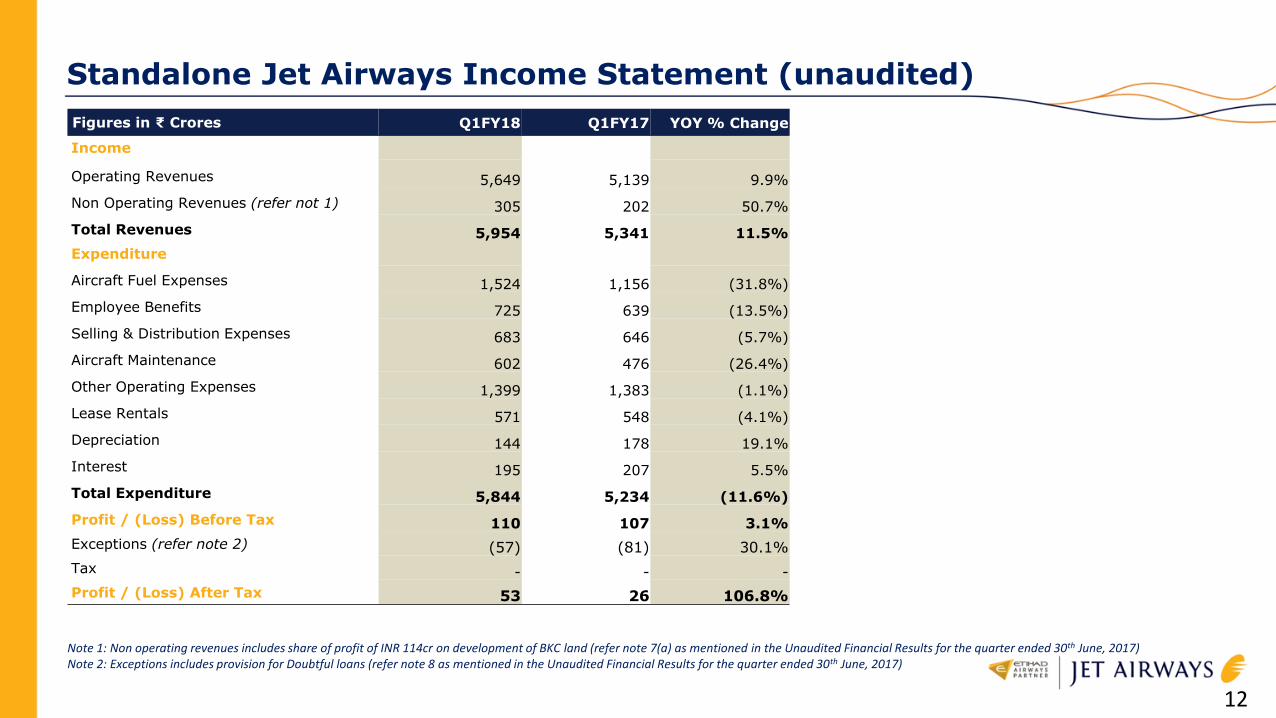
Figures in ₹ Crores Q1FY18 Q1FY17 YOY % Change
Income
Operating Revenues 5,649 5,139 9.9%
Non Operating Revenues (refer not 1) 305 202 50.7%
Total Revenues 5,954 5,341 11.5%
Expenditure
Aircraft Fuel Expenses 1,524 1,156 (31.8%)
Employee Benefits 725 639 (13.5%)
Selling & Distribution Expenses 683 646 (5.7%)
Aircraft Maintenance 602 476 (26.4%)
Other Operating Expenses 1,399 1,383 (1.1%)
Lease Rentals 571 548 (4.1%)
Depreciation 144 178 19.1%
Interest 195 207 5.5%
Total Expenditure 5,844 5,234 (11.6%)
Profit / (Loss) Before Tax 110 107 3.1%
Exceptions (refer note 2) (57) (81) 30.1%
Tax - - -
Profit / (Loss) After Tax 53 26 106.8%
Standalone Jet Airways Income Statement (unaudited)
12
Note 1: Non operating revenues includes share of profit of INR 114cr on development of BKC land (refer note 7(a) as mentioned in the Unaudited Financial Results for the quarter ended 30th June, 2017) Note 2: Exceptions includes provision for Doubtful loans (refer note 8 as mentioned in the Unaudited Financial Results for the quarter ended 30th June, 2017)
Thank You!
13
Certain statements in this release concerning Jet Airways’ future growth prospects are forward-looking statements, which involve a number of risks, and uncertainties that could cause actual results to differ
materially from those in such forward-looking statements. The risks and uncertainties relating to these statements include, but are not limited to, risks and uncertainties regarding fluctuations in earnings, our ability
to manage growth, intense competition in the aviation business including those factors which may affect our cost advantage, wage increases, our ability to attract and retain professionals, time and cost overruns on
various parameters, our ability to manage our international operations, liability for damages, withdrawal of governmental fiscal incentives, political instability, legal restrictions on raising capital, and general economic
conditions affecting our industry. Jet Airways may, from time to time, make additional written and oral forward-looking statements, including our reports to shareholders. Jet Airways does not undertake to update any
forward-looking statement that may be made from time to time by or on behalf of the company.
Disclaimer
14