Financial Results FY2017 (Ended March 2018) · FUJITSU GENERAL LIMITED 1 Financial Results FY2017...
20
FUJITSU GENERAL LIMITED 11 Financial Results FY2017 (Ended March 2018) April 2018 Fujitsu General Limited Any forward-looking statement in this report speaks only as of the date on which it is made; Forward-looking statements are based on the company's current assumptions regarding future business and financial performance; these statements by their nature address matters that are uncertain to different degrees. Forward-looking statements involve a number of risks, uncertainties and other factors that could cause actual results to be materially different. Note: This report is a translation of Japanese version. In case of any difference between English version and Japanese version, Japanese version shall prevail.
Transcript of Financial Results FY2017 (Ended March 2018) · FUJITSU GENERAL LIMITED 1 Financial Results FY2017...
FUJITSU GENERAL LIMITED
11
Financial ResultsFY2017 (Ended March 2018)
April 2018Fujitsu General Limited
Any forward-looking statement in this report speaks only as of the date on which it is made; Forward-looking statements are based on the company's current assumptions regarding future business and financial performance; these statements by their nature address matters that are uncertain to different degrees. Forward-looking statements involve a number of risks, uncertainties and other factors that could cause actual results to be materially different.
Note:
This report is a translation of Japanese version. In case of any difference between English version and Japanese version, Japanese version shall prevail.

FUJITSU GENERAL LIMITED
22Index
1. Financial Results for FY2017Sales by Segment ・・・・・・・・・・・・・・・・・・・・ 3A/C Sales by Geographic area ・・・・・・・・・・・・・・・・・ 4Consolidated Financial Results ・・・・・・・・・・・・・・・ 5Analysis of Consolidated Operating income [FY2017] (vs previous year)・・・ 6Segment information ・・・・・・・・・・・・・・・・・・・ 7Analysis of Financial Results・・・・・・・・・・・・・・・・・ 8Consolidated Balance Sheets ・・・・・・・・・・・・・・・・ 9Main Financial Data ・・・・・・・・・・・・・・・・・・・・ 10
2. Financial Plan for FY2018Sales by Segment ・・・・・・・・・・・・・・・・・・・・・ 11A/C Sales by Geographic area ・・・・・・・・・・・・・・ ・・・ 12Consolidated Financial Plan ・・・・・・・・・・・・・・・・・・ 13Analysis of Consolidated Operating income [FY2018] (vs previous year) ・・・ 14Segment Information, R&D Expenses,
Capital Expenditures, Depreciation Expenses ・・・・・・・・・・ 15Analysis of Financial Plan ・・・・・・・・・・・・・・・・・・ 16Analysis of Consolidated Operating income [FY2018 1st Half] (vs previous year) ・・・・・・・・・・・・・・・ 17<Reference Information> ・・・・・・・・・・・・・・・・・・・ 18

FUJITSU GENERAL LIMITED
3
Sales by Segment(Hundred Million Yen)
89% 2,324 89% 2,349 -% 25 -1% 1%
(555) (552) (-3) (-1%)
(1,769) (1,797) (28) (-1%)
(2%)
146 125 -21 -14%
Electronic devices 117 134 17 15%
10% 263 10% 259 -% -4 -1%
1% 14 1% 15 -% 1 6%
Total 100% 2,601 100% 2,623 -% 22 -1% 1%
Japan 32% 823 31% 812 -1% -11 -1%
Overseas 68% 1,778 69% 1,811 1% 33 2%
FY2016 FY2017
Actual
Change
Actual %
Air conditioners
Others
Telecommunications andElectronic devices
(Japan)
(Overseas)
Telecommunications
1.Financial Results for FY2017
〔Note1: subscripts(%) of sales is proportion to Total〕 〔Note2: subscripts(%) of change % is local currency base〕

FUJITSU GENERAL LIMITED
Greater China Greater ChinaAsia Asia
Oceania Oceania
Middle East and Africa Middle East and Africa
EuropeEurope
AmericasAmericas
JapanJapan
2,1902,331 2,324 2,349
0
700
1,400
2,100
2,800
FY2014 FY2015 FY2016 FY2017
%Local
cu rrency
base
Japan 23% 510 23% 529 24% 555 23% 552 -1% -3 -1% -1%
Americas 15% 333 14% 332 14% 329 15% 349 1% 20 6% 5%
Europe 19% 415 17% 403 19% 449 21% 494 2% 45 10% 4%
Middle East and Africa 17% 368 21% 490 17% 396 14% 337 -3% -59 -15% -14%
Oceania 10% 211 9% 216 10% 220 11% 252 1% 32 15% 10%
Asia 9% 188 9% 199 9% 202 7% 156 -2% -46 -23% -24%
Greater China 7% 165 7% 162 7% 173 9% 209 2% 36 21% 16%
Total 100% 2 ,190 100% 2 ,331 100% 2 ,324 100% 2 ,349 -% 25 1% -1%
(Overseas Total) (77%) (1 ,680) (77%) (1 ,802) (76%) (1 ,769 ) (77%) (1 ,797 ) (1%) ( 28 ) (2%) (-1%)
FY2017
ChangeFY2014 FY2015 FY2016
4
(Hundred Million Yen)
A/C Sales by Geographic area1.Financial Results for FY2017
【Sales by Geographic area】
〔Note1: sales to external customers 〕 〔Note2: subscripts(%) is proportion to Total〕
(Hundred Million Yen)

FUJITSU GENERAL LIMITED
5
(Hundred Million Yen)
Consolidated Financial Results
Foreign Exchange rate Average (Closing) Average (Closing) Average (Closing)
Yen/1USD 110 ( 112) 110 ( 106) - ( -6) Yen/1AUD 81 ( 86) 86 ( 82) 5 ( -4) Yen/1EUR 120 ( 120) 129 ( 131) 9 ( 11) BAHT/1USD 35.0 ( 34.3) 32.5 ( 31.1) -2.5 ( -3.2) RMB/1USD 6.69 ( 6.90) 6.65 ( 6.29) -0.04 ( -0.61)
Consolidated Statements of Income
5
〔Note: subscripts(%) of change % is local currency base 〕
Actual (ratio) Actual (ratio)
2,601 (100.0%) 2,623 (100.0%) 22 -1% 1%
787 (30.3%) 716 (27.3%) -71 -9%
265 (10.2%) 202 (7.7%) -63 -24%Non-operatingprofit or loss
-25 (-1.0%) -17 (-0.6%) 8 -%
(exchange gain and loss) (-28) (-1.1%) (-18) (-0.7%) (10) ( -%)
240 (9.2%) 185 (7.1%) -55 -23%
80 (3.1%) - ( -%) -80 -%
100 (3.9%) 129 (4.9%) 29 28% ※Net income attr ibutable to Owners of the Parent
¥95.88 ¥122.86 ¥26.98
Gross profit
Ordinary income
Net income※
FY 2016
%
Change
Net income per share
Extraordinary loss
FY 2017
Operating income
Net sales
1.Financial Results for FY2017
FUJITSU GENERAL LIMITED
6
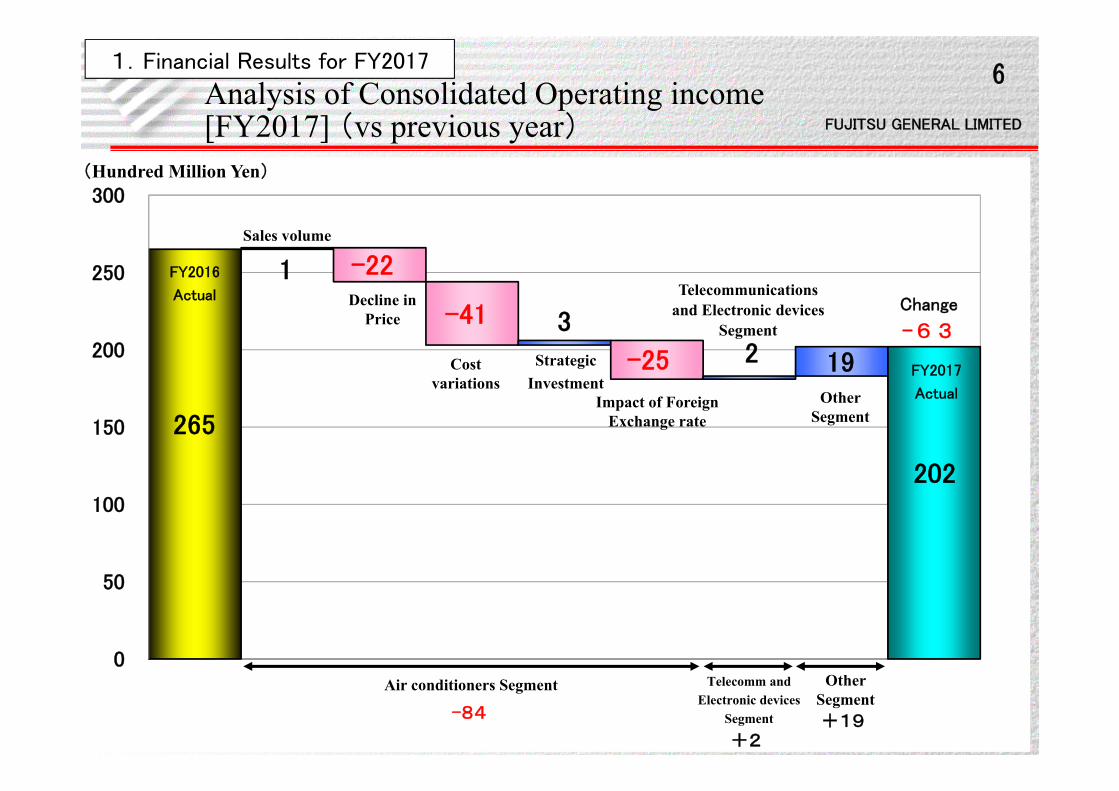
265
1 -22
-41 3
-25 2 19
202
▲100
▲50
-
50
100
150
200
250
300
0
50
100
150
200
250
300
<参考資料>
Analysis of Consolidated Operating income[FY2017] (vs previous year)
1.Financial Results for FY2017
(Hundred Million Yen)
FY2016
Actual
FY2017
Actual
Sales volume
Decline in Price
Cost variations
StrategicInvestment
Impact of Foreign Exchange rate
Telecommunications and Electronic devices
Segment
Other Segment
Change
-63
Air conditioners Segment Telecomm andElectronic devices
Segment
Other Segment
-84
+2+19

FUJITSU GENERAL LIMITED
77
Segment Information(Hundred Million Yen)
FY2016 FY2017
Actual Actual
Net sales 2,324 2,349 25 -1% 1%
Operating income 246 162 -84 -34%
(Operating income margin) (10.6%) (6.9%) (-3.7%)
Net sales 263 259 -4 -1%
Operating income 24 26 2 7%
(Operating income margin) (9.3%) (10.1%) (0.8%)
Net sales 14 15 1 6%
Operating income -5 14 19 -%
(Operating income margin) (-40.0%) (91.0%) (131.0%)
Net sales 2,601 2,623 22 -1% 1%
Operating income 265 202 -63 -24%
(Operating income margin) (10.2%) (7.7%) (-2.5%)
Total
Telecommunicationsand
Electronic devices
Change
Air conditioners
Others
%
〔Note1: sales to external customers〕 〔Note2: subscripts(%) of change % is local currency base〕
1.Financial Results for FY2017

FUJITSU GENERAL LIMITED
88
Analysis of Financial Results
<Sales>
・Air conditioners (Overseas) increased by 2.8 Billion Yen
<Operating income>
・Decreased by 8.4 Billion Yen ( down by 34% from previous year ).
Rising raw material and parts prices and currency appreciation in producing regions,
<Sales>
・Sales decreased by 0.4 Billion Yen ( down by 1% from previous year ).
<Operating income>
・Increased by 0.2 Billion Yen ( up by 7% from previous year ).
Improvement in composition of sales and cost effectiveness.
( up by 2%, down by 1% based on local currency from previous year ).
・Air conditioners (Japan) decreased by 0.3 Billion Yen
Telecommunicationsand
Electronic devices
change of external environment such as sales prices decline in the Middle East region.
( down by 1% from previous year ).Air Conditioners
1.Financial Results for FY2017

FUJITSU GENERAL LIMITED
9
(Hundred Million Yen)
Consolidated Balance Sheets
Actual ratio Actual ratio
Current assets 1,455 75% 1,591 76% 136
(408) (427) (19)
(714) (762) (48)
(233) (279) (46)
(100) (123) (23)
Noncurrent assets 484 25% 513 24% 29
Total assets 1,939 100% 2,104 100% 165
Current liabilities 785 41% 828 40% 43
(377) (448) (71)
(408) (380) (-28)
Noncurrent liabilities 197 10% 199 9% 2
Total liabilities 982 51% 1,027 49% 45
Shareholders' equity 891 46% 996 47% 105
37 2% 49 3% 12
Non-controlling interests 29 1% 32 1% 3
Total net assets 957 49% 1,077 51% 120
Total liabilities and net assets 1,939 100% 2,104 100% 165
Change
(Notes and accounts payable)
FY2016
(Notes and accounts receivable)
(Inventories)
(Others)
Accumulated other comprehensive income
(Others)
FY2017
(Cash and deposits)
1.Financial Results for FY2017

FUJITSU GENERAL LIMITED
1010
Main Financial Data(Hundred Million Yen)
%268 109 -159 -59%-49 -59 -10 19%219 50 -169 -77%
4.7% 121 4.9% 129 0.2% 8 6%55 64 9 15%54 51 -3 -6%
11.3% 13.0% 1.7% 47.8% 49.7% 1.9%
233 279 46 31.7days 37.8days 6.1days 74.5days 74.5days -
-0.44 -0.41 0.03
FY2017Actual
Capital Expenditures
FY2016
Inventory
Change
Shareholders' equity ratio
R&D Expense
Investing Cash FlowOperating Cash Flow
CCC*
ROE
Actual
Days Inventory Outstanding
Free Cash Flow
Depreciation Expense
Net D/E ratio (times)
〔Note: subscripts(%) is proportion to Net sales〕
*CCC (Cash Conversion Cycle): Days Sales Outstanding + Days Inventory Outstanding – Days Payable Outstanding
1.Financial Results for FY2017

FUJITSU GENERAL LIMITED
1111
Sales by Segment(Hundred Million Yen)
Air conditioners 1,108 1,241 89% 2,349 1,115 1,435 89% 2,550 2018%
9%
(Japan) (332) (220) (552) (355) (245) (600) (48) (9%)
(Overseas) (776) (1,021) (1,797) (760) (1,190) (1,950) (153)(8%)
(9%)
48 77 125 55 85 140 15 12%
67 67 134 70 70 140 6 4%
115 144 10% 259 125 155 10% 280 21 8%
Others 7 8 1% 15 10 10 1% 20 5 32%
Total 1,230 1,393 100% 2,623 1,250 1,600 100% 2,850 2278%
9%
Japan 449 363 31% 812 490 410 32% 900 88 11%
Overseas 781 1,030 69% 1,811 760 1,190 68% 1,950 139 8%
Telecommunications andElectronic devices
2nd Half1st Half 1st Half 2nd HalfFullYear
Telecommunications
FullYear
FY2017(Actual) FY2018(Plan)
Electronic devices
Change
FullYear
%
〔Note1: subscripts(%) is proportion to Total〕 〔Note2: subscripts(%) of change % is local currency base〕
2.Financial Plan for FY2018

FUJITSU GENERAL LIMITED
12
%Local
currencybase
Japan 332 220 552 355 245 600 23 25 48 9% 9% Americas 142 207 349 160 260 420 18 53 71 20% 20% Europe 229 265 494 220 285 505 -9 20 11 2% 2% Middle East and Africa 120 217 337 70 205 275 -50 -12 -62 -18% -18% Oceania 107 145 252 120 170 290 13 25 38 15% 16% Asia 63 93 156 55 145 200 -8 52 44 28% 26% Greater China 115 94 209 135 125 260 20 31 51 25% 21% Total 1,108 1,241 2,349 1,115 1,435 2,550 7 194 201 9% 8% (Overseas Total) (776) (1,021) (1,797) (760) (1,190) (1,950) (-16) (169) (153) (9%) (8%)
1st Half 2nd HalfFullYear
FullYear
1st Half 2nd HalfFullYear
ChangeFY2018 PlanFY2017 Actual
1st Half 2nd Half
Greater China
Asia
Oceania
Middle East and Africa
Europe
Americas
Japan
2,349 2,550
0
750
1,500
2,250
3,000
FY2017Actual
FY2018Plan
Greater ChinaAsia
Oceania
Middle East and Africa
Europe
Americas
Japan
1,108 1,115 1,241
1,435
0
400
800
1,200
1,600
FY20171st HalfActual
FY20181st Half
Plan
FY20172nd HalfActual
FY20182nd Half
Plan
(Hundred Million Yen)【Sales by Geographic area】
A/C Sales by Geographic area2.Financial Plan for FY2018
〔Note: sales to external customers 〕
(Hundred Million Yen)

FUJITSU GENERAL LIMITED
13
(Hundred Million Yen)
1,230 1,393 2,623 1,250 1,600 2,850 227 8% 9%
78 124 202 40 130 170 -32 -16%
(6.3%) (8.9%) (7.7%) (3.2%) (8.1%) (6.0%) (-1.7%)
81 104 185 40 130 170 -15 -8%
(6.6%) (7.5%) (7.1%) (3.2%) (8.1%) (6.0%) (-1.1%)
58 71 129 30 90 120 -9 -7%
(4.7%) (5.1%) (4.9%) (2.4%) (5.6%) (4.2%) (-0.7%)
※Net income attr ibutable to owners of the parent
12 12 24 13 13 26 2
(Net income margin※)
Operating income
(Ordinary income margin)
Change
FullYear
FullYear
2nd Half %
Net income※
Dividend per share (Yen)
(Operating income margin)
Ordinary income
Net sales
FY2017(Actual)
1st Half
FY2018(Plan)
2nd Half1st HalfFullYear
Consolidated Financial Plan
Foreign Exchange Rate (Average)Yen/1USD 111 110 110 110 110 110 -
Yen/1AUD 86 86 86 85 85 85 -1
Yen/1EUR 125 133 129 130 130 130 1
BAHT/1USD 33.8 31.7 32.5 32.0 32.0 32.0 -0.5
RMB/1USD 6.81 6.48 6.65 6.35 6.35 6.35 -0.30
19.5% 22.7%
〔Note2: subscripts(%) of dividend per share is dividend payout ratio〕
〔Note1: subscripts(%) of change % is local currency base〕
2.Financial Plan for FY2018

FUJITSU GENERAL LIMITED
14
202
63
-16-6 -25
-38
-1 -9
170
▲50
-
50
100
150
200
250
0
50
100
150
200
250
Analysis of consolidated Operating income[FY2018](vs previous year)
2.Financial Plan for FY2018
(Hundred Million Yen)
FY2017Actual
FY2018Plan
Change
-32
Sales volume
Decline in Price
Cost variations Strategic
Investment
Impact of Foreign Exchange rate
Telecommunications and Electronic devices
Segment
Other Segment
Air conditioners Segment Telecomm andElectronic devices
Segment
Other Segment
-22
-1-9

FUJITSU GENERAL LIMITED
1515
(Hundred Million Yen)
Net sales 1,108 1,241 2,349 1,115 1,435 2,550 201 8% 9%
Operating income 71 91 162 30 110 140 - 22 -14%
(Operating income margin) (6.4%) (7.3%) (6.9%) (2.7%) (7.7%) (5.5%) (-1.4%)
Net sales 115 144 259 125 155 280 21 8%
Operating income 5 21 26 5 20 25 - 1 -5%
(Operating income margin) (4.4%) (14.7%) (10.1%) (4.0%) (12.9%) (8.9%) (-1.2%)
Net sales 7 8 15 10 10 20 5 32%
Operating income 2 12 14 5 - 5 - 9 -64%
(Operating income margin) (21.9%) (161.1%) (91.0%) (50.0%) ( -%) (25.0%) (-66.0%)
Net sales 1,230 1,393 2,623 1,250 1,600 2,850 227 8% 9%
Operating income 78 124 202 40 130 170 - 32 -16%
(Operating income margin) (6.3%) (8.9%) (7.7%) (3.2%) (8.1%) (6.0%) (-1.7%)
62 67 129 65 70 135 6 5%
29 35 64 40 70 110 46 73%
25 26 51 27 28 55 4 9%
%
FY2017(Actual) FY2018(Plan) Change
1st Half 2nd HalfFullYear
FullYear
Capital Expenditures
1st Half 2nd HalfFullYear
Depreciation Expenses
Total
Telecommunicationsand
Electronic devices
Air conditioners
Others
R&D Expenses
Segment Information, R&D Expenses, Capital Expenditures, Depreciation Expenses
5.1%
〔Note1: sales to external customers〕 〔Note2: subscripts(%) of change % is local currency base〕
〔Note3: subscripts(%) is proportion to Net sales〕
4.8% 4..9% 5.2% 4.4% 4.7% -0.2%
2.Financial Plan for FY2018

FUJITSU GENERAL LIMITED
16
・Air conditioners (Overseas) increased by 15.3 Billion Yen
( up by 9%, up by 8% based on local currency from previous year ).
・Air conditioners (Japan) increased by 4.8 Billion Yen ( up by 9% from previous year ).
<Operating income>
・Decreased by 2.2 Billion Yen ( down by 14% from previous year ).
Although plan to increase air conditioners sales and reduction of cost in the whole company,
external environment such as unfavorable exchange rate and rising raw material prices
is expected to result in decrease of profit for the full year.
<Sales>
・Sales increased by 2.1 Billion Yen ( up by 8% from previous year ).
<Operating income>
・Decreased by 0.1 Billion Yen ( down by 5% from previous year ).
Investment amount 11.0 Billion Yen ( increased by 4.6 Billion, up by 73% from previous year ).
Including construction cost about 2.0 Billion Yen regarding Technology Research Building
in Kawasaki head office.
CapitalExpenditures
Air Conditioners
Telecommunicationsand
Electronic devices
<Sales>
Analysis of Financial Plan2.Financial Plan for FY2018

FUJITSU GENERAL LIMITED
17
78
9 -15
-8
1
-28
-3
40
▲40
▲20
-
20
40
60
80
100
0
50
100
―
2.Financial Plan for FY2018
(Hundred Million Yen)
FY2017
1st Half
Actual
FY2018
1st Half
Plan
Sales volume
Decline in Price
Cost variations
StrategicInvestment
Impact of Foreign Exchange rate
Telecommunications and Electronic devices
Segment
Other Segment
Change
-38
-41 +3
Air conditioners Segment Telecomm andElectronic devices
Segment
Other Segment
Analysis of consolidated Operating income[FY2018 1st Half](vs previous year)
FUJITSU GENERAL LIMITED
18
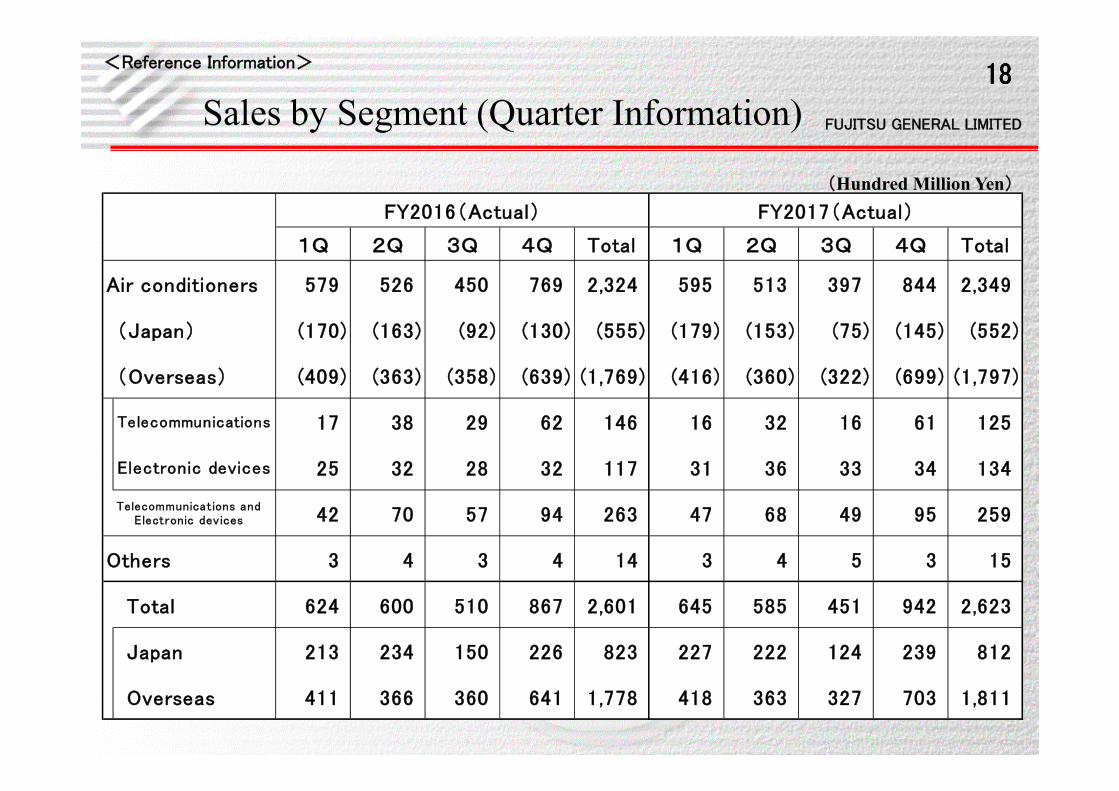
1Q 2Q 3Q 4Q Total 1Q 2Q 3Q 4Q Total
Air conditioners 579 526 450 769 2,324 595 513 397 844 2,349
(Japan) (170) (163) (92) (130) (555) (179) (153) (75) (145) (552)
(Overseas) (409) (363) (358) (639) (1,769) (416) (360) (322) (699) (1,797)
17 38 29 62 146 16 32 16 61 125
25 32 28 32 117 31 36 33 34 134
42 70 57 94 263 47 68 49 95 259
Others 3 4 3 4 14 3 4 5 3 15
Total 624 600 510 867 2,601 645 585 451 942 2,623
Japan 213 234 150 226 823 227 222 124 239 812
Overseas 411 366 360 641 1,778 418 363 327 703 1,811
Telecommunications andElectronic devices
FY2016(Actual)
Telecommunications
Electronic devices
FY2017(Actual)
18
Sales by Segment (Quarter Information)<Reference Information>
(Hundred Million Yen)

FUJITSU GENERAL LIMITED
19
1Q 2Q 3Q 4Q Total 1Q 2Q 3Q 4Q Total
624 600 510 867 2,601 645 585 451 942 2,623
92 34 33 106 265 68 10 1 123 202
(14.8%) (5.6%) (6.6%) (12.2%) (10.2%) (10.5%) (1.8%) (0.3%) (13.0%) (7.7%)
62 27 55 96 240 74 7 - 104 185
(9.9%) (4.4%) (10.9%) (11.0%) (9.2%) (11.5%) (1.2%) (0.1%) (11.1%) (7.1%)
41 16 -29 72 100 56 2 -3 74 129
(6.6%) (2.7%) (-5.9%) (8.4%) (3.9%) (8.6%) (0.4%) (-0.6%) (7.8%) (4.9%)
<Supplementary Information>A/C Sales by Geographic area(Quarter Information)
1Q 2Q 3Q 4Q Total 1Q 2Q 3Q 4Q Total
Japan 170 163 92 130 555 179 153 75 145 552
Americas 51 69 71 138 329 59 83 57 150 349
Europe 151 98 62 138 449 153 76 89 176 494
68 70 102 156 396 57 63 59 158 337
Oceania 35 53 54 78 220 37 70 63 82 252
55 30 37 80 202 45 18 9 84 156
49 43 32 49 173 65 50 45 49 209
579 526 450 769 2,324 595 513 397 844 2,349
(409) (363) (358) (639) (1,769) (416) (360) (322) (699) (1,797)
Asia
FY2017(Actual)
Net salesOperating income
※Net income attr ibutable to owners of the parent
(Overseas Total)
Greater China
(Net income margin※)
Ordinary income
Total
FY2017(Actual)
(Ope rat in g in come margin)
Middle East and Africa
FY2016(Actual)
FY2016(Actual)
(Ordinary i ncome marg i n)
Net income※
〔Note: sales to external customers 〕
19Consolidated Statements of Income(Quarter Information)
<Reference Information>
(Hundred Million Yen)

FUJITSU GENERAL LIMITED
20
106
26-1 -5
3
-26 4 16
123
▲40
▲20
-
20
40
60
80
100
120
140
0
50
100
150
Telecommunications and Electronic devices
Segment
Change
+17
+4-3 +16
Analysis of consolidated Operating income[FY2017 4th Quarter](vs previous year)
FY2016
4Q
Actual
FY2017
4Q
Actual
(Hundred Million Yen)
Sales volume
Decline in Price
Cost variations
Strategic Investment
Impact of Foreign Exchange rate Other
Segment
Air conditioners Segment Telecomm andElectronic devices
Segment
Other Segment
<Reference Information>