Financial Results FY2014 3 QuarterFY2013 3Q FY2014 3Q % change Net sales 251,384 260,709 3.7...
30
Financial Results FY2014 3 rd Quarter February 10, 2015 Nippon Television Holdings, Inc.
Transcript of Financial Results FY2014 3 QuarterFY2013 3Q FY2014 3Q % change Net sales 251,384 260,709 3.7...

Financial Results
FY2014 3rd Quarter
February 10, 2015
Nippon Television Holdings, Inc.
Statements made in this presentation with regards to Nippon TV’s
current plans, strategies, and beliefs as well as other statements that
are not historical facts are forward-looking statements.
Such forward-looking statements are based on management’s
assumptions and beliefs in light of the information currently available.
These forward-looking statements involve risks and uncertainties that
could cause actual results to differ materially. As such, one should not
place undue reliance on them. We do not intend to update these
forward-looking statements, whether as a result of new information,
future events or otherwise, except when required by applicable laws.
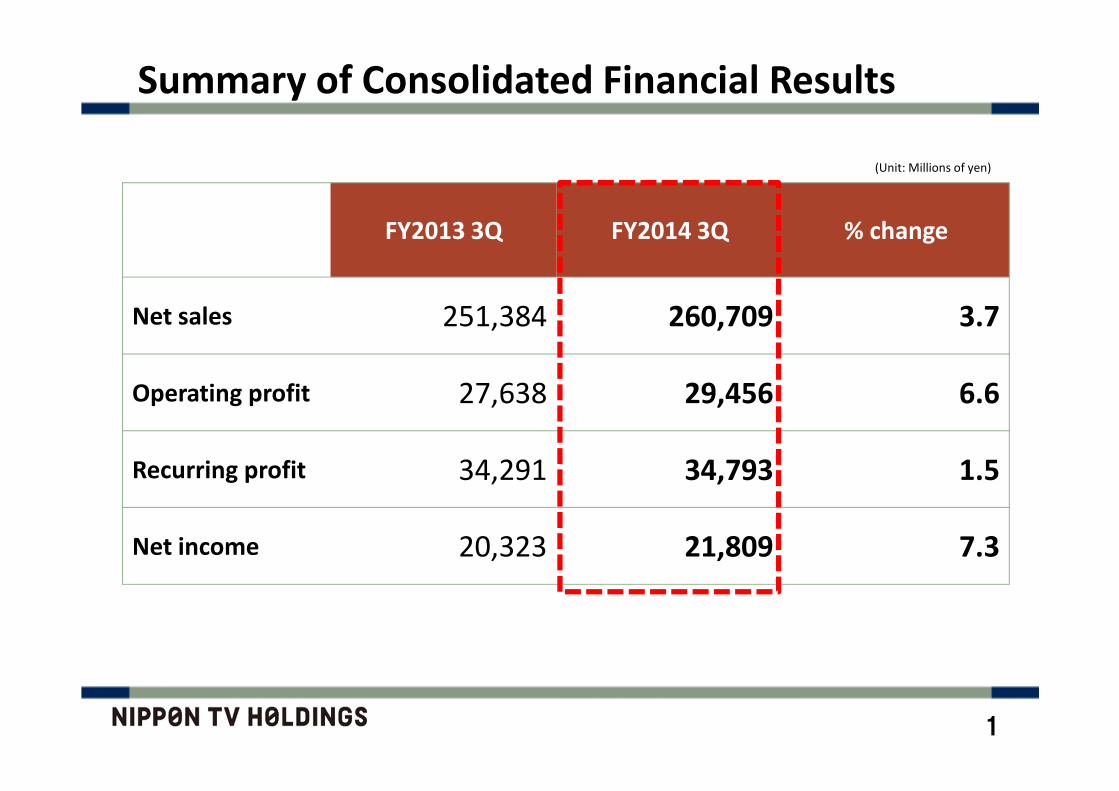
FY2013 3Q FY2014 3Q % change
Net sales 251,384 260,709 3.7
Operating profit 27,638 29,456 6.6
Recurring profit 34,291 34,793 1.5
Net income 20,323 21,809 7.3
Summary of Consolidated Financial Results
(Unit: Millions of yen)
1
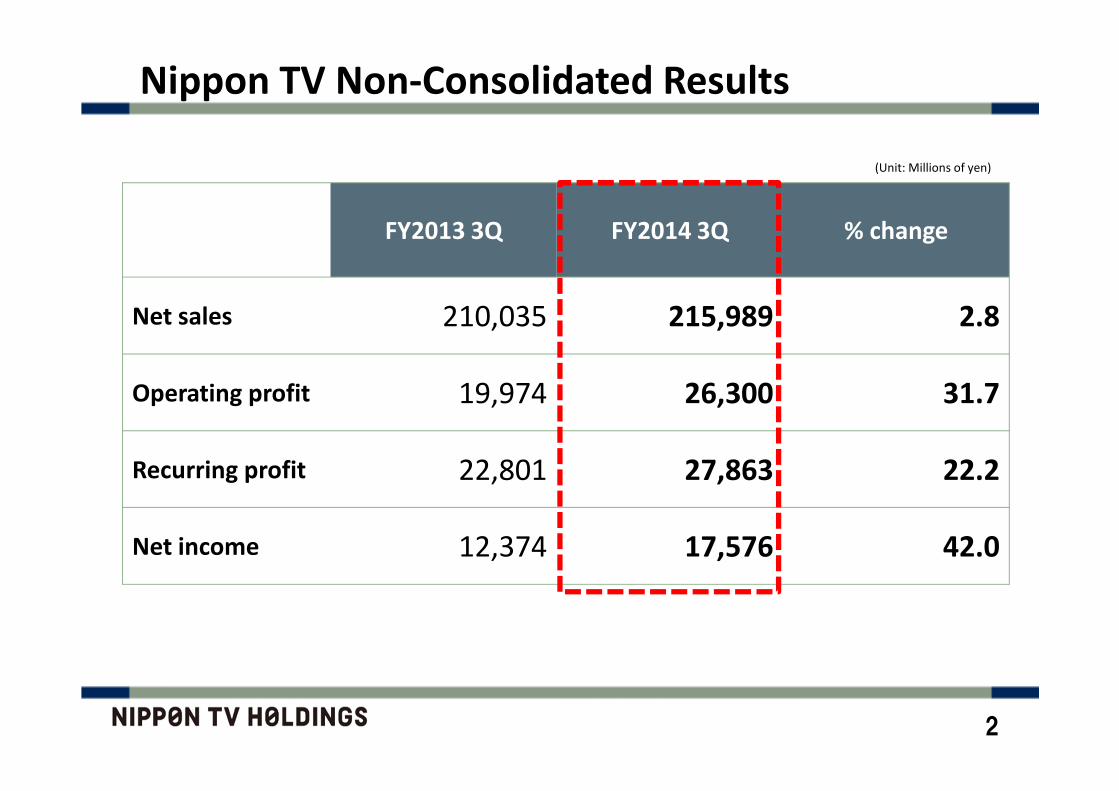
FY2013 3Q FY2014 3Q % change
Net sales 210,035 215,989 2.8
Operating profit 19,974 26,300 31.7
Recurring profit 22,801 27,863 22.2
Net income 12,374 17,576 42.0
(Unit: Millions of yen)
Nippon TV Non-Consolidated Results
2
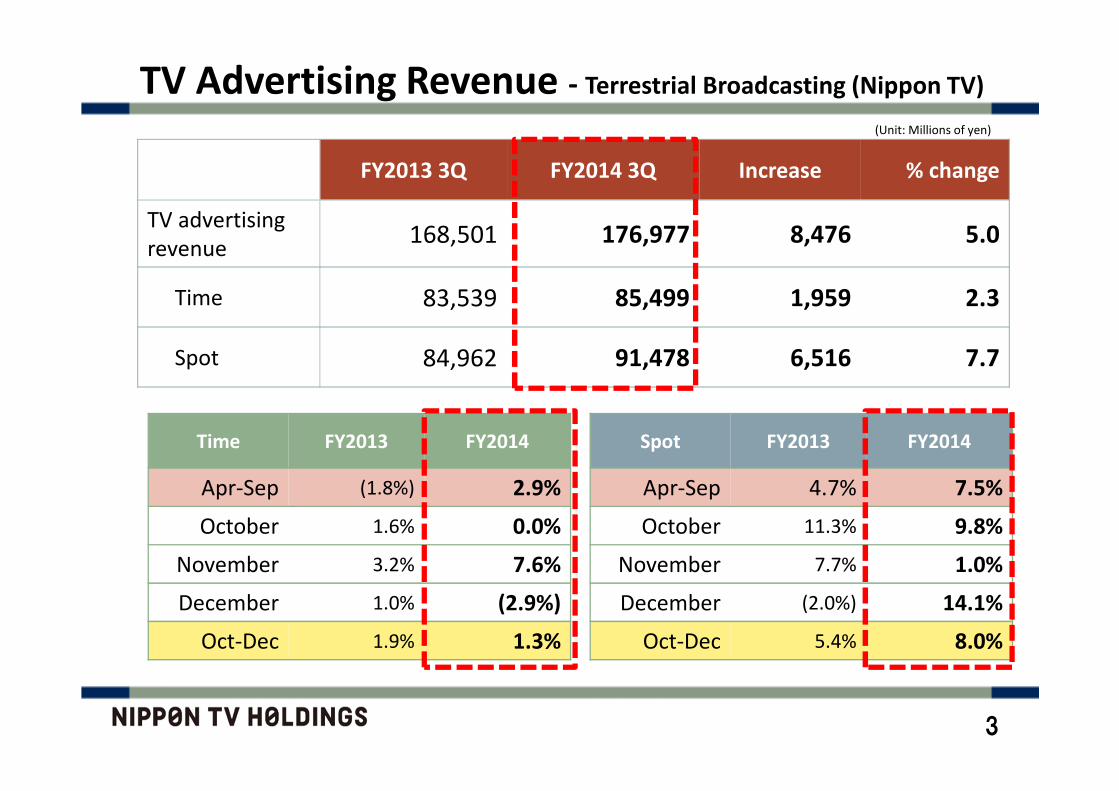
FY2013 3Q FY2014 3Q Increase % change
TV advertising
revenue168,501 176,977 8,476 5.0
Time 83,539 85,499 1,959 2.3
Spot 84,962 91,478 6,516 7.7
(Unit: Millions of yen)
TV Advertising Revenue - Terrestrial Broadcasting (Nippon TV)
3
Time FY2013 FY2014
Apr-Sep (1.8%) 2.9%
October 1.6% 0.0%
November 3.2% 7.6%
December 1.0% (2.9%)
Oct-Dec 1.9% 1.3%
Spot FY2013 FY2014
Apr-Sep 4.7% 7.5%
October 11.3% 9.8%
November 7.7% 1.0%
December (2.0%) 14.1%
Oct-Dec 5.4% 8.0%
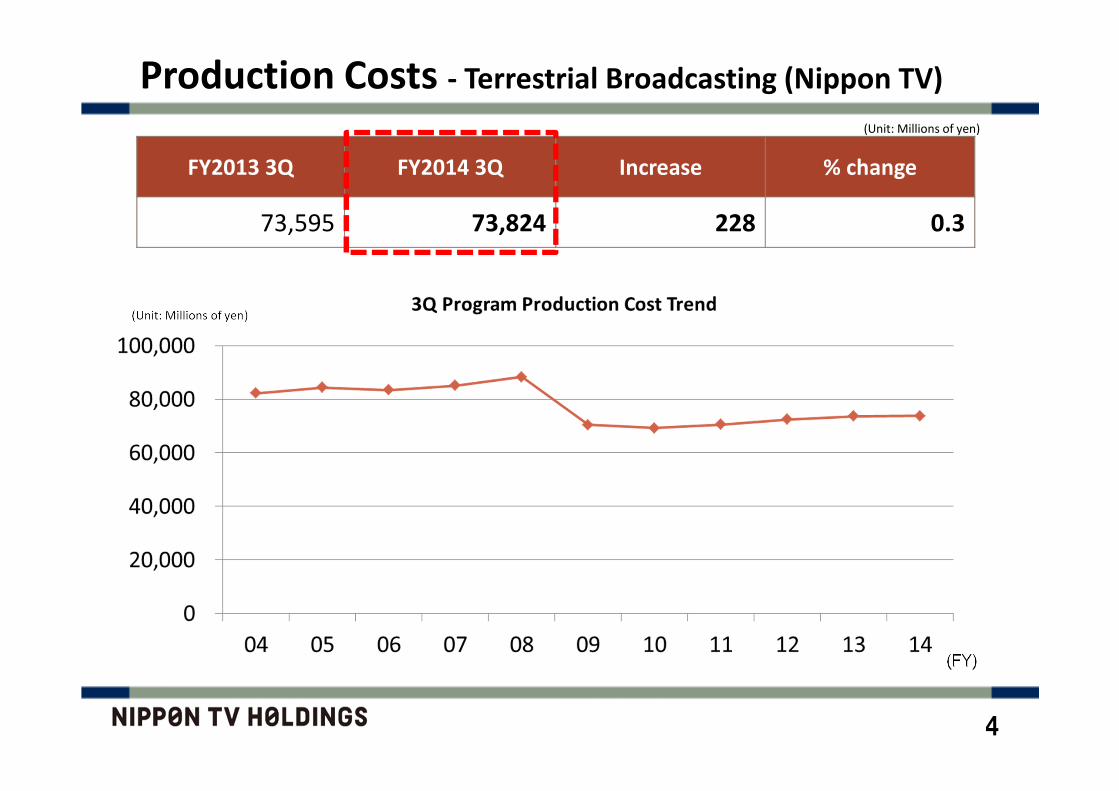
Production Costs - Terrestrial Broadcasting (Nippon TV)
FY2013 3Q FY2014 3Q Increase % change
73,595 73,824 228 0.3
(FY)
(Unit: Millions of yen)
(Unit: Millions of yen)
4
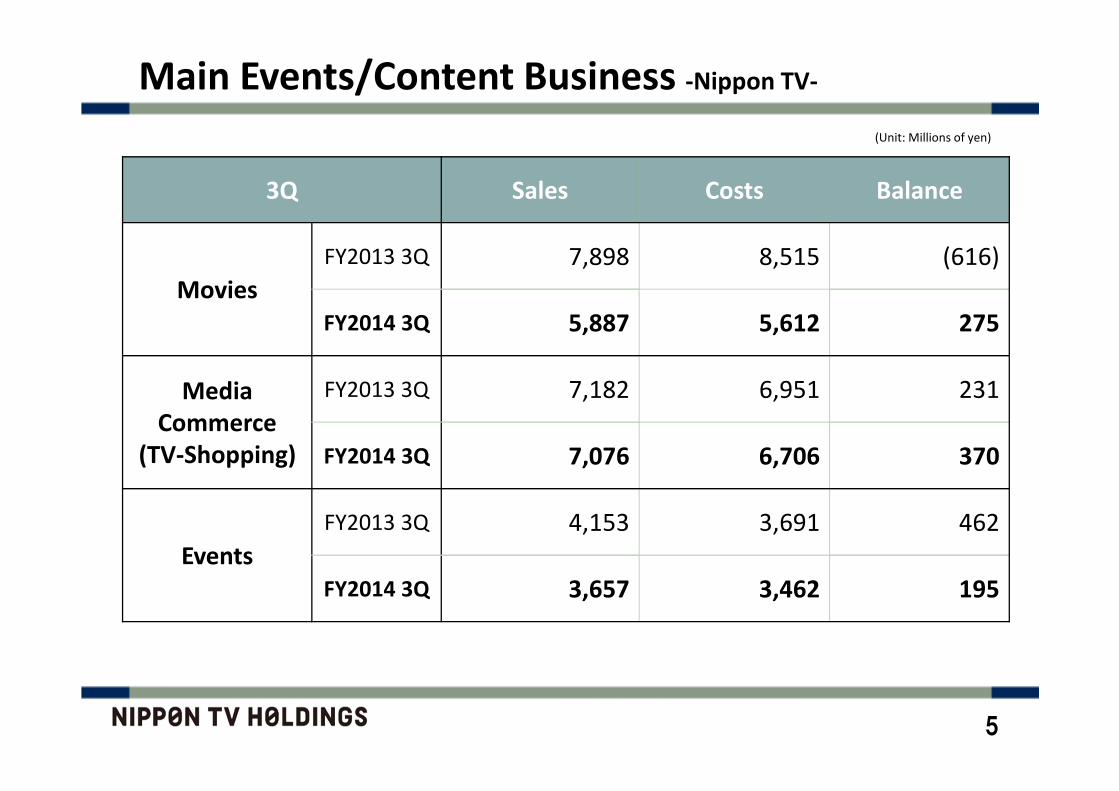
3Q Sales Costs Balance
Movies
FY2013 3Q 7,898 8,515 (616)
FY2014 3Q 5,887 5,612 275
Media
Commerce
(TV-Shopping)
FY2013 3Q 7,182 6,951 231
FY2014 3Q 7,076 6,706 370
Events
FY2013 3Q 4,153 3,691 462
FY2014 3Q 3,657 3,462 195
(Unit: Millions of yen)
Main Events/Content Business -Nippon TV-
5

FY2014 3Q Net sales Operating profit Recurring profit Net income
%chg %chg %chg %chg
BS Nippon Corp. 11,132 6.2 1,848 (10.1) 1,925 (10.1) 1,226 (32.1)
CS Nippon Corp. 4,029 6.1 590 16.8 608 16.9 360 12.2
NTV Technical Resources Inc. 7,717 1.8 293 21.2 323 17.8 216 29.1
NTV AX-ON 15,600 1.2 1,013 (14.0) 1,031 (13.5) 648 (10.2)
NTV EVENTS Inc. 2,065 4.1 123 (16.4) 129 (15.8) 81 (11.9)
Nippon Television Art Inc. 6,115 (1.2) 283 7.8 300 7.4 191 11.6
Nippon Television Music Corp. 7,925 8.6 1,227 5.0 1,293 (7.8) 839 (3.6)
VAP Inc. 11,110 (29.0) (1,419) ---- (1,309) ---- (1,311) ----
NTV Service Inc. 2,775 (20.6) 196 (47.8) 217 (45.2) 136 (43.6)
Nippon Television Work 24 Corp. 3,151 7.6 108 41.9 109 31.2 65 38.3
Forecast Communications Inc. 2,139 (7.4) 58 (31.5) 117 43.5 67 36.9
NitteleSeven 3,686 18.0 167 (1.9) 172 (0.3) 108 3.4
TATSUNOKO PRODUCTION Co., Ltd. 1,528 ---- 137 ---- 138 ---- 83 ----
(Unit: Millions of yen, rounded down)
Financial Highlights of Group Companies
6
※ TATSUNOKO was acquired in 4Q FY2013; hence, YoY comparison is not available
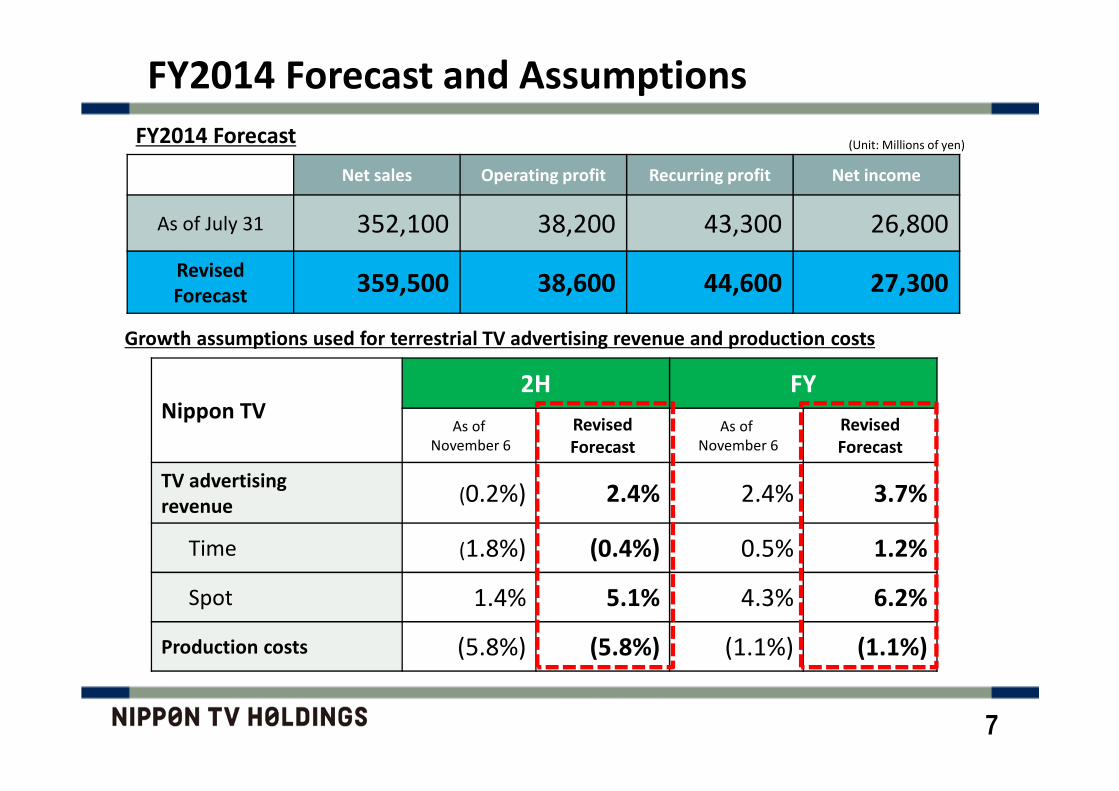
Nippon TV2H FY
As of
November 6
Revised
Forecast
As of
November 6
Revised
Forecast
TV advertising
revenue(0.2%) 2.4% 2.4% 3.7%
Time (1.8%) (0.4%) 0.5% 1.2%
Spot 1.4% 5.1% 4.3% 6.2%
Production costs (5.8%) (5.8%) (1.1%) (1.1%)
FY2014 Forecast
Net sales Operating profit Recurring profit Net income
As of July 31 352,100 38,200 43,300 26,800
Revised
Forecast359,500 38,600 44,600 27,300
7
FY2014 Forecast and Assumptions
(Unit: Millions of yen)
Growth assumptions used for terrestrial TV advertising revenue and production costs

Viewer Ratings
☆☆☆☆Triple Crown Winner for 2014 Annual Viewer Ratings!・Monthly Triple Crown winner for 14 months straight from Dec
2013 to Jan 2015.
・Consecutive Triple Crown winner for Jan, Apr, Jul, and Oct cool.
・Strength in both household and individual viewer ratings.
→Captured the viewership of audiences who are prime target of sponsors.
☆☆☆☆Enjoying the Results of Our Programming Improvements・All Day, Prime Time, Golden Time, and Platinight ratings increase→Maintained high ratings across the board from morning to late night
・Stellar ratings in Kanto region and regional network stations→Annual Triple Crown winner in 24 out of 27 regions
☆☆☆☆On Track to Win 2014 Fiscal Year Triple Crown Title!
8
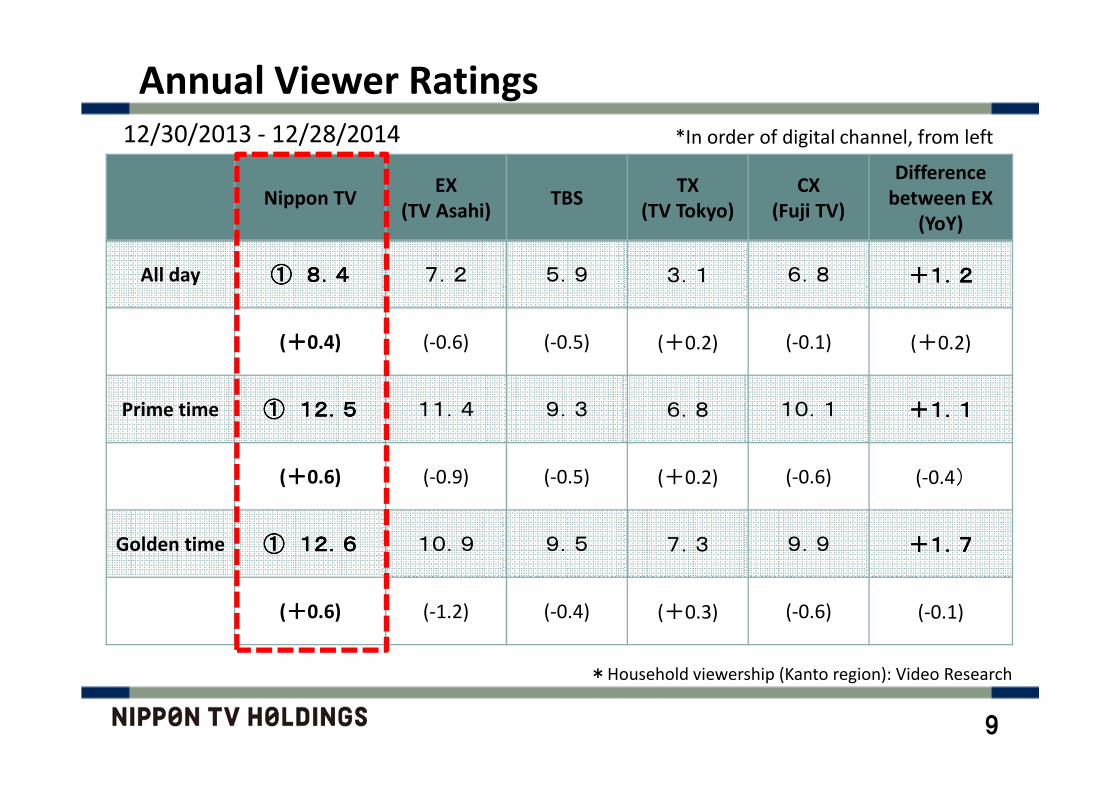
12/30/2013 - 12/28/2014
Nippon TVEX
(TV Asahi)TBS
TX
(TV Tokyo)
CX
(Fuji TV)
Difference
between EX
(YoY)
All day ①①①① 8.48.48.48.4 7.2 5.9 3.1 6.8 +1.2+1.2+1.2+1.2
(++++0.4) (-0.6) (-0.5) (+0.2) (-0.1) (+0.2)
Prime time ①①①① 12.512.512.512.5 11.4 9.3 6.8 10.1 +1.1+1.1+1.1+1.1
(++++0.6) (-0.9) (-0.5) (+0.2) (-0.6) (-0.4)
Golden time ①①①① 12.612.612.612.6 10.9 9.5 7.3 9.9 +1.7+1.7+1.7+1.7
(++++0.6) (-1.2) (-0.4) (+0.3) (-0.6) (-0.1)
Annual Viewer Ratings
*In order of digital channel, from left
9
*Household viewership (Kanto region): Video Research
10
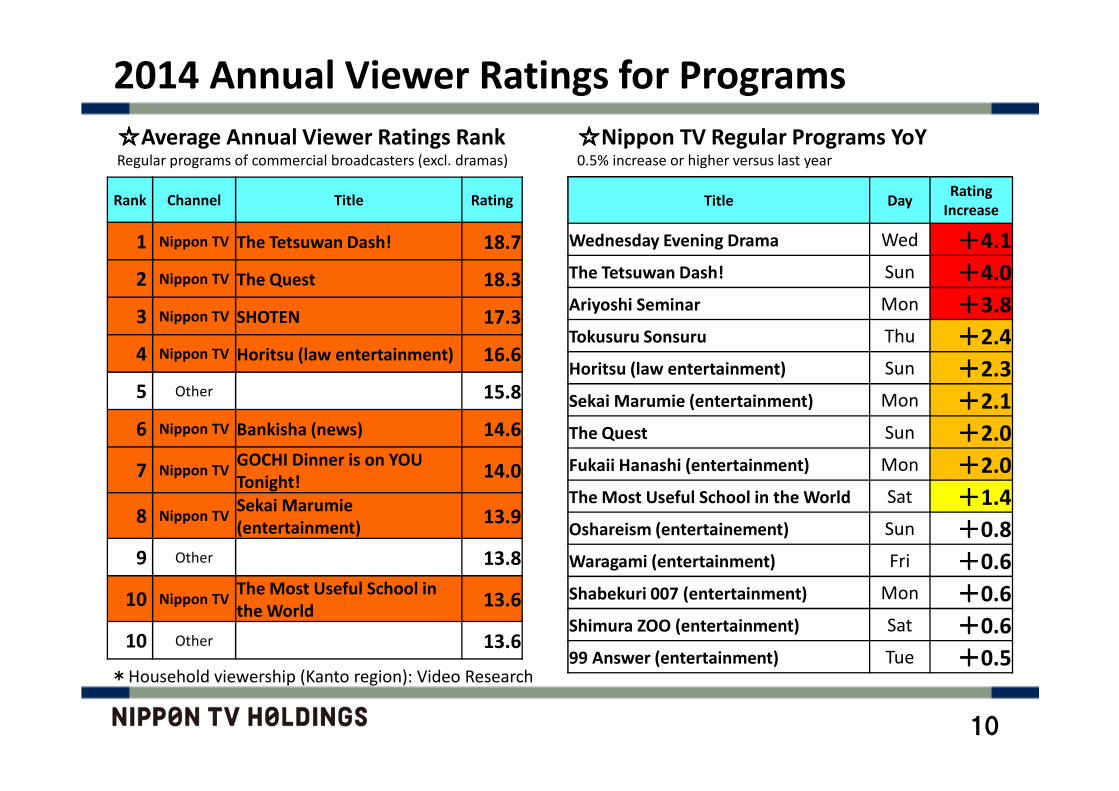
2014 Annual Viewer Ratings for Programs
Rank Channel Title Rating
1 Nippon TV The Tetsuwan Dash! 18.7
2 Nippon TV The Quest 18.3
3 Nippon TV SHOTEN 17.3
4 Nippon TV Horitsu (law entertainment) 16.6
5 Other 15.8
6 Nippon TV Bankisha (news) 14.6
7 Nippon TVGOCHI Dinner is on YOU
Tonight!14.0
8 Nippon TVSekai Marumie
(entertainment)13.9
9 Other 13.8
10 Nippon TVThe Most Useful School in
the World13.6
10 Other 13.6
☆☆☆☆Average Annual Viewer Ratings RankRegular programs of commercial broadcasters (excl. dramas)
☆☆☆☆Nippon TV Regular Programs YoY0.5% increase or higher versus last year
Title DayRating
Increase
Wednesday Evening Drama Wed ++++4.1
The Tetsuwan Dash! Sun ++++4.0
Ariyoshi Seminar Mon ++++3.8
Tokusuru Sonsuru Thu ++++2.4
Horitsu (law entertainment) Sun ++++2.3
Sekai Marumie (entertainment) Mon ++++2.1
The Quest Sun ++++2.0
Fukaii Hanashi (entertainment) Mon ++++2.0
The Most Useful School in the World Sat ++++1.4
Oshareism (entertainement) Sun ++++0.8
Waragami (entertainment) Fri ++++0.6
Shabekuri 007 (entertainment) Mon ++++0.6
Shimura ZOO (entertainment) Sat ++++0.6
99 Answer (entertainment) Tue ++++0.5 *Household viewership (Kanto region): Video Research
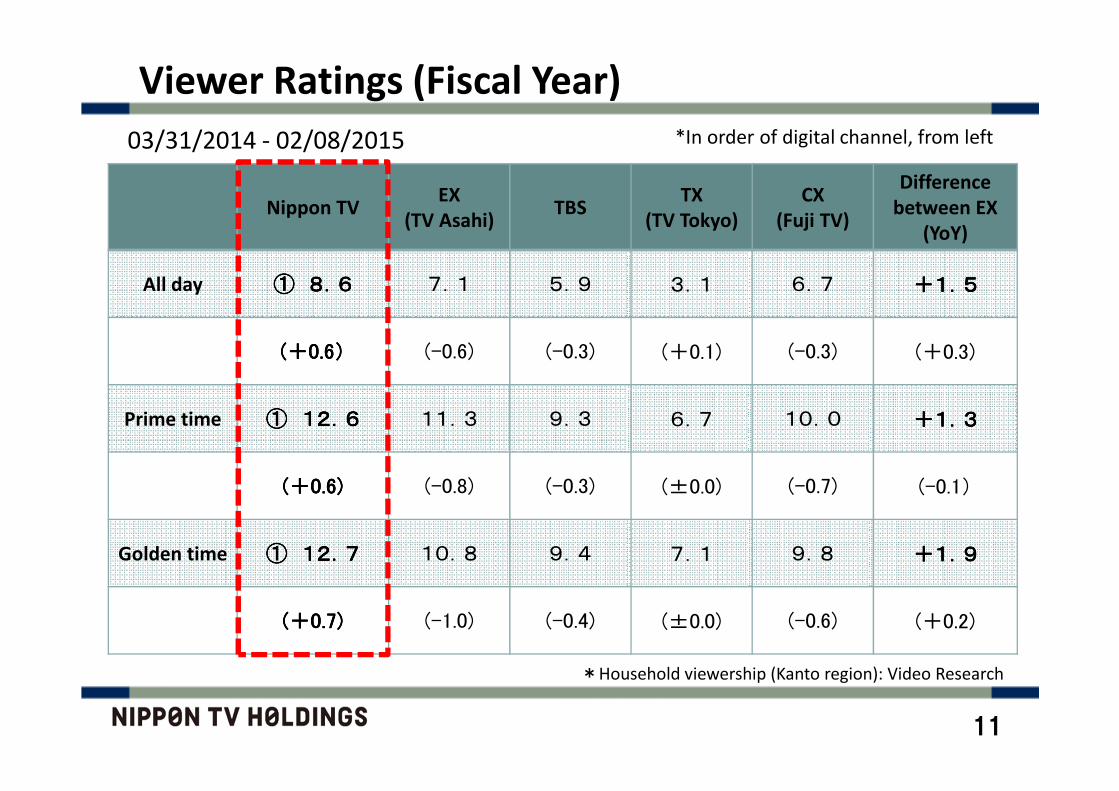
Nippon TVEX
(TV Asahi)TBS
TX
(TV Tokyo)
CX
(Fuji TV)
Difference
between EX
(YoY)
All day ①①①① 8.68.68.68.6 7.1 5.9 3.1 6.7 +1.5+1.5+1.5+1.5
((((++++0.60.60.60.6)))) (-0.6) (-0.3) (+0.1) (-0.3) (+0.3)
Prime time ①①①① 12.612.612.612.6 11.3 9.3 6.7 10.0 +1.3+1.3+1.3+1.3
((((++++0.6)0.6)0.6)0.6) (-0.8) (-0.3) (±0.0) (-0.7) (-0.1)
Golden time ①①①① 12.712.712.712.7 10.8 9.4 7.1 9.8 +1.9+1.9+1.9+1.9
((((++++0.7)0.7)0.7)0.7) (-1.0) (-0.4) (±0.0) (-0.6) (+0.2)
03/31/2014 - 02/08/2015
Viewer Ratings (Fiscal Year)
*In order of digital channel, from left
11
*Household viewership (Kanto region): Video Research

April 2015 Programming Improvements
☆☆☆☆Programming Improvement Concepts
Programming Philosophy
・・・・Maintain Triple Crown title and dominate Platinight zone
・・・・Stock content strategy that emphasizes drama expansion
・・・・Reinforce regular programs and maximize value of timetable
・・・・Multi-platform convergence strategy (DTT, BS, CS + internet + overseas)
☆☆☆☆Programming Improvement Strategy・・・・New drama slot for Sundays and strengthen stock content strategy
・・・・Leverage regular programs and timetable to further strengthen overall lineup.
・・・・Develop next-generation content and talent of human resources
・・・・Multi-platform convergence strategy that encompasses DTT, BS, CS, as well as
internet (Hulu, catch-up, Nippon TV on demand) and global expansion
12
FY 2015 First Half: Main One-Off Programs
☆☆☆☆Large One-Off Programs (establish solid rooting of large one-off programs)
May: “7 days TV” (TBD)
This week-long show tackles “What is family?” through live infotainment, news, golden
and prime time regulars, and special programs to present a wide range of entertainment.
July: “THE MUSIC DAY – The Power of Music”
Nippon TV’s popular music show that features Japan’s leading artists performing live
over several hours so you can enjoy music to your heart’s content.
August: “24-Hour Television 38”
Nippon TV’s large-scale program that has become a summer tradition.
☆☆☆☆Sports ProgramsMarch to November: “Professional Baseball”
Enjoy the March 27th opening game of the Giants, as well as all their exciting games.
September to October: “Rugby World Cup 2015”
Enjoy the 2015 World Cup from England. Japan will be the host in 2019.
13
TIPNESS Limited Acquisition
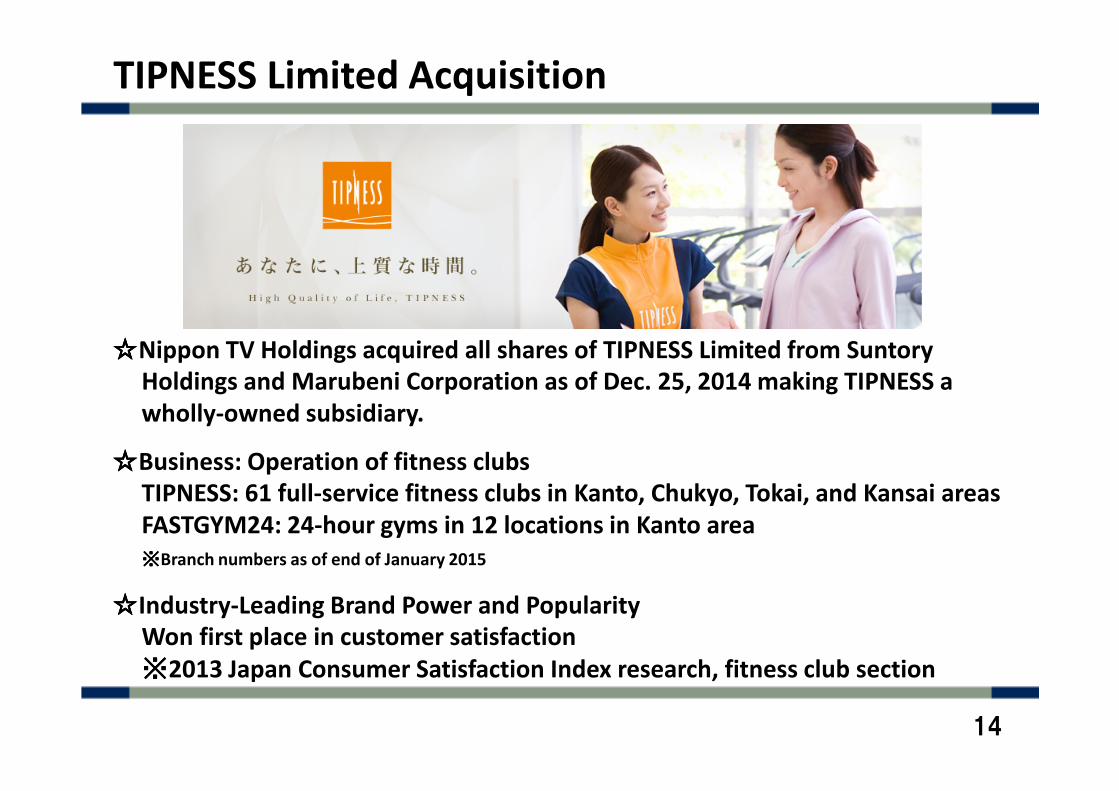
☆☆☆☆Nippon TV Holdings acquired all shares of TIPNESS Limited from Suntory
Holdings and Marubeni Corporation as of Dec. 25, 2014 making TIPNESS a
wholly-owned subsidiary.
☆☆☆☆Business: Operation of fitness clubs
TIPNESS: 61 full-service fitness clubs in Kanto, Chukyo, Tokai, and Kansai areas
FASTGYM24: 24-hour gyms in 12 locations in Kanto area
※※※※Branch numbers as of end of January 2015
☆☆☆☆Industry-Leading Brand Power and Popularity
Won first place in customer satisfaction
※※※※2013 Japan Consumer Satisfaction Index research, fitness club section
14
Lifestyle and Health Business—New Revenue Source
・・・・Diversification of business portfolio (as part of Medium-Term Management Plan
for 2012-2015 Next60)Media business diversification: entry into SVOD through Hulu acquisition
New business expansion: TIPNESS acquisition
・・・・TIPNESS as a subsidiary of Nippon TV HoldingsThe first-ever acquisition of its kind, Nippon TV Holdings adds to its content and real-estate
rental businesses a new lifestyle and health business segment that will become a new pillar
for revenues.
・・・・New “contact point” for consumersTIPNESS branches offer a direct contact point that Nippon TV Group previously did not have,
and will serve as the flagship to advancing our B to C business. (In recognition of the aging
population and the need to control social security costs, growing popularity of sports like
marathon, and the excitement leading up to the 2020 Tokyo Olympics.)
・・・・Create new synergiesThe fitness club and program production businesses both require creativity and the constant
pursuit of consumer satisfaction. Integrating the two businesses through innovative ideas will
lead to infinite possibilities. Nippon TV will also leverage its strength in sports content.
15
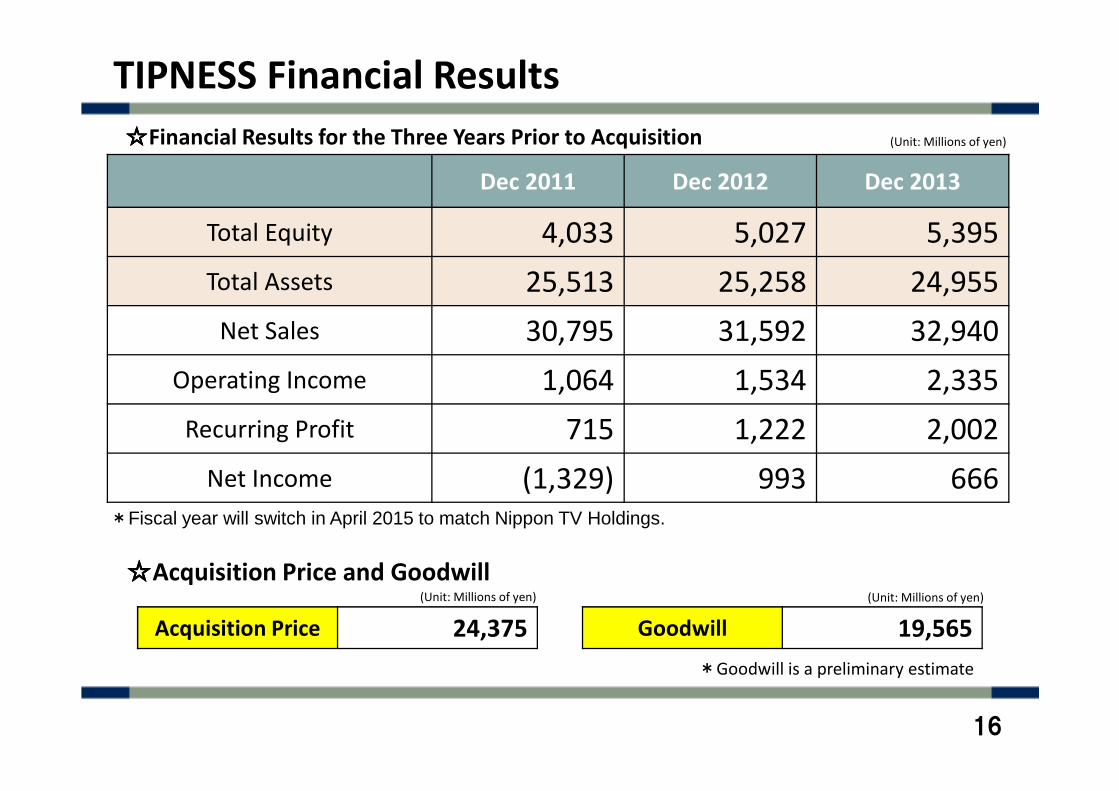
TIPNESS Financial Results
Dec 2011 Dec 2012 Dec 2013
Total Equity 4,033 5,027 5,395
Total Assets 25,513 25,258 24,955
Net Sales 30,795 31,592 32,940
Operating Income 1,064 1,534 2,335
Recurring Profit 715 1,222 2,002
Net Income (1,329) 993 666
☆☆☆☆Financial Results for the Three Years Prior to Acquisition
*Fiscal year will switch in April 2015 to match Nippon TV Holdings.
☆☆☆☆Acquisition Price and Goodwill
Acquisition Price 24,375 Goodwill 19,565
16
*Goodwill is a preliminary estimate
(Unit: Millions of yen)
(Unit: Millions of yen) (Unit: Millions of yen)

Reference Materials
for
Financial Results
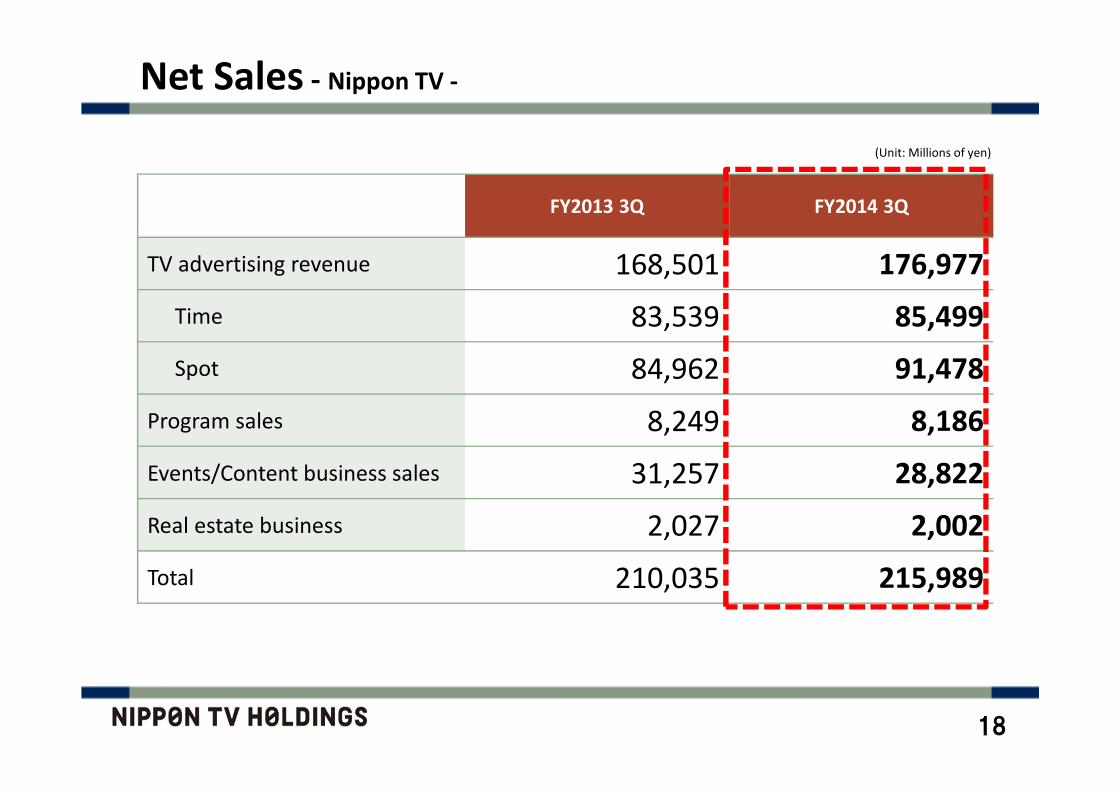
FY2013 3Q FY2014 3Q
TV advertising revenue 168,501 176,977
Time 83,539 85,499
Spot 84,962 91,478
Program sales 8,249 8,186
Events/Content business sales 31,257 28,822
Real estate business 2,027 2,002
Total 210,035 215,989
(Unit: Millions of yen)
Net Sales - Nippon TV -
18
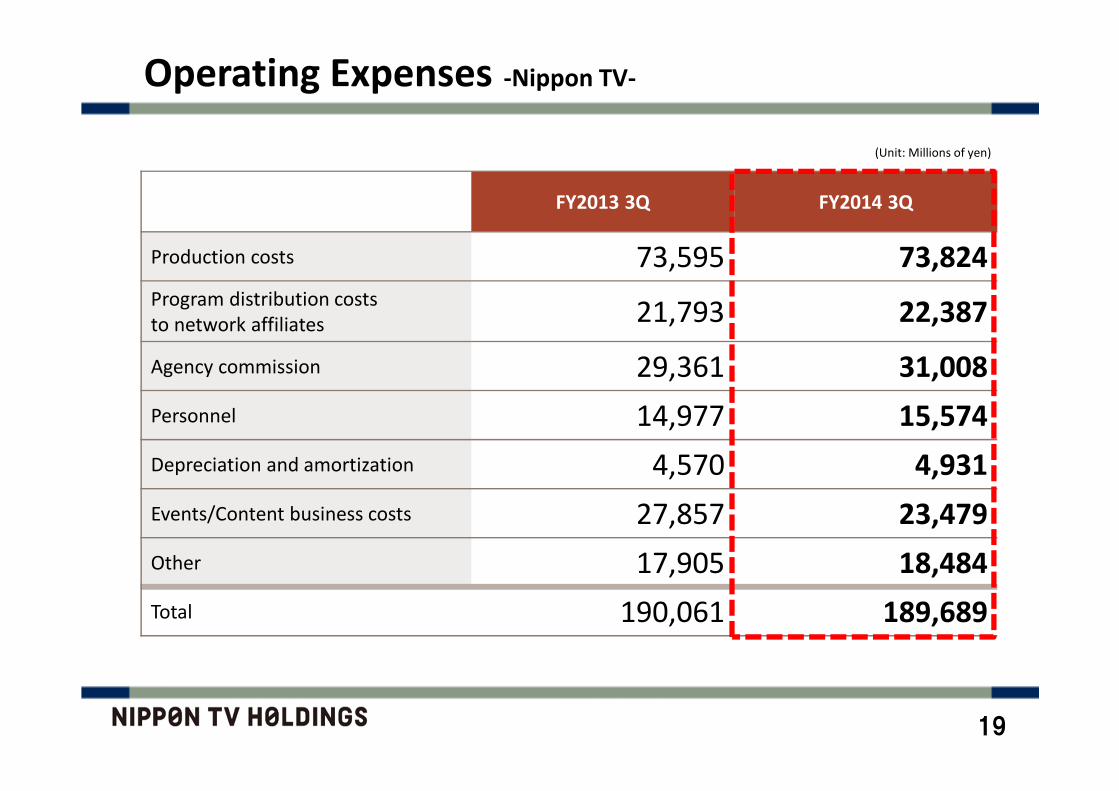
FY2013 3Q FY2014 3Q
Production costs 73,595 73,824
Program distribution costs
to network affiliates 21,793 22,387
Agency commission 29,361 31,008
Personnel 14,977 15,574
Depreciation and amortization 4,570 4,931
Events/Content business costs 27,857 23,479
Other 17,905 18,484
Total 190,061 189,689
(Unit: Millions of yen)
Operating Expenses -Nippon TV-
19
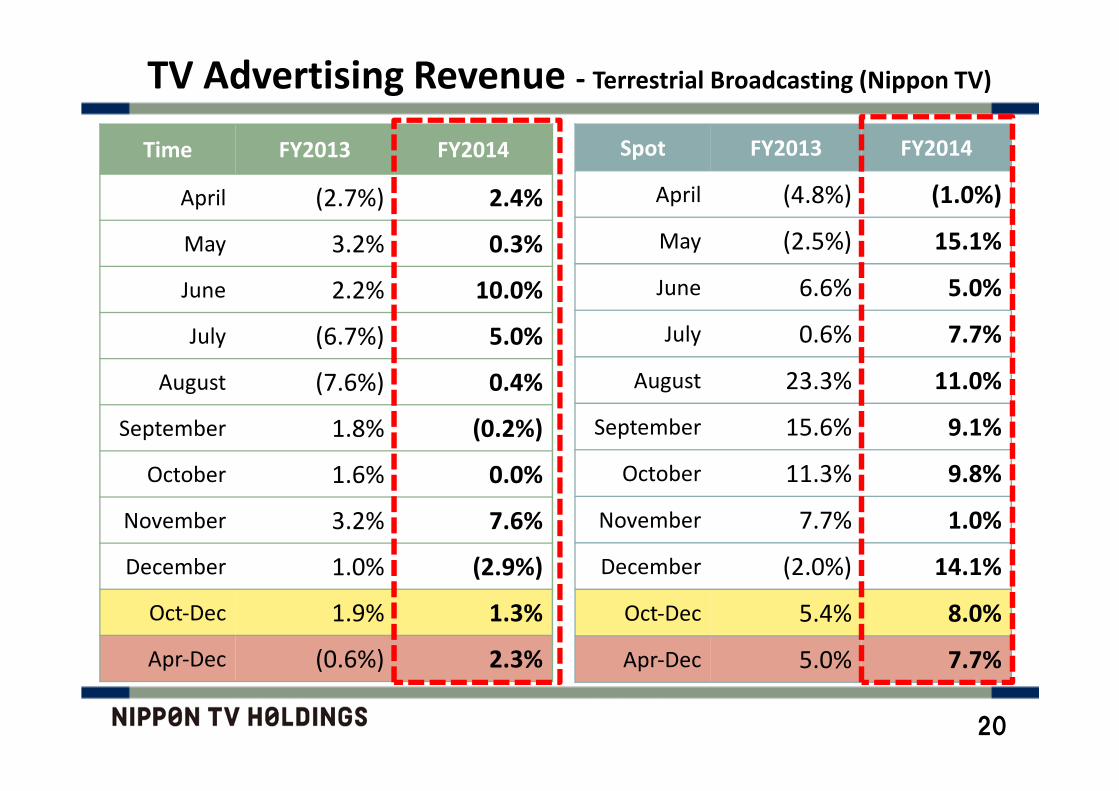
Spot FY2013 FY2014
April (4.8%) (1.0%)
May (2.5%) 15.1%
June 6.6% 5.0%
July 0.6% 7.7%
August 23.3% 11.0%
September 15.6% 9.1%
October 11.3% 9.8%
November 7.7% 1.0%
December (2.0%) 14.1%
Oct-Dec 5.4% 8.0%
Apr-Dec 5.0% 7.7%
Time FY2013 FY2014
April (2.7%) 2.4%
May 3.2% 0.3%
June 2.2% 10.0%
July (6.7%) 5.0%
August (7.6%) 0.4%
September 1.8% (0.2%)
October 1.6% 0.0%
November 3.2% 7.6%
December 1.0% (2.9%)
Oct-Dec 1.9% 1.3%
Apr-Dec (0.6%) 2.3%
20
TV Advertising Revenue - Terrestrial Broadcasting (Nippon TV)
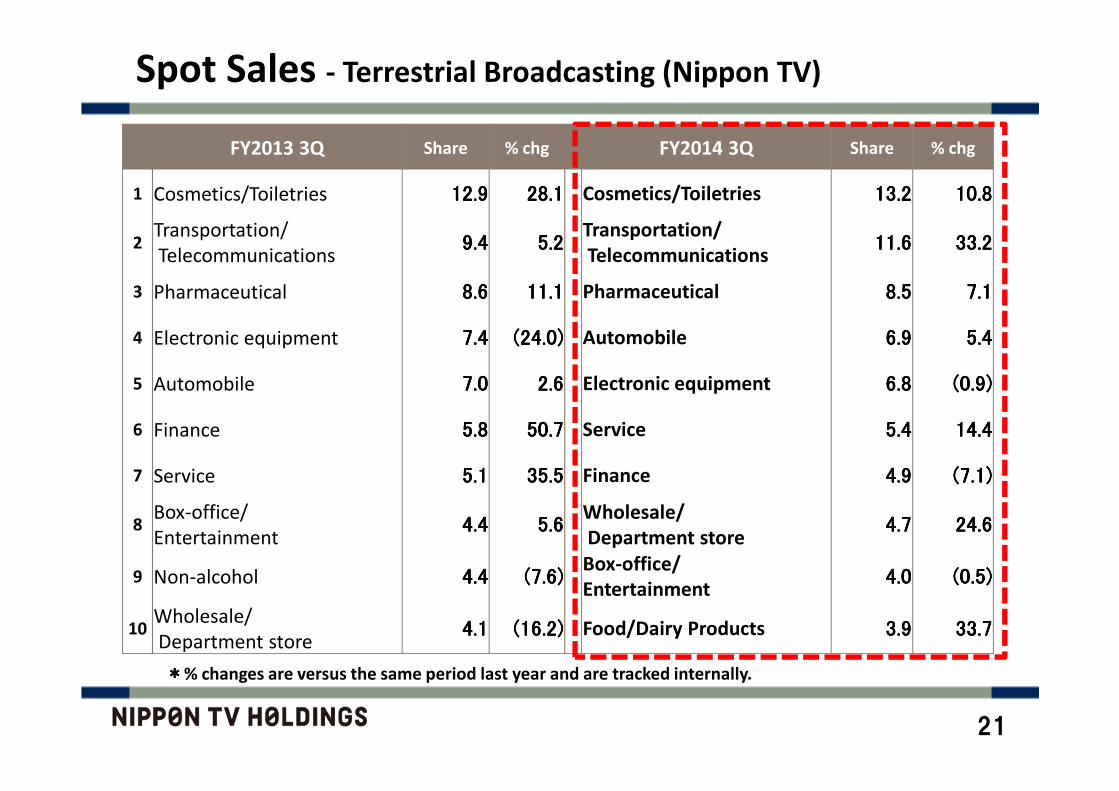
FY2013 3Q Share % chg FY2014 3Q Share % chg
1 Cosmetics/Toiletries 12.912.912.912.9 28.128.128.128.1 Cosmetics/Toiletries 13.2 13.2 13.2 13.2 10.810.810.810.8
2Transportation/
Telecommunications 9.49.49.49.4 5.25.25.25.2
Transportation/
Telecommunications 11.6 11.6 11.6 11.6 33.233.233.233.2
3 Pharmaceutical 8.68.68.68.6 11.111.111.111.1 Pharmaceutical 8.5 8.5 8.5 8.5 7.17.17.17.1
4 Electronic equipment 7.47.47.47.4 (24.0)(24.0)(24.0)(24.0) Automobile 6.9 6.9 6.9 6.9 5.45.45.45.4
5 Automobile 7.07.07.07.0 2.62.62.62.6 Electronic equipment 6.8 6.8 6.8 6.8 (0.9)(0.9)(0.9)(0.9)
6 Finance 5.85.85.85.8 50.750.750.750.7 Service 5.4 5.4 5.4 5.4 14.414.414.414.4
7 Service 5.15.15.15.1 35.535.535.535.5 Finance 4.9 4.9 4.9 4.9 (7.1)(7.1)(7.1)(7.1)
8Box-office/
Entertainment4.44.44.44.4 5.65.65.65.6
Wholesale/
Department store4.7 4.7 4.7 4.7 24.624.624.624.6
9 Non-alcohol 4.44.44.44.4 (7.6)(7.6)(7.6)(7.6)
Box-office/
Entertainment 4.0 4.0 4.0 4.0 (0.5)(0.5)(0.5)(0.5)
10Wholesale/
Department store4.14.14.14.1 (16.2)(16.2)(16.2)(16.2) Food/Dairy Products 3.9 3.9 3.9 3.9 33.733.733.733.7
Spot Sales - Terrestrial Broadcasting (Nippon TV)
****% changes are versus the same period last year and are tracked internally.
21
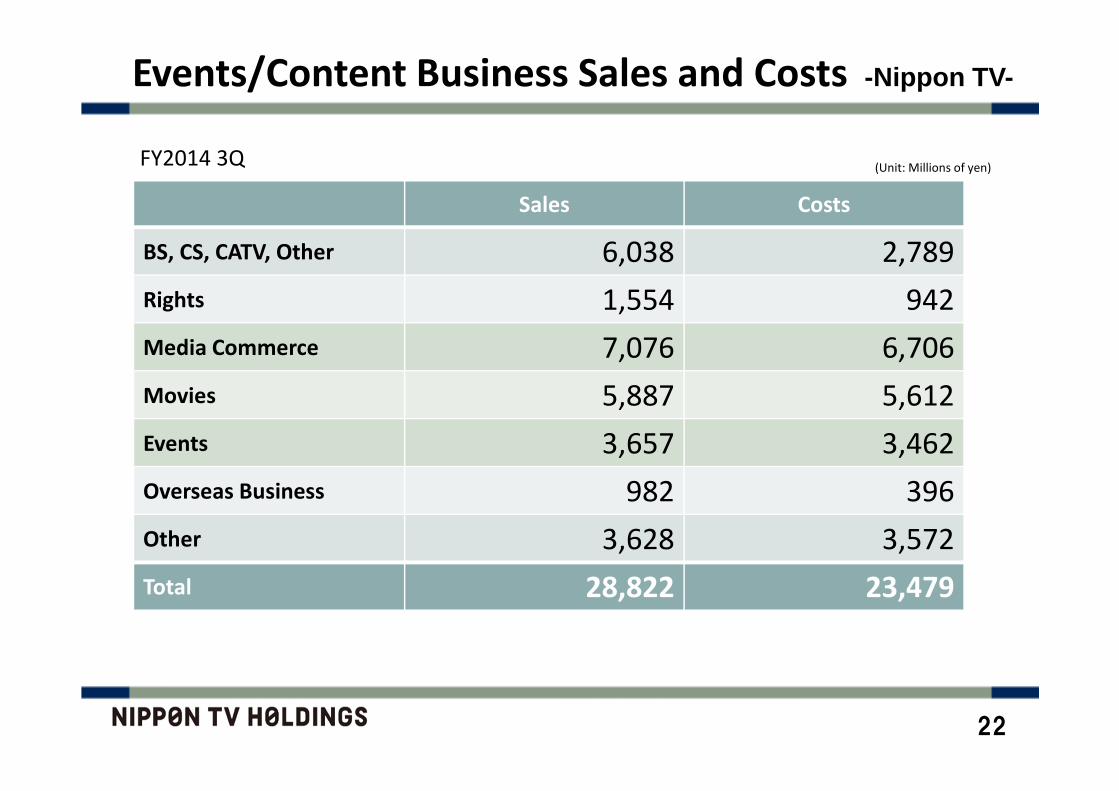
Sales Costs
BS, CS, CATV, Other 6,038 2,789
Rights 1,554 942
Media Commerce 7,076 6,706
Movies 5,887 5,612
Events 3,657 3,462
Overseas Business 982 396
Other 3,628 3,572
Total 28,822 23,479
FY2014 3Q(Unit: Millions of yen)
Events/Content Business Sales and Costs -Nippon TV-
22
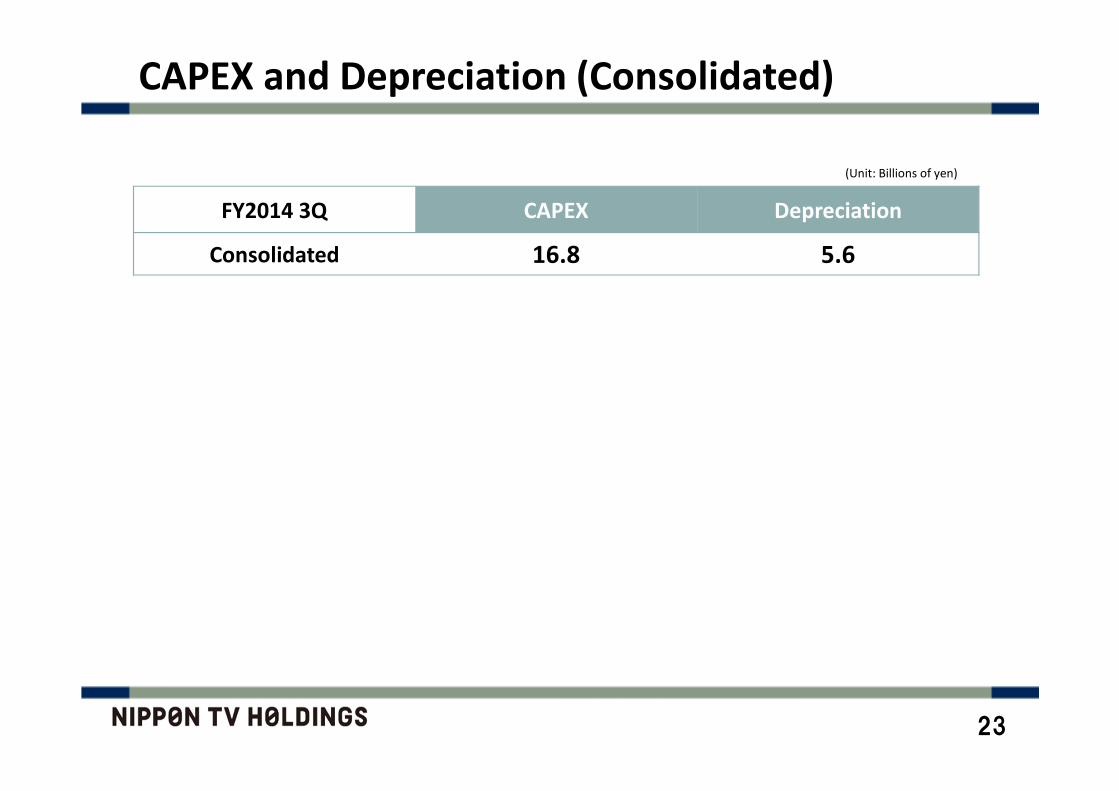
FY2014 3Q CAPEX Depreciation
Consolidated 16.8 5.6
CAPEX and Depreciation (Consolidated)
(Unit: Billions of yen)
23

FY 2014 3Q
Segmentation
Other Total AdjustmentConsolidated
year to
date totalContent
business
Lifestyle
and health
business
Real
estate
business
Total
Net sales 256,741 ---- 7,841 264,583 2,775 267,358 (6,648) 260,709
Segment
profit26,594 ---- 3,052 29,647 196 29,843 (386) 29,456
Segmentation Main businesses
Content businessSales of TV advertising, pay TV business, Video On Demand,
video and music royalty revenue, sales of package media, TV-shopping,
movie business, events and art exhibitions, and content production business
Lifestyle and health business Operation of fitness clubs
Real estate business Rental offices, building management
24
Nippon TV Holdings Consolidated Results – Segment Information
(Unit: Millions of yen)
**** Lifestyle and health business segment is newly established. Financial results will be consolidated beginning FY2014 4Q.

All Day Prime Time Golden Time
January ①①①①8.78.78.78.7 ①①①①12.612.612.612.6 ①①①①12.712.712.712.7
February ①①①①8.88.88.88.8 ①①①①12.512.512.512.5 ①①①①12.712.712.712.7
March ①①①①8.28.28.28.2 ①①①①12.612.612.612.6 ①①①①12.912.912.912.9
April ①①①①8.18.18.18.1 ①①①①12.112.112.112.1 ①①①①12.112.112.112.1
May ①①①①8.18.18.18.1 ①①①①12.112.112.112.1 ①①①①12.012.012.012.0
June ①①①①8.28.28.28.2 ①①①①12.012.012.012.0 ①①①①12.012.012.012.0
July ①①①①8.38.38.38.3 ①①①①12.212.212.212.2 ①①①①12.012.012.012.0
August ①①①①8.68.68.68.6 ①①①①12.812.812.812.8 ①①①①12.912.912.912.9
September ①①①①8.48.48.48.4 ①①①①12.812.812.812.8 ①①①①12.912.912.912.9
October ①①①①8.58.58.58.5 ①①①①12.512.512.512.5 ①①①①12.512.512.512.5
November ①①①①8.68.68.68.6 ①①①①13.013.013.013.0 ①①①①12.912.912.912.9
December ①①①①8.98.98.98.9 ①①①①12.912.912.912.9 ①①①①13.113.113.113.1
Cool All DayPrime
Time
Golden
Time
Jan-Mar ①①①①8.68.68.68.6 ①①①①12.612.612.612.6 ①①①①12.812.812.812.8
Apr-Jun ①①①①8.18.18.18.1 ①①①①12.112.112.112.1 ①①①①12.112.112.112.1
Jul-Sep ①①①①8.58.58.58.5 ①①①①12.612.612.612.6 ①①①①12.612.612.612.6
Oct-Dec ①①①①8.68.68.68.6 ①①①①12.712.712.712.7 ①①①①12.812.812.812.8
Annual ①①①①8.48.48.48.4 ①①①①12.512.512.512.5 ①①①①12.612.612.612.6
25
2014 Nippon TV Household Viewer Ratings Detail
*Household viewership (Kanto region): Video Research
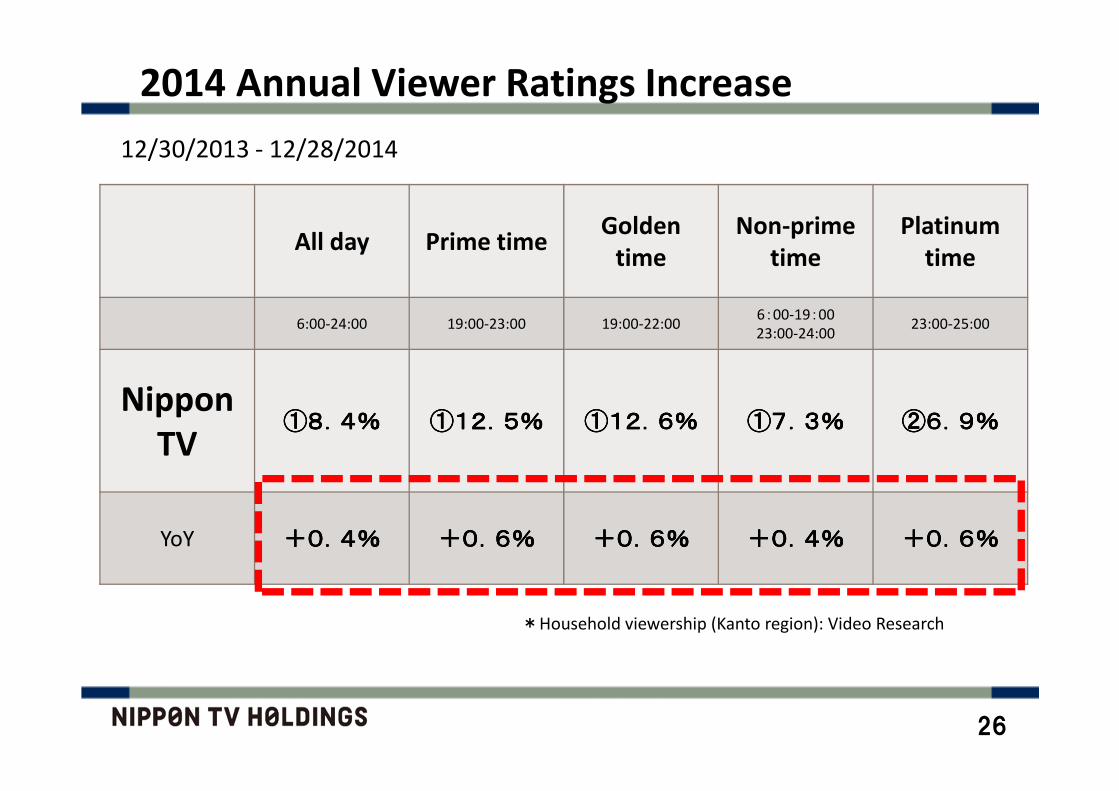
All day Prime timeGolden
time
Non-prime
time
Platinum
time
6:00-24:00 19:00-23:00 19:00-22:006:00-19:00
23:00-24:0023:00-25:00
Nippon
TV①8.4%①8.4%①8.4%①8.4% ①12.5%①12.5%①12.5%①12.5% ①12.6%①12.6%①12.6%①12.6% ①7.3%①7.3%①7.3%①7.3% ②6.9%②6.9%②6.9%②6.9%
YoY +0.4%+0.4%+0.4%+0.4% +0.6%+0.6%+0.6%+0.6% +0.6%+0.6%+0.6%+0.6% +0.4%+0.4%+0.4%+0.4% +0.6%+0.6%+0.6%+0.6%
12/30/2013 - 12/28/2014
2014 Annual Viewer Ratings Increase
*Household viewership (Kanto region): Video Research
26
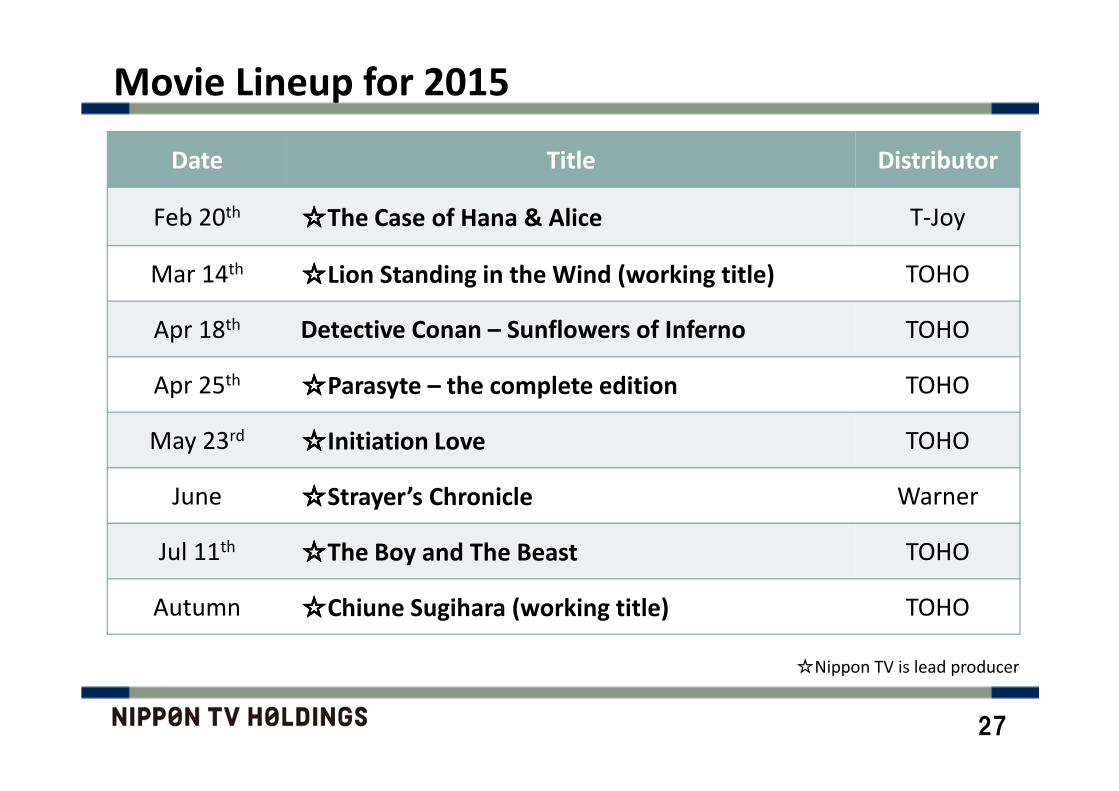
Movie Lineup for 2015
☆Nippon TV is lead producer
Date Title Distributor
Feb 20th☆☆☆☆The Case of Hana & Alice T-Joy
Mar 14th☆☆☆☆Lion Standing in the Wind (working title) TOHO
Apr 18th Detective Conan – Sunflowers of Inferno TOHO
Apr 25th☆☆☆☆Parasyte – the complete edition TOHO
May 23rd☆☆☆☆Initiation Love TOHO
June ☆☆☆☆Strayer’s Chronicle Warner
Jul 11th☆☆☆☆The Boy and The Beast TOHO
Autumn ☆☆☆☆Chiune Sugihara (working title) TOHO
27
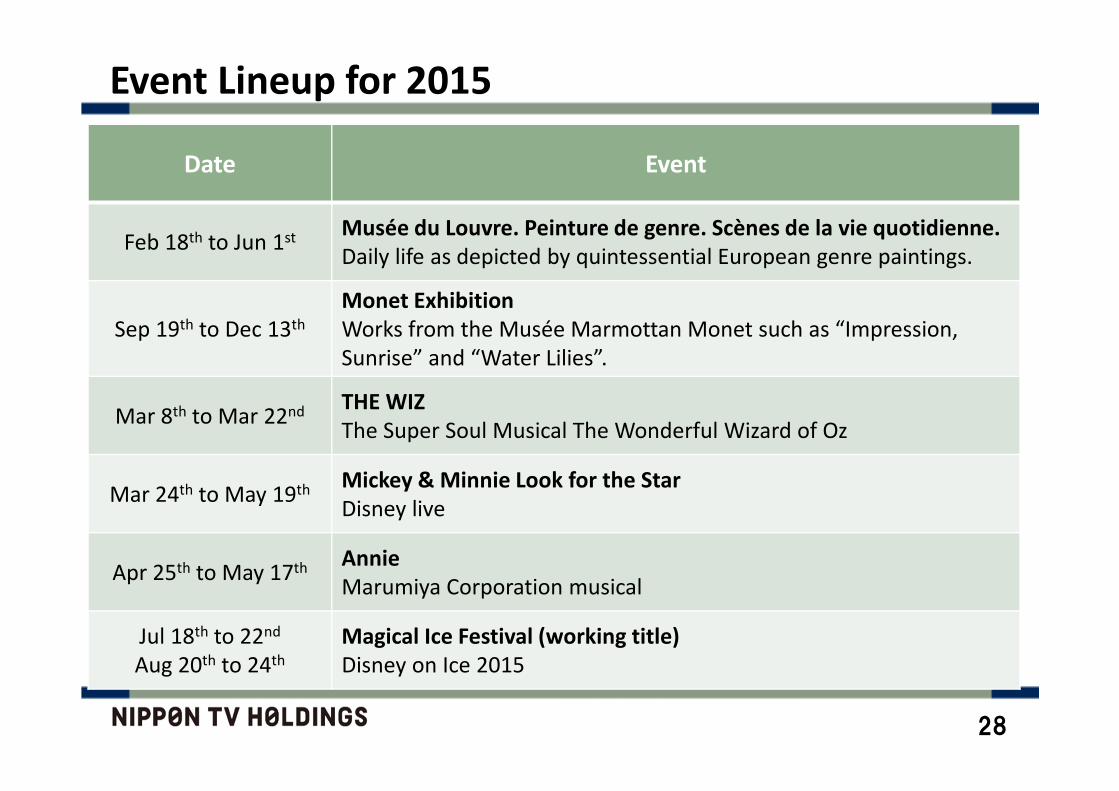
Event Lineup for 2015
Date Event
Feb 18th to Jun 1stMusée du Louvre. Peinture de genre. Scènes de la vie quotidienne.
Daily life as depicted by quintessential European genre paintings.
Sep 19th to Dec 13th
Monet Exhibition
Works from the Musée Marmottan Monet such as “Impression,
Sunrise” and “Water Lilies”.
Mar 8th to Mar 22ndTHE WIZ
The Super Soul Musical The Wonderful Wizard of Oz
Mar 24th to May 19thMickey & Minnie Look for the Star
Disney live
Apr 25th to May 17thAnnie
Marumiya Corporation musical
Jul 18th to 22nd
Aug 20th to 24th
Magical Ice Festival (working title)
Disney on Ice 2015
28