FINANCIAL RESULTS FOR THE YEAR ENDED MARCH 2014 · The Company will adopt International Financial...
51
FINANCIAL RESULTS FOR THE YEAR ENDED MARCH 2014 Mitsubishi Corporation 2-3-1 Marunouchi, Chiyoda-ku, Tokyo, JAPAN 100-8086 http://www.mitsubishicorp.com/
Transcript of FINANCIAL RESULTS FOR THE YEAR ENDED MARCH 2014 · The Company will adopt International Financial...

FINANCIAL RESULTS FOR
THE YEAR ENDED MARCH 2014
Mitsubishi Corporation 2-3-1 Marunouchi, Chiyoda-ku, Tokyo, JAPAN 100-8086
http://www.mitsubishicorp.com/

May 8, 2014Mitsubishi Corporation
1. Consolidated operating results for the year ended March 31, 2014
(1) Operating transactions and incomeNote:Figures less than one million yen are rounded.%: change from the previous year
For the year ended Millions of Yen % Millions of Yen % Millions of Yen % Millions of Yen %
March 31, 2014 21,950,137 8.6 198,467 48.2 432,233 28.2 444,793 23.5
March 31, 2013 20,207,183 0.4 133,875 -50.6 337,206 -25.8 360,028 -20.4
Return on equity attributableto Mitsubishi Corporation
Pre-tax income tototal assets ratio
Operating income to totaloperating transactions ratio
For the year ended % % %
March 31, 2014 9.9 2.9 0.9
March 31, 2013 9.4 2.5 0.7
(2) Assets and shareholders' equity
As of Millions of Yen % Yen
March 31, 2014 4,774,244 31.2 2,896.04
March 31, 2013 4,179,698 29.0 2,537.52
(3) Cash Flows
For the year ended
March 31, 2014
March 31, 2013
2. Dividends
Cash dividends(annual)
Payout ratio(consolidated)
Ratio ofshareholders'equity to cashdividends(consolidated)
(Record date) 1Q end 2Q end 3Q end 4Q end Annual Millions of Yen % %
March 31, 2013 25.00 30.00 55.00 90,590 25.2 2.4
March 31, 2014 30.00 38.00 68.00 112,089 25.2 2.5
March 31, 2015(Forecast) 40.00 30.00 70.00 28.3
3. Outlook for the year ending March 31, 2015 Note:
%: change from the previous year.
For the year ending Millions of Yen % Yen
March 31, 2015 400,000 ‐ 247.48
Consolidated forecasts for the six months ending September 30, 2014 have been omitted because MC tracks performance against targets on an annual basis only.
The Company will adopt International Financial Reporting Standards ("IFRS") for the consolidated financial statements of annual report under the Financial Instrumentsand Exchange Law from the fiscal year ended March 31,2014.Therefore, the Company has made the forecasts for the year ending March 31,2015 based on IFRS and has not made forecasts based on U.S.GAAP.
4. Other
(1) Changes in significant subsidiaries during the period (changes in specified subsidiaries causing changes in scope of consolidation): NoneNew companies : 0
Excluded companies : 0
(2) Changes in accounting principles, procedures and presentation methods for preparing consolidated financial statements-1- Changes due to accounting standards revisions: None
-2- Changes other than -1- : None
Forecast of Net incomeattributable to Mitsubishi
Corporation per share
Net income attributable toMitsubishi Corporation
Cash dividend per share (Yen)
258,142 (182,689) (122,131) 1,322,964
403,313 (752,477) 401,687 1,345,755
Operating activities Investing activities Financing activitiesCash and cash equivalents end of
year
Millions of Yen Millions of Yen Millions of Yen Millions of Yen
MitsubishiCorporation
Shareholders' equityper share
Millions of Yen Millions of Yen
15,291,699 5,204,026
MitsubishiCorporation
shareholders' equity
Ratio of MitsubishiCorporation
shareholders' equity tototal assets
4,556,050
218.66 218.18
Total assets Total equity
269.93 269.31
FINANCIAL HIGHLIGHTS FOR THE YEAR ENDED MARCH 31, 2014(Based on US GAAP) (Consolidated)
Operating transactions Operating income Income before income taxesNet income attributable to
Mitsubishi Corporation
Comprehensive income for the years ended March 31, 2014 and 2013 were ¥687,939 million (-10.1%) and ¥765,379 million (+99.5%) respectively.
Net income attributable to MitsubishiCorporation per share
Net income attributable to MitsubishiCorporation per share (diluted basis)
Yen Yen
14,410,665
(1) Equity in earnings of Affiliated companies for the years ended March 31, 2014 and 2013 were ¥208,507, million and ¥164,274, million respectively.(2) The consolidated financial statements have been prepared in accordance with accounting principles generally accepted in the United States of America.(3) Operating transactions and operating income, as presented above, are voluntary disclosures solely for the convenience of investors in Japan. Operating
transactions represent the gross transaction volume or the aggregate nominal value of the sales contracts in which the Company acts as principal andtransactions in which the Company serves as agent. Operating transactions exclude the contract value of transactions in which the Company's role islimited to that of a broker. Operating income reflects the Company's (a) gross profit, (b) selling, general and administrative expenses, and (c) provision for doubtful receivables.Operating transactions and operating income, as presented above, are non-US GAAP measures commonly used by similar Japanese trading companiesand should not be construed as equivalent to, or a substitute or proxy for, revenues, or as an indicator of our operating performance, liquidity or cashflows generated by operating, investing or financing activities.
(1) Please refer to “(2) Capital Structure Policy and Dividend Policy” under “3. Basic Policy Regarding the Appropriation of profits” under “Operating Results and Financial Position”of the consolidated financial statements on page 9 regarding the above dividend for the year ended March 31, 2014.
(2) Breakdown of year-end dividend for the year ended March 31, 2015: Regular dividend JPY 30.00; commemorative dividend JPY 10.00

(3) Number of shares issued (Common stock)
-1- Number of shares issued at year-end (including treasury shares) (March 31, 2014) 1,653,505,751 (March 31, 2013) 1,653,505,751
-2- Number of treasury shares at year-end (March 31, 2014) 4,964,444 (March 31, 2013) 6,347,756
-3- Average number of shares during each of the following fiscal years (March 31, 2014) 1,647,786,046 (March 31, 2013) 1,646,519,392
Forward-looking Statements
As of the date of disclosure of this earnings release, an audit of the consolidated financial statements is being carried out in accordance with the Financial Instruments and Exchange Act.
Earnings forecasts and other forward-looking statements in this release are based on data currently available to management and certain assumptions that management believes are reasonable, andthere may be latent risks, uncertainties and other factors embedded. Actual results may therefore differ materially from these statements for various reasons. For cautionary notes concerningassumptions for earnings forecasts and use of earnings forecasts, please refer to “(3) Forecasts for the Year Ending March 2015” under “2. Consolidated Results (US GAAP)” of “Operating Resultsand Financial Position” on page 7.
Disclosure Regarding Audit Procedures
Please refer to “(3) Earnings Per Share” under “7. Notes Concerning Consolidated Financial Statements” of the consolidated financial statements on page 36 regarding the number of shares thatserve as the basis for calculating consolidated net income attributable to Mitsubishi Corporation per share.

Contents
Operating Results and Financial Position .............................................................................. 3
1. General Operating Environment ........................................................................................ 3
2. Consolidated Results (US GAAP) ....................................................................................... 3
(1) Summary of the Year Ended March 2014 Results ......................................................................... 3 (2) Segment Information ...................................................................................................................... 4 (3) Forecasts for the Year Ending March 2015 ................................................................................... 7 (4) Changes in Assets, Liabilities and Shareholders’ Equity ............................................................... 7 (5) Cash Flows ..................................................................................................................................... 8
3. Basic Policy Regarding the Appropriation of Profits ....................................................... 9
(1) Investment Plans ............................................................................................................................ 9 (2) Capital Structure Policy and Dividend Policy ............................................................................... 9
4. Business Risks ..................................................................................................................... 10
(1) Risks of Changes in Global Macroeconomic Conditions ............................................................ 10 (2) Market Risks ................................................................................................................................ 11 (3) Credit Risk ................................................................................................................................... 15 (4) Country Risk ................................................................................................................................ 16 (5) Business Investment Risk ............................................................................................................ 16 (6) Risks Related to Specific Investments ........................................................................................... 17 (7) Risks Related to Compliance ......................................................................................................... 19 (8) Risks From Natural Disasters ........................................................................................................ 19
Subsidiaries and Affiliated Companies .................................................................................. 21
Management Policies ................................................................................................................ 22
Consolidated Financial Statements (US GAAP) ................................................................... 26
1. Consolidated Balance Sheets (US GAAP) .......................................................................... 26
2. Consolidated Statements of Income and Comprehensive Income (US GAAP) .............. 28
3. Consolidated Statements of Equity (US GAAP) ................................................................ 30
4. Consolidated Statements of Cash Flows (US GAAP) ....................................................... 32
5. Notes Concerning Going Concern Assumption ................................................................. 33
6. Basis for Preparation of Consolidated Financial Statements ........................................... 33
(1) Basic Accounting Policies ............................................................................................................. 33 (2) Scope of Consolidation and Application of the Equity Method .................................................... 33
1

7. Notes Concerning Consolidated Financial Statements ..................................................... 34
(1) Operating Segment Information ..................................................................................................... 34 (2) Geographic Segment Information .................................................................................................. 35 (3) Earnings Per Share ......................................................................................................................... 36 (4) Omission of Disclosure .................................................................................................................. 36 (5) Subsequent Events ......................................................................................................................... 36
※ Mitsubishi Corporation will hold an earnings conference in Tokyo for the year ended
March 2014 on May 9, 2014 (Friday) from 16:00 to 17:30 (Japan Time), inviting institutional
investors and analysts to join.
The conference material will be accessible in English from the following URL:
http://www.mitsubishicorp.com/jp/en/ir/index.html
(English interpretation of the conference call will be posted on our web site as soon as it becomes
available.)
2

Operating Results and Financial Position 1. General Operating Environment In the year ended March 2014, the U.S. economy continued to experience a modest recovery on the back of healthy consumer spending. In Europe there were continuing signs of a gradual upturn in economic conditions. Emerging nations, while experiencing a slowdown in economic growth, showed signs of bottoming out in some quarters. The Japanese economy, remained on a moderate recovery path, with the benefits of government policies underpinning the economy. As price levels held firm, internal demand was also robust, supported partly by last-minute demand ahead of the increase in the consumption tax rate.
2. Consolidated Results (US GAAP) (Consolidated net income, as used hereinafter, refers to “Consolidated net income attributable to Mitsubishi Corporation.”)
(1) Summary of the Year Ended March 2014 Results Consolidated operating transactions for the year ended March 2014 increased 1,743.0 billion yen, or 9%, year over year to 21,950.1 billion yen. This increase was mainly due to higher transaction volumes and foreign currency factors. Gross profit increased 130.5 billion yen, or 13%, to 1,160.1 billion yen, reflecting mainly the absence of strike action that affected performance at an Australian resource-related subsidiary (coking coal) in the previous fiscal year, foreign currency factors, and the impact of business expansion (new consolidations). Selling, general and administrative expenses increased 51.7 billion yen, or 6%, year over year to 941.7 billion yen, due mainly to the impact of business expansion (new consolidations). Other P/L items collectively had a positive impact on earnings, reflecting
3

mainly an improvement in gain on marketable securities and investments-net, including sales of shares. Other income-net, however, declined due primarily to foreign exchange gains and losses. As a result, income before income taxes and equity in earnings of Affiliated companies increased 95.0 billion yen, or 28%, to 432.2 billion yen. Net equity in earnings of Affiliated companies increased 44.2 billion yen, or 27%, to 208.5 billion yen. Accordingly, consolidated net income for the year ended March 2014 increased 84.8 billion yen, or 24%, to 444.8 billion yen.
(2) Segment Information 1) Global Environmental & Infrastructure Business Group The Global Environmental & Infrastructure Business Group conducts infrastructure projects, related trading operations and other activities in power generation, water, transportation and other infrastructure fields that serve as a foundation for industry. The segment recorded consolidated net income of 22.2 billion yen, up 7.8 billion yen year over year. The higher earnings mainly reflect a one-time gain associated with price revisions in offshore transmission operations. Note: Effective from the year ended March 31, 2014, the Company applied the infrastructure-related businesses of the Global Environmental & Infrastructure Business Group as an independent business segment. Please see (1) Operating Segment Information under 7. Notes Concerning Consolidated Financial Statements on page 34 for details.
2) Industrial Finance, Logistics & Development Group The Industrial Finance, Logistics & Development Group is developing shosha-type industrial finance businesses. These businesses range from asset management, infrastructure investment, and buyout investment to
4

leasing, real estate development and logistics services. The segment recorded consolidated net income of 31.1 billion yen, up 6.1 billion yen year over year. The higher earnings mainly reflect increased earnings in the fund related investment and aircraft leasing-related businesses.
3) Energy Business Group The Energy Business Group conducts a number of activities including oil and gas exploration, development and production (E&P) business; investment in natural gas liquefaction projects; trading of crude oil, petroleum products, carbon materials and products, LNG (Liquefied Natual Gas), and LPG ( Liquefied Petroleum Gas ); and planning and development of new energy businesses. The segment recorded consolidated net income of 147.9 billion yen, up 5.5 billion yen year over year. The increased earnings reflect gains on the sale of shares and higher dividend income from overseas resource-related business investees, despite higher exploration costs.
4) Metals Group The Metals Group trades, develops businesses and invests in a range of fields. These include steel products such as steel sheets and thick plates, steel raw materials such as coking coal and iron ore, and non-ferrous raw materials and products such as copper and aluminum. The segment recorded consolidated net income of 41.2 billion yen, up 4.3 billion yen year over year. The increased earnings reflect higher earnings posted at an Australian resource-related subsidiary (coking coal), gains on the sale of shares and the absence of share write-downs recorded in the previous fiscal year, despite decreases in equity-method earnings and dividend income from overseas resource-related business investees.
5

5) Machinery Group The Machinery Group handles sales, finance and logistics across many different sectors, in which it also invests. These fields include machine tools, agricultural machinery, construction machinery, mining machinery, elevating machinery, ships, aerospace-related equipment and motor vehicles. The segment recorded consolidated net income of 87.1 billion yen, up 31.5 billion yen year over year. Earnings rose due mainly to an absence of impairment losses recorded on company-owned vessels in the previous fiscal year, strong performances in Asian automobile-related operations, the yen’s depreciation and gains on the sale of assets.
6) Chemicals Group The Chemicals Group trades chemical products in a broad range of fields, in which it also develops businesses and invests. These fields extend from raw materials used in industrial products such as ethylene, methanol, and salt produced from crude oil, natural gas, minerals, plants, marine resources and so forth, to plastics, electronic materials, food ingredients, fertilizer and fine chemicals. The segment recorded consolidated net income of 32.8 billion yen, up 10.2 billion yen year over year. Earnings increased mainly due to gains on the sale of shares and higher earnings on transactions at a petrochemical business-related company.
7) Living Essentials Group The Living Essentials Group provides products and services, develops businesses and invests in various fields closely linked with people's lives, including food products and food, textiles, essential supplies, healthcare, distribution and retail. These fields extend from the procurement of raw materials to the consumer market. The segment recorded consolidated net income of 68.3 billion yen, up 0.8
6

billion yen year over year. Earnings increased mainly due to strong performances in food-related businesses, despite equity-method earnings falling as a result of divestment of affiliated investees.
(3) Forecasts for the Year Ending March 2015 The Company will adopt International Financial Reporting Standards (IFRS), beginning with the consolidated financial statements in the Annual Securities Report for the year ended March 2014. Consequently, the Company’s forecasts for the year ending March 2015, containing a projection of 400.0 billion yen in consolidated net income, were formulated based on IFRS. No forecasts based on US GAAP have been compiled. Reference: Change of basic assumptions
Year Ended March 2014
(Actual)
Year Ending March 2015 (Forecasts)
Change
Exchange rate 100.2 JPY/USD 100 JPY/USD -0.2 JPY/USD
Crude oil price 104.6 US$/BBL 100 US$/BBL -4.6 US$/BBL
Interest rate (TIBOR)
0.23% 0.25% +0.02%
(4) Changes in Assets, Liabilities and Equity Total assets at March 31, 2014 were 15,291.7 billion yen, up 881.0 billion yen from March 31, 2013. Total assets increased mainly because of the execution of new investments, along with an increase in investments in Affiliated companies due to the impact of the yen’s depreciation. Another factor was an increase in property and equipment mainly due to capital expenditures at subsidiaries. Total liabilities were 10,087.7 billion yen, up 233.1 billion yen from March 31, 2013. This mainly reflected an increase in long-term debt due to the procurement of funds for making new investments and the impact of the yen’s depreciation.
7

Interest-bearing liabilities (net), which are interest-bearing liabilities (gross) minus cash and cash equivalents and time deposits, increased 186.4 billion yen from March 31, 2013 to 4,522.2 billion yen. The net debt-to-equity ratio, which is net interest-bearing liabilities divided by total shareholders’ equity, was 0.9. Total shareholders’ equity increased 594.5 billion yen from March 31, 2013 to 4,774.2 billion yen. Despite the payment of dividends, total shareholders’ equity increased due to an increase in retained earnings because of the consolidated net income and an improvement in foreign currency translation adjustments accompanying the yen’s depreciation.
(5) Cash Flows Cash and cash equivalents at March 31, 2014 were 1,323.0 billion yen, down 22.8 billion yen from March 31, 2013.
(Operating Activities) Net cash provided by operating activities was 258.1 billion yen. Operating cash flows provided net cash mainly due to cash flows from operating transactions at subsidiaries and dividend income from investees, mainly resource-related businesses, despite an increase in cash requirements due to changes in assets and liabilities associated with operating activities.
(Investing Activities) Net cash used in investing activities was 182.7 billion yen. Investing activities used net cash mainly due to capital expenditures by metals resource-related subsidiaries, and investments in energy resource businesses and offshore transmission operations, despite cash provided by the sale of shares and real estate. As a result, free cash flow, the sum of operating and investing cash flows, was positive 75.4 billion yen.
8

(Financing Activities) Net cash used in financing activities was 122.1 billion yen. The overall result mainly reflected the payment of dividends at the Parent.
3. Basic Policy Regarding the Appropriation of Profits (1) Investment Plans We will accelerate divestments selectively and free up capital for new investments, while continuing to invest at a rate in line with the average of the three years under Midterm Corporate Strategy 2012, in order to improve our earnings base.
(2) Capital Structure Policy and Dividend Policy Our basic policy is to sustain growth and maximize corporate value by balancing earnings growth, capital efficiency and financial soundness. For this, we will continue to utilize retained earnings for investments to drive growth, while maintaining our financial soundness. Moreover, under New Strategic Direction, we introduced a two-staged dividend policy to ensure a certain amount of return to shareholders regardless of changes in the external environment. Accordingly, we plan to pay a yearly base dividend of 50 yen per common share, regardless of our earnings level each year, as the stable portion of this two-staged dividend. On top of that, we will pay a performance based variable dividend at a consolidated dividend payout ratio of at least 30% on consolidated net income above 350.0 billion yen each year, while taking our capital demand for investing in further growth into consideration. In light of the 444.8 billion yen in consolidated net income we recorded for the year ended March 2014, the Board of Directors today passed a resolution setting a total dividend per common share applicable to the fiscal year ended March 31, 2014 of 68 yen per common share (making the year-end dividend 38 yen per common share, having paid an interim dividend of 30 yen per common share). Comprising this is a base dividend
9

of 50 yen per common share, and a performance based variable dividend of 18 yen per common share for a payout ratio of 31.3% on the 94.8 billion yen in performance in excess of 350.0 billion yen. We plan to pay a total dividend of 70 yen per common share for the year ending March 2015. This will consist of a base dividend of 50 yen per common share, performance based variable dividend of 10 yen per common share (for a payout ratio of 33% on the performance in excess of 350.0 billion yen), and a commemorative dividend of 10 yen per common share marking the 60th anniversary of Mitsubishi Corporation’s historic re-merger. [For Reference: Annual Ordinary Dividends] Year ended March 2007 = 46 yen per common share Year ended March 2008 = 56 yen per common share Year ended March 2009 = 52 yen per common share Year ended March 2010 = 38 yen per common share Year ended March 2011 = 65 yen per common share Year ended March 2012 = 65 yen per common share Year ended March 2013 = 55 yen per common share Year ended March 2014 = 68 yen per common share
4. Business Risks (1) Risks of Changes in Global Macroeconomic Conditions As we conduct businesses on a global scale, our operating results are impacted by economic trends in overseas countries as well as those in Japan. For instance, a decline in prices of energy and metal resources could have a large impact on our resource-related import transactions and earnings from business investments. Furthermore, the worldwide economic slowdown could affect our entire export-related business, including plants, construction machinery parts, automobiles, steel products, ferrous raw materials, chemical products, and other products.
10

In Thailand and Indonesia, we have various automobile businesses, including automobile assembly plants, distribution and sales companies and financial services companies jointly established with Japanese automakers. Because automobile sales volume reflects internal demand in each of these countries, economic trends in both Thailand and Indonesia may have a significant bearing on earnings from our automobile operations. In the year ended March 2014, the global economy saw an increase in volatility in the financial and commodity markets, mainly due to concerns about the outlook for the Chinese economy and rising geopolitical risk as a result of the situation in Ukraine and other developments. Volatility in the financial and commodity markets also increased due to expectations the U.S. would scale back its quantitative easing, and after it decided to begin tapering. In emerging countries, the pace of economic growth has slowed even among major countries such as China, mainly due to slower growth in exports, compounded by structural problems within these countries. Furthermore, certain countries have tightened their monetary policies in response to increasing inflation pressures and other factors.
(2) Market Risks Unless otherwise stated, calculations of effects on future consolidated net income are based on consolidated net income for the year ended March 2014.
1) Commodity Market Risk In the course of our business activities, we are exposed to various risks relating to movements in prices of commodities as a trader, an owner of rights to natural and energy resources, and a producer and seller of industrial products of our investees. Product categories that may have a large impact on our operating results are as follows:
11

(Energy Resources) We hold upstream rights to LNG and crude oil, and/or liquefaction facilities in Australia, Malaysia, Brunei, Sakhalin, Indonesia, Gulf of Mexico (United States), Gabon, Angola and other regions. Movements in LNG and crude oil prices may have a significant impact on operating results in these businesses. Fundamentally, LNG prices are linked to crude oil prices. As an estimate, a US$1/BBL fluctuation in the price of crude oil would have an approximate 1.0 billion yen effect on consolidated net income for LNG and crude oil combined in a given year, mainly through a change in equity-method earnings. However, fluctuations in the price of LNG and crude oil might not be immediately reflected in our operating results because of timing differences.
(Metal Resources) Through wholly owned Australian subsidiary Mitsubishi Development Pty Ltd (MDP), we sell coking coal, which is used for steel manufacturing, and thermal coal, which is used for electricity generation. Fluctuations in the price of coking coal may affect our consolidated operating results through MDP’s earnings. MDP’s operating results cannot be determined by the coal price alone since MDP’s results are also significantly affected by fluctuations in exchange rates for the Australian dollar, U.S. dollar and yen, as well as adverse weather and labor disputes. In addition, as a producer, we are exposed to the risk of price fluctuations in copper and aluminum. Regarding copper, a US$100 fluctuation in the price per MT of copper would have a 1.3 billion yen effect on our consolidated net income for the year. However, variables besides price fluctuations can also have an impact. These include the grade of mined ore, the status of production operations, and reinvestment plans (capital expenditures). Therefore, the impact on earnings cannot be determined by the copper price alone. Regarding aluminum, a US$100 fluctuation in the price per MT of aluminum would have a 1.2 billion yen effect on our
12

consolidated net income for the year. However, variables besides price fluctuations can also have an impact. These include the status of production operations, electricity costs, and foreign exchange movements. Therefore, the impact on earnings cannot be determined by the aluminum price alone.
(Petrochemical Products) We are engaged in a broad range of trading activities for petrochemical products manufactured from raw materials such as naphtha and natural gas. The prices of petrochemical products are largely determined for each product on an individual basis based on the prices of the above raw materials, supply-demand dynamics and other factors. Fluctuations in the prices of these raw materials may affect earnings from these trading transactions. We have made investments in manufacturing and sales companies for petrochemicals such as ethylene glycol, paraxylene and methanol in Saudi Arabia, Malaysia and Venezuela. Our equity-method earnings would be affected by changes in the operating results of these companies due to price movements.
2) Foreign Currency Risk We bear risk of fluctuations in foreign currency rates relative to the yen in the course of our trading activities, such as export, import and offshore trading. While we use forward contracts and other hedging strategies, there is no assurance that we can completely avoid foreign currency risk. In addition, dividends received from overseas businesses and equity in earnings of overseas consolidated subsidiaries and equity-method affiliates are relatively high in proportion to our consolidated net income. Because most of these earnings are denominated in foreign currencies, which are converted to yen solely for reporting purposes, an appreciation in the yen relative to foreign currencies has a negative impact on consolidated net income. In terms of sensitivity, a 1 yen change relative to the U.S. dollar would have an approximate 2.5 billion yen effect on consolidated net
13

income. Regarding our investments in overseas businesses, an appreciation in the yen poses the risk of lowering shareholders’ equity through a negative effect on the foreign currency translation adjustments account. Consequently, we implement various measures to prevent increased exposure to foreign currency risk on investments, such as by hedging foreign currency risks with respect to new large investments. However, there is no assurance that we can completely avoid these risks.
3) Stock Price Risk As of March 31, 2014, we owned approximately 1,390.0 billion yen (market value basis) in marketable securities, mostly equity issues of customers, suppliers and affiliated companies. These investments expose us to the risk of fluctuations in stock prices. The valuation above represented net unrealized gains of approximately 560.0 billion yen based on market prices, a figure that could change depending on future trends in stock prices. In our corporate pension fund, some of the pension assets managed are marketable stocks. Accordingly, a fall in stock prices could cause an increase in pension expenses by reducing pension assets.
4) Interest Rate Risk As of March 31, 2014, we had gross interest-bearing liabilities of approximately ¥5,987.9 billion. Because almost all of these liabilities bear floating interest rates, there is a risk of an increase in interest expenses caused by a rise in interest rates. The vast majority of these interest-bearing liabilities are corresponding to trade receivables, loans receivable and other operating assets that are positively affected by changes in interest rates. Because a rise in interest rates produces an increase in income from these assets, while there is a times differences, interest rate risk is offset. For the remaining interest-bearing liabilities exposed to interest rate risk without such offsets, commensurate asset holdings such as investment securities, property and
14

equipment generate trading income as well as other income streams such as dividends that are strongly correlated with economic cycles. Accordingly, even if interest rates increase as the economy improves, leading to higher interest expenses, we believe that these expenses would be offset by an increase in income from the corresponding asset holdings. However, our operating results may be negatively affected temporarily if there is a rapid rise in interest rates because increased income from commensurate asset holdings would fail to offset the effects of a preceding increase in interest expenses. To monitor market movements in interest rates and respond flexibly to market risks, we established the ALM (Asset Liability Management) Committee. This committee establishes fund procurement strategy and manages the risk of interest rate fluctuations.
(3) Credit Risk We extend credit to customers in the form of trade credit, including accounts receivables and advance payments, finance, guarantees and investments due to our various operating transactions. We are therefore exposed to credit risk in the form of losses arising from deterioration in the credit of or bankruptcy of customers. Furthermore, we utilize derivative instruments, primarily swaps, options and futures, for the purpose of hedging risks. In this case, we are exposed to the credit risk of the counterparties to these derivative instruments. To manage this risk, we have established credit and transaction limits for each customer as well as introduced an internal rating system. Based on internal rules determined by internal ratings and the amount of credit, we also require collateral or a guarantee depending on the credit profile of the counterparty. There is no guarantee that we will be able to completely avoid credit risk with these risk hedging strategies. We reduce transactions and take measures to protect our receivables when there is deterioration in the credit condition of customers. We also have a policy for dealing with bankrupt
15

customers and work to collect receivables. However, failure to collect receivables and other credit could affect our operating results.
(4) Country Risk We bear country risk in relation to transactions and investments with overseas companies in the form of delays or inability to collect cash or conduct business activities due to political and socioeconomic conditions in the countries where they are domiciled. We take appropriate risk hedging measures that involve, in principle, hedges via third parties through such means as taking out insurance, depending on the nature of the project. Furthermore, we have established a Country Risk Committee, under which country risk is managed through a country risk countermeasure system. The country risk countermeasure system classifies countries with which we trade into six categories based on risk money in terms of the sum total of the amount of investments, advances, and guarantees, and the amount of trade receivables, net of hedges, as well as creditworthiness by country (country rating). Country risk is controlled through the establishment of risk limits for each category. However, even with these risk hedging measures, it is difficult to completely avoid risks caused by deterioration in the political, economic, or social conditions in the countries or regions where our customers, portfolio companies or we have ongoing projects. Such eventualities may have a significant impact on our operating results.
(5) Business Investment Risk We participate in the management of various companies by acquiring equity and other types of interests. These business investment activities are carried out with the aim of increasing our commercial rights and deriving capital gains. However, we bear various risks related to business investments, such as the possible inability to recover our investments and exit losses and being unable to earn the planned profits. Regarding the management of business investment risk, in the case of new business
16

investments, we clarify the investment meaning and purpose, quantitatively grasp the downside risk of investments and evaluate whether the return on our investments made based on the characteristics of a business exceeds the minimum expected rate of return. After investing, we manage risk on an individual basis with respect to business investments to achieve the investment goals set forth in the business plan formulated every year. Furthermore, we apply exit rules for the early sale of our equity interest or the liquidation of the investee in order to efficiently replace assets in our portfolio. While we follow strict standards for the selection and management of investments, it is difficult to completely avoid the risk of investments not delivering the expected profits. Therefore, we may incur losses resulting from such actions as the withdrawal from an investment.
(6) Risks Related to Specific Investments (Investment in and Operations with Mitsubishi Motors Corporation) Following requests from Mitsubishi Motors Corporation (MMC), we injected equity totaling 140.0 billion yen in MMC from June 2004 through January 2006 by subscribing to ordinary and preferred MMC shares. Based on the Mitsubishi Motors Capital Restructuring Plan announced by MMC on November 6, 2013, we invested part of MMC’s preferred shares that we own in an anonymous association, and converted all the remaining shares into MMC’s common shares on March 5, 2014. Furthermore, we cooperate with MMC developing business at sales companies mainly outside of Japan and across the related value chain. Our risk exposure to MMC proper was approximately 160.0 billion yen as of March 31, 2014. Our risk exposure in connection with investments in businesses, finance, trade receivables and other related business was approximately 205.0 billion yen as of March 31, 2014 (of which, risk exposure in connection with the sales finance business was approximately 95.0 billion yen). Our total MMC-related risk exposure, including both the aforementioned risk exposure to MMC proper and our risk exposure to related business, was thus around 365.0 billion yen as of
17

March 31, 2014. For the year ended March 2014, MMC posted consolidated sales of 2,093.4 billion yen, operating profit of 123.4 billion yen and a net profit of 104.7 billion yen.
(Acquisition of Interest in Chilean Copper Asset) On November 10, 2011, we completed the acquisition of 24.5% of Anglo American Sur, S.A. (AAS) for US$5.39 billion (approximately 420.0 billion yen). AAS is a Chilean copper mining and smelting company, wholly owned by Anglo American plc (AAC). The acquisition is the result of a sales process initiated by AAC. On August 23, 2012, Mitsubishi Corporation agreed to transfer 4.1% of its 24.5% shareholding in AAS to AAC for the sum of US$895 million. As a result of this deal, Mitsubishi Corporation’s risk exposure to this project at March 31, 2014 was approximately 350.0 billion yen. AAC sold a 29.5% shareholding in AAS to a joint venture between Chile's state-run copper producer Corporación Nacional del Cobre de Chile and Mitsui & Co., Ltd., comprising this 4.1% share from Mitsubishi Corporation and 25.4% owned by AAC. Following completion of these transactions, AAC has a 50.1% shareholding in AAS, the aforementioned joint venture has a 29.5% shareholding, and Mitsubishi Corporation has a 20.4% shareholding, thereby forming a strong 4-company partnership. AAS holds a significant portfolio of copper assets in Chile, including the Los Bronces mine, the El Soldado mine, the Chagres smelter and large-scale prospective exploration properties. AAS completed an expansion project at the Los Bronces mine in November 2011, and with the Los Bronces mine at full production in 2012, AAS’ annual copper production became approximately 470,000 tonnes (2013 result). Mitsubishi Corporation has designated the expansion of high-quality resource investments and the expansion of its resource portfolio with
18

sustainable growth as an important area. Mitsubishi Corporation will continue to grow its business in this area.
(7) Risks Related to Compliance We are engaged in businesses in all industries through our many offices around the world. These activities subject us to a wide variety of laws and regulations. Specifically, we must comply with the Companies Act, tax laws, Financial Instruments and Exchange Act, anti-monopoly laws, international trade-related laws, environmental laws and various business laws in Japan. In addition, in the course of conducting business overseas, we must abide by the laws and regulations in the countries and regions where we operate. We have established a Compliance Committee, which is headed by a Chief Compliance Officer, who is at the forefront of our efforts to raise awareness of compliance. This officer also directs and supervises compliance with laws and regulations on a consolidated basis. Notwithstanding these initiatives, compliance risks cannot be completely avoided. Failure to fulfill our obligations under related laws and regulations could affect our businesses and operating results.
(8) Risks From Natural and Other Types of Disasters An unforeseeable event, such as a natural disaster like an earthquake, heavy rain or flood, or infectious diseases such as a new strain of influenza or a large-scale accident, that affects our employees and damages our offices, facilities or systems could hinder sales and production activities. We have established adequate countermeasures, having implemented an employee safety check system; formulated a disaster contingency manual and a business contingency plan (BCP); implemented earthquake-proof measures for buildings, facilities or systems (including backup of data); introduced a program of disaster prevention drills; prepared stocks of necessary goods; and collaborated and shared information with offices,
19

subsidiaries and related companies both in Japan and overseas. However, no amount of preparation of this sort can completely avoid the risk of damage caused by a natural disaster. Accordingly, damage from a natural disaster could affect the company’s operating results. Note: Earnings forecasts and other forward-looking statements in this release are based on data currently available to management and certain assumptions that management believes are reasonable. Actual results may therefore differ materially from these statements for various reasons.
20

MAJOR SUBSIDIARIES MAJOR EQUITY-METHOD AFFILIATED COMPANIES
Diamond Generating Asia, Limited Chiyoda CorporationDiamond Generating CorporationMitsubishi Corporation Machinery, Inc.Mitsubishi Corporation Power Systems, Inc.
ENERGY BUSINESS
METALS
MACHINERY
CHEMICALS
OTHER
PRODUCTS OR SERVICES
Finance, Accounting,Human Resources Management,General Affairs, IT, Insurance, etc.
Exportadora de Sal, S.A de C.V.Metanol de Oriente, METOR, S.A.Petronas Chemicals Aromatics Sdn. Bhd.SPDC Ltd.
Lawson, Inc.Life CorporationMitsubishi Cement Corporation
Iron Ore Company of CanadaMozal S.A.R.L.
JECO CorporationMC Resource Development Ltd.Metal One CorporationMitsubishi Development Pty Ltd
Diamond Gas Resources Pty., Ltd.Mitsubishi Shoji Sekiyu Co., Ltd.Petro-Diamond Inc.
B.V.Mitsubishi Corporation LT, Inc.Diamond Realty Investments, Inc.MC Aviation Partners Inc.MC Aviation Financial Services (Europe)Mitsubishi Corp.-UBS Realty Inc.
New Energy,Overseas Power Generation, Water,Power & Electrical Systems,Railways, Plants, etc.
Foods, Textiles, Daily Necessities,Healthcare, Distribution, Retail, etc.
Alpac Forest Products Inc.Kentucky Fried Chicken Japan Ltd.Mitsubishi Shoji Construction Materials Ltd.Mitsubishi Shokuhin Co., Ltd.Nippon Care Supply Co., Ltd.Nosan CorporationPrinces LimitedToyo Reizo Co., Ltd.
GLOBALENVIRONMENTAL &INFRASTRUCTURE
BUSINESS
P.T. Krama Yudha Tiga Berlian Motors
SIGMAXYZ Inc.
Note:1. The total number of consolidated subsidiaries and equity-method affiliates represents companies which the Company directly consolidates or to which it applies the equitymethod. 603 companies directly consolidated by subsidiaries as of March 31, 2014 are excluded from this total.2. Effective from April 1, 2013, infrastructure-related businesses that were previously included in Machinery were integrated with the Global Environment & InfrastructureBusiness Development Group included in Other. Moreover, the infrastructure-related businesses of the group are now shown as the Global Environment & InfrastructureBusiness Group because the Company has managed and controlled these businesses as an independent business segment from the year ended March 2014.3. MC Food Specialties Inc. was renamed from Kirin Kyowa Foods Company, Limited effective January 1, 2014.4. KFC Holdings Japan, Ltd.was renamed from Kentucky Fried Chicken Japan Ltd. effective April 1, 2014.
IT Frontier CorporationMC Finance & Consulting AsiaMC Finance Australia Pty Ltd.Mitsubishi Corporation Financial & ConsultingAsiaMitsubishi Corporation Finance Plc
Petrochemical Products,Raw Material for Synthetic Fiber,Fertilizer, Functional Chemicals,Synthetic Raw Materials and Plastics,Food Additives, Feed Additives,Pharmaceuticals and AgriculturalChemicals, Electronic Materials, etc.
Chuo Kagaku Co., Ltd.Kohjin Holdings Co., Ltd.MC Ferticom Co., Ltd.MC Food Specialties Inc.Mitsubishi Corporation Life Science LimitedMitsubishi Shoji Chemical Corp.Mitsubishi Shoji Plastics Corp.
REGIONALSUBSIDIARIES
Subsidiaries and Affiliated Companies
Mitsubishi Corporation's subsidiaries and affiliates are diverse organizations engaged in a wide variety of activities on a global scale. We manufacture and market a widerange of products, including energy, metals, machinery, chemicals and living essentials through our domestic and overseas network. We also are involved in diversebusinesses by actively investing in areas such as natural resources development and infrastructure, and we are engaged in finance businesses. We are also engaged indiversified businesses such as creating new business models in the fields of new energy and the environment, and new technology-related businesses. Some of our basicfunctions enhance the above activities and enable us to provide various services to customers. Mitsubishi Corporation organizes business groups according to products and services. Products and services are managed through the business groups of the Parentcompany, subsidiaries, and Affiliated companies (Subsidiaries: 409; Affiliated companies: 217). The following table shows products and services by business groups and major subsidiaries and affiliated companies.
INDUSTRIALFINANCE,
LOGISTICS &DEVELOPMENT
LIVINGESSENTIALS
Industrial Machinery,Ships, Satellite & Aerospace,Automobiles, etc.
Handling of a broad range ofproducts, similar to the Parentcompany in Japan
Mitsubishi Corporation (Americas)Mitsubishi Corporation International (Europe)Plc.Mitsubishi Corporation (Shanghai) Ltd.
Asset Management, BuyoutInvestment,Leasing, Real Estate (Development &Finance), Logistics, etc.
Mitsubishi Auto Leasing Holdings CorporationMitsubishi Ore Transport Co., Ltd.Mitsubishi UFJ Lease & Finance Company Ltd.
Petroleum Products, Carbon,Crude Oil, LPG, LNG, etc.
Brunei LNG Sendirian BerhadJapan Australia LNG (MIMI) Pty., Ltd.
Steel Products, Coals, Iron Ore,Non-Ferrous Metals & Minerals,Non-Ferrous Metal Products, etc.
MCE Bank GmbHNikken CorporationTri Petch Isuzu Sales Co., Ltd.The Colt Car Company Ltd.
21

Management Policies New Strategic Direction In May 2013, Mitsubishi Corporation developed its new management strategy, entitled New Strategic Direction (charting a new path toward sustainable growth). It went into effect in the year ended March 2014. Amidst major changes in Mitsubishi Corporation’s business models and the external environment, we have abolished our traditional “midterm management plan” concept of committing to fixed financial targets three years in the future, in favor of a long-term, circa 2020 growth vision. To realize this vision we have set down our “New Strategic Direction,” which consists of basic concepts on management policy together with our business and market strategies. New Strategic Direction seeks to recognize our value and upside potential as a sogo shosha capable of “providing stable earnings throughout business cycles by managing a portfolio diversified by business model, industry, market and geography.” As we continuously optimize our portfolio, we will strive to realize our growth vision and enhance the Mitsubishi Corporation’s overall corporate value. Mitsubishi Corporation circa 2020: Double Business
Mitsubishi Corporation’s ability to maintain stable earnings is based on its improved concept of portfolio management. Acknowledging both this strength and our company’s upside potential, we have set down our circa 2020 growth vision as follows:
Resource (LNG, coking coal, copper): Double Equity Production
(compared to the year ended March 2013)
Non-Resource: Double Earnings Level
(compared to the year ended March 2013)
Mitsubishi Corporation circa 2020 Portfolio Vision:
Optimal Diversification & Winning Businesses
22

To intensively allocate management resources to current and future “winning businesses” while ensuring optimal diversification, we envision reducing the number of business sub-segments from the current total of 47 to between 35 and 40.
To strengthen these “winning businesses,” we also envision reshaping the portfolio to consist of at least 10 business sub-segments earning more than 20 billion yen in net income, and between 10 and 15 business sub-segments earning between 10 and 20 billion yen in net income.
Management Policies
Our basic management policy is to create sustainable corporate value through business activities and strengthen “winning businesses” through the proactive reshaping of the portfolio in order to win competition at a global scale.
Our investment policy is to accelerate divestments selectively and free up capital for new investments, while continuing to invest at a rate in line with the average of the 3 years under Midterm Corporate Strategy 2012, in order to improve our earnings base.
Our financial policy is to increase our focus on financial discipline including funding our investments within our own cash flow assuming a base earnings level of 350.0 billion yen per annum. Furthermore, we will strive to deliver a return on equity of 12-15% in the medium to long term.
With regard to dividend policy, we will introduce a two-staged dividend policy with a base dividend and a performance based variable dividend in order to provide a stable return to shareholders, regardless of changes in the external environment.
23

Market Strategy / Business Strategy In terms of our market strategy, we will accelerate our global business development by leveraging our shift towards Asian markets, which are gaining greater international presence not only as resource and industrial markets, but as consumer markets as well. Our objective will be to ensure sustainable growth by capturing growth in Asia. This will entail securing global supply sources to meet the increasing demand for raw materials and other commodities in Asia, and establishing a local presence within the region, through M&As, strategic alliances, and other proactive initiatives.
In terms of our business strategy, our resources business will be transitioning to the project development stage toward full operation, which will primarily entail upgrading and expanding our existing asset base (coking coal, copper, LNG and other core assets). At the same time, we will refocus on productivity and cost, be it capital or operational, to make more efficient use of our management resources.
In non-resource fields, we will accelerate the shift of management resources to current and future “winning businesses” to realize our growth vision circa 2020, which aims to build multiple robust and large-scale earnings drivers. While selectively growing businesses (automotive, foods, retail, power generation and life sciences), we will be transforming our business models, such as developing downstream shale gas operations in North America and shifting to industrial finance’s asset management business.
Looking at the outlook for the global business environment, the global economy is expected to remain shrouded in uncertainty, with the economies of developed countries still on a path to recovery, and signs of a slowdown in economic growth evident even in emerging countries such as China, India and Brazil.
Conscious of these conditions, we will forge ahead with New Strategic
24

Direction as we work to create an even stronger earnings base and financial position. In tandem, through our diverse businesses, we aim to create sustainable corporate value while helping solve global problems. Moreover, guided by the spirit of the Three Corporate Principles, which form our corporate philosophy, we are determined to support economic activities and contribute to society through our businesses.
25

ASSETS
March 31 March 31 Increase or
2013 2014 [-]decrease
Current assets:
Cash and cash equivalents 1,345,755 1,322,964 -22,791
Time deposits 123,654 142,705 19,051
Short-term investments 26,880 23,497 -3,383
Notes receivables 341,810 365,155 23,345
Accounts receivables 2,505,518 2,627,752 122,234
Loans and other receivables 455,373 438,234 -17,139
Receivables from Affiliated companies 288,113 256,438 -31,675
Inventories 1,202,295 1,269,679 67,384
Advance payments to suppliers 145,270 141,381 -3,889
Deferred income taxes 62,135 58,962 -3,173
Other current assets 358,374 503,151 144,777
Allowance for doubtful receivables (28,917) (26,713) 2,204
Total current assets 6,826,260 7,123,205 296,945
Investments and noncurrent receivables:
Investments in and advances to Affiliated companies 2,554,161 2,963,404 409,243
Joint investments in real estates 31,393 33,471 2,078
Other investments 1,497,521 1,379,013 -118,508
Noncurrent notes, loans and accounts receivable-trade 663,884 689,994 26,110
Allowance for doubtful receivables (29,528) (42,586) -13,058
Total investments and noncurrent receivables 4,717,431 5,023,296 305,865
Property and equipment:
Property and equipment 3,952,731 4,278,032 325,301
Less accumulated depreciation (1,465,267) (1,562,091) -96,824
Property and equipment - net 2,487,464 2,715,941 228,477
Other assets 379,510 429,257 49,747
Total 14,410,665 15,291,699 881,034
Consolidated Financial Statements
1. CONSOLIDATED BALANCE SHEETS (US GAAP)March 31, 2013 and 2014
Millions of Yen
Mitsubishi Corporation and subsidiaries
26

Consolidated Financial Statements
1. CONSOLIDATED BALANCE SHEETS (US GAAP)March 31, 2013 and 2014
Mitsubishi Corporation and subsidiaries
LIABILITIES AND EQUITY
March 31 March 31 Increase or
2013 2014 [-]decrease
Current liabilities:
Short-term debt 799,983 824,467 24,484
Current maturities of long-term debt 590,976 542,037 -48,939
Notes and acceptances payables 199,954 199,012 -942
Accounts payables 2,230,074 2,222,955 -7,119
Payables to Affiliates companies 227,354 175,670 -51,684
Advances from customers 136,416 122,545 -13,871
Accrued income taxes 56,345 86,251 29,906
Other accrued expenses 126,867 138,287 11,420
Other current liabilities 360,144 390,693 30,549
Total current liabilities 4,728,113 4,701,917 -26,196
Long-term liabilities:
Long-term debt 4,498,683 4,692,531 193,848
Accrued pension and severance liabilities 57,702 57,198 -504
Deferred income taxes 264,616 239,477 -25,139
Other noncurrent liabilities 305,501 396,550 91,049
Total noncurrent liabilities 5,126,502 5,385,756 259,254
Total liabilities 9,854,615 10,087,673 233,058
Mitsubishi Corporation shareholders' equity:
Common stock 204,447 204,447 -
Additional paid-in capital 262,705 265,972 3,267
Retained earnings:
Appropriated for legal reserve 44,933 45,761 828
Unappropriated 3,563,056 3,906,472 343,416
Accumulated other comprehensive income:
Net unrealized gains on securities available-for-sale 305,447 244,156 -61,291
Net unrealized losses on derivatives (4,768) (3,052) 1,716
Defined benefit pension plans (87,887) (68,204) 19,683
Foreign currency translation adjustments (90,265) 192,773 283,038
Less treasury stock (17,970) (14,081) 3,889
Total Mitsubishi Corporation shareholders' equity 4,179,698 4,774,244 594,546
Noncontrolling interest 376,352 429,782 53,430
Total equity 4,556,050 5,204,026 647,976
Total 14,410,665 15,291,699 881,034
Millions of Yen
27

%
Revenues:
Revenues from trading, manufacturing and other activities 5,376,773 7,015,801 1,639,028 30.5
Trading margins and commissions on trading transactions 592,001 573,454 -18,547 -3.1
Total revenues 5,968,774 7,589,255 1,620,481 27.1
Cost of revenues from trading, manufacturing and other activities (4,939,117) (6,429,114) -1,489,997 30.2
Gross profit 1,029,657 1,160,141 130,484 12.7
Other income and expenses:
Selling, general and administrative (889,955) (941,679) -51,724 5.8
Provision for doubtful receivables (5,827) (19,995) -14,168 243.1
Interest expense - net (5,990) (6,023) -33 0.6
Dividend income 144,593 164,883 20,290 14.0
Gain on marketable securities and investments - net 34,132 135,544 101,412 297.1
Loss on property and equipment - net (24,436) (16,878) 7,558 -30.9
Other income (expense) - net 55,032 (43,760) -98,792 -179.5
Total (692,451) (727,908) -35,457 5.1
Income before income taxes and equity in earnings of Affiliated companies and other 337,206 432,233 95,027 28.2
Income taxes:
Current (120,552) (159,912) -39,360 32.6
Deferred 7,066 (10,523) -17,589 -248.9
Income before equity in earnings of Affiliated companies and other 223,720 261,798 38,078 17.0
Equity in earnings of Affiliated companies and other 164,274 208,507 44,233 26.9 Net income 387,994 470,305 82,311 21.2 Less net income attributable to the noncontrolling interest (27,966) (25,512) 2,454 -8.8 Net income attributable to Mitsubishi Corporation 360,028 444,793 84,765 23.5
NOTE: The Company displays revenues and cost of revenues in accordance with ASC Paragraph 605-45 [Revenue Recognition - Principal Agent Considerations].
Operating transactions and operating income, as presented below, are voluntary disclosures solely for the convenience of investors in Japan.
The figures are as follows:
Increase or
[-] decrease %
Operating transactions 20,207,183 21,950,137 1,742,954 8.6
Operating income 133,875 198,467 64,592 48.2
Operating transactions represent the gross transaction volume or the aggregate nominal value of the sales contracts in which the Company acts
as principal and transactions in which the Company serves as agent.
Operating income reflects the Company's (a) gross profit, (b) selling, general and administrative expenses, and (c) provision for doubtful receivables.
Operating transactions and operating income, as presented above, are non-US GAAP measures commonly used by similar Japanese trading companies and
should not be construed as equivalent to, or a substitute or proxy for, revenues, or as an indicator of our operating performance, liquidity or cash flows
generated by operating, investing or financing activities.
Increase or[-] decrease
Year endedMarch 31, 2013
Year endedMarch 31, 2014
Year endedMarch 31,
2013
Year endedMarch 31,
2014
2. CONSOLIDATED STATEMENTS OF INCOME AND Mitsubishi Corporation and subsidiaries
Millions of Yen
COMPREHENSIVE INCOME
CONSOLIDATED STATEMENTS OF INCOME (US GAAP)Years ended March 31, 2013 and 2014
28

Millions of Yen
Comprehensive income
Net income 387,994 470,305
Other comprehensive income (loss), net of tax:
Net unrealized gains (losses) on securities available for sale 76,992 (60,012)
Net unrealized gains on derivatives 3,036 2,113
Defined benefit pension plans (10,171) 20,187
Foreign currency translation adjustments 351,518 292,017
Total other comprehensive income, net of tax 421,375 254,305
Comprehensive income 809,369 724,610
Comprehensive income attributable to the noncontrolling interest (43,990) (36,671)
Comprehensive income attributable to Mitsubishi Corporation 765,379 687,939
Year endedMarch 31, 2013
Year endedMarch 31, 2014
Years ended March 31, 2013 and 2014CONSOLIDATED STATEMENTS OF COMPREHENSIVE INCOME (US GAAP)
29

Millions of Yen
Shareholders' Equity
Common stock:
Balance, beginning of year 204,447 204,447
Balance, end of year 204,447 204,447
Additional paid-in capital:
Balance, beginning of year 262,039 262,705
Compensation costs related to stock options 1,006 1,322
Sales of treasury stock upon exercise of stock options (925) (1,412)
Equity transactions with the noncontrolling interest and others 585 3,357
Balance, end of year 262,705 265,972
Retained earnings appropriated for legal reserve:
Balance, beginning of year 44,133 44,933
Transfer from unappropriated retained earnings 800 828
Balance, end of year 44,933 45,761
Unappropriated retained earnings:
Balance, beginning of year 3,300,588 3,563,056
Net income attributable to Mitsubishi Corporation 360,028 444,793
Cash dividends paid to Mitsubishi Corporation's shareholders (95,503) (98,862)
Transfer to retained earnings appropriated for legal reserve (800) (828)
Sales of treasury stock upon exercise of stock options (1,257) (1,687)
Balance, end of year 3,563,056 3,906,472
Accumulated other comprehensive income (loss), net of tax:
Balance, beginning of year (282,824) 122,527
Net unrealized gains (losses) on securities available for sale 75,085 (61,291)
Net unrealized gains on derivatives 3,665 1,716
Defined benefit pension plans (9,584) 19,683
Foreign currency translation adjustments 336,185 283,038
Balance, end of year 122,527 365,673
Treasury stock:
Balance, beginning of year (20,565) (17,970)
Sales of treasury stock upon exercise of stock options 2,578 3,628
Purchases and sales-net 17 261
Balance, end of year (17,970) (14,081)
Total Shareholders' Equity 4,179,698 4,774,244
Noncontrolling interest
Balance, beginning of year 318,959 376,352
Cash dividends paid to the noncontrolling interest (14,584) (23,328)
Equity transactions with the noncontrolling interest and others 27,987 40,087
Net income attributable to the noncontrolling interest 27,966 25,512
Net unrealized gains on securities available for sale, net of tax 1,907 1,279
Net unrealized (losses) gains on derivatives, net of tax (629) 397
Defined benefit pension plans, net of tax (587) 504
Foreign currency translation adjustments, net of tax 15,333 8,979
Balance, end of year 376,352 429,782
Mitsubishi Corporation and subsidiaries3. CONSOLIDATED STATEMENTS OF EQUITY (US GAAP)
Years ended March 31, 2013 and 2014
Year endedMarch 31, 2013
Year endedMarch 31, 2014
30
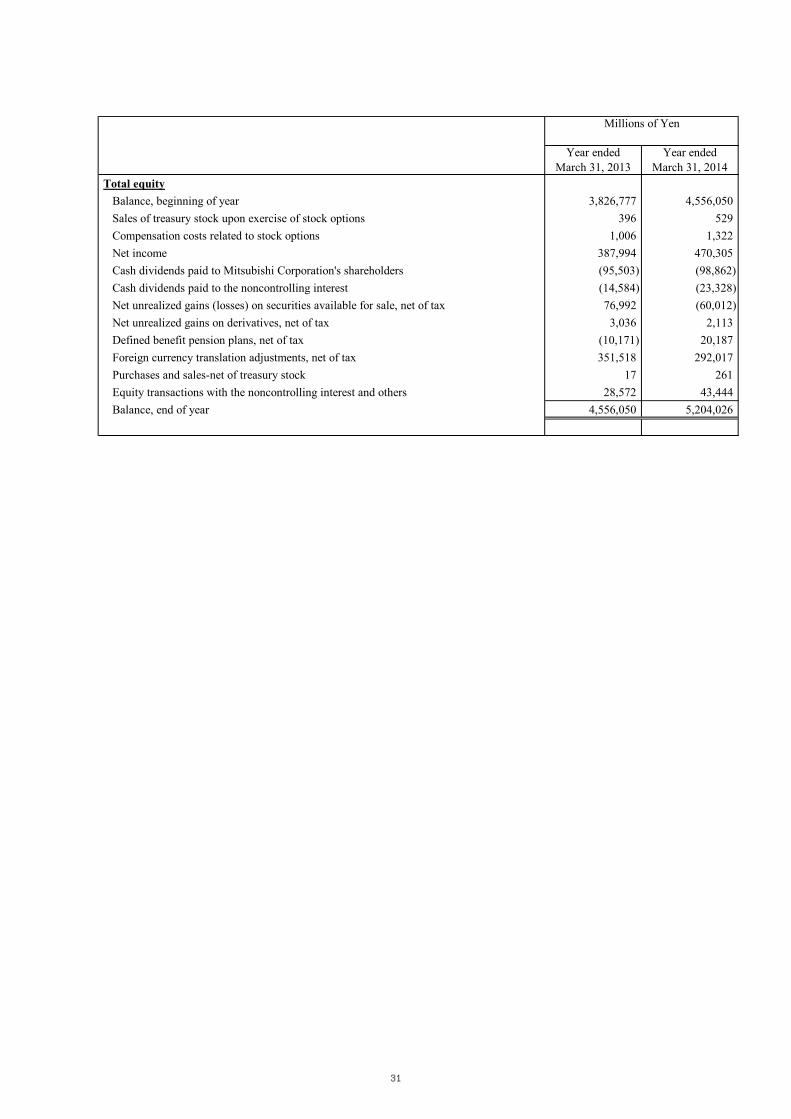
Millions of Yen
Total equity
Balance, beginning of year 3,826,777 4,556,050
Sales of treasury stock upon exercise of stock options 396 529
Compensation costs related to stock options 1,006 1,322
Net income 387,994 470,305
Cash dividends paid to Mitsubishi Corporation's shareholders (95,503) (98,862)
Cash dividends paid to the noncontrolling interest (14,584) (23,328)
Net unrealized gains (losses) on securities available for sale, net of tax 76,992 (60,012)
Net unrealized gains on derivatives, net of tax 3,036 2,113
Defined benefit pension plans, net of tax (10,171) 20,187
Foreign currency translation adjustments, net of tax 351,518 292,017
Purchases and sales-net of treasury stock 17 261
Equity transactions with the noncontrolling interest and others 28,572 43,444
Balance, end of year 4,556,050 5,204,026
Year endedMarch 31, 2013
Year endedMarch 31, 2014
31

Mitsubishi Corporation and subsidiaries4. CONSOLIDATED STATEMENTS OF CASH FLOWS (US GAAP)
Years ended March 31, 2013 and 2014
Year endedMarch 31, 2013
Year endedMarch 31, 2014
Operating activities:
Net income 387,994 470,305 Adjustments to reconcile net income to net cash provided by operating activities:
Depreciation and amortization 157,405 191,913
Provision for doubtful receivables 5,827 19,995
Gain on marketable securities and investments - net (34,132) (135,544)
Loss on property and equipment - net 24,436 16,878
Equity in earnings of Affiliated companies and other, less dividends received (29,658) (48,634)
Deferred income taxes (7,066) 10,523
Changes in operating assets and liabilities:
Short-term investments 638 3,541
Notes and accounts receivables 64,760 (141,655)
Inventories (100,478) (70,978)
Notes, acceptances and accounts payables 5,150 (95,022)
Other - net (71,563) 36,820
Net cash provided by operating activities 403,313 258,142
Investing activities:Expenditures for property and equipment and other (577,961) (478,177)
Proceeds from sales of property and equipment and other 45,304 115,873
Investments in and advances to Affiliated companies (420,990) (285,844)
Proceeds from sales of investments in and collection of advances to Affiliated companie 166,120 198,856
Purchases of available-for-sale securities and other investments (80,819) (96,615)
Proceeds from sales and maturities of available-for-sale securities and other investments 169,875 287,378
Increase in loans receivable (198,252) (151,757)
Collection of loans receivable 148,503 248,036
Net increase in time deposits (4,257) (20,439)
Net cash used in investing activities (752,477) (182,689)
Financing activities:Net decrease in short-term debt (147,553) (142,380)
Proceeds from long-term debt - net of issuance cost 1,385,319 843,878
Repayment of long-term debt (728,347) (732,145)
Payment of dividends (95,503) (98,862)
Payment of dividends to the noncontrolling interest (14,584) (23,328)
Payment for acquisition of subsidiary's interests from the noncontrolling interest (893) (5,556)
Proceeds from sales of subsidiary's interests to the noncontrolling interest 2,858 35,472
Other - net 390 790
Net cash provided by (used in) financing activities 401,687 (122,131)
Effect of exchange rate changes on cash and cash equivalents 40,281 23,887
Net increase (decrease) in cash and cash equivalents 92,804 (22,791)
Cash and cash equivalents, beginning of year 1,252,951 1,345,755
Cash and cash equivalents, end of year 1,345,755 1,322,964
Millions of Yen
32

5. Notes Concerning Going Concern Assumption None
6. Basis for Preparation of Consolidated Financial Statements
(1) Basic Accounting Policies The accompanying consolidated financial statements of Mitsubishi Corporation and its subsidiaries have been
prepared in accordance with accounting principles generally accepted in the United States of America (U.S. GAAP).
The significant differences between U.S. and Japanese accounting standards applicable to the companies relate to
the following:
a. Valuation of investments
b. Deferral of gain on sales of properties for tax purposes (Not permitted under U.S. GAAP)
c. Derivative instruments and hedge accounting
d. Pension and retirement benefit accounting
e. Accounting for business combinations and goodwill and other intangible assets
(2) Scope of Consolidation and Application of the Equity Method
1) Number of consolidated subsidiaries and equity-method affiliates
As of March 31, 2013 As of March 31, 2014 Change
Consolidated subsidiaries 419 409 -10
Equity-method affiliates 208 217 9
Total 627 626 -1
Note: The total number of consolidated subsidiaries and equity-method affiliates represents companies which the
Company directly consolidates or to which it applies the equity method. 557 companies and 603 companies directly
consolidated by subsidiaries as of March 31, 2013 and March 31, 2014, respectively, are excluded from this total.
2) Main changes in the scope of consolidation and application of the equity method
[Consolidated subsidiaries]
New: Jingumae 425
Kirin Kyowa Foods Company, Limited
(Renamed as MC Food Specialties Inc.)
Los Grobo Ceagro do Brasil S.A. (Classification change from equity-method affiliate)
(Renamed as Agrex do Brasil)
Excluded: MC GIP Holdings, Inc.
(Business transferred to MC GIP-UK)
[Equity-method affiliates]
Excluded: PT. Kaltim Parna Industri
Hokuetsu Kishu Paper Co., Ltd.
Ensuiko Sugar Refining Co., Ltd.
T-Gaia Corporation
33

(1) Operating segment information (US GAAP)
Year ended March 31, 2013
Adjustments
Other and
Eliminations
Gross profit…………………… 18,678 56,006 52,811 133,602 190,702 92,109 464,865 1,008,773 23,165 (2,281) 1,029,657
16,883 16,512 72,195 18,537 13,688 13,724 22,788 174,327 (10,433) 380 164,274
14,431 24,963 142,376 36,910 55,634 22,627 67,537 364,478 (543) (3,907) 360,028
Segment assets………………… 722,469 1,027,218 1,909,013 4,145,036 1,815,574 916,614 2,612,950 13,148,874 2,786,685 (1,524,894) 14,410,665
Operating transactions ………… 814,069 234,300 4,964,124 4,007,403 2,195,853 2,396,872 5,564,160 20,176,781 135,285 (104,883) 20,207,183
Year ended March 31, 2014
Adjustments
Other and
Eliminations
Gross profit…………………… 27,241 58,423 44,379 235,919 196,580 102,485 478,585 1,143,612 23,276 (6,747) 1,160,141
19,251 25,855 65,943 24,292 30,333 22,430 23,539 211,643 (3,485) 349 208,507
22,210 31,088 147,940 41,174 87,106 32,777 68,287 430,582 13,942 269 444,793
Segment assets………………… 845,459 1,054,384 2,179,854 4,341,554 1,901,748 1,006,959 2,691,533 14,021,491 3,108,709 (1,838,501) 15,291,699
Operating transactions ………… 960,293 213,339 5,532,352 3,933,554 2,115,043 3,035,402 6,164,505 21,954,488 105,045 (109,396) 21,950,137
NOTES:(1) "Operating transactions" is a voluntary disclosures commonly made by Japanese trading companies, and is not meant to represent sales or revenues in accordance with U.S.GAAP.
(2) "Other" represents corporate departments which primarily provide services and operational support to the Company and Affiliated companies.
This column also includes certain revenues and expenses from business activities related to financing and human resource services that are not allocated to reportable operating segments.
Unallocated corporate assets categorized in "Other" consist primarily of cash, time deposits and securities for financial and investment activities.
(3) "Adjustments and Eliminations" include certain income and expense items that are not allocated to reportable operating segments and intersegment eliminations.
(4) Effective from April 1, 2013, the infrastructure-related business in the "Machinery," was transferred to the "Global Environment & Infrastructure Business Development," that was previously included in "Other."
In addition, from the year ended March 31, 2014, the Company applies the management control as an independent business segment to the infrastructure-related business of the "Global Environment & Infrastructure Business."
With this change, the consolidated financial position and the results of operations of related reportable operating segments for the year ended March 31, 2013 have also been reclassified accordingly.
Consolidated
Equity in earnings of Affiliated companies and other…
Net income attributable to Mitsubishi Corporation………
Millions of Yen
GlobalEnvironmental& Infrastructure
Business
GlobalEnvironmental& Infrastructure
Business
Millions of Yen
Equity in earnings of Affiliated companies and other…
Net income (loss) attributable to Mitsubishi Corporation………
IndustrialFinance,
Logistics &Development
EnergyBusiness
Metals Machinery ChemicalsLiving
EssentialsTotal
Consolidated
7. Notes Concerning Consolidated Financial Statements
IndustrialFinance,
Logistics &Development
EnergyBusiness
Metals Machinery ChemicalsLiving
EssentialsTotal
34

Operating transactions
Japan 16,134,926 16,836,036 701,110
U.S.A. 1,084,460 1,489,358 404,898
Thailand 922,238 923,468 1,230
Other 2,065,559 2,701,275 635,716
Total 20,207,183 21,950,137 1,742,954
Gross profit
Japan 772,561 773,124 563
Thailand 72,368 78,357 5,989
Australia (1,173) 77,498 78,671
Other 185,901 231,162 45,261
Total 1,029,657 1,160,141 130,484
Long-lived assets
Australia 953,037 1,085,910 132,873
Japan 692,428 647,688 -44,740
Canada 110,887 117,951 7,064
Other 686,139 825,443 139,304
Total 2,442,491 2,676,992 234,501
NOTE:
Operating transactions, as presented above, are voluntary disclosures solely for the convenience of investors in
Japan. Operating transactions represent the gross transaction volume or the aggregate nominal value of the sales
contracts in which the companies act as principal and transactions in which the companies serve as agent.
Year endedMarch 31, 2013
Year endedMarch 31, 2014
Increase or[-] decrease
(2) Geographic Segment Information(US GAAP)
Millions of Yen
35

Reconciliations of the differences between basic and diluted net income attributable to Mitsubishi Corporation
per share are as follows:
Numerator : (millions of yen)
Net income attributable to Mitsubishi Corporation 360,028 444,793
Denominator : (thousands of shares)
Basic weighted average common shares outstanding 1,646,519 1,647,786
Effect of dilutive securities
Stock options 3,649 3,794
Diluted outstanding shares 1,650,169 1,651,580
Per share amount : (yen)
Basic 218.66 269.93
Diluted 218.18 269.31
(4) Omission of DisclosureNotes regarding lease transactions, related-party transactions, deferred tax, marketable securities,
derivative transactions, pension benefits, stock options and business combinations have been omitted
because disclosure in this earnings report is not considered to be material.
(5) Subsequent EventsThe Company resolved at the Board of Directors meeting held on May 8, 2014 that it would acquire its own shares
of stock based on the provisions of Article 156 of the Companies Act that is applied in an alternative interpretation
of Article 165, Section 3 of the Companies Act.
The repurchases of shares are to be executed as describe below;
Type of shares: Ordinary shares of the Company
No. of shares to be repurchased: Up to 40 million shares (2.4% of the common shares outstanding)
Total value of stock repurchased: Up to 60,000 millions of yen
Period of acquisitions: May 9, 2014 - July 31, 2014
(3) Earnings Per Share(US GAAP)
Year endedMarch 31, 2013
Year endedMarch 31, 2014
36

May 8, 2014Mitsubishi Corporation
Results for the Year Ended March 2014 and Forecasts for the Year Ending March 2015
May 8, 2014
Mitsubishi Corporation

May 8, 2014Mitsubishi Corporation
1
(Forward-Looking Statements)• This presentation contains forward-looking statements about Mitsubishi Corporation’s future plans, strategies,
beliefs and performance that are not historical facts. Such statements are based on the company’s assumptions and beliefs in light of competitive, financial and economic data currently available and are subject to a number of risks, uncertainties and assumptions that, without limitation, relate to world economic conditions, exchange rates and commodity prices.
• Accordingly, Mitsubishi Corporation wishes to caution readers that actual results may differ materially from those projected in this presentation and that Mitsubishi Corporation bears no responsibility for any negative impact caused by the use of this presentation.
(Notes Regarding this Presentation Material)• Consolidated net income in this presentation shows the amount of consolidated net income attributable to
Mitsubishi Corporation, excluding noncontrolling interests. Total shareholders’ equity shows the amount of total equity attributable to Mitsubishi Corporation, excluding noncontrolling interests.
• The Global Environmental & Infrastructure Business shows the earnings connected with infrastructure-related businesses of the Global Environmental & Infrastructure Business Group that were previously included in “Adjustments and Eliminations.”
• Past figures for each segment have been restated on the basis of the new organization structure following an internal corporate reorganization in April 2013.
• Consolidated net income estimate for year ended March 2014 (IFRS) is an estimated restatement of the result for the year ended March 2014 (US GAAP) in terms of International Financial Reporting Standards (IFRS). It takes into account the estimated financial impact of adopting IFRS and the difference between US GAAP and IFRS that can be recognized in certain line items. Consequently, the consolidated financial statements for Mitsubishi Corporation herein may differ materially from the statements based on International Financial Reporting Standards the Company will disclose in its Annual Securities Report, at a later date.
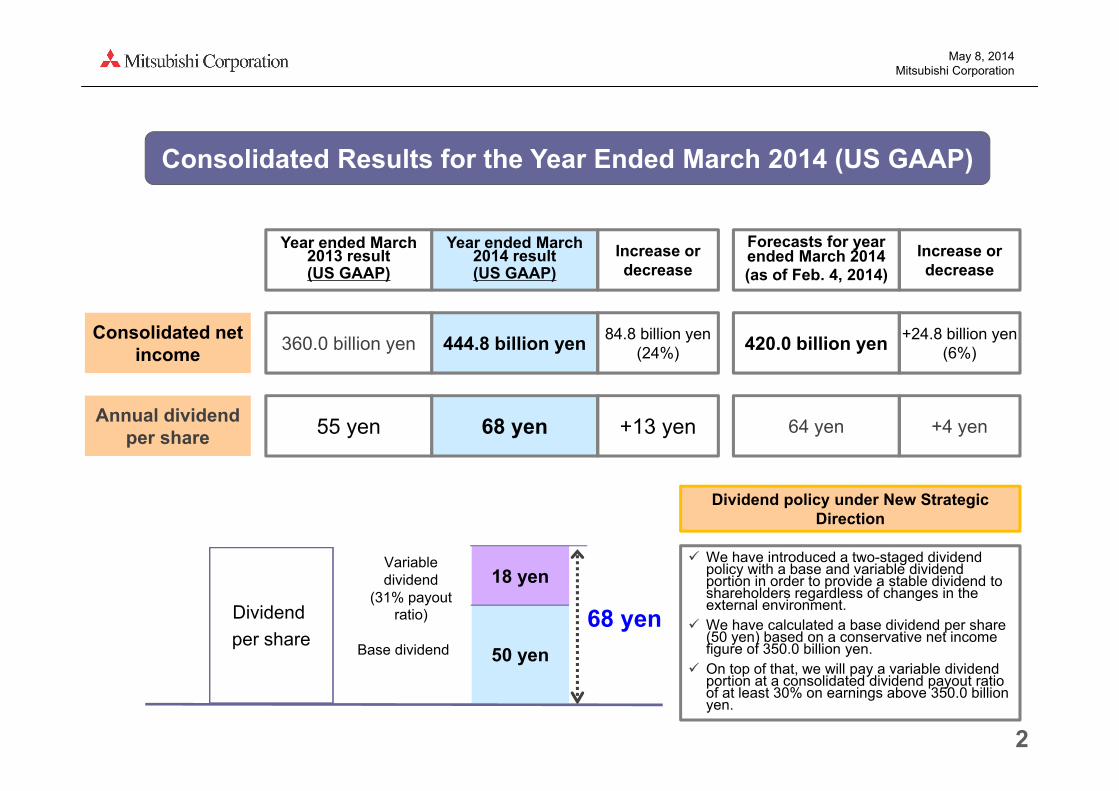
May 8, 2014Mitsubishi Corporation
Consolidated Results for the Year Ended March 2014 (US GAAP)
2
Year ended March 2013 result (US GAAP)
Year ended March 2014 result (US GAAP)
Increase or decrease
360.0 billion yen 444.8 billion yen 84.8 billion yen (24%)
Consolidated net income
Forecasts for year ended March 2014 (as of Feb. 4, 2014)
Increase or decrease
420.0 billion yen +24.8 billion yen (6%)
55 yen 68 yen +13 yenAnnual dividend
per share 64 yen +4 yen
Dividend
per share
Variable dividend
(31% payout ratio)
Base dividend 50 yen
18 yen
68 yen
We have introduced a two-staged dividend policy with a base and variable dividend portion in order to provide a stable dividend to shareholders regardless of changes in the external environment.
We have calculated a base dividend per share (50 yen) based on a conservative net income figure of 350.0 billion yen.
On top of that, we will pay a variable dividend portion at a consolidated dividend payout ratio of at least 30% on earnings above 350.0 billion yen.
Dividend policy under New Strategic Direction

May 8, 2014Mitsubishi Corporation
Forecasts for the Year Ending March 2015 (IFRS)
3
Year ended March 2014 estimate (IFRS)
Year ending March 2015 forecast (IFRS)
Increase or decrease
Approx. 360 billion yen 400 billion yen 40 billion yen
(11%)Consolidated net
income
68 yen 70 yen +2 yenAnnual dividend
per share
Dividend per share
Variable dividend
(31% payout ratio)
Base dividend 50 yen
18 yen
68 yen
Variable dividend
(33% payout ratio)
Base dividend 50 yen
10 yen70 yen
10 yen
60th anniversary commemorative dividend

May 8, 2014Mitsubishi Corporation
194.3
224Approx. 230
259.0
171.6
(Billion yen)
Year ended March 2013 (US GAAP)
40%
60%+64.7
+1.5
Non-resource
Other Year ended March 2014 (US GAAP)
1. Consolidated net income for year ended March 2014 (US GAAP)
All segments recorded higher earnings year on year
Non-resource fields saw a record 259.0 billion yen in net income
Earnings composition was 40% from resource fields and 60% from non-resource fields
Operating CF
258.1
Investing CF
(182.7)Free CF
75.4
14.2
Key Points to Results for the Year Ended March 2014 and Earnings Forecasts for the Year Ending March 2015
170.147%
53%
(4.4)
167
Year ended March 2014 estimate (IFRS)
43%
57%-6
+47
Non-resource
Other
Year ending March 2015 forecast (IFRS)
9
Approx. 12034%
Approx. 10
+18.6
-1
2. Free cash flow for year ended March 2014 (US GAAP)
Free cash flow was a positive 75.4 billion yen. This was attributable to steady generation of operating transactions and rigorous execution of asset replacements.
3. Forecasts for year ending March 2015 (IFRS)
Consolidated net income is forecast to increase, mainly due to the absence of resource-related impairment losses recorded in the year ended March 2014.
360.0
444.8
Approx.360400
4
Resource
Resource
66%
Resource
Non-resource
Non-resource
Resource

May 8, 2014Mitsubishi Corporation
9.2 17.567.5 68.322.6 32.855.6
87.125.0
31.114.4
22.2
2013.3 2014.3
Global Environmental &Infrastructure Business
Industrial Finance, Logistics& DevelopmentMachinery
Chemicals
Living Essentials
Metals—Non‐resource
27.7 23.7
142.4 147.9
2013.3 2014.3
Energy Business
Metals—Resource
5
Year-over-Year Segment Net Income by Resource and Non-resource Field
[Resource]
[Non-resource]
■ Energy Business (+4%)The increased earnings reflect gains on the sale of shares and higher dividend income from overseas resource-related business investees, despite higher exploration costs.
■ Metals—Resource (-14%)The lower earnings reflect lower equity-method earnings and dividend income from resource-related investees, despite higher earnings posted at an Australian resource-related subsidiary (coking coal).
■ Global Environmental & Infrastructure Business (+54%)The higher earnings mainly reflect a one-time gain associated with price revisions in offshore power transmission operations.■ Industrial Finance, Logistics & Development (+24%)
The higher earnings mainly reflect increased earnings in the fund investment and aircraft leasing-related businesses.■ Machinery (+57%)
Earnings rose due mainly to an absence of impairment losses recorded on company-owned vessels in the previous fiscal year, strong performances in Asian automobile-related operations, the yen’s depreciation and gains on the sale of assets.■ Chemicals (+45%)
Earnings increased mainly due to gains on the sale of shares and higher earnings on transactions at a petrochemical business-related company.■ Living Essentials (+1%)
Earnings increased mainly due to strong performances in food-related businesses, despite equity-method earnings falling as a result of divestment of affiliated investees.■ Metals—Non-resource (+90%)
The higher earnings reflected gains on the sale of shares and the absence of share write-downs recorded in the previous fiscal year.
+5.5
-4.0
+7.8
+31.5
+10.2
+0.8
(Billion yen)
(Billion yen)
+6.1
*Earnings related to steel products operations in Metals are counted in Non-resource fields.
+64.7
+1.5
+8.3
170.1(47%) 171.6(40%)
194.3(53%) 259.0(60%)

May 8, 2014Mitsubishi Corporation
761.6
331.2
550.7
403.3
258.1
(138.5)(262.6)
(1,100.9)
(752.5)
(182.7)
623.1
68.6
(550.2)
(349.2)
75.4
Operating cash flows Investing cash flows Free cash flows
Cash Flows
6
(Billion yen)
○ Operating Cash Flows : 258.1 billion yen
Operating cash flows provided net cash mainly due to cash flows from operating transactions at subsidiaries and dividend income from investees, mainly resource-related businesses, despite an increase in cash requirements due to changes in assets and liabilities associated with operating activities.
○ Investing Cash Flows: -182.7 billion yenInvesting activities used net cash mainly due to capital expenditures by metals resource-related subsidiaries and investments in energy resource businesses and offshore power transmission operations, despite cash provided by the sale of shares and real estate.
[Cash Flows for the Year Ended March 2014]
Year ended Mar. 2010
Year ended Mar. 2011
Year ended Mar. 2012
Year ended Mar. 2013
Year ended Mar. 2014

May 8, 2014Mitsubishi Corporation
New Investments and Portfolio Reshaping (Billion yen)
7*Profit and loss on sales is not included in the amount of “Asset sales.”
Total
Depreciation
Total
Actual (Cumulative Total)Main Investment and Divestment Areas
1Q 2Q 3Q 4Q
LNG and shale gas-relatedCoking coal/thermal coal business in Australia
Non-resource 117 143 88 470
Aircraft leasingShipping businessOffshore transmission businessBrazilian grain company (Subsidiary)
68Resource 93 77 92 330
PortfolioReshaping
Asset sales* 140 110 80 510
Marketable securities available for saleSales of assets in automobile f inancing companyAircraft leasingReal estateShipping business
40
New Investment
210 220 180 800
180
170
(30)
160 120 680
120Net Investment 30 60 60
122
190
180
40
220
50 40

May 8, 2014Mitsubishi Corporation
Shareholders’ Equity and Interest-Bearing Liabilities
8
2,947.3
3,647.4
4,335.84,522.2
3,233.3
3,507.8
4,179.7
4,774.2
0.91.0 1.0
0.9
0.0
1.0
2.0
Mar. 31, 2011 Mar. 31, 2012 Mar. 31, 2013 Mar. 31, 2014
Interest-bearing liabilities (net) Total shareholders' equity
Debt-to-equity ratio (net) (Billion yen)
1. Consolidated net income(+444.8 billion yen)
2. Improvement in foreign currency translation adjustments(+283.1 billion yen)
3. Payment of dividends (-98.9 billion yen)
4. Deterioration in net unrealized losses on derivatives(-61.2 billion yen)
[Main Reasons for Change in Total Shareholders’ Equity](+594.5 billion yen compared to March 31, 2013)
[Effect of Currency on Foreign CurrencyTranslation Adjustments]
Currency
Effect of foreign currencyon foreign currency
translation adjustments(Estimate, billion yen)
Mar. 31,2013
rate (Yen)
Mar. 31,2014
rate (Yen)
US$ 185 94.05 102.92
AUS$ (20) 97.93 95.19
Euro 25 120.73 141.65
British Pound 30 143.16 171.31
CAN$ 15 92.58 93.17

May 8, 2014Mitsubishi Corporation
+440
9
444.8
360
-70
-20
FVTOCIadjustment
Other
(Approx. -85)
Year ended March 2014 results(US GAAP)
Year ended March 2014 estimates
(IFRS)
Restatement of Year Ended March 2014 Results According to International Financial Reporting Standards (IFRS)
4,774.2
5,070Approx. +300
Con
solid
ated
net
inco
me
Shar
ehol
ders
’ equ
ity
(Billion yen)
Write-downadjustment
-110
FVTOCIadjustment
Write-downadjustment
-35
Other
+5

May 8, 2014Mitsubishi Corporation
167
224Approx.
230
10
[Forecasts by Segment]
Year ended March 2014
estimate (IFRS)
43%
57%-6
+47
Other
Year ending March 2015
forecast (IFRS)
9
34%
66%
Approx.10 -1
Year ended March 2014 estimate (IFRS)
Year ending March 2015 forecast (IFRS)
Increase or decrease
Approx. 360 billion yen 400 billion yen +40 billion yen
(11%)
Consolidated net income
Forecasts for the Year Ending March 2015 (IFRS)
Resource
Non-resource
Resource
Non-resource
Approx. 120
Approx.360
400
120
57
1827
81
31
579
Energy Business
Metals
Global Environmental & Infrastructure Business
Industrial Finance, Logistics & Development
Machinery
Chemicals
Living Essentials
Adjustment and Eliminations

May 8, 2014Mitsubishi Corporation
11
[Foreign Exchange, Interest Rate and Commodity Prices Sensitivities]
Year endedMar. 2013
Actual
Year endedMar. 2014
Actual(a)
Forecasts foryear ending
Mar. 2015(b)
Increase anddecrease
(b)-(a)
Foreign Exchange(yen/US$)
82.9 100.2 100 -0.2
Yen Interest(%)TIBOR
0.32 0.23 0.25 0.02
US$ Interest(%)LIBOR
0.37 0.25 0.40 0.15
Crude OilPrices(US$/BBL)
(Dubai)107.1 104.6 100 -4.6
Copper(US$/MT) 7,854 7,104 7,496 392
[ ¢/lb ] [ 356] [ 322] [ 340] [ 18]
Net Income Sensitivities
Depreciation (appreciation) of 1 yen per US$1 has a 2.5 billion yen positive(negative) impact on a full year basis.
The effect of rising interest rates is mostly offset by an increase in operating andinvestment profits. However, a rapid rise in interest rates can cause a temporarynegative effect.
A US$1 rise (decline) per barrel increases (reduces) full-year earnings by 1.0 billionyen. Besides crude oil price fluctuations, other variables such as the different fiscalyears of consolidated companies, the timing of the reflection of the crude oil price insales prices, the dividend policy and sales volume affect crude oil-related earningsas well. Therefore, the impact on earnings cannot be determined by the crude oilprice alone.
A US$100 rise (decline) per MT increases (reduces) full-year earnings by 1.3 billionyen. Besides copper price fluctuations, other variables such as the grade of minedore, the status of production operations, and reinvestment plans (capitalexpenditure) affect earnings from copper mines as well. Therefore, the impact onearnings cannot be determined by the copper price alone.
(Reference) Market Conditions