Financial Results for the Quarter ended Sep 30, 2015...Q1 Q2 Q3 Q4 Q1 Q2 Q3 Q4 Q1 Q2 Q3 Q4 Q1 Q2 Q3...
22
Copyright © 2015 KITO CORPORATION All rights reserved. 1 Financial Results for the Quarter ended Sep 30, 2015 KITO CORPORATION TSE 1st Section: 6409 November 12, 2015
Transcript of Financial Results for the Quarter ended Sep 30, 2015...Q1 Q2 Q3 Q4 Q1 Q2 Q3 Q4 Q1 Q2 Q3 Q4 Q1 Q2 Q3...
Copyright © 2015 KITO CORPORATION All rights reserved. 1
Financial Resultsfor the Quarter
ended Sep 30, 2015
KITO CORPORATIONTSE 1st Section: 6409
November 12, 2015
Copyright © 2015 KITO CORPORATION All rights reserved. 2
FY2015 2nd Quarter Financial Results
FY2015 Forecast

Copyright © 2015 KITO CORPORATION All rights reserved. 3
Summary
Sales : JPY 25,809 million + 40.3% YoY
Op Income : JPY 1,505 million + 76.0% YoY
Net Income : JPY 568 million + 12.7% YoY
Sales and Op income up 40.3%, 76.0% respectively
Japan, with stable demand, and Americas, with Peerless M&A,
have contributed to overall performance
Japan Economic recovery continues, with stable private-sector capital investment
Americas Sales boosted by Peerless, and business in North America is stable,though demand softens among energy related sectors
China Economic slowdown pushes down demand, and uncertainty grows
Asia Chinese economy affects regional economies, slows investment growth
(Apr-Sep 2015)

Copyright © 2015 KITO CORPORATION All rights reserved. 4
FY2015 2nd Quarter Financial Highlights
Note: Exchange Rate (FY2014-Q2 -> FY2015-Q2) :USD/JPY 103.0 -> 121.8 CAD/JPY 94.6 -> 96.1 EUR/JPY 138.9 -> 135.1 RMB/JPY 16.7 -> 19.3
JPY in million
FY2014 Q2 (Apr-Sep) FY2015 Q2 (Apr-Sep)
% of
Sales
YoY
Change
% of
Sales
YoY
Change
Sales 18,400 100.0% 4.2% 25,809 100.0% 40.3%
OperatingIncome
855 4.6% (26.7%) 1,505 5.8% 76.0%
OrdinaryIncome
892 4.8% (25.6%) 1,194 4.6% 33.7%
Net Income 504 2.7% (32.2%) 568 2.2% 12.7%

Copyright © 2015 KITO CORPORATION All rights reserved.
17,099
14,468
8,430
9,969
6,591
8,4137,801
10,477
7,430
8,5758,295
11,201
7,996
9,96110,136
14,062
12,122
13,686
Q1 Q2 Q3 Q4 Q1 Q2 Q3 Q4 Q1 Q2 Q3 Q4 Q1 Q2 Q3 Q4 Q1 Q2 Q3 Q4
Sales (JPY in million)
Op Margin
7.1%
4.4%3.3%
13.9%
8.0%8.4%
4.5%
12.7%
4.1%
7.1%
1.9%
8.4%
5.7%5.4%
-1.7%
5.8%6.8%
9.1%
5
Net Sales and Operating Margin
OpIncome
FY2014Net Sales 49,968Op Income 3,395
FY2012Net Sales 35,501Op Income 2,510
FY2013Net Sales 41,855Op Income 4,006
139 609 343
FY2015 ForecastNet Sales 60,000Op Income 5,500
1,419 360 806 809 2,030 280 575 987 1,553
Sales and Op Income up 40.3% and 76.0% respectively,boosted by stable demand in Japan and sales growth from M&A in Americas
538(117) 454 443 878
FY2011Net Sales 33,282Op Income 1,658
966

Copyright © 2015 KITO CORPORATION All rights reserved. 6
Net Sales by Region
JPY in millionFY2013 Q2 (Apr-Sep) FY2014 Q2 (Apr-Sep) FY2015 Q2 (Apr-Sep) YoY Change
% share % share % shareAmount
Change
%
Change
Total 17,657 100.0% 18,400 100.0% 25,809 100.0% 7,409 40.3%
Japan 5,002 28.3% 5,182 28.2% 5,520 21.4% 338 6.5%
Americas 5,579 31.6% 6,151 33.4% 12,853 49.8% 6,701 108.9%
China 3,853 21.8% 4,073 22.1% 4,159 16.1% 85 2.1%
Asia 2,068 11.7% 1,796 9.8% 2,082 8.1% 285 15.9%
Europe 753 4.3% 891 4.8% 843 3.3% (48) (5.4%)
Others 399 2.3% 304 1.7% 350 1.4% 46 15.3%
3 2 %2 2 %
4 %2 %1 2 %2 8 %
Japan
Americas
China
Asia
Europe
Others49.8%
16.1%
3.3%
1.4%
8.1% 21.4%
78.6 % fromNON-JP market
71.8 % fromNON-JP market
FY2015
Q2
Globally diversified portfolio with almost 80% of non-Japanese sales
33 .4%
22 .1%
4 .8%1 .7%
9 .8%28 .2%
Note: Exchange Rate (FY2014 Q2 -> FY2015 Q2) : USD/JPY 103.0 -> 121.8 CAD/JPY 94.6 -> 96.1 EUR/JPY 138.9 -> 135.1 RMB/JPY 16.7 -> 19.3
FY2014Q2

Copyright © 2015 KITO CORPORATION All rights reserved. 7
Net Sales by Region (Japan)
JPY in million
3,018
2,501
2,042
3,096
2,541
3,270
2,460
3,235
2,567
3,417
2,306
2,696 2,840
3,782
2,256
2,926
2,738
3,781
Q1 Q2 Q3 Q4 Q1 Q2 Q3 Q4 Q1 Q2 Q3 Q4 Q1 Q2 Q3 Q4 Q1 Q2 Q3 Q4
- Private-sector capital investment has been stable
- Demand among construction concerns expected to grow in 2nd half
FY2015 Forecast12,800
FY201110,949
FY201211,679
FY201311,624
FY201411,702
Copyright © 2015 KITO CORPORATION All rights reserved. 8
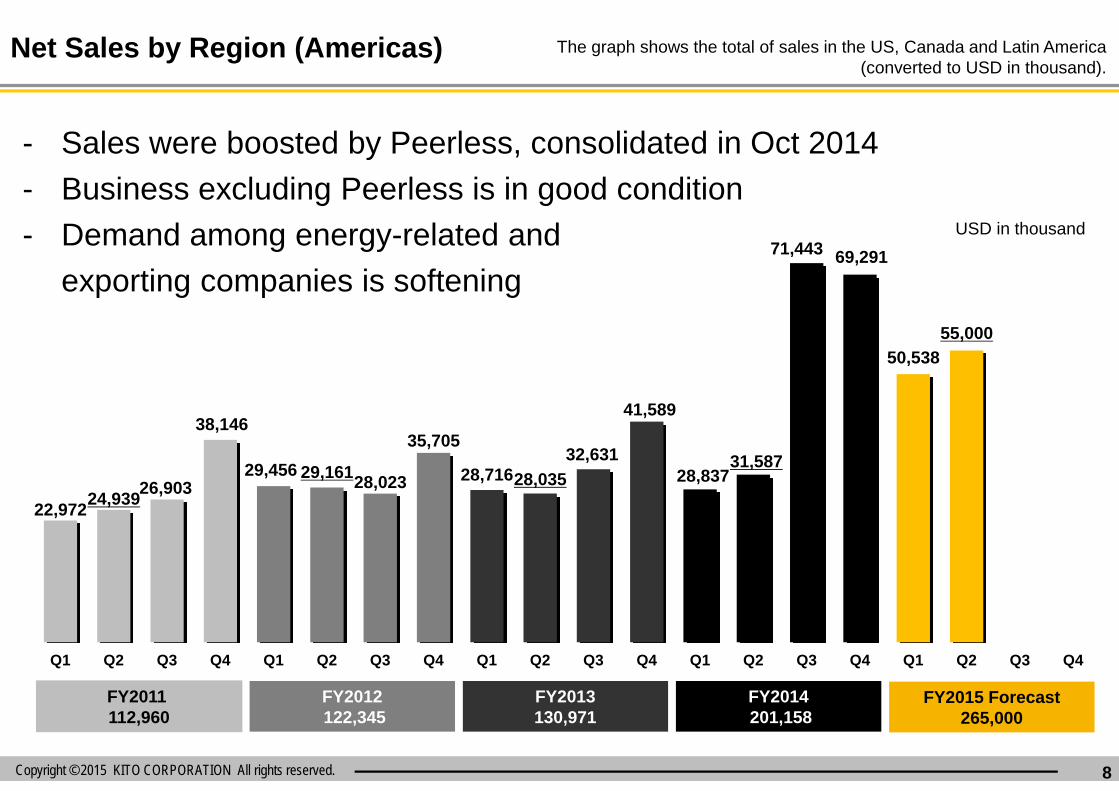
22,97224,939
26,903
38,146
29,456 29,16128,023
35,705
28,71628,035
32,631
41,589
28,83731,587
71,443 69,291
50,538
55,000
Q1 Q2 Q3 Q4 Q1 Q2 Q3 Q4 Q1 Q2 Q3 Q4 Q1 Q2 Q3 Q4 Q1 Q2 Q3 Q4
USD in thousand
The graph shows the total of sales in the US, Canada and Latin America(converted to USD in thousand).
FY2015 Forecast265,000
FY2011112,960
FY2012122,345
FY2013130,971
Net Sales by Region (Americas)
FY2014201,158
- Sales were boosted by Peerless, consolidated in Oct 2014
- Business excluding Peerless is in good condition
- Demand among energy-related and
exporting companies is softening

Copyright © 2015 KITO CORPORATION All rights reserved. 9
130,813
105,923
135,467
121,062
138,085
158,368
142,675
174,583
127,252
163,980
147,982
155,473
143,920
136,236
144,526
114,222115,090
170,473
Q1 Q2 Q3 Q4 Q1 Q2 Q3 Q4 Q1 Q2 Q3 Q4 Q1 Q2 Q3 Q4 Q1 Q2 Q3 Q4
RMB in thousand
Fiscal year of China starts in January and ends in December
FY2015 Forecast442,000
FY2011646,099
FY2012571,478
FY2013563,071
Net Sales by Region (China)
FY2014508,836
- Economic slowing continues, with growing uncertainty
- Our products are rated highly, boosting market share despite slowing
Copyright © 2015 KITO CORPORATION All rights reserved. 10
940
2,579
1,300
1,014
782
2,884
1,216
1,366
702
1,977
1,131
907
611
1,717
577
739
575
1,141
Q1 Q2 Q3 Q4 Q1 Q2 Q3 Q4 Q1 Q2 Q3 Q4 Q1 Q2 Q3 Q4 Q1 Q2 Q3 Q4
The fiscal year of Thailand and Korea beginsin January and ends in December
JPY in million
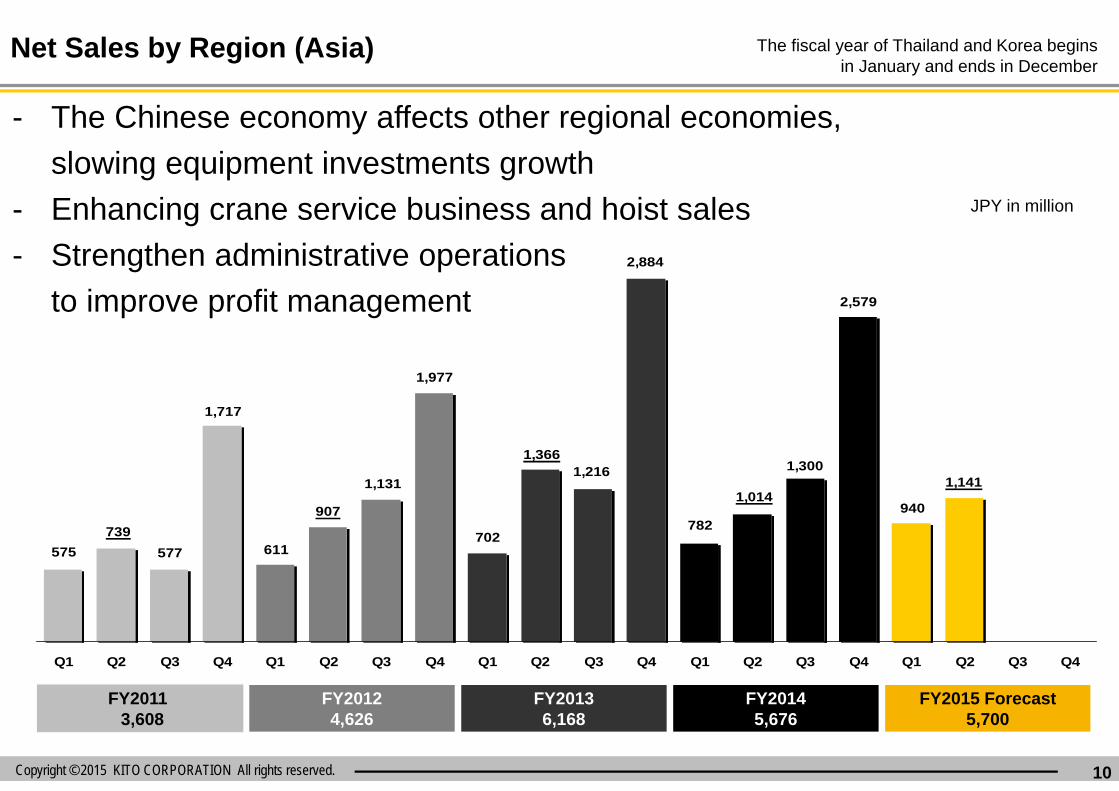
FY2015 Forecast5,700
FY20113,608
FY20124,626
FY20136,168
Net Sales by Region (Asia)
FY20145,676
- The Chinese economy affects other regional economies,
slowing equipment investments growth
- Enhancing crane service business and hoist sales
- Strengthen administrative operations
to improve profit management

Copyright © 2015 KITO CORPORATION All rights reserved.
Operating Income Comparison
1,358(1,805)
1,020
(132)
209
1,505855
Apr-Sep 2014
CurrencyImpact
Increase inSales Volume
Increase inSales Price
Increasein SGA (JPY in million)
Apr-Sep 2015
UnrealizedProfit
757 from Peerless, which wasconsolidated from Dec quarter 2014
162 from amortization of goodwill fromconsolidation of Peerless
476 fromcurrency impact
11

Copyright © 2015 KITO CORPORATION All rights reserved. 12
FY2015 2nd Quarter Consolidated Balance Sheet
JPY in millionMar2015
Sep2015
Change
Current Assets 40,478 39,569 (908)
Cash 9,792 9,400 (391)
Account receivables 12,593 10,372 (2,221)
Inventories 15,105 16,628 1,522
Others 2,986 3,167 181
Fixed Assets 22,703 22,708 4
Tangible fixed assets 12,161 12,817 656
Intangible fixedassets
9,009 8,335 (674)
Investment & otherassets
1,532 1,555 22
Deferred assets 1 0 (1)
Total assets 63,183 62,278 (905)
JPY in millionMar2015
Sep
2015Change
Current Liabilities 17,093 16,309 (783)
Account payable 6,113 6,589 476
Short-term debt 4,319 4,772 452
Others 6,660 4,947 (1,713)
Fixed Liabilities 20,464 20,160 (303)
Long-term debt 16,025 15,469 (556)
Others 4,438 4,691 252
Total net assets 25,626 25,808 181
Total liabilities andnet assets
63,183 62,278 (905)

Copyright © 2015 KITO CORPORATION All rights reserved. 13
Consolidated Cash Flows
JPY in millionApr-Sep
2014Apr-Sep
2015Change
Cash flows fromoperating activities
1,353 1,878 524
Cash flows frominvesting activities
(7,816) (744) 7,071
Cash flows fromfinancing activities
9,028 (1,470) (10,498)
Effect of exchangerate changes on cashand cash equivalents
(774) (45) 729
Net increase(decrease) in cash andcash equivalent
1,790 (381) (2,171)
Cash and cashequivalents at endof period
8,126 9,395 1,269
[Cash flows from operating activities]Income before income taxes: 1,194
Decrease in account receivable 2,286
Increase in inventories 1,608
Payment of income tax 864
[Cash flows from investing activities]
Payment for the acquisition of
tangible fixed assets 603
Payment for the acquisition of
intangible fixed assets 158
[Cash flows from financing activities]
Increase in long term debt 1,000
Payment of long term debt 1,400
Payment of bond 1,000
Major Items for Apr-Sep 2015

Copyright © 2015 KITO CORPORATION All rights reserved. 14
FY2015 2nd Quarter Financial Results
FY2015 Forecast

Copyright © 2015 KITO CORPORATION All rights reserved. 15
FY2015 Forecast
JapanJapan
AmericasAmericas
Market- Economic recovery from previous FY continues, andprivate-sector investment is growing moderately
- Demand is increasing in infrastructure sectorInitiatives- Develop sales network with crane builders- Expand product offerings for new business areas,such as theatrical hoists for entertainment concerns
Market- Continuing demand in broader industries- Softening demand in resources and energy sectorsInitiatives- Strengthen competitive position in the marketswith broader product offerings
- Expand local manufacturing for efficient supply chain

Copyright © 2015 KITO CORPORATION All rights reserved. 16
FY2015 Forecast
ChinaChina
AsiaAsia
Market- Slowdown continues, pushing down overall demandInitiatives- Focus on cost and profit management to ensurehigh margin
- Expand local production and product offering forhigher market share
Market- Slowdown continues, pushing down overall demandInitiatives- Focus on cost and profit management to ensurehigh margin
- Expand local production and product offering forhigher market share
Market- Slowdown of Chinese economy affects Asian regions,slowing equipment investments
- Regional uncertainty is needed to be closely monitoredInitiatives- Enhance service business for crane users- Strengthen administrative operation to improve profitmanagement
Copyright © 2015 KITO CORPORATION All rights reserved. 17
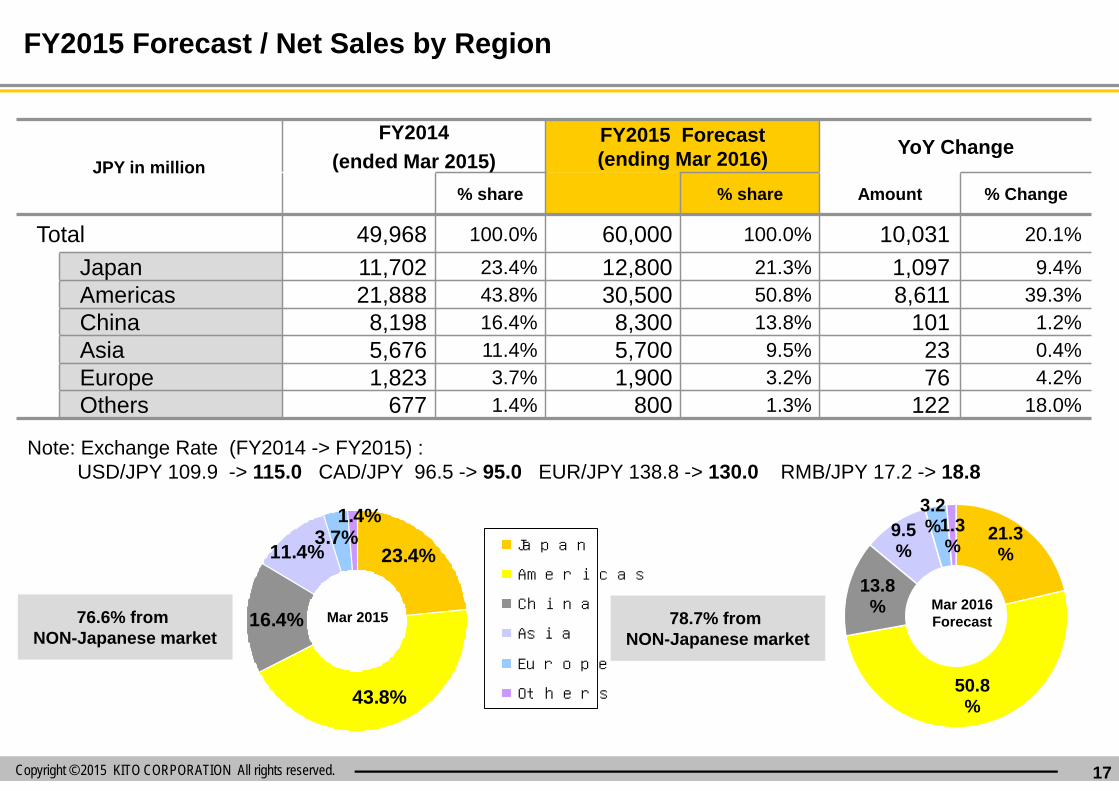
FY2015 Forecast / Net Sales by Region
JPY in million
FY2014
(ended Mar 2015)
FY2015 Forecast(ending Mar 2016)
YoY Change
% share % share Amount % Change
Total 49,968 100.0% 60,000 100.0% 10,031 20.1%
Japan 11,702 23.4% 12,800 21.3% 1,097 9.4%
Americas 21,888 43.8% 30,500 50.8% 8,611 39.3%
China 8,198 16.4% 8,300 13.8% 101 1.2%
Asia 5,676 11.4% 5,700 9.5% 23 0.4%
Europe 1,823 3.7% 1,900 3.2% 76 4.2%
Others 677 1.4% 800 1.3% 122 18.0%
2 7 %2 5 %
4 %3 %7 %3 4 %
Japan
Americas
China
Asia
Europe
Others
21.3%
50.8%
13.8%
9.5%
3.2%1.3
%
Mar 2016Forecast
43.8%
16.4%
3.7%1.4%
11.4% 23.4%
Mar 201576.6% fromNON-Japanese market
78.7% fromNON-Japanese market
Note: Exchange Rate (FY2014 -> FY2015) :USD/JPY 109.9 -> 115.0 CAD/JPY 96.5 -> 95.0 EUR/JPY 138.8 -> 130.0 RMB/JPY 17.2 -> 18.8

Copyright © 2015 KITO CORPORATION All rights reserved. 18
FY2015 Forecast
1,505
3,395
5,500
855
0
1,000
2,000
3,000
4,000
5,000
6,000
7,000
25,809
60,000
49,968
18,400
0
10,000
20,000
30,000
40,000
50,000
60,000
70,000 JPY in million JPY in million
FY2014 FY2015
1H Full 1H Full (FCST)
FY2014 FY2015
1H Full 1H
Op IncomeOp Margin
4.6%
5.8%
6.8%
9.2%
Americas and Japan will lead overall growth to JPY 60 billionscovering slowdown in China and Asia
Net Sales Operating Income, OP margin
Full (FCST)

Copyright © 2015 KITO CORPORATION All rights reserved. 19
FY2015 Forecast
JPY in million
FY2014 (ended Mar 2015) FY2015 Forecast (ending Mar 2016)
% ofSales
YoYchange
% ofSales
YoYchange
Net Sales 49,968 100.0% 19.4% 60,000 100.0% 20.1%
Operating Income 3,395 6.8% (15.2%) 5,500 9.2% 62.0%
Ordinary Income 3,423 6.8% (16.4%) 5,000 8.3% 46.0%
Net Income 2,026 4.1% (14.2%) 3,000 5.0% 48.0%
EPS JPY 77.52 - - JPY114.36 - -
ROE 8.9% - - ≒12.2% - -
CAPEX 1,408 - - 2,200 - -
Depreciation 1,311 - - 2,000 - -
Improvement in EPS and ROE
Note: Exchange Rate FY2014 -> FY2015:USD/JPY 109.9 -> 115.0 CAD/JPY 96.5 -> 95.0 EUR/JPY 138.8 -> 130.0 RMB/JPY 17.2 -> 18.8

Copyright © 2015 KITO CORPORATION All rights reserved. 20
- Transform into a global company- Expand global sales to JPY 100 billion
Mid-termTarget
Estimated sales and targetsJPY in billion Expand global sales to JPY 100 billion
Transform into a global company
There will be a golden opportunity in the next fiveyears for KITO to expand its scale and become the“Truly global No.1 hoist manufacturer.” KITO willchange a Japan-centric operation to a globallyintegrated operation utilizing resources and skillsof the KITO group worldwide.
Increase sales to JPY 58 billion through theorganic growth and achieve further growthby M&A to achieve JPY 100 billion sales.
Mid-term Management Targets (2011 – 2015)
Assumption in 2011
28
58
0
200
400
600
800
1,000
FY2010 Actual FY2015Target
M&As
Organic growth

Copyright © 2015 KITO CORPORATION All rights reserved. 21
Progress of Mid-term Management Plan
FY2010 FY2011 FY2012 FY2013 FY2014 FY2015 FCST
Net sales target is JPY 60 billion for the last year of Mid-term planWith organic growth and M&A, CAGR will reach 20%
Operating Margin(Actual)Operating Margin(Actual)
2832
3337 36
43 42
50
58
6.8%
9.6%
7.1%
5.0%4.0%
60
50
JPY in billion

Copyright © 2015 KITO CORPORATION All rights reserved. 22
Our mission is to become the “truly global No. 1 hoistmanufacturer” by adding value to our customers thatsurpasses their expectations and maximizes the value ofthe KITO brand on the market.