FINANCIAL RESULTS FOR THE QUARTER ENDED 31 DECEMBER …
44
FINANCIAL RESULTS FOR THE QUARTER ENDED 31 DECEMBER 2018 Raja Azmi Raja Nazuddin Group Chief Executive Officer 28 th February 2019
Transcript of FINANCIAL RESULTS FOR THE QUARTER ENDED 31 DECEMBER …

FINANCIAL RESULTS FOR THE QUARTER ENDED 31 DECEMBER 2018
Raja Azmi Raja Nazuddin
Group Chief Executive Officer
28th February 2019

Disclaimer
This presentation may contain forward-looking statements by Malaysia Airports Holdings Berhad (Malaysia Airports) that reflectmanagement’s current expectations, beliefs, intentions or strategies regarding the future and assumptions in light of currentlyavailable information. These statements are based on various assumptions and made subject to a number of risks, uncertainties andcontingencies. Actual results, performance or achievements may differ materially and significantly from those discussed in theforward-looking statements. Such statements are not and should not be construed as a representation, warranty or undertaking as tothe future performance or achievements of Malaysia Airports and Malaysia Airports assumes no obligation or responsibility to updateany such statements.
No representation or warranty (either express or implied) is given by or on behalf of Malaysia Airports or its related corporations(including without limitation, their respective shareholders, directors, officers, employees, agents, partners, associates and advisers),as to the quality, accuracy, reliability or completeness of the information contained in this presentation, or that reasonable care hasbeen taken in compiling or preparing the Information.
No part of this presentation is intended to or construed as an offer, recommendation or invitation to subscribe for or purchase anysecurities in Malaysia Airports.
The financial results should be read in conjunction with the audited Financial Statements for the year ended 31 December 2017 andthe Interim Financial Statements for the quarter ended 31 December 2018.
2

Key Highlights

853.7 831.3
734.6 786.7
FY17 FY18
Retail Commercial
1,138.7 1,229.9
770.7 862.1
FY17 FY18
3,565.6 3,697.6
1,027.8 1,088.5
FY17 FY18
848.1 863.8
210.9 224.7
FY17 FY18
MY TR
96.6 99.0
31.3 34.1
FY17 FY18
MY TR
FY18 Key Highlights
4
Key Highlights
Group EBITDA increased from RM1,909.3mil to RM2,092.0mil, 9.6% higher compared to FY17Group EBITDA rose by 9.6% to RM2,092.0mil, mainly due to the 6.0% overall growth in group international passenger movementsDuring the year, the Group also recognised unrealised gain on the fair value of investment in GMR Hyderabad International Airport (GHIAL) (RM258.4 mil) and gain on disposal of GMR Male International Airport (GMIAL) (RM28.2 mil), resulting in an increase in reported Group EBITDA of 24.2% to RM2,383.5 in FY18The unrealised gain an GHIAL and GMIAL are recognised as non-core item
Group passenger growth and aircraft movement ↑4.0% and ↑2.8% respectivelyTraffic growth in Malaysia and Turkey ↑2.5% and ↑8.8% respectivelyInternational traffic growth higher for Malaysia (↑4.5%) and Turkey (↑12.9%)
Malaysia non-aeronautical revenue continues to grow by ↑1.9% to RM1,618 millionMainly driven by improved commercial revenues (↑7.1%) in Malaysia
133.1128.0
1,088.61,059.0
4,593.4 4,786.1 1,909.32,092.0 1,588.3 1,618.0
*Excluding Construction Revenue and Construction Cost in relation to IC interpretation 12: Service Concession Arrangement (IC12)** EBITDA excludes the non-core items and adjustments as reflected on page 21Note: Prior period financials have been restated to reflect the changes in accounting policy as a result of the transition to the Malaysian Financial Reporting Standards, as disclosed in Notes 1 & 2 to the Interim Financial Statements for the quarter ended 31 December 2018
Passenger Movements (‘mil)
Aircraft Movements (‘000)
Revenue* (RM ‘mil) EBITDA **(RM ‘mil) Malaysia Non-Aeronautical Revenue (RM ‘mil)

> 40 mppa: KLIA Ranking Top
12
Headline Key Performance Indicator (KPI)
MY2
OperationsEBITDA
TR³Operations
EBITDA
Airport Service Quality (ASQ)
5
1 % represents percentage of KPI achieved for the financial year² MY represents results from the Malaysian operation and overseas project and repair maintenance segment in Qatar³ TR represents consolidated results from ISG & LGM in Turkey*Non-core items (NCI) represents the unrealised gain on fair value of investment in GHIAL (RM258.4mil) and gain on disposal of investment in GMIAL (RM28.2mil)
FY18 Actual Excl. NCI & Adj*
RM1,919.6mil(106.8%)¹
RM1,138.7mil(113.7%)
RM780.9mil(98.2%)
FY18Actual
FY17Restated
RM2,092.0mil
RM1,211.1mil
RM880.9mil
> 40 mppa: KLIA Ranking Top
12
FY18 Target
RM2,383.5mil
RM1,510.3mil
RM873.2mil
> 40 mppa: KLIA Ranking Top
14
RM2,092.0mil(100.0%)
RM1,229.9mil(101.6%)
RM862.1mil(97.9%)
> 40 mppa: KLIA Ranking Top
14
EBITDA (%)

Quarter-on-Quarter & Preceding Quarter Summary
Airport Operations
Non-AirportOperations
Revenue excl. IC12
Net Assets
Passengers
Aircraft
6
4Qv3Q
RM904.4mil
RM75.0mil
RM979.4mil +4.7% +6.4%
+4.9% +6.6%
+1.5% +4.4%
25.5mil
222,354
+2.6%+2.4%
+2.6%+3.8%
4Qv4Q 4Qv3Q
RM272.7mil
RM2.2mil
RM274.9mil +8.8%(-11.1%)
+9.1% (-11.1%)
(-13.6%) (-9.1%)
8.1mil
55,066
+3.5% (-16.1%)
+6.3% (-11.4%)
4Qv4Q 4Qv3Q
33.6mil
277,420
+2.6% (-2.6%)
+4.3% (-0.5%)
RM1,177.1mil
RM77.1mil
RM1,254.3mil +5.6% +2.0%
(-0.2%)
+5.9% +1.9%
+1.0% +4.0%
RM9,140.4mil +4.9%
MAHB GROUP
Revenue incl. IC12 RM979.4mil +4.7% +6.4% RM272.3mil (-12.3%)(-11.9%) RM1,251.7mil +0.4% +1.8%
4Qv4Q
(-38.2%)(-20.4%)RM200.6milEBITDA RM218.1mil +14.8% (-17.8%) RM418.8mil (-5.2%) (-29.0%)
TRMY

FY18vFY17
RM3,415.1mil
RM282.5mil
RM3,697.6mil
+32.6%
+3.7%
+4.2%
(-1.9%)
Year-to-date Summary
RM1,079.8mil
RM8.8mil
RM1,154.1mil
RM873.2mil
FY18vFY17
+6.3%
+11.8%
+6.0%
+0.9%
Airport Operations
Non-Airport Operations
Revenue incl. IC12
EBITDA
Net Assets
Passengers
Aircraft
RM1,510.3mil
99.0mil
863,848
34.1mil
224,746
133.1mil
1,088,594
+2.5%
+1.9%
+8.8%
+6.6%
+4.0%
+2.8%
7
RM4,494.8mil
RM291.3mil
RM4,851.7mil
RM2,383.5mil
+4.3%
FY18vFY17
+24.2%
+4.9%
+4.6%
(-1.8%)
RM9,140.4mil
EBITDA excl. NCI & Adj +8.0%RM1,229.9mil RM862.1mil +11.9% RM2,092.0mil +9.6%
Revenue excl. IC12 RM3,697.6mil +3.7% RM1,088.5mil +5.9% RM4,786.1mil +4.2%
Non-core items (NCI) represents the unrealised gain on fair value of investment in GMR Hyderabad International Airport Limited (GHIAL-RM258.4mil) and gain on disposal of investment in GMR Malé International Airport (GMIAL-RM28.2mil)
MAHB GROUPTRMY

250
1,000
1,500
6001,000
2018 2019 2020 2021 2022 2023 2024 PerpetualSukuk
TR
MY
Equity Profile
81The dividend payout ratio is based on the adjusted net core profit of the Group2The final dividend payout is subject to shareholders’ approval
1Amount already paid in 20182Non-call 10 year, fixed initial periodic distribution rate of 5.75% recognised in equity3Net Debt = Total Debt – (Cash and Cash Equivalents plus Unit Trust and Bonds)4After ISG’s floating rate swap
No. of paid-up share capital: 1,659,191,828
Shareholding Profile Borrowing Profile
Dividend Profile
166 / €35
213 / €45
733 / €155
402 / €85
568 / €120(RM / € ‘mil)
(RM ‘mil)
FY18 FY17
Net debt (RM 'mil)3 2,350.3 2,977.8
Share of fixed-rate debt 100%4
100%4
Weighted average maturity (years) 4.45 5.28
Weighted average cost 4.06% 4.02%
Gross gearing ratio (times) 0.56x 0.62x
Credit Rating / Outlook
RAM (Reaffirmed on 19/12/18) AAA / Stable
Moody's (Reaffirmed on 16/01/19) A3 / Stable
40.0%
26.8%
33.2%
31-Dec-18
Foreign
Domestic
39.3%
27.5%
33.2%
31-Dec-17
Foreign
Domestic
Financial Year
Dividend Reinvestment Plan Subscription Rate
Dividend Payment per Share (sen)
Total Amount Paid (RM' mil)
Dividend Payout Ratio1
Interim Final Interim Final Total Interim Final Total Total
2012 46.2% 85.0% 6.00 7.63 13.63 72.60 92.86 165.46 50.0%
2013 88.4% 87.6% 6.00 5.78 11.78 73.95 78.87 152.82 50.0%
2014 53.4% 74.1% 2.00 3.60 5.60 27.48 59.47 86.95 61.2%
2015 N/A N/A 4.00 4.50 8.50 66.37 74.66 141.03 58.1%
2016 N/A N/A 4.00 6.00 10.00 66.37 99.55 165.92 55.5%
2017 N/A N/A 5.00 7.00 12.00 82.96 116.14 199.10 51.0%
2018 N/A N/A 5.00 9.002 14.00 82.96 149.332 232.29 52.6%2
1
118 / €25
2

2 Feb 2018Proposed disposal by Malaysia Airports ofits entire 11% equity interest in GHIAL(Proposed Disposal)
7 Feb 2018Malaysia Airports concluded twopartnership agreements and two MOUs atthe Singapore Airshow
13 Mar 2018Malaysia Airports collaborated with AxisREIT and Senior Aerospace as part of aninitiative to revitalise Subang AerospacePark
22 Mar 2018KLIA won Routes Asia 2018 MarketingAward
27 Mar 2018Proposed disposal by Malaysia Airports ofits entire 23% equity interest in GMIAL
27 Jun 2018KLIA celebrated 20 years of serviceexcellence and joyful memories as anaspiring global aviation hub
31 Jul 2018ISG opened its new domestic boarding hall,increasing the terminal capacity from 33mppa to 41.0mppa
4 Jun 2018Malaysia Airports launched MyAirports App, a new mobile app which provides a comprehensive airport travel guide
11 May 2018ISG celebrated its 10th year anniversary
1 Sep 2018Langkawi International Airport expansionproject completed with capacity increasingfrom 1.5mppa to 4.0mppa
18 Jul 2018MAHB signs MoUs with 4 aviation players atthe Farnborough International Airshow toposition Malaysia as a global hub
Significant Events
9
2 Jan 2019Malaysia Airports terminated the agreementin relation to the Proposed Disposal
4 Jan 2019Appointment of Raja Azmi Raja Nazuddin asGroup Chief Executive Officer of MalaysiaAirports
17 Jan 2019Appointment of Tan Sri Datuk Zainun Ali asChairman of Malaysia Airports
17 Dec 2018Request for proposals for Subang Airportregeneration project to be undertaken on a1,063-acre site
3 Dec 2018The board of Malaysia Airports extendedthe deadline for the completion of theProposed Disposal
13 Dec 2018Malaysia Airports launched ‘Happy Guests,Caring Hosts’ campaign in its effort tobecome a service leader
21 Sep 2018Ground breaking ceremony for a newdedicated processing centre for departingairline crew at klia2

FY19 Headline KPIs and Outlook
10
FY19 Headline Key Performance Indicators (KPIs) FY19 Outlook
KPIs
Profitability(EBITDA)
Airport Service Quality
Target 2019
Above 40.0 mppa Category:
KUL Ranking Top 13
RM2,163.6mil:
▪ RM1,210.1mil
▪ EUR185.9mil / RM927.5mil1
▪ QAR24.1mil / RM26.0mil2
2019 Passenger Growth
Passenger traffic growth is expected to remain
vulnerable
Extensive support from Government
▪ : 4.9% (Int’l: 2.4%, Dom: 7.6%)
▪ : 4.3% (int’l: 5.2%, Dom: 3.8%)
▪ Visit Malaysia 2020 landmark initiativewill be launched in FY19
▪ The extension of 15-day visa exemptionsfor China and India tourists to Dec 2019
▪ Turkish government to promote historicaltourism
▪ GDP growth for MY is expected to growby 4.9%
▪ IATA global traffic forecast; in the range of6.0%
▪ ACI global traffic forecast: 6.1%▪ Low Brent crude prices expected in FY19
will flourish the air travel industry
1 Exchange rate EUR/MYR = RM4.992 Exchange rate QAR/MYR = RM1.08

Group Financial Review

(RM 'mil)
4Q18 4Q17 (Restated)MY
Variance %TR
Variance % Variance %MY TR MY TR
Revenue incl. IC12 979.4 272.3 1,251.7 935.6 310.5 1,246.1 4.7 (12.3) 0.4
Revenue excl. IC12 979.4 274.9 1,254.3 935.6 252.6 1,188.2 4.7 8.8 5.6
Other Income 62.1 11.3 73.4 66.1 7.8 73.9 (6.1) 45.5 (0.7)
Direct Cost (216.9) - (216.9) (224.0) - (224.0) 3.2 - 3.2
Operating Expenditure (624.0) (68.1) (692.1) (525.8) (70.4) (596.2) (18.7) 3.2 (16.1)
Construction Cost - 2.6 2.6 - (57.9) (57.9) - 104.5 104.5
EBITDA 200.6 218.1 418.8 251.9 190.0 441.9 (20.4) 14.8 (5.2)
Depreciation & Amortisation (106.6) (126.8) (233.4) (90.1) (102.6) (192.8) (18.3) (23.5) (21.1)
Finance Costs (43.0) (128.0) (171.0) (48.0) (149.0) (197.0) 10.4 14.1 13.2
Share of Assoc. & JV Profit 13.1 - 13.1 5.2 - 5.2 150.4 - 150.4
Profit before Tax & Zakat 64.2 (36.7) 27.5 119.0 (61.7) 57.4 (46.1) 40.5 (52.1)
Taxation & Zakat (3.2) 3.8 0.6 (47.3) 22.2 (25.1) 93.2 (82.8) 102.5
Net Earnings 61.0 (32.9) 28.1 71.7 (39.5) 32.3 (15.0) 16.7 (13.0)
EBITDA Margin (%) (excl. IC12) 20.5% 79.3% 33.4% 26.9% 75.2% 37.2% (6.4)ppt 4.1ppt (3.8)ppt
PBT Margin (%) (excl. IC12) 6.6% (13.3%) 2.2% 12.7% (24.4%) 4.8% (6.2)ppt 11.1ppt (2.6)ppt
Group 4Q18 Results (vs 4Q17)
12
Exchange rate used in profit and loss for 4Q18 : RM4.75/EUR
Exchange rate used in profit and loss for 4Q17 : RM4.87/EUR

(RM 'mil)
4Q18 4Q17 (Restated)MY
Variance %TR
Variance % Variance % MY TR MY TR
Revenue incl. IC12 979.4 272.3 1,251.7 935.6 310.5 1,246.1 4.7 (12.3) 0.4
Revenue excl. IC12 979.4 274.9 1,254.3 935.6 252.6 1,188.2 4.7 8.8 5.6
Group 4Q18 Results (vs 4Q17)
Group revenue grew by 5.6%*
Airport operations: RM1,177.1mil (+5.9%)
▪ Aeronautical: RM645.3mil (+11.1%) mainly due to higher international passengers in Malaysia and Turkey by4.5% and 12.9% respectively
▪ Non-Aeronautical: RM531.9mil (+0.2%) due to stronger contributions from ISG which was mitigated byweaker sales from the retail business
Non-airport operations: RM77.1mil (+1.3%)
▪ Project and repair maintenance: RM46.2mil (+16.7%)
▪ Hotel: RM25.6mil (-5.9%)
▪ Agriculture & horticulture: RM5.4mil (-43.2%)
13
*Excluding Construction Revenue in relation to IC interpretation 12: Service Concession Arrangement (IC12)

Group EBITDA decreased by 5.2%
Malaysia operations: EBITDA fell by 20.3% due to higher provisions for doubtful debts, utilities and repairs &maintenance costs despite higher revenue
Turkey operations: EBITDA increased by 14.8% in line with higher operating revenue
Group Profit before Tax & Zakat decreased by 52.3%
Malaysia operations: Lower PBT by 46.1% was largely attributed to lower EBITDA
Turkey operations: Recorded PBT of RM15.2mil (4Q17: LBT of RM39.1mil) prior to taking into account a loss ofRM52.0mil (4Q17: RM22.7mil) primarily owing to the amortization of fair value of the concession rights
14
Group 4Q18 Results (vs 4Q17)
(RM 'mil)4Q18 4Q17 (Restated)
MYVariance %
TRVariance % Variance % MY TR MY TR
EBITDA 200.6 218.1 418.8 251.9 190.0 441.9 (20.3) 14.8 (5.2)
Profit before Tax & Zakat 64.2 (36.7) 27.5 119.0 (61.7) 57.4 (46.1) 40.5 (52.3)

(RM 'mil)
4Q18 3Q18 MY
Variance %TR
Variance % Variance % MY TR MY TR
Revenue incl. IC12 979.4 272.3 1,251.7 920.3 309.2 1,229.5 6.4 (11.9) 1.8
Revenue excl. IC12 979.4 274.9 1,254.3 920.3 309.2 1,229.5 6.4 (11.1) 2.0
Other Income 62.1 11.3 73.4 67.1 8.0 75.1 (7.4) 42.0 (2.2)
Direct Cost (216.9) - (216.9) (176.1) - (176.1) (23.1) - (23.1)
Operating Expenditure (624.0) (68.1) (692.1) (486.8) (52.0) (538.7) (28.2) (31.1) (28.5)
Construction Cost - 2.6 2.6 - - - - - -
EBITDA 200.6 218.1 418.8 324.5 265.3 589.8 (38.2) (17.8) (29.0)
Depreciation & Amortisation (106.6) (126.8) (233.4) (93.5) (131.5) (225.1) (13.9) 3.6 (3.7)
Finance Costs (43.0) (128.0) (171.0) (41.6) (172.1) (213.7) (3.4) 25.6 20.0
Share of Assoc. & JV Profit 13.1 - 13.1 3.7 - 3.7 250.3 - 250.3
Profit before Tax & Zakat 64.2 (36.7) 27.5 193.2 (38.4) 154.8 (66.8) 4.4 (82.3)
Taxation & Zakat (3.2) 3.8 0.6 3.4 10.3 13.7 (194.1) (62.8) (95.5)
Net Earnings 61.0 (32.9) 28.1 196.6 (28.1) 168.5 (69.0) (17.1) (83.3)
EBITDA Margin (%) (excl. IC12) 20.5% 79.3% 33.4% 35.3% 85.8% 48.0% (14.8)ppt (6.4) ppt (14.6) ppt
PBT Margin (%) (excl. IC12) 6.6% (13.3%) 2.2% 21.0% (12.4%) 12.6% (14.4)ppt (0.9) ppt (10.4) ppt
Group 4Q18 Results (vs 3Q18)
15
Exchange rate used in profit and loss for 4Q18 : RM4.75/EUR
Exchange rate used in profit and loss for 3Q18 : RM4.79/EUR

(RM 'mil)
4Q18 3Q18 MY
Variance %TR
Variance % Variance % MY TR MY TR
Revenue incl. IC12 979.4 272.3 1,251.7 920.3 309.2 1,229.5 6.4 (11.9) 1.8
Revenue excl. IC12 979.4 274.9 1,254.3 920.3 309.2 1,229.5 6.4 (11.1) 2.0
16
*Excluding Construction Revenue in relation to IC interpretation 12: Service Concession Arrangement (IC12)
Group 4Q18 Results (vs 3Q18)
Group revenue increased by 2.0%*
Airport operations: RM1,177.1mil (+1.9%)
▪ Aeronautical: RM645.3mil (+2.0%) mainly due to higher passenger volumes in Malaysia
▪ Non-Aeronautical: RM531.8mil (+1.7%) mainly cushioned by higher Retail revenues in Malaysia
Non-airport operations: RM77.1mil (+4.0%)
▪ Project and repair maintenance: RM46.2mil (+15.2%)
▪ Hotel: RM25.6mil (+3.6%)
▪ Agriculture & horticulture: RM5.4mil (-41.9%)

Group EBITDA decreased by 29.0%
Malaysia operations: Lower EBITDA by (-38.2%) mainly due to higher provisions for doubtful debts, repair &maintenance cost and employee benefits expenses
Turkey operations: Lower EBITDA by (-17.8%) in line with lower revenue
Group PBT decreased by 82.3%
Malaysia operations: Lower PBT by (-66.8%) largely attributable to lower EBITDA and higher depreciation
Turkey operations: Recorded PBT of RM15.2mil (3Q18: RM16.3mil), prior to taking into account a loss ofRM52.0mil (3Q18: RM55.1mil) primarily owing to the amortization of fair value of the concession rights
17
Group 4Q18 Results (vs 3Q18)
(RM 'mil)4Q18 3Q18
MYVariance %
TRVariance % Variance %
MY TR MY TR
EBITDA 200.6 218.1 418.8 324.5 265.3 589.8 (38.2) (17.8) (29.0)
Profit before Tax & Zakat 64.2 (36.7) 27.5 193.2 (38.4) 154.8 (66.8) 4.4 (82.3)
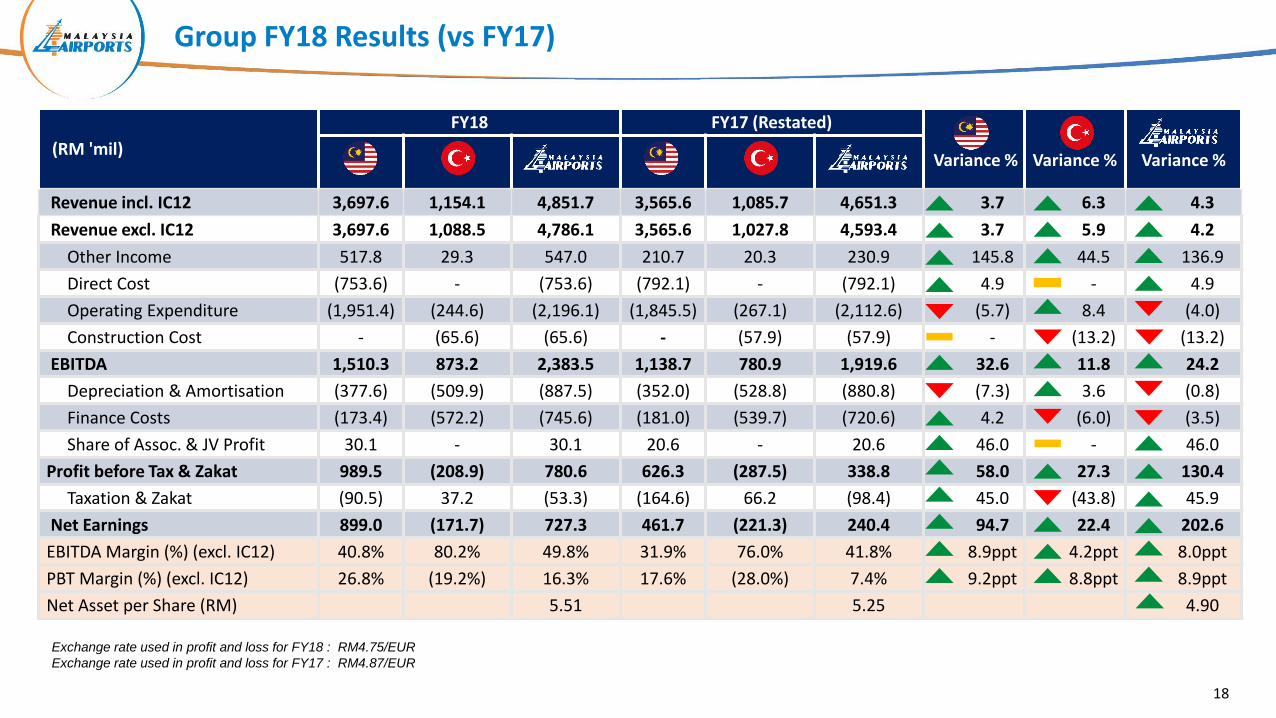
Group FY18 Results (vs FY17)
18
(RM 'mil)
FY18 FY17 (Restated)MY
Variance %TR
Variance %MAHB Group
Variance %MY TR MAHB Group MY TR
Revenue incl. IC12 3,697.6 1,154.1 4,851.7 3,565.6 1,085.7 4,651.3 3.7 6.3 4.3
Revenue excl. IC12 3,697.6 1,088.5 4,786.1 3,565.6 1,027.8 4,593.4 3.7 5.9 4.2
Other Income 517.8 29.3 547.0 210.7 20.3 230.9 145.8 44.5 136.9
Direct Cost (753.6) - (753.6) (792.1) - (792.1) 4.9 - 4.9
Operating Expenditure (1,951.4) (244.6) (2,196.1) (1,845.5) (267.1) (2,112.6) (5.7) 8.4 (4.0)
Construction Cost - (65.6) (65.6) - (57.9) (57.9) - (13.2) (13.2)
EBITDA 1,510.3 873.2 2,383.5 1,138.7 780.9 1,919.6 32.6 11.8 24.2
Depreciation & Amortisation (377.6) (509.9) (887.5) (352.0) (528.8) (880.8) (7.3) 3.6 (0.8)
Finance Costs (173.4) (572.2) (745.6) (181.0) (539.7) (720.6) 4.2 (6.0) (3.5)
Share of Assoc. & JV Profit 30.1 - 30.1 20.6 - 20.6 46.0 - 46.0
Profit before Tax & Zakat 989.5 (208.9) 780.6 626.3 (287.5) 338.8 58.0 27.3 130.4
Taxation & Zakat (90.5) 37.2 (53.3) (164.6) 66.2 (98.4) 45.0 (43.8) 45.9
Net Earnings 899.0 (171.7) 727.3 461.7 (221.3) 240.4 94.7 22.4 202.6
EBITDA Margin (%) (excl. IC12) 40.8% 80.2% 49.8% 31.9% 76.0% 41.8% 8.9ppt 4.2ppt 8.0ppt
PBT Margin (%) (excl. IC12) 26.8% (19.2%) 16.3% 17.6% (28.0%) 7.4% 9.2ppt 8.8ppt 8.9ppt
Net Asset per Share (RM) 5.51 5.25 4.90
Exchange rate used in profit and loss for FY18 : RM4.75/EUR
Exchange rate used in profit and loss for FY17 : RM4.87/EUR

(RM 'mil)
FY18 FY17 (Restated)MY
Variance %TR
Variance %MAHB Group
Variance %MY TRMAHB Group
MY TRMAHB Group
Revenue incl. IC12 3,697.6 1,154.1 4,851.7 3,565.6 1,085.7 4,651.3 3.7 6.3 4.3
Revenue excl. IC12 3,697.6 1,088.5 4,786.1 3,565.6 1,027.8 4,593.4 3.7 5.9 4.2
Group FY18 Results (vs FY17)
Group revenue grew by 4.2%*
Airport operations: RM4,494.8mil (+4.6%)
▪ Aeronautical: RM2,404.3mil (+6.7%) mainly due to higher international passenger growth in Malaysia andTurkey by 4.5% and 12.9% respectively, leading to higher PSC revenue
▪ Non-Aeronautical: RM2,090.5mil (+2.3%) mainly due to higher commercial revenues in Malaysia and Turkey by7.1% and 3.9% respectively
Non-airport operations: RM291.3mil (-1.8%)
▪ Project and repair maintenance: RM162.2mil (+4.5%)
▪ Hotel: RM99.0mil (-4.1%)
▪ Agriculture & horticulture: RM30.1mil (-21.2%)
19
*Excluding Construction Revenue in relation to IC interpretation 12: Service Concession Arrangement (IC12)

Group EBITDA increased by 24.2%
Malaysia operations: EBITDA grew by 32.6% mainly due to unrealised gain on non-core items amounting toRM286.6mil
Malaysia operations: EBITDA excluding non-core items, EBITDA grew by 8.0% in tandem with higher revenuemitigated by increase in utilities and maintenance costs
Turkey operations: EBITDA up by 11.8% in line with higher international passenger growth by 12.5%
Group PBT increased by 130.3%
Malaysia operations: Higher PBT by 58.0% was largely attributed to unrealised gain on non-core items
Malaysia operations: PBT excluding non-core items grew 12.2% attributed to higher EBITDA
Turkey operations: Recorded PBT of RM7.7mil (FY17: LBT of RM75.2mil), prior to taking into account a loss ofRM216.7mil (FY17: RM212.2mil) primarily owing to the amortization of fair value of the concession right.
20
Group FY18 Results (vs FY17)
(RM 'mil)
FY18 FY17 (Restated)MY
Variance %TR
Variance % Variance %MY TR MY TR
EBITDA 1,510.3 873.2 2,383.5 1,138.7 780.9 1,919.6 32.6 11.8 24.2
Profit before Tax & Zakat 989.5 (208.9) 780.6 626.3 (287.5) 338.8 58.0 27.3 130.4

(RM 'mil)
FY18 FY17 (Restated) Variance (%)
EBITDA excluding Non-core items (NCI) & Adjustments (Adj) 1,229.9 862.1 2,092.0 1,138.7 770.7 1,909.3 8.0% 11.9% 9.6%
NCI + Other Income - Gain on disposal of GMIAL 28.2 - 28.2 - - -
NCI + Other Income - FV gain on investment in GHIAL 258.4 - 258.4 - - -
Adj* + Other Income - ISG PPA interest income - 11.1 11.1 - 10.2 10.2
NCI + Other Expenses- Transaction cost (6.1) - (6.1) - - -
EBITDA including NCI & Adj 1,510.3 873.2 2,383.5 1,138.7 780.9 1,919.6 32.6% 11.8% 24.2%
- Depreciation and Amortisation (377.6) (312.8) (690.4) (352.0) (337.6) (689.6)
Adj* - Amortisation - ISG&LGM PPA concession rights fair value - (197.1) (197.1) - (191.2) (191.2)
- Finance Costs - interest on borrowing and misc. (173.4) (120.9) (294.3) (181.0) (111.8) (292.7)
- Finance Costs - ISG utilization fee expense - (420.4) (420.4) - (396.7) (396.7)
Adj* - Finance Costs - ISG&LGM PPA interest expense - (30.9) (30.9) - (31.2) (31.2)
+ Share of Assoc. & JV Profit 30.1 - 30.1 20.6 - 20.6
Profit before Tax & Zakat including NCI &Adj 989.5 (208.9) 780.6 626.3 (287.5) 338.8 58.0% 27.3% 130.4%
- Taxation and Zakat (90.5) 37.2 (53.3) (164.6) 66.2 (98.4)
PAT including NCI & Adj 899.0 (171.7) 727.3 461.7 (221.3) 240.4 94.7% 22.4% 202.6%
FY18 EBITDA and PBT Reconciliation
21
Note: Included within current period retained earnings is a distribution to the perpetual sukuk holders amounting to RM57.5mil (FY17: RM57.5mil)*PPA (Purchase Price Allocation): Non-cash adjustments are in respect of the fair valuation exercise on the Turkish operations under MFRS3: Business Combinations (FY18:RM216.7mil; FY17: RM212.2mil)

1,387.7
406.2
(62.8)65.9
831.3 661.5
61.9 63.3 90.2
30.1 162.2
499.5
107.7
417.2
38.0 17.2 8.8 65.6
1,335.5
385.7
(89.0)
57.3
853.7
630.2
57.4 47.0 94.5
38.2 155.2
453.2
111.0
394.4
44.5 16.0 8.7 57.9
(500.0)
-
500.0
1,000.0
1,500.0
2,000.0
PSC & PSSC
Landing & Parking
Airline Incentive
Others Retail Rental & Royalties
Car Park Others Hotel Agriculture &Horticulture
Proj & repairmaintenance
Construction Revenue
FY17 TR FY17 MY FY18 TR FY18 MY
Group Segmental Revenue
Non-Airport Operations (RM ‘mil)FY18: RM291.3 (-1.8%)FY17: RM296.6FY18: RM282.5 (-1.9%) excluding ISG & LGMFY17: RM287.9 excluding ISG & LGM
Excluding ISG & LGM
Including ISG & LGM
*Included in Turkish operations’ aeronautical revenue is ISG’s jet fuel farm rental income of EUR7.2mil / RM34.3mil (FY17: EUR7.6mil / RM 36.8mil)
**Included in Turkish operations’ rental and royalties is revenue generated from ISG’s duty free business with Setur of EUR53.5mil / RM254.8mil (FY17: EUR48.0mil/ RM234.1mil)
(RM ‘mil)
+5.5%
+3.9%
+5.3%
+5.3%
(-29.4%)
(-29.4%)
+3.2%
+15.0%
(-2.6%)
(-2.6%)
+5.3%
+5.0%
(-1.9%)
+7.8%
+27.9%
+34.8%
(-4.0%)
(-4.5%)
(-21.2%)
(-21.2%)
Non-Aeronautical (RM ‘mil)FY18: RM2,090.5 (+2.3%)FY17: RM2,043.2FY18: RM1,618.0 (+1.9%) excluding ISG & LGMFY17: RM1,588.3 excluding ISG & LGM
22
Aeronautical (RM ‘mil)FY18: RM2,404.3 (+6.7%)FY17: RM2,253.6FY18: RM1,797.0 (+6.4%) excluding ISG & LGMFY17: RM1,689.4 excluding ISG & LGM
Construction Revenue (RM ’mil)
13.2%
-
+4.5%
+4.5%
***Inclusive of MARCS PSC and MARCS ERL
A
B FE
C
D
**
*
***

Group Explanatory Notes
PSC and PSSC (inclusive of MARCS PSC and MARCS ERL)The increase in PSC and PSSC is in line with the passenger movements in Malaysia and Turkey by 2.5% and 8.8% respectively. Malaysian passenger trafficincreased moderately while Turkish operations showed continued strong growth momentum in passenger movements
Landing & ParkingLanding & parking revenue in Malaysia increased due to higher international aircraft movements by 5.4%. Landing & parking revenue at ISG is collected by theGovernment of Turkey
Rental & RoyaltiesDespite the implementation of the commercial reset at KLIA Main, the increase in rental and royalties by improved contributions from:
Extension of permanent contractsCasual leasingPromotional activities
HotelThe decrease in room revenue for Malaysia operations was contributed by: lower occupancy rate (FY18 : 83.0%; FY17 : 86.0%) coupled with lower averageroom rate (FY18: RM304; FY17: RM307)
Agriculture & HorticultureThe decrease was due to lower average price attained per Fresh Fruit Bunches (FFB) by 21.2% (FY18: RM464/MT; FY17: RM611/MT) despite higher FFBproduction (FY18: 67,056 MT; FY17: 63,458 MT)
Construction Revenue (IC12: Service Concession Agreement)IC12 addresses the accounting for ‘public-private’ arrangements whereby a private sector operator is involved in the construction/upgrading of infrastructureassets to be used in providing public service. Under IC12, the operator may provide construction services to the grantor in exchange for an intangible asset (ie.a right to collect revenue in accordance with the concession agreement)
The ISG boarding hall expansion was completed in July 201823
A
B
C
D
E
F

454.7
161.9 137.0
644.9
365.7
289.7 417.6
233.4
44.7
21.9
73.9 104.2
65.6
483.3
160.1 148.8
657.4
316.5
265.4 391.8
214.4
50.0
22.9 87.1 107.0
57.9 -
100.0
200.0
300.0
400.0
500.0
600.0
700.0
800.0
Direct Materials Direct Labour Direct Overheads Staff costs Utilities & comm Maintenance User Fee Others Construction Cost
FY18 MY FY18 TR FY17 MY FY17 TR
Operating Costs (RM ‘mil)FY18: RM1,951.4 (+4.0%)FY17: RM2,112.6 FY18: RM1,951.4 (+5.7%) excluding ISG & LGMFY17: RM1,845.5
Group Operating Cost Analysis
Direct Costs (RM ‘mil)FY18: RM753.6 (-4.9%)FY17: RM792.1
(RM ‘mil)
Excluding ISG & LGM
Including ISG & LGM
(-7.9%)(-5.9%)
(-7.9%)(-5.9%)
+1.1%
+1.1%
+14.2%
+15.6%
(-2.5%)
(-1.9%) +9.2%
+3.2% +6.6%
+6.6%
+5.1%
+8.9%
24
Construction Cost (RM ’mil)
+13.2%
-
A
B C
D

Group Explanatory Notes
Direct CostsDirect costs decreased mainly due to cost savings from direct materials and direct overheads coupled up with lower retail sales
Utilities & CommHigher utilities due to increase in chilled water expenses as a result of increase in tariff as well as higher consumption
User FeeThe increase is mainly due to higher revenue for airport operations revenue and annual escalation of user fee rate (4Q18: 11.89%; 4Q17:11.55%)
Construction Cost (IC12: Service Concession Agreement)IC12 addresses the accounting for ‘public-private’ arrangements whereby a private sector operator is involved in the construction/upgrading ofinfrastructure assets to be used in providing public service. Under IC12, the operator may provide construction services to the grantor inexchange for an intangible asset (ie. a right to collect revenue in accordance with the concession agreement).
The ISG boarding hall expansion was completed in July 2018
25
A
B
C
D

440.4 1,768.9
8,403.1
3,100.0
286.8 1,350.7 155.7
1,024.0
8,361.9
2,043.3
5,024.3
99.8
480.8 1,684.3
8,112.5
3,350.0
372.7 1,199.6 162.8
887.2
9,297.1
2,199.3
5,100.1
101.4
(1,000.0)
3,000.0
7,000.0
11,000.0
15,000.0
19,000.0
TradeReceivables
Cash &Funds
IntangibleAssets
Borrowings TradePayables
OtherPayables
Group Balance Sheet Analysis
Excluding ISG & LGM
Including ISG & LGM
Exchange rate used in balance sheet for FY18: RM4.73/EUR
Exchange rate used in balance sheet for FY17: RM4.84/EUR
Net Assets (RM ‘mil)Dec 18: RM9,140.4 (+4.9%)Dec 17: RM8,715.7
+11.5%(-7.4%)
+12.6%(-8.4%)
(-7.3%)
(-7.5%)
(-3.0%)
(-23.1%)
(-3.7%)
+3.6%
+8.6%
+5.0%
(RM ‘mil)
26
Sukuk repayment of RM250.0mil was made during the year along
with ISG term loan (EUR25mil/ RM117.6)

Turkish Operations(ISG & LGM) Financial
Performance

Profit Before Tax (EUR ‘mil)
ISG Income Statement Summary
28*In relation to IC interpretation 12: Service Concession Arrangement whereby ISG recognised the construction revenues and costs by reference to the stage of completion of Istanbul Sabiha Gokcen International Airport expansion works**Change of jet fuel supply operations in 2013 from supply of jet fuel to airlines to provision of jet fuel farm services to the jet fuel supplier . With effect from Sept 2014, ISG further changed its jet fuel farm operations to outright rental of the farm in the form of variable rent (tariff) per ton of jet fuel supplied to airlines
Revenue (EUR ‘mil)FY18: EUR217.6 (+8.9%)FY17: EUR199.8
Net Earnings (EUR ‘mil)
EBITDA (EUR ‘mil)FY18: EUR174.5 (+15.0%)FY17: EUR151.8
FY18: EUR(-3.7) (+82.5%)FY17: EUR(-21.4)
FY18: EUR(-3.3) (+79.3%)FY17: EUR(-15.7)
275.5
214.3 205.7 197.7 198.5 199.5 217.6 211.4
231.4
- - -47.2 44.8 48.9
- - -
49.0 46.5 52.1
- - -
55.5 59.2 61.8
- - -
46.7 48.9 54.8
0.0
100.0
200.0
300.0
2012 2013 2014 2015 2016 2017 2018
Revenue Revenue (with IC12) Q1 Q2 Q3 Q4
57.4
83.8
131.0
151.5 149.7 151.8
174.5
- - -35.7 33.2 37.2
- - -
36.5 34.4 40.9
- - -
42.2 47.2 52.9
- - -
35.3 37.1
43.5
0.0
30.0
60.0
90.0
120.0
150.0
180.0
210.0
2012 2013 2014 2015 2016 2017 2018
EBITDA Q1 Q2 Q3 Q4
(111.3)
(65.3)
(21.9) (0.2) (18.1)(21.4)
(3.7)
- - -
(5.4)(10.3)
(5.7)- - -
(1.2)
(3.8)(1.9)
- - -(0.9)
2.1 2.9
- - -(10.7) (9.3)
0.9
(125.0)
(95.0)
(65.0)
(35.0)
(5.0)
25.0
2012 2013 2014 2015 2016 2017 2018
PBT Q1 Q2 Q3 Q4
(101.0)
(55.1)
(23.4)
(6.2)
(31.4)
(15.7)
(3.3)
(6.0)(9.3)
(5.1)(3.8) (2.5) (1.4)
(7.3)
1.8 3.3
(14.3)(5.8) 0
(120.0)
(100.0)
(80.0)
(60.0)
(40.0)
(20.0)
0.0
2012 2013 2014 2015 2016 2017 2018
Net Earnings Q1 Q2 Q3 Q4
*
**

93.0
11.6
3.7 7.6
48.0
23.2
9.4 3.3
11.9
104.9
12.2
3.2 7.2
53.5
24.3
8.3 3.9
13.9
0.0
20.0
40.0
60.0
80.0
100.0
120.0
PSC PBB & CIC Others Jet Fuel Farm Duty Free RentalIncome
Other Rental &Commercial
Car Park Others Construction Revenue
FY17 FY18
ISG Revenue Analysis
(EUR ‘mil)
Non-Aeronautical (EUR ‘mil)FY18: €89.9 (+7.1%)FY17: €84.0
Aeronautical (EUR ‘mil)FY18: €127.6 (+10.2%)FY17: €115.8
+12.9% +6.0% (-13.5%) +16.1%+11.5% +4.4% (-12.0%)(-4.7%)
29
Construction Revenue (EUR ‘mil)
+16.5%
A
B
C

ISG Explanatory Notes
PSCThe increase of 12.9% in PSC revenue is due to the 8.8% rise in passenger traffic, with international passenger movements increasing by 12.9%• International PSC: EUR15; Domestic PSC: EUR3; International Transfer PSC: EUR5; Domestic Transfer (from 1 March 2016) PSC: EUR1
Duty Free Rental IncomeThe increase in duty free rental income was mainly due to the rise in international passenger traffic. ISG will receive revenue amounting to thehigher of 46.0% (FY17: 46.0%) between: 1) guaranteed spending per pax which is the contractual income guaranteed by Setur; or (2) actual dutyfree spending per pax• Average Spending per pax (FY18: EUR7.94; FY17: EUR8.87)• Guaranteed spending per pax (FY18: EUR9.50; FY17: EUR9.50)
Construction Revenue (IC12: Service Concession Agreement)IC12 addresses the accounting for ‘public-private’ arrangements whereby a private sector operator is involved in the construction/upgrading ofinfrastructure assets to be used in providing public service. Under IC12, the operator may provide construction services to the grantor inexchange for an intangible asset (ie. a right to collect revenue in accordance with the concession agreement)
The ISG boarding hall expansion was completed in July 2018
30
A
B
C

9.2
4.5 6.4
9.7
20.0
11.9
81.6
22.3
9.0 4.6 5.5
10.6
16.7 13.9
88.4
24.3
0.0
10.0
20.0
30.0
40.0
50.0
60.0
70.0
80.0
90.0
100.0
Staff Costs Utilities Maintenance PSC Share Others Construction Cost Utilization Fee Financial Expense
FY17 FY18
ISG Cost Analysis
(EUR ‘mil)
(-2.6%) +2.4% (-15.0%) +8.2%(-16.5%)+9.7% +16.5%
31
+9.4%
Operating Costs (EUR ‘mil)FY18: €46.3 (-6.9%)FY17: €49.8
Construction Cost (EUR ‘mil)
Finance Cost (EUR ‘mil)FY18: €112.7 (+8.5%)FY17: €103.9
A B C
D
A A

ISG Explanatory Notes
Staff Costs, Maintenance & OthersThe decrease was largely attributable to the higher average exchange rate from Turkish Lira to EUR mainly impacting salaries and contract costs
PSC ShareThe increase of 9.7% is due to 8.8% increase in passenger traffic, particularly international passenger traffic which increased by 12.9%
International PSC share: EUR1.50; International Transfer PSC share: EUR2.50; Domestic Transfer PSC share: EUR0.50
Construction Cost (IC12: Service Concession Agreement)IC12 addresses the accounting for ‘public-private’ arrangements whereby a private sector operator is involved in the construction/upgrading ofinfrastructure assets to be used in providing public service. Under IC12, the operator may provide construction services to the grantor in exchange foran intangible asset (ie. a right to collect revenue in accordance with the concession agreement)
The ISG boarding hall expansion was completed in July 2018
Utilization Fee Finance CostThe utilization fee liability represents the present value of amounts payable to the Administration in accordance with the Implementation Agreementfor the operation of ISG for 24 years. The actual utilization fee payment is based on a step up basis of which the first cycle is EUR76.5 million, followedby an increase of EUR19.1 million for each step up. The first step up to EUR95.6 million granted in 2015 with the next step up to EUR114.8miloccurring in 2019. The utilization fee finance cost of EUR88.4mil relates to interest expense on utilization fee liability for the period. The increase inutilization fee finance cost is due to the 2 year extension to the Implementation Agreement, granted in 2017
32
A
B
C
D

54.0
175.9
1,096.1 1,153.3
454.4
43.6
207.5
1,048.9
1,147.1
432.0
0.0
200.0
400.0
600.0
800.0
1,000.0
1,200.0
1,400.0
Trade & Other Receivables Cash & Funds Intangible Assets Trade & Other Payables Borrowings
Dec-17 Dec-18
ISG Balance Sheet Analysis
(-19.2%) +18.0% (-4.3%) (-0.5%) (-4.9%)
33
Repayment of EUR25.0mil in
2018
Concession rights EUR742.5mil (FY17: EUR782.4mil) Terminal EUR 251.6mil (FY17:EUR 242.2mil)EUR ‘mil

LGM Income Statement
34*Decrease in revenue for LGM is mainly due to lower Commercially Important Person (CIP) rental revenue due to Akbank Lounge which was closed with effect from August 2015
Profit Before Tax (EUR ‘mil)
Revenue (EUR ‘mil)
Net Earnings (EUR ‘mil)
EBITDA (EUR ‘mil)FY18: EUR26.9 (+2.4%)FY17: EUR26.2
FY18: EUR6.5 (+4.3%)FY17: EUR6.3
FY18: EUR5.4 (-3.9%)FY17: EUR5.6
FY18: EUR3.6 (-29.9%)FY17: EUR5.2
12.7 15.3
19.5 20.9
22.6
27.9 26.2 26.9
6.1 5.8 6.3
6.8 6.6 6.4
7.9 7.6 6.6
6.3 6.3 7.6
0.0
5.0
10.0
15.0
20.0
25.0
30.0
2010 2011 2012 2013 2014 2015 2016 2017 2018
Revenue Q1 Q2 Q3 Q4
27.9
0.2 0.5 0.8 1.5
0.7
6.9 6.3 6.5
1.1 1.1 1.4 1.5 1.6 1.5
2.2 2.1 1.8
1.1 1.4 1.8
0.0
2.0
4.0
6.0
8.0
10.0
2010 2011 2012 2013 2014 2015 2016 2017 2018
EBITDA Q1 Q2 Q3 Q4
6.9
0.2 0.3 0.6 1.0 1.3
6.4 5.6
5.4
1.0 0.9 1.3
1.6 1.0
1.3
2.3 2.5
0.5
1.0 1.2 2.3
0.0
1.0
2.0
3.0
4.0
5.0
6.0
7.0
2010 2011 2012 2013 2014 2015 2016 2017 2018
PBT Q1 Q2 Q3 Q4
5.9
0.1 0.2 0.4
1.1 1.0
4.9 5.2
3.6
0.9 0.7 0.9
1.3 0.8
0.9
1.8
2.1
(0.1)
0.8 1.6
1.9
(1.0)
0.0
1.0
2.0
3.0
4.0
5.0
2010 2011 2012 2013 2014 2015 2016 2017 2018
Net Earnings Q1 Q2 Q3 Q4
4.7

Commercial Revenue Analysis

MTB11%
Satellite Building, 35%
Contact Pier12%
klia2, 42%
MTB11%
Satellite Building, 36%
Contact Pier12%
klia2, 41%
DescriptionFY18 FY17 Sales Per Pax
Variance (%)Sales (RM 'mil) No. of Pax ('mil) Sales per Pax (RM) Sales (RM 'mil) No. of Pax ('mil) Sales per Pax (RM)
Main Terminal Building 226.1 228.5
Satellite Building 736.9 751.7
Contact Pier 256.0 252.2
Total KLIA Main 1,219.0 28.1 43.38 1,232.3 28.3 43.56 (0.4)
Total klia2 895.3 31.9 28.10 868.7 30.3 28.70 (2.1)
Total KUL (KLIA Main + klia2) 2,114.3 60.0 35.26 2,101.0 58.6 35.88 (1.7)
KUL - Total Retail and F&B Sales
Sales at KUL FY18 Sales at KUL FY17
Lower sales per pax at KUL was mainlycontributed by:▪ Tight customs enforcement in China and
Malaysia▪ 11.8% increase in domestic passenger in klia2▪ Beginning of commercial reset in KLIA main
36Note: No. of pax includes domestic passengers. Data includes permanent retail and F&B while services & promotion is excluded.

KUL - ERAMAN Retail Revenue
Retail Revenue at KUL FY18
Retail Revenue at KUL FY17
• Top selling duty free products are perfume &cosmetics, followed by tobacco & cigarettes withChinese citizens still being the top spenders per ticketfollowed by ASEAN passengers
• Eraman commands about 41.0% of total sales per paxat klia2
37Note: No. of pax includes domestic passengers
DescriptionFY18 FY17 Revenue
Variance (%)
Revenue Per Pax Variance
(%)Revenue (RM 'mil)
No. of Pax ('mil)
Per Pax Revenue (RM)
Revenue (RM 'mil)
No. of Pax ('mil)
Per Pax Revenue (RM)
Main Terminal Building 22.6 23.1
Satellite Building 145.0 147.6
Contact Pier 165.0 166.0
Total KLIA Main 332.6 28.1 11.83 336.7 28.3 11.90 (1.2) (0.7)
Total klia2 366.8 31.9 11.51 398.6 30.3 13.17 (8.0) (12.6)
Total KUL (KLIA Main + klia2) 699.4 60.0 11.66 735.2 58.6 12.56 (4.9) (7.2)
MTB, 3%
Satellite Building, 21%
Contact Pier24%
klia2, 52%
MTB, 3%
Satellite Building, 20%
Contact Pier23%
klia2, 54%

Total Rental at KUL FY18
Total Rental at KUL FY17
MTB, 14%
Satellite Building, 38%
Contact Pier5%
klia2, 44%
MTB, 3%
Satellite Building, 20%
Contact Pier23%
klia2, 54%
KUL - Retail & F&B Rental
Note: Space is based on occupied space and excludes Eraman’s retail space. Data includes permanent retail and F&B while services & promotion is excluded
▪ KLIA Main recorded lower total rental due to thebeginning of the commercial reset
▪ klia2 rental revenue per sqm increased due tohigher royalties
38
Location
FY18 FY17
Revenue Variance
(%)No. of
Lease outSpace (Sqm)
Rental Revenue (RM 'mil) Rental Revenue
(RM '000) per Sqm
No. of Lease out
Space (Sqm)
Rental Revenue (RM 'mil) Rental Revenue (RM'000) per Sqm
MGP RoyaltyTotal
RentalMGP Royalty
Total Rental
Main Terminal Building 27 4,135 39.0 11.2 50.1 12.1 44 5,044 40.2 11.7 51.9 10.3
Satellite Building 63 7,046 101.9 35.3 137.2 19.5 68 7,662 104.3 36.5 140.8 18.4
Contact Pier 10 3,372 9.0 8.0 17.0 5.0 13 3,499 4.5 8.7 13.2 3.8
Total KLIA Main 100 14,553 149.9 54.4 204.3 14.0 125 16,205 149.0 56.9 205.9 12.7 (0.8)
Total klia2 91 14,220 99.6 58.0 157.6 11.1 82 13,641 98.5 47.2 145.7 10.7 8.1
Total KUL (KLIA Main + klia2) 191 28,773 249.4 112.4 361.9 12.6 207 29,846 247.5 104.1 351.6 11.8 2.9

ISG - Duty Free & Rental Analysis
ISG’s Duty Free Analysis
ISG’s Retail & F&B Rental Analysis
* ISG will receive rental revenue amounting to the higher of 46.0% (FY17: 46.0%) between: (1) guaranteed spending per pax which is the contractual income guaranteed by Setur; or (2) duty free spending per pax
*
39
Unit FY18 FY17
Average Duty Free spending per pax EUR/Pax 7.94 8.87
Guaranteed spending per pax EUR/Pax 9.50 9.50
Description
FY18 FY17Rental
Variance(%)
Rental/Sqm Variance
(%)Space (Sqm)
Rental (EUR 'mil)
Rental/Sqm (EUR
'000)
Space (Sqm)
Rental (EUR 'mil)
Rental/Sqm (EUR '000)
Setur Duty Free 5,050.0 53.5 8.4 5,050.0 48.0 8.2 11.5 11.5
Description
FY18 FY17 RentalVariance
(%)
Rental/Sqm Variance
(%)Space (Sqm)
Total Rental (EUR 'mil)
Rental/Sqm (EUR'000)
Space (Sqm)
Total Rental (EUR 'mil)
Rental/Sqm (EUR'000)
Food & Beverage 9,107.0 9.9 1.1 9,107.0 9.9 1.1 Nm Nm
Retail 2,934.9 1.7 0.6 1,697.5 1.2 0.7 46.0 (15.6)
Total ISG 12,041.9 11.6 1.0 10,804.5 11.1 1.0 4.9 (5.9)

Traffic Statistics

41
11.7 12.0 12.7 13.0 13.0 12.5 13.0 13.1
11.8 11.9 12.0 11.7 11.4 11.8 11.8 12.3
2.1 2.5 3.1 2.5 2.5 2.8 3.5 2.9
4.5 5.3 5.9
5.3 5.3 5.6 6.2
5.2
-
5.0
10.0
15.0
20.0
25.0
1Q17 2Q17 3Q17 4Q17 1Q18 2Q18 3Q18 4Q18
MY Int'l MY Domestic ISG Int'l ISG Domestic
KLIA Main klia2 KLIA (KUL) MASB Airports MY Airports ISG (SAW) MAHB Group
FY18 FY17 Var % FY18 FY17 Var % FY18 FY17 Var % FY18 FY17 Var % FY18 FY17 Var % FY18 FY17 Var % FY18 FY17 Var %
International 22.9 22.1 3.4 20.7 20.3 2.1 43.6 42.4 2.7 8.1 7.0 15.3 51.7 49.5 4.5 11.7 10.3 12.9 63.4 59.8 6.0
ASEAN 8.8 8.5 ↑ 3.3 11.8 11.5 ↑ 3.3 20.7 20.0 ↑ 3.3 4.8 4.2 ↑ 14.0 25.5 24.2 ↑ 5.2
Non-ASEAN 14.0 13.6 ↑ 3.4 8.9 8.9 ↑ 0.5 22.9 22.4 ↑ 2.3 3.3 2.8 ↑ 17.3 26.2 25.2 ↑ 3.9
Domestic 5.3 6.2 (14.7) 11.1 10.0 11.8 16.4 16.1 1.7 31.0 31.1 (0.2) 47.4 47.2 0.4 22.4 21.0 6.7 69.8 68.2 2.4
Total 28.1 28.3 (0.6) 31.9 30.3 5.3 60.0 58.6 2.4 39.1 38.1 2.6 99.0 96.6 2.5 34.1 31.3 8.8 133.1 128.0 4.0
Passenger movements (Pax)
Total MAHB network of airports registered 4.0%growthThere has been an increase in intra-domesticpassenger movements among non-KLIA airportswhich used to flow significantly through KLIA in thepast. There has also been an increase in directinternational services to non-KLIA airport which hasreduced some movements through KLIAPositive developments in Turkey continued, with an8.8% increase total passenger for FY18, contributedby international passenger traffic growth of 12.9%
New destinations for home-based carriers in FY18
AirAsia/AirAsiaXKUL-JaipurKUL-MaléKUL-Hua HinKUL-SilangitKUL-ChangsaKUL-Phu QuocKUL-Tainjin
Pax ‘mil
Malindo Air BKI-ChengduBKI-ChangshaBKI-GuangzhouBKI-TianjinBKI-SingaporeBKI-TawauBKI-Kuching
*
*MASB Airports refers to the 38 Malaysian airports other than KLIA/KUL operated by Malaysia Airports Sdn Bhd
BKI-NanningBKI-WuhanPEN-Banda AcehPEN-NanningIPH-MedanLGK-ChengduLGK-Kunming
Malaysia AirlinesKUL-Brisbane
Pegasus AirlinesSAW-BingolSAW-DammanSAW-NurenbergSAW-MuscatSAW-JeddahSAW-SharjahSAW-RotterdamSAW-Usak
LGK-GuiyangSZB-SilangitKUL-MelbourneKUL-LabuanKUL-AmritsarKUL-KolkataKBR-Surat Thani
Turkish AirlinesSAW-DammanSAW-BahrainSAW-Doha
KUL-KuantanPEN-HanoiPEN-PhuketIPH-Johor BahruIPH-SGBKI-MacauBKI-Kunming
KCH-TawauAOR-Johor Bahru
AnadolujetSAW-Batman

0.0
50.0
100.0
150.0
KLIA SabihaGokcen
Delhi Incheon Jakarta Ataturk Changi Beijing Bangkok Heathrow Sydney Hong Kong
58
.6
31
.3 63
.5
62
.1
62
.5
64
.1
62
.2 95
.8
60
.9
78
.0
43
.3 72
.9
60
.0
34
.1 69
.9
68
.3
66
.9
68
.0
65
.6 10
0.9
63
.4
80
.1
44
.4 74
.7
12M17 12M18
42
+6.0% +2.5%
Airport Peers Passenger Movements
+2.4%Pax ‘mil +7.1%+10.0% +5.5%+10.1% +2.5%
Source: Various airport websites, IATA
+4.1%+8.8%
Source: IATA: Robust passenger demand and a record load factor in 2018 (7th February 2019)
+5.4% +2.7%
• Industry-wide revenue passenger kilometers (RPKs) grew by a robust 6.5% in 2018 as a whole, slightly below the 8.0% rate of 2017
• The moderation in traffic came alongside growing signs of slowing global economic expansion in the second half of 2018
• Capacity grew at a slower pace than traffic in 2018 and the passenger load factor increased to a record high of 81.9%• Although passenger demand has moderated, 2019 is still looking robust in the face of economic uncertainty
Global Drivers

43
KLIA Main klia2 KLIA (KUL) MASB Airports MY Airports ISG (SAW) MAHB Group
FY18 FY17 Var % FY18 FY17 Var % FY18 FY17 Var % FY18 FY17 Var % FY18 FY17 Var % FY18 FY17 Var % FY18 FY17 Var %
International 151.6 147.3 2.8 123.4 119.6 3.1 274.9 266.9 3.0 73.9 64.2 15.1 348.9 331.1 5.4 83.2 76.4 9.0 432.1 407.5 6.0
Domestic 49.6 55.0 (9.8) 74.1 64.1 15.7 123.8 119.1 3.9 391.1 397.9 (1.7) 514.9 517.0 (0.4) 141.5 134.6 5.2 656.5 651.6 0.8
Total 201.2 202.3 (0.6) 197.5 183.7 7.5 398.7 386.1 3.3 465.0 462.1 0.7 863.8 848.1 1.9 224.7 210.9 6.6 1,088.6 1,059.0 2.8
Aircraft Movements (ATM)
ATM ‘000 Airline Routing Frequency EffectiveNew Airlines
Xiamen Air Beijing-BKI Daily 16/1Wings Air Pontianak-KCH 14x weekly 24/1Bassaka Air Phnom Penh-KUL Daily 31/1Scoot Singapore-KUA 3x weekly 2/2Qatar Airways Doha-PEN 3x weekly 6/2Wings Air Pontianak-MYY 7x weekly 15/3Citilink Indonesia Jakarta-PEN 7x weekly 25/3Wings Air Medan - MKZ 7x weekly 20/4Pobeda Airlines Moscow-SAW 7x weekly 21/9Pobeda Airlines St. Petersburg-SAW 7x weekly 28/10Citilink Indonesia Surabaya-PEN 7x weekly 1/11Condor Frankfurt-KUL 3x weekly 2/11Indigo Delhi/Bangalore-KUL 7x weekly 15/11Citilink Indonesia Banyuwangi-KUL 3x weekly 19/12Royal Brunei Bdr Seri Begawan-KCH 2x weekly 28/12
New ServicesWataniya Airways Kuwait-SAW Daily 25/3Emirates Dubai-SAW 5x weekly 8/6Thai Airasia Don Mueng-BKI 3x weekly 16/8Xiamen Air Xiamen-BKI 4x weekly 28/10
Additional FrequenciesChina Southern Guangzhou-PEN 7x to 14x weekly 1/6China Airlines Taipei-PEN 6x to 7x weekly 7/6Qatar Airways Doha-PEN 3x to 4x weekly 17/6
*MASB Airports refers to the 38 Malaysian airports other than KLIA/KUL operated by Malaysia Airports Sdn Bhd
*
Snapshot of new services from foreign based carriers in FY18
77.2 80.7 86.1 87.1 86.8 85.6 88.0 88.5
132.1 130.5 129.6 127.4 125.2 127.4 128.7 133.9
17.1 18.8 22.1 18.4 18.1 20.3 23.5 21.2
30.3 34.0 36.8
33.4 33.4 35.7 38.6
33.8
0.0
50.0
100.0
150.0
200.0
1Q17 2Q17 3Q17 4Q17 1Q18 2Q18 3Q18 4Q18
MY Int'l MY Domestic ISG Int'l ISG Domestic

MALAYSIA AIRPORTS HOLDINGS BERHAD
MALAYSIA AIRPORTS CORPORATE OFFICEPERSIARAN KORPORAT KLIA
64000 KLIASEPANG, SELANGOR
www.malaysiaairports.com.my
TEL: +603-8777 7000 FAX: +603-8777 7776EMAIL: [email protected]