Financial Results for the Period Ended January 2018 (12 ... · Portfolio Succeeded from JSL p.30...
71
Financial Results for the Period Ended January 2018 (12 th Fiscal Period) March 15, 2018
Transcript of Financial Results for the Period Ended January 2018 (12 ... · Portfolio Succeeded from JSL p.30...

Financial Results for the PeriodEnded January 2018 (12th Fiscal Period)
March 15, 2018


2
Disclaimer
The contents of this document, including summary notes, quotes, data and other information, are provided solely for informational purposes of KenedixResidential Next Investment Corporation (KDR) and not intended for the purpose of soliciting investment in, or as a recommendation to purchase or sell, anyspecific products. When you invest, please make decision by your own judgements and responsibility.
Please be aware that matters described herein may change or cease to exist without prior notice of any kind. This document contains forward-lookingstatements and anticipations of future results, based on current assumptions and beliefs in light of currently available information and resources. Risks anduncertainties, both known and unknown, including those relating to the future performance of the real estate market in Japan, interest rate fluctuations,competitive scenarios, and changing regulations or taxation, may cause KDR's actual results, performance, achievements and financial performance to bematerially different from those explicitly or implicitly expressed in this document.
With respect to any and all terms herein, including without limitation, this document, the information provided is intended to be thorough. However, noassurance or warranties are given with respect to the accuracy or completeness thereof.
Neither KDR nor Kenedix Real Estate Fund Management, Inc. (KFM) shall be liable for any errors, inaccuracies, loss or damage, or for any actions taken in reliancethereon, or undertake any obligation to publicly update the information contained in this document after the date of this document.
Revised editions of our annual reports will be posted on our website if there should be major corrections going forward.

3
Contents
1. The Merger with Japan Senior Living Investment Corporation (JSL) and Policies Going ForwardOverview of the Merger p.5
Portfolio after the Merger p.6
Investment Policy p.7
Bridge Funds p.8
Increasing Unitholders’ Value p.9-11
2. Financial Results (Actual Results for 12th Period and Outlook for 13th and 14th Period)Income Statements for the Period Ended January 2018 (12th Fiscal Period) p.13
DPU in 12th Period p.14
Outlook for the Period Ending July 2018 (13th Fiscal Period) p.15-16
Outlook for the Period Ending January 2019 (14th Fiscal Period) p.17-18
DPU Impact by the Merger p.19
3. Operational Status 〜Residential Facilities〜Portfolio p.21
Occupancy Rates p.22
New Tenant Trend p.23
Renewal Tenant Trend p.24
Rent per Tsubo of Residential Unit p.25
Initiatives to Improve the Performance of Properties p.26
Initiatives for Sustainability p.27
4. Operational Status 〜Healthcare Facilities〜Operational Status of Healthcare Facilities p.29
Portfolio Succeeded from JSL p.30
Initiatives to Improve the Performance of Properties p.31
Status of Lease Agreements p.32
5. FinanceFinance p.35-36
Unitholders p.37
AppendicesThe Properties Acquired p.39
The Properties Operated by Bridge Funds p.40-41
Tenant Demographics Analysis p.42
Sub-MLIT Standard Toyo Tire & Rubber Seismic Isolation Materials p.43
The Properties Operated by Bridge Funds (JSL) p.44-46
Classification of Senior Living Facilities p.47
Overview of Operators p.48
Support System by Sponsor and Support Companies p.49
Succession of Investment and Operation Strategy (ORE Strategy) about Healthcare Facilities p.50
Investment Unit Price p.51
KDR Positioning p.52
Financial Statements p.53-54
Summary of Kenedix Group p.55
Organization Chart of KFM (KDR) p.56
Appraisal Unrealized Capital Gains and NAV per Unit p.57
Appraisal Values p.58-63
Summary of Portfolio Performance p.64
Portfolio Performance in 2H 2017 p.65-69

1. The Merger with Japan Senior Living Investment Corporation (JSL) and Policies Going Forward

5
1. The Merger with JSL and Policies Going Forward
KDR will evolve into a new investment corporation (Kenedix Residential Next Investment Corporation) pursuingstable revenue and sustained growth through wide-ranging investment spanning the “spaces where people live
and stay,” extending from residential facilities to healthcare and accommodation.
Overview of the Merger
Advantage IIPeriod ended January 2018(12th fiscal period) Actual
Period ending July 2018(13th fiscal period) Forecast
¥3,570(Period on period +2.8%)
Highest
Period ending January 2019(14th fiscal period) Forecast
¥3,640(Period on Period +2.0%)
¥3,473Before the unit split ¥6,946(Period on Period +4.7%)
Note 1: “Asset size” and “ Market capitalization” are figures as of November 10, 2017 and March 1, 2018.Note 2: “LTV” and “NAV per unit” are the figures as of January 31, 2018 and the estimated figure as of March 1, 2018. “Negative goodwill” is the estimated figure as of March 15, 2018.
Increase in market capitalizationIncrease in asset size
¥164.1 bln ¥193.1 bln ¥100.7 bln ¥120.4 bln
NAV per unit
¥153,716 ¥156,998LTV
51.5 % 50.1 %
Increase in DPU by reduction of redundant costs, etc.
Advantage I Increase in asset size and market capitalization (1)
Advantage III Improve in each financial indicator and acquire negative goodwill (2)
Negative goodwill
¥2.4 bln
6
1. The Merger with JSL and Policies Going Forward
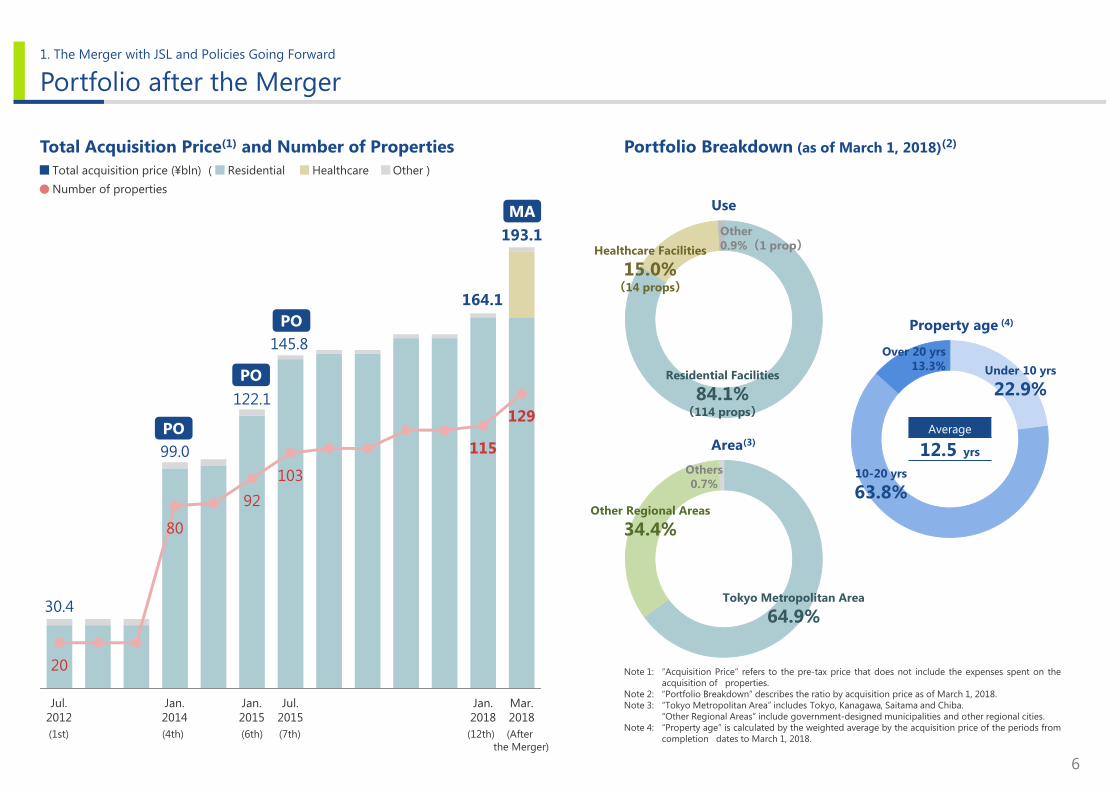
Portfolio after the Merger
30.4
99.0
122.1
145.8
164.1
193.1
20
80
92103
115
129
1st 2nd 3rd 4th 5th 6th 7th 8th 9th 10th 11th 12th
Total Acquisition Price(1) and Number of Properties
Jul.2012
Jan.2014
Jan.2015
Jul.2015
Jan.2018
Mar. 2018
Note 1: “Acquisition Price” refers to the pre-tax price that does not include the expenses spent on theacquisition of properties.
Note 2: “Portfolio Breakdown” describes the ratio by acquisition price as of March 1, 2018.Note 3: “Tokyo Metropolitan Area” includes Tokyo, Kanagawa, Saitama and Chiba.
“Other Regional Areas” include government-designed municipalities and other regional cities.Note 4: “Property age” is calculated by the weighted average by the acquisition price of the periods from
completion dates to March 1, 2018.
PO
PO
PO
MA
Portfolio Breakdown (as of March 1, 2018)(2)
Tokyo Metropolitan Area
64.9%
Others0.7%
Other Regional Areas
34.4%
Area(3)
Residential Facilities
84.1%(114 props)
Use
Healthcare Facilities
15.0%(14 props)
Other0.9%(1 prop)
Under 10 yrs
22.9%
10-20 yrs
63.8%
Over 20 yrs13.3%
Average
12.5 yrs
Property age (4)
Total acquisition price (¥bln) ( Residential Healthcare Other )Number of properties
(1st) (4th) (6th) (7th) (12th) (After the Merger)

7
1. The Merger with JSL and Policies Going Forward
Investment Policy
Investment Target by Use
Investment Policy
Investment Target by Area
Use Status of Market Investment Policy
Residential Facilities
・Inflow of population into Tokyo metropolitan area and major cities continues
・Favorable leasing market mainly in Tokyo・Decline in cap rate
・Put emphasis on investment in Tokyo metropolitan area ・Selective investment in regional cities・Strategic asset reshuffle
Healthcare Facilities
・Increasing number of elderly people in three major metropolitan areas and progress of aging society
・Increasing number of elderly people who live alone and patients with dementia
・Diversified investment mainly in three metropolitan areas・Property acquisition through ORE strategy (1)
・Use of sponsor and support companies’ support
Accommodations
・Foreign visitors to Japan continue to increase and spread into regional cities
・Concern about over-supply of hotels and the implementation of Minpaku (vacation rentals)
・Decline in cap rate
・Selective investment in properties which have steady demand・investment in properties which generated steady income by fixed rent
・Making use of sponsor’s pipeline
Use Target Ratio
ResidentialFacilities
60% and over
HealthcareFacilities
20% and lower
Accommodations 20% and lower
Other 10% and lower
Residential Facilities
84.1%
Healthcare Facilities
15.0%Other 0.9%
Ratio of Use after the Merger(as of March 1, 2018) Area Target Ratio
TokyoMetropolitan Area
50% and over
Tokyo Metropolitan Area
64.9%
Others 0.7%
Other Regional Areas
34.4%
Ratio of Area after the Merger(as of March 1, 2018)
Note 1: About “ORE strategy”, please read p.50 “Succession of Investment and Operation Strategy (ORE Strategy) about Healthcare Facilities”.

8
1. The Merger with JSL and Policies Going Forward
Residential Facilities G.K. Tropic II G.K. Tropic I
KDX Residence Asagaya KDX Residence Hiyoshi Serenite Kobe Motomachi KDX Residence Shukugawa Hills
Location Suginami-ku, Tokyo Yokohama-shi, Kanagawa Kobe-shi, Hyogo Nishinomiya-shi, HyogoProperty type Small family Family Studio FamilyLeasable units 44 units 92 units 138 units 238 unitsAppraisal value(1) ¥2.0 bln ¥2.5 bln ¥2.5 bln ¥7.3 blnAppraisal NOI cap rate (1) 4.4% 5.4% 5.0% 4.8%
Bridge Funds
G.K. KSLF8
Anesis Teradacho Rococo-riha Orage Suma Canadian Hill Anesis HyogoLocation Osaka-shi, Osaka Toyonaka-shi, Osaka Kobe-shi, Hyogo Kobe-shi, Hyogo Kobe-shi, Hyogo
Property type Intermediate nursing homes Intermediate nursing homes Intermediate nursing homes Intermediate nursing homes Intermediate nursing homes
Leasable units 250 (Fee-based homes for the elderly (with nursing care) :100) 100 135 (Serviced housing for the
elderly:35) 115 100
Appraisal value(1) ¥3.6 bln ¥2.1 bln ¥2.8 bln ¥1.8 bln ¥1.4 blnAppraisal NOI cap rate (1) 5.2% 5.2% 5.5% 5.0% 5.4%
Note 1: “Appraisal value” is described the appraisal value on June 30, 2017 for KDX Residence Shukugawa Hills, on July 1, 2017 for KDX Residence Asagaya, KDX Residence Hiyoshi and Serenite Kobe Motomachi and on March 1, 2018 for healthcarefacilities. “Appraisal NOI cap rate”=NOI described in Appraisal Report / Appraisal value
Note 2: Conditions for the purchase of each Bridge Funds are below.G.K. Tropic I and G.K. Tropic II: i) Date of acquisition is before the end of preferential negotiation term (February 28, 2019). ii) The desired price for purchase is reasonably anticipated to be a price that achieves the target internal rate of return (IRR)of the operator. G.K. KSLF8: i) Date of acquisition is before March 29, 2020. ii) Total of the desired price for purchase is over the lowest purchase price (¥11.65 bln) agreed with the operator.
Pipeline by Bridge Funds(2)
Number of Properties
9 props
Total Appraisal Value
¥26.4 bln
Average Appraisal NOI Cap Rate
5.1 %
Healthcare Facilities

9
1. The Merger with JSL and Policies Going Forward
Increasing Unitholders’ Value
30.4
193.1200
300
1st 2nd 3rd 4th 5th 6th 7th 8th 9th 10th11th12th13th
Increase in Asset Size
Total of acquired price (¥ bln)( Residential Healthcare Other )
Jul.2012(1st)
Mar.2018
(After the Merger)
Former Target
New Target
Increase in Market Capitalization
Market cap
¥100.7 bln
Market cap
¥11.6 bln
Market cap
¥120.4bln(based on floating investment unit
¥118.1 bln)
(Reference) FTSE EPRA/NAREIT Global Real Estate Index including standard(2)
Market cap (based floating investment unit) about ¥127.1 bln
Asset size¥200 bln
Former Target
Market cap¥120 bln
FormerTarget
As of concluding merger agreement
(November 10, 2017)
As of merger taking effect(1)
(March 1, 2018)
Aim to ¥300 bln in mid-termby selective investment and replacing assets
NewTarget
Aim to include in Global index(FTSE EPRA/NAREIT Global Real Estate Index Series )
NewTarget
Note 1: Market cap based on floating investment unit is multiplying 768,308 units (total number of investment units issuedfrom Kenedix Residential Next Investment Corporation (782,928 units) minus investment units held by the sponsor(14,620 units) ) and ¥153,800 of investment unit price as of March 1, 2018.
Note 2: KFM calculates it based on FTSE’s materials and 106.23¥/$ rate as of March 1, 2018. This including standard isestimated figure by KFM and KDR will not be definitely included this index if its market cap is larger than the standard.

10
1. The Merger with JSL and Policies Going Forward
3,016 3,116 3,123 3,115
3,180 3,266
3,316
3,473
¥3,570 ¥3,640
Increasing Unitholders’ Value
Maintain and Increase DPU
Jul. 2014(5th)
Jan. 2015(6th)
Jul. 2015(7th)
Jan. 2016(8th)
Jul. 2016(9th)
Jan. 2017(10th)
Jul. 2017(11th)
Jan. 2018(12th)
Jul. 2018(13th)
(Forecast)
Jan. 2019(14th)
(Forecast)
increase DPU by earnings by sales of
properties
DPU¥3,550
Former Target
Increase DPU by external growth, Internal growth and deducting financial costs, etc.Furthermore, KDR aims to increase DPU by earnings by sales of properties.
NewTarget
Former Target¥3,550
Increase DPU

11
1. The Merger with JSL and Policies Going Forward
Increasing Unitholders’ Value
Making Use of Negative Goodwill
Negative goodwill¥2.4 bln
RTA(Reserve for Temporary difference Adjustment)
¥1.7 bln
Distribution for period
ending Jul. 2018 ¥0.4 bln
Earnings surplus¥0.3 bln
Accumulation and Compensation(1)
① ②
¥17 mln and over is amortized compensation for distribution in every fiscal period after the fiscal period ending Jan. 2019 (DPU increase: ¥21)
Reasons- Maintain DPU ¥3,640- Avoid taxes by difference between
Japanese GAAP and Japanese tax law- Temporary costs and loss- Avoid dilution by PO, etc.
Additional compensation for shortage to ¥3,640
EPU
EPU
①Amortized compensation
of RTA
①Amortized compensation
of RTA
②Additional Compensation
Maintain DPU
Maintain DPU ¥3,640 and over after the fiscal period ending January 2019by using negative goodwill to maintain DPU
DistributionPolicy
①Amortized compensation of RTA ②Additional compensation
EPU(2)+RTA compensation≧¥3,640
EPU(2)+RTA compensation< ¥3,640
¥3,640
Note 1: “Negative goodwill” is estimated figure as of March 15, 2018 and it is possible for “Negative goodwill”, “Distribution for period ending Jul. 2018”, “RTA” and “Earnings surplus” to be changed.Note 2: Exclude the item which isn’t revenue on taxation.

2. Financial Results(Actual Results for 12th Period and Outlook for 13th and 14th Period)

13
2. Financial Results (Actual Results for 12th Period and Outlook for 13th and 14th Period)
Income Statements for the Period Ended January 2018 (12th Fiscal Period)
1H 2017 2H 2017
(in millions of yen) Actual Forecast(1) Actual Period on Period Actual vs Forecast
Rent revenue –real estate 5,102 5,207 5,235 133 2.6% 28 0.5%
Other leasebusiness revenue 472 406 435 -36 -7.8% 28 7.1%
dividends received - 9 10 10 - 1 11.5%
Operating revenues 5,574 5,623 5,681 106 1.9% 57 1.0%
Expenses related to rent business
(ex. Depreciation)1,239 1,169 1,185 -54 -4.4% 16 1.4%
NOI 4,335 4,445 4,486 150 3.5% 40 0.9%
Depreciation 884 922 921 37 4.2% 0 0.0%
Other operatingexpenses 617 691 684 67 10.9% -7 -1.0%
Operating income 2,833 2,840 2,889 56 2.0% 49 1.7%
Non-operatingincome 0 0 0 - - - -
Non-operatingexpenses 517 537 537 19 3.8% 0 -
Ordinary income 2,316 2,304 2,353 36 1.6% 48 2.1%
Net income 2,315 2,303 2,352 37 1.6% 49 2.1%
Earnings surplusCompensation 0 70 72 72 - 1 2.3%
Dividends 2,315 2,373 2,424 109 4.7% 50 2.1%
Distribution per Unit 6,633 yen 6,800 yen 6,946 yen 313 yen 4.7% 146 yen 2.1%
Costs related to the Merger +67
Increase debt cost by new borrowings, etc. +25Decrease in deferring amortization of investment unit issuance costs -6
Increase due to new acquisition of properties +124
Increase due to good operation of other properties +8
Decrease leasing related fees, etc. in Off-peak season -50
Increase temporary revenue, etc. +10
Decrease temporary revenue, etc. in off-peak season -29
Increase by higher occupancy rates(Forecast:96.4%⇒Actual:96.7%) +28
Note 1: Earning forecasts in January 31, 2018 are figures after revision released “Notice Concerning Revisions of Earnings Forecasts for the Fiscal Period Ending January 31, 2018” on November 10, 2017.
Compensation of internal reserve as costs related to the Merger +72
Frontloaded repairment +28

14
2. Financial Results (Actual Results for 12th Period and Outlook for 13th and 14th Period)
6,800
6,946
6,400
6,600
6,800
7,000
7,200
6,633
6,946
6,400
6,600
6,800
7,000
7,200
DPU in 12th Period
DPU Breakdown (Period on period)Rental Operations Others
1H 2017 2H 2017
DPU Breakdown (Actual vs Forecast)
(yen)
Rental Operations Others(yen)
2H 2017(Actual)
2H 2017(Forecast)
+29
Good operation of
existing properties
+96 +207
Compensation of internal reserve as
costs related to the Merger
-55-193
Costs related to the Merger
Good operation of
existing properties
+117
Non-operating
income and expense, etc.
Dividend from bridge funds
Increase due to new acquisition
of properties
+229
+21
Decrease other
operating expenses
+3
Dividend from bridge funds
+5
Increase compensation
of internal reserve
賃貸事業

15
2. Financial Results (Actual Results for 12th Period and Outlook for 13th and 14th Period)
Outlook for the Period Ending July 2018 (13th Fiscal Period) 1/2
2H 2017 1H 2018
(in millions of yen) Actual Forecast Period on Period
ResidentialFacilities
Rent revenue –real estate 5,235 5,284 49 0.9%
Other leasebusiness revenue 435 463 27 6.3%
Expenses related to rent business
(ex. Depreciation)1,185 1,275 90 7.6%
NOI 4,486 4,472 -13 -0.3%
Depreciation 921 927 5 0.6%
Rental income of real estate 3,564 3,544 -19 -0.6%
Healthcare
Facilities
Rent revenue –real estate - 816 816 100.0%
Other leasebusiness revenue - 1 1 100.0%
Expenses related to rent business
(ex. Depreciation)- 131 131 100.0%
NOI - 686 686 100.0%
Depreciation - 215 215 100.0%
Rental income ofreal estate - 471 471 100.0%
Increase by step-up rent in KDX Residence Toyosu +78Decrease due to increase of turnover rate in peak season(Actual in 12th:96.7%⇒Forecast:96.3%) -30
Increase leasing related fees, etc. in peak season +62Imposition fixed property tax, etc. of properties acquired in 12th Fiscal period +16
Increase temporary revenue, etc. in peak season +26
Started operation from March 1, 2018 by the Merger
Rental Income of Real Estate by Use(1)
Note 1: The figures of “Residential Facilities” include “Other” (Land).

16
2. Financial Results (Actual Results for 12th Period and Outlook for 13th and 14th Period)
Outlook for the Period Ending July 2018 (13th Fiscal Period) 2/2
2H 2017 1H 2018
(in millions of yen) Actual Forecast Period on PeriodRent revenue –real estate 5,235 6,101 865 16.5%
Other leasebusiness revenue 435 464 29 6.7%
dividends received 10 27 17 173.9%
Operating revenues 5,681 6,593 912 16.1%Expenses related to rent business
(ex. Depreciation)1,185 1,406 221 18.7%
NOI 4,486 5,158 672 15.0%
Depreciation 921 1,143 221 24.0%Costs related to the Merger 67 398 331 491.4%Other operating expenses 616 704 87 14.2%
Operating income 2,889 2,940 50 1.7%Non-operatingincome 0 10 10 -
Non-operatingexpenses 537 557 20 3.8%
Ordinary income 2,353 2,393 40 1.7%
Negative goodwill - 2,410 2,410 -
Net income 2,352 4,802 2,450 104.2%RTA compensation(Accumulation) - (1,700)
Earnings surplusCompensation
(Accumulation)72 (307)
Dividends 2,424 2,795 370 15.3%
Distribution per Unit (1) 3,473 yen 3,570 yen 97 yen 2.8%
Debt cost of succeeded borrowings, etc. by the Merger +47
Completion in deferring investment unit issuance costs -19Decrease debt cost of existing borrowings by decrease of the operating days -7
Note 1: DPU of the period ended January 2018 is considered of the investment unit split.
Internal accumulation of part of negative goodwill (¥297 mln) and compensation of succession of interest rate swap by the Merger (¥10 mln)
Compensation by the succession of interest rate swaps by the Merger +10
616
704
658
600
650
700
750
Increase AM fees by acquisition of properties in 12th
fiscal period
+12
2H 2017Actual
Other operating expenses breakdown
1H 2018Forecast
(in millions of yen)
Costs of appraisal, etc. by increase number of operating properties
+15Increase
professional fees and
administrative service fees
+8 Increase consumption
tax
+7
+16
+30
Temporary matters by the Merger
+46

17
2. Financial Results (Actual Results for 12th Period and Outlook for 13th and 14th Period)
Outlook for the Period Ending January 2019 (14th Fiscal Period) 1/2
1H 2018 2H 2018
(in millions of yen) Forecast Forecast Period on Period
ResidentialFacilities
Rent revenue –real estate 5,284 5,323 38 0.7%
Other leasebusiness revenue 463 425 -37 -8.1%
Expenses related to rent business
(ex. Depreciation)1,275 1,245 -30 -2.4%
NOI 4,472 4,503 31 0.7%
Depreciation 927 929 2 0.2%
Rental income of real estate 3,544 3,573 29 0.8%
Healthcare
Facilities
Rent revenue –real estate 816 979 163 20.0%
Other leasebusiness revenue 1 0 0 -61.1%
Expenses related to rent business
(ex. Depreciation)131 131 0 0.1%
NOI 686 849 162 23.6%
Depreciation 215 259 43 20.4%
Rental income ofreal estate 471 589 118 25.1%
Decrease temporary revenue, etc. in off-peak season -30
Increase by step-up rent in KDX Residence Toyosu going up to long-term level +19
Increase in other properties +18
Increase by one month longer operating term +163
Increase by one month longer operating term +43
Decrease leasing related fees in off-peak season -31
Increase operation costs and land costs, etc. by one month longer operating term +2
Decrease repairment costs -2
Rental Income of Real Estate by Use(1)
Note 1: The figures of “Residential Facilities” include “Other” (Land).

18
2. Financial Results (Actual Results for 12th Period and Outlook for 13th and 14th Period)
1H 2018 2H 2018
(in millions of yen) Forecast Forecast Period on PeriodRent revenue –real estate 6,101 6,303 202 3.3%
Other leasebusiness revenue 464 426 -38 -8.3%
dividends received 27 8 -18 -68.1%
Operating revenues 6,593 6,738 144 2.2%Expenses related to rent business
(ex. Depreciation)1,406 1,376 -30 -2.1%
NOI 5,158 5,352 193 3.8%
Depreciation 1,143 1,188 45 4.0%Costs related to the Merger 398 - -398 -100%Other operating expenses 704 771 67 9.6%
Operating income 2,940 3,400 460 15.7%Non-operatingincome 10 11 0 5.3%
Non-operatingexpenses 557 567 10 1.8%
Ordinary income 2,393 2,844 451 18.8%
Negative goodwill 2,410 - -2,410 -100%
Net income 4,802 2,843 -1,959 -40.8%RTA compensation(Accumulation) (1,700) 17
Earnings surplusCompensation
(Accumulation)(307) (10)
Dividends 2,795 2,849 54 2.0%
Distribution per Unit 3,570 yen 3,640 yen 70 yen 2.0%
Outlook for the Period Ending January 2019 (14th Fiscal Period) 2/2
Increase debt cost of succeeded borrowings, etc. by the Merger +19
Refinancing about existing debt scheduled to be paid in August 2018 -15
Increase debt cost, etc. of existing borrowings by longer operating days +7
704
771
658
600
650
700
750
800
Increase AM fees by the
Merger
+81
1H 2018Actual
Other operating expenses breakdown
2H 2018Forecast
(in millions of yen)
Costs by acquiring
engineering report, etc.
+24Increase
professional fees and
administrative service fees
(excluded the Merger)
+2Increase
consumption tax (excluded the
Merger)
+6
+46
Temporary matters by the Merger

19
2. Financial Results (Actual Results for 12th Period and Outlook for 13th and 14th Period)
DPU Impact by the Merger
DPU Breakdown (12th Actual vs 14th Forecast)(1)
3,400
3,473
3,639 3,640
3,300
3,400
3,500
3,600
3,700Others
2H 2017(Forecast)
2H 2018(Forecast)
(yen)
+21
Amortized compensation
of RTA-24
+156
Increase by the Merger
Other costs
Increase due to good operation of existing
properties, etc.
+73
Rental Operations
2H 2017(Actual)
Increase operating revenue
+14
Decrease depreciation +59
Decrease AM fees +50
Others +47
Note 1: DPU of 2H 2017 (Forecast/Actual) is considered split of investment units.

3. Operational Status 〜Residential Facilities〜

21
3. Operational Status 〜Residential Facilities〜
13.4%
38.5%
49.3%
28.5%
40.4%
44.2%
58.1%
21.1%
6.5%
Portfolio
Portfolio Breakdown (as of January 31, 2018) (1)
Studio
39.8%
Small Family
40.6%
Family
19.6%
Under 10 yrs
24.9%
10-20 yrs
69.4%
Over 20 yrs5.7%
Average
11.5 yrs
10-20 years
Over 20 years
Under 10 years
Studio Small family Family
Room type
Property age (4)
Room type by property age
Rental Housing:
98.2%(111 props)
Company Rental Housing1.2%(2 props)
Use (3)
Rent Guarantee9.4%(4 props)
Serviced Apartment0.5%(1 prop)
Note 1: “Portfolio Breakdown” describes the ratio by acquisition price at the end of thefiscal period.
Note 2: “Tokyo Central 8 Wards” include Minato-ku, Shibuya-ku, Chuo-ku, Chiyoda-ku,Shinjuku-ku, Meguro-ku, Setagaya-ku and Shinagawa-ku.“Tokyo Metropolitan Area” includes Tokyo, Kanagawa, Saitama and Chiba.“Other Regional Areas” include government-designed municipalities and otherregional cities.
Note 3: “Rent guarantee” is contract with rent guarantee structure in part of wholeresidence. KDX Residence Kagurazaka Dori was changed its contract structure toPass-through type on February 5, 2018.
Note 4: “Property age” is calculated by the weighted average by the acquisition price ofthe periods from completion dates to January 31, 2018.
Tokyo Central8 Wards
40.1%
Tokyo23 Wards
22.8%
OtherRegional Areas
30.4%
Area (2)
TokyoMetropolitan Area
69.6%
OtherTokyo Metropolitan Area
6.7%

22
3. Operational Status 〜Residential Facilities〜
90.0%
92.5%
95.0%
97.5%
100.0%
90.0%
92.5%
95.0%
97.5%
100.0%
Occupancy Rates
Note 1: Occupancy Rates by Area include those from stores and offices. Occupancy Rates by Room Type are calculated for residential units of pass through contract (excluding contract for whole building).
Ave. of 2H 201695.7%
Average of period 10th Period (2H 2016) 11th Period (1H 2017) 12th Period (2H 2017)4th 5th 6th 7th 8th 9th Aug. Sep. Oct. Nov. Dec. Jan. Feb. Mar. Apr. May Jun. Jul. Aug. Sep. Oct. Nov. Dec. Jan.
Total 95.1 96.0 95.4 95.8 95.4 96.3 95.3 95.5 95.8 95.9 95.7 96.2 96.5 97.4 96.8 96.3 96.5 96.8 96.6 96.9 96.8 96.6 96.2 97.0Tokyo Metropolitan Area 94.6 95.9 95.1 95.8 96.0 96.7 95.6 95.7 95.8 96.3 96.3 96.7 97.1 97.8 97.4 97.1 97.5 97.7 97.6 97.9 97.6 97.3 97.0 98.0
Other Regional Areas 95.5 96.0 95.6 95.9 94.8 95.9 95.0 95.3 95.7 95.4 95.1 95.6 95.9 97.0 96.1 95.5 95.5 95.9 95.4 95.8 96.0 95.8 95.4 95.9
Ave. of 1H 201796.7%
Ave. of 2H 201796.7%
Average of period 10th Period (2H 2016) 11th Period (1H 2017) 12th Period (2H 2017)4th 5th 6th 7th 8th 9th Aug. Sep. Oct. Nov. Dec. Jan. Feb. Mar. Apr. May Jun. Jul. Aug. Sep. Oct. Nov. Dec. Jan.
Studio 95.5 97.2 96.3 96.7 95.4 96.3 94.8 94.6 94.9 94.6 94.8 95.6 96.0 97.8 97.1 96.6 96.9 97.6 97.5 97.6 97.0 96.5 96.6 96.7Small Family 95.4 95.8 94.6 94.5 94.7 95.8 94.8 95.1 95.0 95.6 95.3 96.1 96.6 96.8 95.9 95.6 95.3 95.4 95.1 95.8 95.8 95.5 95.1 96.0
Family 93.3 94.0 94.3 95.6 94.9 95.6 94.6 95.0 95.8 95.2 95.4 95.5 95.7 97.6 96.7 95.6 96.5 97.1 96.2 96.4 97.3 97.4 96.5 98.0
Occupancy Rates by Area(1)
Occupancy Rates by Room Type(1)
Acquisition of properties Sale of properties
6 23 1 2

23
3. Operational Status 〜Residential Facilities〜
-1.1% -1.1% -1.2%
-0.2%
0.9% 0.9%1.5% 1.3%
-0.5%-0.8%
-0.4%
-1.7%
-0.3%
-1.3%
0.4%-0.3%
-3.0%
0.0%
3.0%東京経済圏 地⽅経済圏 全体
New Tenant Trend
Note 1: “Turnover Rate”= Exiting tenants during the period / Rentable units at the End of Period. These figures are calculated for residential units of pass through contract (excluding contract for whole building).Note 2: “Percentage of Increase/Decline of rent of new tenants” = Total Amount of Increase/Decline of rent of new tenants / Total amount of rent before revisions.
1,018 8301,560
1,1491,628 1,427
2,181 1,530
-1,625 -1,500-2,463
-1,790-1,217 -1,355 -1,129 -924-607 -670 -903 -641
411 721,052 606
-3,000
-2,000
-1,000
0
1,000
2,000
3,000
Increase/Decline of monthly rent
Rent Increase/Decline
1H 2014 2H 2014 1H 2015 2H 2015 1H 2016 2H 2016 1H 2017 2H 2017
Percentage of Increase/Decline of rent of new tenants(2)
-0.9% -1.0% -0.9% -0.9% 0.5% 0.1% 1.1% 0.7%
(thousand yen)
Increase Decline Net
Average Downtime/Turnover Rate(1)
Increase/Decline of monthly rent by area
Average downtime
60days
67days
64days
64days
1H 2014 1H 2015 1H 2016 1H 2017
Turnover rate
13.7% 13.6% 13.5% 12.6%
Average downtime
81days
80days
80days
69days
2H 2014 2H 2015 2H 2016 2H 2017
Turnover rate
10.7% 9.8% 10.2% 10.7%
Peak season Off-peak season
1H 2014 2H 2014 1H 2015 2H 2015 1H 2016 2H 2016 1H 2017 2H 2017
Tokyo Metropolitan Area
OtherRegional Areas All Areas
34.8% 39.0% 43.0% 39.8%52.2% 48.2% 54.9% 52.0%
29.9% 23.2% 16.1% 16.0%
19.3% 20.1%20.0% 22.4%
35.3% 37.7% 40.9% 44.2%28.5% 31.7% 25.1% 25.6%
0%
25%
50%
75%
100%
Rent Increase/Decline (units)
Proportion of units
1H 2014 2H 2014 1H 2015 2H 2015 1H 2016 2H 2016 1H 2017 2H 2017
Increase Stay Decline

24
3. Operational Status 〜Residential Facilities〜
0.0%0.2%
0.0% 0.1%
0.3%0.4%
0.2% 0.2%
-0.1%0.1%
0.3% 0.2%
0.1% 0.0% 0.0% 0.0%
-1.0%
-0.5%
0.0%
0.5%
1.0%東京経済圏 地⽅経済圏 全体
Renewal Tenant Trend
131271
202279 278
204 142
-65 -105 -61-1 -34 -19
-65 131 166 141278 244 185 142
-500
-250
0
250
500
Note 1: “Renewal rate” = Renewal tenants during the period / Ending contracts during the period. These figures are calculated for residential units of pass through contract (excluding contract for whole building).Note 2: “Percentage of Increase/Decline of rent of renewal tenants” = Total Amount of Increase/Decline of rent of renewal tenants / Total amount of rent before revisions.
Increase/Decline of monthly rent
1H 2014 2H 2014 1H 2015 2H 2015 1H 2016 2H 2016 1H 2017 2H 2017
Percentage of Increase/Decline of rent of Renewal tenants(2)
-0.1% 0.2% 0.1% 0.1% 0.2% 0.2% 0.1% 0.1%
(thousand yen)
Renewal Rate(1) Rent Increase/Decline
Increase/Decline of monthly rent by area
Renewal rate
89.2% 87.8% 89.3% 88.8%
1H 2014 1H 2015 1H 2016 1H 2017
Renewal rate
90.4% 89.5% 89.6% 90.3%
2H 2014 2H 2015 2H 2016 2H 2017
Peak season Off-peak season
1H 2014 2H 2014 1H 2015 2H 2015 1H 2016 2H 2016 1H 2017 2H 2017
Increase Decline Net
Tokyo Metropolitan Area
OtherRegional Areas All Areas
5.6% 6.4% 6.3% 7.4% 8.8% 5.6% 4.6%
99.6% 94.4% 93.1% 93.1% 92.5% 90.8% 94.3% 95.4%
0.4% 0.6% 0.5% 0.1% 0.4% 0.1% 0.0%
0%
25%
50%
75%
100%
Rent Increase/Decline (units)
Proportion of units
1H 2014 2H 2014 1H 2015 2H 2015 1H 2016 2H 2016 1H 2017 2H 2017
Increase Stay Decline

25
3. Operational Status 〜Residential Facilities〜
Rent per Tsubo of Residential Unit
Note 1: Rent per Tsubo of Residential Unit by Area and Rent per Tsubo of Residential Unit by Room Type are calculated for residential units of pass through contract (excluding contract for whole building) of 103 properties operated from February 29,2016 to January 31, 2018. (1 Tsubo = 35.5832 sq. ft.)
7,000
8,000
9,000
10,000
11,000
12,000
13,000
7,000
8,000
9,000
10,000
11,000
12,000
13,000
Ave. of 2H 20169,864yen/tsubo
9th Period (1H 2016) 10th Period (2H 2016) 11th Period (1H 2017) 12th Period (2H 2017)Feb. Mar. Apr. May Jun. Jul. Aug. Sep. Oct. Nov. Dec. Jan. Feb. Mar. Apr. May Jun. Jul. Aug. Sep. Oct. Nov. Dec. Jan.
Total 9,819 9,830 9,835 9,844 9,860 9,856 9,851 9,848 9,856 9,879 9,878 9,874 9,873 9,859 9,874 9,882 9,885 9,875 9,898 9,895 9,895 9,889 9,889 9,894Tokyo Metropolitan Area 12,068 12,083 12,118 12,132 12,148 12,136 12,122 12,129 12,145 12,164 12,158 12,160 12,159 12,148 12,159 12,166 12,161 12,148 12,184 12,187 12,186 12,178 12,183 12,177
Other Regional Areas 7,517 7,527 7,538 7,540 7,538 7,530 7,530 7,527 7,530 7,531 7,531 7,525 7,524 7,521 7,537 7,536 7,534 7,537 7,541 7,537 7,541 7,538 7,534 7,536
Ave. of 1H 20179,875yen/tsubo
Ave. of 2H 20179,893yen/tsubo
9th Period (1H 2016) 10th Period (2H 2016) 11th Period (1H 2017) 12th Period (2H 2017)Feb. Mar. Apr. May Jun. Jul. Aug. Sep. Oct. Nov. Dec. Jan. Feb. Mar. Apr. May Jun. Jul. Aug. Sep. Oct. Nov. Dec. Jan.
Studio 11,376 11,395 11,414 11,418 11,420 11,420 11,403 11,401 11,420 11,432 11,434 11,430 11,430 11,440 11,423 11,429 11,434 11,435 11,433 11,442 11,442 11,432 11,429 11,435Small Family 9,666 9,681 9,689 9,674 9,694 9,692 9,685 9,687 9,703 9,735 9,734 9,725 9,730 9,714 9,745 9,751 9,754 9,746 9,775 9,768 9,779 9,776 9,773 9,784
Family 8,534 8,533 8,496 8,546 8,559 8,540 8,559 8,554 8,543 8,559 8,562 8,559 8,547 8,512 8,534 8,541 8,546 8,518 8,549 8,543 8,548 8,546 8,542 8,557
Rent per Tsubo of Residential Unit by Area(1)
Rent per Tsubo of Residential Unit by Type(1)
(yen/tsubo)
Ave. of 1H 20169,841yen/tsubo
(yen/tsubo)

26
3. Operational Status 〜Residential Facilities〜
Initiatives to Improve the Performance of Properties
Improving Revenue by Switch to the Master Lease Agreement with Pass Through Structure
Large Renovations and Value-ups
The contract period of fixed-term lease agreements expired and KDRswitched to the master lease agreement with pass through structure in KDXResidence Kagurazaka Dori (Former: Bureau Kagurazaka).
KDR efforts to maintain and improve property competitiveness throughvalue-ups matched each property’s status.
Take Value-up around the entrance and change itsname to “KDX Residence Kagurazaka Dori”
Large renovations(KDX Residence Nihombashi Hakozaki,Hanzomon and Nishijin)
Value-ups in entrance(KDX Residence Togoshi, etc.)
Changing long sheet for hallway(KDX Residence Monzennakachoand Moto-asakusa)
Change non-use water panel in entrance lobby to common space making use ofatrium for a better image of the property
Value-up
February 2015 Start to operate with ML agreement with fixed renttargeted to switch all rooms for public because there arerooms for public and serviced apartments in the facility
April 2016 Complete switching all rooms for public
February 2018 Expired contract period of fixed-term lease agreements andswitched to ML agreement with pass through structure
Increase NOI cap rate by pass through structure
4.6%(12th Actual)
6.1%(13th Forecast)
Waterproofing of rooftop in KDX ResidenceNihombashi Hakozaki

27
3. Operational Status 〜Residential Facilities〜
Properties with excellent environmental & social awareness
Initiatives for Sustainability
DBJ Green Building Certification(1) GRESB Real Estate Assessment
Note 1: “DBJ Green Building Certification” is a system established by Development Bank of Japan in April 2011 to support real estate that meets environmental and social conditions.Note 2: “114 certificatable properties” are properties operated on January 31, 2018 excluded land.Note 3: “Annual reduction” is calculated based on the presentation materials from construction company as of exchanging construction.
Newly acquired certification for KDX Residence Toyosu5 properties in 114 certificatable properties(2) are certificated.
KDX Residence YotsuyaKDX Residence Ebisu
KDX Residence Hanzomon
The Investment Corporation participates in GRESB Real Estate Assessmentfrom 2016.
GRESB (Global Real Estate Sustainability Benchmark) is a benchmark to evaluatesustainability performance of private and listed real estate portfolio, etc. fromenvironmental and social perspectives.
Ashiya Royal Homes
KDX Residence Toyosu
Others
January 2018 New
Remote Surveillance of Road HeatingInstallation of Disaster Prevention Set
LED Lights in Common Areas(3)
1H 2015 2H 20151H 2016
2H 20161H 2017 2H 2017 Total
Property (props) 4 8 14 6 32
Expense (mln yen) 9.3 21.2 22.4 6.3 59.3
Annual reduction (mln yen) 0.9 7.0 7.7 1.6 17.3
3 props107 propsInstallation of disaster prevention set toprepare for the time of disasters for tenants
The installation of remote surveillancesystems for road heating at three propertiescut the cost of fuel needed to melt snow.
Properties certificated DBJ Green Building
4. Operational Status 〜Healthcare Facilities〜

29
4. Operational Status 〜Healthcare Facilities〜
30 27
43
25 28 36
-26
-16
-27 -30 -26 -27
4 11
16
-5 2
9
-40
-20
0
20
40
60
Operational Status of Healthcare Facilities
Actual Occupancy Rate and Sales(1,5) Status of Replacement and Turnover(1)
518 520 519 517 518 536
86.2 86.9 87.8 87.4 87.5 87.9
0
200
400
600
60.0
70.0
80.0
90.0(%)
Jul. 31 Aug. 31 Sep. 30 Oct. 31 Nov. 30 Dec. 312017
Occupancy rate Sales
Average Nursing Care Level(4)
1.7(-)
Jul. 31 Aug. 31 Sep. 30 Oct. 31 Nov. 30 Dec. 312017
Replacement Turnover net
Note 1: “Actual Occupancy Rate (based on end-tenants)”, “Sales”, “Replacement” and “Turnover” are figures based on documents from operators but “Sales” is the total sales of portfolio excluding “Granda Mondo Yakujin”.Note 2: “Average of Actual Occupancy Rate ‘(based on end-tenants)” is average from July 2017 to December 2017 and the figure in brackets is difference the term from January 2017 to June 2017 and the term from July 2017 to December 2017.Note 3: “Replacement Rate” and “Turnover Rate” are the figures that the total people of “Replacement” or “Turnover” from July 2017 to December 2017 divided by capacity and the figures in brackets is difference the term from January 2017 to June 2017
and the term from July 2017 to December 2017.Note 4: “Average Age” and “Average Nursing Care Level” are figures as of December 31, 2017 and the figures in brackets is difference as of June 30, 2017 and as of December 31, 2017. “Average Nursing Care Level” is calculated excluding “Granda Mondo
Yakujin”.Note 5: “Actual Occupancy Rate (based on end-tenants)” = Number of residents / number of rooms.
(People)
Highlights of Operational Status (from July 2017 to December 2017) (1)
Average Age(4)
85.6 yrs(-)
Turnover Rate(3)
8.5%(+0.5%)
Replacement Rate(3)
10.5%(+4.0%)
Average of Actual Occupancy Rate(2)
87.3%(+1.3%)
(¥ mln)

30
4. Operational Status 〜Healthcare Facilities〜
Portfolio Succeeded from JSL
No. Name AcquisitionPrice Location Facility Type Property
Age Rooms Capacity LeasableArea
Actual Occupancy Rate(1)
①(Jun. 2017) ②(Dec. 2017) ②-①(¥ mln) (yrs) (rooms) (people) (m2) (%) (%) (%)
Healthcare
Facilities
H-1 Irise Kamata/Yuseien 1,120 Ota-ku, Tokyo Fee-based homes for the elderly (with nursing care) 10.7 48 55 2,086.40 93.8 100.0 +6.3H-2 Nichii Home Nakano Minamidai 1,780 Nakano-ku, Tokyo Fee-based homes for the elderly (with nursing care) 25.7 83 83 3,339.00 67.5 79.5 +12.0H-3 Joy Stage Hachioji 3,690 Hachioji-shi, Tokyo Fee-based homes for the elderly (with nursing care) 22.3 232 263 13,812.27 88.4 90.1 +1.7H-4 Yuimaru Hijirigaoka 1,120 Tama-shi, Tokyo Fee-based homes for the elderly (residential) 6.3 70 109 4,385.53 100.0 100.0 -H-5 Nichii Home Tama Plaza 2,940 Kawasaki-shi, Kanagawa Fee-based homes for the elderly (with nursing care) 26.0 160 164 8,208.65 75.0 68.1 -6.9H-6 Ten 2,630 Sapporo-shi, Hokkaido Fee-based homes for the elderly (with nursing care) 10.5 85 89 6,473.60 89.4 84.7 -4.7H-7 Irise Nishioka 858 Sapporo-shi, Hokkaido Fee-based homes for the elderly (residential) 3.8 83 83 3,140.27 86.7 96.4 +9.6
H-8 Alpha Eniwa Sta. Nishiguchi SaikaihatsuBuilding 1,660 Eniwa-shi, Hokkaido Fee-based homes for the elderly (residential) 3.1 73 73 5,343.33 76.7 86.3 +9.6
H-9 Sawayaka Sakura Nibankan 989 Akita-shi, Akita Fee-based homes for the elderly (with nursing care) 6.4 92 92 3,628.51 100.0 100.0 -H-10 Active Biwa 6,560 Otsu-shi, Shiga Fee-based homes for the elderly (with nursing care) 30.6 384 445 39,649.84 78.1 79.4 +1.3H-11 Sompo Care LAVIERE Kobe Tarumi 2,110 Kobe-shi, Hyogo Fee-based homes for the elderly (with nursing care) 8.0 100 100 4,493.35 88.0 97.0 +9.0H-12 Granda Mondo Yakujin 1,190 Nishinomiya-shi, Hyogo Fee-based homes for the elderly (residential) 3.6 62 63 3,287.80 - - -H-13 Excellent Nishinomiya 971 Nishinomiya-shi, Hyogo Fee-based homes for the elderly (with nursing care) 8.1 67 70 2,685.48 100.0 100.0 -H-14 Gran Hills Ogawarako 1,380 Kamikita-gun, Aomori Serviced housing for the elderly 10.9 103 107 4,180.28 100.0 100.0 -
Total/Average 28,998 17.6 1,642 1,796 104,714.31 86.0 87.9 +1.9
Portfolio Breakdown (March 1, 2018)(2)
Tokyo Metropolitan Area
36.7%
Greater Osaka Area
37.4%
Area(3)
Serviced housing for the elderly
4.8% (1 prop)
Use
Fee-based homes for the elderly (with nursing care)
78.6%(9 props)
Others4.8%
Fee-based homes for the elderly (residential)
16.7% (4 props)
Under 10 yrs
30.7%
10-20 yrs
17.7%
Average
17.6 yrs
Property age(4)
Over 20 yrs
51.6%
Note 1: “Actual Occupancy Rate (based on end-tenants)” =Number of residents / number of rooms. “ActualOccupancy Rate” is based on documents fromoperators but that of “Granda Mondo Yakujin” isn’tdisclosed because KDR isn’t admitted to disclose fromthe operator. If “Actual Occupancy Rate” is over100.0% by calculation, it is written as 100.0%.
Note 2: “Portfolio Breakdown” describes the ratio byacquisition price at March 1, 2018. Acquisition price isthe price of succeeding price by KDR and is appraisalvalue as of March 1, 2018.
Note 3: “Tokyo Metropolitan Area” includes Tokyo, Kanagawa,Saitama and Chiba.“Greater Osaka Area” includes Osaka, Kyoto, Nara,Hyogo and Shiga.“Three Major metropolitan Areas” include “TokyoMetropolitan Area”, “Greater Osaka Area” and“Greater Nagoya Area.”“Other Regional Areas” include g other regional citiesexcluding “Three Major metropolitan Areas”.
Note 4: “Property age” is calculated by the weighted averageby the acquisition price of the periods fromcompletion dates to March 1, 2018.
Other Regional Area
21.2%
Three Major Metropolitan Areas
74.1%

31
4. Operational Status 〜Healthcare Facilities〜
Family room (New)2F Hall Dining
Common space in hallwayEntrance Lounge
Initiatives to Improve the Performance of Properties
Value-ups
Contract Term Until July 31, 2022 Until July 31, 2032
Now After Changing
Increase rent+
Unable to rent revision until Aug. 31, 2027Rent
+10yrs
Value-up renovation for strengthen competitiveness of the facilities Agreement to length the contract term and increase in rent with the operator
Revision of Contract Conditions with Value-up Renovation
Note 1: “Investment efficiency”= Increase price of annual cash flow / costs of value-ups
Revision by 3 years
Value-up renovation in common area (Nichii Home Tama Plaza)
Renovation in Car park (Irise Nishioka)
Expansion car park by development part of land for improvement of convenience in the facility
Agreement to increase rent with the operator
NOI
4.9%UP
Investment efficiency
5.5%(1)
NOI
0.8%UP
Investmentefficiency
10.4%(1)

32
4. Operational Status 〜Healthcare Facilities〜
22.6%
16.3%
12.7%12.5%
9.1%
7.3%
4.8%4.1%
3.9%3.4%3.3%
Status of Lease Agreements
No. Name Operator(1,2) Facility Type Effective Date of Agreements
End of Prohibited
Cancellation
TerminationDate of
Agreements
RemainingTerm(3) Revision Period Date of Next
Revision
(yrs)
Healthcare
Facilities
H-1 Irise Kamata/Yuseien HITOWA Care Service Co., Ltd. (4) 2012/7/1 - 2042/6/30 24.3 Each 5 years 2022/7/1
H-2 Nichii Home Nakano Minamidai Nichii Carepalace Company 2007/4/1 2027/3/31 2027/3/31 9.1 Each 3 years 2019/4/1
H-3 Joy Stage Hachioji NM LIFE Co., Ltd. 2014/7/31 2026/1/31 2036/1/31 17.9 Not allowed (5) -
H-4 Yuimaru Hijirigaoka Community Net Inc. 2014/12/17 2022/12/16 2064/12/16 46.8 Not allowed (6) -
H-5 Nichii Home Tama Plaza Nichii Carepalace Company 2002/8/1 2027/8/31 2032/7/31 14.4 Not allowed (7) 2027/9/1
H-6 Ten NOTE Social Welfare Corporation 2007/9/15 2023/2/26 2038/2/26 20.0 Not allowed (6) -
H-7 Irise Nishioka HITOWA Care Service Co., Ltd. (4) 2014/6/1 2027/3/31 2044/5/31 26.3 Not allowed (5) -
H-8 Alpha Eniwa Sta. NishiguchiSaikaihatsu Building HITOWA Care Service Co., Ltd. (4) 2015/3/15 2023/3/31 2045/3/31 27.1 Not allowed (5) -
H-9 Sawayaka Sakura Nibankan Sawayaka Club Co., Ltd. 2013/3/27 2023/3/27 2033/3/27 15.1 Not allowed (5) -
H-10 Active Biwa Activa Co., Ltd. 2007/8/31 2017/8/31 2027/8/30 9.5 Each 3 years 2021/8/31(注11)
H-11 Sompo Care LAVIERE Kobe Tarumi Sompo Care Next Inc. 2010/5/13 2028/5/31 2030/5/31 12.3 Not allowed (9) -
H-12 Granda Mondo Yakujin Benesse Style Care Co., Ltd. 2014/7/31 2037/7/30 2037/7/30 19.4 Not allowed (9) -
H-13 Excellent Nishinomiya Excellent Care System Co., Ltd. 2014/10/8 2022/10/7 2034/10/7 16.6 Not allowed (6) -
H-14 Gran Hills Ogawarako Silver Town Ltd. 2007/4/27 2024/5/31 2029/10/31 11.7 Each 3 years (10) 2020/11/12
Average 16.7
Note 4: Company name was changed to HITOWA Care Service Co., Ltd as of November 1, 2017.Note 5: As a rule, no revision is allowed in term of agreements. Discussion is allowed about increase in rent by inflation and
rising interest rates.Note 6: As a rule, no revision is allowed in term of agreements. Discussion is allowed by each three years in the case
conditions are highly unreasonable because of the changes of economic climate but if the discussion is failed,tenants are needed to pay current rent.
Note 7: As a rule, no revision is allowed by August 31, 2027.Note 8: Contents of lease agreements about “Irise Eniwa” occupying from 4F to 6F of “Alpha Eniwa Sta. Nishiguchi
Saikaihatsu Building”.Note 9: As a rule, no revision is allowed in term of agreements. Discussion is allowed in the case conditions are highly
unreasonable because of the changes of economic climate.Note 10: Requests of rent reduction aren’t allowed except the case that the facility has defects or is unable to be used.Note 11: KDR has agreed it with Activa Co., Ltd. that it won’t request rent reduction and the revised rent will be at the same or
higher than current one on the date of rent revision, August 31, 2018 in the contraction of changing lease agreementon April 1, 2017.
Note 12: “Operator” and “Remaining Term” are the ratios of the acquisition price on March 1, 2018.
2018 2019 2020 2021 2022Jan.
(12th)Jul.
(13th)Jan.
(14th)Jul.
(15th)Jan.
(16th)Jul.
(17th)Jan.
(18th)Jul.
(19th)Jan.
(20th)Jul.
(21st)
Revision Period
Activa BiwaGran Hills Ogawarako Irise Kamata/Yuseien
Operator (12)
Activa
Nichii Carepalace
NM LIFEHITOWA Care Service (4)
Sompo Care Next
NOTE Social Welfare
Silver Town
Benesse Style Care
Community Net
Sawayaka Club
Excellent Care System
Remaining Term (12)
Average Remaining Term
16.7 yrs
5-10 yrs
28.8%Over 20 yrs
25.5%
10-20 yrs
45.8%
Nursing Care
Residential
Serviced
Nichii Home Nakano Minamidai
Nursing Care
Nursing Care
Nursing Care
Nursing Care
Residential
Residential
Nursing Care
Nursing Care
Nursing Care
Residential
Nursing Care
Note 1: In the case there are multiple tenants in each facility, status is referred based on lease agreements with operatorswhich are main tenants.
Note 2: Types of lease agreements are all ordinary lease agreements excluding “Gran Hills Ogawarako”. The type of leaseagreement of “Gran Hills Ogawarako” is a fixed-term lease agreement.
Note 3: “Remaining Term” is calculated from March 1, 2018 to the termination date of agreements with operators.

33
memo

5. Finance

35
5. Finance
4.35.1 4.6 5.2 4.7
1.25%1.19% 1.19%
1.10%1.08%
0.0
2.0
4.0
6.0
8.0
10.0
0.60%
0.80%
1.00%
1.20%
1.40%
Debt Indicators of ExistingLoans from JSL (¥15 bln)
Finance 1/2
(yrs)
Key Debt Indicators (1)Average interest rate Average remaining term (RHS)
Jul. 31, 2016(9th period)
Jan. 31, 2017(10th period)
Jul. 31, 2017(11th period)
Jan. 31, 2018(12th period)
Mar. 1, 2018(After the Merger)
(Forecast)
Rate of fixed-interest
95.2%
Jul. 31, 2014
Jan. 31, 2015
Jul. 31 Jan. 31, 2016
Jul. 31 Jan. 31, 2017
Jul. 31 Jan. 31, 2018
Mar. 1, 2018
(After the Merger)
(Forecast)
LTV (based on total assets)(3)
LTV Appraisal LTV
LTV target:50〜55%
Credit Rating
Note 1: “Average interest rate” calculated by weighted average interest rate at the end of the period and March 1, 2018that took into consideration up-front fee (per year) and the effect of the interest rate swap. “Average remainingterm” calculated by weighted average remaining term of interest-bearing liabilities at the end of the period andMarch 1, 2018. “Rate of fixed-interest” calculated the percentage of fixed interest rate loans of total amount ofloans at the end of the period. The floating loans which are substantially fixed with interest rate swap areincluded in the fixed-rate.
Note 2: “Average interest rate” of existing loan from JSL calculated by weighted average interest that took intoconsideration up-front fee (per year) and the effect of the interest rate swap as of January 31, 2018.
Note 3: “LTV” = Interest-bearing Liabilities / Total Assets. “Appraisal LTV” = Interest-bearing Liabilities / Total AppraisalValue. “LTV” as of end of March 1, 2018 is current forecasts.
Lender Amount(¥mln) Ratio
■ Sumitomo Mitsui Banking Corporation 31,230 29.4%
■ The Bank of Tokyo-Mitsubishi UFJ, Ltd. 19,300 18.2%
■ Aozora Bank, Ltd. 9,650 9.1%■ Mizuho Bank, Ltd. 7,650 7.2%■ Resona Bank, Ltd. 7,600 7.2%■ Development Bank of Japan Inc. 7,500 7.1%■ Shinsei Bank, Ltd. 5,350 5.0%
■ Sumitomo Mitsui Trust Bank, Limited. 4,450 4.2%
■ Mizuho Trust & Banking Co., Ltd. 4,400 4.1%
■ Mitsubishi UFJ Trust and Banking Corporation 4,000 3.8%
■ Sompo Japan Nipponkoa Insurance Inc. 1,000 0.9%
■ THE BANK OF FUKUOKA, LTD. 500 0.5%■ Nippon Life Insurance Company 500 0.5%■ Investment Corporation Bonds 3,000 2.8%
106,130
Status of Interest-bearing Liabilities (as of March 1, 2018)
Total amount
¥106.1 blnNumber of Lenders
13
29.4%
18.2%9.1%
3.8%
4.2%
7.1%
2.8%
4.1%
A+(Japan Credit Rating Agency, Ltd. (JCR))
7.2%
7.2%
5.0%
Average Interest Rate (2) 0.92%
Average Remaining Term 2.4 yrs
52.0%53.7%
46.3% 46.7% 46.8%
48.9% 48.9%
51.5%50.1%
47.4%
45.0%
50.0%
55.0%
60.0%

36
5. Finance
Finance 2/2
Repayment Terms
Note 1: “Average interest rate” calculated by weighted average interest rate at the end of the period that took into consideration up-front fee (per year) and the effect of the interest rate swap.
Latest New Loans and Refinance (12th)
Classification Amount Term Interest rate(1)
New (Short) ¥1.6 bln 1.0 yr 0.46%
Refinance ¥11.0 bln 6.8 yrs 0.79%
New (Long) ¥7.7 bln 8.3 yrs 0.96%
Initial Loan Condition of Interest-bearing Debt Repayment Date from Now on
Repayment Amount Term Interest rate(1)
Jul. 31, 2018 ¥7.1 bln 2.0 yrs 0.51%
Jan. 31, 2019 ¥11.0 bln 5.1 yrs 1.36%
Jul. 31, 2019 ¥1.5 bln 1.5 yrs 0.48%
Jan. 31, 2020 ¥1.5 bln 5.0 yrs 0.89%
Jul. 31, 2020 ¥6.0 bln 5.0 yrs 0.88%
11,000
1,630
1,500
6,200 3,000 3,500
1,000 1,500
2,000
4,500
6,000
4,500
11,000
0
2,000
4,000
6,000
8,000
10,000
12,000
14,000(¥ mln)
Jan.2018
Jul. Jan.2019
Jul. Jan.2020
Jul. Jan.2021
Jul. Jan.2022
Jul. Jan.2023
Jul. Jan.2024
Jul. Jan.2025
Jul. Jan.2026
Jul. Jan.2027
Jul. Jan.2028
Jul. Jan.2029
1.5 y
10 y1.0 y
5.5 y 6.5 y 7.0 y 7.5 y 8.5 y
Repayment in Aug. 2018
Refinance New loans Existing loans from JSL Investment Corporation Debt Other existing loans

37
5. Finance
12.8% 11.0% 11.8% 10.0%
60.2% 63.4% 63.3% 70.1%
21.3% 21.0% 20.4% 15.7%4.4% 4.3% 3.9% 3.7%1.4% 0.4% 0.5% 0.4%
0%
25%
50%
75%
100%
第9期末 第10期末 第11期末 第12期末Jul. 31, 2016(9th period)
Jan. 31, 2017(10th period)
Jul. 31, 2017(11th period)
Jan. 31, 2018(12th period)
0
5,000
10,000
15,000
個⼈・その他
57
142 132
13 0
50
100
150
200
Name Units Ratio(1)
Periodon
Period1 Japan Trustee Services Bank, Ltd. (Trust Acct.) 108,149 31.0% -1.0%2 The Master Trust Bank of Japan Ltd. (Trust Acct.) 65,555 18.8% 10.4%3 NOMURA BANK (LUXEMBOURG) S.A. 15,211 4.4% -3.5%
4 Trust and Custody Services Bank, Ltd. (Securities Investment Trust Acct.) 14,959 4.3% -3.5%
5 The Nomura Trust Banking Co., Ltd. (Trust Acct.) 12,885 3.7% -0.3%6 Mizuho Trust & Banking Co., Ltd. 8,616 2.5% 0.1%7 Kenedix, Inc. 7,310 2.1% -8 Mitsubishi UFJ Trust and Banking Corporation 7,281 2.1% 0.4%9 STATE STREET BANK AND TRUST COMPANY 505012 6,046 1.7% 0.1%10 The Gunma Bank, Ltd. 5,877 1.7% -
Total 251,889 72.1% 3.0%
Individuals Institutional investors
Composition of Unitholders (based on number of units) Major Unitholders (as of January 31, 2018)
Security firmsOther domesticcompaniesForeign companies and individualsFinancial institutions
Individuals and others
8,122
Number of Unitholders (last 4 fiscal periods)
Financialinstitutions
Foreigncompanies
and individuals
Otherdomestic
companies
Securityfirms
Individualsand others
Division of Investment Units and Unitholders’ Equity after the Merger
as of January 31, 2018(12th Period)
as of March 2018(after Division of
Investment Units and the Merger)
Unitholders equity
Unitholders capital 80,132 million yen 80,132 million yen
Retained earnings - 13,187 million yen
Total number of investment units authorized 5,000,000 units 10,000,000 units
Total number of investment units issued and outstanding 349,089 units 782,928 units
Unitholders
Note 1: Ratio means the percentage for total units owned to total units issued. (Rounded down to the nearest threedecimal places)

Appendices
39
Appendices
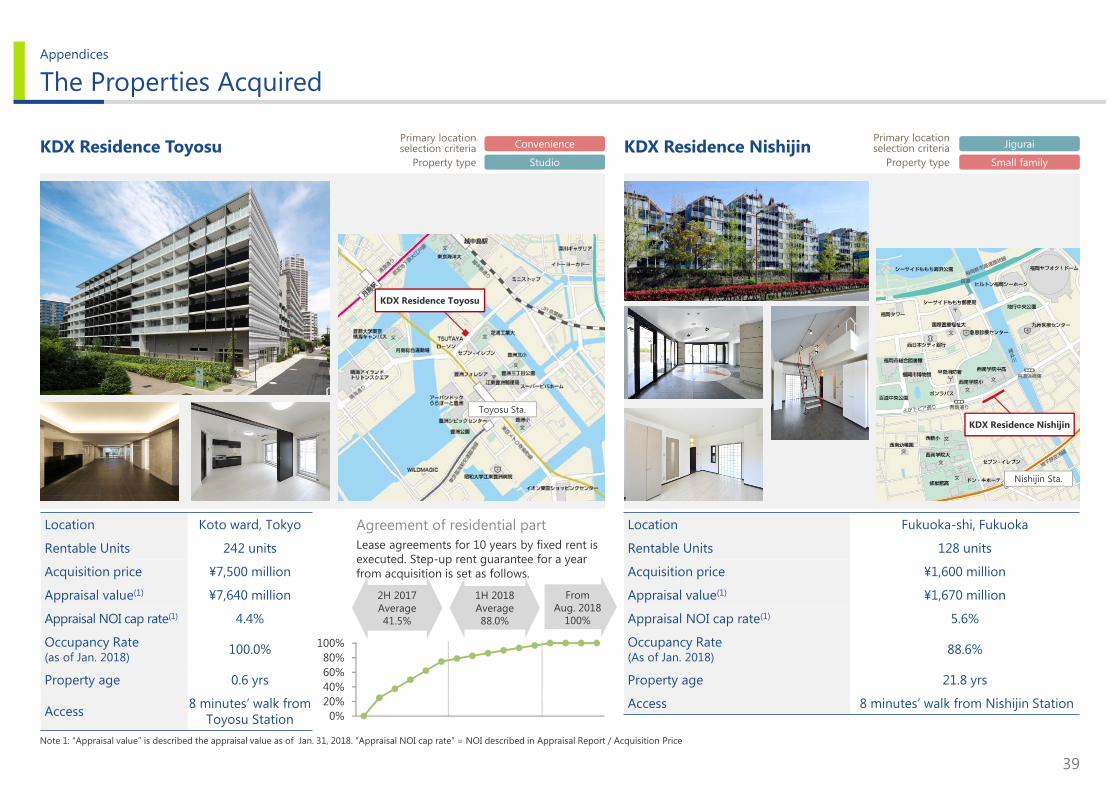
The Properties Acquired
Note 1: “Appraisal value” is described the appraisal value as of Jan. 31, 2018. “Appraisal NOI cap rate” = NOI described in Appraisal Report / Acquisition Price
Location Fukuoka-shi, Fukuoka
Rentable Units 128 units
Acquisition price ¥1,600 million
Appraisal value(1) ¥1,670 million
Appraisal NOI cap rate(1) 5.6%
Occupancy Rate(As of Jan. 2018) 88.6%
Property age 21.8 yrs
Access 8 minutes’ walk from Nishijin Station0%
20%40%60%80%
100%
Lease agreements for 10 years by fixed rent is executed. Step-up rent guarantee for a year from acquisition is set as follows.
KDX Residence Toyosu
Location Koto ward, Tokyo
Rentable Units 242 units
Acquisition price ¥7,500 million
Appraisal value(1) ¥7,640 million
Appraisal NOI cap rate(1) 4.4%
Occupancy Rate(as of Jan. 2018) 100.0%
Property age 0.6 yrs
Access 8 minutes’ walk from Toyosu Station
Convenience
Studio
Jigurai
Small familyKDX Residence Nishijin
2H 2017Average 41.5%
Agreement of residential part
FromAug. 2018
100%
1H 2018Average88.0%
KDX Residence Toyosu
KDX Residence Nishijin
Primary locationselection criteria
Property type
Toyosu Sta.
Nishijin Sta.
Primary locationselection criteria
Property type
40
Appendices
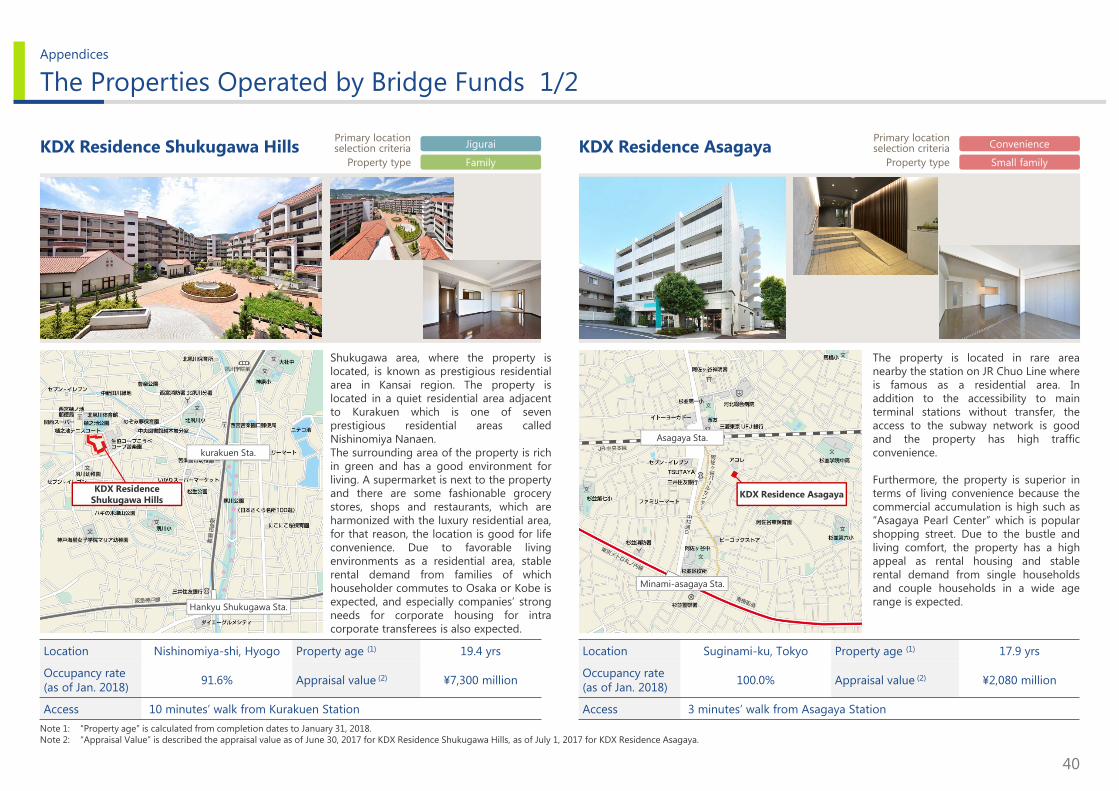
Location Suginami-ku, Tokyo Property age (1) 17.9 yrs
Occupancy rate (as of Jan. 2018) 100.0% Appraisal value (2) ¥2,080 million
Access 3 minutes’ walk from Asagaya Station
Location Nishinomiya-shi, Hyogo Property age (1) 19.4 yrs
Occupancy rate (as of Jan. 2018) 91.6% Appraisal value (2) ¥7,300 million
Access 10 minutes’ walk from Kurakuen Station
The Properties Operated by Bridge Funds 1/2
KDX Residence Shukugawa Hills
Note 1: “Property age” is calculated from completion dates to January 31, 2018.Note 2: “Appraisal Value” is described the appraisal value as of June 30, 2017 for KDX Residence Shukugawa Hills, as of July 1, 2017 for KDX Residence Asagaya.
Shukugawa area, where the property islocated, is known as prestigious residentialarea in Kansai region. The property islocated in a quiet residential area adjacentto Kurakuen which is one of sevenprestigious residential areas calledNishinomiya Nanaen.The surrounding area of the property is richin green and has a good environment forliving. A supermarket is next to the propertyand there are some fashionable grocerystores, shops and restaurants, which areharmonized with the luxury residential area,for that reason, the location is good for lifeconvenience. Due to favorable livingenvironments as a residential area, stablerental demand from families of whichhouseholder commutes to Osaka or Kobe isexpected, and especially companies’ strongneeds for corporate housing for intracorporate transferees is also expected.
KDX Residence Asagaya
The property is located in rare areanearby the station on JR Chuo Line whereis famous as a residential area. Inaddition to the accessibility to mainterminal stations without transfer, theaccess to the subway network is goodand the property has high trafficconvenience.
Furthermore, the property is superior interms of living convenience because thecommercial accumulation is high such as“Asagaya Pearl Center” which is popularshopping street. Due to the bustle andliving comfort, the property has a highappeal as rental housing and stablerental demand from single householdsand couple households in a wide agerange is expected.
Jigurai
Family
Convenience
Small family
Primary locationselection criteria
Property type
Primary locationselection criteria
Property type
KDX Residence Shukugawa Hills
kurakuen Sta.
Hankyu Shukugawa Sta.
KDX Residence Asagaya
Asagaya Sta.
Minami-asagaya Sta.

41
Appendices
Location Kobe-shi, Hyogo Property age (1) 0.9 yrs
Occupancy rate(as of Jan. 2018) 99.2% Appraisal value (2) ¥2,540 million
Access 5 minutes’ walk from Motomachi Station
Location Yoyohama-shi, Kanagawa Property age (1) 21.3 yrs
Occupancy rate(as of Jan. 2018) 91.7% Appraisal value (2) ¥2,560 million
Access 8 minutes’ walk from Hiyoshi Station
The Properties Operated by Bridge Funds 2/2
KDX Residence Hiyoshi
Note 1: “Property age” is calculated from completion dates to January 31, 2018.Note 2: “Appraisal Value” is described the appraisal value as of July 1, 2017.
The area started urbanization earlier inthe inland area of Yokohama withopening of the current JR Yokohama Linein 1908 and the current Tokyu ToyokoLine in 1926, quiet residential area andone of the distinguished lands inYokohama.
In the surrounding area, there are 5redevelopment projectsincluding thenext-generation urban smart city“Tsunashima Sustainable SmartTown”which industry, government andacademia will jointly develop fortownopening in 2018.
Due to traffic convenience, stable rentaldemand from couple households andfamily households commuting to thecenter of Tokyo or Yokohama is expected.
Serenite Kobe MotomachiFamily
Jigurai
Studio
Jigurai
KDX Residence Hiyoshi
Serenite Kobe Motomachi
Primary locationselection criteria
Property type
Primary locationselection criteria
Property type
Kobe Motomachi area, which has developed corresponding to the prosperity of “Kobe harbor” opened 150 years ago and has rows of many historic buildings keeping the remnants of the Kobe foreign settlements, is surrounded by the sea and the mountains and one of the distinguished lands in Kobe with living comfort.
“Nanjing Town” which is one of the Japan’sthree major Chinatowns, “Meriken Park” and “Kobe Harbor Land” are withinwalking distance. Due to living comfort and environment, stable rental demand from single households commuting to the center of Osaka or Kobe as well as workers around the nearest station is expected.

42
Appendices
Tenant Demographics Analysis
Large corporate contracts in rental housing(2)
58.8% 57.7% 57.2% 57.4%40.3% 40.7% 40.2% 39.5%
78.8% 78.2% 77.8% 78.4%
21.8% 22.2% 23.1% 22.9%
27.7% 27.6% 28.7% 28.9%
15.4% 15.7% 16.3% 15.8%16.7% 17.3% 17.0% 16.9%27.4% 27.3% 26.8% 27.1%
5.1% 5.3% 5.1% 5.0%2.8% 2.8% 2.7% 2.8% 4.6% 4.4% 4.3% 4.5%0.8% 0.8% 0.8% 0.8%
2016.7 2017.1 2017.7 2018.1 2016.7 2017.1 2017.7 2018.1 2016.7 2017.1 2017.7 2018.1
全体 東京経済圏 地⽅経済圏Total Tokyo Metropolitan Area Other Regional Areas
24.0% 22.0% 23.6% 20.8%
38.3% 38.7% 38.0% 39.2%
21.5% 21.5% 20.8% 20.9%
10.8% 11.5% 11.4% 12.6%
5.3% 6.2% 6.1% 6.6%
2016.7 2017.1 2017.7 2018.1
55.5% 55.7% 56.0% 56.2%
44.5% 44.3% 44.0% 43.8%
2016.7 2017.1 2017.7 2018.1
36.7% 36.1% 35.9% 35.0%
63.3% 63.9% 64.1% 65.0%
2016.7 2017.1 2017.7 2018.1
Sex
Note 1: Lessees of units at the end of each periodinclude stores and offices.
Note 2: Large corporate contracts are those that lease over 20% of the units in a certain property. However, 4 properties which have rent guaranteed master lease contracts are excluded.
Property Name Number of Contracts
% in a property
KDX Residence Okachimachi 27 units 52.9%
KDX Residence Yoga 18 units 47.4%KDX Residence Higashi-shinjuku 75 units 41.9%
KDX Residence Ojima 44 units 37.6%
PersonalContracts
CorporateContracts
Male
Female
Age
〜29
〜39
〜49
〜59
60〜
Type of Lessees(1) Breakdown of Personal Contracts
Breakdown of Rent Range (based on unit)
Type of lessees
Area TokyoMetropolitan Area
Other Regional Areas Total
Studio ¥93,967(+312)
¥69,182(▲136)
¥85,279(+118)
Small Family ¥164,512(+564)
¥85,727(▲1,306)
¥120,108(▲1,736)
Family ¥215,596(+1,325)
¥164,905(+185)
¥191,363(+1,031)
Total ¥134,209(+1,086)
¥90,943(▲902)
¥114,290(▲224)
Room Type
Average Rent per Residential Unit (1) (as of January 31, 2018)
Note1: ”( )” Shows the amount of increase or decrease compared to the previous period.
¥250,000〜 ¥150,000〜¥250,000 ¥100,000〜¥150,000 〜¥100,000
43
Appendices
Sub-MLIT Standard Toyo Tire & Rubber Seismic Isolation Materials
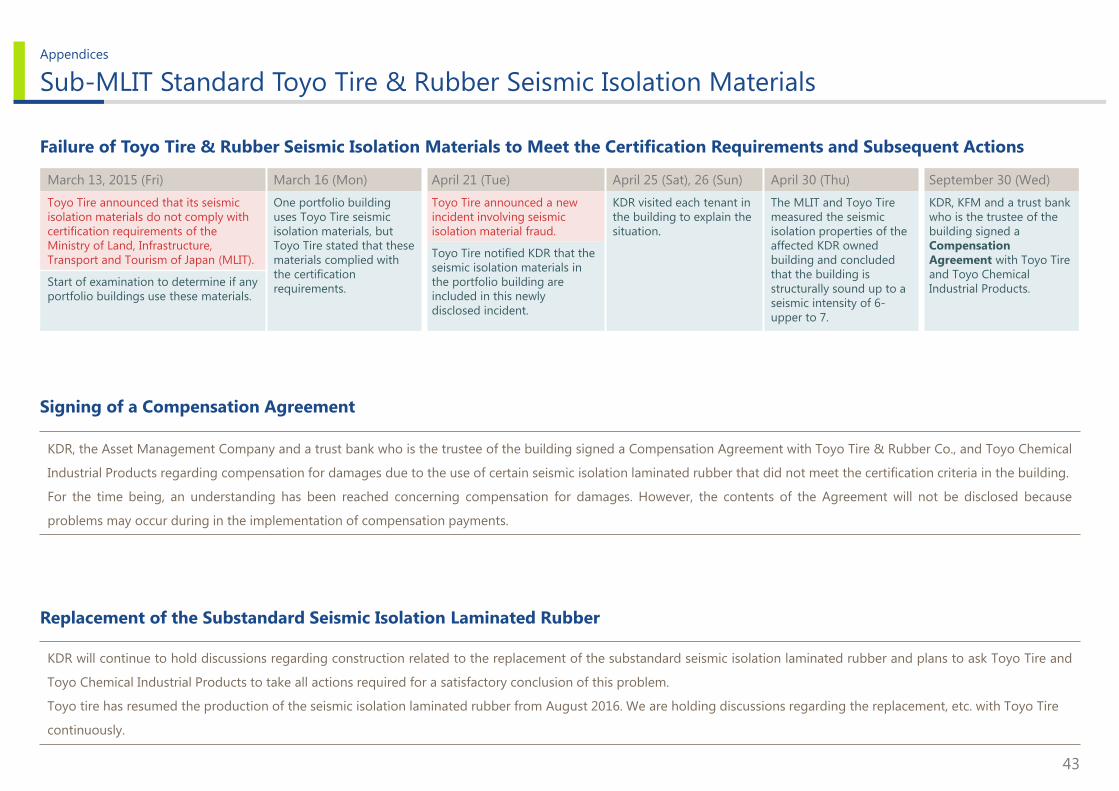
Failure of Toyo Tire & Rubber Seismic Isolation Materials to Meet the Certification Requirements and Subsequent Actions
Signing of a Compensation Agreement
KDR, the Asset Management Company and a trust bank who is the trustee of the building signed a Compensation Agreement with Toyo Tire & Rubber Co., and Toyo Chemical
Industrial Products regarding compensation for damages due to the use of certain seismic isolation laminated rubber that did not meet the certification criteria in the building.
For the time being, an understanding has been reached concerning compensation for damages. However, the contents of the Agreement will not be disclosed because
problems may occur during in the implementation of compensation payments.
March 13, 2015 (Fri) March 16 (Mon) April 21 (Tue) April 25 (Sat), 26 (Sun) April 30 (Thu) September 30 (Wed)
Toyo Tire announced that its seismic isolation materials do not comply with certification requirements of the Ministry of Land, Infrastructure, Transport and Tourism of Japan (MLIT).
One portfolio building uses Toyo Tire seismic isolation materials, but Toyo Tire stated that these materials complied with the certification requirements.
Toyo Tire announced a new incident involving seismic isolation material fraud.
KDR visited each tenant in the building to explain the situation.
The MLIT and Toyo Tire measured the seismic isolation properties of the affected KDR owned building and concluded that the building is structurally sound up to a seismic intensity of 6-upper to 7.
KDR, KFM and a trust bank who is the trustee of the building signed a Compensation Agreement with Toyo Tire and Toyo Chemical Industrial Products.
Toyo Tire notified KDR that the seismic isolation materials in the portfolio building are included in this newly disclosed incident.
Start of examination to determine if any portfolio buildings use these materials.
KDR will continue to hold discussions regarding construction related to the replacement of the substandard seismic isolation laminated rubber and plans to ask Toyo Tire and
Toyo Chemical Industrial Products to take all actions required for a satisfactory conclusion of this problem.
Toyo tire has resumed the production of the seismic isolation laminated rubber from August 2016. We are holding discussions regarding the replacement, etc. with Toyo Tire
continuously.
Replacement of the Substandard Seismic Isolation Laminated Rubber

44
Appendices
The Properties Operated by Bridge Funds (JSL) 1/3
Location Osaka-shi, Osaka Property age (1) 7.3 yrs
Operator KouyuKai Medical Corporation Appraisal value (2) ¥3,630 million
Anesis Teradacho
The property is a large-scaleintermediate nursing home with a fee-based home for the elderly (with nursingcare). There are small homes and shopsaround the property. The area is highlyconvenient because there are shops, etc.and since it is next to National Route 25,which runs along the side of the property.The intermediate nursing home targetspeople in need of nursing care and has150 beds (10 private rooms and 35rooms with capacity for multiple people)on floors 1 through 5. The area of aprivate room is about 14m2 and a roomwith capacity for multiple people is about32m2. The fee-based home for theelderly (with nursing care) has 100private rooms on floors 6 through 10 andthe area of a private room is about 18m2.
Note 1: “Property age” is calculated from completion dates to January 31, 2018.Note 2: “Appraisal value” is described the appraisal value as of March 1, 2018.
Rococo-riha
The property is a large-scaleintermediate nursing home with a dayrehabilitation facility (care prevention).The area is a traditional quiet residentialarea composed of many detached homesand apartments.
The intermediate nursing home targetspeople in need of nursing care and has100 beds (32 private rooms and 20rooms with capacity for multiple people).The area of a private room is about 14m2
and a room with capacity for multiplepeople is about 23m2-36m2.
Location Toyonaka-shi, Osaka Property age (1) 6.8 yrs
Operator KouyuKai Medical Corporation Appraisal value (2) ¥2,180 million
Anesis Teradacho
Rococo-riha
Fee-Based Homes for the Elderly (with nursing care)
Intermediate Nursing Homes
Type Intermediate Nursing HomesType

45
Appendices
The Properties Operated by Bridge Funds (JSL) 2/3
Location Kobe, Hyogo Property age (1) 7.4 yrs
Operator KouyuKai Medical Corporation Appraisal value (2) ¥2,820 million
Orage Suma
The property provides serviced housingfor the elderly and is a large-scaleintermediate nursing home with adaytime rehabilitation facility (careprevention) located on high ground inSuma new town. The property is locatedin a residential area with rich greeneryand detached homes next to RokkoMountains, providing a high level ofcomfort.
The intermediate nursing home targetspeople in need of nursing care and has100 private rooms, each with an area of aprivate about 14m2. The serviced housingfor the elderly can also be used byindependent people and has 35 privaterooms with areas of about 18m2-32m2.
Location Kobe-shi, Hyogo Property age (1) 16.0 yrs
Operator KouyuKai Medical Corporation Appraisal value (2) ¥1,890 million
Canadian Hill
The property, a large-scale intermediatenursing home with a daytimerehabilitation facility, is named after theCanadian Academy, an internationalschool located in the same spot. The areais a residential area with apartments anddetached homes and comfortable to livein. It is located at the foot of the RokkoMountains and provides a view of OsakaBay from the roof.
The intermediate nursing home targetspeople in need of nursing care and has115 beds (15 private rooms and 25rooms with capacity for four people). Thearea of a private room is about 11m2 anda room with capacity for four people isabout 34m2.
Note 1: “Property age” is calculated from completion dates to January 31, 2018.Note 2: “Appraisal value” is described the appraisal value as of March 1, 2018.
Canadian Hill
Orage Suma
Serviced Housing for the Elderly
Intermediate Nursing Homes
Type Type Intermediate Nursing Homes

46
Appendices
The Properties Operated by Bridge Funds (JSL) 3/3
Anesis Hyogo
The property is a large-scaleintermediate nursing home with adaytime rehabilitation facility. Thesurrounding area is a downtown mix ofhousing, shops, factories, etc., but thereare also residential developments such asapartments and detached houses as wellas roads and parks in line with theHamayama land readjustment project.
The intermediate nursing home targetspeople in need of nursing care and has100 beds (44 private rooms and 14rooms with capacity for four people). Thearea of a private room is about 11m2 anda room with capacity for four people isabout 35m2.
Location Kobe-shi, Hyogo Property age (1) 12.4 yrs
Operator KouyuKai Healthcare Corporation Appraisal value (2) ¥1,420 million
Note 1: “Property age” is calculated from completion dates to January 31, 2018.Note 2: “Appraisal value” is described the appraisal value as of March 1, 2018.
Anesis Hyogo
Type Intermediate Nursing Homes

47
Appendices
Classification of Senior Living Facilities
For persons living on their own(self-reliant) For persons requiring nursing care
Mid-price range High price range Mid-price range High price range
Market demand◎
(Potential demand)
△(Price)
◎(Volume zone)
○(Price)
Monthlyhousing charge ¥0.1〜0.3 million ¥0.3 million
〜 ¥0.1〜0.3 million ¥0.3 million〜
Unit size 25〜50m2 50〜100m2 15〜25m2 18〜25m2
Room amenities
Sharedamenities
Note 1: The above chart shows, in a simplified manner, the general features of market demand, monthly housing charge,unit size, room amenities and shared amenities assumed by KDR to pertain to the mentioned types of senior livingfacilities. The monthly housing charge is calculated as follows: “the amount of lump sum received, if any, dividedby the No. of months of the amortization period defined by the tenant agreement” + “the monthly usage charge(including meal charges).”
Note 2: This diagram is a simplified analysis of attributes of senior living facilities in the portfolio. The averages of both service for self-reliant and service for requiring nursing care are calculated for Joy Stage Hachioji, Yuimaru Hijirigaoka, Ten, and Active Biwa.
Note 3: The “Nursing level” represents the ratios, by support/Long-term Care level, of residents against the total no. of residents. The“Average nursing level” represents the “Total of (A x B)’s” divided by C: A=“No. of residents by nursing level defined by thedisclosure statement”; B=”0” for self-reliant, ”0.375” for Support Required-1, “1” for Support Required-1, or ”1-5” respectively forLong-term Care Required-1 to Long-term Care Required-5; and C=“Total no. of residents.” The data are based on the disclosurestatement or the operator’s submitted materials.(excluding Granda Mondo Yakujin)
Washroom, bathroom, air conditioner, etc
bathroom, kitchen, etc.
Dining room, kitchen, lounge, etc.
bathroom (for individual, public bath room and mechanical bathroom),
helper station, health management room, rehabilitation room, etc.
public bathroom,
Leisure facilities , etc.
Average Required Level of Nursing and Monthly Paid Fee by Facilities(2)Classification of Senior Living Facilities by Type(1)
0
10
20
30
40
50
60
0 1 2 3 4
(thousand yen)
ActivaBiwa
Nichii Home Tama Plaza
Irise Nishioka
Irise Kamata/Yuseien
Ten
Sawayaka Sakura Nibankan
Nichii Home Nakano
Minamidai
Ten
Joy Stage Hachioji
ActivaBiwa
YuimaruHijirigaoaka
Gran Hills Ogawarako
YuimaruHijirigaoka
Irise Eniwa
GrandaMondo Yakujin
Excellent Nishinomiya
Joy Stage Hachioji
Monthly charged fee
Level of required nursing care
New demand
Volume zone
Sompo Care Lavire Kobe Tarumi
Service for self-reliant Service for requiring nursing care
Average age
85.6 yrs
Status of End-tenants (3)
21.1%
12.4%
5.4%
19.4%
13.6%
10.2%
11.0%
6.9%
Average nursing level
1.7
Self-Reliant
Support Required-1
SupportRequired-2
Long-term Care Required- 1
Long-term CareRequired- 2
Long-term Care Required- 3
Long-term Care Required- 4
Long-term Care Required- 5
Nursing level Age

48
Appendices
Overview of Operators
OperatorFacilitiesOperated
(1)
No. of rooms(capacity;
Person)(1)Overview Facilities name owned by KDR
Benesse Style Care Co., Ltd. 313 17,599 Operates fee-based homes for the elderly mainly primarily in the Tokyo area and the Kansai area under brands such as Aria, Granny & Granda, Bonsejour, Kurara, Madoka, and Kokochi ・Granda Mondo Yakujin
Sompo Care Next Inc. 117 8,910Based on its philosophy of “homes are solely for the happiness of tenants,” operates over 100 fee-based homes for the elderly primarily in the Tokyo area, and also in the Kansai, Chubu, and Chugoku regions, under brands such as SOMPO Care Lavire. In addition to the institutional care business (fee-based homes for the elderly), also operates a day-care nursing business, in-home caregiving business, in-home nursing business, and in-home caregiving support business
・Sompo Care Lavire Kobe Tarumi
HITOWA Care Service Co., Ltd.(3)
(Old: Hasegawa Care Service Co., Ltd.)137 7,907
A wholly-owned subsidiary of HITOWA Holdings that, under the philosophy of “generating new value to support living with family and providing inspiration and satisfaction,” engages in the comfortable lifestyle services business, nursing services business, welfare services business, human resource services business, and food services business, amongst others. Operates fee-based homes for the elderly as well as day-care nursing and in-home caregiving services mainly in the Tokyo area under brands such as Irise
・Irise Kamata/Yuseien・Irise Nishioka・Alpha Eniwa Sta. Nishiguchi
Saikaihatsu Building
Nichii Carepalace Company 78 5,099A wholly-owned subsidiary of NICHIIGAKKAN engaged in the medical, nursing, healthcare, and education businesses. The NICHIIGAKKAN group operates fee-based homes for the elderly under the Nichii Home and Nichii no Kiramekibrands and serviced senior housing and the like under the Iris Garden brand throughout Japan
・Nichii Home Nakano Minamidai
・Nichii Home Tama Plaza
Sawayaka Club Co., Ltd. 74 4,408Founded in December 2004. Under the philosophy of “setting our customers first out of love and preserving their dignity,” engages mainly in the business of operating assisted-living fee-based homes for the elderly. Currently operates an institutional care business (fee-based homes for the elderly) in addition to a day-care nursing business and an in-home caregiving business from Hokkaido to Oita Prefecture and primarily in Fukuoka Prefecture
・Sawayaka Sakura Nibankan
Activa Co., Ltd. 14 1,912 Activa Co., Ltd. operates Activa Biwa as a wholly-owned subsidiary of Resorttrust ・Activa Biwa
NOTE Social Welfare Corporation 43 1,728Established in May 1983 with the goal of being a local company that supports people in living independently and with dignity and under the philosophy of “providing everyone with the happiness of living an ordinary life.” Takes on the “NOTE regional comprehensive care” structure with, at its core, special elderly nursing homes supporting people of middle to advanced age
・Ten
Excellent Care System T Co., Ltd. 39 1,470Under three key caregiving principles of “customer interaction, meals, and keeping customers entertained on a daily basis,” operates a comprehensive caregiving business that includes an institutional care business (fee-based homes for the elderly), day-care nursing business, in-home caregiving business, and in-home nursing business in Hyogo Prefecture, Tokushima Prefecture, Kyoto, Tokyo, Kanagawa Prefecture, Aichi Prefecture, and Osaka
・Excellent Nishinomiya
Community Net Inc. 10 1,070Aims to resolve various issues facing Japan, such as the aging population, depopulation, and the abandoned home problem. Currently engages in business focused primarily on self-reliant elderly housing under the Yuimaru brand in order to achieve “communities where everyone, from children to the elderly, can live together in harmony” throughout Japan
・Yuimaru Hijirigaoka
NM LIFE Co., Ltd. 1 263Under its “New Make Life” philosophy, provides services with the aim of allowing residents to enjoy active lifestyles. Established on October 5, 1995 through a 50-50 joint venture between a major trading company and a second-tier construction firm, and currently a wholly-owned subsidiary of Iriscare, a company engaged in the operation of medical and care facilities as well as consulting
・Joy Stage Hachioji
Silver Town Ltd. 3 188Group company of Iriscare, which is engaged in the operation of medical and care facilities as well as consulting. Characterized in that it works with a medical company in the same group to take in a wide-range of users, including those who are highly dependent on medical services
・Gran Hills Ogawarako
Note1: The figures for “facilities operated” and “no. of room (capacity)” are as of Dec.31,2017.(The figure for Benesse Style Care Co., Ltd. is as of Jan 31, 2018) and Activa Co., Ltd. is included the figure for facilities operated by Resorttrust Inc.Note2: The above information describes the information acquired KDR as it is, it is merely reference information, and the information may be incomplete or inaccurate.Note3: Hasegawa Care Service Co., Ltd. changed its company name to HITOWA Care Service Co., Ltd. on Nov. 1, 2017.

49
Appendices
External growth support Internal growth support
SponsorSupport Com
panies
Development(2)
Information provision (1) Warehousing
Personnel support or
provision of expertise
Renovations, maintenance
Backup operator (3)
__
Finance supportFinancing means for
bridge funds, etc.provided
Support System by Sponsor and Support Companies
Residential facilities Healthcare facilities AccommodationSupport for:
Note 1: “Information provision” means support to provide, to KDR or KFM under certain conditions, information on sales of third parties’ real properties, etc. that Sponsor or individual Support Companies obtain on their ownor information on sales of real properties that Sponsor, individual Support Companies or their group companies, etc. possess (with respect to Shinsei Bank and Mitsubishi UFJ Trust and Banking Corporation amongother Support Companies, only information on sales of third parties’ real properties, etc. that they obtain on their own).
Note 2: “Development” means support to provide cooperation to the extent practically reasonable and under practically reasonable conditions when KDR requests support for new development of investable assets orredevelopment of real properties, etc. that KDR possesses or considers to acquire.
Note 3: “Backup operator” means support to consider to be backup operators for existing operators who are managing facilities which are located on real properties, etc. that KDR possesses or considers to acquire whenKDR requests.
Note 4: This is limited to the provision of expertise, and personnel support is not included.Note 5: The chart above shows a summary of support set forth in each support agreement executed by and among Sponsor, each of the Support Companies and KDR/KFM or agreeing succession resulting from the merger.
Neither the Sponsor nor the individual Support Companies are necessarily contractually obligated to provide the support above, and Sponsor and the individual Support Companies have not guaranteed or promisedto provide the support above.
(Note 4)
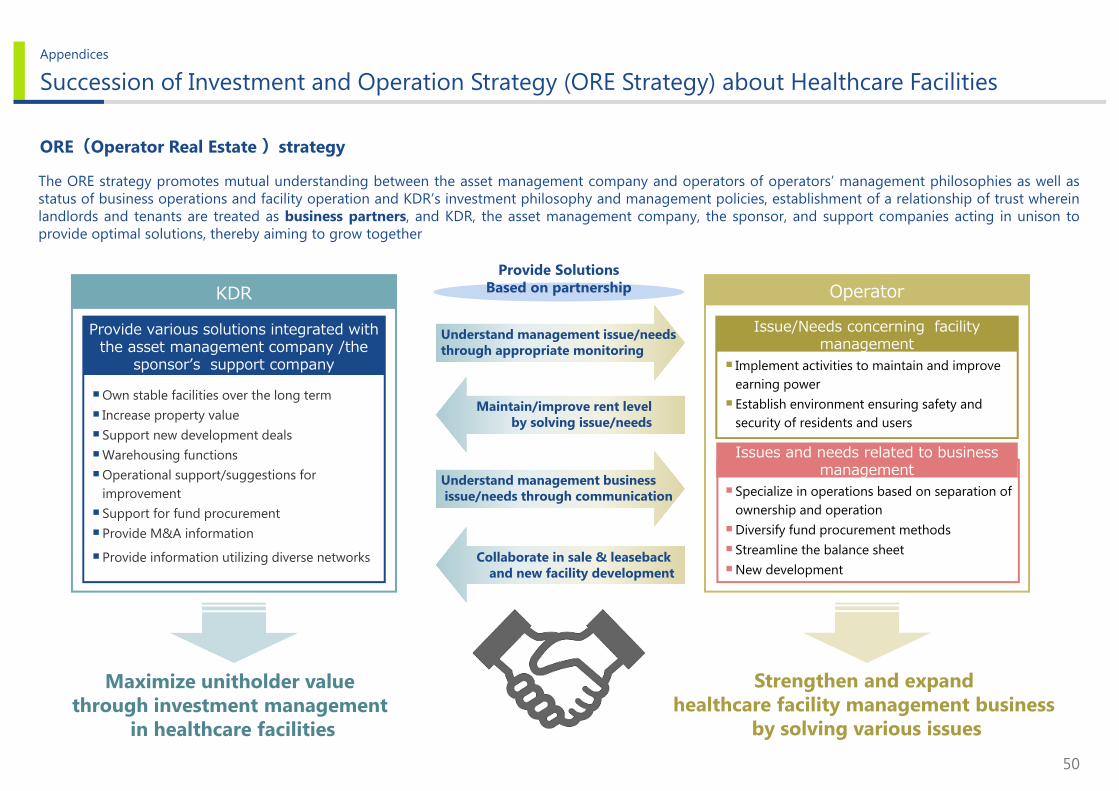
50
Appendices
Succession of Investment and Operation Strategy (ORE Strategy) about Healthcare Facilities
ORE(Operator Real Estate )strategy
The ORE strategy promotes mutual understanding between the asset management company and operators of operators’ management philosophies as well asstatus of business operations and facility operation and KDR’s investment philosophy and management policies, establishment of a relationship of trust whereinlandlords and tenants are treated as business partners, and KDR, the asset management company, the sponsor, and support companies acting in unison toprovide optimal solutions, thereby aiming to grow together
Provide various solutions integrated withthe asset management company /the
sponsorʼs support company
Own stable facilities over the long term Increase property value Support new development dealsWarehousing functionsOperational support/suggestions for
improvement Support for fund procurement Provide M&A information Provide information utilizing diverse networks
KDRIssue/Needs concerning facility
management Implement activities to maintain and improve
earning power Establish environment ensuring safety and
security of residents and users
Operator
Specialize in operations based on separation of ownership and operation
Diversify fund procurement methods Streamline the balance sheetNew development
Understand management issue/needsthrough appropriate monitoring
Maintain/improve rent level by solving issue/needs
Understand management businessissue/needs through communication
Collaborate in sale & leaseback and new facility development
Maximize unitholder value through investment management
in healthcare facilities
Strengthen and expand healthcare facility management business
by solving various issues
Provide SolutionsBased on partnership
Issues and needs related to business management

51
Appendices
Investment Unit Price
0
2,000
4,000
6,000
8,000
10,000
12,000
150,000
200,000
250,000
300,000
350,000
400,000
450,000(yen) (units)
Jul. 2012 Jan. 2013 Jul. 2013 Jan. 2014 Jul. 2014 Jan. 2015 Jul. 2015 Jan. 2016 Jul. 2016 Jan. 2017 Jul. 2017 Jan. 2018
Jan. 15, 2015Announcement of
Public Offering
Jul. 18, 2014Announcement of
Public Offering
Jul. 17, 2013Announcement of
Public Offering
2017/11/10Announcement of
the Merger
Investment unit price TSE REIT Index TSE Residential REIT Index Volume (RHS)
Note1: Tokyo Stock Exchange REIT Index and Tokyo Stock Exchange Residential REIT Index are indexed from the closing price as of April 26, 2012 (964.36 and 1,247.66) which are initial listing date of KDR to the closing price of KDR (¥181,000).
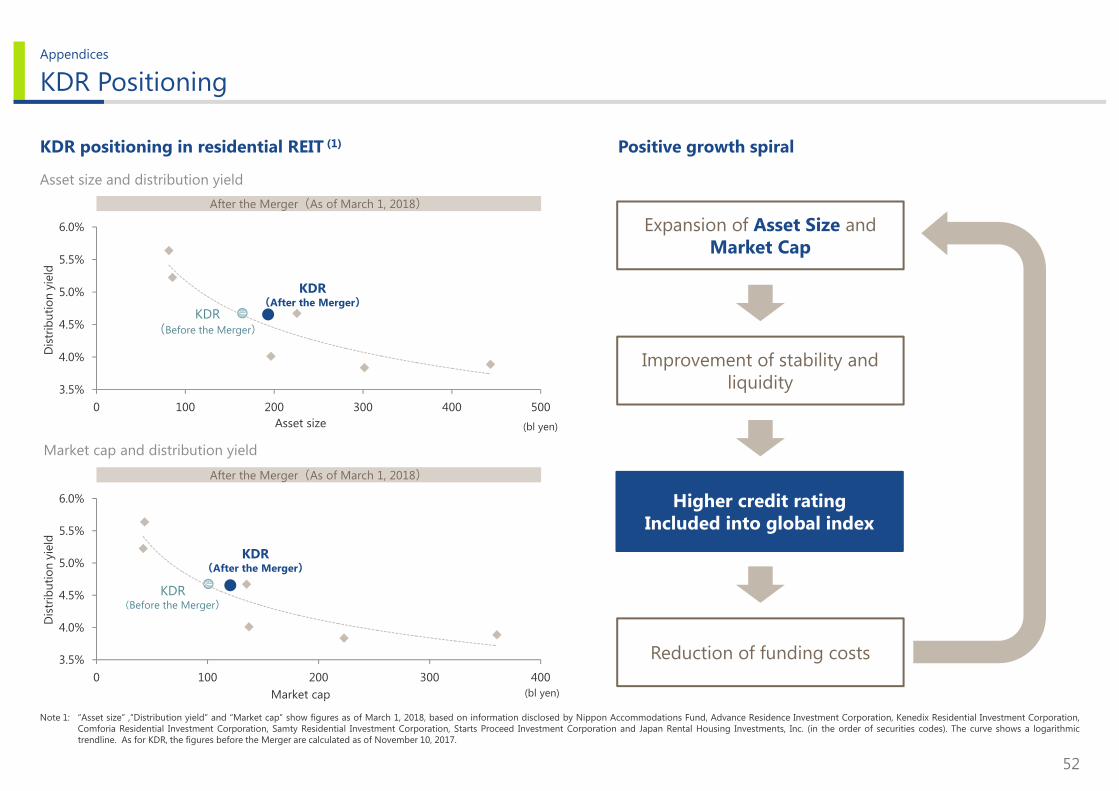
52
Appendices
3.5%
4.0%
4.5%
5.0%
5.5%
6.0%
0 100 200 300 400 500
3.5%
4.0%
4.5%
5.0%
5.5%
6.0%
0 100 200 300 400
Asset size
Market cap (bl yen)
KDR Positioning
Note 1: “Asset size” ,“Distribution yield” and “Market cap” show figures as of March 1, 2018, based on information disclosed by Nippon Accommodations Fund, Advance Residence Investment Corporation, Kenedix Residential Investment Corporation,Comforia Residential Investment Corporation, Samty Residential Investment Corporation, Starts Proceed Investment Corporation and Japan Rental Housing Investments, Inc. (in the order of securities codes). The curve shows a logarithmictrendline. As for KDR, the figures before the Merger are calculated as of November 10, 2017.
KDR positioning in residential REIT (1)
Asset size and distribution yield
Market cap and distribution yield
KDR(After the Merger)
KDR(After the Merger)
Dis
trib
utio
n yi
eld
Dis
trib
utio
n yi
eld
KDR(Before the Merger)
KDR(Before the Merger)
After the Merger(As of March 1, 2018)
After the Merger(As of March 1, 2018)
Expansion of Asset Size and Market Cap
Improvement of stability and liquidity
Reduction of funding costs
Higher credit ratingIncluded into global index
Positive growth spiral
(bl yen)

53
Appendices
Financial Statements
(in thousands of yen)11th fiscal period 12th fiscal period
(as of Jul. 31, 2017) (as of Jan 31, 2018)Liabilities
Current liabilitiesOperating accounts payable 431,854 473,021Short-term loans payable 1,000,000 2,630,000Current portion of long-term loans payable 11,000,000 11,000,000Accounts payable-other 203,876 239,241Accrued expenses 24,212 26,142Income taxes payable 799 604Accrued consumption taxes 6,135 -Advances received 766,964 779,137Deposits received 50,111 53,143Total current liabilities ¥13,483,955 ¥15,201,290
Noncurrent liabilitiesInvestment corporation bonds 3,000,000 3,000,000Long-term loans payable 66,800,000 74,500,000Tenant leasehold and security deposits in trust 1,473,087 1,462,549Total noncurrent liabilities ¥71,273,087 ¥78,962,549
Total liabilities ¥84,757,042 ¥94,163,839Net Assets
Unitholders’ equityUnitholders’ capital 80,132,379 80,132,379Surplus
Unappropriated retained earnings (undisposed loss) 2,400,002 2,437,011Total surplus ¥2,400,002 ¥2,437,011Total unitholders’ equity ¥82,532,381 ¥82,569,390
Valuation and translation adjustmentsDeferred gains or losses on hedges 26,626 80,743Total valuation and translation adjustments ¥26,626 ¥80,743
Total net assets ¥82,559,008 ¥82,650,134Total liabilities and net assets ¥167,316,051 ¥176,813,974
(in thousands of yen)11th fiscal period 12th fiscal period
(as of Jul. 31, 2017) (as of Jan 31, 2018)Assets
Current assetsCash and deposits 6,405,982 6,551,666Cash and deposits in trust 3,778,959 3,928,017Operating accounts receivable 24,821 24,913Prepaid expenses 4,831 3,557Deferred tax assets 9 -Other 503 11,358Total current assets ¥10,215,108 ¥10,519,513
Noncurrent assetsProperty, plant and equipment
Land 1,798,041 1,798,041Building in trust 59,595,871 61,915,815Structures in trust 343,563 388,001Machinery and equipment in trust 1,061,940 1,090,946Tools, furniture and fixtures in trust 243,587 309,425Land in trust 93,118,700 99,538,715Total property, plant and equipment, net ¥156,161,704 ¥165,040,946
Investments and other assetsInvestment securities 91,579 221,707Lease and guarantee deposits 10,397 10,397Long-term prepaid expenses 764,254 915,782Other 26,626 80,743Total investments and other assets ¥892,858 ¥1,228,631
Total noncurrent assets ¥157,054,563 ¥166,269,577Deferred assets
Investment corporation bond issuance costs 26,340 24,461Investment unit issuance costs 20,039 421Total deferred assets ¥46,380 ¥24,883
Total assets ¥167,316,051 ¥176,813,974
Balance Sheets

54
Appendices
Financial Statements
(in thousands of yen)11th fiscal period 12th fiscal period
from: Feb. 1, 2017 from: Aug. 1, 2017to: Jul. 31, 2017 to: Jan. 31, 2018
Operating revenuesRent revenues-real estate 5,102,400 5,235,620Other lease business revenue 472,418 435,685Dividend received - 10,132Total operating revenues ¥5,574,819 ¥5,681,438
Operating expensesExpenses related to rent business 2,124,246 2,107,064Asset management fees 371,229 377,361Asset custody fees 11,363 11,365Administrative service fees 38,143 39,023Directors' compensation 4,500 4,500Merger-related expenses - 67,446Other operating expenses 192,121 184,719Total operating expenses ¥2,741,604 ¥2,791,481
Operating Income ¥2,833,215 ¥2,889,956Non-operating income
Interest income 12 12Dividends and redemption-prescription 824 350Total non-operating income ¥836 ¥363
Non-operating expensesInterest expenses 385,660 410,074Interest expenses on Investment corporation bonds 7,629 7,806Borrowing expenses 96,801 97,811Amortization ofinvestment corporation bond issuance costs 1,878 1,878Amortization of investment unit issuance costs 25,790 19,618Total non-operating expenses ¥517,760 ¥537,188
Ordinary Income ¥2,316,291 ¥2,353,130
(in thousands of yen)11th fiscal period 12th fiscal period
from: Feb. 1, 2017 from: Aug. 1, 2017to: Jul. 31, 2017 to: Jan. 31, 2018
Net cash provided by (used in) operating activities 3,267,273 3,251,371Net cash provided by (used in) investing activities △239,024 △9,969,526Net cash provided by (used in) financing activities △2,282,658 7,012,897Net increase (decrease) in Cash and Cash Equivalents ¥745,590 ¥294,741Cash and cash equivalents at the beginning of period 9,439,351 10,184,942Cash and cash equivalents at the End of Period ¥10,184,942 ¥10,479,684
11th fiscal period 12th fiscal periodfrom: Feb. 1, 2017 from: Aug. 1, 2017
to: Jul. 31, 2017 to: Jan. 31, 2018I. Retained earnings at the end of period 2,400,002,851 yen 2,437,011,775 yenII. Total distributions 2,315,507,337 yen 2,424,772,194 yen
(Distributions per unit) (6,633 yen) (6,946 yen)III. Retained earnings brought forward to the
next period 84,495,514 yen 12,239,581 yen
Statements of Income and Retained Earnings
Distributions
Statements of Cash Flows
(in thousands of yen)11th fiscal period 12th fiscal period
from: Feb. 1, 2017 from: Aug. 1, 2017to: Jul. 31, 2017 to: Jan. 31, 2018
Income before income taxes ¥2,316,291 ¥2,353,130Income taxes-current 801 604Income taxes-deferred 51 9Total income taxes ¥853 ¥614Net Income ¥2,315,438 ¥2,352,516Retained earnings brought forward 84,564 84,495Unappropriated retained earnings (undisposed loss) ¥2,400,002 ¥2,437,011

55
Appendices
Summary of Kenedix Group
Priority Rights of Consideration for Real Estate Sale Information in Asset Management Company
Property typeTotal floor area per investment property (m2)
Primary 2nd 3rd
ResidentialLess than 20,000 (1) KDR KPI(2) Private Fund
Over 20,000 (1) KPI(2) KDR Private Fund
Healthcare All KDR Private Fund -
Accommodation All KPI(2) KDR Private Fund
Note 1: Total floor area per property is for properties in the 23 wards of Tokyo. This figure is less than 30,000 for each of the other regions outside of the 23 wards of Tokyo, and over 30,000 combined. Note 2: “KPI” indicates Kenedix Private Investment Corporation.
Main Funds Kenedix Group Involves in Operation
Residential facilitiesHealthcare facilities
AccomodationRetail facilities
Large-scale office buildings,
Hotels etc.Medium-scale office
buildings, etc. Logistics facilities Office buildings, residential, etc.
Private Funds
All sorts of assets
Kenedix Real Estate Fund Management, Inc. (KFM)(KDX Wholly-owned)
Mitsui & Co.,Logistics
Partners Ltd. (KDX 10%-owned)
Premier REITAdvisorsCo., Ltd.
(KDX 30%-owned)KFM Kenedix, Inc.
(KDX)
J-REIT Private REIT Private Fund
Breakdown of AUM (as of end of December 2017)
REIT¥1,432.8 bln(71.5%)
Private funds¥477.6 bln(23.8%)
Proprietary investments¥92.9 bln(4.6%)
¥2,003.3 bln

56
Appendices
Organization Chart of KFM (KDR)
Shareholders’ meeting
Corporate Auditors
Board of Directors
Chairman,Representative Director
President & CEO
Compliance Committee
Internal Audit Dept.Compliance
Officer/ComplianceDept.
Office REIT Dept. Residential REIT Dept.
Residential REIT Dept.Asset Management
Committee
Private REIT Dept. Retail REIT Dept. Private Fund Dept. Finance &Accounting Dept.
Business Administration
Dept.
Asset Investment Div. Asset Management Div.
Healthcare Investment
Management Div. Planning Div.
Overview of Asset Management Company
Name Kenedix Real Estate Fund Management, Inc.
Representative
Ryosuke HommaChairman, Representative DirectorMasahiko Tajima,President & CEO
Capital 200 million yen
Book-closing December
Shareholder Kenedix Inc. (100%)
Head of Residential REIT Department
(Director & COO)
Organizational chart

57
Appendices
Appraisal Unrealized Capital Gains and NAV per Unit
¥92,295 ¥93,297 ¥97,461 ¥105,254
¥110,612 ¥120,880
¥136,325 ¥141,812 ¥143,904
¥149,079 ¥152,528 ¥153,716 ¥156,998
0.1 0.3 0.9 2.2 4.8 10.3
14.9 18.7 20.3
23.826.2 27.0 27.0
0.5% 1.0%3.0% 2.3%
4.8%
8.3%10.1%
12.5%13.5%
15.2%16.8% 16.4%
14.0%
0.0%
5.0%
10.0%
15.0%
20.0%
0
100
200
300
400
Appraisal Unrealized Capital Gains and Appraisal Unrealized Gain Ratio(1)
NAV per Unit(2)
(in billions of yen)
Note 1: “Appraisal Unrealized Capital Gains” = Total Appraisal Value at the End of the Period – Total Book Value at the End of the Period (Appraisal Value for Healthcare facilities after the merger). “Appraisal Unrealized Capital Gain Ratio” = Total AppraisalUnrealized Capital Gains at the End of the Period / Total . After the merger of “Appraisal Unrealized Capital Gains” and ”Appraisal Unrealized Gain Ratio“are estimated figure calculated under premise assumptions as of March 1,2018.
note2: "NAV per unit" has been changed as follows, including for past figuresCalculation method up until the previous fiscal period: NAV per unit = (end of period total assets - unappropriated retained earnings + end of period appraisal value - property, plant and equipment)/number of outstanding unitsCalculation method from the current fiscal period: NAV per unit = (end of period total assets - total distribution amount + end of period appraisal value - property, plant and equipment)/number of outstanding unitsFurther, considering the 2-for-1 investment unit split on March 1, 2018, NAV per unit from July 31, 2017 (end of 11th fiscal period) onward reflects the split by being prorated by 2. Post-merger NAV per unit is estimated figure calculated as of March1, 2018 based on certain assumptions.
Appraisal unrealized capital gains Appraisal unrealized capital gain ratio (RHS)
Jul. 31, 2012(1st Period)
Jan. 31, 2013(2nd Period)
Jul. 31, 2013(3rd Period)
Jan. 31, 2014(4th Period)
Jul. 31, 2014(5th Period)
Jan. 31, 2015(6th Period)
Jul. 31, 2015(7th Period)
Jan. 31, 2016(8th Period)
Jul. 31, 2016(9th Period)
Jan. 31, 2017(10th Period)
Jul. 31, 2017(11th Period)
Jan. 31, 2018(12tt Period)
Mar. 2018(After the Merger)
(Forecast)
Jul. 31, 2012(1st Period)
Jan. 31, 2013(2nd Period)
Jul. 31, 2013(3rd Period)
Jan. 31, 2014(4th Period)
Jul. 31, 2014(5th Period)
Jan. 31, 2015(6th Period)
Jul. 31, 2015(7th Period)
Jan. 31, 2016(8th Period)
Jul. 31, 2016(9th Period)
Jan. 31, 2017(10th Period)
Jul. 31, 2017(11th Period)
Jan. 31, 2018(12th Period)
Mar. 2018(After the Merger)
(Forecast)
10
20
30
40

58
Appendices
Appraisal Values 1/5
Appraisal Value Cap Rate Discount Rate Terminal Cap Rate
No. Property Name Appraiser Previous End of the 12th Period Difference Previous End of the
12th Period Previous End of the 12th Period Previous End of the
12th PeriodAcquisition
Price Difference Book Value Difference
a b c [b-a] d e [b-d] f g [b-f]
Tokyo Metropolitan A
rea
T-1 KDX Daikanyama Residence F 5,680 5,680 - 4.1% 4.1% 3.9% 3.9% 4.3% 4.3% 4,700 980 4,721 958
T-3 KDX Odemma Residence F 1,990 1,990 - 4.2% 4.2% 4.0% 4.0% 4.4% 4.4% 1,775 215 1,731 258
T-4 KDX Iwamoto-cho Residence F 928 928 - 4.2% 4.2% 4.0% 4.0% 4.4% 4.4% 822 106 800 127
T-5 KDX Bunkyo Sengoku Residence F 1,710 1,710 - 4.2% 4.2% 4.0% 4.0% 4.4% 4.4% 1,488 222 1,468 241
T-6 KDX Azumabashi Residence F 849 849 - 4.3% 4.3% 4.1% 4.1% 4.5% 4.5% 650 199 624 224
T-7 KDX Shimura Sakaue Residence F 3,250 3,250 - 4.6% 4.6% 4.4% 4.4% 4.8% 4.8% 2,830 420 2,718 531
T-9 Cosmo Heim Motosumiyoshi(land with leasehold interest) F 1,790 1,790 - - - 4.7% 4.7% 4.9% 4.9% 1,750 40 1,798 -8
T-10 KDX Musashi Nakahara Residence F 712 713 1 4.9% 4.9% 4.7% 4.7% 5.1% 5.1% 637 76 637 75
T-11 KDX Chiba Chuo Residence D 1,740 1,750 10 4.9% 4.9% 4.7% 4.7% 5.1% 5.1% 1,480 270 1,367 382
T-12 KDX Kawaguchi Saiwai-choResidence F 1,350 1,350 - 4.8% 4.8% 4.6% 4.6% 5.0% 5.0% 1,150 200 1,128 221
T-13 KDX Residence Shirokane I F 3,430 3,430 - 4.2% 4.2% 4.0% 4.0% 4.4% 4.4% 3,000 430 3,019 410
T-15 KDX Residence Shirokane II F 3,340 3,340 - 4.1% 4.1% 3.9% 3.9% 4.3% 4.3% 2,800 540 2,812 527
T-16 KDX Residence Minami-aoyama F 2,470 2,470 - 4.1% 4.1% 3.9% 3.9% 4.3% 4.3% 2,230 240 2,244 225
T-17 KDX Residence Minami-azabu F 2,530 2,530 - 4.1% 4.1% 3.9% 3.9% 4.3% 4.3% 2,080 450 2,082 447
T-18 KDX Residence Shiba Koen F 2,220 2,220 - 4.1% 4.1% 3.9% 3.9% 4.3% 4.3% 1,781 439 1,776 443
T-19 KDX Residence Azabu East F 1,910 1,910 - 4.2% 4.2% 4.0% 4.0% 4.4% 4.4% 1,560 350 1,559 350
T-20 KDX Residence Takanawa F 956 987 31 4.1% 4.1% 3.9% 3.9% 4.3% 4.3% 770 217 770 216
T-21 KDX Residence Nishihara F 1,870 1,870 - 4.2% 4.2% 4.0% 4.0% 4.4% 4.4% 1,450 420 1,456 413
T-22 KDX Residence Daikanyama II F 928 928 - 4.4% 4.4% 4.2% 4.2% 4.6% 4.6% 730 198 762 165
T-23 KDX Residence Sendagaya F 782 788 6 4.3% 4.3% 4.1% 4.1% 4.5% 4.5% 650 138 645 142
T-24 KDX Residence NihombashiSuitengu D 3,860 3,870 10 4.1% 4.1% 3.9% 3.9% 4.3% 4.3% 3,240 630 3,205 664
T-25 KDX Residence NihombashiHakozaki D 1,330 1,330 - 4.1% 4.2% 3.9% 4.0% 4.3% 4.4% 1,147 183 1,174 155
T-26 KDX Residence Higashi-shinjuku F 3,880 3,890 10 4.2% 4.2% 4.0% 4.0% 4.4% 4.4% 3,270 620 3,250 639
T-27 KDX Residence Yotsuya F 2,580 2,590 10 4.2% 4.2% 4.0% 4.0% 4.4% 4.4% 2,260 330 2,261 328
T-28 KDX Residence Nishi-shinjuku F 1,250 1,250 - 4.2% 4.2% 4.0% 4.0% 4.4% 4.4% 1,000 250 1,003 246
T-29 KDX Residence Kagurazaka F 870 870 - 4.2% 4.2% 4.0% 4.0% 4.4% 4.4% 720 150 716 153
(in millions of yen)
Note 1: Regarding Appraisers, “F” means Japan Real Estate Institute, “D” means Daiwa Real Estate Appraisal co., ltd., “M” means Morii Appraisal & Investment Consulting Inc. and “T” means The Tanizawa Sogo Appraisal Co., Ltd. Appraisal values arerounded down to the nearest ¥mln. Contents of the real estate appraisal are opinions and judgements at the time of evaluation(Previous; [T-1~78 and R-1~42; July 31, 2017, R-43; June 1,2017],12th Period; January 31, 2018), and do notguarantee the validity, accuracy and the possibility of sales at appraisal values. Subtotal and Total of “Cap Rate”, “Discount Rate” and “Terminal Cap Rate” are calculated by the weighted average by the appraisal value. For properties for whichmultiple discount rates are set per fiscal period, the value for the first fiscal period in which a discount rate was applied is shown above.

59
Appendices
Appraisal Values 2/5
(in millions of yen)Appraisal Value Cap Rate Discount Rate Terminal Cap Rate
No. Property Name Appraiser Previous End of the 12th Period Difference Previous End of the
12th Period Previous End of the 12th Period Previous End of the
12th PeriodAcquisition
Price Difference Book Value Difference
a b c [b-a] d e [b-d] f g [b-f]
Tokyo Metropolitan A
rea
T-30 KDX Residence Futako Tamagawa F 1,420 1,420 - 4.4% 4.4% 4.2% 4.2% 4.6% 4.6% 1,250 170 1,276 143
T-31 KDX Residence Komazawa Koen F 1,070 1,070 - 4.2% 4.2% 4.0% 4.0% 4.4% 4.4% 920 150 915 154
T-32 KDX Residence Misyuku F 885 888 3 4.2% 4.2% 4.0% 4.0% 4.4% 4.4% 760 128 760 127
T-33 KDX Residence Yoga F 832 835 3 4.3% 4.3% 4.1% 4.1% 4.5% 4.5% 700 135 700 134
T-34 KDX Residence Shimouma F 722 727 5 4.3% 4.3% 4.1% 4.1% 4.5% 4.5% 600 127 604 122
T-35 Raffine Minami-magome F 1,460 1,450 -10 4.9% 4.9% 4.7% 4.7% 5.1% 5.1% 1,250 200 1,247 202
T-36 KDX Residence Yukigaya Otsuka F 1,280 1,280 - 4.5% 4.5% 4.3% 4.3% 4.7% 4.7% 1,050 230 1,039 240
T-37 KDX Residence Denen Chofu D 1,190 1,190 - 4.5% 4.5% 4.3% 4.3% 4.7% 4.7% 1,000 190 1,055 134
T-38 KDX Residence Tamagawa F 901 901 - 4.6% 4.6% 4.4% 4.4% 4.8% 4.8% 776 125 755 145
T-39 KDX Residence Monzennakacho F 937 938 1 4.3% 4.3% 4.1% 4.1% 4.5% 4.5% 773 165 770 167
T-40 KDX Residence Okachimachi F 1,020 1,020 - 4.4% 4.4% 4.2% 4.2% 4.6% 4.6% 850 170 846 173
T-41 KDX Residence Moto-asakusa F 968 968 - 4.3% 4.3% 4.1% 4.1% 4.5% 4.5% 800 168 799 168
T-42 KDX Residence Itabashi Honcho F 727 727 - 4.6% 4.6% 4.4% 4.4% 4.8% 4.8% 620 107 610 116
T-43 KDX Residence Azusawa F 634 635 1 4.6% 4.6% 4.4% 4.4% 4.8% 4.8% 550 85 560 74
T-44 KDX Residence Tobu Nerima F 496 496 - 4.7% 4.7% 4.5% 4.5% 4.9% 4.9% 420 76 407 88
T-45 KDX Residence Yokohama Kannai F 959 960 1 4.8% 4.8% 4.6% 4.6% 5.0% 5.0% 800 160 787 172
T-46 KDX Residence Miyamaedaira F 1,130 1,130 - 4.6% 4.6% 4.4% 4.4% 4.8% 4.8% 999 131 999 130
T-47 KDX Residence Machida F 1,990 1,990 - 4.5% 4.5% 4.3% 4.3% 4.7% 4.7% 1,800 190 1,745 244
T-48 KDX Residence Kinshicho F 1,600 1,600 - 4.3% 4.3% 4.1% 4.1% 4.5% 4.5% 1,350 250 1,354 245
T-49 KDX Residence NihombashiHamacho F 1,170 1,170 - 4.2% 4.2% 4.0% 4.0% 4.4% 4.4% 996 174 1,008 161
T-50 KDX Residence NihombashiNingyocho F 643 643 - 4.4% 4.4% 4.2% 4.2% 4.6% 4.6% 530 113 566 76
T-51 KDX Residence Jiyugaoka F 1,500 1,500 - 4.1% 4.1% 3.9% 3.9% 4.3% 4.3% 1,268 232 1,327 172
T-52 KDX Residence Togoshi F 4,500 4,520 20 4.3% 4.3% 4.1% 4.1% 4.5% 4.5% 3,745 775 3,782 737
T-53 KDX Residence Shinagawa Seaside F 3,090 3,100 10 4.3% 4.3% 4.1% 4.1% 4.5% 4.5% 2,593 507 2,612 487
T-54 KDX Residence Ojima F 2,160 2,160 - 4.4% 4.4% 4.2% 4.2% 4.6% 4.6% 1,857 303 1,861 298
T-55 KDX Residence Oyama F 3,120 3,120 - 4.6% 4.6% 4.4% 4.4% 4.8% 4.8% 2,679 441 2,684 435
Note 1: Regarding Appraisers, “F” means Japan Real Estate Institute, “D” means Daiwa Real Estate Appraisal co., ltd., “M” means Morii Appraisal & Investment Consulting Inc. and “T” means The Tanizawa Sogo Appraisal Co., Ltd. Appraisal values arerounded down to the nearest ¥mln. Contents of the real estate appraisal are opinions and judgements at the time of evaluation(Previous; [T-1~78 and R-1~42; July 31, 2017, R-43; June 1,2017],12th Period; January 31, 2018), and do notguarantee the validity, accuracy and the possibility of sales at appraisal values. Subtotal and Total of “Cap Rate”, “Discount Rate” and “Terminal Cap Rate” are calculated by the weighted average by the appraisal value. For properties for whichmultiple discount rates are set per fiscal period, the value for the first fiscal period in which a discount rate was applied is shown above.

60
Appendices
Appraisal Values 3/5
Appraisal Value Cap Rate Discount Rate Terminal Cap Rate
No. Property Name Appraiser Previous End of the 12th Period Difference Previous End of the
12th Period Previous End of the 12th Period Previous End of the
12th PeriodAcquisition
Price Difference Book Value Difference
a B c [b-a] d e [b-d] f g [b-f]
Tokyo Metropolitan A
rea
T-56 KDX Residence Hanzomon F 5,470 5,470 - 4.2% 4.2% 3.9% 3.9% 4.3% 4.3% 4,832 638 4,982 487
T-57 B-Site Akihabara F 942 941 -1 4.3% 4.3% 4.1% 4.1% 4.5% 4.5% 850 91 869 71
T-58 KDX Residence Kagurazaka Dori(2) F 1,520 1,620 100 4.2% 4.0% 4.0% 3.8% 4.3% 4.2% 1,360 260 1,389 230
T-59 KDX Residence Sendagi F 2,360 2,360 - 4.3% 4.3% 4.1% 4.1% 4.5% 4.5% 2,200 160 2,377 -17
T-60 KDX Residence Seijo F 1,520 1,520 - 4.3% 4.3% 4.1% 4.1% 4.5% 4.5% 1,400 120 1,431 88
T-61 KDX Residence Akihabara F 1,430 1,430 - 4.3% 4.3% 4.1% 4.1% 4.5% 4.5% 1,250 180 1,266 163
T-62 KDX Residence Iriya F 1,300 1,300 - 4.5% 4.5% 4.3% 4.3% 4.7% 4.7% 1,062 238 1,079 220
T-63 KDX Residence Tachikawa F 3,410 3,410 - 4.5% 4.5% 4.3% 4.3% 4.7% 4.7% 3,026 383 3,045 364
T-64 KDX Residence Tsurumi F 1,380 1,380 - 5.1% 5.1% 4.9% 4.9% 5.3% 5.3% 1,050 330 1,129 250
T-65 KDX Residence Morishita Chitose M 1,170 1,200 30 4.4% 4.3% 4.2% 4.1% 4.6% 4.5% 1,100 100 1,121 78
T-66 KDX Residence Akasaka F 1,530 1,530 - 4.0% 4.0% 3.8% 3.8% 4.2% 4.2% 1,150 380 1,203 326
T-67 KDX Residence Kanda F 1,020 1,020 - 4.1% 4.1% 3.9% 3.9% 4.3% 4.3% 700 320 733 286
T-68 KDX Residence Ebisu F 3,880 3,880 - 4.0% 4.0% 3.8% 3.8% 4.2% 4.2% 2,845 1,035 2,972 907
T-69 KDX Residence Nishi-magome F 1,180 1,180 - 4.3% 4.3% 4.1% 4.1% 4.5% 4.5% 1,130 50 1,184 -4
T-70 KDX Residence Nishi-azabu F 1,440 1,450 10 4.1% 4.1% 3.9% 3.9% 4.3% 4.3% 1,224 226 1,248 201
T-71 KDX Residence Azabu Sendaizaka F 924 929 5 4.1% 4.1% 3.9% 3.9% 4.3% 4.3% 792 136 810 118
T-72 KDX Residence Waseda Tsurumaki F 778 778 - 4.2% 4.2% 4.0% 4.0% 4.4% 4.4% 561 217 574 203
T-73 KDX Residence Bunkyo Yushima F 890 892 2 4.2% 4.2% 4.0% 4.0% 4.4% 4.4% 695 197 710 181
T-74 KDX Residence Kamishakujii F 750 750 - 4.6% 4.6% 4.4% 4.4% 4.8% 4.8% 648 102 665 84
T-75 KDX Residence Shin-otsuka F 922 922 - 4.3% 4.3% 4.1% 4.1% 4.5% 4.5% 764 158 785 136
T-76 KDX Residence Sakurajosui F 1,100 1,100 - 4.2% 4.2% 4.0% 4.0% 4.4% 4.4% 894 206 919 180
T-77 KDX Residence Ryogoku F 1,050 1,050 - 4.2% 4.2% 4.0% 4.0% 4.4% 4.4% 842 208 868 181
T-78 KDX Residence Toyosu T 7,620 7,640 20 4.2% 4.2% 4.3% 4.4% 4.4% 4.4% 7,500 140 7,818 -178
Subtotal / Average 134,195 134,473 278 4.3% 4.3% 4.2% 4.2% 4.6% 4.6% 114,781 19,691 116,007 18,465
Note 1: Regarding Appraisers, “F” means Japan Real Estate Institute, “D” means Daiwa Real Estate Appraisal co., ltd., “M” means Morii Appraisal & Investment Consulting Inc. and “T” means The Tanizawa Sogo Appraisal Co., Ltd. Appraisal values arerounded down to the nearest ¥mln. Contents of the real estate appraisal are opinions and judgements at the time of evaluation(Previous; [T-1~78 and R-1~42; July 31, 2017, R-43; June 1,2017],12th Period; January 31, 2018), and do notguarantee the validity, accuracy and the possibility of sales at appraisal values. Subtotal and Total of “Cap Rate”, “Discount Rate” and “Terminal Cap Rate” are calculated by the weighted average by the appraisal value. For properties for whichmultiple discount rates are set per fiscal period, the value for the first fiscal period in which a discount rate was applied is shown above.
Note 2: “Bureau Kagurazaka” was changed into “KDX Residence Kagurazaka Dori” on February 5, 2018.
(in millions of yen)

61
Appendices
Appraisal Values 4/5
(in millions of yen)Appraisal Value Cap Rate Discount Rate Terminal Cap Rate
No. Property Name Appraiser Previous End of the 12th Period Difference Previous End of the
12th Period Previous End of the 12th Period Previous End of the
12th PeriodAcquisition
Price Difference Book Value Difference
a b c [b-a] d e [b-d] f g [b-f]
Other
Regional Areas
R-2 KDX JozenjiDori Residence D 1,260 1,270 10 5.1% 5.1% 4.9% 4.9% 5.3% 5.3% 1,015 255 965 304
R-3 KDX Izumi Residence F 1,290 1,300 10 4.7% 4.7% 4.5% 4.5% 4.9% 4.9% 1,120 180 1,074 225
R-4 KDX Chihaya Residence F 1,350 1,350 - 4.8% 4.8% 4.6% 4.6% 5.0% 5.0% 1,080 270 1,025 324
R-5 KDX Sakaisuji HommachiResidence F 3,150 3,150 - 4.7% 4.7% 4.5% 4.5% 4.9% 4.9% 2,910 240 2,773 376
R-6 KDX Shimmachi Residence F 1,200 1,200 - 4.8% 4.8% 4.6% 4.6% 5.0% 5.0% 1,015 185 962 237
R-7 KDX Takarazuka Residence F 1,780 1,780 - 4.8% 4.8% 4.6% 4.6% 5.0% 5.0% 1,510 270 1,401 378
R-8 KDX Shimizu Residence F 1,950 1,950 - 5.0% 5.0% 4.8% 4.8% 5.2% 5.2% 1,680 270 1,599 350
R-9 KDX Residence Odori Koen F 899 901 2 5.1% 5.1% 4.9% 4.9% 5.3% 5.3% 765 136 741 159
R-10 KDX Residence Kikusui Yojo F 1,000 1,000 - 5.3% 5.3% 5.1% 5.1% 5.5% 5.5% 830 170 807 192
R-11 KDX Residence Toyohira Koen F 529 529 - 5.4% 5.4% 5.2% 5.2% 5.6% 5.6% 445 84 434 94
R-13 KDX Residence Ichiban-cho D 683 683 - 5.1% 5.1% 4.9% 4.9% 5.3% 5.3% 530 153 515 167
R-14 KDX Residence Kotodai D 562 562 - 5.1% 5.1% 4.9% 4.9% 5.3% 5.3% 520 42 508 53
R-15 KDX Residence Izumi Chuo D 611 611 - 5.2% 5.2% 5.0% 5.0% 5.4% 5.4% 480 131 469 141
R-16 KDX Residence Higashi-sakura I F 2,700 2,700 - 4.8% 4.8% 4.6% 4.6% 5.0% 5.0% 2,350 350 2,299 400
R-17 KDX Residence Higashi-sakura II F 1,070 1,070 - 4.8% 4.8% 4.6% 4.6% 5.0% 5.0% 900 170 884 185
R-18 KDX Residence Jingumae F 1,040 1,040 - 5.1% 5.1% 4.9% 4.9% 5.3% 5.3% 840 200 817 222
R-19 KDX Residence Nishi-oji D 925 925 - 4.8% 4.8% 4.6% 4.6% 5.0% 5.0% 813 112 797 127
R-20 KDX Residence Saiin D 498 498 - 4.8% 4.8% 4.6% 4.6% 5.0% 5.0% 440 58 430 67
R-21 KDX Residence Namba F 1,630 1,630 - 5.0% 5.0% 4.8% 4.8% 5.2% 5.2% 1,410 220 1,388 241
R-22 KDX Residence Namba-minami F 1,560 1,560 - 5.0% 5.0% 4.8% 4.8% 5.2% 5.2% 1,350 210 1,314 245
R-23 KDX Residence Shin-osaka F 578 578 - 5.1% 5.1% 4.9% 4.9% 5.3% 5.3% 510 68 491 86
R-24 KDX Residence Ibaraki I・II F 1,387 1,387 - 5.2% 5.2% 5.0% 5.0% 5.4% 5.4% 1,275 112 1,287 99
R-25 KDX Residence Toyonaka-minami F 840 840 - 5.2% 5.2% 5.0% 5.0% 5.4% 5.4% 740 100 706 133
R-26 KDX Residence Moriguchi F 640 640 - 5.1% 5.1% 4.9% 4.9% 5.3% 5.3% 551 89 532 107
R-27 KDX Residence Sannomiya F 1,290 1,290 - 4.7% 4.7% 4.5% 4.5% 4.9% 4.9% 1,080 210 1,059 230
R-28 Ashiya Royal Homes F 1,720 1,720 - 4.5% 4.5% 4.3% 4.3% 4.7% 4.7% 1,360 360 1,462 257
Note 1: Regarding Appraisers, “F” means Japan Real Estate Institute, “D” means Daiwa Real Estate Appraisal co., ltd., “M” means Morii Appraisal & Investment Consulting Inc. and “T” means The Tanizawa Sogo Appraisal Co., Ltd. Appraisal values arerounded down to the nearest ¥mln. Contents of the real estate appraisal are opinions and judgements at the time of evaluation(Previous; [T-1~78 and R-1~42; July 31, 2017, R-43; June 1,2017],12th Period; January 31, 2018), and do notguarantee the validity, accuracy and the possibility of sales at appraisal values. Subtotal and Total of “Cap Rate”, “Discount Rate” and “Terminal Cap Rate” are calculated by the weighted average by the appraisal value. For properties for whichmultiple discount rates are set per fiscal period, the value for the first fiscal period in which a discount rate was applied is shown above.

62
Appendices
Appraisal Values 5/5
Appraisal Value Cap Rate Discount Rate Terminal Cap Rate
No. Property Name Appraiser Previous End of the 12th Period Difference Previous End of the
12th Period Previous End of the 12th Period Previous End of the
12th PeriodAcquisition
Price Difference Book Value Difference
a b c [b-a] d e [b-d] f g [b-f]
Other
Regional Areas
R-29 KDX Residence Funairi Saiwai-cho F 662 664 2 5.7% 5.7% 5.5% 5.5% 5.9% 5.9% 588 76 569 94
R-30 KDX Residence Tenjin-higashi II F 851 851 - 5.0% 5.0% 4.8% 4.8% 5.2% 5.2% 680 171 664 186
R-32 KDX Residence Nishi Koen F 839 839 - 5.0% 5.0% 4.8% 4.8% 5.2% 5.2% 763 76 745 93
R-33 KDX Residence Hirao Josui-machi F 862 867 5 4.8% 4.8% 4.6% 4.6% 5.0% 5.0% 760 107 751 115
R-34 Melody Heim Gotenyama F 510 510 - 5.6% 5.6% 5.4% 5.4% 5.8% 5.8% 400 110 430 79
R-35 Leopalace Flat Shin-sakae M 4,170 4,260 90 4.8% 4.7% 4.7% 4.6% 5.0% 4.9% 3,500 760 3,592 667
R-36 KDX Residence Konan Yamate F 1,120 1,120 - 4.7% 4.7% 4.5% 4.5% 4.9% 4.9% 973 147 981 138
R-37 KDX Residence Hommachibashi F 3,450 3,450 - 4.7% 4.7% 4.5% 4.5% 4.9% 4.9% 3,201 249 3,218 231
R-38 KDX Residence Minami-kusatsu D 2,290 2,290 - 5.5% 5.5% 5.3% 5.3% 5.7% 5.7% 1,974 315 2,024 265
R-39 KDX Residence Ohori Harbor View Tower D 5,210 5,210 - 4.8% 4.8% 4.6% 4.6% 5.0% 5.0% 4,606 603 4,671 538
R-40 KDX Residence Minami-sanjo F 1,550 1,560 10 5.0% 5.0% 4.8% 4.8% 5.2% 5.2% 915 645 952 607
R-41 Serenite Kita-kyuhoji M 1,440 1,470 30 4.5% 4.4% 4.3% 4.2% 4.7% 4.6% 1,290 179 1,308 161
R-42 Serenite Nishinomiya Hommachi T 739 739 - 5.0% 5.0% 5.1% 5.1% 5.2% 5.2% 617 121 657 81
R-43 KDX Residence Nishijin T 1,670 1,670 - 4.9% 4.9% 5.0% 5.0% 5.1% 5.1% 1,600 70 1,712 -42
Subtotal / Average 57,505 57,664 159 4.9% 4.9% 4.7% 4.7% 5.1% 5.1% 49,387 8,276 49,033 8,630
Total / Average 191,700 192,137 437 4.5% 4.5% 4.3% 4.3% 4.7% 4.7% 164,169 27,967 165,040 27,096
(in millions of yen)
Note 1: Regarding Appraisers, “F” means Japan Real Estate Institute, “D” means Daiwa Real Estate Appraisal co., ltd., “M” means Morii Appraisal & Investment Consulting Inc. and “T” means The Tanizawa Sogo Appraisal Co., Ltd. Appraisal values arerounded down to the nearest ¥mln. Contents of the real estate appraisal are opinions and judgements at the time of evaluation(Previous; [T-1~78 and R-1~42; July 31, 2017, R-43; June 1,2017],12th Period; January 31, 2018), and do notguarantee the validity, accuracy and the possibility of sales at appraisal values. Subtotal and Total of “Cap Rate”, “Discount Rate” and “Terminal Cap Rate” are calculated by the weighted average by the appraisal value. For properties for whichmultiple discount rates are set per fiscal period, the value for the first fiscal period in which a discount rate was applied is shown above.

63
Appendices
Appraisal Values (JSL)
Appraisal Value Cap Rate Discount Rate Terminal Cap RateBefore the Merger After the Merger
No. Property Name Appraiser Aug. 2017 Appraiser Mar. 2018 Difference Before the Merger
As of the Merger
Before the Merger
As of the Merger
Before the Merger
As of the Merger
a b c [b-a]
Healthcare facilities
H-1 Irise Kamata/Yuseien F 1,190 D 1,120 -70 4.5% 4.7% 4.3% 4.5% 4.7% 4.9%
H-2 Nichii Home Nakano-Minamidai F 2,020 D 1,780 -240 4.2% 4.4% 4.0% 4.2% 4.4% 4.6%
H-3 Joy Stage Hachioji F 3,890 T 3,690 -200 5.2% 5.3% 5.0% 5.2% 5.4% 5.5%
H-4 Yuimaru Hijirigaoka T 1,330 F 1,120 -210 4.6% 5.0% 4.6% 4.8% 4.8% 5.2%
H-5 Nichii Home Tama Plaza F 2,810 D 2,940 130 4.9% 5.1% 4.7% 4.9% 5.1% 5.3%
H-6 Ten F 2,600 T 2,630 30 6.2% 6.1% 6.0% 6.2% 6.4% 6.3%
H-7 Irise Nishioka T 890 F 858 -32 5.0% 5.3% 5.0% 5.1% 5.2% 5.5%
H-8 Joy Stage Hachioji T 1,790 F 1,660 -130 5.1% 6.1% 5.1% 5.9% 5.3% 6.3%
H-9 Sawayaka Sakura Nibankan F 1,030 D 989 -41 5.5% 5.6% 5.3% 5.4% 5.7% 5.8%
H-10 Activa Biwa F 7,310 T 6,560 -750 5.4% 5.7% 5.2% 5.8% 5.6% 5.9%
H-11 Sompo Care LAVIERE Kobe Tarumi F 2,060 T 2,110 50 5.0% 4.9% 4.8% 4.9% 5.2% 5.1%
H-12 Granda Mondo Yakujin T 1,240 F 1,190 -50 4.7% 4.9% 4.7% 4.6% 4.9% 5.1%
H-13 Excellent Nishinomiya F 932 T 971 39 5.2% 5.0% 5.0% 5.0% 5.4% 5.2%
H-14 Gran Hills Ogawarako F 1,430 T 1,380 -50 6.9% 7.2% 6.7% 7.1% 7.1% 7.4%
Subtotal / Average 30,522 28,998 -1,524 5.2% 5.4% 5.1% 5.4% 5.4% 5.6%
Note 1: Regarding Appraisers, “F” means Japan Real Estate Institute, “D” means Daiwa Real Estate Appraisal co., ltd., “M” means Morii Appraisal & Investment Consulting Inc. and “T” means The Tanizawa Sogo Appraisal Co., Ltd. Appraisal values arerounded down to the nearest ¥mln. Contents of the real estate appraisal are opinions and judgements at the time of evaluation (Before the Merger: August 31, 2017, As of the Merger: March 1, 2018) and do not guarantee the validity, accuracyand the possibility of sales at appraisal values. Subtotal and Total of “Cap Rate”, “Discount Rate” and “Terminal Cap Rate” are calculated by the weighted average by the appraisal value. For properties for which multiple discount rates are set perfiscal period, the value for the first fiscal period in which a discount rate was applied is shown above.
(in millions of yen)

64
Appendices
Note 1: NOI=Operating Revenues – Operating Expenses(ex. Depreciation) (Rounded down to the nearest one decimal places)Note 2: Replacement=New tenants during the operating period / Rentable Units Note 3: Turnover=Exiting tenants during the operating period / Rentable Units
Summary of Portfolio Performance
7th fiscal period 8th fiscal period 9th fiscal period 10th fiscal period 11th fiscal period 12th fiscal period(as of Jul. 31, 2015) (as of Jan. 31, 2016) (as of Jul. 31, 2016) (as of Jan. 31, 2017) (as of Jul. 31, 2017) (as of Jan. 31, 2018)
Number of Properties 103 props 105 props 105 props 113 props 113 props 115 propsProperties Acquired during the period 12 props 5 props 0 props 10 props 0 props 2 propsProperties Transferred during the period 1 Props 3 Props 0 Props 2 Props 0 Props 0 PropsTotal Acquisition Price 145,873 million 148,184 million 148,184 million 155,069 million 155,069 million 164,169 millionTotal Book Value 148,872 million 150,906 million 150,211 million 156,805 million 156,161 million 165,040 millionTotal Appraisal Value 163,849 million 169,702 million 170,538 million 180,618 million 182,410 million 192,137 millionRentable Units 7,080 units 7,243 units 7,243 units 7,518 units 7,518 units 7,888 unitsRentable Area 280,436.94 m2 286,310.51 m2 286,310.51 m2 292,324.33 m2 292,324.33 m2 303,608.43 m2
Leasing Business Revenues 5,170 million 5,208 million 5,329 million 5,437 million 5,574 million 5,671 millionLeasing Business Expenses (ex. Depreciation) 1,125 million 1,084 million 1,175 million 1,172 million 1,239 million 1,185 millionNOI (Net Operating Income)(1) 4,044 million 4,124 million 4,153 million 4,265 million 4,335 million 4,486 millionNOI Cap Rate (per year) 5.6 % 5.6 % 5.6 % 5.5 % 5.6 % 5.4 %Capital Expenditure 146 million 167 million 163 million 220 million 241 million 286 millionDepreciation 827 million 852 million 857 million 878 million 884 million 921 millionDepreciation Rate (per acquisition price, year) 1.1 % 1.1 % 1.2 % 1.1 % 1.2 % 1.1 %NOI Cap Rate after Depreciation (per year) 4.5 % 4.4 % 4.5 % 4.4 % 4.5 % 4.3 %Occupancy Rates (average during the period) 95.8 % 95.4 % 96.3 % 95.7 % 96.7 % 96.7 %Occupancy Rates (at the end of the period) 96.2 % 96.0 % 95.9 % 96.2 % 96.8 % 97.0 %Rent per Tsubo (average during the period) 9,802 per tsubo 9,752 per tsubo 9,783 per tsubo 9,942 per tsubo 10,003 per tsubo 9,965 per tsuboRent per Tsubo (at the end of the period) 9,824 per tsubo 9,760 per tsubo 9,798 per tsubo 9,996 per tsubo 10,005 per tsubo 9,969 per tsuboReplacement Rate (2) 14.2 % 11.3 % 13.0 % 11.4 % 13.4 % 10.6 %Turnover Rate (3) 13.6 % 9.8 % 13.5 % 10.2 % 12.6 % 10.7 %Renewal Rate (average during the period) (4) 87.8 % 89.5 % 89.3 % 89.6 % 88.8 % 90.3 %Average Occupancy Period(5) 1,090 days 1,066 days 1,140 days 1,157 days 1,207 days 1,202 daysAverage Downtime(6) 67 days 80 days 64 days 80 days 64 days 69 days
Trends in Portfolio Performance
Note 4: Renewal Rate=Renewal tenants during the operating period / Ending contracts during the operating period Note 5: Average Occupancy Period is based on exiting tenants during the operating periodNote 6: Average Downtime is based on new tenants during the operating period

65
Appendices
Portfolio Performance in 2H 2017 1/5
No. Property Name Acquisition Price
BookValue
Appraisal Value Type(1)
Rentable Units
RentableArea
Rented Area
Occupancy Rate
Operating Days
Leasing Business Revenues
Leasing Business Expenses
NOI DepreciationLeasing BusinessIncome
NOI Cap Rate
NOI Cap Rate after
Depreciation(unit) (m2) (m2) (%) (days) a b c [a-b] d e [c-d] (per year) (per year)
TokyoM
etropolitan Area
T-1 KDX Daikanyama Residence 4,700,000 4,721,258 5,680,000 SF 86 5,338.99 5,244.35 98.2% 184 159,975 25,476 134,498 15,857 118,641 5.7% 5.0%
T-3 KDX Odemma Residence 1,775,000 1,731,059 1,990,000 SF 54 2,353.23 2,353.23 100.0% 184 57,810 12,083 45,726 10,666 35,059 5.1% 3.9%
T-4 KDX Iwamoto-cho Residence 822,000 800,973 928,000 SF 36 1,131.24 1,108.68 98.0% 184 27,540 7,198 20,341 5,241 15,100 4.9% 3.6%
T-5 KDX Bunkyo Sengoku Residence 1,488,000 1,468,860 1,710,000 S 77 2,054.10 2,054.10 100.0% 184 50,874 12,195 38,679 6,513 32,166 5.2% 4.3%
T-6 KDX Azumabashi Residence 650,000 624,003 849,000 S 41 1,054.83 1,054.83 100.0% 184 25,340 4,529 20,811 4,899 15,912 6.4% 4.9%
T-7 KDX Shimura Sakaue Residence 2,830,000 2,718,544 3,250,000 F 85 6,117.48 6,117.48 100.0% 184 103,181 19,927 83,253 21,485 61,768 5.8% 4.3%
T-9 Cosmo Heim Motosumiyoshi(land) 1,750,000 1,798,041 1,790,000 - - - - - 184 43,749 1,256 42,493 0 42,493 4.8% 4.8%
T-10 KDX Musashi Nakahara Residence 637,000 637,893 713,000 F 35 2,123.46 2,002.46 94.3% 184 24,830 6,559 18,271 3,604 14,666 5.7% 4.6%
T-11 KDX Chiba Chuo Residence 1,480,000 1,367,236 1,750,000 S 106 3,546.91 3,388.11 95.5% 184 60,539 14,605 45,934 17,226 28,707 6.2% 3.8%
T-12 KDX Kawaguchi Saiwai-choResidence 1,150,000 1,128,250 1,350,000 SF 61 2,491.66 2,449.77 98.3% 184 48,148 9,971 38,177 7,261 30,915 6.6% 5.3%
T-13 KDX Residence Shirokane I 3,000,000 3,019,567 3,430,000 SF 50 3,617.32 3,575.44 98.8% 184 108,351 31,864 76,486 7,703 68,782 5.1% 4.5%
T-15 KDX Residence Shirokane II 2,800,000 2,812,225 3,340,000 S 85 2,889.66 2,854.89 98.8% 184 90,659 16,907 73,751 6,673 67,077 5.2% 4.8%
T-16 KDX Residence Minami-aoyama 2,230,000 2,244,386 2,470,000 SF 20 1,680.79 1,190.11 70.8% 184 51,269 10,771 40,497 3,241 37,256 3.6% 3.3%
T-17 KDX Residence Minami-azabu 2,080,000 2,082,865 2,530,000 SF 62 2,785.42 2,730.82 98.0% 184 73,715 13,698 60,016 6,865 53,151 5.7% 5.1%
T-18 KDX Residence Shiba Koen 1,781,000 1,776,543 2,220,000 SF 64 2,507.52 2,443.72 97.5% 184 63,622 10,464 53,158 5,777 47,380 5.9% 5.3%
T-19 KDX Residence Azabu East 1,560,000 1,559,740 1,910,000 S 76 1,849.00 1,827.99 98.9% 184 55,810 10,447 45,363 6,152 39,210 5.8% 5.0%
T-20 KDX Residence Takanawa 770,000 770,051 987,000 SF 27 1,034.27 1,007.18 97.4% 184 26,659 7,181 19,477 2,765 16,711 5.0% 4.3%
T-21 KDX Residence Nishihara 1,450,000 1,456,237 1,870,000 SF 39 2,310.08 2,310.08 100.0% 184 48,661 12,158 36,502 5,805 30,697 5.0% 4.2%
T-22 KDX Residence Daikanyama II 730,000 762,484 928,000 F 17 985.10 985.10 100.0% 184 27,891 6,490 21,400 1,262 20,137 5.8% 5.5%
T-23 KDX Residence Sendagaya 650,000 645,838 788,000 SF 16 748.96 748.96 100.0% 184 21,990 5,167 16,822 2,804 14,018 5.1% 4.3%
T-24 KDX Residence NihombashiSuitengu 3,240,000 3,205,061 3,870,000 F 79 5,534.86 5,534.86 100.0% 184 97,101 10,460 86,641 17,764 68,876 5.3% 4.2%
T-25 KDX Residence NihombashiHakozaki 1,147,000 1,174,448 1,330,000 S 60 1,537.38 1,516.87 98.7% 184 40,126 11,020 29,105 6,547 22,558 5.0% 3.9%
T-26 KDX Residence Higashi-shinjuku 3,270,000 3,250,543 3,890,000 S 179 4,358.43 4,218.00 96.8% 184 110,561 20,331 90,229 11,563 78,666 5.5% 4.8%
T-27 KDX Residence Yotsuya 2,260,000 2,261,479 2,590,000 F 42 3,101.16 3,101.16 100.0% 184 78,944 16,786 62,158 9,293 52,864 5.5% 4.6%
T-28 KDX Residence Nishi-shinjuku 1,000,000 1,003,253 1,250,000 S 54 1,345.92 1,318.50 98.0% 184 34,369 7,670 26,699 3,877 22,821 5.3% 4.5%
T-29 KDX Residence Kagurazaka 720,000 716,043 870,000 S 34 890.93 865.97 97.2% 184 24,498 4,602 19,896 3,320 16,576 5.5% 4.6%
(in thousands of yen)
Note 1: Type means principal room type of the property (If applicable to some types, type of the largest footprint unit)Single (S): (intended primarily for single-person households) [footprint of equal or more than 18m2 and less than 30m2 and more than 20 rentable units per property], Small Family (SF): (intended primarily for households of couples or familieswith infants) [footprint of equal or more than 30m2 and less than 60m2 and more than 15 rentable units per property], Family (F): (intended primarily for households of three or more families) [ footprint of equal or more than 60m2 and morethan 5 rentable units per property]

66
Appendices
Portfolio Performance in 2H 2017 2/5
No. Property Name Acquisition Price
BookValue
Appraisal Value Type(1)
Rentable Units
RentableArea
Rented Area
Occupancy Rate
Operating Days
Leasing Business Revenues
Leasing Business Expenses
NOI DepreciationLeasing BusinessIncome
NOI Cap Rate
NOI Cap Rate after
Depreciation(unit) (m2) (m2) (%) (days) a b c [a-b] d e [c-d] (per year) (per year)
TokyoM
etropolitan Area
T-30 KDX Residence Futako Tamagawa 1,250,000 1,276,891 1,420,000 F 38 2,339.62 2,339.62 100.0% 184 43,154 7,991 35,163 4,555 30,607 5.6% 4.9%
T-31 KDX Residence Komazawa Koen 920,000 915,121 1,070,000 SF 32 1,020.18 974.47 95.5% 184 28,664 6,438 22,225 4,654 17,570 4.8% 3.8%
T-32 KDX Residence Misyuku 760,000 760,411 888,000 S 39 1,103.82 1,078.33 97.7% 184 26,531 5,793 20,737 3,112 17,625 5.4% 4.6%
T-33 KDX Residence Yoga 700,000 700,802 835,000 S 38 1,012.80 911.52 90.0% 184 23,700 5,026 18,674 2,607 16,066 5.3% 4.6%
T-34 KDX Residence Shimouma 600,000 604,240 727,000 S 29 829.05 829.05 100.0% 184 20,578 5,875 14,703 2,250 12,453 4.9% 4.1%
T-35 Raffine Minami-magome 1,250,000 1,247,076 1,450,000 S 56 2,408.56 2,408.56 100.0% 184 46,452 3,091 43,360 3,315 40,045 6.9% 6.4%
T-36 KDX Residence Yukigaya Otsuka 1,050,000 1,039,031 1,280,000 S 72 1,526.98 1,506.42 98.7% 184 39,188 9,252 29,935 5,445 24,490 5.7% 4.6%
T-37 KDX Residence Denen Chofu 1,000,000 1,055,092 1,190,000 F 36 2,359.44 2,359.44 100.0% 184 38,747 5,557 33,190 4,115 29,074 6.6% 5.8%
T-38 KDX Residence Tamagawa 776,000 755,912 901,000 S 52 1,170.40 1,148.50 98.1% 184 28,573 5,462 23,111 5,892 17,219 5.9% 4.4%
T-39 KDX Residence Monzennakacho 773,000 770,744 938,000 S 49 1,171.41 1,123.47 95.9% 184 27,651 8,034 19,616 3,971 15,644 5.0% 4.0%
T-40 KDX Residence Okachimachi 850,000 846,892 1,020,000 S 51 1,329.79 1,329.79 100.0% 184 29,932 4,768 25,164 3,768 21,396 5.9% 5.0%
T-41 KDX Residence Moto-asakusa 800,000 799,207 968,000 SF 44 1,314.91 1,261.28 95.9% 184 29,478 7,686 21,791 4,473 17,318 5.4% 4.3%
T-42 KDX Residence Itabashi Honcho 620,000 610,491 727,000 S 46 1,127.58 1,083.40 96.1% 184 23,241 5,107 18,134 4,209 13,924 5.8% 4.5%
T-43 KDX Residence Azusawa 550,000 560,496 635,000 S 39 989.82 989.82 100.0% 184 20,458 5,599 14,859 3,353 11,506 5.4% 4.1%
T-44 KDX Residence Tobu Nerima 420,000 407,214 496,000 S 37 931.82 931.82 100.0% 184 17,299 4,156 13,142 3,770 9,371 6.2% 4.4%
T-45 KDX Residence Yokohama Kannai 800,000 787,570 960,000 S 72 1,602.16 1,554.11 97.0% 184 34,871 9,277 25,593 5,945 19,648 6.3% 4.9%
T-46 KDX Residence Miyamaedaira 999,000 999,800 1,130,000 F 40 2,448.27 2,387.52 97.5% 184 36,269 9,074 27,194 4,708 22,485 5.4% 4.5%
T-47 KDX Residence Machida 1,800,000 1,745,279 1,990,000 F 52 3,832.53 3,832.53 100.0% 184 58,756 15,792 42,963 14,894 28,068 4.7% 3.1%
T-48 KDX Residence Kinshicho 1,350,000 1,354,922 1,600,000 F 33 2,024.81 2,024.81 100.0% 184 43,874 8,721 35,153 6,907 28,245 5.2% 4.2%
T-49 KDX Residence NihombashiHamacho 996,000 1,008,604 1,170,000 F 28 1,756.27 1,756.27 100.0% 184 30,200 5,012 25,187 4,119 21,068 5.0% 4.2%
T-50 KDX Residence NihombashiNingyocho 530,000 566,600 643,000 S 27 877.14 877.14 100.0% 184 18,875 4,212 14,663 2,225 12,438 5.5% 4.7%
T-51 KDX Residence Jiyugaoka 1,268,000 1,327,831 1,500,000 SF 48 1,637.00 1,599.23 97.7% 184 39,176 7,849 31,327 4,182 27,144 4.9% 4.2%
T-52 KDX Residence Togoshi 3,745,000 3,782,966 4,520,000 SF 144 4,591.76 4,441.03 96.7% 184 119,543 22,570 96,973 17,032 79,940 5.1% 4.2%
T-53 KDX Residence Shinagawa Seaside 2,593,000 2,612,131 3,100,000 S 127 3,314.75 3,217.69 97.1% 184 86,087 16,054 70,032 12,789 57,243 5.4% 4.4%
T-54 KDX Residence Ojima 1,857,000 1,861,433 2,160,000 S 117 2,372.67 2,372.67 100.0% 184 63,293 14,709 48,583 11,049 37,534 5.2% 4.0%
T-55 KDX Residence Oyama 2,679,000 2,684,971 3,120,000 SF 145 4,009.07 3,820.02 95.3% 184 90,645 15,285 75,359 16,586 58,772 5.6% 4.4%
Note 1: Type means principal room type of the property (If applicable to some types, type of the largest footprint unit)Single (S): (intended primarily for single-person households) [footprint of equal or more than 18m2 and less than 30m2 and more than 20 rentable units per property], Small Family (SF): (intended primarily for households of couples or familieswith infants) [footprint of equal or more than 30m2 and less than 60m2 and more than 15 rentable units per property], Family (F): (intended primarily for households of three or more families) [ footprint of equal or more than 60m2 and morethan 5 rentable units per property]
(in thousands of yen)

67
Appendices
Portfolio Performance in 2H 2017 3/5
No. Property Name Acquisition Price
BookValue
Appraisal Value Type(1)
Rentable Units
RentableArea
Rented Area
Occupancy Rate
Operating Days
Leasing Business Revenues
Leasing Business Expenses
NOI DepreciationLeasing BusinessIncome
NOI Cap Rate
NOI Cap Rate after
Depreciation(unit) (m2) (m2) (%) (days) a b c [a-b] d e [c-d] (per year) (per year)
TokyoM
etropolitan Area
T-56 KDX Residence Hanzomon 4,832,000 4,982,285 5,470,000 F 85 4,854.23 4,854.23 100.0% 184 130,077 25,554 104,523 14,215 90,307 4.3% 3.7%
T-57 B-Site Akihabara 850,000 869,501 941,000 S 52 1,254.50 1,254.50 100.0% 184 23,882 2,898 20,983 2,513 18,470 4.9% 4.3%
T-58 KDX Residence Kagurazaka Dori(2) 1,360,000 1,389,961 1,620,000 S 70 1,809.84 1,809.84 100.0% 184 39,000 7,787 31,212 3,659 27,552 4.6% 4.0%
T-59 KDX Residence Sendagi 2,200,000 2,377,478 2,360,000 F 40 3,159.89 3,159.89 100.0% 184 64,419 12,636 51,782 8,726 43,056 4.7% 3.9%
T-60 KDX Residence Seijo 1,400,000 1,431,110 1,520,000 SF 38 2,198.56 2,144.19 97.5% 184 40,279 8,825 31,454 4,595 26,858 4.5% 3.8%
T-61 KDX Residence Akihabara 1,250,000 1,266,345 1,430,000 SF 32 1,929.61 1,871.70 97.0% 184 39,287 6,895 32,392 6,591 25,800 5.1% 4.1%
T-62 KDX Residence Iriya 1,062,000 1,079,572 1,300,000 S 57 1,899.29 1,872.15 98.6% 184 38,859 7,277 31,581 6,175 25,406 5.9% 4.7%
T-63 KDX Residence Tachikawa 3,026,200 3,045,942 3,410,000 S 174 4,314.87 3,996.56 92.6% 184 98,675 15,629 83,046 21,053 61,992 5.4% 4.1%
T-64 KDX Residence Tsurumi 1,050,000 1,129,419 1,380,000 SF 59 3,499.84 3,499.84 100.0% 184 52,126 9,981 42,145 6,975 35,169 8.0% 6.6%
T-65 KDX Residence Morishita Chitose 1,100,000 1,121,729 1,200,000 S 65 1,614.28 1,572.06 97.4% 184 38,221 9,938 28,283 5,665 22,618 5.1% 4.1%
T-66 KDX Residence Akasaka 1,150,000 1,203,643 1,530,000 SF 28 1,180.71 1,140.44 96.6% 184 37,031 4,069 32,962 4,195 28,767 5.7% 5.0%
T-67 KDX Residence Kanda 700,000 733,067 1,020,000 SF 30 1,031.09 1,031.09 100.0% 184 27,160 4,831 22,329 3,682 18,646 6.3% 5.3%
T-68 KDX Residence Ebisu 2,845,000 2,972,924 3,880,000 SF 65 2,659.66 2,659.66 100.0% 184 96,735 13,213 83,522 11,268 72,254 5.8% 5.0%
T-69 KDX Residence Nishi-magome 1,130,000 1,184,662 1,180,000 S 47 1,297.27 1,246.79 96.1% 184 30,995 5,451 25,543 4,885 20,658 4.5% 3.6%
T-70 KDX Residence Nishi-azabu 1,224,000 1,248,857 1,450,000 SF 33 1,357.88 1,321.80 97.3% 184 38,828 7,452 31,376 3,848 27,527 5.1% 4.5%
T-71 KDX Residence Azabu Sendaizaka 792,300 810,185 929,000 S 30 878.50 878.50 100.0% 184 25,935 8,799 17,135 2,521 14,614 4.3% 3.7%
T-72 KDX Residence Waseda Tsurumaki 561,000 574,994 778,000 S 39 808.54 808.54 100.0% 184 21,147 6,722 14,424 2,968 11,456 5.1% 4.1%
T-73 KDX Residence Bunkyo Yushima 695,000 710,851 892,000 S 38 939.89 939.89 100.0% 184 25,038 4,349 20,688 3,111 17,576 5.9% 5.0%
T-74 KDX Residence Kamishakujii 648,000 665,462 750,000 S 47 1,032.18 967.77 93.8% 184 23,201 6,125 17,076 3,523 13,552 5.2% 4.1%
T-75 KDX Residence Shin-otsuka 764,000 785,830 922,000 S 40 872.00 872.00 100.0% 184 22,608 1,803 20,804 3,433 17,371 5.4% 4.5%
T-76 KDX Residence Sakurajosui 894,000 919,020 1,100,000 S 43 1,227.16 1,048.80 85.5% 184 27,441 5,702 21,738 4,116 17,622 4.8% 3.9%
T-77 KDX Residence Ryogoku 842,000 868,208 1,050,000 S 36 1,190.53 1,111.66 93.4% 184 27,796 4,796 22,999 4,392 18,606 5.4% 4.4%
T-78 KDX Residence Toyosu 7,500,000 7,818,097 7,640,000 S 242 6,811.38 6,811.38 100.0% 163 79,320 4,948 74,372 28,252 46,120 2.2% 1.4%
Subtotal / Average 114,781,500 116,007,784 134,473,000 4,366 160,313.01 157,034.45 98.0% 182.6 3,669,539 713,917 2,955,621 514,485 2,441,136 5.1% 4.3%
Note 1: Type means principal room type of the property (If applicable to some types, type of the largest footprint unit)Single (S): (intended primarily for single-person households) [footprint of equal or more than 18m2 and less than 30m2 and more than 20 rentable units per property], Small Family (SF): (intended primarily for households of couples or familieswith infants) [footprint of equal or more than 30m2 and less than 60m2 and more than 15 rentable units per property], Family (F): (intended primarily for households of three or more families) [ footprint of equal or more than 60m2 and morethan 5 rentable units per property]
Note 2: “Bureau Kagurazaka” was changed into “KDX Residence Kagurazaka Dori” on February 5, 2018.
(in thousands of yen)

68
Appendices
Portfolio Performance in 2H 2017 4/5
No. Property Name Acquisition Price
BookValue
Appraisal Value Type(1)
Rentable Units
RentableArea
Rented Area
Occupancy Rate
Operating Days
Leasing Business Revenues
Leasing Business Expenses
NOI DepreciationLeasing BusinessIncome
NOI Cap Rate
NOI Cap Rate after
Depreciation(unit) (m2) (m2) (%) (days) a b c [a-b] d e [c-d] (per year) (per year)
Other Regional A
reas
R-2 KDX JozenjiDori Residence 1,015,000 965,112 1,270,000 S 92 3,330.15 3,096.47 93.0% 184 48,735 11,940 36,795 10,350 26,444 7.2% 5.2%
R-3 KDX Izumi Residence 1,120,000 1,074,940 1,300,000 F 40 2,798.20 2,651.30 94.8% 184 42,417 10,797 31,619 9,164 22,455 5.6% 4.0%
R-4 KDX Chihaya Residence 1,080,000 1,025,309 1,350,000 SF 92 2,936.40 2,823.78 96.2% 184 48,038 10,487 37,550 10,014 27,536 6.9% 5.1%
R-5 KDX Sakaisuji HommachiResidence 2,910,000 2,773,523 3,150,000 SF 160 6,385.70 6,194.90 97.0% 184 107,651 22,814 84,836 23,761 61,075 5.8% 4.2%
R-6 KDX Shimmachi Residence 1,015,000 962,529 1,200,000 S 94 2,146.02 2,077.53 96.8% 184 37,295 11,251 26,043 8,995 17,048 5.1% 3.3%
R-7 KDX Takarazuka Residence 1,510,000 1,401,780 1,780,000 F 80 4,631.16 4,631.16 100.0% 184 58,399 9,173 49,226 16,534 32,692 6.5% 4.3%
R-8 KDX Shimizu Residence 1,680,000 1,599,346 1,950,000 SF 148 6,255.16 5,996.30 95.9% 184 70,579 17,102 53,476 14,202 39,274 6.3% 4.6%
R-9 KDX Residence Odori Koen 765,000 741,580 901,000 SF 78 2,762.76 2,692.30 97.4% 184 33,686 8,329 25,356 7,869 17,487 6.6% 4.5%
R-10 KDX Residence Kikusui Yojo 830,000 807,609 1,000,000 SF 84 3,413.06 3,222.67 94.4% 184 37,066 10,102 26,964 7,515 19,448 6.4% 4.6%
R-11 KDX Residence Toyohira Koen 445,000 434,396 529,000 SF 65 2,253.81 2,007.66 89.1% 184 21,557 8,510 13,046 4,397 8,649 5.8% 3.9%
R-13 KDX Residence Ichiban-cho 530,000 515,614 683,000 SF 45 1,818.09 1,768.79 97.3% 184 26,557 7,097 19,460 5,020 14,439 7.3% 5.4%
R-14 KDX Residence Kotodai 520,000 508,149 562,000 SF 27 1,475.73 1,475.73 100.0% 184 20,647 5,188 15,459 4,448 11,010 5.9% 4.2%
R-15 KDX Residence Izumi Chuo 480,000 469,483 611,000 SF 40 2,159.25 2,029.65 94.0% 184 22,524 5,387 17,137 4,505 12,632 7.1% 5.2%
R-16 KDX Residence Higashi-sakura I 2,350,000 2,299,213 2,700,000 SF 187 6,221.83 5,789.34 93.0% 184 97,370 30,062 67,307 17,785 49,522 5.7% 4.2%
R-17 KDX Residence Higashi-sakura II 900,000 884,913 1,070,000 SF 66 2,655.31 2,536.31 95.5% 184 38,560 12,983 25,577 6,991 18,585 5.6% 4.1%
R-18 KDX Residence Jingumae 840,000 817,338 1,040,000 SF 95 2,724.19 2,489.15 91.4% 184 38,711 12,499 26,212 7,321 18,890 6.2% 4.5%
R-19 KDX Residence Nishi-oji 813,000 797,545 925,000 S 76 2,353.55 2,283.76 97.0% 184 32,412 7,914 24,497 6,340 18,156 6.0% 4.4%
R-20 KDX Residence Saiin 440,000 430,552 498,000 S 49 1,094.81 1,072.39 98.0% 184 18,141 4,236 13,904 3,848 10,056 6.3% 4.5%
R-21 KDX Residence Namba 1,410,000 1,388,312 1,630,000 S 118 3,387.30 3,284.38 97.0% 184 56,446 14,979 41,466 9,965 31,501 5.8% 4.4%
R-22 KDX Residence Namba-minami 1,350,000 1,314,524 1,560,000 S 131 3,813.31 3,696.27 96.9% 184 56,076 11,548 44,528 11,786 32,741 6.5% 4.8%
R-23 KDX Residence Shin-osaka 510,000 491,618 578,000 SF 43 1,321.04 1,290.94 97.7% 184 20,183 6,533 13,649 5,192 8,457 5.3% 3.3%
R-24 KDX Residence Ibaraki I・II 1,275,000 1,287,952 1,387,000 F 61 4,701.87 4,548.39 96.7% 184 53,727 10,676 43,050 6,314 36,736 6.7% 5.7%
R-25 KDX Residence Toyonaka-minami 740,000 706,177 840,000 SF 70 2,024.50 1,935.59 95.6% 184 28,976 6,123 22,852 8,164 14,688 6.1% 3.9%
R-26 KDX Residence Moriguchi 551,000 532,122 640,000 F 28 1,942.78 1,942.78 100.0% 184 24,143 5,774 18,369 5,422 12,946 6.6% 4.7%
R-27 KDX Residence Sannomiya 1,080,000 1,059,652 1,290,000 S 86 2,292.72 2,292.72 100.0% 184 40,065 9,982 30,083 7,724 22,358 5.5% 4.1%
R-28 Ashiya Royal Homes 1,360,000 1,462,974 1,720,000 F 21 3,999.01 3,999.01 100.0% 184 66,564 17,573 48,990 4,738 44,252 7.1% 6.5%
Note 1: Type means principal room type of the property (If applicable to some types, type of the largest footprint unit)Single (S): (intended primarily for single-person households) [footprint of equal or more than 18m2 and less than 30m2 and more than 20 rentable units per property], Small Family (SF): (intended primarily for households of couples or familieswith infants) [footprint of equal or more than 30m2 and less than 60m2 and more than 15 rentable units per property], Family (F): (intended primarily for households of three or more families) [ footprint of equal or more than 60m2 and morethan 5 rentable units per property]
(in thousands of yen)

69
Appendices
Portfolio Performance in 2H 2017 5/5
No. Property Name Acquisition Price
BookValue
Appraisal Value Type(1)
Rentable Units
RentableArea
Rented Area
Occupancy Rate
Operating Days
Leasing Business Revenues
Leasing Business Expenses
NOI DepreciationLeasing BusinessIncome
NOI Cap Rate
NOI Cap Rate after
Depreciation(unit) (m2) (m2) (%) (days) a b c [a-b] d e [c-d] (per year) (per year)
Other Regional A
reas
R-29 KDX Residence Funairi Saiwai-cho 588,000 569,004 664,000 S 64 1,889.53 1,859.68 98.4% 184 27,011 6,456 20,554 5,369 15,185 6.9% 5.1%
R-30 KDX Residence Tenjin-higashi II 680,000 664,492 851,000 SF 63 2,602.53 2,478.60 95.2% 184 30,178 7,376 22,801 6,223 16,578 6.7% 4.8%
R-32 KDX Residence Nishi Koen 763,000 745,643 839,000 F 36 2,522.16 2,300.38 91.2% 184 30,493 6,993 23,499 6,370 17,129 6.1% 4.5%
R-33 KDX Residence Hirao Josui-machi 760,000 751,636 867,000 F 24 2,098.68 2,008.16 95.7% 184 28,963 8,069 20,894 4,779 16,115 5.5% 4.2%
R-34 Melody Heim Gotenyama 400,000 430,504 510,000 F 36 2,297.24 2,297.24 100.0% 184 21,695 5,414 16,281 3,004 13,276 8.1% 6.6%
R-35 Leopalace Flat Shin-sakae 3,500,000 3,592,255 4,260,000 S 274 11,589.95 11,589.95 100.0% 184 121,557 15,228 106,328 33,178 73,150 6.0% 4.1%
R-36 KDX Residence Konan Yamate 973,000 981,892 1,120,000 SF 55 1,923.22 1,844.12 95.9% 184 33,104 7,900 25,203 4,911 20,292 5.1% 4.1%
R-37 KDX Residence Hommachibashi 3,201,000 3,218,476 3,450,000 SF 134 6,511.88 6,361.03 97.7% 184 109,334 18,576 90,758 21,966 68,791 5.6% 4.3%
R-38 KDX Residence Minami-kusatsu 1,974,666 2,024,554 2,290,000 S 170 5,735.96 5,452.32 95.1% 184 98,944 23,244 75,699 18,250 57,449 7.6% 5.8%
R-39 KDX Residence Ohori Harbor View Tower 4,606,296 4,671,742 5,210,000 SF 212 11,855.63 10,854.69 91.6% 184 180,391 40,344 140,047 42,536 97,510 6.0% 4.2%
R-40 KDX Residence Minami-sanjo 915,000 952,184 1,560,000 SF 114 5,269.39 5,024.59 95.4% 184 53,669 13,544 40,125 11,228 28,897 8.7% 6.3%
R-41 Serenite Kita-kyuhoji 1,290,740 1,308,512 1,470,000 S 85 2,277.14 2,194.73 96.4% 184 41,356 9,334 32,022 10,155 21,866 4.9% 3.4%
R-42 Serenite Nishinomiya Hommachi 617,048 657,252 739,000 S 51 1,351.68 1,326.37 98.1% 184 23,317 4,714 18,602 4,746 13,856 6.0% 4.5%
R-43 KDX Residence Nishijin 1,600,000 1,712,735 1,670,000 SF 128 4,472.72 3,964.64 88.6% 184 55,209 15,015 40,193 6,277 33,916 5.0% 4.2%
Subtotal / Average 49,387,750 49,033,161 57,664,000 3,522 143,295.72 137,385.77 95.9% 184.0 2,001,766 471,287 1,530,478 407,373 1,123,104 6.1% 4.5%
Total / Average 164,169,250 165,040,946 192,137,000 7,888 303,608.43 294,420.22 97.0% 183.0 5,671,305 1,185,205 4,486,099 921,858 3,564,241 5.4% 4.3%
(in thousands of yen)
Note 1: Type means principal room type of the property (If applicable to some types, type of the largest footprint unit)Single (S): (intended primarily for single-person households) [footprint of equal or more than 18m2 and less than 30m2 and more than 20 rentable units per property], Small Family (SF): (intended primarily for households of couples or familieswith infants) [footprint of equal or more than 30m2 and less than 60m2 and more than 15 rentable units per property], Family (F): (intended primarily for households of three or more families) [ footprint of equal or more than 60m2 and morethan 5 rentable units per property]
70
memo