
Financial Results for the First Six Months of the Fiscal ... · 3.Forecasts for Fiscal 2016 (April...
43
Financial Results for the First Six Months of the Fiscal year ending March 31, 2017 (IFRS, Consolidated) November 1, 2016 Company name: Mitsubishi Tanabe Pharma Corporation Stock exchange listings: Tokyo Securities code number: 4508 URL: http://www.mt-pharma.co.jp/ Representative: Name: Masayuki Mitsuka Title: President and Representative Director For further information, please contact: Name: Yoshifumi Mifune Title: General Manager, Corporate Communications Department Telephone: +81-6-6205-5211 Planned date of filing of quarterly securities report: November 10, 2016 Planned date of start of dividend payments: December 1, 2016 Provision of supplementary explanatory materials for quarterly results: Yes Quarterly results presentation: Yes (for institutional investors and securities analysts) Notes; Amounts less than ¥1 million have been rounded. Percentage changes in the list show change in comparison with the same period of the previous fiscal year. 1. Results for 2nd Quarter (April 1, 2016 to September 30, 2016) (1) Consolidated Business Results Revenue Operating profit Profit before tax Net profit for the period Millions of Yen % change Millions of Yen % change Millions of Yen % change Millions of Yen % change 2nd Quarter of Fiscal 2016 204,115 1.0 47,816 (3.0) 49,402 (0.6) 35,225 1.5 2nd Quarter of Fiscal 2015 202,065 - 49,284 - 49,703 - 34,719 - Net profit attributable to owners of the Company Total comprehensive income for the period Basic earnings per share Diluted earnings per share Millions of Yen % change Millions of Yen % change Yen Yen 2nd Quarter of Fiscal 2016 36,297 1.6 25,208 (24.0) 64.70 - 2nd Quarter of Fiscal 2015 35,713 - 33,151 - 63.66 - (References) 1. Core operating profit: ¥47,953 million, (3.5)% in 2nd Quarter of Fiscal year 2016 (¥49,716 million, -% in 2nd Quarter of Fiscal year 2015) 2. "Core operating profit" is a profit except the income and loss recorded by non-recurring items specified by the Group from operating profit. (2) Consolidated Financial Position Total assets Total equity Equity attributable to owners of the Company Ratio of equity attributable to owners of the Company to total assets Equity attributable to owners of the Company per share Millions of Yen Millions of Yen Millions of Yen % Yen As of September 30, 2016 965,401 839,600 829,600 85.9 1,478.82 As of March 31, 2016 958,445 826,316 815,518 85.1 1,453.71 2. Dividends Dividends per share 1st Quarter 2nd Quarter 3rd Quarter Year-end Annual Yen Yen Yen Yen Yen Fiscal 2015 - 22.00 - 24.00 46.00 Fiscal 2016 - 24.00 Fiscal 2016(forecasts) - 24.00 48.00 (Note) Revisions to recently announced dividend forecasts: No
Transcript of Financial Results for the First Six Months of the Fiscal ... · 3.Forecasts for Fiscal 2016 (April...

Financial Results for the First Six Months of the Fiscal year ending March 31, 2017(IFRS, Consolidated)
November 1, 2016Company name: Mitsubishi Tanabe Pharma CorporationStock exchange listings: TokyoSecurities code number: 4508URL: http://www.mt-pharma.co.jp/Representative: Name: Masayuki Mitsuka
Title: President and Representative DirectorFor further information, please contact: Name: Yoshifumi Mifune
Title: General Manager, Corporate Communications DepartmentTelephone: +81-6-6205-5211
Planned date of filing of quarterly securities report: November 10, 2016Planned date of start of dividend payments: December 1, 2016Provision of supplementary explanatory materials for quarterly results: YesQuarterly results presentation: Yes (for institutional investors and securities analysts)
Notes; Amounts less than ¥1 million have been rounded.Percentage changes in the list show change in comparison with the same period of the previous fiscal year.
1. Results for 2nd Quarter (April 1, 2016 to September 30, 2016)(1) Consolidated Business Results
Revenue Operating profit Profit before tax Net profit for the period
Millions of Yen % change Millions of Yen % change Millions of Yen % change Millions of Yen % change
2nd Quarter of Fiscal2016 204,115 1.0 47,816 (3.0) 49,402 (0.6) 35,225 1.5
2nd Quarter of Fiscal2015 202,065 - 49,284 - 49,703 - 34,719 -
Net profit attributable to owners of the Company
Total comprehensive incomefor the period
Basic earningsper share
Diluted earningsper share
Millions of Yen % change Millions of Yen % change Yen Yen2nd Quarter of Fiscal2016 36,297 1.6 25,208 (24.0) 64.70 -
2nd Quarter of Fiscal2015 35,713 - 33,151 - 63.66 -
(References)1. Core operating profit: ¥47,953 million, (3.5)% in 2nd Quarter of Fiscal year 2016 (¥49,716 million, -% in 2nd Quarter of Fiscal
year 2015)2. "Core operating profit" is a profit except the income and loss recorded by non-recurring items specified by the Group from
operating profit.
(2) Consolidated Financial Position
Total assets Total equityEquity attributable
to owners of the Company
Ratio of equity attributable to owners of the
Company to total assets
Equity attributable to owners of the
Companyper share
Millions of Yen Millions of Yen Millions of Yen % YenAs of September 30, 2016 965,401 839,600 829,600 85.9 1,478.82As of March 31, 2016 958,445 826,316 815,518 85.1 1,453.71
2. DividendsDividends per share
1st Quarter 2nd Quarter 3rd Quarter Year-end AnnualYen Yen Yen Yen Yen
Fiscal 2015 - 22.00 - 24.00 46.00Fiscal 2016 - 24.00Fiscal 2016(forecasts) - 24.00 48.00
(Note) Revisions to recently announced dividend forecasts: No

3. Forecasts for Fiscal 2016 (April 1, 2016 to March 31, 2017)Revenue Operating profit Profit before tax
Millions of Yen % change Millions of Yen % change Millions of Yen % changeFull year 414,000 (2.8) 84,000 2.7 86,000 3.3
Net Profit for the period Net profit attributable to owners of the Company
Basic earningsper share
Millions of Yen % change Millions of Yen % change YenFull year 62,000 8.7 64,000 7.9 114.08
(Note) Revisions to recently announced consolidated earnings forecasts: No(Reference) Core operating profit: ¥85,000 million, (20.5)% in Fiscal year 2016
※ Notes(1) Significant change involving subsidiaries during the period: No
(Change in designated subsidiaries accompanying changes in the scope of consolidation)
(2) Changes in accounting policies and accounting estimates1. Changes in accounting policies required by IFRS: No2. Other changes: No3. Change in accounting estimates: No
(3) Number of shares issued (ordinary shares)1. Number of shares issued at the end of the period (including treasury shares)
2nd Quarter of Fiscal 2016 561,417,916 shares Fiscal 2015 561,417,916 shares
2. Number of treasury shares at the end of the period2nd Quarter of Fiscal 2016 429,225 shares Fiscal 2015 428,945 shares
3. Average number of shares during the period (cumulative total)2nd Quarter of Fiscal 2016 560,988,894 shares 2nd Quarter of Fiscal 2015 560,989,386 shares
*Note regarding implementation of quarterly review proceduresThis financial results report is exempt from the audit procedures in accordance with the Financial Instruments and Exchange Act.At the time when this summary of 2nd quarter financial results was released, the review procedures for the quarterly financialstatements were in progress in accordance with the Financial Instruments and Exchange Act.
*Explanation regarding the appropriate use of earnings forecasts and other matters of special note(Adoption of IFRS)The Group has adopted IFRS from the first quarter of the fiscal year ending March 31, 2017. Figures for the second quarter endedSeptember 30, 2015 and the fiscal year ended March 31, 2016 are also presented in accordance with IFRS. Please see “3. CondensedConsolidated Financial Statements (6) Notes to Condensed Consolidated Financial Statements (First-time Adoption)” on page 24 forthe difference between the financial figures under IFRS and Japanese GAAP.
(Note about forward-looking information)In these materials, earnings forecasts and other statements about the future are forward-looking statements based on the informationcurrently available and certain assumptions that the Company regards as reasonable. Accordingly, the Company cannot makepromises to achieve such forecasts. Actual financial results may differ materially from these forecasts depending on a number ofimportant factors.Please see “1. Qualitative Information for 2nd Quarter of Fiscal year 2016 (3) Explanation about Future Prediction Information ofConsolidated Earnings Forecasts” on page 4 for information regarding the forecast of consolidated financial results.
(Methods of obtaining the supplementary materials and the content of the results presentation)・Supplementary materials are disclosed with this material on TDnet on the same day and are made available on the Company's
website.・The Company plans to hold a results presentation (conference call) for institutional investors and securities analysts on November
1, 2016 (Tuesday).The Company plans to make the presentation materials available on its website at the same time as the release of this document,and the audio materials are provided on the website immediately after the presentation is held.

Contents of supplement
1. Qualitative Information for 2nd Quarter of Fiscal year 2016 ...................................................................................................... 1
(1)Explanation about Results of Operations ..................................................................................................................................... 1
(2)Explanation about Financial Position .......................................................................................................................................... 4
(3)Explanation about Future Prediction Information of Consolidated Earnings Forecasts ............................................................. 4
2. Items Concerning Summary Data (The notes) ............................................................................................................................. 5
(1)Changes in Significant Subsidiaries during the Period ................................................................................................................ 5
(2)Changes in Accounting Policies and Accounting Estimates ....................................................................................................... 5
3. Condensed Consolidated Financial Statements ........................................................................................................................... 6
(1)Condensed Consolidated Statements of Income ......................................................................................................................... 6
(2)Condensed Consolidated Statements of Comprehensive Income ............................................................................................... 7
(3)Condensed Consolidated Statements of Financial Position ........................................................................................................ 8
(4)Condensed Consolidated Statements of Changes in Equity ....................................................................................................... 10
(5)Condensed Consolidated Statements of Cash Flows .................................................................................................................. 12
(6)Notes to Condensed Consolidated Financial Statements ............................................................................................................ 13
(Note regarding Going Concern Assumption) ....................................................................................................................... 13
(Operating Segment) .............................................................................................................................................................. 13
(Subsequent Event) ................................................................................................................................................................ 13
(Reporting Entity) .................................................................................................................................................................. 14
(Basis of Preparation) ............................................................................................................................................................ 14
(Significant Accounting Policies) .......................................................................................................................................... 15
(First-time Adoption) ............................................................................................................................................................. 24

1. Qualitative Information for 2nd Quarter of Fiscal year 2016【Adoption of International Financial Reporting Standards】
Mitsubishi Tanabe Pharma Corporation (hereinafter “the Company”), its subsidiaries and its affiliates (collectively, “the Group”, including the Company) have adopted the International Financial Reporting Standards (hereinafter “IFRS”), effective from the first three months of the fiscal year ending March 31, 2017, for the purpose of improving the international comparability of financial information in the capital market (date of transition to IFRS: April 1, 2015). Figures for the second quarter ended September 30, 2015 and the fiscal year ended March 31, 2016 are also presented in accordance with IFRS.For details of adjustments in the change from Japanese Generally Accepted Accounting Principles, please refer to “3. Condensed Consolidated Financial Statements, (6) Notes to Condensed Consolidated Financial Statements, First-time Adoption” on page 24.In applying IFRS, the Group has introduced “core operating profit” as a major profit item showing its recurring profitability and positioned it an important indicator of business management, etc. “Core operating profit” is a profit except the income and loss recorded by non-recurring items (hereinafter “non-recurring items”) specified by the Group from operating profit. The Company assumes income associated with a business transfer, restructuring expenses, impairment losses on intangible assets associated with products, losses on disaster and others as non-recurring items.
(1) Explanation about Results of OperationsConsolidated operating results for the first six months of the fiscal year ending March 31, 2017 (April 1, 2016 to September 30,2016) were as follows.
(Millions of yen)
2nd quarter ofFiscal year 2015
2nd quarter ofFiscal year 2016
Increase /Decrease % change
Revenue 202,065 204,115 2,050 1.0
Core operating profit 49,716 47,953 (1,763) (3.5)
Operating profit 49,284 47,816 (1,468) (3.0)
Profit before tax 49,703 49,402 (301) (0.6)
Net profit attributable to owners of the Company
35,713 36,297 584 1.6
< Research and development expense>
(Millions of yen)
2nd quarter ofFiscal year 2015
2nd quarter ofFiscal year 2016
Increase /Decrease % change
Research anddevelopment expense
31,879 30,327 (1,552) (4.9)
- 1 -

【Revenue】Revenue increased by 1.0%, or ¥2.0 billion, year-on-year, to ¥204.1 billion.
(Millions of yen)
2nd quarter ofFiscal year 2015
2nd quarter ofFiscal year 2016
Increase /Decrease % change
Pharmaceuticals 202,065 204,115 2,050 1.0
Domestic ethical drugs 147,332 151,994 4,662 3.2
Overseas ethical drugs 13,903 10,672 (3,231) (23.2)
Royalty revenue, etc. 37,488 38,510 1,022 2.7
OTC products 2,099 1,944 (155) (7.4)
Others 1,243 995 (248) (20.0)
・Revenue of domestic ethical drugs increased by 3.2%, year-on-year, to ¥151.9 billion due to the following reasons:- Decrease in revenue of domestic ethical drugs due to the revision of NHI drug price standards in April 2016- Increase in revenue of SIMPONI, for the treatment agent of Rheumatoid arthritis (RA), because the distribution of
SIMPONI has be undertaken solely by the Company- Increase in revenue of high-priority products such as TENELIA and CANAGLU, type 2 diabetes mellitus, and vaccines
・Royalty revenue, etc. increased by 2.7%, year-on-year, to ¥38.5 billion due to the following reasons:- Increase in royalty revenue from Gilenya, for the treatment of multiple sclerosis, licensed to Novartis- Decrease in royalty revenue from INVOKANA and the fixed dose combination with metformin (IR), for the treatment of
type2 diabetes mellitus, licensed to Janssen Pharmaceuticals due to the effect of exchange rates
【Core operating profit】Core operating profit decreased by 3.5%, or ¥1.7 billion, year-on-year, to ¥47.9 billion because the decrease in gross profit accompanying a higher cost of sales ratio due to the revision of NHI drug price standards exceeded the decrease in labor cost related to the implementation of early retirement program in the last year and the decrease in R&D expenses.
【Operating profit】Operating profit was down 3.0%, or ¥1.4 billion, year-on-year, to ¥47.8 billion. The Group recorded income of ¥0.1 billion associated with a business transfer of a certain subsidiary and restructuring expenses of ¥0.3 billion as non-recurring items excluded from core operating profit.
【Profit before tax and net profit attributable to owners of the Company】Profit before tax was down 0.6%, or ¥0.3 billion, year-on-year, to ¥49.4 billion. And net profit attributable to owners of the Company was up 1.6%, or ¥0.5 billion, year-on-year, to ¥36.2 billion.
- 2 -

【R&D activities】Research and development expense were ¥30.3 billion, accounting for 14.9% of revenue. The major progress of clinical development activities during the first six months of the fiscal year ending March 31, 2017 is as follows;
Acquisition of approval・In May 2016, REMICADE was approved for a partial change in dosage and usage (increased dosage and shorter dosing
intervals) in psoriasis in Japan.・In August 2016, Valixa was approved for an additional indication of the prevention of cytomegalovirus (CMV) disease in
organ transplant patients (excluding haematopoietic stem cell transplantation) in Japan.
Application of approval・In June 2016, an application was submitted in US for amyotrophic lateral sclerosis(ALS) for MCI-186 (generic name:
edaravone, Japanese product name: RADICUT).・In August 2016, an application was submitted in Japan for type2 diabetes mellitus for MT-2412 (the fixed dose combination
of TENELIA (DPP-4 inhibitor) and CANAGLU (SGLT2 inhibitor)).・In September 2016, an application was submitted in Japan for a partical change on administration / dosage (a shortened
administration interval) for Crohn's diseases for REMICADE.
Development status of licensing-out products・In September 2016, licensee Janssen Pharmaceuticals, Inc. received approval in US for an indication of type2 diabetes
mellitus for the fixed dose combination of TA-7284 (generic name: canagliflozin, product name: INVOKANA) withmetformin (XR).
- 3 -

(2) Explanation about Financial Position【Statement of financial position】 (Millions of yen)
End of Fiscal year 2015(As of March 31, 2016)
End of 2nd quarterof Fiscal year 2016
(As of September 30, 2016)
Increase/Decrease
Non-current assets 308,266 299,082 (9,184)
Current assets 650,179 666,319 16,140
Total assets 958,445 965,401 6,956
Liabilities 132,129 125,801 (6,328)
Equity 826,316 839,600 13,284
Total liabilities and equity 958,445 965,401 6,956
Total assets at the end of the second quarter of the fiscal year ending March 31, 2017 were ¥965.4 billion, an increase of ¥6.9 billion from the end of the fiscal year ended March 31, 2016. Major factors causing changes in the consolidated statement of financial position in comparison with the previous year-end were as follows.・Non-current assets were down ¥9.1 billion, to ¥299.0 billion, due to the decrease in financial assets such as domestic listed
stocks and intangible assets associated with products.・Current assets were up ¥16.1 billion, to ¥666.3 billion because the increase in cash and cash equivalents exceeded the decrease
in other financial assets.・Liabilities were down ¥6.3 billion, to ¥125.8 billion because the decrease in income taxes payable and other financial liabilities
exceeded the increase in trade and other payables.・Equity was up ¥13.2 billion, to ¥839.6 billion, as a result of posting net profit for the period and dividends payment, and a
decrease in exchange differences on translation of foreign operations.
【Cash flows】 (Millions of yen)
2nd quarter ofFiscal year 2015
2nd quarter ofFiscal year 2016
Increase/Decrease
Operating activities 28,361 31,324 2,963
Investing activities 82,359 43,914 (38,445)
Financing activities (10,891) (12,030) (1,139)
Change in cash and cash equivalents 99,317 61,492 (37,825)
At the beginning of the year 73,337 88,919 15,582
At the end of the period 172,654 150,411 (22,243)
Net increase in cash and cash equivalents was ¥61.4 billion, and the balance of cash and cash equivalents at the end of the second quarter of the fiscal year ending March 31, 2017 was ¥150.4 billion.・Net cash provided by operating activities was ¥31.3 billion because cash inflows including profit before taxes of ¥49.4 billion
exceeded cash outflows including income taxes paid of ¥16.9 billion.・Net cash provided by investing activities was ¥43.9 billion because of proceeds from withdrawal of time deposits.・Net cash used in financing activities was ¥12.0 billion mainly due to dividends paid.
(3) Explanation about Future Prediction Information of Consolidated Earnings ForecastsThere has been no change to the consolidated forecasts for the full-year of the fiscal year ending March 31, 2017 announced onOctober 25, 2016.
- 4 -

2. Items Concerning Summary Data (The notes)(1) Changes in Significant Subsidiaries during the Period
Not applicable.
(2) Changes in Accounting Policies and Accounting EstimatesNot applicable.
- 5 -
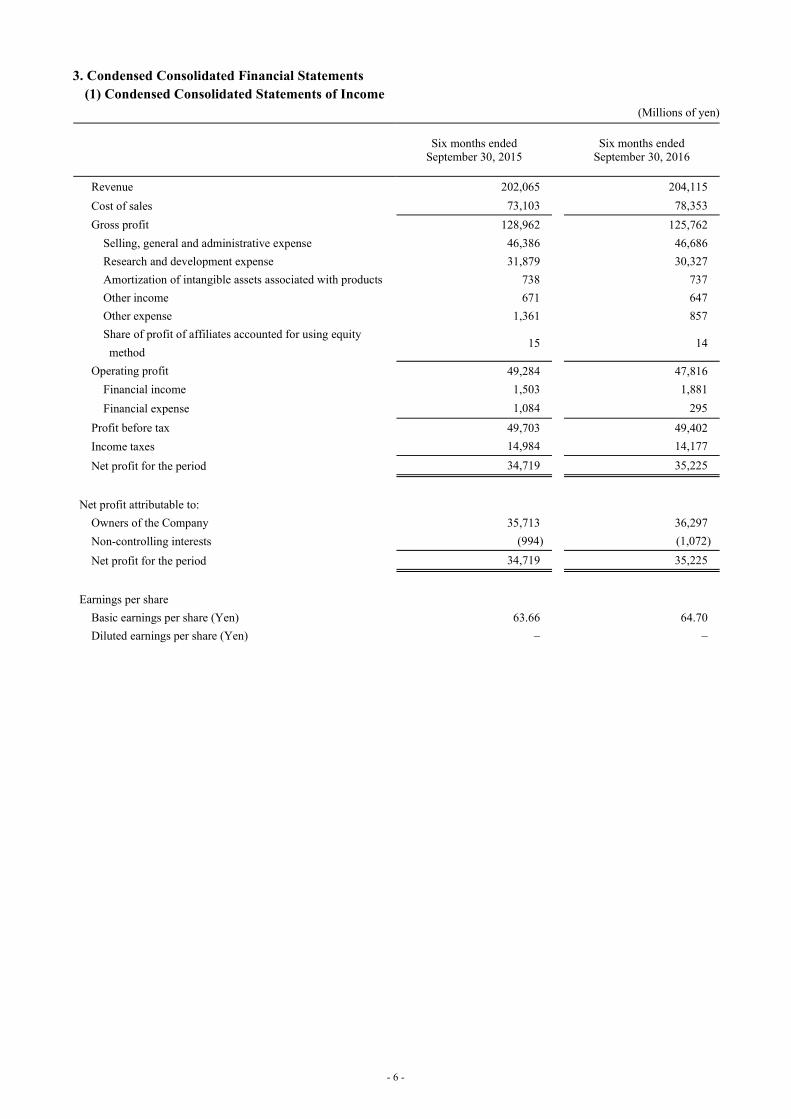
3. Condensed Consolidated Financial Statements(1) Condensed Consolidated Statements of Income
(Millions of yen)
Six months endedSeptember 30, 2015
Six months endedSeptember 30, 2016
Revenue 202,065 204,115Cost of sales 73,103 78,353Gross profit 128,962 125,762
Selling, general and administrative expense 46,386 46,686Research and development expense 31,879 30,327Amortization of intangible assets associated with products 738 737Other income 671 647Other expense 1,361 857Share of profit of affiliates accounted for using equity method
15 14
Operating profit 49,284 47,816Financial income 1,503 1,881Financial expense 1,084 295
Profit before tax 49,703 49,402Income taxes 14,984 14,177
Net profit for the period 34,719 35,225
Net profit attributable to:Owners of the Company 35,713 36,297Non-controlling interests (994) (1,072)
Net profit for the period 34,719 35,225
Earnings per shareBasic earnings per share (Yen) 63.66 64.70Diluted earnings per share (Yen) – –
- 6 -

(2) Condensed Consolidated Statements of Comprehensive Income(Millions of yen)
Six months endedSeptember 30, 2015
Six months endedSeptember 30, 2016
Net profit for the period 34,719 35,225Other comprehensive income
Components of other comprehensive income that will not be reclassified to profit or loss
Fair value changes of financial assets measured through other comprehensive income
2,665 (2,948)
Remeasurements of defined benefit plans (1,578) (682)Total other comprehensive income that will not be reclassified to profit or loss
1,087 (3,630)
Components of other comprehensive income that may be reclassified to profit or loss
Exchange differences on translation of foreign operations (2,531) (6,343)Cash flow hedges (105) (8)Share of other comprehensive income of affiliates accounted for using equity method
(19) (36)
Total other comprehensive income that may be reclassified to profit or loss
(2,655) (6,387)
Total other comprehensive income, net of tax (1,568) (10,017)
Comprehensive income 33,151 25,208
Comprehensive income attributable to:Owners of the Company 34,845 27,546Non-controlling interests (1,694) (2,338)
Comprehensive income 33,151 25,208
- 7 -

(3) Condensed Consolidated Statements of Financial Position (Millions of yen)
As of April 1, 2015 As of March 31, 2016 As of September 30,
2016
Assets
Non-current assets
Property, plant and equipment 87,271 84,077 86,631 Goodwill 81,041 80,511 79,850 Intangible assets 51,290 55,924 52,622 Investments accounted for using equity method 278 265 217 Other financial assets 95,439 65,519 56,893 Net defined benefit assets 15,730 8,170 7,631 Other non-current assets 861 632 530 Deferred tax assets 8,407 13,168 14,708 Total non-current assets 340,317 308,266 299,082
Current assets
Inventories 82,324 75,697 75,394 Trade and other receivables 130,287 121,249 126,084 Other financial assets 297,182 351,665 304,767 Other current assets 9,428 12,502 9,663 Cash and cash equivalents 73,337 88,919 150,411
Subtotal 592,558 650,032 666,319 Assets held for sale 3,526 147 -
Total current assets 596,084 650,179 666,319
Total assets 936,401 958,445 965,401
- 8 -

(Millions of yen)
As of April 1, 2015 As of March 31, 2016 As of September 30,
2016
Liabilities and equity
Liabilities
Non-current liabilities
Borrowings 894 713 590 Other financial liabilities 2,843 2,646 2,446 Net defined benefit liabilities 2,456 1,354 1,237 Provisions 6,467 9,106 7,924 Other non-current liabilities 7,339 11,987 11,009 Deferred tax liabilities 8,011 7,412 6,568 Total non-current liabilities 28,010 33,218 29,774
Current liabilities
Borrowings 132 125 110 Trade and other payables 34,585 32,653 36,056 Other financial liabilities 34,871 27,466 25,367 Income taxes payable 19,189 16,332 13,339 Provisions 438 137 100 Other current liabilities 23,181 22,198 21,055 Total current liabilities 112,396 98,911 96,027
Total liabilities 140,406 132,129 125,801
Equity
Share capital 50,000 50,000 50,000 Capital surplus 451,186 451,186 451,187 Treasury shares (493) (494) (495) Retained earnings 267,278 304,931 327,069 Other components of equity 16,557 9,895 1,839 Total equity attributable to owners of the Company
784,528 815,518 829,600
Non-controlling interests 11,467 10,798 10,000 Total equity 795,995 826,316 839,600
Total liabilities and equity 936,401 958,445 965,401
- 9 -
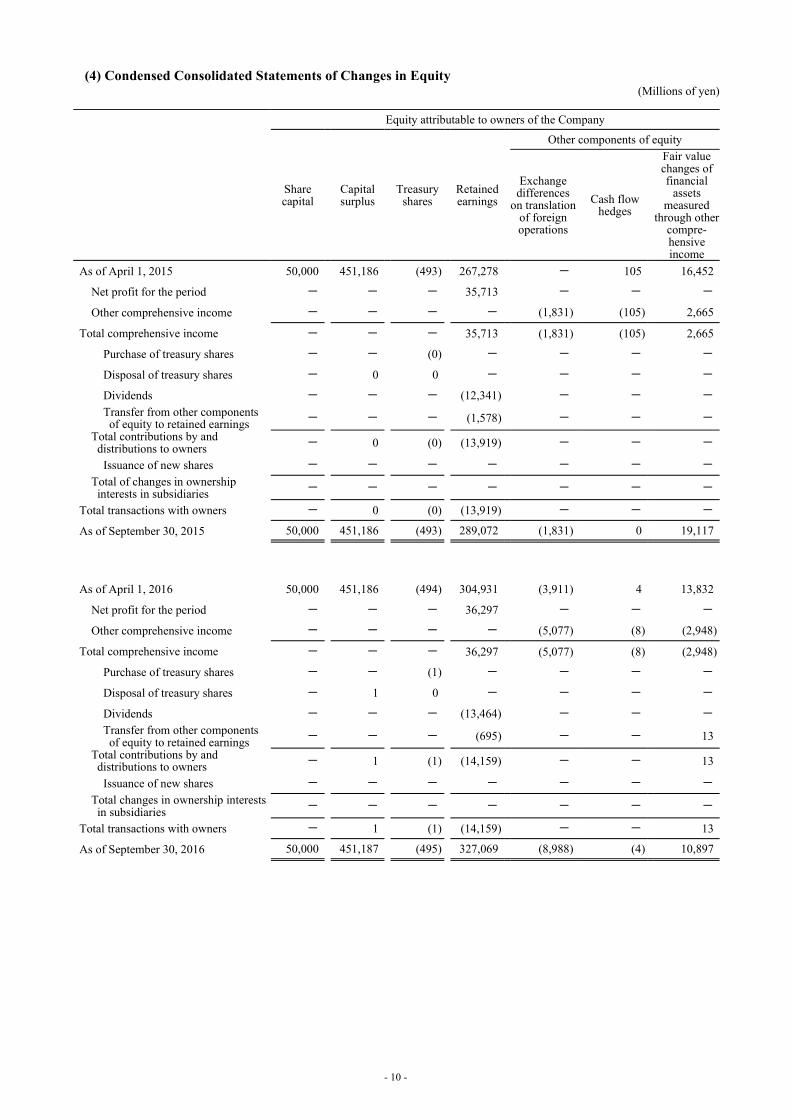
(4) Condensed Consolidated Statements of Changes in Equity(Millions of yen)
Equity attributable to owners of the Company
Share capital
Capital surplus
Treasury shares
Retained earnings
Other components of equity
Exchange differences
on translation of foreign operations
Cash flow hedges
Fair value changes of financial
assets measured
through other compre-hensive income
As of April 1, 2015 50,000 451,186 (493) 267,278 - 105 16,452
Net profit for the period - - - 35,713 - - -
Other comprehensive income - - - - (1,831) (105) 2,665
Total comprehensive income - - - 35,713 (1,831) (105) 2,665
Purchase of treasury shares - - (0) - - - -
Disposal of treasury shares - 0 0 - - - -
Dividends - - - (12,341) - - -
Transfer from other components of equity to retained earnings - - - (1,578) - - -
Total contributions by and distributions to owners - 0 (0) (13,919) - - -
Issuance of new shares - - - - - - -
Total of changes in ownership interests in subsidiaries - - - - - - -
Total transactions with owners - 0 (0) (13,919) - - -
As of September 30, 2015 50,000 451,186 (493) 289,072 (1,831) 0 19,117
As of April 1, 2016 50,000 451,186 (494) 304,931 (3,911) 4 13,832
Net profit for the period - - - 36,297 - - -
Other comprehensive income - - - - (5,077) (8) (2,948)
Total comprehensive income - - - 36,297 (5,077) (8) (2,948)
Purchase of treasury shares - - (1) - - - -
Disposal of treasury shares - 1 0 - - - -
Dividends - - - (13,464) - - -
Transfer from other components of equity to retained earnings - - - (695) - - 13
Total contributions by and distributions to owners - 1 (1) (14,159) - - 13
Issuance of new shares - - - - - - -
Total changes in ownership interests in subsidiaries - - - - - - -
Total transactions with owners - 1 (1) (14,159) - - 13
As of September 30, 2016 50,000 451,187 (495) 327,069 (8,988) (4) 10,897
- 10 -

(Millions of yen)
Equity attributable to owners of the Company
Non-controlling
interests Total equity
Other components of equity
Total equity attributable to owners of the
Company
Remeasure- ments of defined
benefit plans
Share of other comprehensive
income of affiliates
accounted for using equity
method
Total
As of April 1, 2015 - - 16,557 784,528 11,467 795,995
Net profit for the period - - - 35,713 (994) 34,719
Other comprehensive income (1,578) (19) (868) (868) (700) (1,568)
Total comprehensive income (1,578) (19) (868) 34,845 (1,694) 33,151
Purchase of treasury shares - - - (0) - (0)
Disposal of treasury shares - - - 0 - 0
Dividends - - - (12,341) (75) (12,416) Transfer from other components of equity to retained earnings
1,578 - 1,578 - - -
Total contributions by and distributions to owners 1,578 - 1,578 (12,341) (75) (12,416)
Issuance of new shares - - - - 1,637 1,637 Total of changes in ownership interests in subsidiaries - - - - 1,637 1,637
Total transactions with owners 1,578 - 1,578 (12,341) 1,562 (10,779)
As of September 30, 2015 - (19) 17,267 807,032 11,335 818,367
As of April 1, 2016 - (30) 9,895 815,518 10,798 826,316
Net profit for the period - - - 36,297 (1,072) 35,225
Other comprehensive income (682) (36) (8,751) (8,751) (1,266) (10,017)
Total comprehensive income (682) (36) (8,751) 27,546 (2,338) 25,208
Purchase of treasury shares - - - (1) - (1)
Disposal of treasury shares - - - 1 - 1
Dividends - - - (13,464) (77) (13,541) Transfer from other components of equity to retained earnings
682 - 695 - - -
Total contributions by and distributions to owners 682 - 695 (13,464) (77) (13,541)
Issuance of new shares - - - - 1,617 1,617 Total of changes in ownership interests in subsidiaries - - - - 1,617 1,617
Total transactions with owners 682 - 695 (13,464) 1,540 (11,924)
As of September 30, 2016 - (66) 1,839 829,600 10,000 839,600
- 11 -

(5) Condensed Consolidated Statements of Cash Flows(Millions of yen)
Six months endedSeptember 30, 2015
Six months endedSeptember 30, 2016
Cash flows from operating activities:Profit before tax 49,703 49,402Depreciation and amortization 5,150 5,044Loss on impairment of fixed assets 689 13Interest and dividends income (1,462) (1,374)Share of loss (profit) of affiliates accounted for using equity method
(15) (14)
Loss (gain) on sales of property, plant and equipment (257) (187)Decrease (increase) in trade and other receivables 990 (5,262)Decrease (increase) in inventories 4,977 (95)Increase (decrease) in trade and other payables (5,696) 3,731Increase (decrease) in provisions (696) (1,219)Decrease (increase) in net defined benefit asset (800) (442)Other (6,034) (2,736)
Subtotal 46,549 46,861Interest received 879 997Dividends received 638 474Interest paid (103) (87)Income taxes paid (19,602) (16,921)Net cash provided by operating activities 28,361 31,324
Cash flows from investing activities:Payments into time deposits (941) (616)Proceeds from withdrawal of time deposits 24,692 117,591Purchase of property, plant and equipment (7,793) (5,594)Proceeds from sales of property, plant and equipment 1,977 578Purchase of intangible assets (5,900) (937)Purchase of investments (36,069) (121,636)Proceeds from sales and redemption of investments 102,973 54,500Proceeds from company split 3,323 -
Other 97 28Net cash provided by investing activities 82,359 43,914
Cash flows from financing activities:Proceeds from share issuance to non-controlling shareholders
1,637 1,617
Dividends paid (12,341) (13,464)Other (187) (183)Net cash used in financing activities (10,891) (12,030)
Effect of exchange rate changes on cash and cash equivalents
(512) (1,716)
Net increase in cash and cash equivalents 99,317 61,492Cash and cash equivalents at the beginning of period 73,337 88,919
Cash and cash equivalents at the end of period 172,654 150,411
- 12 -

(6) Notes to Condensed Consolidated Financial Statements(Note regarding Going Concern Assumption)
Not applicable.
(Operating Segment)Information by reportable segment has been omitted due to single segment of the “Pharmaceuticals” in the Group.
(Subsequent Event)Not applicable.
- 13 -

(Reporting Entity) The Company is a corporation domiciled in Japan, and is listed on the First Section of the Tokyo Stock Exchange. The address of the Company’s registered head office is available on the Company’s website (http://www.mt-pharma.co.jp/). The Company’s condensed consolidated financial statements as of and for the first six months ended September 30, 2016 comprise the Group and the Group’s interests in joint arrangements. The Group is principally engaged in the pharmaceuticals business. In addition, the Company’s parent company is Mitsubishi Chemical Holdings Corporation.
(Basis of Preparation) (1) Compliance with IFRS and first-time adoption
Since the requirements for “Specific company of Designated International Financial Reporting Standards” set forth in Article 1-2 of the “Ordinance on Terminology, Forms, and Preparation Methods of Quarterly Consolidated Financial Statements” (Cabinet Office Ordinance No. 64 of 2007) are satisfied, the condensed consolidated financial statements of the Group have been prepared in accordance with IAS 34 “Interim Financial Reporting,” pursuant to Article 93 of the ordinance. The Group first adopted IFRS from the first quarter of the fiscal year ending March 31, 2017. The date of transition to IFRS (hereinafter the “IFRS transition date”) was April 1, 2015. Effects of the transition to IFRS on the Group’s financial position, operating results and cash flows are provided in “First-time Adoption” on page 24.
(2) Basis of measurement The Group’s Condensed Consolidated Financial Statements have been prepared on an acquisition cost basis, except for specific financial instruments described in “Significant Accounting Policies” on page 15.
(3) Presentation currency The Group’s Condensed Consolidated Financial Statements are presented in Japanese yen, which is also the Company’s functional currency, and figures are rounded to the nearest million yen.
(4) Early adoption of new accounting standards The Group has early adopted IFRS 9 “Financial Instruments” (issued in November 2009, revised in July 2014) (hereinafter “IFRS 9”), from the IFRS transition date.
- 14 -

(Significant Accounting Policies)(1) Basis of consolidation
1) SubsidiariesSubsidiaries are entities controlled by the Group. The Group controls an entity when the Group has power over theentity, is exposed, or has rights, to variable returns from its involvement with the entity, and has the ability to affectthose returns through its power over the entity.The acquisition date of a subsidiary is the date on which the Group gained control of the subsidiary, and the subsidiaryis included in the consolidation from the date of acquisition until the date on which the Group loses control.In cases where the accounting policies applied by a subsidiary are different from those applied by the Group,adjustments are made to the subsidiary’s financial statements, if necessary.When the end of reporting period of a subsidiary is different from that of the Group, the subsidiary implements itsfinancial statements based on the provisional accounting as of the Group’s closing date.All intercompany balances, transactions and unrealized gains or losses on transactions within the Group are eliminatedon consolidation.In case of changes in the ownership interest in subsidiaries, if the Group retains control over the subsidiaries, they areaccounted for as equity transactions. Any difference between the adjustment to the non-controlling interests and the fairvalue of the consideration transferred or received is recognized directly in equity attributable to owner of the Group.When the Group results in loss of control, any retained interests in the entity is measured at the fair value on the datewhen the Group loses control. The difference between the carrying amount of subsidiary on the date when control islost and the fair value of the retained interests or the amount received by disposal is recognized in profit or loss.Non-controlling interests to the consolidated subsidiary’s net assets is identified separately from those of the Group.And, comprehensive income of the consolidated subsidiary is attributed to the owners of the Company and to the non-controlling interests even if non-controlling interests have a deficit balance.
2) Joint arrangementsA joint arrangement is an arrangement in which the Group has joint control. Joint control is the contractually agreedsharing of control of an arrangement, which exists only when decisions about the activities that significantly affect thereturns of the arrangement require the unanimous consent of the parties sharing control. A type of joint arrangementsthat the Group has is a joint venture. A joint venture is a joint arrangement whereby the parties that have joint controlof the arrangement have rights to the net assets of the arrangement.The Group accounts for investments in joint ventures using the equity method.
3) Business combinationsBusiness combinations are accounted for by applying the acquisition method.The acquiree’s identifiable assets and liabilities are measured at their acquisition-date fair values, except certain assetsand liabilities based on the requirements of IFRS.The excess of the aggregate of the consideration transferred, the fair value of equity interests in the acquiree held by theGroup prior to acquisition-date in case of step acquisition, and the amount of non-controlling interest in the acquireeover the net value of the identifiable assets and liabilities is recorded as goodwill. If the excess is negative, then theexcess is immediately recognized in profit or loss.The consideration transferred is calculated as the sum of the acquisition-date fair values of the assets transferred by theacquirer, the liabilities incurred by the acquirer to former owners of the acquiree and the equity interests issued by theacquirer.Non-controlling interests are measured either at fair value or at the non-controlling interests’ proportionate share of therecognized amounts of the acquiree’s identifiable net assets on a transaction-by- transaction basis.Acquisition-related costs incurred in connection with business combinations, such as finder’s fees and advisory fees,are expensed when incurred.
- 15 -

(2) Foreign currency translation1) Foreign currency transactions
Each entity of the Group has set its own functional currency as the currency of the primary economic environment inwhich the entity operates. Transactions of each entity are measured at the functional currency.Foreign currency transactions are translated into the functional currency using the spot exchange rates at the dates ofthe transactions or an exchange rate that approximates the spot rate.At the end of the reporting period, foreign currency monetary items are translated into the functional currency using thespot exchange rates at the end of the reporting period.Translation differences arising from the translation and settlement are recognized as profit or loss.However, translation differences arising from financial assets measured through other comprehensive income and cashflow hedges are recognized as other comprehensive income.
2) Foreign operationsAssets and liabilities of foreign operations in the statement of financial position are translated into Japanese yen usingthe exchange rate at the end of the reporting period. Income and expenses in each financial statement presenting profitor loss and other comprehensive income are translated into Japanese yen using the average exchange rate for theperiod.Exchange differences arising from translating the financial statements of foreign operations are recognized in othercomprehensive income.In cases of disposition of whole interests of foreign operations or certain interests involving loss of control or jointarrangement, the cumulative amount of other comprehensive income is reclassified to part of profit or loss on disposal.
(3) Revenue1) Sale of goods
Revenue from the sale of goods is recognized when all of the following conditions have been satisfied.(a) Significant risks and rewards incidental to ownership of the goods have been transferred to the buyers(b) The Group retains neither continuing involvement to the degree usually associated with ownership nor effective
control over the goods sold(c) The amount of revenue can be measured reliably(d) It is probable that the economic benefits associated with the transaction will flow to the Group(e) The costs incurred or to be incurred in respect of the transaction can be measured reliablyRevenue is measured at the fair value of the consideration received or receivable taking into account the amount of anyallowance, rebate, and consumption taxes.
2) Rendering of servicesRevenue from rendering of services is recognized at the point when services are provided to external customers.
3) Royalty income, etc.Some of the Group’s revenues are generated from the agreements under which third parties have been granted rights toproduce or market products or rights to use technologies.Upfront payments under agreements where the rights or obligations still exist are initially recognized as deferredincome and then recognized in income as earned over the period of duties based on the agreements.Milestone payment is recognized upon achievement of the milestones defined in the respective agreements.For running royalty, revenue is recognized on an accrual basis in accordance with the substance of the relevantagreement.
4) Interest revenueInterest revenue is recognized using the effective interest method.
5) Dividend incomeIn principle, dividend income is recognized when the shareholder’s right to receive payment is established.
- 16 -

(4) Income taxesIncome taxes are comprised of current and deferred taxes, and recognized in profit or loss, except for taxes related tobusiness combinations and to items that are recognized in other comprehensive income or directly in equity.Current tax is calculated at the amount expected to be paid to or recovered from the taxation authority by applying thestatutory tax rate and tax laws enacted or substantially enacted at the end of the reporting period.Deferred tax assets and liabilities are determined based on temporary differences between tax base of assets and liabilitiesand their accounting carrying amount at the end of the reporting period, unused tax credits and tax loss carryforwards.However, deferred tax assets and liabilities are not recognized for:(a) taxable temporary differences arising from the initial recognition of goodwill.(b) taxable or deductible temporary differences arising from the initial recognition of assets and liabilities in a
transaction other than a business combination that affects neither accounting profit nor taxable profit (tax loss).(c) deductible temporary differences associated with investments in subsidiaries and interests in joint arrangements
when it is not probable that the temporary difference will reverse in the foreseeable future or there will not be sufficienttaxable profits against which the deductible temporary differences can be utilized.
(d) taxable temporary differences associated with investments in subsidiaries and interests in joint arrangements whenthe Group is able to control the timing of the reversal of the temporary difference and it is probable that the temporarydifference will not reverse in the foreseeable future.
Deferred tax assets are recognized to the extent that it is probable that taxable profits will be available against which deductible temporary differences, unused tax loss carryforwards, and unused tax credits can be utilized.Deferred tax assets and liabilities are measured at the tax rates that are expected to apply to the period when the asset is realized or the liability is settled, based on statutory tax rates and tax laws that have been enacted or substantively enacted by the end of the reporting period.Deferred tax assets and liabilities are offset if the Group has a legally enforceable right to offset current tax assets against current tax liabilities, and they are related to income taxes levied by the same taxation authority on the same taxable entity.Income taxes expense recorded in the respective quarterly period is calculated based on the estimated annual effective tax rate.
(5) Earnings per shareBasic earnings per share are calculated by dividing net profit (loss) attributable to owners of the Company by theweighted average number of ordinary shares outstanding during the period, adjusting treasury shares.Diluted earnings per share are not calculated as there are no dilutive potential ordinary shares.
(6) Property, plant and equipment (excluding leased assets)Property, plant, and equipment after recognition is measured by using the cost model and is stated at cost lessaccumulated depreciation and accumulated impairment losses.The cost of an item of property, plant and equipment includes any costs directly attributable to the acquisition of the item,costs of dismantling, removing and restoring the item and borrowing costs eligible for capitalization.An item of property, plant and equipment other than land and construction in progress is depreciated in a way that allowsthe depreciable amount, which is determined by deducting its residual value from its cost, to be allocated regularly on astraight-line basis over the following useful lives.
Buildings and structures 2 to 60 yearsMachinery and vehicles 2 to 22 yearsTools, furniture and fixtures 2 to 20 years
The depreciation methods, residual values and useful lives of property, plant and equipment are revised at the end of fiscal year, and changed, as necessary.
- 17 -

(7) LeasesLeases are classified as finance leases whenever substantially all the risks and rewards incidental to ownership of leasedassets are transferred to the Group. All other leases are classified as operating leases.In finance lease transactions, leased assets and lease obligations are recognized in the consolidated statement of financialposition at the lower of the fair value of the leased property or the present value of the minimum lease payments, eachdetermined at the inception of the lease.Lease payments are apportioned between the financial costs and the reduction of the outstanding obligation based on theinterest method. Financial costs are recognized in the consolidated statement of income.Leased assets are depreciated on a straight-line basis over the shorter of their estimated useful lives or lease terms.Under operating lease transactions, lease payments are recognized as an expense on a straight-line basis over the leaseterm.The Group determines whether an arrangement is, or contains a lease, based on the substance of the arrangement.
(8) GoodwillGoodwill is not amortized but carried at cost less any accumulated impairment losses. Goodwill is allocated to each of thecash-generating units that are expected to benefit from the synergies of the business combination.Measurement at the initial recognition of Goodwill is stated in “(1)Basis of consolidation, 3) Business combinations.”Impairment of goodwill is stated in “(10)Impairment of property, plant and equipment, goodwill, and intangible assets, 2)Impairment of goodwill.”
(9) Intangible assetsIntangible assets are identifiable non-monetary assets without physical substance, other than goodwill, including patentsand technologies, distribution rights, and in-process research and development acquired in a business combination oracquired separately.Intangible assets after recognition are measured by using the cost model and are carried at cost less accumulatedamortization and accumulated impairment losses.Intangible assets acquired separately are measured at cost including costs directly related to the acquisition at the initialrecognition. Cost of intangible assets acquired through business combinations is measured at fair value at the acquisitiondate.Internally incurred expenditure in the research stage is recognized as expenses when incurred. Expenditure in thedevelopment stage is recognized as intangible assets when the Group can prove all the following requirements.(a) The technical feasibility of completing the intangible asset so that it will be available for use or sale.(b) The intention to complete the intangible asset and use or sell it.(c) The ability to use or sell the intangible asset.(d) How the intangible asset will generate future economic benefits.(e) The availability of adequate resources to complete the development of the intangible asset.(f) The ability to reliably measure the expenditure attributable to the intangible asset during its development.The Group considers that expenditure incurred for ongoing development projects does not meet requirements forcapitalization unless marketing approval is obtained from the regulatory authorities in a major market, and recognizessuch expenditure as expenses when incurred.Except for intangible assets with indefinite useful lives and intangible assets that are not yet available for use, each assetis amortized over the estimated useful life on a straight-line basis.The estimated useful life of intangible assets acquired through business combinations and under the in-licensing oftechnologies, etc. is the shorter of the period of legal protection or its economic life in principle. However, if there is aperiod in which the effect of intangible assets is expected more appropriately, with the purpose of the expenditure andeconomic substance of the transaction taken into account, this period is deemed as the estimated useful life.The estimated useful lives of major asset items are as follows:
Intangible assets associated with products 4 to 11 yearsSoftware 3 to 5 years
Since intangible assets acquired through business combinations and under the in-licensing of technologies, etc. consist of combined rights such as license and distribution rights for products under development and it is difficult to classify and identify the amortization expense for these assets by function, such amortization expense is separately presented as “amortization of intangible assets associated with products” in the consolidated statements of income.
- 18 -

The amortization methods, residual values and useful lives of intangible assets are reviewed at the end of fiscal year, and changed, as necessary.
(10) Impairment of property, plant and equipment, goodwill, and intangible assets1) Impairment of property, plant and equipment and intangible assets
At the end of reporting period, the Group assesses whether there is any indication that its property, plant and equipmentand intangible assets may be impaired. If there is an indication of impairment, the recoverable amount of the asset isestimated. Intangible assets not yet available for use or with indefinite useful lives are tested for impairment annuallyirrespective of whether there is any indication of impairment.When it is not possible to estimate the recoverable amount of an individual asset, the Group estimates the recoverableamount of each cash-generating unit to which the asset belongs.The recoverable amount is the higher of fair value less costs of disposal, or value in use. Fair value is calculated usingthe appropriate evaluation model supported by available fair value indicators. Value in use is determined as thediscounted present value of estimated future cash flows using a pretax discount rate that reflects current marketevaluation for the time value of money and the risks specific to the asset.Where the carrying amount of the asset or cash-generating unit exceeds its recoverable amount, the asset is writtendown to its recoverable amount and profit or loss is recognized.
2) Impairment of goodwillGoodwill is tested for impairment annually or whenever there is any indication of impairment.
3) Reversal of impairment lossFor assets on which an impairment loss was recognized in prior years other than goodwill, the Group confirms whetherthere is any indication that the loss may have decreased or may no longer exist, including any change in matters basedon which the recoverable amount is determined as of the end of the reporting period.If the above indication exists, the recoverable amount of the asset or cash-generating unit is estimated. If therecoverable amount is greater than the carrying amount before impairment of the asset in the asset or cash-generatingunit after taking into account the depreciation, a reversal of an impairment loss is recognized, to the extent the amountdoes not exceed the lower of the recoverable amount or the carrying amount before impairment after taking intoaccount the depreciation. A reversal of an impairment loss is recognized as profit or loss.Any impairment loss recognized for goodwill is not reversed.
(11) Financial instruments1) Financial assets (excluding derivatives)(i) Initial recognition and measurement
Purchase or sale of financial instruments is recognized or derecognized based on trade date accounting (contract datebasis).Financial assets are classified as “financial assets measured at amortized cost,” “financial assets measured at fairvalue through other comprehensive income” or “financial assets measured at fair value through profit or loss” uponinitial recognition.
(Debt financial assets)Debt financial assets that meet all the following conditions are classified as “financial assets measured at amortized cost.”(a) The asset is held within a business model whose objective is to hold assets in order to collect contractual cash
flows.(b) The contractual terms of the financial asset give rise on specified dates that are solely payments of principal and
interest on the principal amount outstanding.Debt financial assets that meet all the following conditions are classified as “financial assets measured at fair value through other comprehensive income.”(c) The asset is held within a business model whose objective is to hold assets in order to collect contractual cash
flows and collect by sale.(d) The contractual terms of the financial asset give rise on specified dates that are solely payments of principal and
interest on the principal amount outstanding.
- 19 -

Debt financial assets other than “financial assets measured at amortized cost” and “financial assets measured at fair value through other comprehensive income” are classified as “financial assets measured at fair value through profit or loss.”
(Equity financial assets)Equity financial assets, except in case where they are held for trading, are designated by financial asset to be classified as “financial assets measured at fair value through other comprehensive income” or “financial assets measured at fair value through profit or loss,” and the classification is applied continuously.All financial assets are measured at fair value with addition of transaction costs that are directly attributable to the financial assets, except for the case of being classified in the category of "financial assets measured at fair value through profit or loss."
(ii) Subsequent measurementAfter initial recognition, financial assets are measured based on the classification as follows:
(a) Financial assets measured at amortized costFinancial assets measured at amortized cost are measured at amortized cost using the effective interest method.Amortization under the effective interest method and any gain or loss in the case of derecognition of financial assetsare recognized in profit or loss.
(b) Financial assets measured at fair value through other comprehensive incomeAny change in fair value is recognized as other comprehensive income. If equity financial assets are derecognized orthe fair value decreased significantly, accumulated other comprehensive income is transferred to retained earnings.
(c) Financial assets measured at fair value through profit or lossChanges in fair value are recognized in profit or loss.
(iii) Impairment lossThe Group recognizes impairment loss of financial assets based on its evaluation at the end of each reporting periodwhether there is a significant increase in credit risk of financial assets or groups of financial assets since initialrecognition. Specifically, when there is no significant increase in the credit risk since initial recognition, expectedcredit losses for 12 months are recognized as allowance account for credit losses.On the other hand, when there is a significant increase in credit risk since initial recognition, expected credit lossesfor the remaining life of the financial assets are recognized as allowance account for credit losses.Whether credit risk is significantly increased or not is determined based on the changes in default risk. To determineif there is a change in default risk, factors such as delinquencies or external credit rating of the financial asset areconsidered. However, expected credit losses of trade and other receivables are recognized over their remaining livessince inception simply based on historical credit loss experience.Expected credit losses are measured based on the discounted present value of the differences between the contractualcash flows and the cash flows expected to be received.
(iv) DerecognitionThe Group derecognizes a financial asset when the contractual rights to the cash flows from the financial asset expireor when it transfers the financial asset and substantially all the risks and rewards incidental to ownership of thefinancial asset.In cases where the Group neither transfers nor retains substantially all the risks and rewards of ownership butcontinues to control the assets transferred, the Group recognizes the retained interest in assets and related liabilitiesthat might be payable.
2) Financial liabilities (excluding derivatives)(i) Initial recognition and measurement
Upon initial recognition, financial liabilities held for trading are classified as financial liabilities measured at fairvalue through profit or loss, while other financial liabilities are classified as financial liabilities measured atamortized cost.Financial liabilities are measured at fair value at initial recognition. Financial liabilities measured at amortized costare measured deducting transaction costs that are directly attributable to the issue of the financial liabilities.
- 20 -

(ii) Subsequent measurementAfter initial recognition, financial liabilities are measured based on the classification as follows:
(a) Financial liabilities measured at amortized costFinancial liabilities measured at amortized cost are measured at amortized cost using the effective interest method.Amortization under the effective interest method and any gain or loss in the case of derecognition of financialliabilities are recognized in profit or loss.
(b) Financial liabilities measured at fair value through profit or lossChanges in fair value are recognized in profit or loss.
(iii) DerecognitionFinancial liabilities are derecognized when the obligation specified in the contract is discharged or cancelled orexpires.
3) DerivativesThe Group hedges the risks arising mainly from their exposure to fluctuations in foreign exchange rates and interestrates by using derivative financial instruments such as forward exchange contracts and currency options.Derivatives are initially recognized at fair value of the date when the contracts are entered into and are subsequentlymeasured at their fair values at the end of the reporting period.Derivatives to which hedge accounting is not applied are classified as financial assets or liabilities measured at fairvalue through profit or loss, and any change in fair value is recognized at the end of the reporting period.
4) Hedge accountingHedges that meet criteria for hedge accounting are accounted for as follows:Relationship between the hedging instrument and the hedged item is documented based on the risk managementstrategy and the risk management purpose at the inception of the hedge.
(i) Fair value hedgesChanges in the fair value of derivatives are recognized in profit or loss.Changes in the fair value of the hedged item attributable to the hedged risk adjust the carrying amount of the hedgeditem and are recognized in profit or loss.
(ii) Cash flow hedgesThe effective portion of the gain or loss on the hedging instruments is recognized in other comprehensive income,while the ineffective portion is recognized in profit or loss.The cumulative amounts of hedging instruments that has been recognized in other comprehensive income as equityare reclassified to profit or loss when the hedged transaction affects profit or loss.If a hedged item results in the recognition of a non-financial asset or a non-financial liability, the associated amountrecognized in other comprehensive income is accounted for as adjustment to the carrying amount of the non-financial asset or the non-financial liability.When any forecast transaction is no longer expected to occur, any related cumulative gain or loss that has beenrecognized in other comprehensive income as equity is reclassified to profit or loss.When any hedging instrument expires, is sold, or terminated or exercised without the replacement or rollover of thehedging instrument into another hedging instrument, or when any hedge designation regarding all or the portion ofthe hedge relationship accompanying the change in the risk management purpose is revoked, the cumulative amountthat has been recognized in other comprehensive income as equity is continued to be recognized as equity until theforecast transaction occurs or no longer expected to occur.
5) Offsetting financial instrumentsFinancial assets and financial liabilities are offset only when the Group has a legally enforceable right to set off therecognized amounts and the Group intends either to settle on a net basis or to realize the assets and settle the liabilitiessimultaneously.
- 21 -

6) Fair value of financial instrumentsWith regard to the fair value of financial instruments traded on active financial markets as of the end of each reportingperiod, the Group refers to the fair value in the market or dealer prices.The Group calculates the fair value of financial instruments for which an active market does not exist by reference to anappropriate evaluation technique or offered prices by financial institutions.
(12) Cash and cash equivalentsCash and cash equivalents comprise cash on hand, readily available deposits, and short-term, highly liquid investmentshaving maturities of three months or less of the date of acquisition that are readily convertible to known amounts of cashand which are subject to an insignificant risk of changes in value.
(13) InventoriesInventories are measured at the lower of cost and net realizable value.Cost of inventories is principally determined using the weighted average method and includes cost of purchase, cost ofconversion and all incidental costs incurred in bringing the inventories to their present location and condition.Net realizable value is calculated as the estimated selling price in the ordinary course of business less the estimated costsof completion and estimated costs necessary to sell.
(14) Assets held for saleNon-current assets (or disposal groups) are classified as assets held for sale if their carrying amounts will be recoveredprincipally through a sale transaction rather than through continuing use.To be classified as assets held for sale, the asset must be available for immediate sale in its present condition, and the salemust be highly probable. Management of the Group must have a firm commitment to execute the plan to sell the asset andthe sale is expected to be completed within one year from the date of classification, as a general rule.For non-current assets (or disposal groups), depreciation or amortization is ceased. Non-current assets (or disposalgroups) are measured at the lower of their carrying amounts and fair values less costs to sell. The resulting losses arerecognized as impairment losses.
(15) Equity1) Ordinary shares
Ordinary shares are recorded in share capital and capital surplus at their issue price.
2) Treasury sharesWhen the Company reacquires its own treasury shares, the amount of the consideration paid is deducted from equity.When the Company sells treasury shares, the difference between the carrying amount and the consideration receivedfrom the sale is recognized in capital surplus.
(16) Employee benefits1) Post-employment benefits
The Group operates defined benefit plans and defined contribution plans as post-employment benefit plans for itsemployees.(i) Defined benefit plans
Retirement benefit obligations of each plan are determined using the projected unit credit method and, the discountrate is determined by reference to market yield on high-quality corporate bonds having maturity terms consistentwith the estimated term of the related pension obligations.The defined benefit assets and liabilities are calculated by deducting fair value of plan assets from retirement benefitobligations.The Group recognizes the actuarial gains or losses in other comprehensive income and immediately transfers them toretained earnings in the fiscal year in which they were incurred.Past service cost is recognized as profit or loss in the fiscal year in which it was incurred.
- 22 -

(ii) Defined contribution plansFor defined contribution plans, the amount of contributions corresponding to the period in which employees renderedservices is recorded as expenses.
2) Short-term employee benefitsShort-term employee benefits are recognized as an expense when the related service is rendered.Paid absences are recognized as a liability when the Group has legal or constructive obligations resulting from pastservice rendered by the employees and reliable estimates of the obligations can be made.
(17) ProvisionsProvisions are recognized when the Group has present legal or constructive obligations as a result of past events, it isprobable that outflows of resources embodying economic benefits will be occurred to settle the obligations, and reliableestimates of the obligations can be made.When the effect of the time value of money is material in measurement of provisions, the present value of theexpenditures expected to be required to settle the obligations are used.In calculating the present value, the Group principally calculates using the pretax discount rate reflecting the time value ofmoney and the risks specific to the liability.
(18) Government grantsGovernment grants are measured and recognized at fair value, if there is reasonable assurance that the Group will complywith the conditions attaching to them and that the grants will be received.Government grants related to revenue are deducted directly from related costs covered by the grants.Government grants related to assets are deducted directly from the acquisition cost of the assets.
- 23 -

(First-time Adoption)The Group disclosed the Condensed Consolidated Financial Statements under IFRS for the first time from the first quarter of this fiscal year.The latest consolidated financial statements under Japanese GAAP are prepared for the fiscal year ended March 31, 2016, and the IFRS transition date is April 1, 2015.
(1) Exemptions to retrospective application of IFRSIFRS stipulates that an entity adopting IFRS for the first time shall apply IFRS retrospectively to prior periods, inprinciple.However, IFRS 1, “First-time Adoption of International Financial Reporting Standards” (hereinafter “IFRS 1”), allowscertain exemptions from the retrospective application of certain aspects required by IFRS.
The Group has applied the following exemptions in accordance with the transition from Japanese GAAP to IFRS.
1) Business combinationsIFRS 1 permits an entity not to apply IFRS 3 “Business Combinations” retrospectively to business combinations thatoccurred prior to the IFRS transition date. The Group elected to apply this exemption and did not apply IFRS 3retrospectively to business combinations that occurred before the IFRS transition date. Consequently, the amount ofgoodwill arising from business combinations before the date of transition is based on the carrying amount as of the dateof transition under Japanese GAAP. However, expenditures incurred in line with the in-licensing of technologies, etc.that were not identified in the past business combinations and meet the recognition requirements under IFRS arerecorded as “Intangible assets,” and at the same time, the amount of “Goodwill” is reduced. Further, the Groupperformed an impairment test on goodwill at the date of transition regardless of whether there was any indication thatthe goodwill may be impaired.
2) Use of fair value as deemed costIFRS 1 permits an entity to measure items of property, plant and equipment and intangible assets at the IFRS transitiondate at its fair value and use that fair value as deemed cost at that date. The Group elected to use the fair value at theIFRS transition date as deemed cost at the IFRS transition date for certain items of property, plant and equipment. Atthe transition date, the prior carrying amount of property, plant and equipment to which deemed cost was applied was7,439 million yen, and the fair value was 2,451 million yen.
3) Translation differences for foreign operationsIFRS 1 permits to elect the cumulative amount of translation differences for foreign operations to be deemed to be zeroat the IFRS transition date.The Group elected to deem all cumulative translation differences for foreign operations as zero at the IFRS transitiondate.
4) Designation of financial instruments recognized prior to date of transitionIFRS 1 allows entities to determine the classification under IFRS 9 based on facts and circumstances as of the date oftransition and to designate changes in fair values of equity financial assets as financial assets measured through othercomprehensive income based on facts and circumstances existing as of the transaction date. The Group has determinedthe classification under IFRS 9 based on facts and circumstances existing as of the date of transition and designatedsome equity financial assets as financial assets measured through other comprehensive income.
- 24 -

(2) Reconciliations The reconciliations required to be disclosed in the first IFRS financial statements are described below. In the reconciliations below, “Presentation” includes items that do not affect retained earnings and comprehensive income, while “Recognition and measurement” includes items that affect retained earnings and comprehensive income.
Reconciliation of profit or loss and comprehensive income for the six months ended September 30, 2015 (Millions of yen)
Japanese GAAP Japanese GAAP Presentation
Recognition and
measurement IFRS Note IFRS
Net sales 201,729 - 336 202,065 1) Revenue Cost of sales 73,170 (85) 18 73,103 Cost of sales
Gross profit 128,559 85 318 128,962 Gross profit Selling, general and administrative
expenses 85,040 (33,632) (5,022) 46,386 2) Selling, general and administrative expense
- 33,261 (1,382) 31,879 3) Research and development expense
- 852 (114) 738 4) Amortization of intangible assets associated with products
- 671 - 671 5) Other income - 1,360 1 1,361 6) Other expense
- 15 - 15 7) Share of profit of affiliates accounted for using equity method
Operating income 43,519 (1,070) 6,835 49,284 Operating profit Non-operating income 1,984 (1,984) - - Non-operating expense 2,185 (2,185) - - Extraordinary income 494 (494) - - Extraordinary loss 689 (689) - - - 1,699 (196) 1,503 8) Financial income - 1,084 - 1,084 9) Financial expense
Income before income taxes and non-controlling interests 43,123 (59) 6,639 49,703 Profit before tax
Total income taxes 14,982 (59) 61 14,984 10) Income taxes Net income 28,141 - 6,578 34,719 Net profit for the period
Net income 28,141 - 6,578 34,719 Net profit for the period Other comprehensive income Other comprehensive income
Components of other comprehensive income
that will not be reclassified to profit or loss
Unrealized holding gains (losses) on securities 2,281 - 384 2,665 11)
Fair value changes of financial assets measured through other comprehensive income
Remeasurements of defined benefit plans, net of tax 268 - (1,846) (1,578) 12) Remeasurements of defined benefit plans
- - - 1,087 Total other comprehensive income that will
not be reclassified to profit or loss
Components of other comprehensive income
that may be reclassified to profit or loss
Translation adjustments (2,516) - (15) (2,531) Exchange differences on translation of
foreign operations Deferred gains (losses) on hedges (105) - - (105) Cash flow hedges Other comprehensive income
(loss) of equity method companies attributable to the Company
(19) - - (19) Share of other comprehensive income of
affiliates accounted for using equity method
- - - (2,655) Total other comprehensive income that may
be reclassified to profit or loss Total other comprehensive income
(loss) (91) - (1,477) (1,568) Total other comprehensive income, net of tax
Comprehensive income 28,050 - 5,101 33,151 Comprehensive income
- 25 -

Reconciliation of profit or loss and comprehensive income for the fiscal year ended March 31, 2016 (Millions of yen)
Japanese GAAP Japanese GAAP Presentation
Recognition and
measurement IFRS Note IFRS
Net sales 431,701 – (5,937) 425,764 1) Revenue Cost of sales 155,806 (69) 65 155,802 Cost of sales
Gross profit 275,895 69 (6,002) 269,962 Gross profit Selling, general and administrative
expenses 180,988 (75,468) (9,176) 96,344 2) Selling, general and administrative expense
– 75,293 (10,680) 64,613 3) Research and development expense
– 1,700 (227) 1,473 4) Amortization of intangible assets associated with products
– 1,603 (2) 1,601 5) Other income – 25,785 1,576 27,361 6) Other expense
– 31 – 31 7) Share of profit of affiliates accounted for using equity method
Operating income 94,907 (25,607) 12,503 81,803 Operating profit Non-operating income 3,976 (3,976) – – Non-operating expense 4,120 (4,120) – – Extraordinary income 14,132 (14,132) – – Extraordinary loss 24,583 (24,583) – – – 16,399 (13,406) 2,993 8) Financial income – 1,504 37 1,541 9) Financial expense
Income before income taxes and non-controlling interests 84,312 (117) (940) 83,255 Profit before tax
Total income taxes 30,155 (117) (3,817) 26,221 10) Income taxes Net income 54,157 – 2,877 57,034 Net profit
Net income 54,157 – 2,877 57,034 Net profit Other comprehensive income Other comprehensive income
Components of other comprehensive income
that will not be reclassified to profit or loss
Unrealized holding gains (losses) on securities (3,054) – 9,575 6,521 11)
Fair value changes of financial assets measured through other comprehensive income
Remeasurements of defined benefit plans, net of tax (7,724) – 1,613 (6,111) 12) Remeasurements of defined benefit plans
– – – 410 Total other comprehensive income that will
not be reclassified to profit or loss
Components of other comprehensive income
that may be reclassified to profit or loss
Translation adjustments (4,954) – (23) (4,977) Exchange differences on translation of
foreign operations Deferred gains (losses) on hedges (101) – – (101) Cash flow hedges Other comprehensive income
(loss) of equity method companies attributable to the Company
(30) – – (30) Share of other comprehensive income of
affiliates accounted for using equity method
– – – (5,108) Total other comprehensive income that may
be reclassified to profit or loss Total other comprehensive income
(loss) (15,863) – 11,165 (4,698) Total other comprehensive income, net of tax
Comprehensive income 38,294 – 14,042 52,336 Comprehensive income
- 26 -

Reconciliation of equity as of the date of transition to IFRS (April 1, 2015) (Millions of yen)
Japanese GAAP Japanese GAAP Presentation
Recognition and
measurement IFRS Note IFRS
Assets Assets
Fixed assets Non-current assets Total property, plant and
equipment 92,497 (756) (4,470) 87,271 13) Property, plant and equipment
Intangible fixed assets
Goodwill 81,517 – (476) 81,041 14) Goodwill
Software 4,275 (4,275) – –
Other 31,127 10,247 9,916 51,290 15) Intangible assets
Investments and other assets
– 278 – 278 16) Investments accounted for using equity method
Investment in securities 76,328 16,601 2,510 95,439 17) Other financial assets
Net defined benefit asset 15,730 – – 15,730 Net defined benefit assets
Other 23,417 (22,556) – 861 19) Other non-current assets
Deferred tax assets 763 8,319 (675) 8,407 20) Deferred tax assets Less allowance for doubtful
receivables (2) 2 – –
Total fixed assets 325,652 7,860 6,805 340,317 Total non-current assets
Current assets Current assets Merchandise and finished
goods 63,566 18,758 – 82,324 21) Inventories
Work in process 582 (582) – –
Raw materials and supplies 20,943 (20,943) – –
Notes and accounts receivable - trade 130,331 (44) – 130,287 Trade and other receivables
Marketable securities 118,805 (118,805) – –
Deposits 192,758 (192,758) – –
– 297,187 (5) 297,182 22) Other financial assets
Other 18,186 (8,758) – 9,428 23) Other current assets
Deferred tax assets 8,319 (8,319) – –
Cash and time deposits 50,203 23,134 – 73,337 24) Cash and cash equivalents Less allowance for doubtful
receivables (44) 44 – –
– – – 592,558 Subtotal
– 3,526 – 3,526 25) Assets held for sale
Total current assets 603,649 (7,560) (5) 596,084 Total current assets
Total assets 929,301 300 6,800 936,401 Total assets
- 27 -

(Millions of yen)
Japanese GAAP Japanese GAAP Presentation
Recognition and
measurement IFRS Note IFRS
Liabilities and equity
Liabilities Liabilities
Long-term liabilities Non-current liabilities Long-term debt, less current
maturities 894 – – 894 Borrowings
– 2,843 – 2,843 26) Other financial liabilities
Net defined benefit liability 2,456 – – 2,456 Net defined benefit liabilities Reserve for health management
allowances for HIV compensation
1,700 4,767 – 6,467 27) Provisions
Reserve for health management allowances for SMON compensation
2,731 (2,731) – –
Reserve for HCV litigation 2,036 (2,036) – –
Other 3,875 (2,843) 6,307 7,339 28) Other non-current liabilities
Deferred tax liabilities 9,776 – (1,765) 8,011 29) Deferred tax liabilities
Total long-term liabilities 23,468 – 4,542 28,010 Total non-current liabilities
Current liabilities Current liabilities Current maturities of long-term
debt 132 – – 132 Borrowings
Notes and accounts payable - trade 34,620 (35) – 34,585 Trade and other payables
Accounts payable - other 25,386 (25,386) – –
– 34,274 597 34,871 30) Other financial liabilities
Income taxes payable 19,758 (569) – 19,189 31) Income taxes payable
Reserve for sales returns 127 311 – 438 32) Provisions
Reserve for sales rebates 11 (11) – –
Reserve for employees’ bonuses 9,957 (9,957) – –
Other 15,408 1,673 6,100 23,181 33) Other current liabilities
Total current liabilities 105,399 300 6,697 112,396 Total current liabilities
Total liabilities 128,867 300 11,239 140,406 Total liabilities
Net assets Equity
Common stock 50,000 – – 50,000 Share capital
Capital surplus 451,186 – – 451,186 Capital surplus
Treasury stock, at cost (493) – – (493) Treasury shares
Retained earnings 275,325 – (8,047) 267,278 34) Retained earnings Total accumulated other
comprehensive income 12,961 – 3,596 16,557 35) Other components of equity
– – – 784,528 Total equity attributable to owners of the
Company Non-controlling interests 11,455 – 12 11,467 Non-controlling interests
Total net assets 800,434 – (4,439) 795,995 Total equity
Total liabilities and net assets 929,301 300 6,800 936,401 Total liabilities and equity
- 28 -

Reconciliation of equity as of September 30, 2015 (Millions of yen)
Japanese GAAP Japanese GAAP Presentation
Recognition and
measurement IFRS Note IFRS
Assets Assets
Fixed assets Non-current assets Total property, plant and
equipment 90,246 (332) (4,488) 85,426 13) Property, plant and equipment
Intangible fixed assets
Goodwill 75,916 - 4,767 80,683 14) Goodwill
Other 33,303 5,173 11,737 50,213 15) Intangible assets
Investments and other assets
- 260 - 260 16) Investments accounted for using equity method
Investment in securities 69,706 15,985 2,887 88,578 17) Other financial assets
Net defined benefit asset 18,159 - (3,964) 14,195 18) Net defined benefit assets
Other 22,149 (21,420) - 729 19) Other non-current assets
Deferred tax assets 433 7,750 (2,399) 5,784 20) Deferred tax assets Less allowance for doubtful
receivables (2) 2 - -
Total fixed assets 309,910 7,418 8,540 325,868 Total non-current assets
Current assets Current assets Merchandise and finished goods 56,183 20,887 110 77,180 21) Inventories
Work in process 363 (301) (62) -
Raw materials and supplies 20,586 (20,586) - -
Notes and accounts receivable - trade 129,149 (40) - 129,109 Trade and other receivables
Marketable securities 111,000 (111,000) - -
Deposits 192,969 (192,969) - -
- 214,831 (5) 214,826 22) Other financial assets
Other 17,127 (7,626) - 9,501 23) Other current assets
Deferred tax assets 7,750 (7,750) - -
Cash and time deposits 75,892 96,762 - 172,654 24) Cash and cash equivalents Less allowance for doubtful
receivables (40) 40 - -
- - - 603,270 Subtotal
- 332 - 332 25) Assets held for sale
Total current assets 610,979 (7,420) 43 603,602 Total current assets
Total assets 920,889 (2) 8,583 929,470 Total assets
- 29 -

(Millions of yen)
Japanese GAAP Japanese GAAP Presentation
Recognition and
measurement IFRS Note IFRS
Liabilities and equity
Liabilities Liabilities
Long-term liabilities Non-current liabilities Long-term debt, less current
maturities 797 - - 797 Borrowings
- 2,784 - 2,784 26) Other financial liabilities
Net defined benefit liability 2,424 - - 2,424 Net defined benefit liabilities Reserve for health management
allowances for HIV compensation
1,700 4,380 - 6,080 27) Provisions
Reserve for health management allowances for SMON compensation
2,514 (2,514) - -
Reserve for HCV litigation 1,866 (1,866) - -
Other 3,778 (2,784) 5,971 6,965 28) Other non-current liabilities
Deferred tax liabilities 11,588 - (4,004) 7,584 29) Deferred tax liabilities
Total long-term liabilities 24,667 - 1,967 26,634 Total non-current liabilities
Current liabilities Current liabilities Current maturities of long-term
debt 121 - - 121 Borrowings
Notes and accounts payable - trade 28,825 (36) - 28,789 Trade and other payables
Accounts payable - other 15,872 (15,872) - -
- 24,662 - 24,662 30) Other financial liabilities
Income taxes payable 13,313 (808) (147) 12,358 31) Income taxes payable
Other reserve 129 - - 129 Provisions
Reserve for employees’ bonuses 9,965 (9,965) - -
Other 10,292 2,017 6,101 18,410 33) Other current liabilities
Total current liabilities 78,517 (2) 5,954 84,469 Total current liabilities
Total liabilities 103,184 (2) 7,921 111,103 Total liabilities
Net assets Equity
Common stock 50,000 - - 50,000 Share capital
Capital surplus 451,186 - - 451,186 Capital surplus
Treasury stock, at cost (493) - - (493) Treasury shares
Retained earnings 292,131 - (3,059) 289,072 34) Retained earnings Total accumulated other
comprehensive income 13,571 - 3,696 17,267 35) Other components of equity
- - - 807,032 Total equity attributable to owners of the
Company Non-controlling interests 11,310 - 25 11,335 Non-controlling interests
Total net assets 817,705 - 662 818,367 Total equity
Total liabilities and net assets 920,889 (2) 8,583 929,470 Total liabilities and equity
- 30 -

Reconciliation of equity as of March 31, 2016 (Millions of yen)
Japanese GAAP Japanese GAAP Presentation
Recognition and
measurement IFRS Note IFRS
Assets Assets
Fixed assets Non-current assets Total property, plant and
equipment 88,294 (147) (4,070) 84,077 13) Property, plant and equipment
Intangible fixed assets
Goodwill 70,515 – 9,996 80,511 14) Goodwill
Software 3,680 (3,680) – –
Other 28,376 8,005 19,543 55,924 15) Intangible assets
Investments and other assets
– 265 – 265 16) Investments accounted for using equity method
Investment in securities 49,835 12,845 2,839 65,519 17) Other financial assets
Net defined benefit asset 8,170 – – 8,170 Net defined benefit assets
Other 18,068 (17,436) – 632 19) Other non-current assets
Deferred tax assets 6,052 7,287 (171) 13,168 20) Deferred tax assets Less allowance for doubtful
receivables (1) 1 – –
Total fixed assets 272,989 7,140 28,137 308,266 Total non-current assets
Current assets Current assets Merchandise and finished
goods 52,623 23,008 66 75,697 21) Inventories
Work in process 552 (552) – –
Raw materials and supplies 22,456 (22,456) – –
Notes and accounts receivable - trade 121,288 (39) – 121,249 Trade and other receivables
Marketable securities 96,500 (96,500) – –
Deposits 193,147 (193,147) – –
– 351,665 – 351,665 22) Other financial assets
Other 20,765 (8,263) – 12,502 23) Other current assets
Deferred tax assets 7,287 (7,287) – –
Cash and time deposits 142,674 (53,755) – 88,919 24) Cash and cash equivalents Less allowance for doubtful
receivables (39) 39 – –
– – – 650,032 Subtotal
– 147 – 147 25) Assets held for sale
Total current assets 657,253 (7,140) 66 650,179 Total current assets
Total assets 930,242 – 28,203 958,445 Total assets
- 31 -
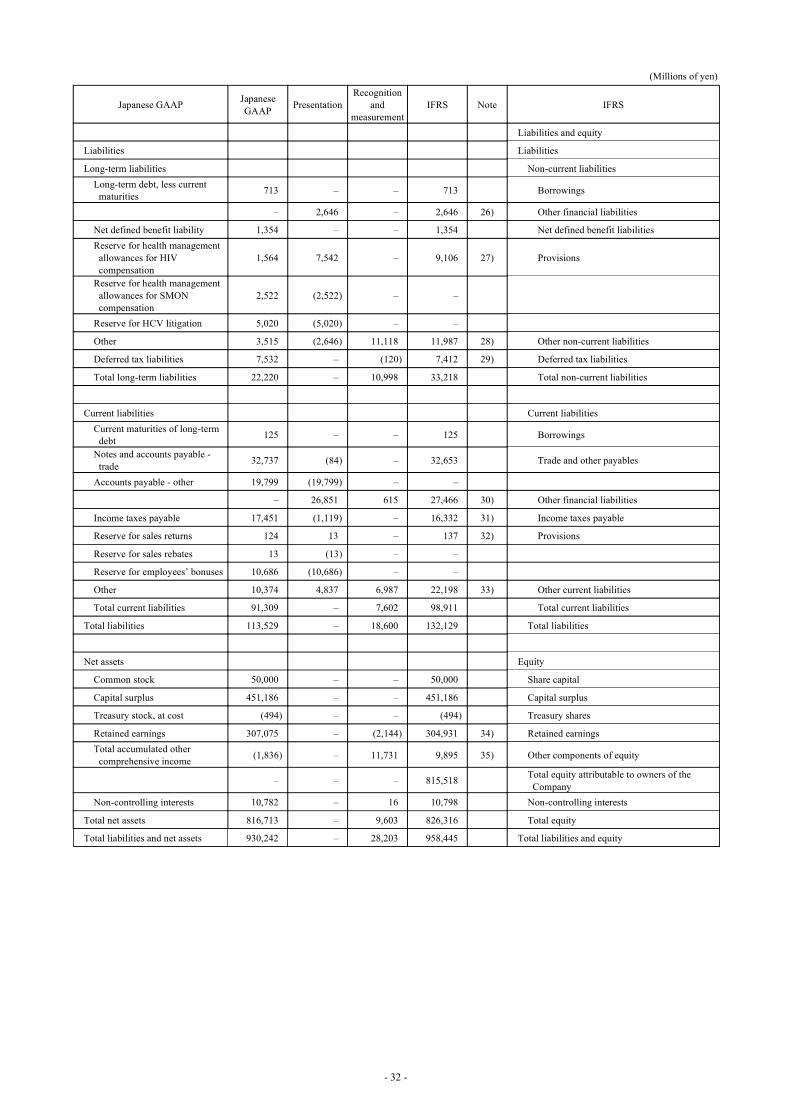
(Millions of yen)
Japanese GAAP Japanese GAAP Presentation
Recognition and
measurement IFRS Note IFRS
Liabilities and equity
Liabilities Liabilities
Long-term liabilities Non-current liabilities Long-term debt, less current
maturities 713 – – 713 Borrowings
– 2,646 – 2,646 26) Other financial liabilities
Net defined benefit liability 1,354 – – 1,354 Net defined benefit liabilities Reserve for health management
allowances for HIV compensation
1,564 7,542 – 9,106 27) Provisions
Reserve for health management allowances for SMON compensation
2,522 (2,522) – –
Reserve for HCV litigation 5,020 (5,020) – –
Other 3,515 (2,646) 11,118 11,987 28) Other non-current liabilities
Deferred tax liabilities 7,532 – (120) 7,412 29) Deferred tax liabilities
Total long-term liabilities 22,220 – 10,998 33,218 Total non-current liabilities
Current liabilities Current liabilities Current maturities of long-term
debt 125 – – 125 Borrowings
Notes and accounts payable - trade 32,737 (84) – 32,653 Trade and other payables
Accounts payable - other 19,799 (19,799) – –
– 26,851 615 27,466 30) Other financial liabilities
Income taxes payable 17,451 (1,119) – 16,332 31) Income taxes payable
Reserve for sales returns 124 13 – 137 32) Provisions
Reserve for sales rebates 13 (13) – –
Reserve for employees’ bonuses 10,686 (10,686) – –
Other 10,374 4,837 6,987 22,198 33) Other current liabilities
Total current liabilities 91,309 – 7,602 98,911 Total current liabilities
Total liabilities 113,529 – 18,600 132,129 Total liabilities
Net assets Equity
Common stock 50,000 – – 50,000 Share capital
Capital surplus 451,186 – – 451,186 Capital surplus
Treasury stock, at cost (494) – – (494) Treasury shares
Retained earnings 307,075 – (2,144) 304,931 34) Retained earnings Total accumulated other
comprehensive income (1,836) – 11,731 9,895 35) Other components of equity
– – – 815,518 Total equity attributable to owners of the
Company Non-controlling interests 10,782 – 16 10,798 Non-controlling interests
Total net assets 816,713 – 9,603 826,316 Total equity
Total liabilities and net assets 930,242 – 28,203 958,445 Total liabilities and equity
- 32 -
Notes to reconciliation of profit or loss and comprehensive income and reconciliation of equity 1) Revenue
(Recognition and measurement) Under Japanese GAAP, revenue from sales alliance and out-licensing of technologies, etc. was recorded as one-time income. However, under IFRS, when contractual obligations are not fulfilled, such revenue is recorded as deferred income and the income is recognized over the period in which the obligations are performed. As a result, the amount of revenue has increased or decreased.
2) Selling, general and administrative expense (Presentation) Research and development expenses and amortization of intangible assets included in “Selling, general and administrative expenses” under Japanese GAAP have been presented separately as “Research and development expense” and “Amortization of intangible assets associated with products” under IFRS. Donations presented as “Non-operating expense” under Japanese GAAP have been included in “Selling, general and administrative expense” under IFRS. (Recognition and measurement) Goodwill was amortized over a specified period under Japanese GAAP while it is not amortized under IFRS. Consequently, there has been a decrease in “Selling, general and administrative expense.” Under Japanese GAAP, with regard to retirement benefits under defined benefit plans, interest expenses and expected returns on pension assets were recognized as profit or loss. The portion of actuarial gains or losses and past service cost that did not constitute profit or loss in the fiscal year in which they were incurred was recognized as other comprehensive income, and subsequently as profit or loss over certain future periods. On the other hand, under IFRS, net interest expenses are recognized as profit or loss at the amount calculated by multiplying net defined benefit asset (obligation) by a discount rate. Past service cost is recognized as profit or loss in the fiscal year in which it was incurred, and actuarial gains or losses are recorded in other comprehensive income as remeasurements of net defined benefit asset (obligation), and transferred directly to retained earnings, rather than through profit or loss. As a result, the amount of “Selling, general and administrative expense” related to retirement benefits has increased.
3) Research and development expense (Presentation) Research and development expenses included in “Selling, general and administrative expenses” under Japanese GAAP have been presented separately as “Research and development expense” under IFRS. (Recognition and measurement) Under Japanese GAAP, expenses associated with the in-licensing of products and technologies that were principally incurred before filing an application for approval from regulatory authorities were recorded as research and development expenses, but under IFRS, such expenses that satisfy certain criteria are recorded as assets. Retirement benefits under defined benefit plans are accounted for in the same way as described in “2) Selling, general and administrative expense.” As a result, the amount of “Research and development expense” has decreased.
4) Amortization of intangible assets associated with products (Presentation) Amortization of intangible assets included in “Selling, general and administrative expenses” under Japanese GAAP has been presented separately as “Amortization of intangible assets associated with products” under IFRS. (Recognition and measurement) Under Japanese GAAP, expenses associated with the in-licensing of products and technologies that were principally incurred before filing an application for approval from regulatory authorities were recorded as research and development expenses, but under IFRS, such expenses that satisfy certain criteria are recorded as assets and amortized over their estimated useful lives on a straight-line basis. Also, the useful life of license fees under certain distribution agreements, etc. was revised upon adoption of IFRS. As a result, the amount of “Amortization of intangible assets associated with products” has decreased.
- 33 -

5) Other income (Presentation) “Rent income” presented as “Non-operating income” under Japanese GAAP has been included in “Other income” under IFRS. “Gain on sales of property, plant and equipment” presented as “Extraordinary income” under Japanese GAAP has been included in “Other income” under IFRS. In addition, certain items of income presented as “Other” in “Non-operating income” under Japanese GAAP have been included in “Other income” under IFRS.
6) Other expense (Presentation) “Loss on disposal of property, plant and equipment” presented as “Non-operating expense” under Japanese GAAP has been included in “Other expense” under IFRS. “Loss on impairment of fixed assets,” “Restructuring expenses” and “Provision of reserve for HCV litigation” presented as “Extraordinary loss” under Japanese GAAP have been included in “Other expense” under IFRS. In addition, certain items of expenses presented as “Other” in “Non-operating expense” under Japanese GAAP have been included in “Other expense” under IFRS. (Recognition and measurement) Under Japanese GAAP, costs associated with the in-licensing of products and technologies that were principally incurred before filing an application for approval from regulatory authorities were recorded as research and development expenses, but under IFRS, such costs that satisfy certain criteria are recorded as assets. For certain intangible assets additionally recognized upon adoption of IFRS, the carrying amount is reduced to the recoverable amount when the discontinuation of the development, etc. is decided during the period, and the difference is recognized as impairment loss in the same period. As a result, the amount of “Other expense” has increased.
7) Share of profit of affiliates accounted for using equity method (Presentation) “Equity in earnings of affiliates” presented as “Non-operating income” under Japanese GAAP has been presented separately as “Share of profit of affiliates accounted for using equity method” under IFRS.
8) Financial income (Presentation) “Interest income” and “Dividend income” presented as “Non-operating income” under Japanese GAAP have been included in “Financial income” under IFRS. “Gain on sales of investment in securities” presented as “Extraordinary income” under Japanese GAAP has been included in “Financial income” under IFRS. In addition, certain items of income presented as “Other” in “Non-operating income” under Japanese GAAP have been included in “Financial income” under IFRS. (Recognition and measurement) Under Japanese GAAP, gain on sales of investment in securities was recorded as “Extraordinary income.” However, under IFRS, it is allowed to designate equity financial assets as financial assets measured through other comprehensive income, and gain on sales of equity financial assets that has been designated so is recorded as other comprehensive income. As a result, the amount of “Financial income” has decreased.
9) Financial expense (Presentation) “Interest expense,” “Foreign exchange losses” and “Loss on investment securities operation” presented as “Non-operating expense” under Japanese GAAP have been included in “Financial expense” under IFRS. “Loss on valuation of investment in securities” presented as “Extraordinary loss” under Japanese GAAP has been included in “Financial expense” under IFRS. In addition, certain items of expenses presented as “Other” in “Non-operating expense” under Japanese GAAP have been included in “Financial expense” under IFRS.
- 34 -
10) Income taxes (Recognition and measurement) Since certain gain on sales of investment in securities recorded as “Extraordinary income” under Japanese GAAP has been recorded as other comprehensive income under IFRS, income taxes on such gain on sales of investment in securities are recorded as other comprehensive income. In addition, temporary differences arose as a result of the reconciliations to adoption of IFRS including the application of the estimated effective tax rate to quarterly income taxes under IFRS. Consequently, the amount of “Income taxes” has increased or decreased.
11) Fair value changes of financial assets measured through other comprehensive income (Recognition and measurement) Certain gain on sales of investment in securities recorded as “Extraordinary income” under Japanese GAAP and income taxes on such gain on sales are recorded as “Fair value changes of financial assets measured through other comprehensive income” under IFRS. In addition, unlisted stocks were principally stated at cost calculated by using the moving average method under Japanese GAAP, but under IFRS, they are measured at fair value. As a result, the amount of “Fair value changes of financial assets measured through other comprehensive income” has increased.
12) Remeasurements of defined benefit plans (Recognition and measurement) Under Japanese GAAP, actuarial gains and losses associated with retirement benefits were amortized on a straight-line basis from the fiscal year following the year in which they were incurred over the average remaining service years of employees at the time they were incurred. However, under IFRS, the Group fully recognizes the actuarial gains and losses when they are incurred in other comprehensive income as remeasurements of net defined benefit obligation. As a result, the amount of “Remeasurements of defined benefit plans” has increased. Under IFRS, plan assets are measured at fair value on a quarterly basis, and the resulting actuarial gains or losses have been recorded as other comprehensive income. As a result, the amount of “Remeasurements of defined benefit plans” has increased or decreased.
13) Property, plant and equipment (Presentation) Under Japanese GAAP, “Buildings and structures, net,” “Machinery, equipment and vehicles, net,” “Tools, furniture and fixtures, net,” “Land,” “Leased equipment, net,” and “Construction in progress” were presented separately, whereas they have been included in “Property, plant and equipment” under IFRS. Certain items of assets held for sale included in “Property, plant and equipment” under Japanese GAAP have been presented separately as “Assets held for sale” under IFRS. (Recognition and measurement) The amount of “Property, plant and equipment” has decreased as a result of using the fair value as deemed cost for certain items of property, plant and equipment upon the adoption of IFRS. Real estate acquisition taxes were expensed under Japanese GAAP, whereas they have been included in acquisition cost of property, plant and equipment under IFRS. In addition, acquisition cost of land acquired in the exchange was measured at the carrying amount of the land transferred under Japanese GAAP, but it is measured at the fair value of the land acquired in the exchange under IFRS. As a result, the amount of “Property, plant and equipment” has increased.
14) Goodwill (Recognition and measurement) Due to the adoption of IFRS, expenditures associated with the in-licensing of technologies, etc. that were not identified in the past business combinations and meet the recognition requirements under IFRS have been recorded as “Intangible assets.” As a result, the amount of “Goodwill” has decreased. Under Japanese GAAP, goodwill was amortized over a period in which the effect is expected, but under IFRS, goodwill is not amortized. As a result, the amount of “Goodwill” has increased.
- 35 -

15) Intangible assets (Presentation) “Software” presented separately under Japanese GAAP has been included in “Intangible assets” under IFRS. License fees under distribution agreements, etc. were included in “Other” as investments and other assets under Japanese GAAP, but they have been included in “Intangible assets” under IFRS. (Recognition and measurement) Under Japanese GAAP, expenses associated with the in-licensing of technologies, etc. incurred by the time of filing an application for approval from regulatory authorities were recorded as research and development expenses, but under IFRS, such expenses that satisfy certain criteria are recorded as “Intangible assets.” In addition, expenses associated with the in-licensing of technologies, etc. that were not identified in the past business combinations and meet the recognition requirements under IFRS have been recorded as “Intangible assets,” and at the same time, the amount of “Goodwill” has been reduced. “Intangible assets” are amortized over the estimated useful life on a straight-line basis. Other than that, the useful life of license fees under certain distribution agreements, etc. was revised upon adoption of IFRS. As a result, the amount of “Intangible assets” has increased.
16) Investments accounted for using equity method (Presentation) Investments accounted for using the equity method were included in “Investment in securities” under Japanese GAAP, but they are presented separately as “Investments accounted for using equity method” under IFRS.
17) Other financial assets (non-current) (Presentation) Investments accounted for using the equity method were included in “Investment in securities” under Japanese GAAP, but they are presented separately as “Investments accounted for using equity method” under IFRS. Other “Investment in securities” has been included in “Other financial assets” as non-current assets under IFRS. Long-term accounts receivable - other and long-term guarantee deposits, etc. were included in “Other” as investments and other assets under Japanese GAAP, but they have been included in “Other financial assets” as non-current assets under IFRS. (Recognition and measurement) Under Japanese GAAP, unlisted stocks were stated at cost calculated by using the moving average method. However, under IFRS, unlisted stocks are measured at fair value. As a result, the amount of “Other financial assets” in non-current assets has increased.
18) Net defined benefit assets (Recognition and measurement) Since assets of defined benefit plans are measured at fair value on a quarterly basis under IFRS, the amount of “Net defined benefit assets” has decreased.
19) Other non-current assets (Presentation) License fees under distribution agreements, etc. long-term accounts receivable - other and long-term guarantee deposits, etc. were included in “Other” as investments and other assets under Japanese GAAP. However, under IFRS, license fees under distribution agreements, etc. have been included in “Intangible assets,” whereas long-term accounts receivable - other and long-term guarantee deposits, etc. have been included in “Other financial assets” as non-current assets.
20) Deferred tax assets (Presentation) Deferred tax assets were presented separately as current assets and fixed assets under Japanese GAAP, but the full amount of deferred tax assets has been presented as an item in non-current assets under IFRS.
- 36 -

(Recognition and measurement) “Deferred tax assets” are recognized for the temporary differences resulting from the reconciliations to adoption of IFRS. Under Japanese GAAP, deferred tax assets and liabilities were offset only within the categories of short-term or long-term items. However, the amount of the offset increased because all deferred tax assets and liabilities are classified as non-current items under IFRS. As a result, the amount of “Deferred tax assets” has decreased.
21) Inventories (Presentation) “Merchandise and finished goods,” “Work in process” and “Raw materials and supplies,” which were presented separately under Japanese GAAP, are included in “Inventories” under IFRS. Certain items of assets held for sale included in “Inventories” under Japanese GAAP have been presented separately as “Assets held for sale” under IFRS.
22) Other financial assets (current) (Presentation) Items included in “Marketable securities” under Japanese GAAP, except for securities that become due for maturity within three months from the acquisition date, have been included in “Other financial assets” as current assets under IFRS. Items included in “Deposits” under Japanese GAAP, except for deposits with the deposit period of three months or less (deposit management), have been included in “Other financial assets” as current assets under IFRS. Time deposits with maturities over three months included in “Cash and time deposits” under Japanese GAAP have been included in “Other financial assets” as current assets under IFRS. Accounts receivable - other, derivatives, and advances paid, etc. included in “Other” as current assets under Japanese GAAP have been included in “Other financial assets” as current assets under IFRS.
23) Other current assets (Presentation) Accounts receivable - other, derivatives, and advances paid, etc. included in “Other” as current assets under Japanese GAAP have been included in “Other financial assets” as current assets under IFRS. Short-term loans receivable that become due for maturity within three months from the drawdown date included in “Other” as current assets under Japanese GAAP have been included in “Cash and cash equivalents” under IFRS.
24) Cash and cash equivalents (Presentation) Securities that become due for maturity within three months from the acquisition date, which were included in “Marketable securities” under Japanese GAAP, have been included in “Cash and cash equivalents” under IFRS. Short-term loans receivable that become due for maturity within three months from the drawdown date included in “Other” as current assets under Japanese GAAP have been included in “Cash and cash equivalents” under IFRS. Deposits with the deposit period of three months or less (deposit management) included in “Deposits” under Japanese GAAP have been included in “Cash and cash equivalents” under IFRS. Time deposits with maturities over three months included in “Cash and time deposits” under Japanese GAAP have been included in “Other financial assets” as current assets under IFRS.
25) Assets held for sale (Presentation) Assets held for sale included in “Property, plant and equipment” and “Inventories” under Japanese GAAP have been presented separately as “Assets held for sale” under IFRS.
26) Other financial liabilities (non-current) (Presentation) Guaranty deposits received and lease obligations, etc. included in “Other” as long-term liabilities under Japanese GAAP have been included in “Other financial liabilities” as non-current liabilities under IFRS.
- 37 -

27) Provisions (non-current) (Presentation) “Reserve for health management allowances for HIV compensation,” “Reserve for health management allowances for SMON compensation” and “Reserve for HCV litigation,” which were presented separately under Japanese GAAP, have been included in “Provisions” as non-current liabilities under IFRS.
28) Other non-current liabilities (Presentation) Guaranty deposits received and lease obligations, etc. included in “Other” as long-term liabilities under Japanese GAAP have been included in “Other financial liabilities” as non-current liabilities under IFRS. (Recognition and measurement) Under Japanese GAAP, upfront payments accompanying the out-licensing of technologies, collaborative sales and collaborative sales promotion were recorded as income when they were received. However, under IFRS, when contractual obligations are not fulfilled, such payments are recorded as deferred income and the income is recognized over the period in which the obligations are performed. Accrued paid absences, for which accounting treatment was not required under Japanese GAAP, are recognized as liabilities under IFRS. As a result, the amount of “Other non-current liabilities” has increased.
29) Deferred tax liabilities (Recognition and measurement) “Deferred tax liabilities” are recognized for the temporary differences resulting from the reconciliations to adoption of IFRS. Under Japanese GAAP, deferred tax assets and liabilities were offset only within the categories of short-term or long-term items. However, the amount of the offset increased because all deferred tax assets and liabilities are classified as non-current items under IFRS. As a result, the amount of “Deferred tax liabilities” has decreased.
30) Other financial liabilities (current) (Presentation) “Accounts payable - other,” which was presented separately under Japanese GAAP, have been included in “Other financial liabilities” as current liabilities under IFRS. Accrued expenses, etc. included in “Other” as current liabilities under Japanese GAAP have been included in “Other financial liabilities” as current liabilities under IFRS. (Recognition and measurement) With regard to levies of fixed asset tax, the fixed amount based on the tax notice, etc. was recorded under Japanese GAAP, but under IFRS, the estimated amount of payment is recognized when the obligation of payment is generated.
31) Income taxes payable (Presentation) Accrued business taxes based on the size of business, which were included in “Income taxes payable” under Japanese GAAP, have been included in “Other current liabilities” under IFRS. (Recognition and measurement) Under IFRS, the estimated effective tax rate is applied to quarterly income taxes.
32) Provisions (current) (Presentation) “Reserve for sales returns” and “Reserve for sales rebates” presented separately under Japanese GAAP have been included in “Provisions” as current liabilities under IFRS.
- 38 -
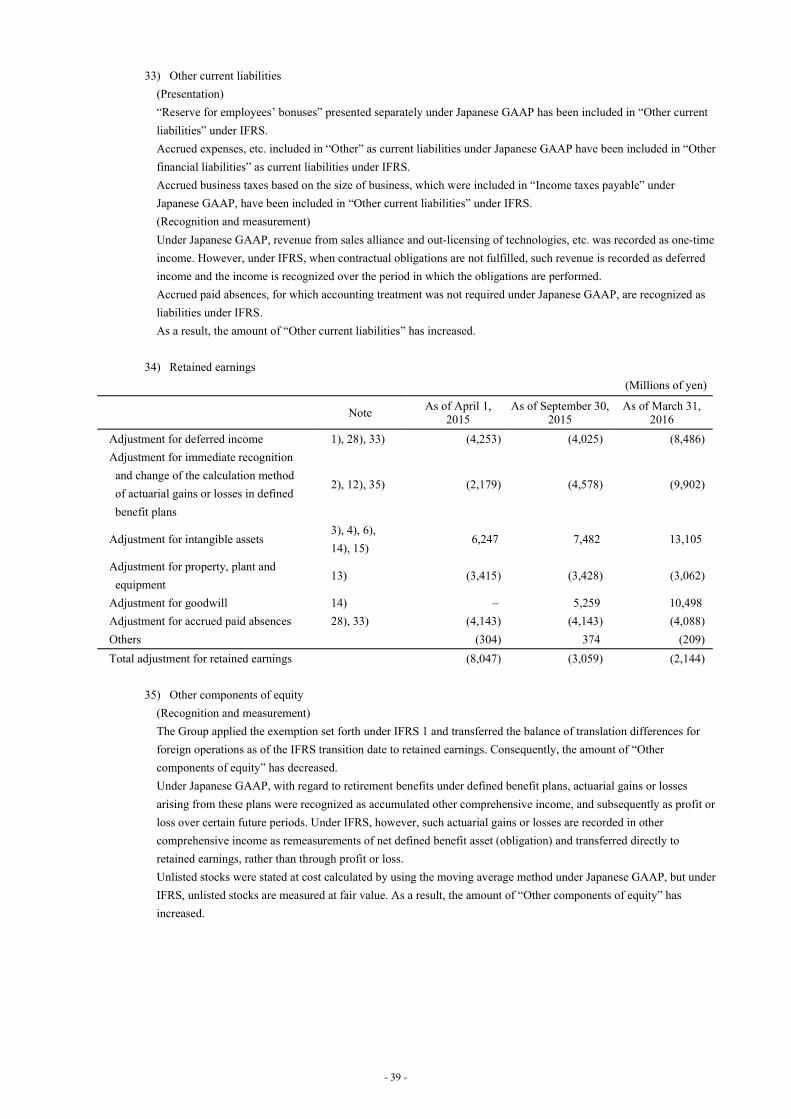
33) Other current liabilities (Presentation) “Reserve for employees’ bonuses” presented separately under Japanese GAAP has been included in “Other current liabilities” under IFRS. Accrued expenses, etc. included in “Other” as current liabilities under Japanese GAAP have been included in “Other financial liabilities” as current liabilities under IFRS. Accrued business taxes based on the size of business, which were included in “Income taxes payable” under Japanese GAAP, have been included in “Other current liabilities” under IFRS. (Recognition and measurement) Under Japanese GAAP, revenue from sales alliance and out-licensing of technologies, etc. was recorded as one-time income. However, under IFRS, when contractual obligations are not fulfilled, such revenue is recorded as deferred income and the income is recognized over the period in which the obligations are performed. Accrued paid absences, for which accounting treatment was not required under Japanese GAAP, are recognized as liabilities under IFRS. As a result, the amount of “Other current liabilities” has increased.
34) Retained earnings (Millions of yen)
Note As of April 1, 2015
As of September 30, 2015
As of March 31, 2016
Adjustment for deferred income 1), 28), 33) (4,253) (4,025) (8,486) Adjustment for immediate recognition
and change of the calculation method of actuarial gains or losses in defined benefit plans
2), 12), 35) (2,179) (4,578) (9,902)
Adjustment for intangible assets 3), 4), 6), 14), 15)
6,247 7,482 13,105
Adjustment for property, plant and equipment
13) (3,415) (3,428) (3,062)
Adjustment for goodwill 14) – 5,259 10,498 Adjustment for accrued paid absences 28), 33) (4,143) (4,143) (4,088) Others (304) 374 (209) Total adjustment for retained earnings (8,047) (3,059) (2,144)
35) Other components of equity (Recognition and measurement) The Group applied the exemption set forth under IFRS 1 and transferred the balance of translation differences for foreign operations as of the IFRS transition date to retained earnings. Consequently, the amount of “Other components of equity” has decreased. Under Japanese GAAP, with regard to retirement benefits under defined benefit plans, actuarial gains or losses arising from these plans were recognized as accumulated other comprehensive income, and subsequently as profit or loss over certain future periods. Under IFRS, however, such actuarial gains or losses are recorded in other comprehensive income as remeasurements of net defined benefit asset (obligation) and transferred directly to retained earnings, rather than through profit or loss. Unlisted stocks were stated at cost calculated by using the moving average method under Japanese GAAP, but under IFRS, unlisted stocks are measured at fair value. As a result, the amount of “Other components of equity” has increased.
- 39 -

Notes to reconciliation of Consolidated Statements of Cash Flows for the six months ended September 30, 2015 and for the fiscal year ended March 31, 2016
The expenditures associated with research and development expenses were classified as cash flows from operating activities under Japanese GAAP because research and development expenses were expensed as incurred, while under IFRS, the capitalized research and development expenses have been classified as cash flows from investing activities.
- 40 -


![FY2015.3 Financial Results PresentationNet income 199.9 180.3 [200.0]-19.5 90.2 238.0 +57.6 131.9 [Note] Net income in forecasts for Fiscal 2016 represents Profit Attributable to owners](https://static.fdocuments.in/doc/165x107/5f1d886109330c7f070688b1/fy20153-financial-results-presentation-net-income-1999-1803-2000-195-902.jpg)

![Brennan, Niamh [1996] Disclosure of Profit Forecasts during Takeover Bids. Doctoral Dissertation, University of Warwick, UK](https://static.fdocuments.in/doc/165x107/55506296b4c905c0448b52ed/brennan-niamh-1996-disclosure-of-profit-forecasts-during-takeover-bids-doctoral-dissertation-university-of-warwick-uk.jpg)