Financial Results for FY2017 - global.kawasaki.com · Gas Turbine & Machinery Main Products: Jet...
24
Financial Results for FY2017 (for the year ended March 31, 2018) April 26, 2018
-
Upload
nguyenminh -
Category
Documents
-
view
224 -
download
0
Transcript of Financial Results for FY2017 - global.kawasaki.com · Gas Turbine & Machinery Main Products: Jet...
Financial Results for FY2017 (for the year ended March 31, 2018)
April 26, 2018
2 © 2018 KAWASAKI HEAVY INDUSTRIES, LTD. All Rights Reserved
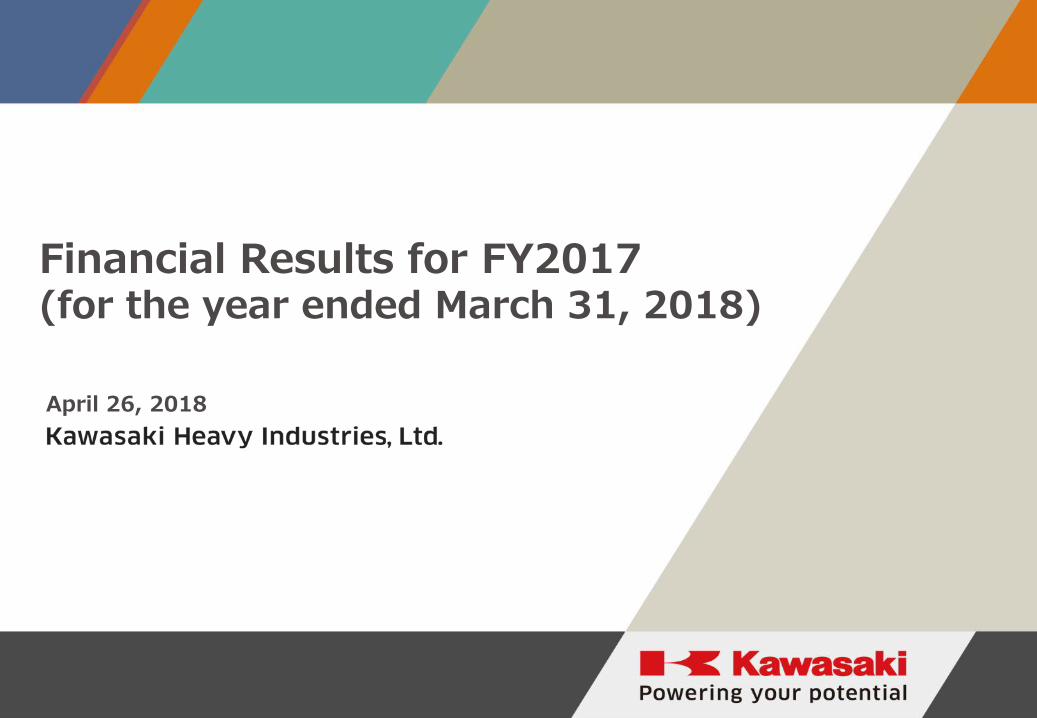
• Consolidated Operating Performance 17 • Forecast by Segment 18 • Before-tax ROIC by Segment 19 • R&D/CAPEX/Number of Employees 20
Table of Contents
• Summary of Financial Results 3 • Financial Results by Segment 4 • Details of Change in Profit 5 • Summary of Income Statement 6 • Financial Results/Forecast by Segment − Ship & Offshore Structure 7 − Rolling Stock 8 − Aerospace 9 −Gas Turbine & Machinery 10 − Plant & Infrastructure 11 −Newly Reorganized Segment 12 −Motorcycle & Engine 13 − Precision Machinery 14
• Summary of Balance Sheet 15 • Summary of Cash Flows 16
Ⅰ. Consolidated Results for FY2017 Ⅱ. Forecast for FY2018
• Historical Data 21 • Market Overview 22
<Appendix>
3 © 2018 KAWASAKI HEAVY INDUSTRIES, LTD. All Rights Reserved
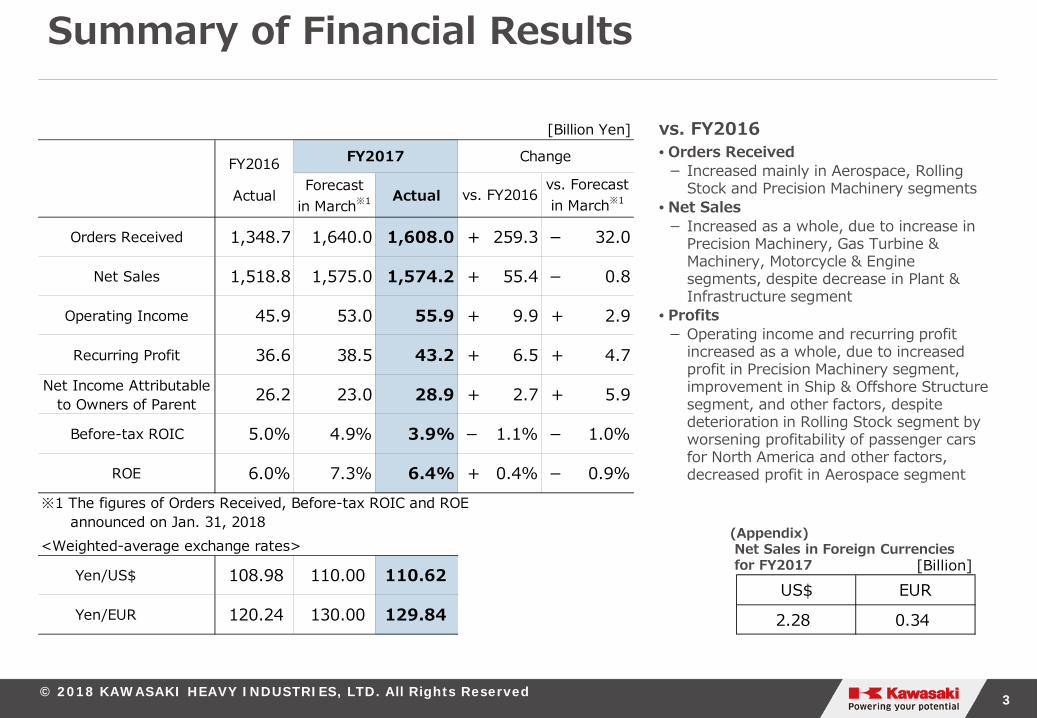
Summary of Financial Results
vs. FY2016
(Appendix) Net Sales in Foreign Currencies for FY2017
[Billion Yen]
FY2016
ActualForecast
in March※1 Actual
Orders Received 1,348.7 1,640.0 1,608.0 + 259.3 - 32.0
Net Sales 1,518.8 1,575.0 1,574.2 + 55.4 - 0.8
Operating Income 45.9 53.0 55.9 + 9.9 + 2.9
Recurring Profit 36.6 38.5 43.2 + 6.5 + 4.7Net Income Attributable
to Owners of Parent 26.2 23.0 28.9 + 2.7 + 5.9
Before-tax ROIC 5.0% 4.9% 3.9% - 1.1% - 1.0%
ROE 6.0% 7.3% 6.4% + 0.4% - 0.9%
<Weighted-average exchange rates>
Yen/US$ 108.98 110.00 110.62
Yen/EUR 120.24 130.00 129.84
FY2017 Change
vs. FY2016vs. Forecastin March※1
※1 The figures of Orders Received, Before-tax ROIC and ROE announced on Jan. 31, 2018
[Billion]US$ EUR
2.28 0.34
• Orders Received − Increased mainly in Aerospace, Rolling
Stock and Precision Machinery segments • Net Sales − Increased as a whole, due to increase in
Precision Machinery, Gas Turbine & Machinery, Motorcycle & Engine segments, despite decrease in Plant & Infrastructure segment
• Profits − Operating income and recurring profit
increased as a whole, due to increased profit in Precision Machinery segment, improvement in Ship & Offshore Structure segment, and other factors, despite deterioration in Rolling Stock segment by worsening profitability of passenger cars for North America and other factors, decreased profit in Aerospace segment
4 © 2018 KAWASAKI HEAVY INDUSTRIES, LTD. All Rights Reserved
[Billion Yen]
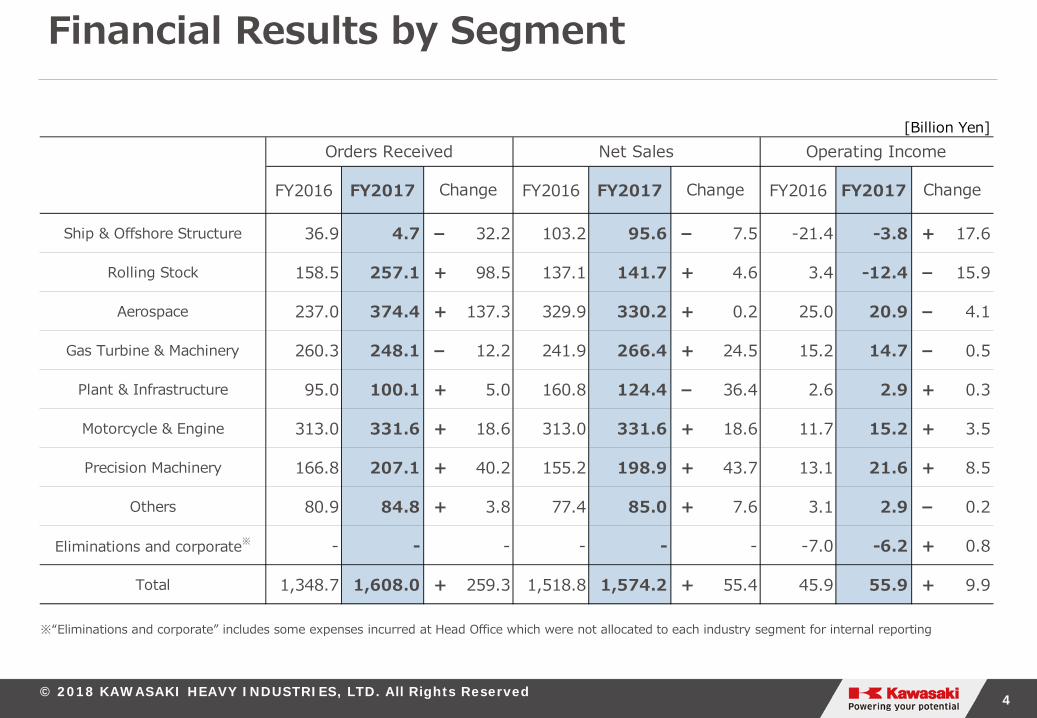
FY2016 FY2017 FY2016 FY2017 FY2016 FY2017
Ship & Offshore Structure 36.9 4.7 - 32.2 103.2 95.6 - 7.5 -21.4 -3.8 + 17.6
Rolling Stock 158.5 257.1 + 98.5 137.1 141.7 + 4.6 3.4 -12.4 - 15.9
Aerospace 237.0 374.4 + 137.3 329.9 330.2 + 0.2 25.0 20.9 - 4.1
Gas Turbine & Machinery 260.3 248.1 - 12.2 241.9 266.4 + 24.5 15.2 14.7 - 0.5
Plant & Infrastructure 95.0 100.1 + 5.0 160.8 124.4 - 36.4 2.6 2.9 + 0.3
Motorcycle & Engine 313.0 331.6 + 18.6 313.0 331.6 + 18.6 11.7 15.2 + 3.5
Precision Machinery 166.8 207.1 + 40.2 155.2 198.9 + 43.7 13.1 21.6 + 8.5
Others 80.9 84.8 + 3.8 77.4 85.0 + 7.6 3.1 2.9 - 0.2
Eliminations and corporate※ - - - - - - -7.0 -6.2 + 0.8
Total 1,348.7 1,608.0 + 259.3 1,518.8 1,574.2 + 55.4 45.9 55.9 + 9.9
Orders Received Net Sales Operating Income
Change Change Change
※“Eliminations and corporate” includes some expenses incurred at Head Office which were not allocated to each industry segment for internal reporting
Financial Results by Segment
5 © 2018 KAWASAKI HEAVY INDUSTRIES, LTD. All Rights Reserved
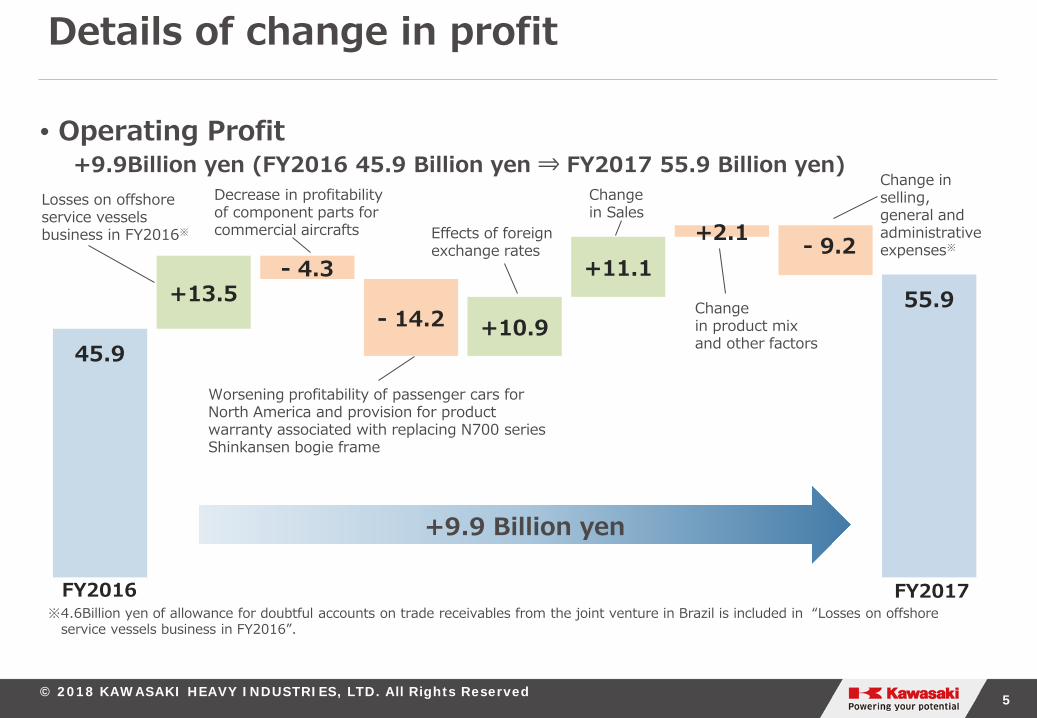
45.9
- 9.2
55.9+13.5- 4.3
- 14.2 +10.9
+11.1+2.1
• Operating Profit +9.9Billion yen (FY2016 45.9 Billion yen ⇒ FY2017 55.9 Billion yen)
FY2016
+9.9 Billion yen
※4.6Billion yen of allowance for doubtful accounts on trade receivables from the joint venture in Brazil is included in “Losses on offshore service vessels business in FY2016”.
Details of change in profit
FY2017
Losses on offshore service vessels business in FY2016※
Decrease in profitability of component parts for commercial aircrafts Effects of foreign
exchange rates
Change in Sales
Change in product mix and other factors
Change in selling, general and administrative expenses※
Worsening profitability of passenger cars for North America and provision for product warranty associated with replacing N700 series Shinkansen bogie frame
6 © 2018 KAWASAKI HEAVY INDUSTRIES, LTD. All Rights Reserved
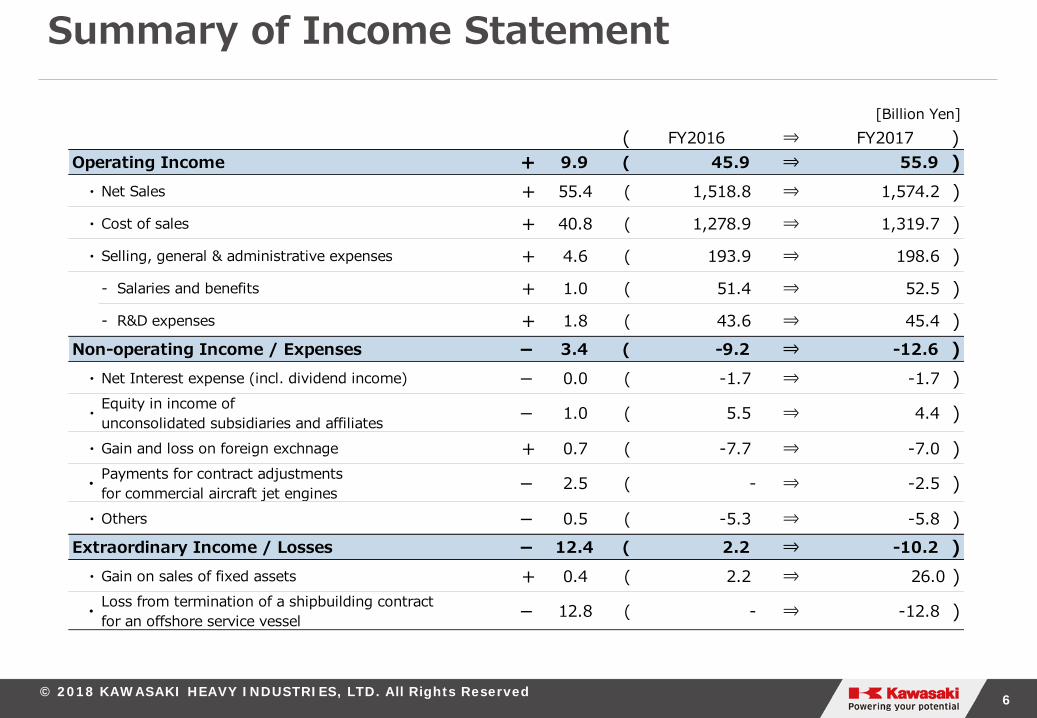
Summary of Income Statement
[Billion Yen]( FY2016 ⇒ FY2017 )
Operating Income + 9.9 ( 45.9 ⇒ 55.9 )・ Net Sales + 55.4 ( 1,518.8 ⇒ 1,574.2 )・ Cost of sales + 40.8 ( 1,278.9 ⇒ 1,319.7 )・ Selling, general & administrative expenses + 4.6 ( 193.9 ⇒ 198.6 )
- Salaries and benefits + 1.0 ( 51.4 ⇒ 52.5 )- R&D expenses + 1.8 ( 43.6 ⇒ 45.4 )
Non-operating Income / Expenses - 3.4 ( -9.2 ⇒ -12.6 )・ Net Interest expense (incl. dividend income) - 0.0 ( -1.7 ⇒ -1.7 )
・ - 1.0 ( 5.5 ⇒ 4.4 )
・ Gain and loss on foreign exchnage + 0.7 ( -7.7 ⇒ -7.0 )
・ - 2.5 ( - ⇒ -2.5 )
・ Others - 0.5 ( -5.3 ⇒ -5.8 )Extraordinary Income / Losses - 12.4 ( 2.2 ⇒ -10.2 )
・ Gain on sales of fixed assets + 0.4 ( 2.2 ⇒ 26.0 )
・ - 12.8 ( - ⇒ -12.8 )
Equity in income of unconsolidated subsidiaries and affiliates
Payments for contract adjustments for commercial aircraft jet engines
Loss from termination of a shipbuilding contract for an offshore service vessel
7 © 2018 KAWASAKI HEAVY INDUSTRIES, LTD. All Rights Reserved
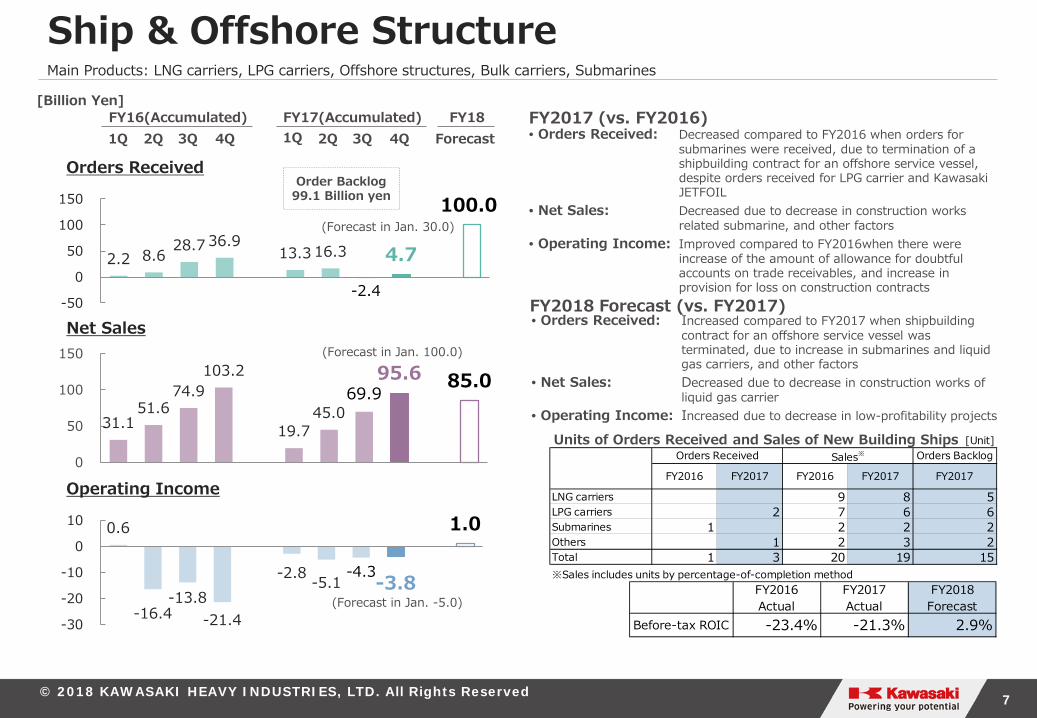
2.2 8.6 28.7 36.9 13.3 16.3
-2.4
4.7
100.0
-50
0
50
100
150
Orders Received
31.1 51.6
74.9 103.2
19.7 45.0
69.9 95.6 85.0
0
50
100
150
Net Sales
0.6
-16.4 -13.8
-21.4
-2.8 -5.1 -4.3 -3.8
1.0
-30
-20
-10
0
10
Operating Income
Units of Orders Received and Sales of New Building Ships
(Forecast in Jan. 30.0)
(Forecast in Jan. 100.0)
(Forecast in Jan. -5.0)
FY2017 (vs. FY2016)
FY2018 Forecast (vs. FY2017)
Order Backlog 99.1 Billion yen
Ship & Offshore Structure Main Products: LNG carriers, LPG carriers, Offshore structures, Bulk carriers, Submarines
1Q 2Q 3Q 4Q 1Q 2Q 3Q 4Q Forecast FY16(Accumulated) FY17(Accumulated) FY18
[Billion Yen]
[Unit]Orders Received Sales※ Orders Backlog
FY2016 FY2017 FY2016 FY2017 FY2017
LNG carriers 9 8 5LPG carriers 2 7 6 6Submarines 1 2 2 2Others 1 2 3 2Total 1 3 20 19 15※Sales includes units by percentage-of-completion method
Before-tax ROIC -23.4% -21.3% 2.9%
FY2016Actual
FY2017Actual
FY2018Forecast
• Orders Received: Decreased compared to FY2016 when orders for submarines were received, due to termination of a shipbuilding contract for an offshore service vessel, despite orders received for LPG carrier and Kawasaki JETFOIL
• Net Sales: Decreased due to decrease in construction works related submarine, and other factors
• Operating Income: Improved compared to FY2016when there were increase of the amount of allowance for doubtful accounts on trade receivables, and increase in provision for loss on construction contracts
• Orders Received: Increased compared to FY2017 when shipbuilding contract for an offshore service vessel was terminated, due to increase in submarines and liquid gas carriers, and other factors
• Net Sales: Decreased due to decrease in construction works of liquid gas carrier
• Operating Income: Increased due to decrease in low-profitability projects
8 © 2018 KAWASAKI HEAVY INDUSTRIES, LTD. All Rights Reserved
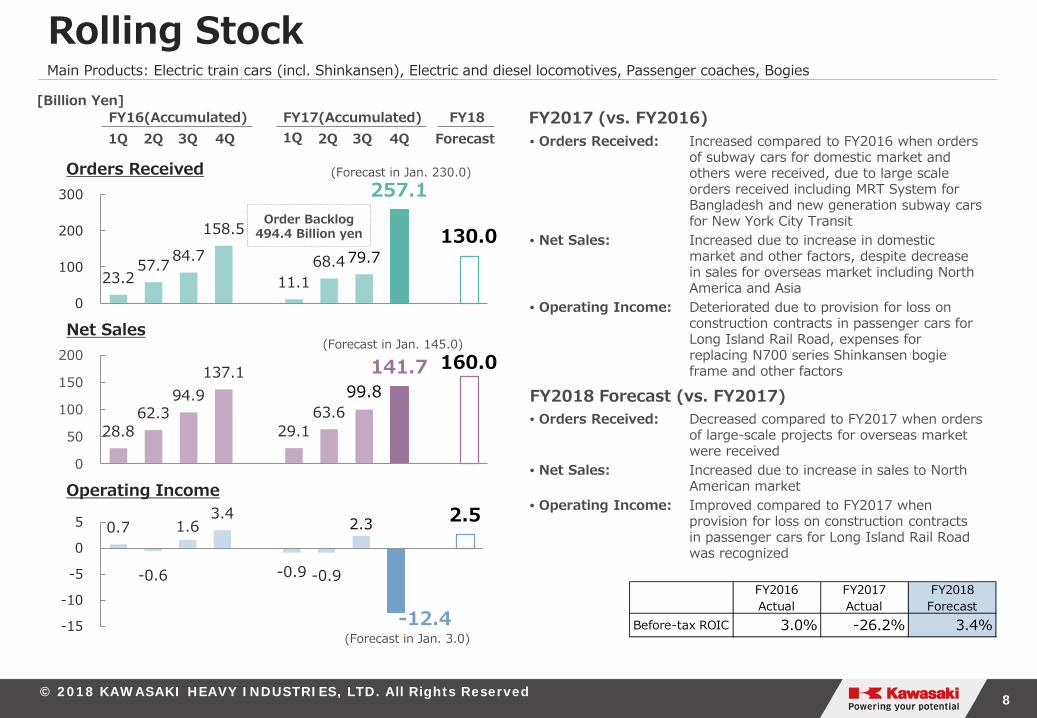
23.2 57.7 84.7
158.5
11.1 68.4 79.7
257.1
130.0
0
100
200
300
Orders Received
28.8 62.3
94.9 137.1
29.1 63.6
99.8 141.7 160.0
0
50
100
150
200
Net Sales
0.7
-0.6
1.6 3.4
-0.9 -0.9
2.3
-12.4
2.5
-15
-10
-5
0
5
Operating Income
Order Backlog 494.4 Billion yen
(Forecast in Jan. 230.0)
(Forecast in Jan. 145.0)
(Forecast in Jan. 3.0)
Rolling Stock Main Products: Electric train cars (incl. Shinkansen), Electric and diesel locomotives, Passenger coaches, Bogies
FY2017 (vs. FY2016)
FY2018 Forecast (vs. FY2017)
Before-tax ROIC 3.0% -26.2% 3.4%
FY2016Actual
FY2017Actual
FY2018Forecast
1Q 2Q 3Q 4Q 1Q 2Q 3Q 4Q Forecast FY16(Accumulated) FY17(Accumulated) FY18
[Billion Yen]
• Orders Received: Increased compared to FY2016 when orders of subway cars for domestic market and others were received, due to large scale orders received including MRT System for Bangladesh and new generation subway cars for New York City Transit
• Net Sales: Increased due to increase in domestic market and other factors, despite decrease in sales for overseas market including North America and Asia
• Operating Income: Deteriorated due to provision for loss on construction contracts in passenger cars for Long Island Rail Road, expenses for replacing N700 series Shinkansen bogie frame and other factors
• Orders Received: Decreased compared to FY2017 when orders of large-scale projects for overseas market were received
• Net Sales: Increased due to increase in sales to North American market
• Operating Income: Improved compared to FY2017 when provision for loss on construction contracts in passenger cars for Long Island Rail Road was recognized
9 © 2018 KAWASAKI HEAVY INDUSTRIES, LTD. All Rights Reserved
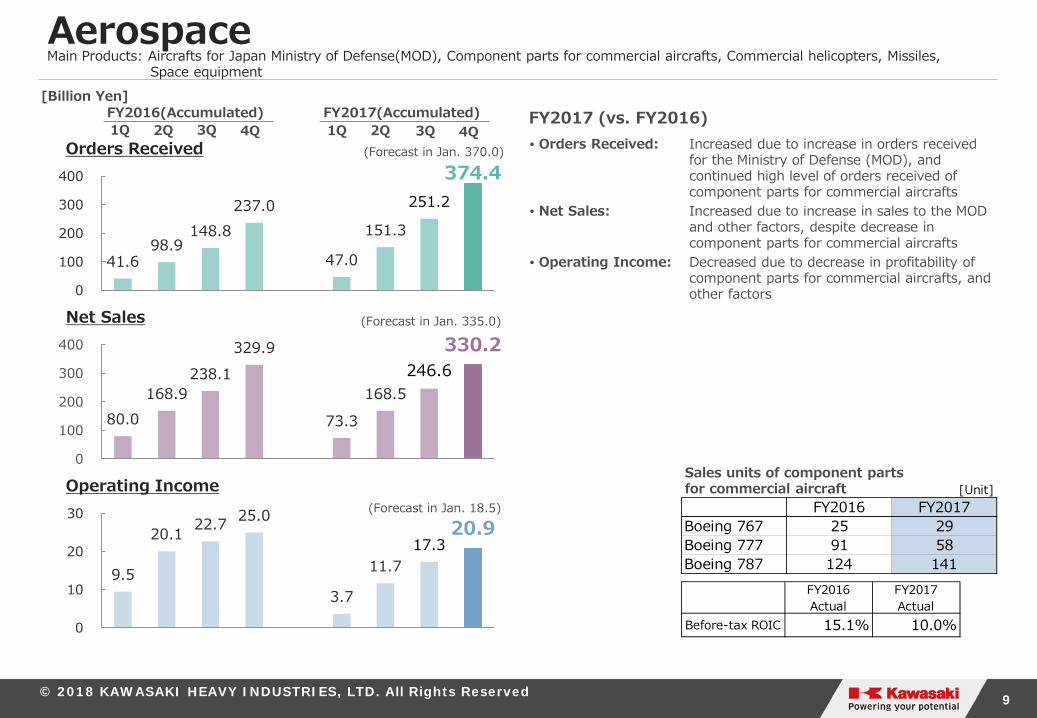
41.6 98.9
148.8 237.0
47.0
151.3
251.2
374.4
0
100
200
300
400
Orders Received
80.0 168.9
238.1 329.9
73.3
168.5 246.6
330.2
0
100
200
300
400
Net Sales
9.5
20.1 22.7 25.0
3.7
11.7 17.3
20.9
0
10
20
30
Operating Income Sales units of component parts for commercial aircraft
Aerospace Main Products: Aircrafts for Japan Ministry of Defense(MOD), Component parts for commercial aircrafts, Commercial helicopters, Missiles, Space equipment
FY2017 (vs. FY2016)
[Unit]FY2016 FY2017
Boeing 767 25 29Boeing 777 91 58Boeing 787 124 141
1Q 2Q 3Q 4Q 1Q 2Q 3Q 4Q FY2016(Accumulated) FY2017(Accumulated)
[Billion Yen]
• Orders Received: Increased due to increase in orders received for the Ministry of Defense (MOD), and continued high level of orders received of component parts for commercial aircrafts
• Net Sales: Increased due to increase in sales to the MOD and other factors, despite decrease in component parts for commercial aircrafts
• Operating Income: Decreased due to decrease in profitability of component parts for commercial aircrafts, and other factors
(Forecast in Jan. 370.0)
(Forecast in Jan. 335.0)
(Forecast in Jan. 18.5)
Before-tax ROIC 15.1% 10.0%
FY2016Actual
FY2017Actual
10 © 2018 KAWASAKI HEAVY INDUSTRIES, LTD. All Rights Reserved
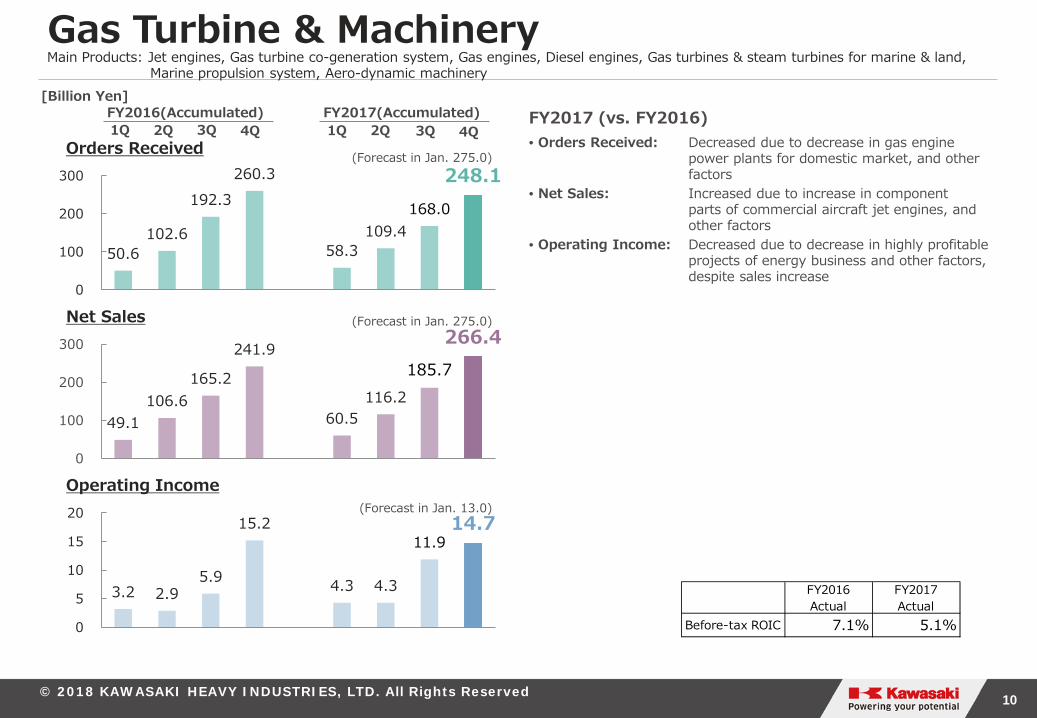
50.6 102.6
192.3 260.3
58.3 109.4
168.0
248.1
0
100
200
300
Orders Received
49.1 106.6
165.2
241.9
60.5 116.2
185.7
266.4
0
100
200
300
Net Sales
3.2 2.9 5.9
15.2
4.3 4.3
11.9 14.7
0
5
10
15
20
Operating Income
(Forecast in Jan. 275.0)
(Forecast in Jan. 275.0)
(Forecast in Jan. 13.0)
Gas Turbine & Machinery Main Products: Jet engines, Gas turbine co-generation system, Gas engines, Diesel engines, Gas turbines & steam turbines for marine & land, Marine propulsion system, Aero-dynamic machinery
FY2017 (vs. FY2016) 1Q 2Q 3Q 4Q 1Q 2Q 3Q 4Q FY2016(Accumulated) FY2017(Accumulated)
[Billion Yen]
• Orders Received: Decreased due to decrease in gas engine power plants for domestic market, and other factors
• Net Sales: Increased due to increase in component parts of commercial aircraft jet engines, and other factors
• Operating Income: Decreased due to decrease in highly profitable projects of energy business and other factors, despite sales increase
Before-tax ROIC 7.1% 5.1%
FY2016Actual
FY2017Actual
11 © 2018 KAWASAKI HEAVY INDUSTRIES, LTD. All Rights Reserved
18.0 34.3
60.4 95.0
15.1
53.6 86.4
100.1
0
50
100
150
Orders Received
31.7 78.5
114.2 160.8
25.5 53.7
80.0 124.4
0
50
100
150
200
Net Sales
0.6 1.7
2.3 2.6
-0.6 -0.2 0.0
2.9
-101234
Operating Income
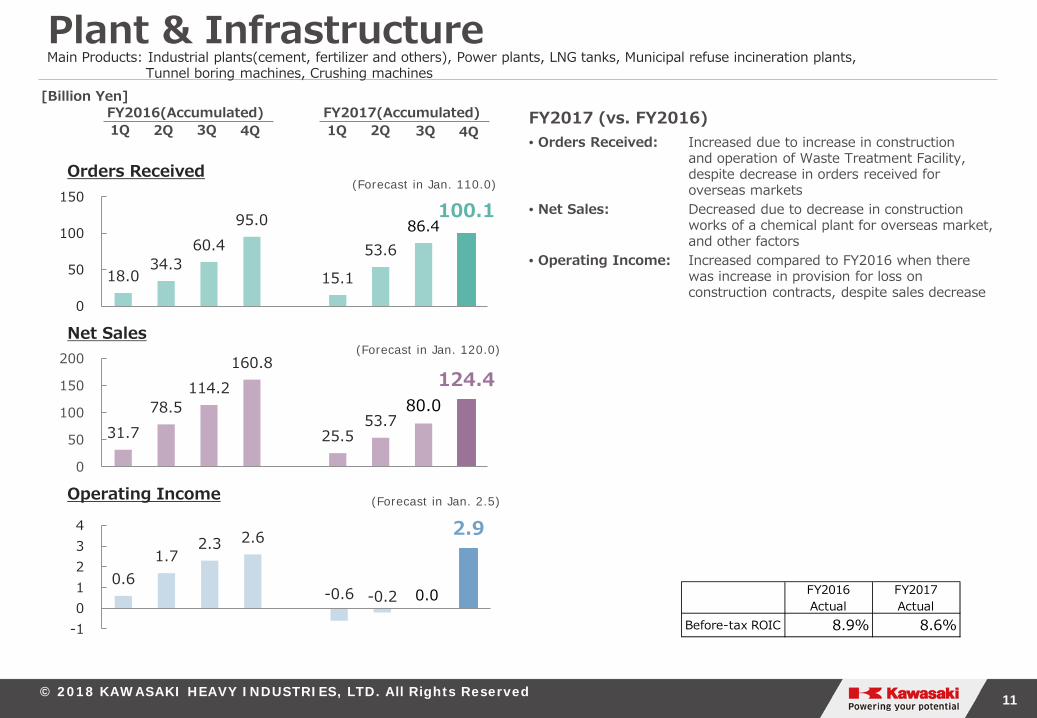
Plant & Infrastructure Main Products: Industrial plants(cement, fertilizer and others), Power plants, LNG tanks, Municipal refuse incineration plants, Tunnel boring machines, Crushing machines
FY2017 (vs. FY2016)
(Forecast in Jan. 110.0)
(Forecast in Jan. 120.0)
(Forecast in Jan. 2.5)
1Q 2Q 3Q 4Q 1Q 2Q 3Q 4Q FY2016(Accumulated) FY2017(Accumulated)
[Billion Yen]
• Orders Received: Increased due to increase in construction and operation of Waste Treatment Facility, despite decrease in orders received for overseas markets
• Net Sales: Decreased due to decrease in construction works of a chemical plant for overseas market, and other factors
• Operating Income: Increased compared to FY2016 when there was increase in provision for loss on construction contracts, despite sales decrease
Before-tax ROIC 8.9% 8.6%
FY2016Actual
FY2017Actual
12 © 2018 KAWASAKI HEAVY INDUSTRIES, LTD. All Rights Reserved
498.9 385.0
0.0100.0200.0300.0400.0500.0600.0
Orders Received
469.5 475.0
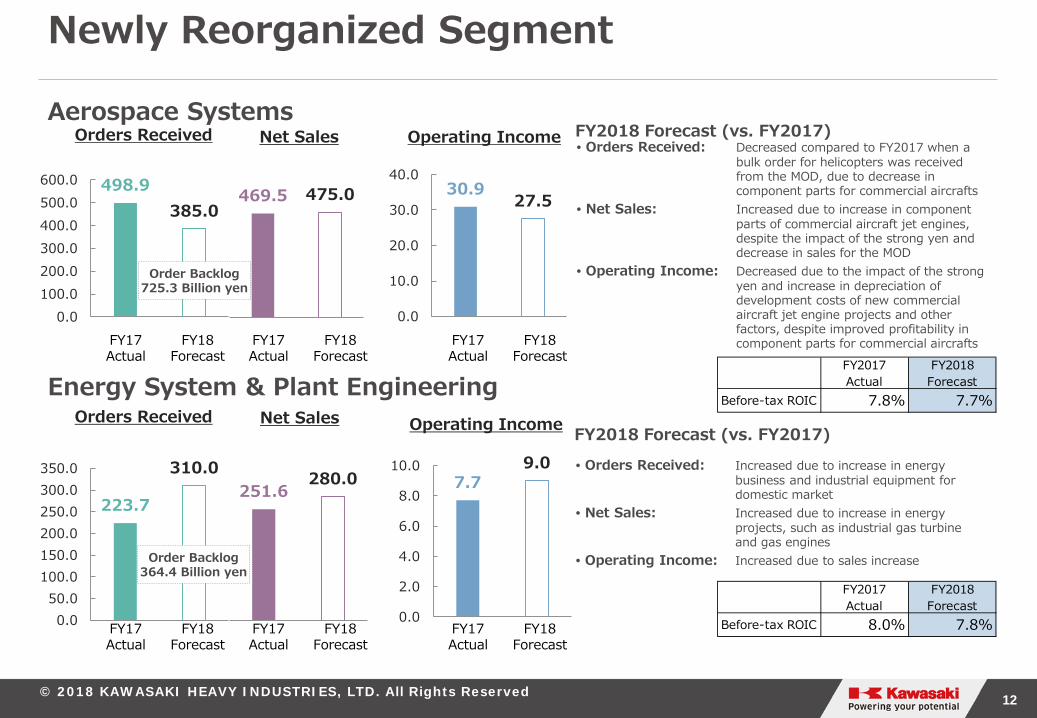
Net Sales • Orders Received: Decreased compared to FY2017 when a
bulk order for helicopters was received from the MOD, due to decrease in component parts for commercial aircrafts
• Net Sales: Increased due to increase in component parts of commercial aircraft jet engines, despite the impact of the strong yen and decrease in sales for the MOD
• Operating Income: Decreased due to the impact of the strong yen and increase in depreciation of development costs of new commercial aircraft jet engine projects and other factors, despite improved profitability in component parts for commercial aircrafts
Newly Reorganized Segment
FY2018 Forecast (vs. FY2017)
FY2018 Forecast (vs. FY2017) Aerospace Systems
Energy System & Plant Engineering
Order Backlog 725.3 Billion yen
FY18 Forecast
FY17 Actual
FY18 Forecast
FY17 Actual
FY18 Forecast
FY17 Actual
223.7
310.0
0.050.0
100.0150.0200.0250.0300.0350.0
Orders Received
251.6 280.0
Net Sales
7.7 9.0
0.0
2.0
4.0
6.0
8.0
10.0
Operating Income
FY18 Forecast
FY17 Actual
FY18 Forecast
FY17 Actual
FY18 Forecast
FY17 Actual
Order Backlog 364.4 Billion yen
• Orders Received: Increased due to increase in energy business and industrial equipment for domestic market
• Net Sales: Increased due to increase in energy projects, such as industrial gas turbine and gas engines
• Operating Income: Increased due to sales increase
Before-tax ROIC 7.8% 7.7%
FY2017Actual
FY2018Forecast
Before-tax ROIC 8.0% 7.8%
FY2017Actual
FY2018Forecast
30.9 27.5
0.0
10.0
20.0
30.0
40.0
Operating Income
13 © 2018 KAWASAKI HEAVY INDUSTRIES, LTD. All Rights Reserved
69.2 128.5
198.7
313.0
67.7 136.9
214.9
331.6 335.0
0
100
200
300
400
Net Sales
0.3
-2.4 -2.0
11.7
-3.3 -2.0
3.2
15.2 15.0
-10
0
10
20
Operating Income
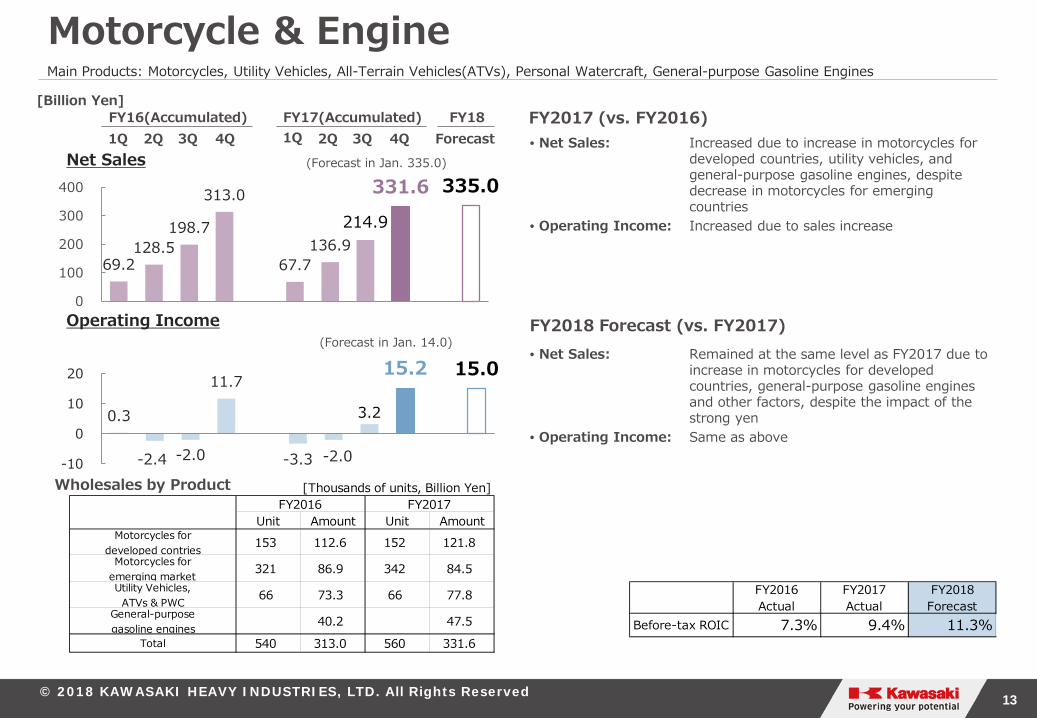
Motorcycle & Engine
Wholesales by Product
(Forecast in Jan. 335.0)
(Forecast in Jan. 14.0)
Main Products: Motorcycles, Utility Vehicles, All-Terrain Vehicles(ATVs), Personal Watercraft, General-purpose Gasoline Engines
FY2017 (vs. FY2016)
FY2018 Forecast (vs. FY2017)
1Q 2Q 3Q 4Q 1Q 2Q 3Q 4Q Forecast FY16(Accumulated) FY17(Accumulated) FY18
[Billion Yen]
Before-tax ROIC 7.3% 9.4% 11.3%
FY2016Actual
FY2017Actual
FY2018Forecast
[Thousands of units, Billion Yen]FY2016 FY2017
Unit Amount Unit AmountMotorcycles for
developed contries 153 112.6 152 121.8Motorcycles for
emerging market 321 86.9 342 84.5Utility Vehicles,
ATVs & PWC 66 73.3 66 77.8General-purpose gasoline engines 40.2 47.5
Total 540 313.0 560 331.6
• Net Sales: Increased due to increase in motorcycles for developed countries, utility vehicles, and general-purpose gasoline engines, despite decrease in motorcycles for emerging countries
• Operating Income: Increased due to sales increase
• Net Sales: Remained at the same level as FY2017 due to increase in motorcycles for developed countries, general-purpose gasoline engines and other factors, despite the impact of the strong yen
• Operating Income: Same as above
14 © 2018 KAWASAKI HEAVY INDUSTRIES, LTD. All Rights Reserved
33.1 71.4
115.7 166.8
42.8 92.4
144.7 207.1
245.0
0
100
200
300
Orders Received
32.9 65.7
103.5 155.2
41.8 86.9
136.3 198.9 230.0
0
100
200
300
Net Sales
2.1 3.9 6.8
13.1
4.5 9.0
14.7
21.6 24.5
0
10
20
30
Operating Income
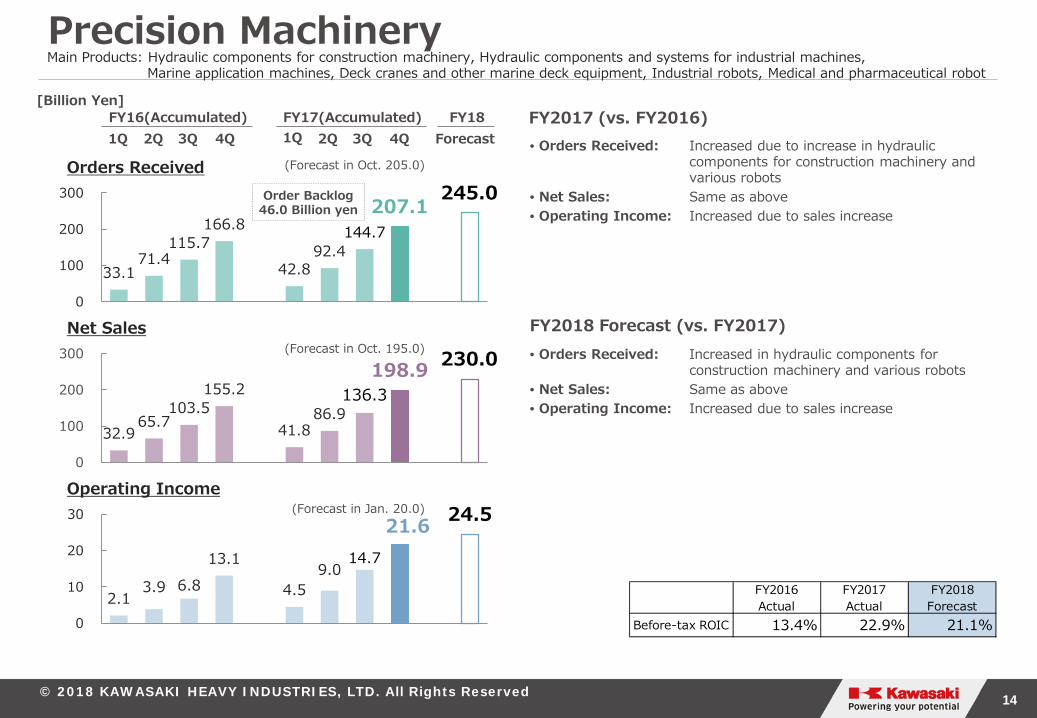
Precision Machinery
Order Backlog 46.0 Billion yen
(Forecast in Oct. 205.0)
(Forecast in Oct. 195.0)
(Forecast in Jan. 20.0)
Main Products: Hydraulic components for construction machinery, Hydraulic components and systems for industrial machines, Marine application machines, Deck cranes and other marine deck equipment, Industrial robots, Medical and pharmaceutical robot
FY2017 (vs. FY2016)
FY2018 Forecast (vs. FY2017)
1Q 2Q 3Q 4Q 1Q 2Q 3Q 4Q Forecast FY16(Accumulated) FY17(Accumulated) FY18
[Billion Yen]
Before-tax ROIC 13.4% 22.9% 21.1%
FY2016Actual
FY2017Actual
FY2018Forecast
• Orders Received: Increased due to increase in hydraulic components for construction machinery and various robots
• Net Sales: Same as above • Operating Income: Increased due to sales increase
• Orders Received: Increased in hydraulic components for construction machinery and various robots
• Net Sales: Same as above • Operating Income: Increased due to sales increase
15 © 2018 KAWASAKI HEAVY INDUSTRIES, LTD. All Rights Reserved
0.0
200.0
400.0
600.0
800.0
1Q 2Q 3Q 4Q 1Q 2Q 3Q 4Q 1Q 2Q 3Q 4Q
Long-term debt Short-term debt
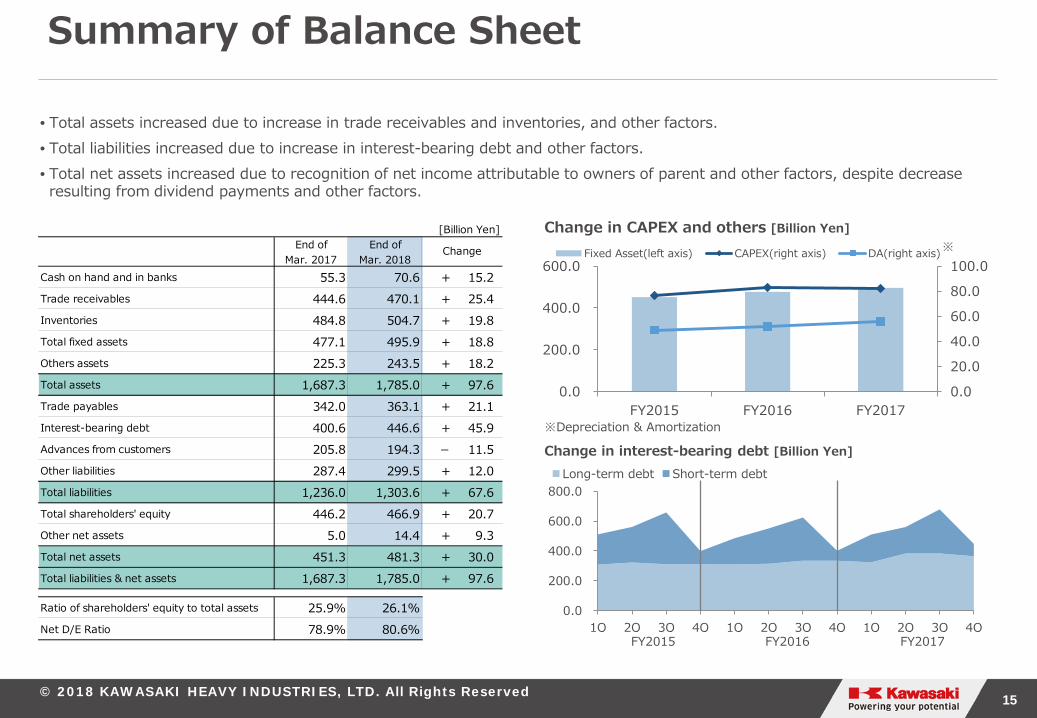
Summary of Balance Sheet
Change in CAPEX and others [Billion Yen]
Change in interest-bearing debt [Billion Yen]
FY2015 FY2016 FY2017
※Depreciation & Amortization
[Billion Yen]End of
Mar. 2017End of
Mar. 2018Cash on hand and in banks 55.3 70.6 + 15.2Trade receivables 444.6 470.1 + 25.4Inventories 484.8 504.7 + 19.8Total fixed assets 477.1 495.9 + 18.8Others assets 225.3 243.5 + 18.2Total assets 1,687.3 1,785.0 + 97.6Trade payables 342.0 363.1 + 21.1Interest-bearing debt 400.6 446.6 + 45.9Advances from customers 205.8 194.3 - 11.5Other liabilities 287.4 299.5 + 12.0Total liabilities 1,236.0 1,303.6 + 67.6Total shareholders' equity 446.2 466.9 + 20.7Other net assets 5.0 14.4 + 9.3Total net assets 451.3 481.3 + 30.0Total liabilities & net assets 1,687.3 1,785.0 + 97.6
Ratio of shareholders' equity to total assets 25.9% 26.1%Net D/E Ratio 78.9% 80.6%
Change
0.0
20.0
40.0
60.0
80.0
100.0
0.0
200.0
400.0
600.0
FY2015 FY2016 FY2017
Fixed Asset(left axis) CAPEX(right axis) DA(right axis)※
• Total assets increased due to increase in trade receivables and inventories, and other factors. • Total liabilities increased due to increase in interest-bearing debt and other factors. • Total net assets increased due to recognition of net income attributable to owners of parent and other factors, despite decrease resulting from dividend payments and other factors.
16 © 2018 KAWASAKI HEAVY INDUSTRIES, LTD. All Rights Reserved
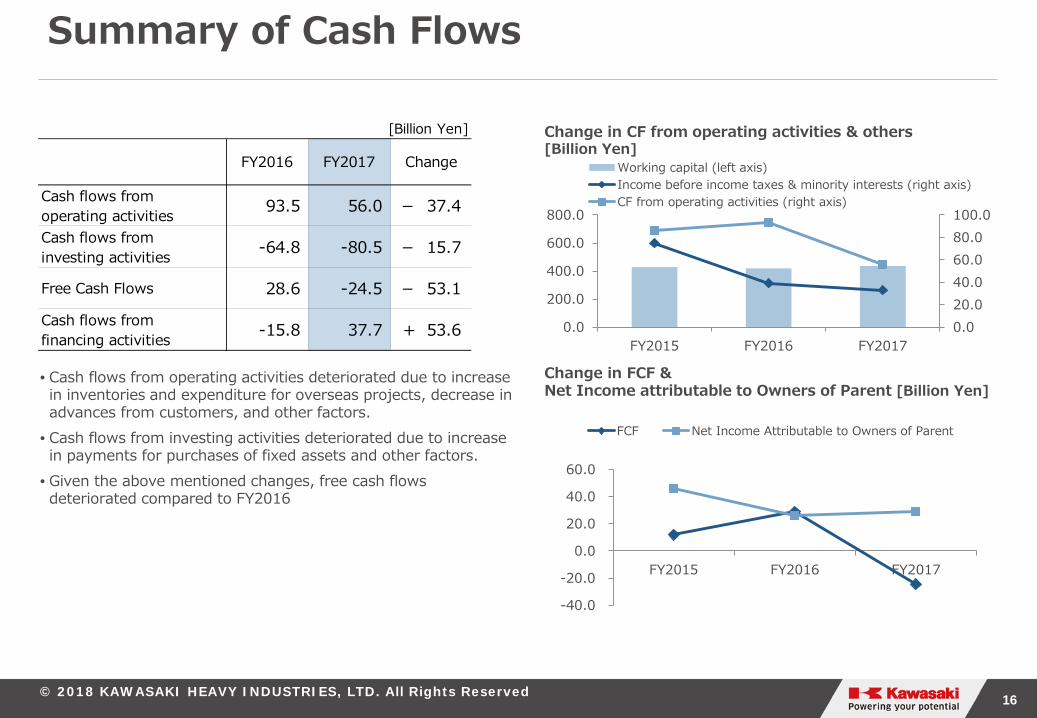
Summary of Cash Flows
Change in CF from operating activities & others [Billion Yen]
Change in FCF & Net Income attributable to Owners of Parent [Billion Yen]
[Billion Yen]
FY2016 FY2017
Cash flows fromoperating activities 93.5 56.0 - 37.4
Cash flows from investing activities -64.8 -80.5 - 15.7
Free Cash Flows 28.6 -24.5 - 53.1
Cash flows fromfinancing activities -15.8 37.7 + 53.6
Change
0.020.040.060.080.0100.0
0.0
200.0
400.0
600.0
800.0
FY2015 FY2016 FY2017
Working capital (left axis)Income before income taxes & minority interests (right axis)CF from operating activities (right axis)
-40.0
-20.0
0.0
20.0
40.0
60.0
FY2015 FY2016 FY2017
FCF Net Income Attributable to Owners of Parent
• Cash flows from operating activities deteriorated due to increase in inventories and expenditure for overseas projects, decrease in advances from customers, and other factors.
• Cash flows from investing activities deteriorated due to increase in payments for purchases of fixed assets and other factors.
• Given the above mentioned changes, free cash flows deteriorated compared to FY2016
17 © 2018 KAWASAKI HEAVY INDUSTRIES, LTD. All Rights Reserved
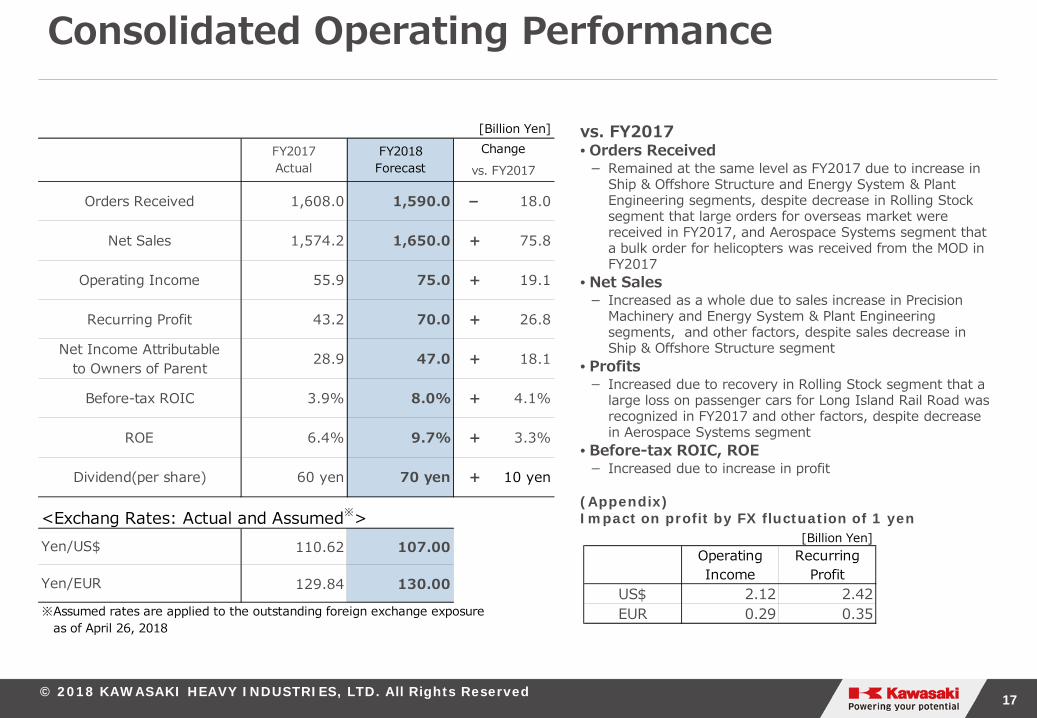
Consolidated Operating Performance
(Appendix) Impact on profit by FX fluctuation of 1 yen
vs. FY2017
[Billion Yen]Operating Income
Recurring Profit
US$ 2.12 2.42EUR 0.29 0.35
• Orders Received − Remained at the same level as FY2017 due to increase in
Ship & Offshore Structure and Energy System & Plant Engineering segments, despite decrease in Rolling Stock segment that large orders for overseas market were received in FY2017, and Aerospace Systems segment that a bulk order for helicopters was received from the MOD in FY2017
• Net Sales − Increased as a whole due to sales increase in Precision
Machinery and Energy System & Plant Engineering segments, and other factors, despite sales decrease in Ship & Offshore Structure segment
• Profits − Increased due to recovery in Rolling Stock segment that a
large loss on passenger cars for Long Island Rail Road was recognized in FY2017 and other factors, despite decrease in Aerospace Systems segment
• Before-tax ROIC, ROE − Increased due to increase in profit
[Billion Yen]
1,608.0 1,590.0 - 18.0
1,574.2 1,650.0 + 75.8
55.9 75.0 + 19.1
43.2 70.0 + 26.8
28.9 47.0 + 18.1
3.9% 8.0% + 4.1%
6.4% 9.7% + 3.3%
60 yen 70 yen + 10 yen
<Exchang Rates: Actual and Assumed※>110.62 107.00
129.84 130.00
Net Sales
FY2017Actual
Orders Received
vs. FY2017ChangeFY2018
Forecast
※Assumed rates are applied to the outstanding foreign exchange exposure as of April 26, 2018
Dividend(per share)
Yen/US$
Yen/EUR
Operating Income
Recurring Profit
Net Income Attributableto Owners of Parent
Before-tax ROIC
ROE
18 © 2018 KAWASAKI HEAVY INDUSTRIES, LTD. All Rights Reserved
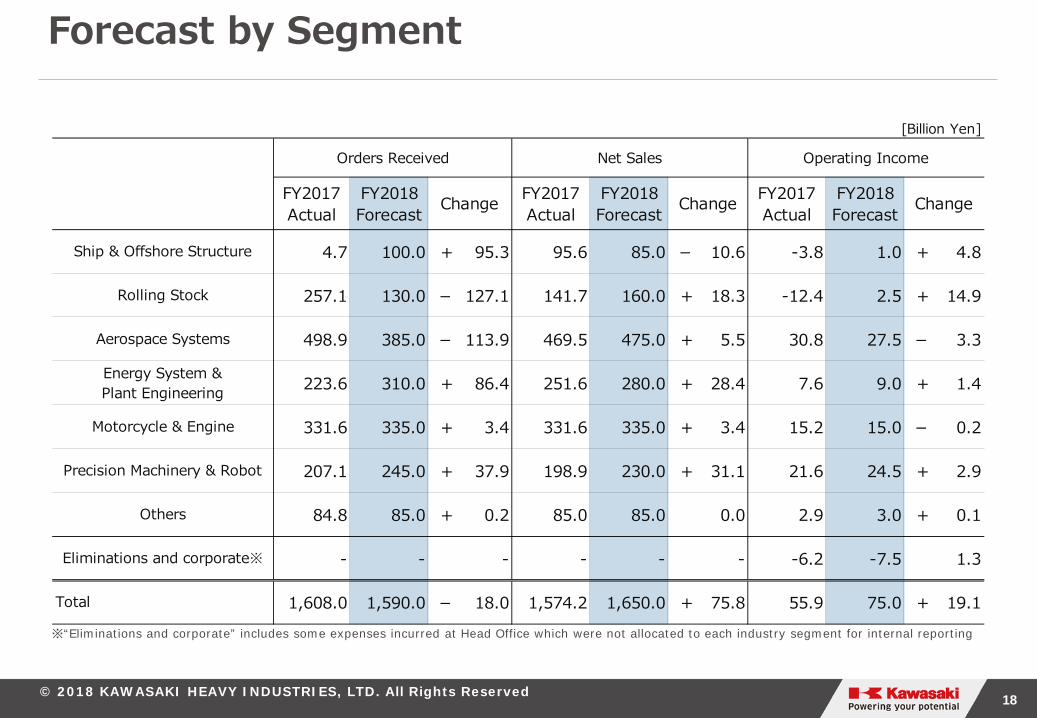
Forecast by Segment
※“Eliminations and corporate” includes some expenses incurred at Head Office which were not allocated to each industry segment for internal reporting
[Billion Yen]
Orders Received Net Sales Operating Income
FY2017Actual
FY2018Forecast
FY2017Actual
FY2018Forecast
FY2017Actual
FY2018Forecast
4.7 100.0 + 95.3 95.6 85.0 - 10.6 -3.8 1.0 + 4.8
257.1 130.0 - 127.1 141.7 160.0 + 18.3 -12.4 2.5 + 14.9
498.9 385.0 - 113.9 469.5 475.0 + 5.5 30.8 27.5 - 3.3
223.6 310.0 + 86.4 251.6 280.0 + 28.4 7.6 9.0 + 1.4
331.6 335.0 + 3.4 331.6 335.0 + 3.4 15.2 15.0 - 0.2
207.1 245.0 + 37.9 198.9 230.0 + 31.1 21.6 24.5 + 2.9
84.8 85.0 + 0.2 85.0 85.0 0.0 2.9 3.0 + 0.1
- - - - - - -6.2 -7.5 1.3
1,608.0 1,590.0 - 18.0 1,574.2 1,650.0 + 75.8 55.9 75.0 + 19.1
Change Change Change
Total
Ship & Offshore Structure
Rolling Stock
Aerospace Systems
Energy System &Plant Engineering
Motorcycle & Engine
Precision Machinery & Robot
Others
Eliminations and corporate※
19 © 2018 KAWASAKI HEAVY INDUSTRIES, LTD. All Rights Reserved
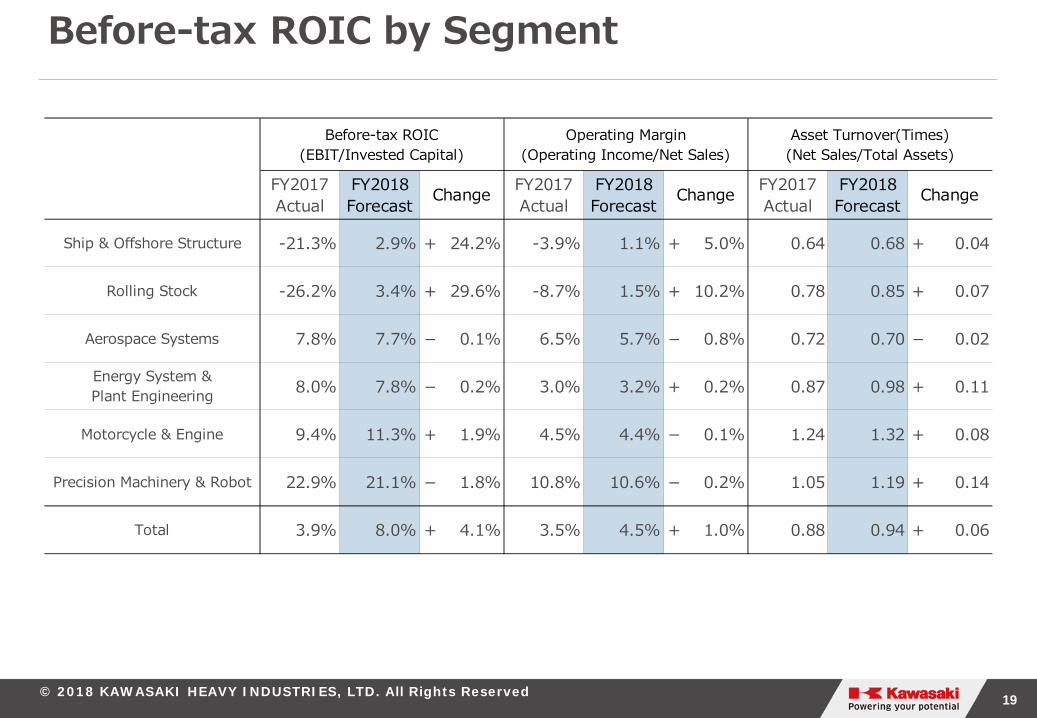
Before-tax ROIC by Segment
Before-tax ROIC(EBIT/Invested Capital)
Operating Margin(Operating Income/Net Sales)
Asset Turnover(Times)(Net Sales/Total Assets)
FY2017Actual
FY2018Forecast
FY2017Actual
FY2018Forecast
FY2017Actual
FY2018Forecast
-21.3% 2.9% + 24.2% -3.9% 1.1% + 5.0% 0.64 0.68 + 0.04
-26.2% 3.4% + 29.6% -8.7% 1.5% + 10.2% 0.78 0.85 + 0.07
7.8% 7.7% - 0.1% 6.5% 5.7% - 0.8% 0.72 0.70 - 0.02
8.0% 7.8% - 0.2% 3.0% 3.2% + 0.2% 0.87 0.98 + 0.11
9.4% 11.3% + 1.9% 4.5% 4.4% - 0.1% 1.24 1.32 + 0.08
22.9% 21.1% - 1.8% 10.8% 10.6% - 0.2% 1.05 1.19 + 0.14
3.9% 8.0% + 4.1% 3.5% 4.5% + 1.0% 0.88 0.94 + 0.06
Change Change Change
Motorcycle & Engine
Precision Machinery & Robot
Total
Ship & Offshore Structure
Rolling Stock
Aerospace Systems
Energy System &Plant Engineering
20 © 2018 KAWASAKI HEAVY INDUSTRIES, LTD. All Rights Reserved
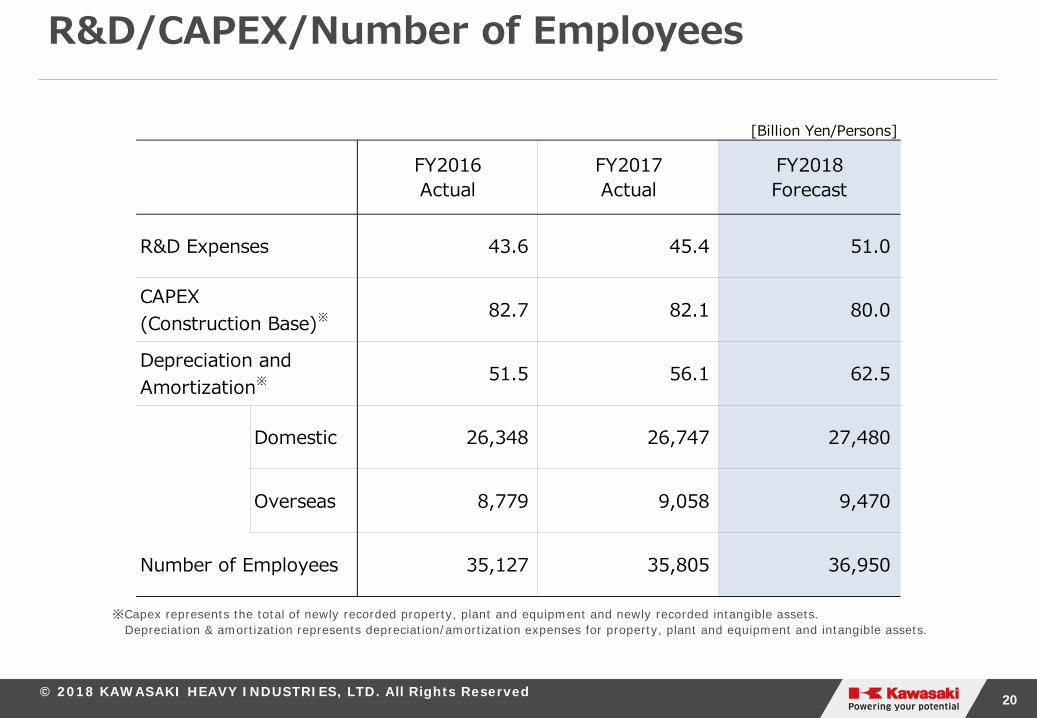
R&D/CAPEX/Number of Employees
※Capex represents the total of newly recorded property, plant and equipment and newly recorded intangible assets. Depreciation & amortization represents depreciation/amortization expenses for property, plant and equipment and intangible assets.
[Billion Yen/Persons]
FY2016Actual
FY2017Actual
FY2018Forecast
43.6 45.4 51.0
82.7 82.1 80.0
51.5 56.1 62.5
Domestic 26,348 26,747 27,480
Overseas 8,779 9,058 9,470
Number of Employees 35,127 35,805 36,950
R&D Expenses
CAPEX(Construction Base)※
Depreciation andAmortization※
21 © 2018 KAWASAKI HEAVY INDUSTRIES, LTD. All Rights Reserved
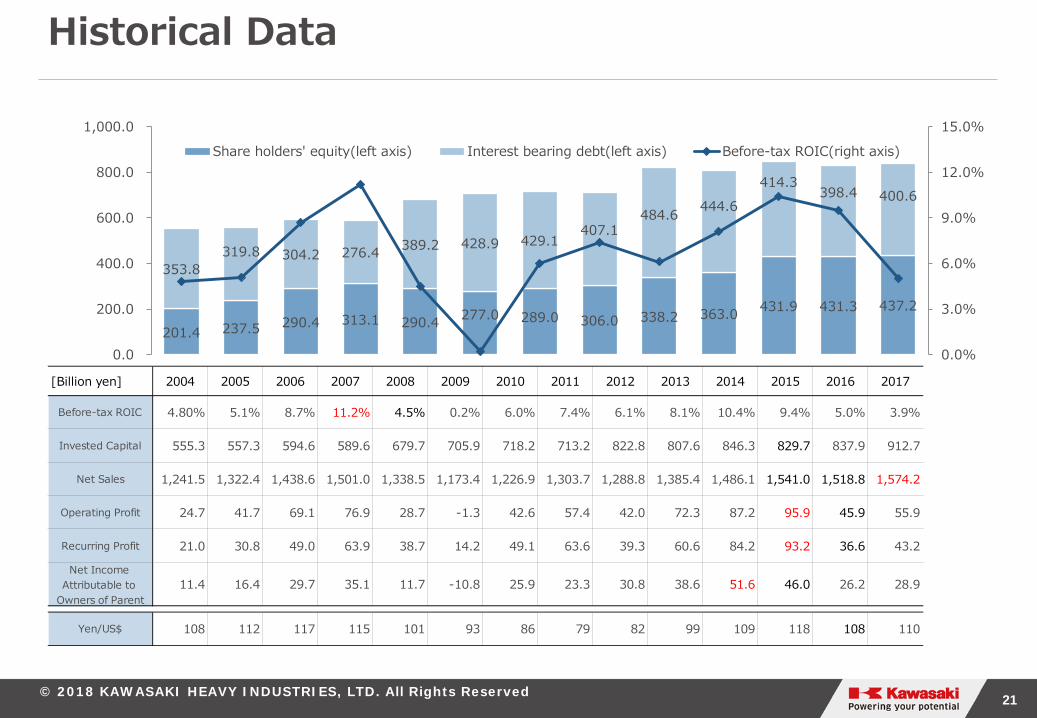
Historical Data
201.4 237.5 290.4 313.1 290.4 277.0 289.0 306.0 338.2 363.0 431.9 431.3 437.2
353.8 319.8 304.2 276.4 389.2 428.9 429.1
407.1 484.6 444.6
414.3 398.4 400.6
0.0%
3.0%
6.0%
9.0%
12.0%
15.0%
0.0
200.0
400.0
600.0
800.0
1,000.0
Share holders' equity(left axis) Interest bearing debt(left axis) Before-tax ROIC(right axis)
[Billion yen] 2004 2005 2006 2007 2008 2009 2010 2011 2012 2013 2014 2015 2016 2017
Before-tax ROIC 4.80% 5.1% 8.7% 11.2% 4.5% 0.2% 6.0% 7.4% 6.1% 8.1% 10.4% 9.4% 5.0% 3.9%
Invested Capital 555.3 557.3 594.6 589.6 679.7 705.9 718.2 713.2 822.8 807.6 846.3 829.7 837.9 912.7
Net Sales 1,241.5 1,322.4 1,438.6 1,501.0 1,338.5 1,173.4 1,226.9 1,303.7 1,288.8 1,385.4 1,486.1 1,541.0 1,518.8 1,574.2
Operating Profit 24.7 41.7 69.1 76.9 28.7 -1.3 42.6 57.4 42.0 72.3 87.2 95.9 45.9 55.9
Recurring Profit 21.0 30.8 49.0 63.9 38.7 14.2 49.1 63.6 39.3 60.6 84.2 93.2 36.6 43.2
Net Income Attributable to
Owners of Parent11.4 16.4 29.7 35.1 11.7 -10.8 25.9 23.3 30.8 38.6 51.6 46.0 26.2 28.9
Yen/US$ 108 112 117 115 101 93 86 79 82 99 109 118 108 110
22 © 2018 KAWASAKI HEAVY INDUSTRIES, LTD. All Rights Reserved
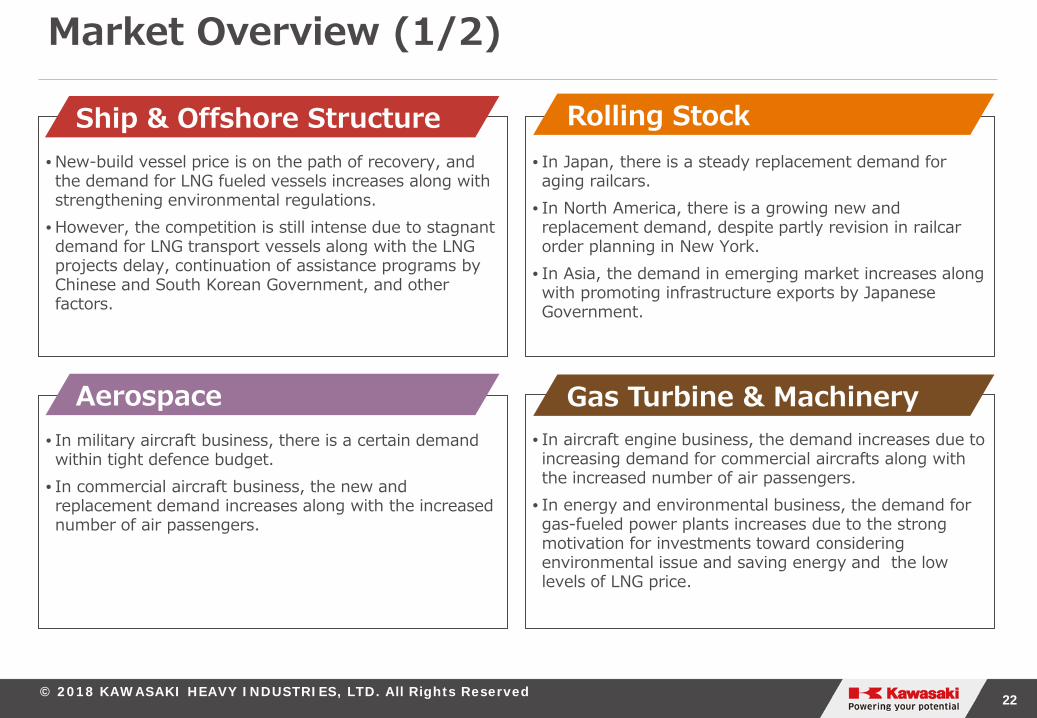
Market Overview (1/2)
• New-build vessel price is on the path of recovery, and the demand for LNG fueled vessels increases along with strengthening environmental regulations.
• However, the competition is still intense due to stagnant demand for LNG transport vessels along with the LNG projects delay, continuation of assistance programs by Chinese and South Korean Government, and other factors.
• In Japan, there is a steady replacement demand for aging railcars.
• In North America, there is a growing new and replacement demand, despite partly revision in railcar order planning in New York.
• In Asia, the demand in emerging market increases along with promoting infrastructure exports by Japanese Government.
• In military aircraft business, there is a certain demand within tight defence budget.
• In commercial aircraft business, the new and replacement demand increases along with the increased number of air passengers.
• In aircraft engine business, the demand increases due to increasing demand for commercial aircrafts along with the increased number of air passengers.
• In energy and environmental business, the demand for gas-fueled power plants increases due to the strong motivation for investments toward considering environmental issue and saving energy and the low levels of LNG price.
Ship & Offshore Structure Rolling Stock
Aerospace Gas Turbine & Machinery
23 © 2018 KAWASAKI HEAVY INDUSTRIES, LTD. All Rights Reserved
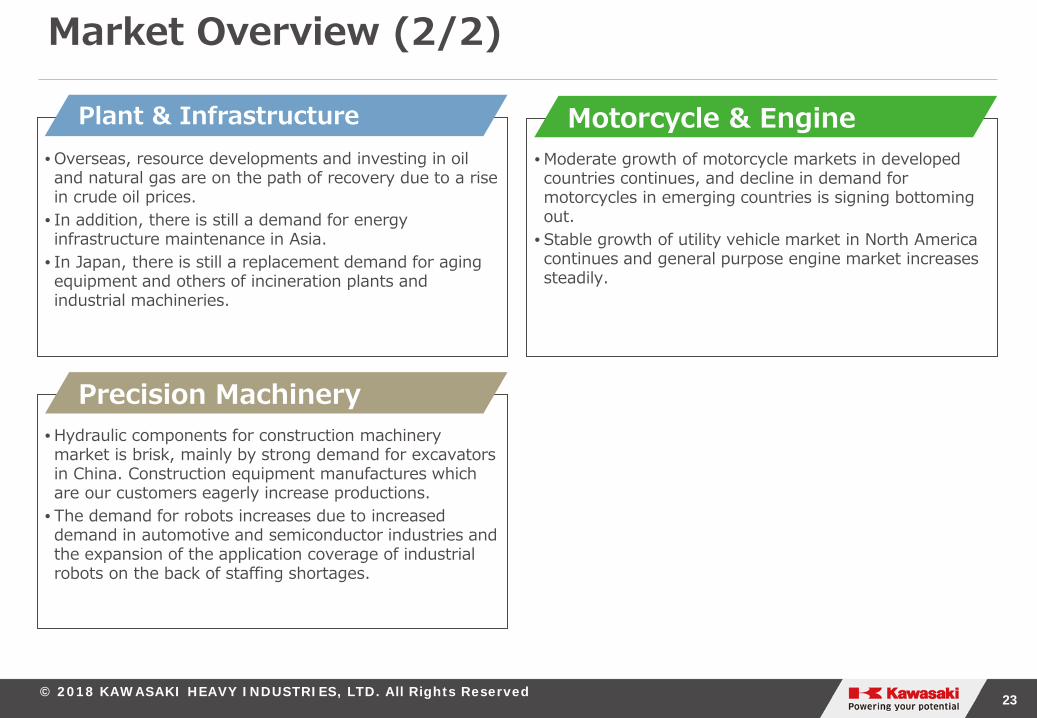
Market Overview (2/2)
• Overseas, resource developments and investing in oil and natural gas are on the path of recovery due to a rise in crude oil prices.
• In addition, there is still a demand for energy infrastructure maintenance in Asia.
• In Japan, there is still a replacement demand for aging equipment and others of incineration plants and industrial machineries.
• Moderate growth of motorcycle markets in developed countries continues, and decline in demand for motorcycles in emerging countries is signing bottoming out.
• Stable growth of utility vehicle market in North America continues and general purpose engine market increases steadily.
• Hydraulic components for construction machinery market is brisk, mainly by strong demand for excavators in China. Construction equipment manufactures which are our customers eagerly increase productions.
• The demand for robots increases due to increased demand in automotive and semiconductor industries and the expansion of the application coverage of industrial robots on the back of staffing shortages.
Plant & Infrastructure Motorcycle & Engine
Precision Machinery
24 © 2018 KAWASAKI HEAVY INDUSTRIES, LTD. All Rights Reserved
Figures recorded in the business forecasts are forecasts that reflect the judgment of the Company based on the information available at the time of release and include risks and uncertainties. Accordingly, the Company cautions investors not to make investment decisions solely on the basis of these forecasts. Actual business results may differ materially from these business forecasts due to various important factors resulting from changes in the external environment and internal environment. Important factors that may affect actual business results include, but are not limited to, economic conditions, the yen exchange rate against the U.S. dollar and other currencies, the tax system, and laws and regulations.