Capcom Financial Results Presentation for 2nd Quarter in FY2016

FUJITSU GENERAL LIMITED
1
April 2017Fujitsu General Limited
Any forward-looking statement in this report speaks only as of the date on which it is made; Forward-looking statements are based on the company's current assumptions regarding future business and financial performance; these statements by their nature address matters that are uncertain to different degrees. Forward-looking statements involve a number of risks, uncertainties and other factors that could cause actual results to be materially different.
Note:
This report is a translation of Japanese version. In case of any difference between English version and Japanese version, Japanese version shall prevail.
Financial Results for FY2016 and
Medium-term Management Policy

FUJITSU GENERAL LIMITED目 次
1.Financial Results for FY2016 and Financial Plan for FY2017
2
2.History of the company
3.Medium-term Management Policy(FY2017~FY2020)

FUJITSU GENERAL LIMITED
1.Financial Results for FY2016 and Financial Plan for FY2017
3

FUJITSU GENERAL LIMITED
41-1.Financial Results for FY2016
Sales by Segment(Hundred Million Yen)
83% 2,331 89% 2,324 6% -7 6% -%
(529) (555) (26) (5%)
(1,802) (1,769) (-33) (7%) (-2%)
365 146 -219 -60%
Electronic devices 100 117 17 17%
16% 465 10% 263 -6% -202 -44%
1% 14 1% 14 -% - 3%
Total 100% 2,810 100% 2,601 -% -209 -2% -7%
Japan 36% 1,000 32% 823 -4% -177 -18%
Overseas 64% 1,810 68% 1,778 4% -32 -2%
FY2015 FY2016
Actual
Change
Actual %
Air conditioners
Others
Telecommunications andElectronic devices
(Japan)
(Overseas)
Telecommunications
〔Note1: subscripts(%) of sales is proportion to Total〕 〔Note2: subscripts(%) of change % is local currency base〕

FUJITSU GENERAL LIMITED
51-1.Financial Results for FY2016
Overseas A/C Sales by Geographic area
(Hundred Million Yen)
〔Note1: sales to external customers 〕 〔Note2: subscripts(%) is proportion to Overseas Total〕
%Local
cur rencybase
Americas 20% 265 20% 333 19% 332 19% 329 -% -3 -1% 6%Europe 28% 378 25% 415 22% 403 25% 449 3% 46 12% 22%
16% 224 22% 368 27% 490 22% 396 -5% -94 -19% -13%Oceania 14% 195 12% 211 12% 216 12% 220 -% 4 2% 8%Asia 11% 150 11% 188 11% 199 12% 202 1% 3 1% 11%Greater China 11% 155 10% 165 9% 162 10% 173 1% 11 7% 22%
Overseas Total 100% 1,367 100% 1,680 100% 1,802 100% 1,769 -% -33 -2% 7%
Middle East and Africa
FY2013Actual
FY2014Actual
FY2015Actual
FY2016Actual
Change
(Hundred Millions Yen)
【Sales by Geographic area】
Greater China Greater China
As ia As ia
OceaniaOceania
Middle East and Africa
Middle East and Africa
Europe
EuropeAmericas
Americas
1,367
1,6801,802 1,769
0
400
800
1,200
1,600
2,000
FY2013
Actual
FY2014
Actual
FY2015
Actual
FY2016
Actual

FUJITSU GENERAL LIMITED
61-1.Financial Results for FY2016
(Hundred Million Yen)
Consolidated Financial Results
Foreign Exchange rate Average (Closing) Average (Closing) Average (Closing) Yen/1USD 120 ( 113) 110 ( 112) -10 ( -1) Yen/1AUD 88 ( 86) 81 ( 86) -7 ( -) Yen/1EUR 131 ( 128) 120 ( 120) -11 ( -8) BAHT/1USD 34.7 ( 35.1) 35.0 ( 34.3) 0.3 ( -0.8) RMB/1USD 6.29 ( 6.46) 6.69 ( 6.90) 0.40 ( 0.44)
Consolidated Statements of Income 〔Note: subscripts(%) of change % is local currency base 〕
Actual (ratio) Actual (ratio)
2,810 (100.0%) 2,601 (100.0%) -209 -2% -7%
786 (28.0%) 787 (30.3%) 1 -%
275 (9.8%) 265 (10.2%) -10 -4%Non-operatingprofit or loss
-16 (-0.6%) -25 (-1.0%) -9 -%
(exchange gain and loss) (-18) (-0.6%) (-28) (-1.1%) (-10) ( -%)
259 (9.2%) 240 (9.2%) -19 -8%
- ( -%) 80 (3.1%) 80 -%
175 (6.2%) 100 (3.9%) -75 -43% ※Net income attr ibutable to Owners of the Parent
¥167.55 ¥95.88 ¥-71.67
FY 2015
%
Change
Net income per share
Extraordinary loss
FY 2016
Operating income
Net sales
Gross profit
Ordinary income
Net income※

FUJITSU GENERAL LIMITED
71-1.Financial Results for FY2016
275
-84
-35
-4263
41
48-1
265
▲150
▲100
▲50
-
50
100
150
200
250
300
0
50
100
150
200
250
Decline in Price
Change
-10
+75
-84 -1
(Hundred Million Yen)
Analysis of Consolidated Ordinary income[FY2016] (vs previous year)
FY2015
ActualFY2016
Actual
Telecommunications and Electronic devices
Segment
StrategicInvestment
Cost reduction
Sales volume
Impact of Foreign
Exchange rate
Other Segment
Other Segment
Air conditioners SegmentTelecommunications and Electronic devices
Segment

FUJITSU GENERAL LIMITED
81-1.Financial Results for FY2016
Segment Information
(Hundred Million Yen)
FY2015 FY2016
Actual Actual
Net sales 2,331 2,324 -7 6% -%
Operating income 171 246 75 44%
(Operating income margin) (7.3%) (10.6%) (3.3%)
Net sales 465 263 -202 -44%
Operating income 108 24 -84 -77%
(Operating income margin) (23.3%) (9.3%) (-14.0%)
Net sales 14 14 - 3%
Operating income -4 -5 -1 -%
(Operating income margin) (-30.1%) (-40.0%) (-9.9%)
Net sales 2,810 2,601 -209 -2% -7%
Operating income 275 265 -10 -4%
(Operating income margin) (9.8%) (10.2%) (0.4%)
Total
Telecommunicationsand
Electronic devices
Change
Air conditioners
Others
%
〔Note1: sales to external customers〕 〔Note2: subscripts(%) of change % is local currency base〕

FUJITSU GENERAL LIMITED
91-1.Financial Results for FY2016
Main Financial Data(Hundred Million Yen)
%232 268 36 16%-68 -49 19 -28%164 219 55 34%
4.4% 124 4.7% 121 0.3% -3 -2%50 55 5 10%46 54 8 18%
22.0% 11.3% -10.7% 47.0% 47.8% 0.8%
200 233 33 31.1days 31.7days 0.6days 81.8days 74.5days -7.3days
-0.25 -0.44 -0.19
Free Cash Flow
Depreciation Expense
Net D/E ratio (times)CCC*
ROE
Actual
Days Inventory Outstanding
Inventory
Change
Shareholders' equity ratio
R&D Expense
Investing Cash FlowOperating Cash Flow
Capital Expenditures
FY2015 FY2016Actual
〔Note: subscripts(%) is proportion to Net sales〕
*CCC (Cash Conversion Cycle): Days Sales Outstanding + Days Inventory Outstanding – Days Payable Outstanding

FUJITSU GENERAL LIMITED
101-2.Financial Plan for FY2017
Sales by Segment(Hundred Million Yen)
Air conditioners 1,105 1,219 89% 2,324 1,140 1,505 91% 2,645 32111%
14%
(Japan) (333) (222) (555) (350) (230) (580) (25) (4%)
(Overseas) (772) (997) (1,769) (790) (1,275) (2,065) (296)(13%)
(17%)
55 91 146 45 80 125 -21 -14%
57 60 117 60 60 120 3 3%
112 151 10% 263 105 140 9% 245 -18 -7%
Others 7 7 1% 14 5 5 -% 10 -4 -30%
Total 1,224 1,377 100% 2,601 1,250 1,650 100% 2,900 2999%
12%
Japan 447 376 32% 823 460 375 29% 835 12 2%
Overseas 777 1,001 68% 1,778 790 1,275 71% 2,065 287 16%
Change
FullYear
%
Telecommunications
FullYear
FY2016(Actual) FY2017(Plan)
Electronic devices
Telecommunications andElectronic devices
2nd Half1st Half 1st Half 2nd HalfFullYear
〔Note1: subscripts(%) is proportion to Total〕 〔Note2: subscripts(%) of change % is local currency base〕

FUJITSU GENERAL LIMITED
111-2.Financial Plan for FY2017
%Local
currencybase
Americas 120 209 329 159 273 432 39 64 103 31% 24%Europe 249 200 449 218 216 434 -31 16 -15 -3% -5%Middle East and Africa 138 258 396 109 340 449 -29 82 53 14% 10%Oceania 88 132 220 103 149 252 15 17 32 15% 16%Asia 85 117 202 83 187 270 -2 70 68 34% 27%Greater China 92 81 173 118 110 228 26 29 55 32% 25%Overseas Total 772 997 1,769 790 1,275 2,065 18 278 296 17% 13%
FullYear
ChangeFY2017 PlanFY2016 Actual
1st Half 2nd Half 1st Half 2nd HalfFullYear
FullYear
1st Half 2nd Half
Greater China
Asia
Oceania
Middle East
and Africa
Europe
Americas
1,769
2,065
0
600
1,200
1,800
2,400
FY2016
Actual
FY2017
Plan
Greater ChinaAsia
Oceania
Middle East and Africa
Europe
Americas
772 790
997
1,275
0
400
800
1,200
1,600
FY2016
1st Harf
Actual
FY2017
1st Harf
Plan
FY2016
2nd Harf
Actual
FY2017
2nd Harf
Plan
Overseas A/C Sales by Geographic area(Hundred Million Yen)
【Sales by Geographic area】
〔Note: sales to external customers 〕
(Hundred Million Yen)

FUJITSU GENERAL LIMITED
121-2.Financial Plan for FY2017
(Hundred Million Yen)
1,224 1,377 2,601 1,250 1,650 2,900 299 9% 12%
126 139 265 60 170 230 -35 -13%
(10.3%) (10.1%) (10.2%) (4.8%) (10.3%) (7.9%) (-2.3%)
89 151 240 60 170 230 -10 -4%
(7.2%) (11.0%) (9.2%) (4.8%) (10.3%) (7.9%) (-1.3%)
- 80 80 - - - -80 -%
57 43 100 40 120 160 60 60%
(4.7%) (3.1%) (3.9%) (3.2%) (7.3%) (5.5%) (1.6%)
※Net income attr ibutable to owners of the parent
11 11 22 12 12 24 2
(Net income margin※)
Operating income
(Ordinary income margin)
Change
FullYear
FullYear
2nd Half %
Net income※
Dividend per share (Yen)
(Operating income margin)
Ordinary income
Extraordinary loss
Net sales
FY2016(Actual)
1st Half
FY2017(Plan)
2nd Half1st HalfFullYear
Consolidated Financial Plan
Foreign Exchange Rate (Average) Yen/1USD 106 113 110 115 115 115 5
Yen/1AUD 78 83 81 80 80 80 -1
Yen/1EUR 118 120 120 120 120 120 -
BAHT/1USD 34.9 35.1 35.0 34.5 34.5 34.5 -0.5
RMB/1USD 6.57 6.87 6.69 6.80 6.80 6.80 0.11
22.9% 15.7%
〔Note2: subscripts(%) of dividend per share is dividend payout ratio〕
〔Note1: subscripts(%) of change % is local currency base〕

FUJITSU GENERAL LIMITED
131-2.Financial Plan for FY2017
265
-30
-22-18
-22
66-9 -
230
▲50
-
50
100
150
200
250
300
0
50
100
150
200
250
Telecommunications and Electronic
devices Segment
Change
-35
―-26
-9
Analysis of consolidated Operating income[FY2017](vs previous year)
(Hundred Million Yen)
FY2016Actual
FY2017Plan
Impact of Foreign
Exchange rate
Cost reduction
Decline in Price Strategic
InvestmentSales volume
Telecommunications and Electronic devices
Segment
Other Segment
Other Segment
Air conditioners Segment

FUJITSU GENERAL LIMITED
141-2.Financial Plan for FY2017
(Hundred Million Yen)
Net sales 1,105 1,219 2,324 1,140 1,505 2,645 321 11% 14%
Operating income 122 124 246 60 160 220 - 26 -11%
(Operating income margin) (11.0%) (10.2%) (10.6%) (5.3%) (10.6%) (8.3%) (-2.3%)
Net sales 112 151 263 105 140 245 - 18 -7%
Operating income 6 18 24 2 13 15 - 9 -39%
(Operating income margin) (5.8%) (12.0%) (9.3%) (1.9%) (9.3%) (6.1%) (-3.2%)
Net sales 7 7 14 5 5 10 - 4 -30%
Operating income - 2 - 3 - 5 - 2 - 3 - 5 - -%
(Operating income margin) (-31.0%) (-49.4%) (-40.0%) (-40.0%) (-60.0%) (-50.0%) (-10.0%)
Net sales 1,224 1,377 2,601 1,250 1,650 2,900 299 9% 12%
Operating income 126 139 265 60 170 230 - 35 -13%
(Operating income margin) (10.3%) (10.1%) (10.2%) (4.8%) (10.3%) (7.9%) (-2.3%)
59 62 121 64 66 130 9 7%
27 28 55 38 32 70 15 26%
30 24 54 27 28 55 1 2%Depreciation Expenses
Total
Telecommunicationsand
Electronic devices
Air conditioners
Others
R&D Expenses
FullYear
Capital Expenditures
1st Half 2nd HalfFullYear
%
FY2016(Actual) FY2017(Plan) Change
1st Half 2nd HalfFullYear
Segment Information, R&D Expenses, Capital Expenditures, Depreciation Expenses
4.8%
〔Note1: sales to external customers〕 〔Note2: subscripts(%) of change % is local currency base〕
〔Note3: subscripts(%) is proportion to Total Net sales〕
4.5% 4.7% 5.1% 4.0% 4.5% -0.2%

FUJITSU GENERAL LIMITED
2.History of the company
15

FUJITSU GENERAL LIMITED
1,157
853
1,3921,566
1,745 1,7161,950
2,1902,331
2,324151
140
136
113
164 279
357
451365
146
148
86
88
107
10580
89
91 100
117
461
438
1,917
1,5171,642
1,821
2,035 2,092
2,414
2,7482,810
2,601
0
500
1,000
1,500
2,000
2,500
3,000
FY2000 FY2001 FY2009 FY2010 FY2011 FY2012 FY2013 FY2014 FY2015 FY2016
162.History of the company
A/C business heavily dependent
on Europe
Restructuring(Selection andConcentration)
Special demand for Fire-Ambulance
system
Growth stage focusing on A/C
(Hundred Million Yen)
Discontinued operations / others Telecomm
Elec Dev
A/C
Sales by Segment

FUJITSU GENERAL LIMITED
473
145242 298 369 281
378 415 403 449
144
178215
242291
335 224368
490 396230
227
402364
388 426 500
564
577 595
23
30
119158
185 189265
333
332 329
287
273
414
504
512 485
583
510
529 555
1,157
853
1,392
1,566
1,745 1,716
1,950
2,190
2,331 2,324
0
400
800
1,200
1,600
2,000
2,400
FY2000 FY2001 FY2009 FY2010 FY2011 FY2012 FY2013 FY2014 FY2015 FY2016
A/C Sales by Geographic area17
2.History of the company
(Hundred Million Yen)
Middle East and Africa
Europe
Asia and Oceania
Americas
Japan
Overseas
Total
1,769
Overseas Total
580

FUJITSU GENERAL LIMITED
81
▲20
71 74 95
71 93
115
171
246
▲9
▲16
17 24
34 78
119
156
108
24
▲35
▲27
37
▲63
94 110
133 151
207
271 275 265
▲80
▲40
0
40
80
120
160
200
240
280
320
FY2000 FY2001 FY2009 FY2010 FY2011 FY2012 FY2013 FY2014 FY2015 FY2016
Telecomm &Elec Devices
Others
18
(Hundred Million Yen)
2.History of the company
A/C business heavily dependent
on Europe
Restructuring(Selection andConcentration)
Special demand for Fire-Ambulance
system
Growth stage focusing on A/C
Discontinued operations / others
A/C
Operating income by Segment

FUJITSU GENERAL LIMITED
3.Medium-term Management Policy
(FY2017~FY2020)
19
FUJITSU GENERAL LIMITEDMedium-term Management Policy
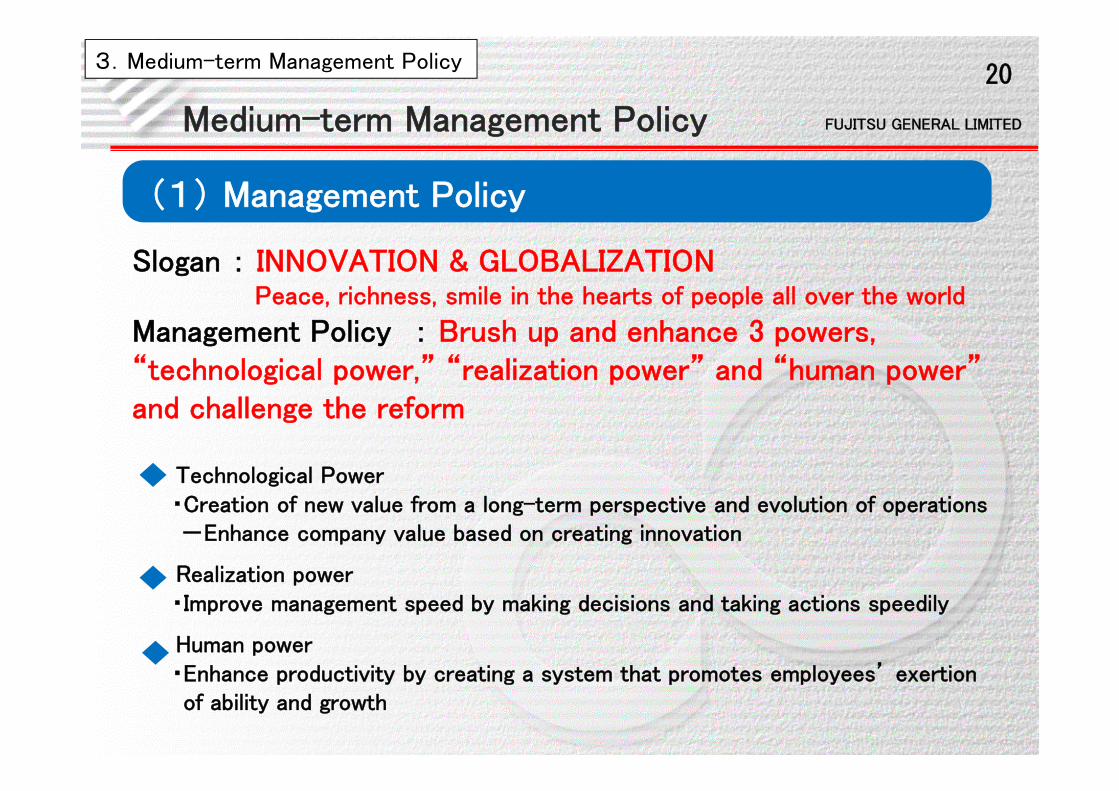
Slogan : INNOVATION & GLOBALIZATIONPeace, richness, smile in the hearts of people all over the world
Management Policy : Brush up and enhance 3 powers, “technological power,” “realization power” and “human power” and challenge the reform
Technological Power・Creation of new value from a long-term perspective and evolution of operations-Enhance company value based on creating innovation
Realization power・Improve management speed by making decisions and taking actions speedily
Human power・Enhance productivity by creating a system that promotes employees’ exertionof ability and growth
(1) Management Policy
203.Medium-term Management Policy

FUJITSU GENERAL LIMITED
FY2020 : Net sales 400 billion yenOperating income 40 billion yenOperating income ratio 10%
〔Assumptions:1US$ = 120yen, copper $7,000/t〕
(2) Medium-term Plan
213.Medium-term Management Policy
(Hundred Million Yen)
Medium-term Management Policy
FY2014 FY2015 FY2016 FY2017 FY2020( Actual ) ( Actual ) ( Actual ) ( Plan ) ( Plan )
Net sales 2,190 2,331 2,324 2,645 3,600Operating income 115 171 246 220 350
(%) (5.2%) (7.3%) (10.6%) (8.3%) (9.7%)Net sales 558 479 277 255 400
Operating income 156 104 19 10 50(%) (28.0%) (21.7%) (6.8%) (3.9%) (12.5%)
Net sales 2,748 2,810 2,601 2,900 4,000Operating income 271 275 265 230 400
(%) (9.9%) (9.8%) (10.2%) (7.9%) (10.0%)Total
Telecomm &Elec Dev,Others
A/C

FUJITSU GENERAL LIMITED
Ⅰ.Expand the air conditioner business1)market environment and basic policy
2)innovation of development system
3)strengthen sales activities
Ⅱ.Restructure the information & communicationsystems/ electronic devices segment
Ⅲ.Promote cost reduction to improve operating profitratio: more than 10%
Ⅳ.Generate cash flow
Ⅴ.Develop human resources
223.Medium-term Management Policy
(3) Important challenges
Medium-term Management Policy

FUJITSU GENERAL LIMITED
◇Emerging countries: higher volumes owing to increased uptake◇Developed countries: high price owing to improved energy efficiency and
performance, along with increased demand for heating applications
233. Medium-term Management Policy
Ⅰ-1)Market environment and basic policies
Forecast of the world demand for air conditioner:Continuous growth at an annual rate of around 6%
Market Environment◇Environmental problems(global warming, Paris Agreement at COP 21)
Introduction and raise of environmental regulations in each country◇Intensifying competition
(Aggressive M&A of competitors, improvement of Chinese and Koreanmanufacturers' technologies, American manufacturers entering the North American ductless market)
◇The progress of IoT and AI both in the areas of functions of air conditionersand manufacturing industry

FUJITSU GENERAL LIMITED
Japan55.5billion(24%)
Americas32.9billion(14%)
Middle East
39.6billion(17%)
Asia/Oceania
59.5billion(26%)
Europe44.9billion(19%)
◇Maintain 5 bases to diversify risks and to create opportunities
◇In the medium term, we concentrate on strategy targets
Evolution of the 5 bases by promoting glocalization
(Global viewpoint + emphasis on the actual situations at the local sites)
243. Medium-term Management Policy
Ⅰ-1)The environment of the air conditioner business and basic policies
The figures are Sales and composition ratiosfor fiscal year 2016

FUJITSU GENERAL LIMITED
25
Ⅰ-2)Innovation of A/C development system
①In-house development
◇Strengthen basic technologies(HP※1, standardization)
◇Develop differentiated products
◇Strengthen cost competitiveness
②In-house+Tie-up◇Bring up new technology(IoT, AI)
◇Innovation(BIG※2)
③Utilization of external resources
◇ODM・OEM procurement
◇New range of products not owned by ourcompany
Double the number of models
Renovate development team
Use external resources to speed up
※1:heat pump※2:Being Innovative Group
(Newly organized groupin Nov 2016)
3. Medium-term Management Policy

FUJITSU GENERAL LIMITED
[Overseas] (1)Growth in commercial business: sales increase of 90% versus FY2016
・Boosting personnel to build support structure for design offices andconsultants
・Expanding in peripheral equipment, ventilation field (considering M&A)
⇒Responding to Chinese manufacturers by increasing system productsales
(2)Speeding up cooperation with Rheem in North American manufacturer(generating sales of 20.0 billion)
・Mutual OEM supply
・Promotion of joint development (startup of North American R&D center in April 2017)
(3)Reestablishment sales strategy for India: doubling sales versus FY2016 ・Allocating personnel and resources, reviewing of JV operations・Strengthening product strategy, considering local production
26
Ⅰ-3)Strengthening A/C Sales Promotion
Five major growth projects
3. Medium-term Management Policy
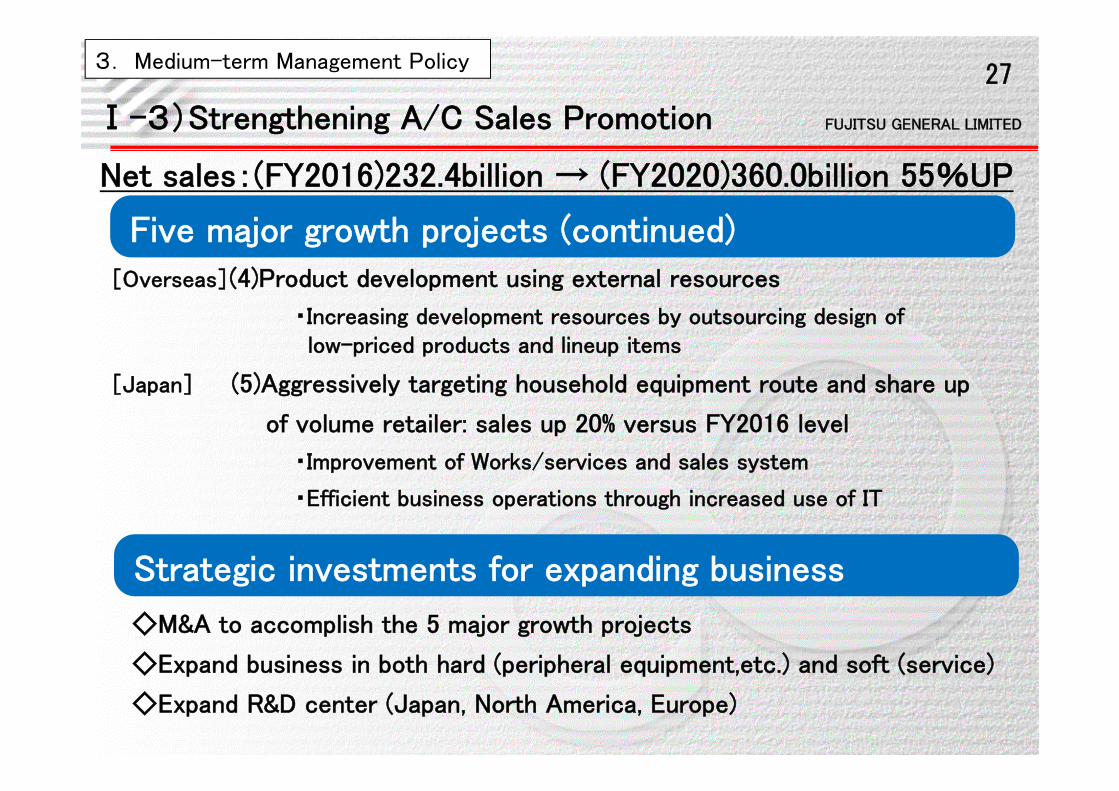
Net sales:(FY2016)232.4billion → (FY2020)360.0billion 55%UP
FUJITSU GENERAL LIMITED
[Overseas](4)Product development using external resources
・Increasing development resources by outsourcing design of low-priced products and lineup items
[Japan] (5)Aggressively targeting household equipment route and share up
of volume retailer: sales up 20% versus FY2016 level
・Improvement of Works/services and sales system
・Efficient business operations through increased use of IT
27
Strategic investments for expanding business
◇M&A to accomplish the 5 major growth projects
◇Expand business in both hard (peripheral equipment,etc.) and soft (service)
◇Expand R&D center (Japan, North America, Europe)
3. Medium-term Management Policy
Net sales:(FY2016)232.4billion → (FY2020)360.0billion 55%UP
Five major growth projects (continued)
Ⅰ-3)Strengthening A/C Sales Promotion

FUJITSU GENERAL LIMITED
Tele
com
munic
ations
Ele
ctro
nic
Devic
es
① Expand business centered on wirelesstechnology (fire-fighting/ disasterprevention) Replacement of fire-fightingdigital system
② Expand private sector business
③ Foster new business (public BB, etc.)
① Narrow down products and concentrateresources
② Speed up of cost reduction activities
◇Cost reduction activities
③ New business: develop in-house products
146
200
FY2016 FY2020
Sales(Hundred Million Yen)
1.4times
117
200
FY2016 FY2020
1.7times
28Ⅱ.Restructure the business system of Telecommunications
/ Electronic Devices
3. Medium-term Management Policy
Sales(Hundred Million Yen)

FUJITSU GENERAL LIMITED
Efforts for sales
①Absorbing fixed cost by expanding sales
②Improve product mix(Expand sales of high-end products andlarge-sized systems)
③Improve brand image(Increase sales price)
Promote cost reduction
① Promote “AKASURI campaign”
② Cost reduction/VE
③ Quality improvement
④ Strengthen manufacturing (“monozukuri”)
⑤ Innovate IT system
29Ⅲ.Promote cost reduction to meet the goal of operating income ratio
for more than 10%
3. Medium-term Management Policy

FUJITSU GENERAL LIMITED
30
Ⅳ.Generate cash flow
◇Promote CCC improvement(Goal: shorten more than 10% versus FY2016 in FY2020)
-Improve inventory turnover period, shorten collection period
Promote operational efficiency
◇Investment for growth(strengthen R&D, improve peripheralequipment, develop sales, etc.)
⇒Consider M&A
◇Shareholder returns: sustainable and stable profit distribution.Target a dividend payout ratio of 20% for the time being
◇Investment in human resources(human resources development, increase motivation)
How to use the cash
3. Medium-term Management Policy

FUJITSU GENERAL LIMITED
◇Motivate employees and improve their productivities
① Health management
② Reduce overtime work
③ Education/ Training
④ Enrichment of welfare benefits
⑤ Promote diversity
31Ⅴ.Promoting and strengthening the management
to think of and make use of persons
Realization of a workplace that keeps employees’ high spirit and to tackle our reform
3. Medium-term Management Policy

FUJITSU GENERAL LIMITED
-END-FUJITSU GENERAL LIMITED
32
Financial Results for FY2016 and
Medium-term Management Policy