Financial and Operational Review First Quarter Ended 31 March 2015 (FY2015)

1 Nissha Confidential Proprietary
Financial Results for FY2015Ended March 31, 2015
andthe Medium-term Business Plan
May 12, 2015
Junya Suzuki President and CEO
Nissha Printing Co., Ltd.
Notes: 1. In this presentation, “FY2015” refers to the year ended March 31, 2015. 2. The results and forecast presented on these materials are all consolidated basis except as otherwise noted.
Nissha Confidential Proprietary
Highlights
FY2015 outperformed the previously announced plan(dated Feb 6th)Net sales 118.7 billion yen, Operating income 8.7 billion yenNet income is the record high at 11.2billion yen (increase dividend payout)ROE19.1%, equity ratio has recovered to 57.4%.
Q4: Devices demand sluggish, Industrial materials performance has recovered.
2
FY2015 Results
FY2016 Forecast: Sales 120.0 billion yen, operating income: 8.5 billion yen(1$=¥118)Devices net sales and net profit decrease. Industrial Materials net sales and net profit increase. Life Innovation business unit is established. Information and Communication business unit is split off as a wholly owned subsidiary of Nissha Printing, clarifying empowerment and accountability.(July 1st)
FY2016 Outlook
Perfect reorganization of business portfolio, thus establish new growth fundamentals. FY2018 target: Sales 150.0 billion yen, operating income 12.0 billion yenROE: 10% or higher, ROIC: 8% or higher, Sales ratio of new businesses and new products: 35% or higher
The Fifth Medium-term Business Plan (FY2016 – FY2018)

3 Nissha Confidential Proprietary
FY2014Results
FY2015Forecast
(Feb 6th)
FY2015Results
Vs. forecast YoY
Net Sales 110,922 117,000 118,775 +1.5% +7.1%Operating Income
(%)
1,935(1.7%)
8,000(6.8%)
8,750(7.4%)
+9.4%(+0.6pt)
+352.2%(+5.7pt)
Ordinary Income 5,182 11,500 12,494 +8.6% +141.1%Net Income 3,967 8,000 11,245 +40.6% +183.5%
Net SalesbyBusinessSegment
Industrial Materials 26,409 28,500 29,460 +3.4% +11.6%Devices 66,315 69,200 70,266 +1.5% +6.0%Information and Communication 18,196
18,000 17,890 -0.6%+4.7%
Others 1,300 1,158 -10.9%Operating IncomebyBusinessSegment
Industrial Materials -1,122 - -235 - -Devices 7,440 - 13,594 - +82.7%Information and Communication -737
- -657 --
Others - -284 -Reconciliations -3,644 - -3,666 - -
FY2015: Outperformed the forecast.Net income reached a record-high. FY2015 accumulated results (Millions of Yen)
*Information and Communication contains Others before FY2014. Others make up another new segment from FY2015.
4 Nissha Confidential Proprietary
FY2015Industrial Materials returned to black in H2.
FY2015Results
Q1Results
Q2Results
Q3Results
Q4Results
Net Sales 22,150 32,972 40,600 23,053 118,775Operating Income
(%)
-751(-3.4%)
3,569(10.8%)
7,541(18.6%)
-1,609(-7.0%)
8,750(7.4%)
Ordinary Income -856 4,918 10,377 -1,945 12,494Net Income -965 4,177 9,230 -1,197 11,245
Net SalesbyBusinessSegment
Industrial Materials 5,721 6,917 8,022 8,800 29,460Devices 12,448 21,596 27,271 8,951 70,266Information and Communication 3,950 4,115 4,916 4,909 17,890Others 29 345 391 393 1,158
Operating IncomebyBusinessSegment
Industrial Materials -548 -125 159 279 -235Devices 879 4,920 8,455 -660 13,594Information and Communication -192 -236 -131 -98 -657Others -13 -97 -65 -109 -284Reconciliations -875 -893 -877 -1,021 -3,666
FY2015 accumulated results (Millions of Yen)
5 Nissha Confidential Proprietary
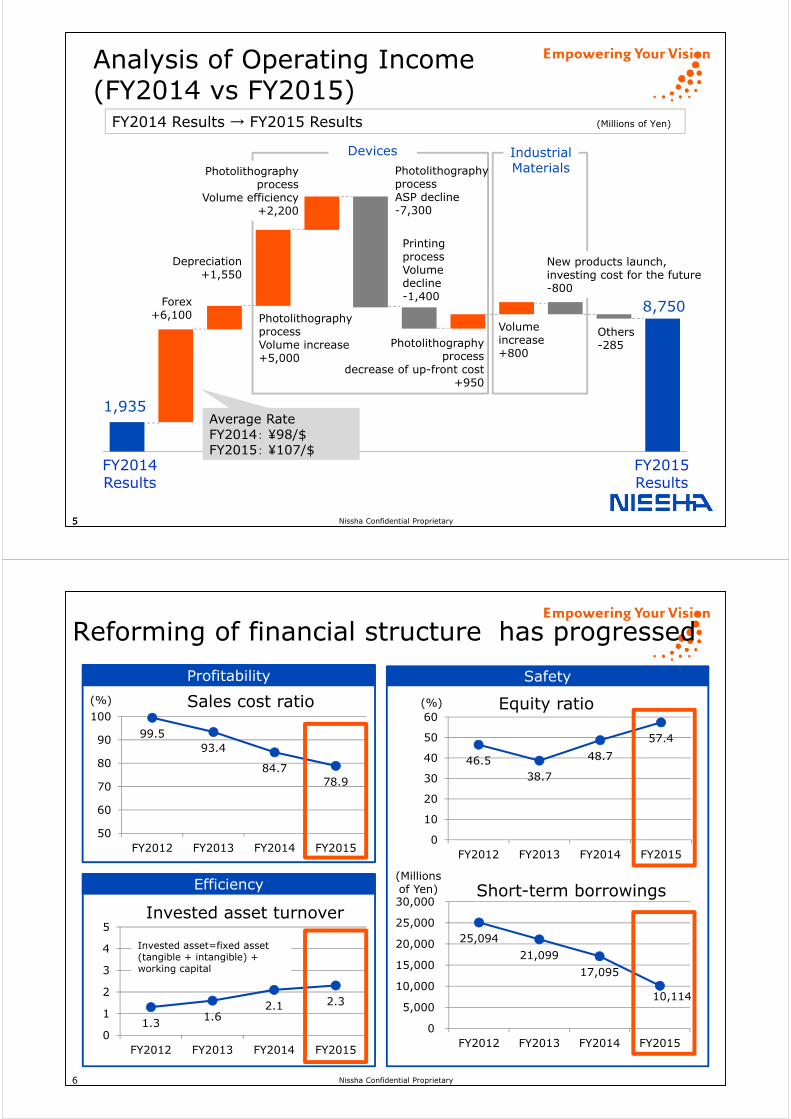
1,935
Others-285
Devices
Forex+6,100
Average RateFY2014: ¥98/$FY2015: ¥107/$
IndustrialMaterials
Photolithography processVolume increase+5,000
5
FY2014Results
FY2015Results
8,750
Photolithography processASP decline-7,300
Depreciation+1,550
Printing processVolume decline-1,400
Volume increase+800
Photolithography process
Volume efficiency+2,200
Photolithographyprocess
decrease of up-front cost+950
New products launch,investing cost for the future-800
FY2014 Results → FY2015 Results (Millions of Yen)
Analysis of Operating Income(FY2014 vs FY2015)
6 Nissha Confidential Proprietary
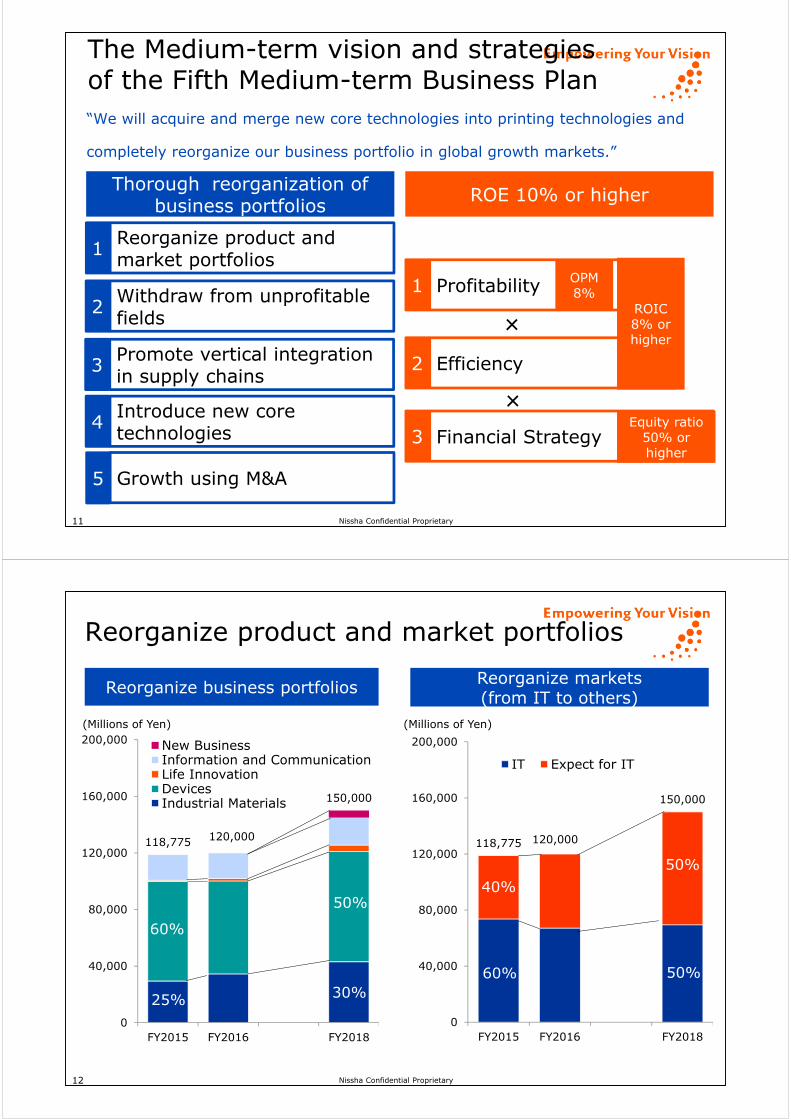
1.3 1.62.1 2.3
0
1
2
3
4
5
FY2012 FY2013 FY2014 FY2015
Invested asset turnover
Reforming of financial structure has progressed
99.593.4
84.778.9
50
60
70
80
90
100
FY2012 FY2013 FY2014 FY2015
Sales cost ratio
25,094
21,099
17,095
10,114
0
5,000
10,000
15,000
20,000
25,000
30,000
FY2012 FY2013 FY2014 FY2015
Short-term borrowings
46.538.7
48.7
57.4
0
10
20
30
40
50
60
FY2012 FY2013 FY2014 FY2015
Equity ratio(%)
Invested asset=fixed asset (tangible + intangible) + working capital
(Millions of Yen)
(%)
Profitability
Efficiency
Safety

7 Nissha Confidential Proprietary
13,864 14,413
21,590
‐ 7,206
‐ 16,149
‐ 4,141
6,658
‐ 1,736
17,449
-25,000
-20,000
-15,000
-10,000
-5,000
0
5,000
10,000
15,000
20,000
25,000
FY2013 FY2014 FY2015
(Millions of Yen) Operating C/F Investing C/F Free C/F
Free C/F has widely been improved
C/F (Millions of Yen)Summary of FY2015
Operating C/FGain before tax 10,761Depreciation 9,687Impairment loss 1,394
Investing C/FPurchase of PP&E -2,212Purchase of investments in subsidiaries -2,039
Financing C/FNet decrease of short-term loans -7,099
8 Nissha Confidential Proprietary
The Fifth Medium-term Business Plan(FY2016 – FY2018)

Nissha Confidential Proprietary
‐10
10
30
50
-50,000
0
50,000
100,000
150,000
200,000
250,000
300,000
FY2013 FY2014 FY2015 FY2016 FY2017 FY2018 FY2019 FY2020 FY2021
9
VISION 2020 Accelerate reorganization of business portfolio
(%)
Net Sales
OPM
150.0billion yen
35%
50%
Sales ratio of new businesses and new products
Growth strategy through reorganization Industrial Materials recovers Completed capex cycle of existing business Leverage M&A Increase credit line
118.7billion yen
5%
Devices generates cash Improved financial performance
Recovered equity ratioCompress interest bearing debt
Needs to pursue growth strategyThe 4th Medium-term
Business Plan
Improve financial performance
The 5th Medium-termBusiness Plan
Perfect reorganization
Nissha Confidential Proprietary10
FY2018 target:Sales 150.0 billion yen, operating income 12.0 billion yen
The 3rd
Medium-term
Business Plan
(FY2012)Results
The 4th
Medium-term Business Plan
(FY2015)Forecast
The 4th
Medium-term Business Plan
(FY2015)Results
H1:1$=¥101H2:1$=¥113.5
The 5th
Medium-term Business Plan
(FY2018)Forecast1$=¥118
Net Sales 80,160 130,000 Sales ratio of new businesses and new
products: 25% or higher
118,775 Sales ratio of new businesses and new
products: 5%
150,000 Sales ratio of new businesses and new
products: 35% or higher
Operating income (%)
-11,716(-14.6%)
9,000(6.9%)
8,750(7.4%)
12,000(8.0%)
Net income(%)
11,245(9.5%)
9,500(6.3%)
ROE ― 10% or higher 19.1% 10% or higher
ROIC* ― 6% or higher 6.6% 8% or higher*ROIC=Operating income×(1- effective tax rate 35%)/(working capital + fixed assets
+ cash equivalent + investments in securities)
Foreign exchange profit and tax effectsare not assumed
Including foreign exchange profit (about 4.5 billion yen) and tax effects (about 1.8 billion yen)
Nissha Confidential Proprietary
“We will acquire and merge new core technologies into printing technologies and
completely reorganize our business portfolio in global growth markets.”
The Medium-term vision and strategiesof the Fifth Medium-term Business Plan
11
Thorough reorganization of business portfolios
Profitability1Withdraw from unprofitable fields2
Promote vertical integration in supply chains3
Introduce new core technologies4
Growth using M&A5
ROE 10% or higher
Reorganize product and market portfolios1
Efficiency2
Financial Strategy3
ROIC8% orhigher
Equity ratio50% or higher
OPM8%
×
×
Nissha Confidential Proprietary
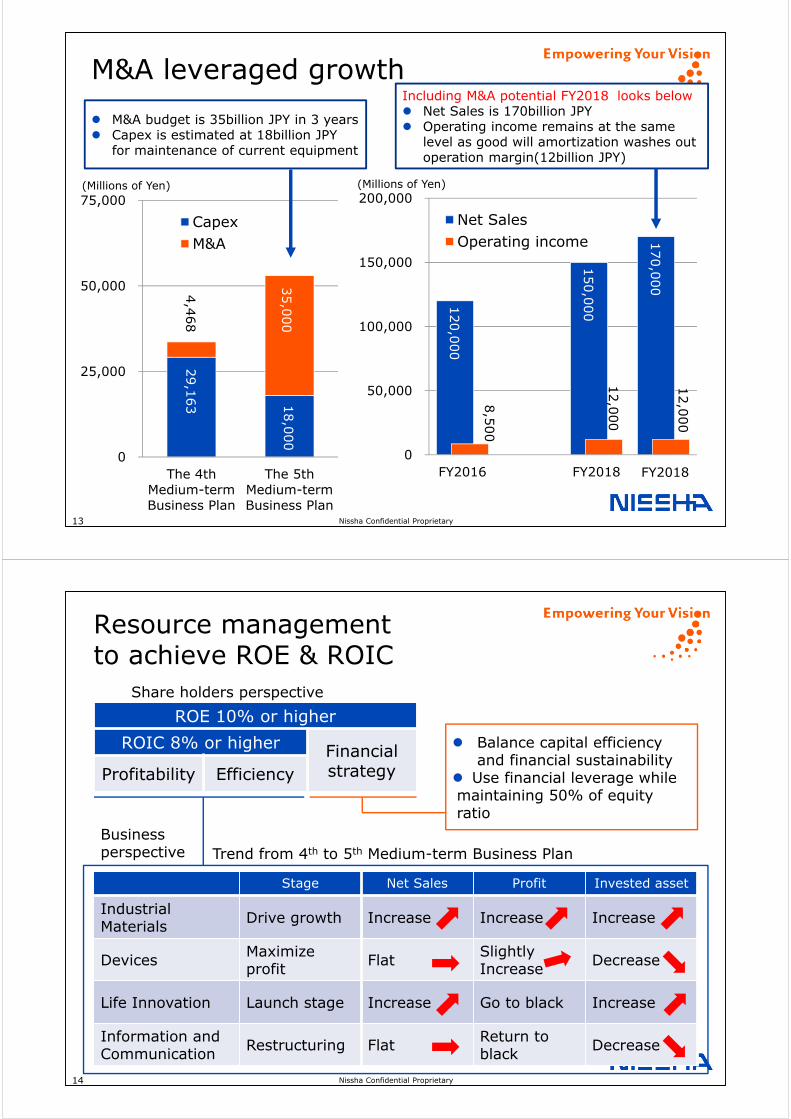
118,775 120,000
150,000
0
40,000
80,000
120,000
160,000
200,000
FY2015 FY2016 FY2017 FY2018
IT Expect for IT
IT比率
41%IT比率
48%
12
118,775 120,000
150,000
0
40,000
80,000
120,000
160,000
200,000
FY2015 FY2016 FY2017 FY2018
New BusinessInformation and CommunicationLife InnovationDevicesIndustrial Materials
Reorganize markets(from IT to others)
Reorganize business portfolios
60%
40%
50%
50%
60%
50%
25% 30%
(Millions of Yen)(Millions of Yen)
Reorganize product and market portfolios
Nissha Confidential Proprietary
29,1
63
18,0
00
4,4
68
35,0
00
0
25,000
50,000
75,000
The 4thMedium-termBusiness Plan
The 5thMedium-termBusiness Plan
CapexM&A
120,0
00
150,0
00
170,0
00
8,5
00
12,0
00
12,0
00
0
50,000
100,000
150,000
200,000
FY2016 FY2017 FY2018 FY20182
Net SalesOperating income
FY2018
(Millions of Yen)
Including M&A potential FY2018 looks below Net Sales is 170billion JPY Operating income remains at the same
level as good will amortization washes out operation margin(12billion JPY)
M&A leveraged growth
(Millions of Yen)
M&A budget is 35billion JPY in 3 years Capex is estimated at 18billion JPY
for maintenance of current equipment
13
Nissha Confidential Proprietary
Resource managementto achieve ROE & ROIC
Stage Net Sales Profit Invested asset
Industrial Materials Drive growth Increase Increase Increase
Devices Maximize profit Flat Slightly
Increase Decrease
Life Innovation Launch stage Increase Go to black Increase
Information and Communication Restructuring Flat Return to
black Decrease
ROE 10% or higher
ROIC 8% or higher FinancialstrategyProfitability Efficiency
Business perspective
Balance capital efficiency and financial sustainability
Use financial leverage while maintaining 50% of equity ratio
Share holders perspective
Trend from 4th to 5th Medium-term Business Plan
14

Nissha Confidential Proprietary
Industrial Materials:Recovers to become a breadwinner
15
The Fifth Medium-term Business Plan
Automotive and home appliances are the focus areas.
Automotive segment aims 20billion net sales
Increase decoration solution line-ups
Establish global value chain through vertical integration such as integrating molding businesses.
Gain foothold in printing related materials area up-stream in the printing value chain
(Millions of Yen)
Stage Net Sales Profit Invested asset
Drive growth Increase Increase Increase
Nissha Confidential Proprietary16
Build the global chain to captureautomotive & home appliance fields
Eimo Technologies(USA)
PMX Technologies(Mexico)
Southern Nissha(Malaysia)
Si-Cal Technologies(USA)
Nissha Confidential Proprietary
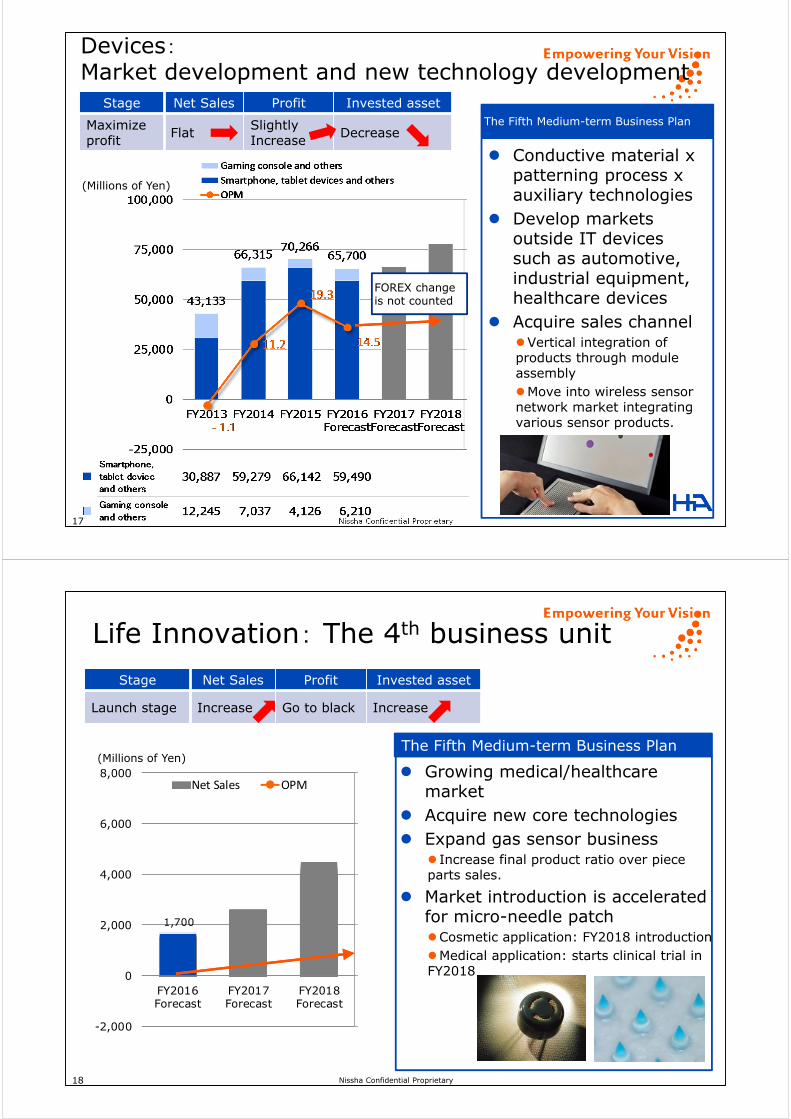
Devices:Market development and new technology development
17
Conductive material x patterning process x auxiliary technologies
Develop markets outside IT devices such as automotive, industrial equipment, healthcare devices
Acquire sales channelVertical integration of products through module assemblyMove into wireless sensor network market integrating various sensor products.
Stage Net Sales Profit Invested asset
Maximizeprofit Flat Slightly
Increase DecreaseThe Fifth Medium-term Business Plan
FOREX change is not counted
(Millions of Yen)
Nissha Confidential Proprietary
Life Innovation: The 4th business unit
18
1,700
‐5
0
5
10
15
20
-2,000
0
2,000
4,000
6,000
8,000
FY2016Forecast
FY2017Forecast
FY2018Forecast
Net Sales OPM Growing medical/healthcare
market Acquire new core technologies Expand gas sensor business
Increase final product ratio over piece parts sales.
Market introduction is accelerated for micro-needle patchCosmetic application: FY2018 introductionMedical application: starts clinical trial in FY2018
Stage Net Sales Profit Invested asset
Launch stage Increase Go to black Increase
The Fifth Medium-term Business Plan(Millions of Yen)

Nissha Confidential Proprietary
Information and Communication:Split off business unit to be a wholly owned subsidiary, to clarify empowerment and accountability.
19
Stage Net Sales Profit Invested asset
Restructuring Flat Return to black Decrease
*Others contains such as real-estate and personnel-service business that are not included in Information and Communication business before 2014/3. They are not contained in 2015/3 forecast.
Increase autonomy to cope with rapidly changing business environment through split-off on July 1st.
Pursue profit management through selection and concentration of existing business opportunities.
The Fifth Medium-term Business Plan
20 Nissha Confidential Proprietary
FY2016 Forecast (Millions of Yen)
FY2015Results
FY2016Forecast(¥118/$)
YoYH1 H2
Net Sales 118,775 55,000 65,000 120,000 +1.0%
Operating income(OPM)
8,750(7.4%)
2,000(3.6%)
6,500(10.0%)
8,500(7.1%)
-2.9%(-0.3pt)
Ordinary Income 12,494 2,000 6,500 8,500 -32.0%
Net Income 11,245 1,500 5,800 7,300 -35.1%
Net Sales by Business Segment
Industrial Materials 29,460 16,500 18,000 34,500 +17.1%Devices 70,266 29,650 36,050 65,700 -6.5%Life Innovation - 600 1,100 1,700 -Information and Communication 17,890 8,200 9,800 18,000 +0.6%Others 1,158 50 50 100 -
Operating income by Business Segment
Industrial Materials -235 550 1,450 2,000 Return to black
Devices 13,594 3,400 6,100 9,500 -30.1%Life Innovation - -200 200 0 -Information and Communication -657 -150 350 200 Return to black
Others -284 0 0 0 -Reconciliations -3,666 -1,600 -1,600 -3,200 -
FY2016:Industrial Materials return to stage for future growth.

21 Nissha Confidential Proprietary
8,750
Devices IndustrialMaterials
21
FY2015Results
FY2016Forecast
Forex+5,950
Depreciation+2,100
8,500
Photolithography processASP decline-7,600
Amortization of goodwill,
new production launch, etc.
-500
Photolithography process
Volume decline-2,300
Volumeincrease+1,600
Cost increase for new production launch and
developing cost-1,600
Assumed rateFY2015: ¥107/$FY2016: ¥118/$
Profit impro-vement+800
Information andCommunication
Photolithography processproductivity improvement+1,000
FISSales increase,profit improvement+300
Life Innovation
FY2015 Results → FY2016 Forecast (Millions of Yen)
Analysis of Operating Income(FY2015 vs FY2016)
22 Nissha Confidential Proprietary22
Thank you.
Contact to:Investor RelationsNissha Printing Co., Ltd.T +81 75 823 5144

23 Nissha Confidential Proprietary23
Disclaimer;These presentation materials include statements and data that show future forecasts related to the results, strategies, business plans, etc., of Nissha Printing Co., Ltd.
These statements and data related to future forecasts are not actual facts of the past, but rather forecasts that Nissha has judged based on the information available at the time of presentation.
In addition, these presentation materials also include potential risks and uncertain factors such as economic trends and the competitive situation with other companies. Consequently, please be aware that it is possible actual results, business developments and the company’s financial situation may differ greatly from the future forecasts included in this presentation due to future economic trends, competition in the industry, market demand, and various other factors such as the economic, social and political climate.
Terms of use;This document contains confidential information and any all rights regarding the document belong to the editor of the document. Therefore, any disclosure and/or leakage of the document to any third parties other than recipients of the documents, and copy, transfer and/or citation of the document without the prior authorization of the editor are strictly prohibited.In addition, any use of the document for the purpose other than original purpose for the disclosure of the document is also prohibited.
23