Financial Results for Fiscal 2020 and Forecast for Fiscal 2021
47
Financial Results for Fiscal 2020 and Forecast for Fiscal 2021 May 11, 2021 KOBE STEEL, LTD.
Transcript of Financial Results for Fiscal 2020 and Forecast for Fiscal 2021

Financial Results forFiscal 2020 andForecast forFiscal 2021
May 11, 2021KOBE STEEL, LTD.

P2
1. Financial Results for Fiscal 2020
2. Forecast for Fiscal 2021
3. Reference Information

P3
1. Financial Results for Fiscal 2020

P4Consolidated Earnings Summary of FY2020
(Billions of yen)
FY2019 Actual FY2020 Actual Change
1H 2H ① 1H 2H ② ②-①
Net Sales 944.4 925.3 1,869.8 776.4 929.1 1,705.5 (164.2)
Operating Income (Loss) 7.4 2.4 9.8 (27.1) 57.5 30.3 20.5
Ordinary Income (Loss) 1.4 (9.5) (8.0) (35.2) 51.4 16.1 24.2
Excluding Inventory Valuation 2.9 (9.0) (6.0) (24.7) 44.9 20.1 26.2
Extraordinary Income (Loss) (4.1) (53.3) (57.4) 13.6 (11.0) 2.5 60.0
Net Income (Loss) Attributable to Owners of the Parent
(6.2) (61.7) (68.0) (15.2) 38.4 23.2 91.2
FY2019 FY2020
1 U.S. dollar to yen 109 106
1 Chinese yuan to yen 15.6 15.7
1 Euro to yen 121 124
※
The impact of the spread of the novel coronavirus (COVID-19) has significantly worsened the economic environment.
Net Sales ・・ Decreased due to a decrease in sales volume mainly for automobiles, aircraft, and construction.
Ordinary Income (Loss) ・・ Improved mainly due to the profit improvement centered on Steel & Aluminum, Advanced
Materials, and Construction Machinery, and the start of operations at the Moka Power Plant.
※Breakdown of Extraordinary Income (Loss) FY2019 FY2020
Extraordinary Income Gain on sale of fixed assets ー 9.9
Gain on step acquisitions ー 3.2
Gain on sale of investment securities 7.5 2.9
Extraordinary Loss Loss on impairment (49.9) (13.5)
Loss on valuation of investment securities (15.0) ー
Extraordinary Income (Loss) (57.4) 2.5

P5FY2020 Analysis of Ordinary Income (Loss)
(Billions of yen)
※Inventory valuation includes effect from the average method and the lower of cost or market method.
Quantity mix(62.0)
Reduced production and cost
increase of steel products
(6.0)

P6Earnings Summary of FY2020(Net Sales and Ordinary Income (Loss) by Segment)
(Billions of yen)
FY2019Actual
FY2020Actual
Change
②-①① ②
Steel &Aluminum
780.2 696.3 (83.9)
AdvancedMaterials
297.1 238.1 (58.9)
Welding 83.7 70.0 (13.7)
Machinery 165.9 175.3 9.3
Engineering 141.5 136.1 (5.3)
ConstructionMachinery
360.8 333.1 (27.6)
Electric Power 75.6 80.4 4.7
OtherBusinesses
33.6 27.8 (5.8)
Adjustment (68.9) (51.7) 17.2
Total 1,869.8 1,705.5 (164.2)
(Billions of yen)
FY2019Actual
FY2020Actual
Change
④-③③ ④
Steel &Aluminum
(16.5) (22.6) (6.1)
AdvancedMaterials
(25.2) (12.1) 13.1
Welding 2.9 1.7 (1.1)
Machinery 9.6 11.4 1.8
Engineering 5.7 4.4 (1.3)
ConstructionMachinery
7.5 12.7 5.2
Electric Power 8.9 20.6 11.7
OtherBusinesses
3.3 4.2 0.8
Adjustment (4.4) (4.3) 0.1
Total (8.0) 16.1 24.2
【Net Sales】 【Ordinary Income (Loss)】

P7Returns to Shareholders
➢ Kobe Steel determines dividends taking its financial condition, business performance,future capital needs and other factors into overall consideration with the aim of payingdividends on a continuous and steady basis in principle. The target dividend payout ratiois 15 to 25% of consolidated net income attributable to owners of the parent.
➢ Under this policy, Kobe Steel passed a resolution to pay a year-end dividend of 10 yen per share, with a change from 5 yen per share, reflecting the increase in net income attributable to owners of the parent compared to the forecast announced on April 5.(See P.34 for details on consolidated earnings.)
FY2019 FY2020
Interim Year-end Interim Year-end
Dividends per sharein yen
- - - - 10 10
Dividend per net assets
15.6%

P8Earnings Summary of FY2020 【Steel & Aluminum】
(Billions of yen)
FY2019 Actual FY2020 Actual Change
1H 2H ① 1H 2H ② ②-①
Steel products
Net Sales 330.0 320.0 650.0 245.2 318.6 563.8 (86.2)
Ordinary Income (Loss) (0.3) (8.4) (8.8) (40.4) 17.1 (23.3) (14.5)
Excluding Inventory Valuation (0.3) (8.4) (8.8) (31.9) 11.1 (20.8) (12.0)
Aluminumrolled
Products
Net Sales 65.9 64.1 130.1 65.9 66.4 132.4 2.3
Ordinary Income (Loss) (4.2) (3.4) (7.7) (1.4) 2.0 0.6 8.3
Excluding Inventory Valuation (3.7) (1.9) (5.7) 0.0 3.0 3.1 8.8
Total
Net Sales 396.0 384.1 780.2 311.2 385.1 696.3 (83.9)
Ordinary Income (Loss) (4.5) (11.9) (16.5) (41.8) 19.2 (22.6) (6.1)
Excluding Inventory Valuation (4.0) (10.4) (14.5) (31.8) 14.2 (17.6) (3.1)

P9Earnings Summary of FY2020【Steel & Aluminum】(Steel products)
Steel products
FY2019: Ordinary Loss of 8.8 billion yen →FY2020: Ordinary Loss of 23.3 billion yen (Down 14.5 billion yen from FY2019)
■Crude steel production: 5.81 million tons (down 0.69 million tons year on year)■Sales volume: 4.73 million tons (down 0.57 million tons year on year)・ Overall demand declined mainly in the automotive sector due to the impact of COVID-19
■Sale price: 82,300 yen/ton (down 4,600 yen/ton year on year)・ A fall in prices of main materials / A fall in export prices
■Factors affecting profit and loss・ Decreased sales volume・ Improvement of variable costs through improved yield and increased use of inexpensive raw materials・ Cost reduction through emergency measures such as labor cost reduction and maintenance cost reduction
※Inventory valuation includes effect from the average method and the lower of cost or market method.
※Related data on P.37-39
Quantity mix(32.0)
Reduced production and cost increase
(6.0)
(Billions of yen)

P10Earnings Summary of FY2020【Steel & Aluminum】(Aluminum rolled products)
Aluminumrolled
products
FY2019: Ordinary Loss of 7.7 billion yen →FY2020: Ordinary Income of 0.6 billion yen (Up 8.3 billion yen from FY2019)
■Sales volume: 305 thousand tons (up 6 thousand tons year on year)・ For beverage can stock: Remained stable・ For IT and semiconductors: Increased owing mainly to the increased supply for data centers・ For automobiles: Decreased
■Factors affecting profit and loss
・ Sales expansion of beverage can stock (profit improvement in the materials businesses)
・ Cost reduction including emergency measures
※Inventory valuation includes effect from the average method and the lower of cost or market method.
(Billions of yen)
※Related data on P.38-39
P11
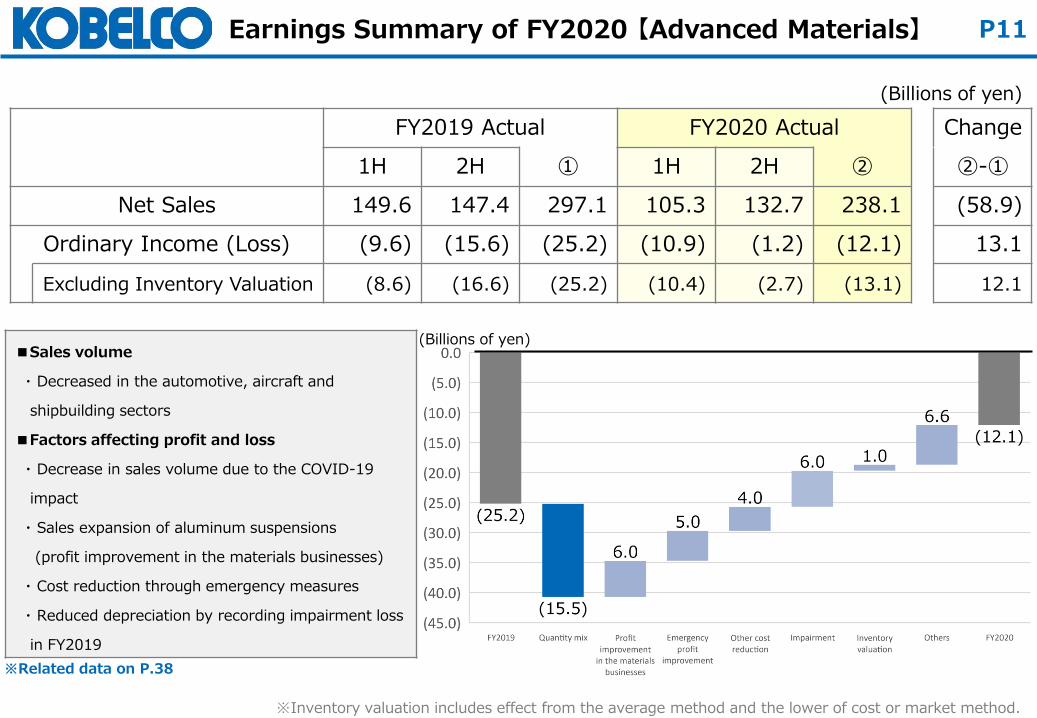
■Sales volume
・ Decreased in the automotive, aircraft and
shipbuilding sectors
■Factors affecting profit and loss
・ Decrease in sales volume due to the COVID-19
impact
・ Sales expansion of aluminum suspensions
(profit improvement in the materials businesses)
・ Cost reduction through emergency measures
・ Reduced depreciation by recording impairment loss
in FY2019
Earnings Summary of FY2020 【Advanced Materials】
(Billions of yen)
FY2019 Actual FY2020 Actual Change
1H 2H ① 1H 2H ② ②-①
Net Sales 149.6 147.4 297.1 105.3 132.7 238.1 (58.9)
Ordinary Income (Loss) (9.6) (15.6) (25.2) (10.9) (1.2) (12.1) 13.1
Excluding Inventory Valuation (8.6) (16.6) (25.2) (10.4) (2.7) (13.1) 12.1
※Inventory valuation includes effect from the average method and the lower of cost or market method.
(Billions of yen)
※Related data on P.38

P12Earnings Summary of FY2020 【Welding】
(Billions of yen)
FY2019 Actual FY2020 Actual Change
1H 2H ① 1H 2H ② ②-①
Net Sales 43.1 40.6 83.7 34.7 35.2 70.0 (13.7)
Ordinary Income (Loss) 1.8 1.0 2.9 0.6 1.1 1.7 (1.1)
■Sales volume
Domestic: Decline in demand for automobiles and construction machinery
Overseas: Decline in demand for automobiles in Southeast Asia and other regions
and sluggish demand for shipbuilding
■Factors affecting profit and loss
・ Decrease in sales volume
・ Cost reduction through fixed cost reduction
※Related data on P.38

P13Earnings Summary of FY2020 【Machinery】
(Billions of yen)
FY2019 Actual FY2020 Actual Change
1H 2H ① 1H 2H ② ②-①
Net Sales 80.4 85.5 165.9 86.4 88.9 175.3 9.3
Ordinary Income (Loss) 2.3 7.3 9.6 4.1 7.3 11.4 1.8
Orders 80.5 71.1 151.6 50.6 61.9 112.6 (38.9)
Backlog of Orders 155.1 118.0 (37.1)
■Orders
・ Decreased both in the industrial machinery and compressor sectors against the backdrop
of reductions and deferment of capital investments due to the impact of COVID-19
■Factors affecting profit and loss
・ Cost reduction through fixed cost reduction

P14
(Billions of yen)
FY2019 Actual FY2020 Actual Change
1H 2H ① 1H 2H ② ②-①
Net Sales 61.4 80.0 141.5 56.0 80.1 136.1 (5.3)
Ordinary Income (Loss) 2.1 3.5 5.7 (0.6) 5.1 4.4 (1.3)
Orders 69.6 64.8 134.5 75.8 37.6 113.4 (21.1)
Backlog of Orders 291.1 282.1 (8.9)
Earnings Summary of FY2020 【Engineering】
※Regarding long-term operation and maintenance work in Kobelco Eco Solutions’ water treatment and waste treatment business, orders were previously counted at the time of sales. A new counting method has been adopted since FY2020 and orders are counted at the time of acceptance of a contract. Orders and backlog of orders for FY2019 have also been recounted based on the new method.
※
■Orders
・ Major projects in water treatment and waste treatment were ordered in FY2019
■Factors affecting profit and loss
・ Overseas project were deferred due to the impact of COVID 19
※

P15Earnings Summary of FY2020 【Construction Machinery】
(Billions of yen)
FY2019 Actual FY2020 Actual Change
1H 2H ① 1H 2H ② ②-①
Net Sales 197.8 163.0 360.8 161.8 171.3 333.1 (27.6)
Ordinary Income (Loss) 8.7 (1.2) 7.5 4.7 8.0 12.7 5.2
■Unit sales
・ Hydraulic excavators
Domestic: Unit sales increased year on year compared to
FY2019 that saw a decline in sales due to
Typhoon Hagibis.
China: Increased due to increased infrastructure investment
Others: Significantly decreased due to the impact
of COVID-19
・ Crawler cranes
Decreased both in Japan and overseas due to the impact
of COVID-19
■Factors affecting profit and loss
・ Decreased profitability in China due to decreased unit sales
and intensified competition
・ Cost reduction through emergency measures
(Billions of yen)

P16Earnings Summary of FY2020 【Electric Power】
(Billions of yen)
FY2019 Actual FY2020 Actual Change
1H 2H ① 1H 2H ② ②-①
Net Sales 35.4 40.2 75.6 37.0 43.3 80.4 4.7
Ordinary Income (Loss) 1.6 7.3 8.9 8.1 12.4 20.6 11.7
■Factors affecting profit and loss
・ Start of full operation of the Moka Power Plant
(No.1 Unit: October 2019/No.2 Unit: March 2020)
・ Increase in demand for electricity supply in winter
・ Decrease in depreciation of the Kobe Power Plant’s No. 1 unit and No. 2 unit

P17
2. Forecast for Fiscal 2021

P18Consolidated Forecast for FY2021
(Billions of yen)
FY2020 Actual
FY2021 Forecast Change
① 1H 2H ② ②-①
Net Sales 1,705.5 910.0 960.0 1,870.0 164.5
Operating Income (Loss) 30.3 20.0 35.0 55.0 24.7
Ordinary Income (Loss) 16.1 15.0 30.0 45.0 28.9
Excluding Inventory Valuation 20.1 2.0 33.0 35.0 14.9
Extraordinary Income (Loss) 2.5 - - - (2.5)
Net Income (Loss) Attributable to Owners of the Parent
23.2 10.0 15.0 25.0 1.8
FY2020 FY2021
1 U.S. dollar to yen 106 109
1 Chinese yuan to yen 15.7 16.0
1 Euro to yen 124 130
• Anticipates an increase in sales volume due to recovery in demand mainly for automobiles and expansion of sales
• Partially eases emergency profit improvement measures for some areas such as labor management
• Anticipates the impact of inventory valuation associated with rising raw material prices and possible changes in the businessperformance of the electric power business due to temporary factors
• Carefully monitors factors that could have the impact on business performance, such as rising iron ore prices, semiconductor shortages, and changes in demand due to the resurgence of COVID-19
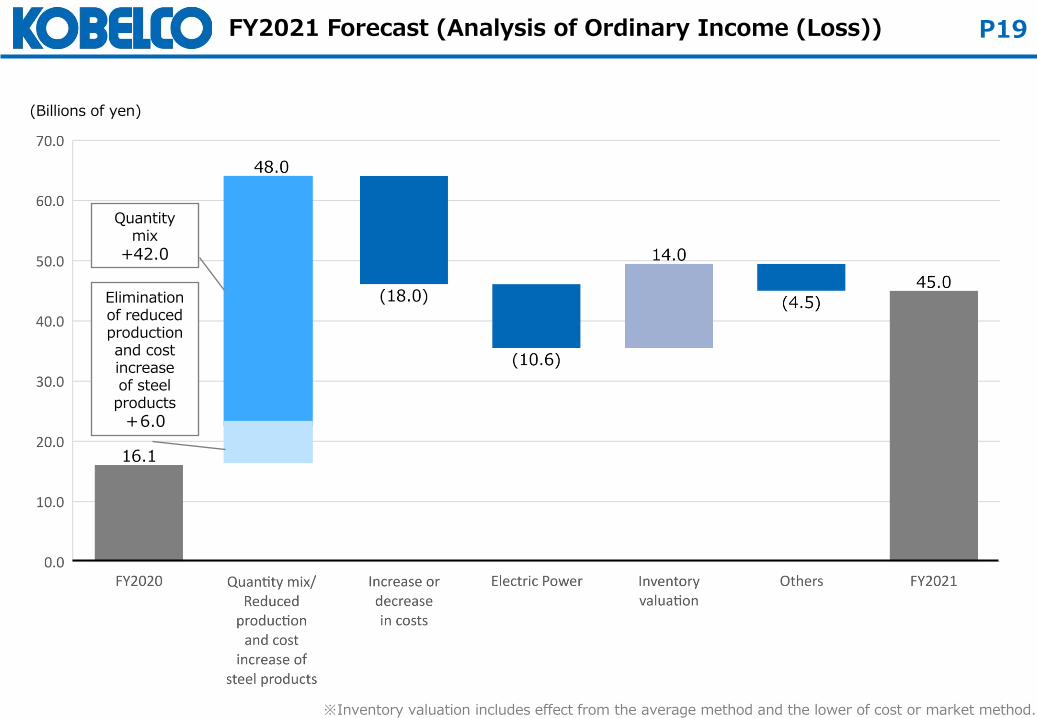
P19FY2021 Forecast (Analysis of Ordinary Income (Loss))
(Billions of yen)
Quantity mix
+42.0
Elimination of reduced production and cost increaseof steel products
+6.0
※Inventory valuation includes effect from the average method and the lower of cost or market method.

P20Demand Forecast of Materials business
Business units that are affected by demand fluctuation are shown in ( ).
Automobiles
(Steel products, aluminum flat rolled products, aluminum suspensions, aluminum extrusions & fabrication, copper flat rolled products, steel powder, and welding)In the 1st half of fiscal 2021, the index is expected to remain at the same level as FY2020 4Q level, with a moderate increase expected in the 2nd half. However, there are concerns that the shortage of semiconductors will affect automobile production.
《Estimation of Japanese Automobile Manufacturers' Production Volume (including overseas) (Compared to FY 2020 4Q)》 (Compared to fiscal 2020)
Aircraft (Aluminum casting & forging, and titanium)Due to a decline in passenger demand, the market is anticipated to remain sluggish over the next few years.
Shipbuilding (Steel products, steel casting & forging, and welding)Difficult conditions will continue due to stagnation in new business projects and postponement in construction plans.
Beverage canstock
(Aluminum flat rolled products)Strong demand is expected to continue in fiscal 2021.
IT/Semiconductors
(Aluminum flat rolled products, and copper flat rolled products)Sales of IT and semiconductor products are generally strong, including disk materials for data centers and leadframe materials for PCs and mobile phones. Demand is expected to increase compared to fiscal 2020.
Civilengineering &construction
(Steel products and welding)Demand in the construction sector will remain sluggish. Demand for steel frames is expected to remain at the same level as fiscal 2020.
1Q 2Q 3Q 4Q
FY2021 ー ー +5% +5%
Full year
+15%

P21FY2021 Forecast (Net Sales by Segment)
(Billions of yen)
FY2020 Actual
FY2021 Forecast Change
① 1H 2H ② ②-①
Steel &Aluminum
696.3 395.0 410.0 805.0 108.7
Advanced Materials
238.1 135.0 145.0 280.0 41.9
Welding 70.0 33.0 36.0 69.0 (1.0)
Machinery 175.3 79.0 86.0 165.0 (10.3)
Engineering 136.1 60.0 81.0 141.0 4.9
ConstructionMachinery
333.1 190.0 170.0 360.0 26.9
ElectricPower
80.4 31.0 48.0 79.0 (1.4)
OtherBusinesses
27.8 11.0 16.0 27.0 (0.8)
Adjustment (51.7) (24.0) (32.0) (56.0) (4.3)
Total 1,705.5 910.0 960.0 1,870.0 164.5
【Net Sales】

P22FY2021 Forecast (Ordinary Income (Loss) by Segment)
(Billions of yen)
FY2020 Actual
FY2021 Forecast Change
① 1H 2H ② ②-①
Steel &Aluminum
(22.6) 11.0 14.0 25.0 47.6
Advanced Materials
(12.1) (1.0) 2.0 1.0 13.1
Welding 1.7 0.0 1.0 1.0 (0.7)
Machinery 11.4 0.0 3.5 3.5 (7.9)
Engineering 4.4 1.5 3.0 4.5 0.1
ConstructionMachinery
12.7 3.0 4.0 7.0 (5.7)
ElectricPower
20.6 4.0 6.0 10.0 (10.6)
OtherBusinesses
4.2 0.0 3.0 3.0 (1.2)
Adjustment (4.3) (3.5) (6.5) (10.0) (5.7)
Total 16.1 15.0 30.0 45.0 28.9
【Ordinary Income (Loss)】

P23FY2021 Forecast 【Steel & Aluminum】
(Billions of yen)
FY2020 Actual
FY2021 Forecast Change
① 1H 2H ② ②-①
Steelproducts
Net Sales 563.8 320.0 340.0 660.0 96.2
Ordinary Income (Loss) (23.3) 10.5 12.0 22.5 45.8
Excluding Inventory Valuation (20.8) (2.0) 16.0 14.0 34.8
Aluminumrolled
products
Net Sales 132.4 75.0 70.0 145.0 12.6
Ordinary Income (Loss) 0.6 0.5 2.0 2.5 1.9
Excluding Inventory Valuation 3.1 0.0 1.5 1.5 (1.6)
Total
Net Sales 696.3 395.0 410.0 805.0 108.7
Ordinary Income (Loss) (22.6) 11.0 14.0 25.0 47.6
Excluding Inventory Valuation (17.6) (2.0) 17.5 15.5 33.1

P24FY2021 Forecast 【Steel & Aluminum】(Steel products)
Steel products
FY2020 Actual: Ordinary Loss of 23.3 billion yen →FY2021 Forecast: Ordinary Income of 22.5 billion yen (Up 45.8 Billion yen from FY2020)
■Crude steel production: 6.60 million tons (up 0.79 million tons from FY2020)
■Sales volume: 5.40 million tons (up 0.67 million tons from FY 2020)
・ Demand recovered mainly for automobiles
■Factors affecting profit and loss
・ Increase in profits due to an increase in sales volume and improved inventory valuation・ Efforts to pass on higher raw material prices to sales prices・ Continued cost reductions, mainly in fixed costs, despite partial easing of profit improvement measures in
some areas such as labor management
※Related data on P.37-39
※Inventory valuation includes effect from the average method and the lower of cost or market method.
Quantity mix
+31.0
Elimination of reduced production and cost increase
+6.0
(Billions of yen)

P25FY2021 Forecast 【Steel & Aluminum】(Aluminum rolled products)
※関連データはP.XX
Aluminum rolled
products
FY2020 Actual: Ordinary Income of 0.6 billion yen →FY2021 Forecast: Ordinary Income of 2.5 billion yen (Up 1.9 billion yen from FY 2020)
■Sales volume: 350 thousand tons (up 45 thousand tons from FY2020)・ Strong sales continue for beverage can materials and IT/semiconductor products.
Plans to expand sales of automotive panel materials.
■Factors affecting profit and loss・ Increase in profits due to an increase in sales volume and improved inventory valuation・ Increase in depreciation due to the start of operation of automobile panel materials manufacturing facilities
※Inventory valuation includes effect from the average method and the lower of cost or market method.
(Billions of yen)
※Related data on P.38

P26FY2021 Forecast 【Advanced Materials】
(Billions of yen)
FY2020 Actual
FY2021 Forecast Change
① 1H 2H ② ②-①
Net Sales 238.1 135.0 145.0 280.0 41.9
Ordinary Income (Loss) (12.1) (1.0) 2.0 1.0 13.1
Excluding Inventory Valuation (13.1) (1.0) 1.5 0.5 13.6
(Billions of yen)
※Inventory valuation includes effect from the average method and the lower of cost or market method.
※Related data on P.38
■Sales volume
・ Demand for shipbuilding and aircraft is anticipated
to continue to be sluggish
・ An overall increase is anticipated due to recovery
in demand for automobiles and semiconductors
■Factors affecting profit and loss
・ Increase in profits due to increased sales volume,
etc.

P27FY2021 Forecast 【Welding】
(Billions of yen)
FY2020 Actual
FY2021 Forecast Change
① 1H 2H ② ②-①
Net Sales 70.0 33.0 36.0 69.0 (1.0)
Ordinary Income (Loss) 1.7 0.0 1.0 1.0 (0.7)
※Related data on P.38
■Sales volume
・ Demand for shipbuilding is anticipated to continue to be sluggish
・ Overall sales are anticipated to increase due to recovery in demand for automobiles
■Factor affecting profit and loss
・ Decrease in profits due to decreased sales of welding systems, etc.

P28FY2021 Forecast 【Machinery】
(Billions of yen)
FY2020 Actual
FY2021 Forecast Change
① 1H 2H ② ②-①
Net Sales 175.3 79.0 86.0 165.0 (10.3)
Ordinary Income (Loss) 11.4 0.0 3.5 3.5 (7.9)
Orders 112.6Approx.
160.0Approx.
47.0
■Orders
・ Increase in orders is anticipated due to recovery in demand in the automotive, electrical
and semiconductor sectors
■Factor affecting profit and loss
・ Decrease in profits due to a decrease in orders for industrial machinery and
compressors in FY2020

P29FY2021 Forecast 【Engineering】
(Billions of yen)
FY2020 Actual
FY2021 Forecast Change
① 1H 2H ② ②-①
Net Sales 136.1 60.0 81.0 141.0 4.9
Ordinary Income(Loss)
4.4 1.5 3.0 4.5 0.1
Orders 113.4Approx.
180.0Approx.
67.0
■Orders
・ Increase in orders is anticipated due to orders for new overseas projects, including
those for the direct reduced iron business
■Factor affecting profit and loss
・ Sales are expected to increase while remaining at the same level as FY2020 due to
differences in project composition

P30FY2021 Forecast 【Construction Machinery】
(Billions of yen)
FY2020 Actual
FY2021 Forecast Change
① 1H 2H ② ②-①
Net Sales 333.1 190.0 170.0 360.0 26.9
Ordinary Income (Loss) 12.7 3.0 4.0 7.0 (5.7)
(Billions of yen)
■Unit sales
・ Recovery in overseas demand is expected.
■Factors affecting profit and loss
・ Increase in development and other
expenses
・ Decrease in profits due to decreased
profitability of businesses in China amid
intensifying competition

P31FY2021 Forecast 【Electric Power】
(Billions of yen)
FY2020 Actual
FY2021 Forecast Change
① 1H 2H ② ②-①
Net Sales 80.4 31.0 48.0 79.0 (1.4)
Ordinary Income (Loss) 20.6 4.0 6.0 10.0 (10.6)
■Factors affecting profit and loss・ Decrease in the number of operating days at Moka Power Plant due to the
implementation of statutory inspections
・ Decrease in profits from fiscal 2020, which saw an increase in profits due to a
temporary increase in demand for electricity supply in winter

P32
724.2
784.4 785.7
600.0
0.98
1.19
1.11
0.60
0.70
0.80
0.90
1.00
1.10
1.20
1.30
1.40
400.0
500.0
600.0
700.0
800.0
900.0
1,000.0
FY2018 FY2019 FY2020 FY2021
Interest-Bearing Debt D/E Ratio
D/E ratio excluding early procurement of borrowings 62.1
billion yen
1.10 times
(Billions of yen)
approx.0.8
(Times)
72.3 21.4
210.0
140.0
(10.9)
(133.4)(81.9)
(140.0)
61.4
(112.0)
128.1
0.0
(210.0)
(110.0)
(10.0)
90.0
190.0
FY2018 FY2019 FY2020 FY2021
Cash Flows from Investing ActivitiesCash Flows from Operating ActivitiesFree Cash Flow
(Billions of yen)D/E ratio
excluding early procurement of borrowings 92.1
billion yen
0.85 times
D/E ratio excluding early procurement of
borrowings 186.2 billion yen
0.84 times
《Free Cash Flow》 《Interest Bearing Debt & D/E Ratio 》
Cash Flow Status
Forecast Forecast※Project finance is not included in free cash flow and D/E ratio.
■ FY2020 Actual
• Successfully implemented cash flow improvement measures of about 135.0 billion yen through improvements in working capital
such as reduction of inventories, asset sales and deferral of capital investment.
• Achieved a D/E ratio of 1 or less, which was the top priority. (excluding early procurement of borrowings 186.2 billion yen)
■ FY2021 Forecast
• Continues to carefully select new capital investments and investments and loans.
• Strengthens monitoring of cash flow plans with the newly established Business Portfolio Management Committee.
• Strives to rebuild the financial base with the aim of achieving a D/E ratio of approx. 0.8.

P33
3.Reference Information

P34
(Billions of yen)
FY2020 Change
Announced in February
①
Announced in April
②
Actual③
③-② ③-①
Net Sales 1,690.0 1,700.0 1,705.5 5.5 15.5
Operating Income (Loss) 10.0 23.0 30.3 7.3 20.3
Ordinary Income (Loss) (10.0) 6.0 16.1 10.1 26.1
Net Income (Loss) Attributable to Owners of the Parent
0.0 7.0 23.2 16.2 23.2
Consolidated Earnings Summary of FY2020(Announced in April → Actual)
■Changes from Timely Disclosure as of April 5【Ordinary Income (Loss)】・ Profits improved centered on materials businesses due to cost reductions and
recovery in demand【Net Income (Loss) Attributable to Owners of the Parent】・ Net income increased due to an increase in deferred tax assets

P35Earnings Summary of FY 2020 by Segment(Announced in February → Actual)
(Billions of yen)
FY2020
Announced in February Actual Change
②-①① ②
Steel &Aluminum
690.0 696.3 6.3
AdvancedMaterials
230.0 238.1 8.1
Welding 68.0 70.0 2.0
Machinery 179.0 175.3 (3.7)
Engineering 136.0 136.1 0.1
ConstructionMachinery
330.0 333.1 3.1
Electric Power 74.0 80.4 6.4
OtherBusinesses
26.0 27.8 1.8
Adjustment (43.0) (51.7) (8.7)
Total 1,690.0 1,705.5 15.5
(Billions of yen)
FY2020
Announced in February Actual Change
④-③③ ④
Steel &Aluminum
(32.0) (22.6) 9.4
AdvancedMaterials
(13.5) (12.1) 1.4
Welding 1.0 1.7 0.7
Machinery 10.0 11.4 1.4
Engineering 2.0 4.4 2.4
ConstructionMachinery
8.0 12.7 4.7
Electric Power 16.0 20.6 4.6
OtherBusinesses
2.0 4.2 2.2
Adjustment (3.5) (4.3) (0.8)
Total (10.0) 16.1 26.1
【Net Sales】 【Ordinary Income (Loss)】
・ Profit improvement in materials businesses due to cost reductions and recovery in demand・ Response to a temporary demand rise due to a shortage of power supply・ Risks avoided, including a shortage of semiconductors

P36FY2020 Analysis of Ordinary Income (Loss)(Announced in February → Actual)
(Billions of yen)
※Inventory valuation includes effect from the average method and the lower of cost or market method.
20.0 33.0 33.0
20.0
25.0 25.0
0.0
20.0
40.0
60.0
Beginning
of FY2020
Announced
in February
Actual
Profit improvement in the materials businesses
Emergency profit improvement
40.0
58.0 58.0

P37Data
FY2019 FY2020
1H 2H Full Year 1H 2H Full Year
Domestic crude steel production
(Millions of tons) 50.66 47.76 98.43 37.09 45.70 82.79
Domestic inventory level (Millions of tons) 5.94 5.79 5.79 5.16 5.07
Inventory level of threetypes of steel sheets
(Millions of tons) 4.44 4.39 4.39 3.67 3.52
Domestic auto production (Millions of cars) 4.82 4.67 9.49 3.35 4.59 79.4
0
50
100
150
200
250
300
FY16/1
Q
2Q
3Q
4Q
FY17/1
Q
2Q
3Q
4Q
FY18/2
Q
2Q
3Q
4Q
FY19/1
Q
2Q
3Q
4Q
FY20/3
Q
2Q
3Q
4Q
FY21/1
Q
Iron ore (fines) Hard coking coal
About 122
(4Q)
About 155 (1Q)
($/ton)
60
65
70
75
80
85
90
95
FY16/1
Q
2Q
3Q
4Q
FY17/1
Q
2Q
3Q
4Q
FY18/1
Q
2Q
3Q
4Q
FY19/1
Q
2Q
3Q
4Q
FY20/1
Q
2Q
3Q
4Q
Steel Prices
86.5(4Q)
(Thousand of yen/ton)
End of March advance figure
End of March advance figure

P38
FY2019 Actual FY2020 Actual FY2021 Forecast
1H 2HFull Year
1H 2HFull Year
1H 2H Full Year
Crude steel production ※ (Millions of tons) 3.39 3.11 6.50 2.48 3.33 5.81 approx.3.30 approx.3.30 approx.6.60
Sales volume of steel products
(Millions of tons) 2.73 2.57 5.30 2.04 2.69 4.73 approx.2.70 approx.2.70 approx.5.40
(Domestic) 2.00 1.93 3.93 1.43 2.01 3.44
(Exports) 0.73 0.64 1.37 0.61 0.68 1.29
Average steel selling price (Thousands of yen/ton) 86.7 87.1 86.9 79.1 84.7 82.3
Export ratio(value basis)
25.4% 23.4% 24.4% 25.0% 23.1% 23.9%
Aluminum rolled products (Thousands of tons) 152 147 299 152 153 305 approx.180 approx.170 approx.350
(Domestic) 122 115 237 121 114 236
(Exports) 30 32 62 30 38 69
Aluminum extrusions (Thousands of tons) 17 17 34 12 18 31 approx.19 approx.19 approx.38
(Domestic) 16 16 33 12 17 29
(Exports) 1 1 1 0 1 1
Copper rolled products (Thousands of tons) 26 27 53 19 30 48 approx.29 approx.29 approx.58
Copper tubes (Thousands of tons) 44 38 82 32 35 67 approx.36 approx.36 approx.72
Welding materials (Thousands of tons) 148 140 288 120 121 242 approx.120 approx.130 approx.250
(Domestic) 65 60 125 49 51 100
(Overseas) 83 80 163 71 70 142
Data
※Including production volume of electric furnaces at Takasago Works

P39Data
Aluminum rolled products (Billions of yen)
FY2019 Actual FY2020 Actual
1H 2H Full Year 1H 3Q 4Q 2H Full Year
Average method (0.5) (1.5) (2.0) (1.5) (0.5) (0.5) (1.0) (2.5)
Lower-of-cost-or-market method
0.0 0.0 0.0 0.0 0.0 0.0 0.0 0.0
Inventory Valuation (0.5) (1.5) (2.0) (1.5) (0.5) (0.5) (1.0) (2.5)
Steel products (Billions of yen)
FY2019 Actual FY2020 Actual
1H 2H Full Year 1H 3Q 4Q 2H Full Year
Iron ore 2.5 (0.5) 2.0 0.5 2.0 1.0 3.0 3.5
Coal (1.5) (1.0) (2.5) (1.5) 0.5 0.0 0.5 (1.0)
Carry Over 1.0 (1.5) (0.5) (1.0) 2.5 1.0 3.5 2.5
Average method 0.5 2.0 2.5 0.5 (4.5) (1.5) (6.0) (5.5)
Lower-of-cost-or-market method
(0.5) (2.0) (2.5) (9.0) 10.0 2.0 12.0 3.0
Inventory Valuation 0.0 0.0 0.0 (8.5) 5.5 0.5 6.0 (2.5)

P40Earnings Summary of FY2020 (1st half → 2nd half)
(Billions of yen)
FY2020 Actual Change
1H①
2H②
②-①
Steel &Aluminum
(41.8) 19.2 (22.6) 61.1
AdvancedMaterials
(10.9) (1.2) (12.1) 9.7
Welding 0.6 1.1 1.7 0.4
Machinery 4.1 7.3 11.4 3.1
Engineering (0.6) 5.1 4.4 5.7
ConstructionMachinery
4.7 8.0 12.7 3.2
Electric Power 8.1 12.4 20.6 4.2
OtherBusinesses
0.7 3.5 4.2 2.8
Adjustment (0.1) (4.1) (4.3) (3.9)
Total (35.2) 51.4 16.1 86.7
【Ordinary Income (Loss)】

P41Analysis of Ordinary Income (Loss) in Steel & Aluminum Segment 【Steel products】
57.5
(Billions of yen)
FY2020 Actual
1H 2H Full Year
Steel products (40.4) 17.1 (23.3)
(Billions of yen)
【Ordinary Income (Loss)】
※Inventory valuation includes effect from the average method and the lower of cost or market method.

P42Analysis of Ordinary Income (Loss) in Steel & Aluminum Segment 【Aluminum rolled products】
3.4
(Billions of yen)
FY2020 Actual
1H 2H Full Year
Aluminum rolled products (1.4) 2.0 0.6
(Billions of yen)
【Ordinary Income (Loss)】
※Inventory valuation includes effect from the average method and the lower of cost or market method.

P43Analysis of Ordinary Income (Loss) in Advanced Materials Segment
9.7
(Billions of yen)
FY2020 Actual
1H 2H Full Year
(10.9) (1.2) (12.1)
(Billions of yen)
【Ordinary Income (Loss)】
※Inventory valuation includes effect from the average method and the lower of cost or market method.

P44Free Cash Flow & Capital Investment
(Billions of yen)
FY2019Actual
FY2020Actual
FY2021Forecast
Change
① ② ③ ②‐① ③‐②
Cash Flows from Operating Activities 21.4 210.0 140.0 188.6 (70.0)
Cash Flows from Investing Activities (133.4) (81.9) (140.0) 51.5 (58.1)
Free Cash Flow(excluding project financing)
(112.0) 128.1 0.0 240.2 (128.1)
Free Cash Flow(including project financing)
(191.9) 52.9 (65.0) 244.8 (117.9)
Cash and Deposits(excluding project financing)
134.9 301.8 115.0 166.9 (186.8)
(Billions of yen)
FY2019Actual
FY2020Actual
FY2021Forecast
Change
① ② ③ ②‐① ③‐②
Capital Investment (accrual basis) 239.8 185.0 150.0 (54.7) (35.0)
Capital Investment (payment basis) 245.3 173.2 180.0 (72.1) 6.8
Depreciation 105.3 100.8 105.0 (4.4) 4.2

P45Financial Indices
FY2018Actual
FY2019Actual
FY2020Actual
FY2021Forecast
Net Income (Loss) per Share 99.20 yen (187.55 yen) 64.05 yen 68.92 yen
Outside Debt760.3 billion
yen906.6 billion
yen987.8 billion
yen860.0 billion
yen
Outside Debt Excluding Debtfrom IPP project financing
724.2 billion yen
784.4 billion yen
785.7 billion yen
600.0 billion yen
D/E Ratio 0.98 times 1.19 times 1.11 timesApprox.
0.8 times
ROS 1.8% (0.4%) 0.9% 2.4%
ROA 1.5% (0.3%) 0.6% 1.7%
ROE 4.8% (9.7%) 3.4% 3.5%
ROIC 2.8% 0.9% 1.1% 2.6%
※1: D/E ratio: Debt (excluding IPP project finance) / Stockholders’ Equity※2: Includes early procurement of borrowings for FY2019 (92.1 billion yen)
D/E Ratio 0.85 times (excluding early procurement of borrowings)※3: Includes early procurement of borrowings for FY 2020 (62.1 billion yen)
D/E Ratio 1.10 times (excluding early procurement of borrowings)※4: Includes early procurement of borrowings for FY 2021 (186.2 billion yen)
D/E Ratio 0.84 times (excluding early procurement of borrowings)※5: ROS: Ordinary Income / Net Sales※6: ROA: Ordinary Income / Total Assets※7: ROE: Net Income Attributable to Owners of the Parent / Stockholders’ Equity※8: ROIC: After-tax operating Income / Invested Capital
※1 ※2 ※3 ※4
※6
※7
※5
※8

P46The Kobe Steel Group’s Corporate Philosophy

P47
Cautionary Statement
• Certain statements in this presentation contain forward-looking statements concerning forecasts, assertions, prospects, intentions and strategies. The decisions and assumptions leading to these statements were based on information currently available to Kobe Steel. Due to possible changes in decisions and assumptions, future business operation, and internal and external conditions, actual results may differ materially from the projected forward-looking statements. Kobe Steel is not obligated to revise the forward-looking contents of this presentation.
• Uncertain and variable factors include, but are not limited to: – Changes in economic outlook, demand and market conditions
– Political situation and trade and other regulations
– Changes in currency exchange rates
– Availability and market conditions of raw materials
– Products and services of competing companies, pricing policy, alliances, and business development including M&As
– Strategy changes of alliance partners