Financial Results for FY2009 · (¥Bil.) ※Real net business income = Net business income +...
68
May 27, 2010 Financial Results Financial Results for FY2009 for FY2009 Customer first policy First-rate bank in the region
Transcript of Financial Results for FY2009 · (¥Bil.) ※Real net business income = Net business income +...

May 27, 2010
Financial ResultsFinancial Resultsfor FY2009for FY2009
Customer first policy First-rate bank in the region

1
Table of Contents
Foreword 2
Summary of Financial Results (1) 4
Summary of Financial Results (2) 5
Net Interest Income (1) 6
Net Interest Income (2) 7
Net Interest Income (3) 8
Fees and Commissions Income 9
Gains/Losses related to Securities 10
Expenses 11
Credit Costs (1) 12
Credit Costs (2) 13
Loan Portfolio 14
Earnings Projections for FY2010 15
■ Chapter 1 - Summary of Financial Results
■ Chapter 2 - Progress in the MediumTerm Management Plan “1st 1st”
Changes in Business Environment 17
Sphere of “Wider Chiba” as a growth market 18
Branch Network Strategy I 19
Branch Network Strategy II 20
Strengthen the financial Intermediation functions
and provide high-quality financial services
Corporate 21
Personal I 22
Personal II 23
Personal III 24
Brokerage Business I 25
Brokerage Business II 26
Establish Robust Management Structure I 27
Establish Robust Management Structure II 28
Capital Policy 29
■ Appendix

2
75.2 77.2
83.9
62.2
81.8
50
60
70
80
90
FY05 FY06 FY07 FY08 FY09
46.750.1
44.6
11.3
36.2
0
20
40
60
FY05 FY06 FY07 FY08 FY09
■ In FY2009, Chiba Bank achieved a V-shaped recovery
in real net business income at ¥81.8 billion (an increase
of ¥19.5 billion, 31.4% up from the previous fiscal year),
mainly due to a decrease in losses related to bonds.
■ Because of a reduction in bankruptcy cases, net credit
costs decreased to ¥19.4 billion, down by ¥17.7 billion,
(47.7%) from the previous fiscal year.
■ As a result, net income jumped ¥24.8 billion to ¥36.2
billion, 219.8% up from the previous fiscal year.
■ Today, we would like to give an outline of our results for
FY2009 and our future strategies based on the medium
term management plan “1st 1st - DOUBLE FIRST”, which
started from April 2009.
Foreword
Real Net Business Income (NonReal Net Business Income (Non--consolidated)consolidated)
(¥Bil.)
※Real net business income = Net business income + Net transfer to general allowance for loan losses
Net Income (NonNet Income (Non--consolidated)consolidated)
(¥Bil.)
(2.1)
2.0 3.6
37.2
19.4
(10)
0
10
20
30
40
FY05 FY06 FY07 FY08 FY09
Net Credit Costs (NonNet Credit Costs (Non--consolidated)consolidated)
(¥Bil.)

Summary of Financial Result
■ Chapter 2 – Progress in the Medium TermManagement Plan “1st 1st”
■ Appendix
■ Chapter 1 - Summary of Financial Results

4
<\Bil.> FY08 FY09
Change
Gross Business Profit (1) 142.1 162.1 20.0
Net Interest Income 146.6 143.3 (3.3)
15.3 14.1 (1.2)
Trading Income 4.7 3.0 (1.7)
(24.6) 1.6 26.3
(2) (28.4) (0.9) 27.4
Expenses (3) 79.9 80.3 0.4
Personnel Expenses 38.7 40.3 1.5
Non-Personnel Expenses 36.9 35.9 (0.9)
Real Net Business Income (1)-(3) 62.2 81.8 19.5
Core Net Business Income (1)-(2)-(3) 90.7 82.8 (7.8)
Gains/Lossesrelated to Bonds
Profit from other businesstransactions
Net Fees andCommissions Income
■ Real Net Business Income jumped up, due to a decrease in losses related to bonds
Summary of Financial Results (1)
Net Interest Incom
eN
et Interest Income
Net Fees and C
omm
issions Income
Net Fees and C
omm
issions Income
<\Bil.> FY09
ChangeNet Interest Income 143.3 (3.3)
Domestic 139.6 (2.5)Loans & Deposits 125.5 (2.8)
Loans 137.3 (9.7)Deposits 11.7 (6.9)
Securities 16.0 0.0International 3.6 (0.7)
<\Bil.> FY09
ChangeNet Fees & Commissions Income 14.1 (1.2)
Income 31.3 (0.5)
8.0 0.1Investment trusts 3.9 (0.0)Personal Annuities 4.0 0.1
0.9 (0.4)Expenses 17.2 0.7
10.2 0.6Fees paid related toloans
Investment trusts &Personal Annuities
Fees from investmentbanking *
¥1.7 Bil of losses on cancellation of alternative investments and investment trusts have been deducted from interest income
*Fees related to private offering of bonds, syndicated loans, M&A, CLO etc.
Trading Income
Trading Income
<\Bil.> FY09
Change
Trading Income 3.0 (1.7)Income from CP 1.2 (1.9)
CP spread narrowed (0.91%→0.34%)

5
<\Bil.> FY08 FY09
Change
Real Net Business Income 62.2 81.8 19.5
(4) 7.5 0.6 (6.8)
Net Business Income 54.7 81.1 26.4
Non-recurrent income/losses (48.1) (27.7) 20.4
(5) 35.0 25.7 (9.3)
Gains/losses related to stocks (6) (14.5) (1.1) 13.4
Ordinary Profit 6.5 53.4 46.9
Extraordinary Income/losses 4.9 6.4 1.4
Recov eries of written-of f claims (7) 5.3 6.9 1.6
Net Income 11.3 36.2 24.8
Gains/losses related to securities (2)+(6) (43.0) (2.1) 40.8
Net Credit Costs (4)+(5)-(7) 37.2 19.4 (17.7)
Consolidated Net Income 12.3 37.5 25.1
Dif f erence (Consoli - Non-consoli) 1.0 1.3 0.2
Net Transfer to generalallow ance for loan losses
Disposal of non-perf orming loans
■ Net Income increased approximately threefold, as a result of a drastic improvementin losses related to securities as well as net credit costs
Summary of Financial Results (2)
Net C
redit Costs
Net C
redit Costs
13.9
21.115.9
9.7
0
10
20
1H08 2H08 1H09 2H09
Disposals of N
PLs
Results by half
(¥Bil.)
<\Bil.> FY09
Change
0.6 (6.8)Disposal of NPLs 25.7 (9.3)
New Downgrades 24.1 (9.5)
Decrease in collateral value 3.4 (1.1)Upgrades & repayments (1.7) 1.3
Credit Costs 26.4 (16.1)
6.9 1.6Net Credit Costs 19.4 (17.7)
Net transfer to generalallowance for loan losses
Recoveries of written-off claims
Gains/Losses related to S
tocksG
ains/Losses related to Stocks
<\Bil.> FY09
Change
(1.1) 13.4Gains on stocks sold 1.9 1.6Losses on stocks sold 2.7 2.6Write-of f s on stocks 0.3 (14.4)
Gains/Losses related to stocks
Stock balance reduction ¥13.1 Bil.
09/1109/11ProjectionProjection
48.048.0
32.032.0
33.033.0

6
Net Interest Income (1)
■ Volume of loans and deposits increased steadily, while spread narrowed due to rate cuts by BOJ
Increase/Decrease factors in Interest IncomeIncrease/Decrease factors in Interest Income
FY08 FY09 FY10
146.6146.6
143.3143.3
3.93.9
6.86.8
0.60.6
Volumefactor
Yieldfactor
Domestic Loans and deposits
Dom
estic Securities
Other dom
estic factorsand International
--2.82.8
Domestic Loans and DepositsDomestic Loans and Deposits (average balance)(average balance)
(Projection)
6,502.9
6,863.47,072.4
7,274.4
5,000
6,000
7,000
FY07 FY08 FY09 FY10
8,034.68,250.7
8,462.7 8,632.3
6,000
7,000
8,000
9,000
FY07 FY08 FY09 FY10
(Projection)
(¥¥Bil)
(¥Bil.)
++3.0%3.0%
++2.5%2.5%
LoansLoans
DepositsDeposits
Average yield on domestic loans and depositsAverage yield on domestic loans and deposits
2.17 2.14
1.941.85
0.220.230.13
0.080.8
1.2
1.6
2.0
2.4
FY07 FY08 FY09 FY10
0.0
0.4
0.8
1.2(%)
(%)
1.77%
Loan yield
Deposit yield※
1.92%
1.81%
(Projection)※ Excluding NCD
--0.110.11ptspts
Policy rate was cut by 0.4% during the second half of FY08
0.00.0
1.94%
145.0145.0
(Projection)
Including ¥¥1.7bil.1.7bil. of losses on cancellation of
alternative investments, etc.
--0.040.04ptspts
(Unit:¥¥Bil)

7
'09/3 '10/3
Change
(%)
Domestic Loans 6,945.3 7,115.8 170.4 2.4%
ex. Public sector 6,690.6 6,835.9 145.2 2.1%
Corporate 4,313.6 4,285.3 (28.2) (0.6%)
Large Corp. 1,289.7 1,250.9 (38.8) (3.0%)
SMEs 3,023.8 3,034.4 10.6 0.3%
Consumer Loans 2,377.0 2,550.5 173.5 7.2%
Housing Loans 2,267.5 2,444.9 177.3 7.8%
Public sector 254.6 279.9 25.2 9.9%
MOF - 49.9 49.9 -
Domestic Loans 6,945.3 7,115.8 170.4 2.4%
Branches in Chiba 5,381.1 5,457.8 76.6 1.4%
Branches outside Chiba 1,564.1 1,657.9 93.8 5.9%
1,153.4 1,172.9 19.5 1.6%
410.7 485.0 74.2 18.0%
Wholesale Branches(special branches)
Retail Branches(ex. special branches)
Net Interest Income (2)
■ Placement of new housing loans was the highest ever level in the Bank’s history
Breakdown of increase in LoansBreakdown of increase in Loans
New Housing LoansNew Housing Loans
133.3 146.9 133.6 139.2182.1
156.0178.4 187.8 186.0
153.1
196.7191.2
289.4
325.4 321.5 325.2
378.8
344.4
0
100
200
300
400
FY04 FY05 FY06 FY07 FY08 FY09
(¥Bil)
3,023.83,026.0
3,034.4
3,000
3,010
3,020
3,030
3,040
'09/3 '09/9 '10/3
(¥Bil)
22HH
11HH
Highest level in Highest level in BankBank’’s historys history
Loan Balance for Loan Balance for SMEsSMEs
*Tokyo Head Office, Shinjuku branch and Osaka branch
*
8
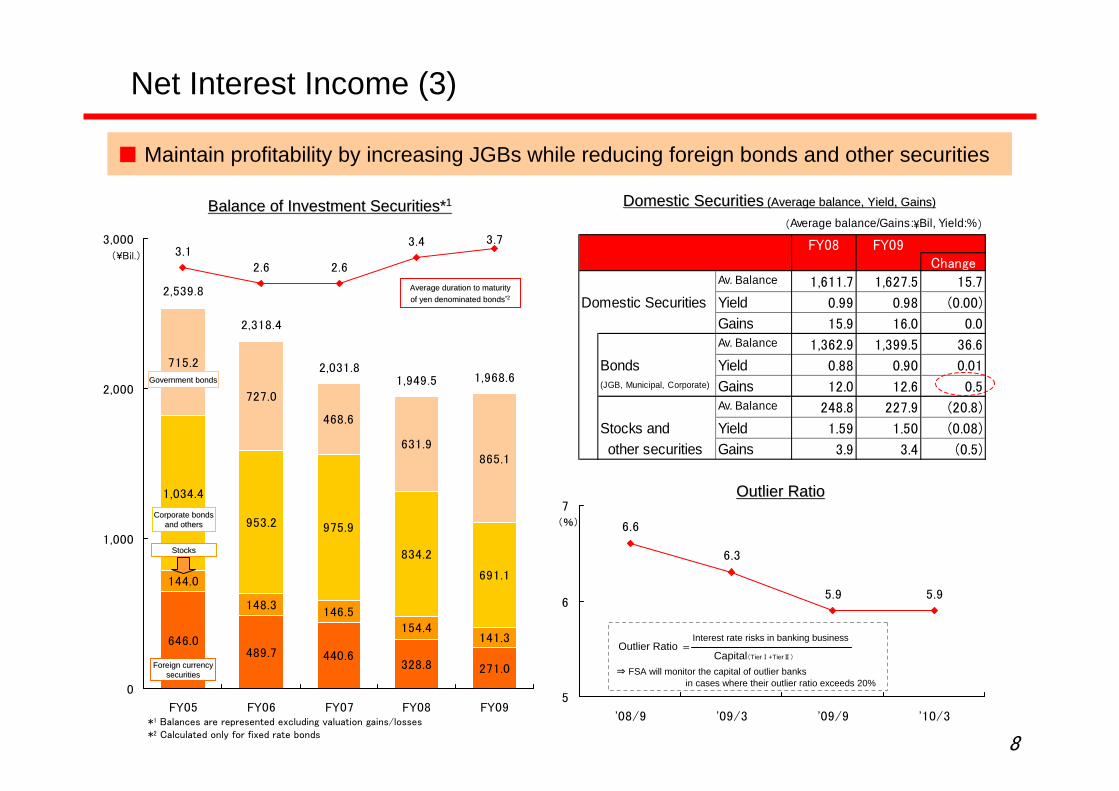
Net Interest Income (3)
■ Maintain profitability by increasing JGBs while reducing foreign bonds and other securities
646.0489.7 440.6
328.8 271.0
144.0
148.3146.5
154.4141.3
1,034.4
953.2 975.9
834.2
691.1
715.2
727.0
468.6
631.9865.1
2,539.8
2,318.4
2,031.81,949.5 1,968.6
3.12.6 2.6
3.4 3.7
0
1,000
2,000
3,000
FY05 FY06 FY07 FY08 FY09
Balance of Investment Securities*Balance of Investment Securities*11
Government bondsGovernment bonds
StocksStocks
Foreign currency Foreign currency securitiessecurities
Corporate bonds Corporate bonds and othersand others
*1 Balances are represented excluding valuation gains/losses*2 Calculated only for fixed rate bonds
(¥Bil.)
Domestic SecuritiesDomestic Securities (Average balance, Yield, Gains)(Average balance, Yield, Gains)
Average duration to maturityAverage duration to maturityof yen denominated bondsof yen denominated bonds*2*2
(Average balance/Gains:\Bil, Yield:%)
FY08 FY09Change
Av. Balance 1,611.7 1,627.5 15.7
Domestic Securities Yield 0.99 0.98 (0.00)
Gains 15.9 16.0 0.0Av. Balance 1,362.9 1,399.5 36.6
Bonds Yield 0.88 0.90 0.01(JGB, Municipal, Corporate) Gains 12.0 12.6 0.5
Av. Balance 248.8 227.9 (20.8)
Stocks and Yield 1.59 1.50 (0.08)
other securities Gains 3.9 3.4 (0.5)
Outlier RatioOutlier Ratio
6.6
6.3
5.9 5.9
5
6
7
'08/9 '09/3 '09/9 '10/3
(%)
Outlier Ratio ==Interest rate risks in banking business
Capital(TierⅠ+TierⅡ)
⇒ FSA will monitor the capital of outlier banksin cases where their outlier ratio exceeds 20%

9
Fees and Commissions Income
■ Sales of Investment type financial products steadily recovered; aiming at further profit increase
9.0
6.3 6.77.3 7.5 7.5
17.2
14.615.3
16.0
(8.2) (8.2) (8.5) (8.6)(10)
(5)
0
5
10
15
20
1H08 2H08 1H09 2H09 1H10 2H10
51.731.4
48.870.0
53.9
21.4
38.0
75.0
70.074.9
75.048.8
105.7
52.8
86.9
123.8
145.0 145.0
0
50
100
150
1H08 2H08 1H09 2H09 1H10 2H10
Sales of Investment type financial products (HalfSales of Investment type financial products (Half--yearly basis)yearly basis)
(¥Bil.)
Fees and commissions (HalfFees and commissions (Half--yearly basis)yearly basis)
(¥Bil.)
10.520.8 22.8 25.9
36.7 38.29.5
11.816.8
22.126.6
21.2
0
20
40
60
3Q08 4Q08 1Q09 2Q09 3Q09 4Q09
(¥Bil.)
Sales of Investment type financial products (Quarterly basis) Sales of Investment type financial products (Quarterly basis)
Sales ofSales ofstock fundsstock funds
Sales ofSales ofpersonal annuitiespersonal annuities
Sales of Sales of stock fundsstock funds
Sales of Sales of personal annuitiespersonal annuities
ProfitProfit
IncomeIncome
ExpensesExpenses
(Projection)
(Projection)
FY08FY08¥15.3 15.3 BilBil
FY09FY09¥14.1 14.1 BilBil
FY10(FY10(projproj.).)¥15.0 15.0 BilBil
(Projection)
(Projection)
Original ProjectionOriginal Projection120.0120.0
10
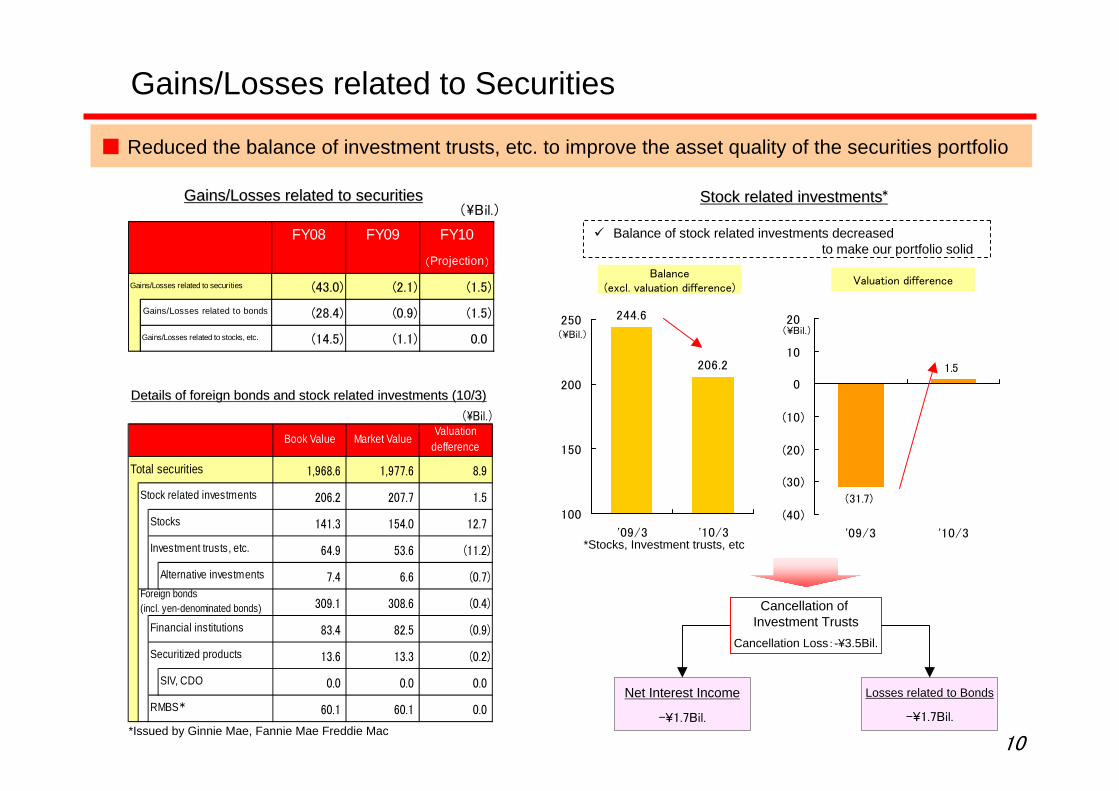
Gains/Losses related to Securities
■ Reduced the balance of investment trusts, etc. to improve the asset quality of the securities portfolio
244.6
206.2
100
150
200
250
'09/3 '10/3
1.5
(31.7)
(40)
(30)
(20)
(10)
0
10
20
'09/3 '10/3
Balance(excl. valuation difference)
Valuation difference
*Stocks, Investment trusts, etc
(¥Bil.)(¥Bil.)
Stock related investmentsStock related investments**
Balance of stock related investments decreasedto make our portfolio solid
Net Interest Income
-¥1.7Bil.
Cancellation of Investment Trusts
Cancellation Loss:-¥3.5Bil.
Losses related to Bonds
-¥1.7Bil.
Gains/Losses related to securitiesGains/Losses related to securities
Details of foreign bonds and stock related investments (10/3)Details of foreign bonds and stock related investments (10/3)(\Bil.)
Book Value Market Value Valuationdefference
Total securities 1,968.6 1,977.6 8.9
Stock related investments 206.2 207.7 1.5
Stocks 141.3 154.0 12.7
Investment trusts, etc. 64.9 53.6 (11.2)
Alternative investments 7.4 6.6 (0.7)
309.1 308.6 (0.4)
Financial institutions 83.4 82.5 (0.9)
Securitized products 13.6 13.3 (0.2)
SIV, CDO 0.0 0.0 0.0
RMBS 60.1 60.1 0.0
Foreign bonds(incl. yen-denominated bonds)
*Issued by Ginnie Mae, Fannie Mae Freddie Mac
*
(\Bil.)
FY08 FY09 FY10
(Projection)
(43.0) (2.1) (1.5)
Gains/Losses related to bonds (28.4) (0.9) (1.5)
Gains/Losses related to stocks, etc. (14.5) (1.1) 0.0
Gains/Losses related to securities
11
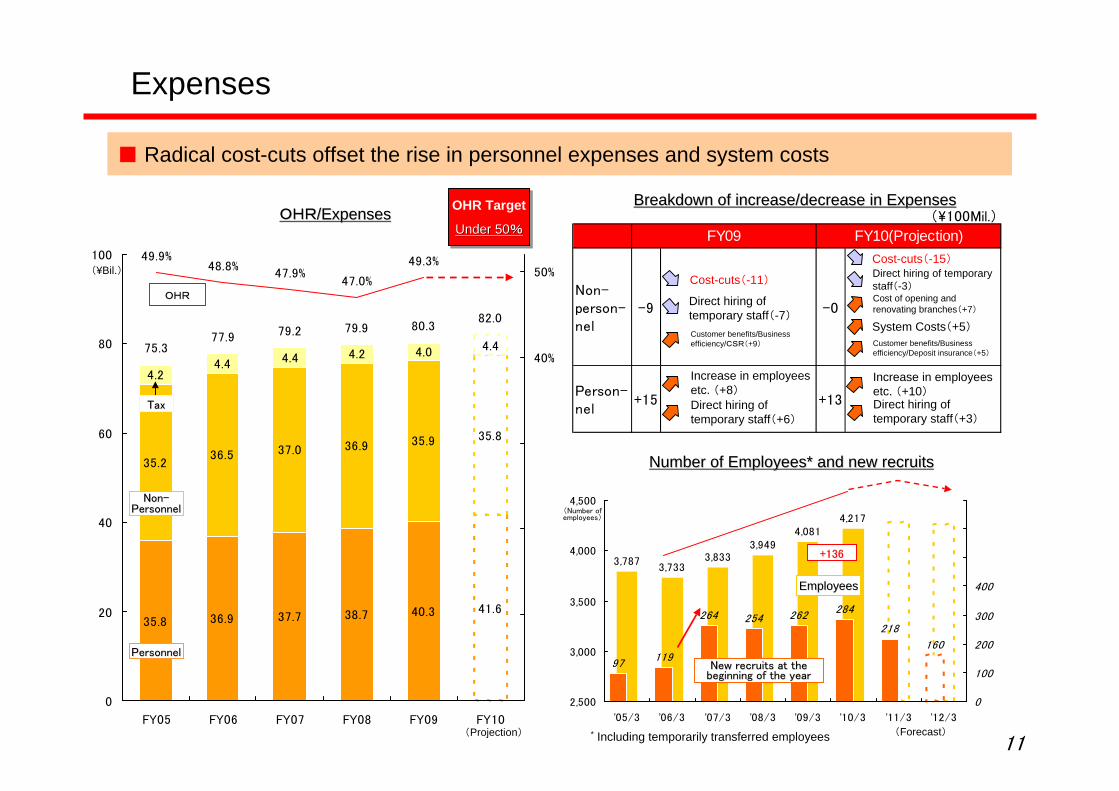
(\100Mil.)
FY09 FY10(Projection)
Non-person-nel
-9 -0
Person-nel
+15 +13
3,7873,733
3,8333,949
4,0814,217
97119
264 254 262284
218
160
2,500
3,000
3,500
4,000
4,500
'05/3 '06/3 '07/3 '08/3 '09/3 '10/3 '11/3 '12/3
0
100
200
300
400
500
600
700
35.8 36.9 37.7 38.7 40.3 41.6
35.236.5 37.0 36.9 35.9 35.8
4.24.4 4.4 4.2 4.0 4.4
49.9%48.8%
47.9%47.0%
49.3%
75.377.9 79.2 79.9 80.3
82.0
0
20
40
60
80
100
FY05 FY06 FY07 FY08 FY09 FY10
0%
10%
20%
30%
40%
50%
Expenses
■ Radical cost-cuts offset the rise in personnel expenses and system costs
OHROHR//ExpensesExpenses
OHROHR
(¥Bil.)
(Projection)
(Number of employees)
Number of Employees* and new recruitsNumber of Employees* and new recruits
+136+136
* Including temporarily transferred employees
NonNon--PersonnelPersonnel
PersonnelPersonnel
EmployeesEmployees
New recruits at the New recruits at the beginning of the yearbeginning of the year
Breakdown of increase/decrease in ExpensesBreakdown of increase/decrease in Expenses
Increase in employees etc. (+8)
Direct hiring of temporary staff(+6)
Cost-cuts(-11)
Direct hiring of temporary staff(-7)
Customer benefits/Business efficiency/CSR(+9)
Increase in employees etc. (+10)
Cost-cuts(-15)
System Costs(+5)
Cost of opening and renovating branches(+7)
Customer benefits/Business efficiency/Deposit insurance(+5)
OHR Target
Under 50%
OHR Target
Under 50Under 50%%
Direct hiring of temporary staff(+3)
Direct hiring of temporary staff(-3)
TaxTax
(Forecast)

12
Credit Costs (1)■ Disposal of non-performing loans show a decreasing trend;
conservatively projecting annual forecastNet Credit CostsNet Credit Costs
7.5
(1.0)
0.6
(1.3)(8.7)
2.0
37.2
19.4
17.0
3.6
(10)
0
10
20
30
40
FY06 FY07 FY08 FY09 FY10
Net Credit Net Credit CostsCosts
Net transfer to/from general allowance
for loan losses*
* Transfer from general allowance for loan losses was included in reversal of allowance for loan losses in extraordinary income for FY06 and FY07
33bpbp
55bpbp
Net credit cost ratioNet credit cost ratio((vs. Termvs. Term--end balanceend balance))
5353bpbp
2323bpbp2727bpbp
Breakdown of Net Credit CostsBreakdown of Net Credit Costs
(¥Bil.)
(Forecast)
13.9
21.1
15.9
9.711.0 11.0
15.018.6
15.4
8.6 9.5 9.5
0
5
10
15
20
1H08 2H08 1H09 2H09 1H10 2H10
Disposal of NPL (HalfDisposal of NPL (Half--yearly basis)yearly basis)
(¥Bil.)
Disposal of NPLDisposal of NPL
New DowngradeNew Downgrade
(Forecast) (Forecast)
6.3
3.4
5.43.2
0
3
6
3Q 4Q
Improvement from Target
--8.08.0
(\Bil.)
FY09 FY10(Forecast)
1H 2H 1H 2H
(1) 5.2 (4.5) (0.5) (0.5)
Disposal of NPL (2) 15.9 9.7 11.0 11.0
New Dow ngrades 15.4 8.6 9.5 9.5Decreases in collateralv alue 1.8 1.6 2.0 2.0
Credit Costs (1)+(2) 21.1 5.2 10.5 10.5
26.4 21.0
(3) 4.3 2.6 2.0 2.0
Net Credit Costs (1)+(2)-(3) 16.8 2.6 8.5 8.5
19.4 17.0
Net transfer to/from generalallowance for loan losses
Recoveries of written-off claims

13
Credit Costs (2)
■ Losses from the real estate sector quickly diminished as the balance decreased
Breakdown of loans to real estate sectorBreakdown of loans to real estate sector
Disposal of real estate sector NPLDisposal of real estate sector NPL((Quarterly basisQuarterly basis))
2.75.0
8.411.1 10.9
8.31.3
0.8
5.4
10.0
5.0
1.4
4.1
13.9
21.1
15.9
9.7
5.8
0
5
10
15
20
1H07 2H07 1H08 2H08 1H09 2H09
5.0 3.2
1.2
0.1
6.33.4
3Q 4Q
Real Estate TradingReal Estate Trading
Other than Other than Real Estate TradingReal Estate Trading
(¥Bil)
(\Bil.)
'08/3 '09/3 '10/3 Disposalof NPLs
(1) (2) (3) (3)-(1) (3)-(2) (%) (FY08, FY09)
Domestic loans 6,629.9 6,945.3 7,115.8 485.9 170.4 100.00% 60.8
Real estate 1,470.4 1,442.6 1,456.6 (13.8) 13.9 20.47% 23.2
1,101.0 1,142.4 1,216.4 115.4 73.9 17.10% 1.3
369.3 300.1 240.1 (129.2) (60.0) 3.37% 21.9
271.5 214.9 169.4 (102.0) (45.5) 2.38% 21.9
94.6 80.5 71.0 (23.6) (9.5) 1.00% 2.4
176.8 134.3 98.3 (78.4) (35.9) 1.38% 19.5
Listed less than 20years and non-listed 116.9 60.2 42.2 (74.6) (17.9) 0.59% 19.5
Public Corporations 97.8 85.2 70.7 (27.1) (14.5) 0.99% -
Headquarteredoutside Chiba
Real estate rental &management
Real estate trading, etc
Real estate trading
Headquartered inChiba (All non-listed)
Decreased by 63.8% (over 2 years)
Breakdown of disposal of NPLBreakdown of disposal of NPLby industrial sector by industrial sector ((FY09FY09))
6.41.6
3.83.43.2
2.62.2 2.1
Wholesale & Wholesale & Retail tradeRetail trade
ConstructionConstructionMedical, welfare Medical, welfare & other services& other services
OthersOthers
Real estate rentalReal estate rental& management& management
TransportationTransportation
ManufacturingManufacturing
Real estate Real estate tradingtrading
Portion of disposal of NPL
2424%%
(¥Bil)
*
*Total amount of disposal of NPL (including other assets)

14
Loan Portfolio
■ Over 50% of the loan portfolio is for “Real Estate rental & management” and “Consumer loans” with low risks
Breakdown of loan portfolio by industrial sector (2010/3Breakdown of loan portfolio by industrial sector (2010/3))
0.98 1.01
0.760.70
0.620.70
0.75
1.06
0.840.75
0.0
0.5
1.0
'01/3 '02/3 '03/3 '04/3 '05/3 '06/3 '07/3 '08/3 '09/3 '10/3
Delinquency Ratio of Housing LoansDelinquency Ratio of Housing Loans
Real estate rental &management 17.10%
Personal (mainly housingloans) 36.05%
Other sectors46.85%
Analysis of Real estate rental & managementAnalysis of Real estate rental & management
Breakdown of loans for real estate rental & management by loan balance(excl. special branches outside Chiba)
Credit cost ratio of main industrial sectors
Less than ¥50M52.5%
Less than ¥100M19.6%
Less than ¥500M
24.7%
Less than ¥1B2.5%
¥1B or above0.7%
10.2% 13.4% 49.1% 15.7% 11.5%
0.11
0.03 0.03(0.06)
(0.2)
0.0
0.2
0.4
0.6
0.8
1H08 2H08 1H09 2H09
ConstructionVarious services
Wholesale/ Retail
Manufacturing
※ “Credit cost in each half”/”Total balance as of the end of each period”
(%)(%)
Real estate rentalReal estate rental& management& management
88.5% of total Balance: Less than ¥1B
Domestic Loans¥7,115.8Bil.
Average Balance per customer:¥14Mil.
※ Loan balances with more than 1day overdue (as of the end of each period)/ Total Balance
Main Target: Wealthy families with a large landbank (landlords)Criteria: Much importance on cash flow & collateral (e.g. Stress-check on interest rate at 5% etc.)
Collateral coverage: approximately 80%
Number of Customers
Balance
15
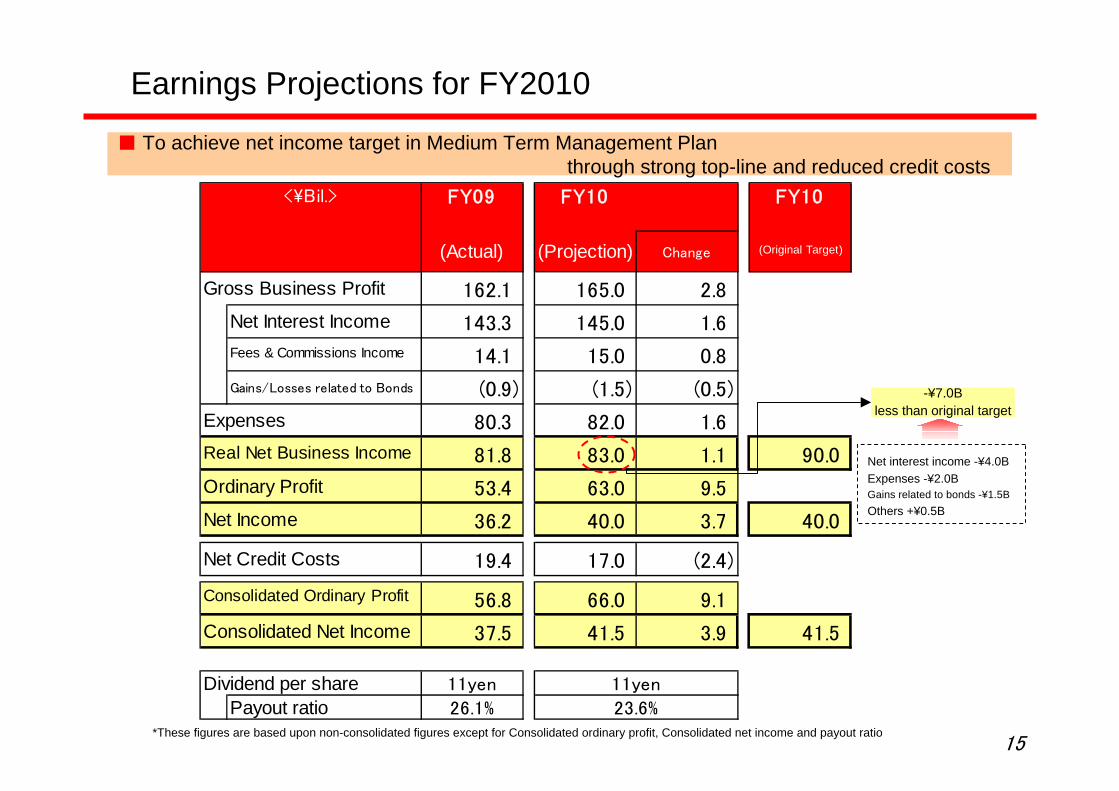
Earnings Projections for FY2010
■ To achieve net income target in Medium Term Management Planthrough strong top-line and reduced credit costs
*These figures are based upon non-consolidated figures except for Consolidated ordinary profit, Consolidated net income and payout ratio
<\Bil.> FY09 FY10 FY10
(Actual) (Projection) Change (Original Target)
Gross Business Profit 162.1 165.0 2.8
Net Interest Income 143.3 145.0 1.6
14.1 15.0 0.8
(0.9) (1.5) (0.5)
Expenses 80.3 82.0 1.6
81.8 83.0 1.1 90.0
Ordinary Profit 53.4 63.0 9.5
Net Income 36.2 40.0 3.7 40.0
Net Credit Costs 19.4 17.0 (2.4)
56.8 66.0 9.1
Consolidated Net Income 37.5 41.5 3.9 41.5
Dividend per share 11yen 11yenPayout ratio 26.1% 23.6%
Fees & Commissions Income
Gains/Losses related to Bonds
Real Net Business Income
Consolidated Ordinary Profit
Net interest income -¥4.0BExpenses -¥2.0BGains related to bonds -¥1.5BOthers +¥0.5B
-¥7.0Bless than original target

Progress in the Medium Term Management
Plan “1st 1st”■ Chapter 1 - Summary of Financial Results
■ Appendix
■ Chapter 2 - Progress in the Medium TermManagement Plan “1st 1st”

17
Changes in Business Environment
■ Business Environment changes in the middle of the Medium Term Management Plan
Medium Term Management Plan
““11stst 11st st ((Double FirstDouble First))””
(April 2009 ~ March 2011)
Various Changes in the Business EnvironmentVarious Changes in the Business Environment
0.0
0.2
0.4
0.6
0.8
1.0
09/1 09/4 09/7 09/10 10/1 10/4
0
200
400
600
08/1 08/7 09/1 09/7 10/1
Interest rates declined gradually through monetary easing
The business environment has eased the private sector’s tight liquidity
Swap rate (5y)(%)
Start of Plan
CDSCDS SpreadSpreadInterest RatesInterest Rates
Start of Plan
TIBOR 3M
Target O/N rate
MarginMargin↓↓Loans to large Loans to large corpcorp,,↓↓
△ 30
△ 20
△ 10
0
10
08/1 08/7 09/1 09/7 10/1
Business Survey Index of SalesBusiness Survey Index of Sales
Up
Dow
n
5,000
10,000
15,000
08/1 08/7 09/1 09/7 10/1
Nikkei 225 IndexNikkei 225 Index
Stock price rose after the Plan started
Sales BSI was tended towards recovery
(JPY)
Start of PlanStart of Plan
Sales of Investment type financial productsSales of Investment type financial products↑↑Loans in ChibaLoans in Chiba↑↑ Credit CostsCredit Costs↓↓
New housing starts recovered in Chiba
Housing loansHousing loans↑↑
8,000
10,000
12,000
14,000
16,000
1-3 4-6 7-9 10-12 1-3 4-6 7-9 10-12 1-3
(Number)
New Housing Starts in Chiba New Housing Starts in Chiba (Quarterly basis)(Quarterly basis)
Start of Plan
08/ 09/ 10/

18
Sphere of “Wider Chiba” as a growth market
■ The sphere of “Wider Chiba” has high potential, supported by a growing population
Chiba PrefectureChiba Prefecture6mil. people6mil. people
2.5mil. households2.5mil. households
Neighboring AreaNeighboring Area6mil. people6mil. people
2.5mil. households2.5mil. households++ ==Sphere of “Wider Chiba”
12mil. people5mil. households
Sphere of Sphere of ““Wider ChibaWider Chiba””
12mil. people12mil. people5mil. households5mil. households
ChibaChiba
■ Newly opened branches (05/4~10/3)
● Existing branches
TokyoTokyo
SaitamaSaitama IbarakiIbaraki
Ken-O do expressway
Narita SkyAccess
Tsukuba Express
Expression of runway B of Narita International Airport
09/10
10/7 Opening
05/8 Opened
07/3 partially opened
Tokyo Bay Aqua Line
(Number)Prefecture Net Inflows
1 Tokyo 56,220
2 Chiba 21,692
3 Kanagawa 21,466
4 Saitama 18,083
5 Aichi 4,075
Ranking No2
Net populationinflows
Ranking Ranking No2No2
Net populationinflows
Population Net Inflow Ranking Population Net Inflow Ranking ((20092009))
“National Athletic Meet”will be held in Chiba
Image Character of the Meet“CHI-BA+KUN”
Image Character of the Meet“CHI-BA+KUN”
Source: Ministry of Internal Affairs and Communications
103.3
102.1
102.9
101.6
102.4
99.7
99
100
101
102
103
104
05/10 06/10 07/10 08/10 09/10
05/10=10005/10=100
Population GrowthPopulation Growthin Chiba and Neighboring Area in Chiba and Neighboring Area Neighboring Neighboring
AreaArea
ChibaChibaSaitamaSaitama**
KanagawaKanagawa
JapanJapan
TokyoTokyo**
Source: Ministry of Internal Affairs and Communications, each prefecture* Excluding “Neighboring Area”
10/9~10

19
Branch Network Strategy I
■ Branch network is expanding aggressively in the sphere of “Wider Chiba”;customer satisfaction and convenience improving through branch-renewals
ChibaChibaChiba
TokyoTokyoTokyo
SaitamaSaitamaSaitama
IbarakiIbarakiIbaraki
Kamisu Branch
Moriya Branch
Funabori Corporate Banking Office
Kasai Branch
Fukagawa Branch
Senju Branch
Chiharadai Branch
Kashiwanoha Campus Branch
Consulting Plaza Kashiwa
Nagareyama Otakanomori Branch
Consulting Plaza Funabashi
New branchesNew branches
Narita Airport Office III
Koshigaya Laketown Branch(Koshigaya Corporate Banking Office ⇒)
Yashio Ekimae Branch
Misato Chuo Branch2011/3 Opening
2011/6 Opening
■ Newly opened branches (05/4-10/3)● Existing branches
■ Renewed branches (05/4~10/3)■ Branches to be opened in the future■ Branches to be renewed in the future
05/3 10/3Change
159 172 13
in Chiba 150 155 5
9 17 8
Tokyo 8 12 4
Ibaraki 0 2 2
Saitama 0 2 2
Osaka 1 1 0
Domestic branches
outside Chiba
Expansion of branch networkExpansion of branch network

20
Branch Network Strategy II
■ 2 branches will be opened in East Saitamaand the branch network expanded alongside the Tsukuba Express to 8 branches
Branch Network alongside Tsukuba Express and in Saitama PrefectuBranch Network alongside Tsukuba Express and in Saitama Prefecturere
Nagareyama-otakanomori
Kashiwanoha-campus
Moriya
Misato-chuo
Yashio
Kita-Senju Branch
Akihabara
Tsukuba ExpressTsukuba Express
JR JR Musashino Musashino LineLine
Koshigaya Laketown Branch
Misato Chuo Branch
Expected population: 22 thousandBig Shopping Center opened
Expected population: 13 thousandNeighboring branch is growing
AEON LaketownAEON Laketown
12.3
20.3
25.1
0
10
20
30
'08/3 '09/3 '10/3
(¥Bil.)
Loan balance of Yashio Ekimae Branch
11/3Opening
11/6Opening
08/3Opened Ibaraki
Chiba
Saitama
Tokyo
06/10
07/5
08/12
07/12
09/3
Koshigaya-Laketown
Minami-Nagareyama
For TsukubaFor Tsukuba
23.5
73.4
106.5
0
50
100
'08/3 '09/3 '10/3
(¥Bil.)
Total Loan Balanceof branches along Tsukuba Express
※Balance after branches openedKashiwanoha Campus, Nagareyama OtakanomoriYashio Ekimae, Moriya, Sejju
SenjuSenju BranchBranch
Yashio Ekimae Yashio Ekimae BranchBranch
Minami Minami Nagareyama Nagareyama BranchBranch
Nagareyama OtakanomoriNagareyama Otakanomori BranchBranch
Kashiwanoha Kashiwanoha Campus BranchCampus Branch
Moriya BranchMoriya Branch
Akihabara BranchAkihabara Branch
05/8Opened

21
Strengthen business with growth sectors by deployingspecialist staff in Business Promotion Division
Strengthen the financial intermediation functions and provide high-quality financial services - Corporate
161.7145.0
3,075
4,087
0
100
200
FY08 FY09
-5,000
-2,500
0
2,500
5,000
Loans to new customersLoans to new customers
■ Strengthening the financial intermediation functionsthrough expansion of loans to new customers and business with growth sectors
(¥Bil.)
* Excluding results of Special branches outside Chiba which mainly target major corporations
AmountAmount
Number of customersNumber of customers
0.5
2.3
0
1
2
3
'09/9 '10/3
(¥Bil.)
Business in growth sectorsBusiness in growth sectors
AgricultureAgriculture MedicalMedicalTourismTourism
Hold various seminars and business matching events
Loans with guarantee of Loans with guarantee of Chiba AgriculturalChiba Agricultural
Credit Fund AssociationCredit Fund Association
Enhance loan products
Started from 09/4
“Chibagin Agri-business seminar”“Chibagin Agri-business seminar”
09/11
“Chiba Tourism matching event”“Chiba Tourism matching event”
09/12
Amount(09/12)
Number 1*
(among All Japanese Banks)
Amount(09/12)
Number 1Number 1**
(among All Japanese Banks)(among All Japanese Banks)
*Excluding JA
Number of customers, Amount*
FukagawaFukagawa BranchBranch((TokyoTokyo))
¥¥11.311.3BilBil..((Ranking Ranking No1No1))
Moriya BranchMoriya Branch((IbarakiIbaraki))
¥¥10.910.9BilBil((Ranking Ranking No2No2))
08/11Opened
(Number of customers)
Achieved the target
Target4,000/year
Target4,000/year4,000/year
08/12Opened
Breakdown of loans to new customers
Number of Amountcustomers (\Bil.)
4,087 161.7
401 42.0 Branches openedafter 05/4
Total (excl. Specialbranches outside Chiba)

22
Strengthen the financial intermediation functions and provide high-quality financial services - Personal I
■ Record amount of new housing loans, mainly from new housing demand
1,892.7
2,022.1
2,124.0
2,267.5
2,444.9
1,000
1,500
2,000
2,500
FY05 FY06 FY07 FY08 FY09
Housing loansHousing loans
(¥Bil)
1.8 12.825.1
37.3
321.5 325.2
344.4
378.8
200
250
300
350
400
FY06 FY07 FY08 FY09
0
20
40
60
New Housing LoansNew Housing Loans
Via new Via new branchesbranches
※ Branches opened after 06/3
FY09 New loansHighest ever level
FY09 New loansFY09 New loansHighest ever levelHighest ever level
(¥Bil.)
(%)
Breakdown of New Housing LoansBreakdown of New Housing Loans((New; SwitchedNew; Switched))
New¥328.7328.7BilBil((86.886.8%)%)
SwitchedSwitched¥¥50.150.1BilBil((13.213.2%)%)
++7.87.8%%

23
Strengthen the financial intermediation functions and provide high-quality financial services - Personal II
■ Meeting housing loan demand by opening new Loan Centers in growing areas
New Loan Center openingsNew Loan Center openings
(%)
CityGrowthratio
1 Inzai 2.702 Shiroi 1.763 Nagareyama 1.554 Kasiwa 1.405 Funabashi 1.40
(number)
WardNumber of
people1 Kouto 10,3702 Adachi 7,2813 Nerima 4,5644 Ota 3,9755 Edogawa 3,681
Hokuso Area around Chiba New Town
Ranking of population growth ratioRanking of population growth ratioin Chiba in Chiba ((08/1008/10→→09/1009/10))
Ranking of population growthRanking of population growthin Tokyo 23 wardsin Tokyo 23 wards((08/1008/10→→09/1009/10))
Eastern Tokyo Area
FukagawaFukagawa BranchBranchAmount in FY09Amount in FY09
¥¥12.312.3BilBil((RankingRankingNoNo22))
Hokuso Loan Center
Tokyo Loan Center
Target
Target
Narita Narita SkyAccessSkyAccess
09/12Opened
09/12OpenedNew housing loans via Loan Centers/PlazasNew housing loans via Loan Centers/Plazas
55.1 57.4 68.897.4
94.3 95.6
111.2
94.9
59.555.9 56.2
63.4
0
50
100
150
200
FY06 FY07 FY08 FY09
0
20
40
60(¥Bil)(%)
New loans via Loan New loans via Loan Centers/PlazasCenters/Plazas
Portion of loans via Loan Portion of loans via Loan Centers/Plazas to total new loansCenters/Plazas to total new loans
11HH
22HH
45 44 42
1933
11 11
13
45
63
75
0
20
40
60
80
100
09/4 09/10 10/4
0
2
4
6
8
10
12
14(staff) (offices)
OfficesOffices
StaffStaff
Staff Staff (C course)*(C course)*
Number of staff and offices of Loan Centers and Loan PlazasNumber of staff and offices of Loan Centers and Loan Plazas
+2
Nearby Inzai Makinohara stationNearby Inzai Makinohara station
10/7
* C Course: Staff mainly in charge of retail business, within defined commutable area
Toyosu Area(Tokyo)Toyosu Area(Tokyo)

24
Population in Sphere
of “Wider Chiba”12 million12 million
Strengthen the financial intermediation functions and provide high-quality financial services - Personal III
■ Strengthening our group synergy to enhance the consulting function
Investment
TrustsInvestm
ent Trusts
Personal AnnuitiesPersonal Annuities
Trust & Inheritance related business
Trust & Inheritance related business
Brokerage business
Brokerage business
Chibagin SecuritiesChibagin Chibagin SecuritiesSecurities
Cooperation
Consu
lting B
usin
ess D
iv.C
onsu
lting B
usin
ess D
iv.C
onsu
lting B
usin
ess D
iv.
Bran
che
sB
ranche
sB
ranche
s
Chiba Bank Group
09/10established
Personal deposit customers:4.28mil4.28mil
Personal securities customers:62,00062,000
11/1Name changed from “Chuo
Securities”
Investment typefinancial products(JPY10M or above)
210,000210,000
Landlords
4,2004,200Company Owners
2,4002,400
*Landlord: Real estate rental & management (Loan balance:JPY50M or above)*Company owner (Revenue:JPY1B or above)
(Share Capital: JPY300M or above)
Customer
Needs
Best
Proposal
Sphere of“Wider Chiba”
14 branches14 branches
98/1098/10PermissionPermission
01/401/4FirstFirst
02/1002/10SecondSecond
05/1205/12ThirdThird
07/1207/12Final Final PermissionPermission
06/606/6Started Started
to handleto handle
98/398/3Acquisition ofAcquisition ofChuo SecuritiesChuo Securities
05/205/2Started Agent BusinessStarted Agent Business
on financial productson financial products((via Chuo Securitiesvia Chuo Securities))
First for Regional banks
Amount as of 10/3¥¥505.7505.7BilBil
(No1No1among regional banks)
WealthManagers
Chief C
onsultants
Sphere of“Wider Chiba”
168 branches168 branches
10/4~Assignment
10/4Assignment

25
0%
500%
1000%
1500%
2000%
2500%
0 5,000 10,000 15,000 20,000
Strengthen the financial intermediation functions and provide high-quality financial services - Brokerage Business I
■ Chuo Securities - strong branch network in the sphere of “Wider Chiba”.Solid capital ratio, self-sufficient profitability
Chuo SecuritiesChuo Securities
History
1883/6 Obuse Securities founded1923/4 Toriumi Securities founded1981/10 Chuo Securities established through merger of above companies
1998/3 Joined Chiba Bank Group
Network 16 branches(Chiba12 - largest、Tokyo1、Saitama1、Ibaraki1、Nagano1)
Staff 219 staff (17 years services on average)
ResultsNet Revenue: ¥3,406MNet Income: ¥252MCapital Ratio: 1,091.3%
CustomerBase
Number of accounts: 65,000Controlled assets: ¥539.3B
(as of 2010/3)
Profitability and SoundnessProfitability and Soundness
Breakdown of Net RevenueBreakdown of Net Revenue
Soundn
ess
(Capital Ratio
–
09/
12)
Soundn
ess
(Capital Ratio
–
09/
12)
Operating Revenue(FY09)Operating Revenue(FY09)
DescriptionDescription
Chuo Securities
Strong capital ratio and suitable profitability in comparison with listed brokerage firms
(excluding big names*, internet firms)
*Operating Revenue ¥50B or above
(¥mil)
Brokerage Fees(Stock) 51.7%Brokerage Fees
(Trust) 28.7%
Brokerage Fees(Others) 0.9%
Trading13.8%
Net RevenueNet Revenue((FY09FY09))
Others4.7%
70% of net revenue is brokerage fees.Trading revenue shows increasing trend.
3.9
10.7
31.5
0
20
40
FY07 FY08 FY09
Bond trading revenueBond trading revenue
(¥mil)Capital
Share Capital: ¥4,374M(Chiba Bank Group has 48.7% in voting rights) 08/4
Banks started to sell Structured Bonds

26
Strengthen the financial intermediation functions and provide high-quality financial services - Brokerage Business II
■ Change the name from “Chuo Securities” to “Chibagin Securities”, to provide “One Stop Service”
Expansion of Brokerage BusinessExpansion of Brokerage Business
05/205/2■■Started Agent Business onStarted Agent Business on
financial productsfinancial products ((via Chuo Securitiesvia Chuo Securities))
98/398/3■■Acquisition ofAcquisition of
““Chuo SecuritiesChuo Securities””
08/408/4■■Started handling ofStarted handling of
Structured BondsStructured Bonds as Agentas Agent
11/111/1~~
■■Change to Change to ““Chibagin Chibagin SecuritiesSecurities””■■Move Head Office to ChibaMove Head Office to Chiba■■Strengthening cooperation with BankStrengthening cooperation with Bank ( (Review of assessment systemReview of assessment system))■■Activating exchange of human resourcesActivating exchange of human resources
Phase 1Phase 1
Phase 2Phase 2
Phase 3Phase 3
Phase 4Phase 4
■■Meet financial needs of CompanyMeet financial needs of Company ((IPO, Underwriting, M&AIPO, Underwriting, M&A))■■Unite strategy of product mixUnite strategy of product mix and channel networkand channel network■■Raise market shareRaise market share■■Strengthen consulting skillsStrengthen consulting skills
98/1098/10 Investment TrustsInvestment Trusts01/ 401/ 4 Personal AnnuitiesPersonal Annuities
Strong publicity by using “Chibagin” brand in ChibaAdvantageous recruiting
Possible synergy
To provide To provide ““One Stop ServicesOne Stop Services””
Financial Products
Deposits
Insurance
Trusts
Bonds
InvestmentTrusts
Stocks
Foreign
Corporate, Foreign,Structured
Domestic
JGB, Municipal
Bank Securities
Deregulation
Know-how

27
Establish Robust Management Structure I
■ Improving business efficiency and distributing management resources effectively for further growth
Reform of clerical workReform of clerical work
2008 2009 2010 2011
Centralize clerical work in branchesReceipt of telephone calls(08/10~)
Administration of various requests(08/10~)
Procedures for remittances(09/5~)
First PhaseFirst Phase
Review business processes
Second PhaseSecond Phase
Business operation reformby new branch system
Third PhaseThird Phase
(Year)
Reduce clerical workSatisfy customers
Improve and minimizeprocessing flow
Support for salesAdd auto-checking
function
CompleteComplete
ReRe--distributing human resourcesdistributing human resources
Head Office staffin non-business
sections
Head Office staffin non-business
sections
BranchesClerical staffBranches
Clerical staff
Corporate LoansCorporate Loans
Housing LoansHousing Loans
Investment-typefinancial productsInvestment-type
financial products
Improving business efficiencyReviewing business processesImproving business efficiencyImproving business efficiency
Reviewing business processesReviewing business processes
5050staffstaff
100100staffstaff
Sales Staff
Image of new branch systemImage of new branch system
Committee for improving business efficiency(Chairman of Committee: Bank President)
Committee for improving business efficiencyCommittee for improving business efficiency(Chairman of Committee: Bank President)
Project Team for improving business efficiencyProject Team for improving business efficiency Project Team for re-distributing human resourcesProject Team for re-distributing human resources
09/9Established
Centralizing clerical work and reducing expenses Re-distributing human resources efficientlyCorrelation
109 109 staffstaff (projection 150 staff) had been transferred by 10/4

28
Establish Robust Management Structure II
189.8
144.2
129.2
25.422.2
53.8
0
50
100
150
200
250
'01/3 '09/9 '10/3
-60
-40
-20
0
20
40
60
Book value of stocksBook value of stocks** and portion to Tier I capital (Consolidated)and portion to Tier I capital (Consolidated)
Book valueBook valueof stocksof stocks
Book value of stocks to Tier I capitalBook value of stocks to Tier I capital
*Acquisition cost of other securities with market value
(¥Bil) (%)
■ Lessening risks through reducing stocks, Strengthening corporate governance
Enhancement of corporate governanceEnhancement of corporate governance
Reform management structure
Reform remuneration system
Abolishment ofRetirement gratuity
Abolishment ofRetirement gratuity
Introduction of Reward-type Stock Option
Introduction of Reward-type Stock Option++
Directors’ incentive to improve financial results and to enhance bank’s valueManagement taking more account of benefit to shareholders
Directors AuditorsCurrentsystemNewsystem Monthly Basic Reward
Monthly Basic Reward +Bonus Retirement gratuity+
+Reward-type Stock Option
09/6
10/6Scheduled
Enhancing the function of board of directors, responding rapidlyto the business environmentStrong cooperation across divisions, independence of credit unit, smooth decision making
Reform of directors and Reform of directors and executive officers systemexecutive officers system
Introduction of unit system,Introduction of unit system,appointment of head of each unitappointment of head of each unit
Decide important matters
Supervise business execution
Directors in charge of various operations
Directors Executive Officers
To clarify authorityTo clarify authorityand responsibilityand responsibility
GM of ShareholdersBoard of directors
Board of Designated directors
BusinessPromotion
Unit
CreditUnit
Corporate Planningand
Administration Unit
Corp. AuditorsBoard of Corp.Auditors
Staff
NewNew
AppointAppointHead of UnitHead of Unit
Audit and Inspection Div.
General Managers of Various divisions and branches
Monthly Basic Reward +Bonus Retirement gratuity+
Monthly Basic Reward

29
Capital Policy
■ Sufficient capital enables the provision of smooth and expeditious financing to the region
Core TieCore Tierr I Ratio (Consolidated, as of 10/3)I Ratio (Consolidated, as of 10/3)
Breakdown of Tier I (Consolidated, as of 10/3) Breakdown of Tier I (Consolidated, as of 10/3)
Capital Ratio 12.80%
Tier I Ratio 11.39%
Core Tier I Ratio (i) excluding preferred shares and preferredsecurities 11.39%
Core Tier I Ratio (ii) excluding preferred shares, preferred securitiesand deferred tax assets 10.35%
Core Tier I Ratio (iii) excluding preferred shares, preferred securities,deferred tax assets and intangible fixed assets 10.17%
11.19
11.63
12.20
8.36
9.68
10.72
12.80
11.7011.39
10.17
4
6
8
10
12
'06/3 '07/3 '08/3 '09/3 '10/3
Capital Ratio, Tier I Ratio (Consolidated)Capital Ratio, Tier I Ratio (Consolidated)
Tier I Ratio
Capital Ratio
(%)
(\Bil)
Tier I 581.9
Capital stock (fully composed of commonstocks), Capital surplus 268.4
Retained earnings 313.9
Amount of minority interests held by consolidatedsubsidiaries (no preferred securities) 12.9
Others (13.4)
(Reference)Deferred tax assets (B/S amount) 53.2
Intangible fixed assets 9.0
Risk Assets 5,106.1

Appendix
■ Appendix
■ Chapter 1 - Summary of Financial Results
■ Chapter 2 – Progress in the Medium TermManagement Plan “1st 1st”

Appendix-1
Table of Contents
県内経済概況①業況判断指数 3県内経済概況②貸出動向 4県内経済概況③人口増減 5県内経済概況④企業倒産 6県内金融機関シェア 7県内経済指標① 8県内経済指標② 9県内地価動向 10千葉県経済規模 11
Appendix Ⅰ Regional Economy
Summary of Income and Expenses 13Management Indicators 14Interest Yields 15Working Assets and Liabilities 16Domestic Loans - Balance 17Domestic Loans - Breakdown 18Loans, Borrowers Classified by Industry 19Profit Structure of Loans 20Domestic Deposits - Balance 21Domestic Deposits - Breakdown 22Expansion of Personal Deposits 23Financial Products 24Loans Disclosed under Self-Assessment and theFinancial Reconstruction Law 25
Factors for Fluctuations in Assets Requiring Caution 26Disposal of Collateral 27Efforts to Facilitate Financing 28Capital Ratio 29Risk Capital Allocation 30Strengthening staff training 31CSR activities 32Branch Network 33Composition of Shareholders 34Changes in Composition of Shareholders 35Recent News 36
Appendix Ⅱ Management indices
Economic Conditions (1) Business Survey Index 3Economic Conditions (2) Loans 4Economic Conditions (3) Population Increase 5Economic Conditions (4) Corporate Bankruptcies 6Business Share of Financial Institutions withinChiba Prefecture 7
Economic Indicators for Chiba Prefecture (1) 8Economic Indicators for Chiba Prefecture (2) 9Land Price Trends in Chiba Prefecture 10Key Data for Chiba Prefecture 11

■ 1. Regional Economy
■ 2. Management Indices

Appendix-3
△ 35
△ 25
△ 15
△ 5
5
15
25
90 92 94 96 98 00 02 04 06 08 10
Trend of BSI of Sales (All Industries)Trend of BSI of Sales (All Industries)
Economic Conditions (1) Business Survey Index
ActualForecast
FY10Forecast
Apr-Jun Jul-Sep Oct-Dec Jan-Mar Apr-Jun
Food (11.9) (8.6) (18.3) (17.2) (9.4)
Petroleum & Chemicals (32.7) (17.4) (11.4) (6.8) 16.7
Plastics (36.4) (40.9) (12.5) (20.0) (5.0)
Glass (28.6) (25.0) (36.4) (4.2) (22.7)
Steel & Non-f errous Metals (37.5) (30.8) (12.5) (4.2) (12.5)
Metals (43.2) (38.0) (10.0) 2.4 (4.6)
Machinery (44.1) (35.3) (23.4) (18.8) (3.2)
Electrical machinery (44.5) (50.0) (25.0) 27.8 11.1
Transportation equipment (43.4) (38.5) (18.8) 0.0 3.0
Other manufacturing (26.2) (29.0) (13.9) (12.5) (15.6)
Construction (19.1) (27.5) (17.5) (25.0) (21.5)
Transportation (23.1) (26.9) (10.7) 0.0 (4.6)
Wholesaling (25.0) (30.6) (25.0) (16.0) (14.6)
Retailing (17.2) (17.3) (20.4) (20.0) (14.6)
Hotels (50.0) (25.0) (46.2) (20.9) (4.6)
Services (24.0) (26.5) (20.9) (15.0) (12.5)
ActualFY09
BSI: Business Survey Index is an index of executives' business sentiment and actual conditions, with a choice from "upward/ increase/improve" ,"no change", and "downward/decrease/worsen". BSI = ("upward/ increase/improve" - "downward/decrease/worsen") x1/2
BSI: Business Survey Index is an index of executives' business sentiment and actual conditions, with a choice from "upward/ increase/improve" ,"no change", and "downward/decrease/worsen". BSI = ("upward/ increase/improve" - "downward/decrease/worsen") x1/2
Source: Chiba Economy Center "BSI survey in Chiba (January to March 10)"Surveyees: Enterprises with a head office and/or an office in Chiba As at: April 10Answers: 746 enterprises surveyed, 320 effective answers
Trend of BSI of Sales (By Industry)Trend of BSI of Sales (By Industry)

Appendix-4
Economic Conditions (2) Loans
10.0
10.5
11.0
11.5
12.0
12.5
13.0
02/7 03/1 03/7 04/1 04/7 05/1 05/7 06/1 06/7 07/1 07/7 08/1 08/7 09/1 09/7 10/1
-25.0%
-20.0%
-15.0%
-10.0%
-5.0%
0.0%
5.0%
Loan Balance
Change from previous year
Loans in Chiba PrefectureLoans in Chiba Prefecture[Change][Loan Balance]
(¥ Tri.)
Made by Chiba Bank with data from Business Support Div., Commerce, Industry & Labour Dept. of Chiba Prefecture Note: Figures are term-end balance of total loans from banks
Appendix-5
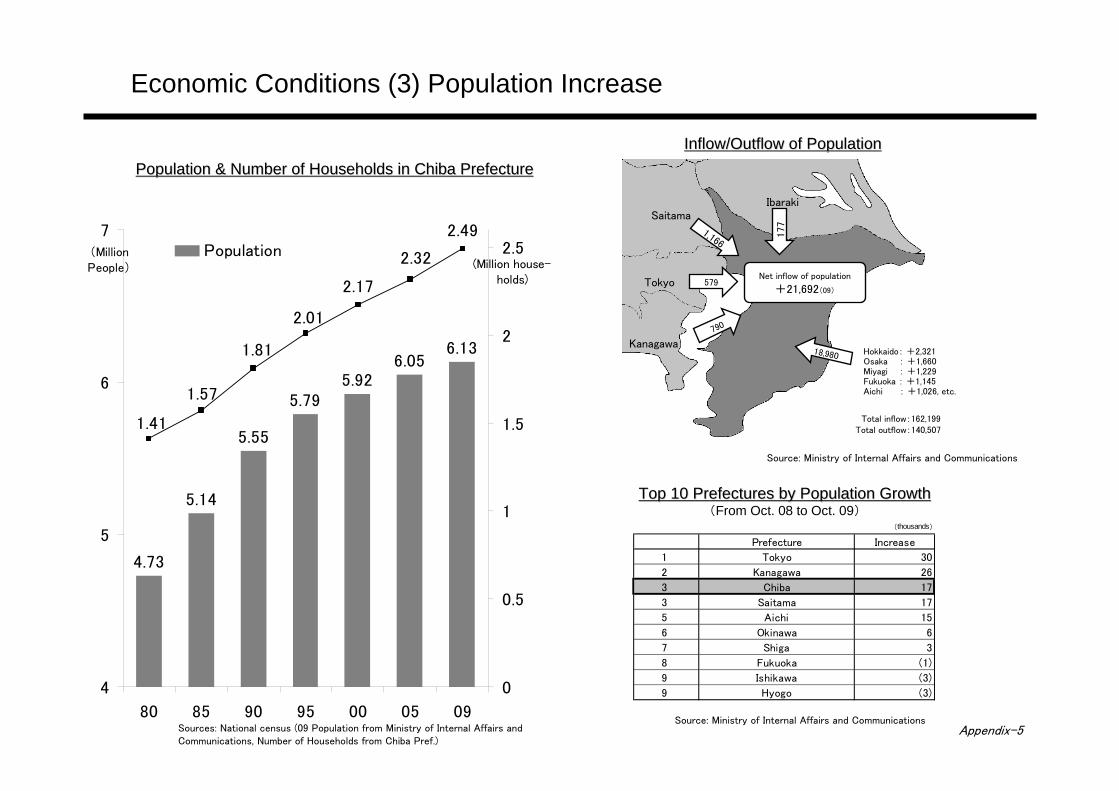
人口増加ランキング(2007/10⇒2008/10) (thousands)
Prefecture Increase
1 Tokyo 30
2 Kanagawa 26
3 Chiba 17
3 Saitama 17
5 Aichi 15
6 Okinawa 6
7 Shiga 3
8 Fukuoka (1)
9 Ishikawa (3)
9 Hyogo (3)
790
1,166
177
Net inflow of population
+21,692(09)
18,980 Hokkaido: +2,321 Osaka : +1,660 Miyagi : +1,229 Fukuoka : +1,145 Aichi : +1,026, etc.
Tokyo
Kanagawa
SaitamaIbaraki
Total inflow:162,199Total outflow:140,507
Economic Conditions (3) Population Increase
4.73
5.14
5.55
5.795.92
6.056.13
2.49
2.32
2.17
2.01
1.81
1.57
1.41
4
5
6
7
80 85 90 95 00 05 09
(MillionPeople)
0
0.5
1
1.5
2
2.5(Million house-
holds)
Population
579
Population & Number of Households in Chiba PrefecturePopulation & Number of Households in Chiba PrefectureInflow/Outflow of PopulationInflow/Outflow of Population
Source: Ministry of Internal Affairs and Communications
Top 10 Prefectures by Population GrowthTop 10 Prefectures by Population Growth(From Oct. 08 to Oct. 09)
Sources: National census (09 Population from Ministry of Internal Affairs and Communications, Number of Households from Chiba Pref.)
Source: Ministry of Internal Affairs and Communications

Appendix-6
Economic Conditions (4) Corporate Bankruptcies
8.74.5
13.0
47.3
5.0
34.9
9.96.2
49.3
13.710.616.0
24.5
12.115.7
9.5
19.9
29.1
39.7
55.7
22.7
49.2
11.5
19.3
30.6
59.5
15.118.0
8.8
19.8
8.111.6
26.4
15.115.2
7.89.15.0
9.6
35.1
12.4
6.93.76.9
22.3
3.84.6
43.4
16.4
34.7
7.2
12.98.5
5.4
63.5
10.0
2.13.7
13.3
21.7
1.87.2
15.7
25.7
12.710.2
6.9
18.9
5.03.18.45.2
2.9
36.8
10.3
1.96.39.3
5.03.14.910.0
4.73.49.1
3.43.75.37.2
20.9
7.34.9
19.6
10.412.0
4.53.14.5
40.6
1.74.8
16.0
6.4
12.1
18.9
2.07.310.7
12.919.0
60.9
105.2
107.3
726.1
56.040.5
61.2
12.4
6.711.7
34
40
3230
40
2931
24
28
36
24
29
2220
27
31
2220
15
27
33
2425
37
2523
28
34
24
3436
31
17
3031
21
34
2122
28
16
383536
2325
32
38
26
31
4340
31
44
56
36
4340
26
20
44
24
323130
34
4548
3939
33
42393940
43
58
4750
46
54
67
504747
434545
54
59
49
43
48
52
41
34
46
6161
52
48
41
47
43
5456
31
47
53
50
42
37
30
35
32
47
26
2932
39
0
20
40
60
80
100
120
140
160
00/4 00/10 01/4 01/10 02/4 02/10 03/4 03/10 04/4 04/10 05/4 05/10 06/4 06/10 07/4 07/10 08/4 08/10 09/4 09/10 10/4
0
20
40
60
80Amounts
Cases
(¥ Bil.) (Cases)
Default Cases/Amounts in Chiba PrefectureDefault Cases/Amounts in Chiba Prefecture(Headquartered in Chiba Prefecture & with debts over ¥10 million)
Source: Made by Chiba Bank with data from Shoko Research

Appendix-7
Business Share of Financial Institutions within Chiba Prefecture
Regional
banks(ex.Chiba
Bank)
10.8%
2nd-tier regional
banks
13.6%
Shinkin banks
11.2%
Credit
cooperatives/
Labour Bank/JA
9.0%
City banks
23.0%
Chiba Bank
32.4%
Regional
banks(ex.Chiba Bank)
10.6%
2nd-tier regional
banks
14.1%
Shinkin banks
9.9%
Credit
cooperatives/Labour
Bank/JA
8.6%
City banks
22.0%
Chiba Bank
34.8%Chiba Bank
38.1%
City banks
16.6%
Credit cooperatives/
Labour Bank/JA
8.9%
Shinkin banks
8.7%
2nd-tier regional
banks
15.2%
Regional
banks(ex.Chiba Bank)
12.5%
04/3 13.5trillion 09/3 14.1trillion99/3 15.2trillion
Chiba Bank
18.6%
Japan Post
31.2%
Citybanks
19.1%
Credit
cooperatives/Labour
Bank/JA
9.1%
Shinkin banks
8.0%
2nd-tier regional
banks
7.8% Regional banks
(ex. Chiba Bank)
6.2%
Chiba Bank
20.3%
Japan Post
28.3%
City banks
22.4%
Credit
cooperatives/Labour
Bank/JA
8.5%
Shinkin banks
6.8%
2nd-tier regional
banks
8.1%Regional
banks(ex.Chiba Bank)
5.6%
Regional
banks(ex.Chiba Bank)
5.9%
2nd-tier regional
banks
9.4%
Shinkin banks
6.5%
Credit
cooperatives/Labour
Bank/JA
8.9%
City banks
24.2%
Japan Post Bank
21.9%
Chiba Bank
23.2%
04/3 34.7trillion 09/3 35.5trillion99/3 32.5trillion
LoansLoans
DepositsDeposits
Source: KINYU JOURNAL

Appendix-8
Economic Indicators for Chiba Prefecture (1)
◆千葉県経済指標Population Industrial Production Index Electric Power Consumption Building Construction
Total Production ShipmentProducers'
Inventory
RatioTotal Floor Area
New Housingstarts
Largeusers
As of Oct 1 2005=100 Million KWH 2005=100 Total Thousand ㎡
2005 * 6,056,462 100.0 100.0 101.0 38,027 11,950 100.0 145,151 10,167 64,587
2006 6,077,929 102.0 103.1 102.4 37,906 12,463 100.0 144,900 10,079 71,536
2007 6,108,809 104.8 105.8 97.6 38,151 12,643 99.9 139,271 8,210 58,147
2008 6,147,347 102.6 104.8 106.0 39,056 13,109 101.1 135,000 7,552 62,745
2009 6,183,743 86.3 89.7 108.1 36,490 11,237 99.8 126,789 5,303 42,526
2009/04 6,162,593 80.8 82.0 126.6 3,012 891 100.3 7,302 548 3,577
2009/05 6,172,836 84.8 87.3 117.4 2,821 903 100.1 8,383 341 2,941
2009/06 6,174,848 89.3 93.6 105.9 2,788 955 99.7 10,666 380 3,245
2009/07 6,177,586 90.1 93.4 104.8 3,100 981 99.7 12,264 469 3,884
2009/08 6,180,436 92.8 97.8 98.9 3,306 971 99.5 8,619 370 3,058
2009/09 6,181,152 91.9 94.3 102.1 3,112 962 99.5 13,550 445 3,578
2009/10 6,183,743 91.0 93.9 101.9 2,928 1,017 99.3 11,101 387 3,463
2009/11 6,185,793 95.5 97.5 101.2 2,994 1,072 99.3 11,875 368 3,691
2009/12 6,187,320 93.0 98.4 99.3 3,088 987 99.2 10,484 376 3,630
2010/01 6,187,319 95.1 97.8 98.8 3,451 956 98.5 10,556 551 5,738
2010/02 6,186,546 - - - 3,277 907 98.6 12,300 471 3,142
2010/03 6,185,403 - - - - - - 17,398 - -
Source Statistics Div., Policy & Planning Dept. of Chiba Pref.Tokyo Electric Power
Company, Chiba Branch
Statistics Div., Policy &Planning Dept. of
Chiba Pref.
Chiba Toyota MotorCorporation & Japan
Mini Vehicles
Ministry of Land, Infrastructureand Transport
CustomerPrice Index
New CarRegistrations
*Source of Population as of 2005: National Census

Appendix-9
Economic Indicators for Chiba Prefecture (2)
◆千葉県経済指標Trade Customs Clearance Corporate Bankruptcies Labor Market Real Wage Index(Chiba Port & Kisarazu Port)
Export Import \ Million 2005=100
2005 1,325,789 3,602,269 306 301,161 80,205 66,618 0.83 100.0 100.0 100.0 100.0
2006 1,483,712 4,350,374 355 140,573 76,648 68,983 0.90 98.2 100.1 98.4 95.7
2007 1,716,473 4,750,864 329 153,140 73,197 69,028 0.94 99.6 100.9 95.6 95.6
2008 2,023,363 6,237,267 388 78,715 73,345 58,681 0.80 100.8 100.3 95.5 95.2
2009 1,052,293 3,247,148 436 118,539 97,619 44,453 0.46
2009/04 61,544 231,485 40 20,870 101,796 46,562 0.48 99.1 91.5 80.7 71.7
2009/05 64,356 199,967 31 7,250 103,231 40,962 0.44 100.2 90.5 78.4 71.4
2009/06 99,452 216,719 44 4,883 105,169 40,236 0.43 99.8 90.4 138.0 149.1
2009/07 102,043 302,526 56 19,603 105,690 39,466 0.40 99.5 90.0 97.8 97.4
2009/08 105,611 281,583 36 10,365 103,959 39,818 0.40 99.1 89.9 78.0 74.0
2009/09 115,545 309,306 43 12,030 102,639 41,624 0.41 99.2 89.8 76.8 71.9
2009/10 93,102 257,934 40 4,484 103,821 43,968 0.42 99.0 90.2 76.1 72.3
2009/11 87,639 294,247 26 3,099 100,707 42,584 0.40 99.6 89.9 78.7 74.2
2009/12 98,495 359,389 20 4,494 95,163 40,686 0.40 99.4 90.0 164.4 172.4
2010/01 91,979 297,866 44 40,674 95,329 42,211 0.41 99.0 91.0 78.3 75.4
2010/02 104,937 315,404 24 1,698 96,747 43,978 0.41 - - - -
2010/03 - - 32 4,767 - - - - - - -
Source Chiba Customs Branch Tokyo Shoko Research, Ltd., Chiba Branch Chiba Labor Bureau Statistics Div., Policy & Planning Dept. of Chiba Pref.
Active JobOpenings
(Headquartered in Chiba Pref . &with debt ¥10 mil. or more)
Number ofCompanies ¥Million
ActiveApplications
Regular Employment Index
(Number of employees: 30 or more) (Number of employees: 30 or more)Active
OpeningRatio
All industries Manufacturing All industries Manufacturing

Appendix-10
(%)
Land Price Trends in Chiba Prefecture
-4.9-4.8
-9.1-10.0
-9.2-9.1-8.6-7.0
-4.5 -4.5
-14.5
-12.6
-14.9-15.8
-14.2-13.3
-11.0
-8.9
-5.7
-0.8
-4.8-3.5
2.81.6
-1.5
-4.1
6.1
3.6
-20
-15
-10
-5
0
5
10
97 98 99 00 01 02 03 04 05 06 07 08 09 10
Residential
Commercial
09.1.1 09.4.1 09.7.1 09.10.1
City Category Area ~ ~ ~ ~
09.4.1 09.7.1 09.10.1 10.1.1
A Chuo-ku, Chiba city Residential Chiba Minato 5 5 5 5
B Chuo-ku, Chiba city Commerce Around Chiba Sta. 6 6 6 5
C Mihama-ku, Chiba ciry Commerce Kaihimmakuhari 5 5 5 5
D Urayasu Residential Shin-Urayasu 6 6 5 5
E Ichikawa Commerce Around Motoyawata Sta. 6 5 5 6
F Funabashi Commerce Around Funabashi Sta. 7 6 5 5
G Kashiwa Residential Kashiwanoha 5 5 6 6
Trend Prices of Intensively Used Land in Major CitiesTrend Prices of Intensively Used Land in Major Cities((Chiba PrefectureChiba Prefecture))
<Legend>
Demonstrating early trend prices of intensively used land by research trend prices of intensively used land which reflects trend prices of land in major cities.
Level Change in three months
1 Increasing(6% or more)
2 Increasing(From 3% to less than 6%)
3 Increasing(over 0% to less than 3%)
4 flat(0%)
5 Decreasing(over 0% to less than 3%)
6 Decreasing(from 3% to less than 6%)
7 Decreasing(from 6% to less than 9%)
8 Decreasing(from 9% to less than 12%)
9 Decreasing(12% or more)
AB
CD
E F
G
ChibaChibaChiba
<Research Area>
<Outline of the investigation>
Standard Land Prices(Chiba Prefecture)Standard Land Prices(Chiba Prefecture)
Data from Chiba PrefectureAs of July 1 of each year

Appendix-11
No. 3nationwide
No. 2nationwide
No. 1nationwide
Chiba
Osaka8.80 million
Kanagawa8.94 million
Tokyo12.86 million
6.13 million(Ranked 6th
nationwide)
Population
Kanagawa¥33.6 trillion
Osaka¥55.1 trillion
Tokyo¥169.4 trillion
¥22.8 trillion(Ranked 6thnationwide)
Balance of Deposits
Kanagawa¥17.6 trillion
Osaka¥38.0 trillion
Tokyo¥171.0 trillion
¥11.7 trillion(Ranked 7thnationwide)
Balance ofLoans
Aichi76 thousand
Kanagawa83 thousand
Tokyo150 thousand
58 thousand(Ranked 6thnationwide)
Number of new housing
starts
Osaka¥27 trillion
Kanagawa¥29 trillion
Tokyo¥57 trillion
¥18 trillion(Ranked 6thnationwide)
Prefectural Income
Key Data for Chiba Prefecture
Sources:Population: Statistics Bureau, Ministry of Internal Affairs and Communications (October 2009)Number of new housing starts: Ministry of Land, Infrastructure and Transport (2009)Prefectural Income: Economic and Social Research Institute, Cabinet Office (FY 2007)Balance of Deposits and Loans: The Bank of Japan (As of March 2010)

Management Indices
■ 1. Regional Economy
■ 2. Management Indices

Appendix-13
※ Above figures are non-consolidated except for Consolidated net income
Summary of Income and Expenses
(\Billion)
FY 03 FY 04 FY 05 FY 06 FY 07 FY 08 FY 09
1H 1H 1H 1H 1H 1H 1H
Gross business profits 70.5 142.5 72.5 147.8 75.0 150.5 77.8 155.1 79.5 163.1 73.0 142.1 82.3 162.1
Net interest income 60.5 120.8 61.5 123.7 61.8 126.2 65.8 132.4 68.8 139.5 73.4 146.6 72.8 143.3
8.2 16.8 8.3 17.0 9.3 19.6 10.4 21.4 10.0 18.4 9.0 15.3 6.7 14.1
Net trading income 0.7 2.0 1.0 2.4 1.0 1.9 0.9 2.3 1.5 3.3 1.6 4.7 1.6 3.0
0.9 2.7 1.5 4.5 2.8 2.6 0.6 -1.1 -0.8 1.8 -11.1 -24.6 1.0 1.6
Gains (losses) related to bonds 0.2 1.1 0.5 2.2 1.8 0.7 -2.1 -6.0 -2.1 -0.9 -12.8 -28.4 -0.5 -0.9
Expenses 37.0 74.1 36.9 73.7 37.6 75.3 39.1 77.9 39.5 79.2 40.4 79.9 39.7 80.3
Real net business income 33.5 68.4 35.5 74.0 37.4 75.2 38.7 77.2 40.0 83.9 32.6 62.2 42.5 81.8
Ordinary profit 16.4 40.3 28.8 57.8 36.0 68.8 31.8 71.3 38.4 70.0 11.1 6.5 22.0 53.4
Net income 11.7 25.7 19.5 34.3 23.4 46.7 24.5 50.1 27.2 44.6 7.3 11.3 16.3 36.2
Net credit costs 17.4 30.9 2.9 16.5 -2.5 -2.1 0.8 2.0 -3.5 3.6 19.3 37.2 16.8 19.4
Consolidated net income 11.7 27.5 20.7 36.3 24.8 48.9 25.6 52.5 27.9 45.9 7.6 12.3 16.6 37.5
Net fees and commissions income
Profit from other business transactions
*These figures are based on non-consolidated figures except for Consolidated net income.
Appendix-14
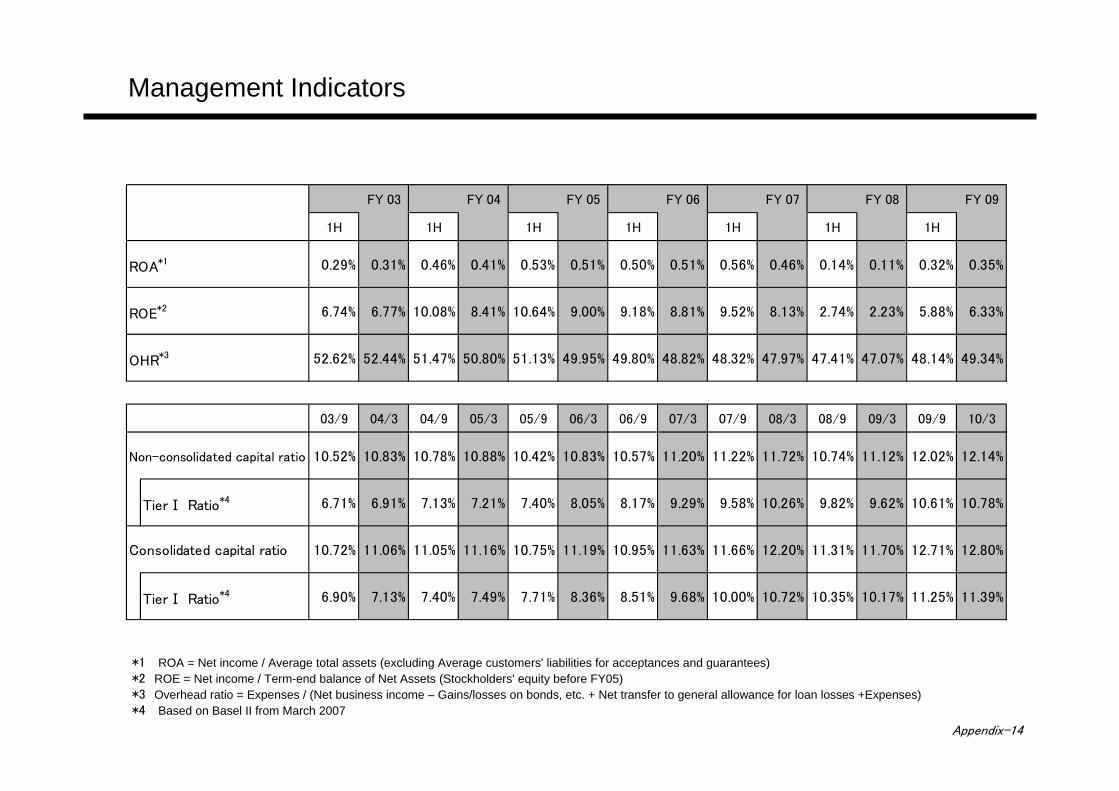
*1 ROA = Net income / Average total assets (excluding Average customers' liabilities for acceptances and guarantees)*2 ROE = Net income / Term-end balance of Net Assets (Stockholders' equity before FY05)*3 Overhead ratio = Expenses / (Net business income – Gains/losses on bonds, etc. + Net transfer to general allowance for loan losses +Expenses)*4 Based on Basel II from March 2007
Management Indicators
FY 03 FY 04 FY 05 FY 06 FY 07 FY 08 FY 09
1H 1H 1H 1H 1H 1H 1H
ROA*1 0.29% 0.31% 0.46% 0.41% 0.53% 0.51% 0.50% 0.51% 0.56% 0.46% 0.14% 0.11% 0.32% 0.35%
ROE*2 6.74% 6.77% 10.08% 8.41% 10.64% 9.00% 9.18% 8.81% 9.52% 8.13% 2.74% 2.23% 5.88% 6.33%
OHR*3 52.62% 52.44% 51.47% 50.80% 51.13% 49.95% 49.80% 48.82% 48.32% 47.97% 47.41% 47.07% 48.14% 49.34%
03/9 04/3 04/9 05/3 05/9 06/3 06/9 07/3 07/9 08/3 08/9 09/3 09/9 10/3
10.52% 10.83% 10.78% 10.88% 10.42% 10.83% 10.57% 11.20% 11.22% 11.72% 10.74% 11.12% 12.02% 12.14%
TierⅠ Ratio*4 6.71% 6.91% 7.13% 7.21% 7.40% 8.05% 8.17% 9.29% 9.58% 10.26% 9.82% 9.62% 10.61% 10.78%
Consolidated capital ratio 10.72% 11.06% 11.05% 11.16% 10.75% 11.19% 10.95% 11.63% 11.66% 12.20% 11.31% 11.70% 12.71% 12.80%
TierⅠ Ratio*4 6.90% 7.13% 7.40% 7.49% 7.71% 8.36% 8.51% 9.68% 10.00% 10.72% 10.35% 10.17% 11.25% 11.39%
Non-consolidated capital ratio

Appendix-15
Interest Yields
FY 03 FY 04 FY 05 FY 06 FY 07 FY 08 FY 09
1H 1H 1H 1H 1H 1H 1H
Average yield on interest-bearing assets 1.70% 1.70% 1.68% 1.69% 1.62% 1.60% 1.59% 1.65% 1.82% 1.83% 1.87% 1.85% 1.74% 1.70%
Average yield on loans and bills discounted 2.02% 2.01% 1.99% 1.99% 1.90% 1.88% 1.85% 1.92% 2.13% 2.17% 2.16% 2.14% 1.97% 1.94%
Average yield on securities 0.66% 0.62% 0.66% 0.66% 0.69% 0.76% 0.96% 0.94% 0.95% 0.91% 1.16% 0.99% 1.05% 0.98%
Average yield on interest-bearing liabilities 1.01% 1.01% 0.97% 0.97% 0.95% 0.93% 0.96% 1.00% 1.14% 1.15% 1.16% 1.11% 1.00% 1.00%
Average yield on deposits and NCD 0.02% 0.02% 0.01% 0.01% 0.01% 0.01% 0.05% 0.09% 0.22% 0.23% 0.26% 0.23% 0.15% 0.14%
Expense ratio 0.99% 0.99% 0.96% 0.96% 0.94% 0.94% 0.95% 0.95% 0.93% 0.93% 0.91% 0.91% 0.88% 0.89%
Average interest rate spread 0.69% 0.69% 0.71% 0.72% 0.67% 0.67% 0.63% 0.65% 0.68% 0.68% 0.71% 0.74% 0.74% 0.70%
2.00% 1.99% 1.98% 1.98% 1.89% 1.87% 1.80% 1.83% 1.91% 1.94% 1.90% 1.91% 1.82% 1.80%
03/9 04/3 04/9 05/3 05/3 06/3 06/9 07/3 07/9 08/3 08/9 09/3 09/9 10/3
Major companies 1.05% 1.00% 0.97% 0.94% 0.80% 0.72% 0.91% 1.17% 1.28% 1.29% 1.25% 1.19% 0.99% 0.90%
Mid-sized companies 1.73% 1.68% 1.51% 1.45% 1.36% 1.33% 1.46% 1.61% 1.67% 1.67% 1.65% 1.45% 1.35% 1.30%
Small and medium-sized companies 2.35% 2.33% 2.30% 2.25% 2.18% 2.11% 2.24% 2.30% 2.39% 2.36% 2.35% 2.14% 2.08% 2.03%
Consumer loans 2.38% 2.33% 2.30% 2.27% 2.22% 2.17% 2.24% 2.35% 2.49% 2.54% 2.58% 2.55% 2.33% 2.22%
Housing loans 2.21% 2.16% 2.12% 2.10% 2.04% 1.99% 2.06% 2.18% 2.32% 2.37% 2.41% 2.38% 2.17% 2.06%
Others 5.70% 5.78% 6.20% 6.42% 6.60% 6.79% 7.02% 7.37% 7.61% 7.82% 7.93% 8.05% 7.87% 7.81%
Public sector 0.94% 0.98% 1.13% 0.80% 0.96% 0.82% 1.05% 1.26% 1.38% 1.35% 1.38% 1.70% 1.31% 1.30%
Difference between average yield on loans and deposits
Domestic OperationsDomestic Operations
Contract Rate by Type BorrowersContract Rate by Type Borrowers
*Internal management base (term-end’s weighted average contact lending rate of each category.)

Appendix-16
FY 07 FY 08 FY 09 FY 07 FY 08 FY 09
1H 1H 1H 1H 1H 1H
8,958.7 9,044.5 9,258.2 9,283.2 9,345.9 9,386.0 2.05% 2.04% 2.00% 1.94% 1.76% 1.72%
Loans and bills discounted 6,467.5 6,543.0 6,774.1 6,930.4 7,112.3 7,155.1 2.15% 2.18% 2.16% 2.14% 1.96% 1.93%
Securities 2,312.0 2,207.6 2,116.7 2,077.9 1,954.0 1,962.3 1.83% 1.72% 1.62% 1.40% 1.19% 1.14%
8,908.5 9,007.7 9,245.7 9,306.4 9,484.5 9,486.0 0.52% 0.50% 0.41% 0.36% 0.20% 0.19%
Deposits 8,307.7 8,294.0 8,505.7 8,465.7 8,663.5 8,664.9 0.38% 0.36% 0.32% 0.27% 0.16% 0.14%
Borrowed money 125.1 190.7 125.8 210.7 251.1 232.7 1.14% 0.95% 0.93% 0.81% 0.49% 0.48%
国内業務部門
FY 07 FY 08 FY 09 FY 07 FY 08 FY 09
1H 1H 1H 1H 1H 1H
8,534.0 8,661.4 8,883.8 8,923.3 9,051.7 9,090.4 1.82% 1.83% 1.87% 1.85% 1.74% 1.70%
Loans and bills discounted 6,425.1 6,502.9 6,718.8 6,863.4 7,032.2 7,072.4 2.13% 2.17% 2.16% 2.14% 1.97% 1.94%
Securities 1,753.7 1,674.2 1,597.1 1,611.7 1,608.7 1,627.5 0.95% 0.91% 1.16% 0.99% 1.05% 0.98%
8,490.9 8,622.3 8,871.9 8,945.9 9,189.9 9,190.8 0.25% 0.26% 0.28% 0.25% 0.17% 0.16%
Deposits 8,022.3 8,034.6 8,264.3 8,250.7 8,471.0 8,462.7 0.22% 0.23% 0.25% 0.22% 0.15% 0.13%
Borrowed money 124.1 189.7 124.8 188.2 234.2 220.9 1.12% 0.93% 0.91% 0.74% 0.48% 0.48%
Average balance (\ Billion)
Average balance (\ Billion)
Interest yield
Interest yield
Interest-bearing liabilities
Interest-bearing assets
Interest-bearing assets
Interest-bearing liabilities
Working Assets and Liabilities
OverallOverall
Domestic OperationsDomestic Operations
Appendix-17
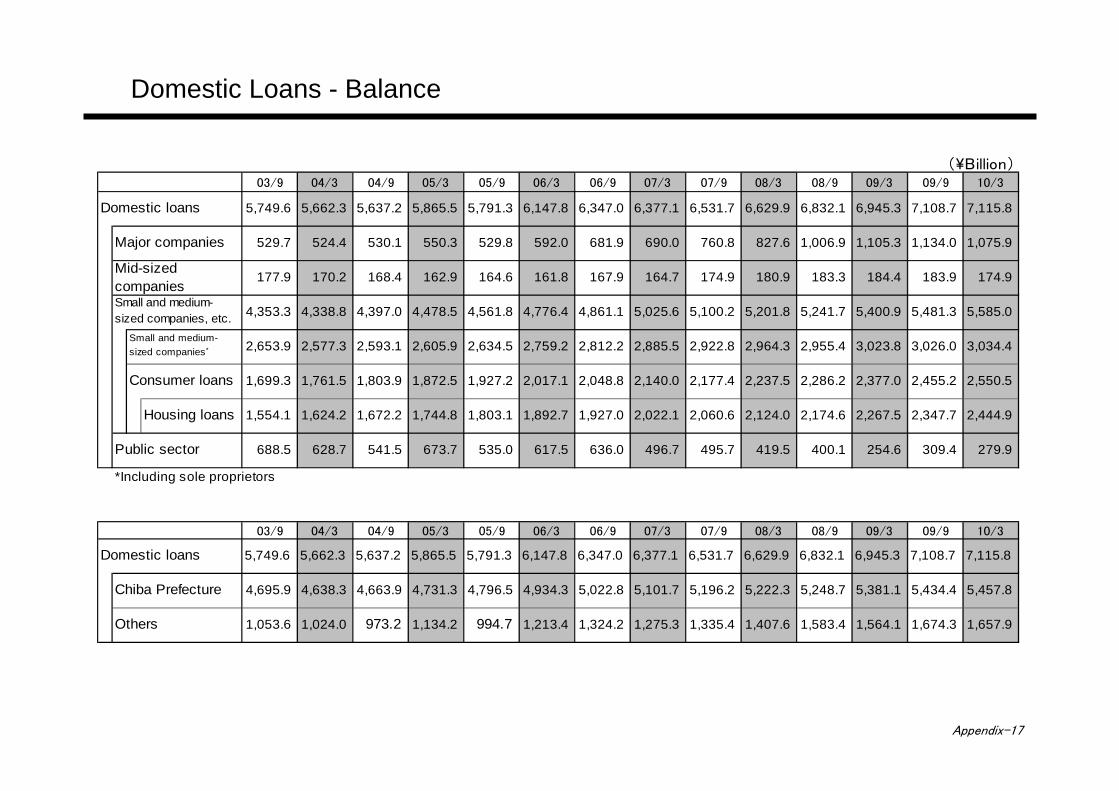
(\Billion)03/9 04/3 04/9 05/3 05/9 06/3 06/9 07/3 07/9 08/3 08/9 09/3 09/9 10/3
Domestic loans 5,749.6 5,662.3 5,637.2 5,865.5 5,791.3 6,147.8 6,347.0 6,377.1 6,531.7 6,629.9 6,832.1 6,945.3 7,108.7 7,115.8
Major companies 529.7 524.4 530.1 550.3 529.8 592.0 681.9 690.0 760.8 827.6 1,006.9 1,105.3 1,134.0 1,075.9
177.9 170.2 168.4 162.9 164.6 161.8 167.9 164.7 174.9 180.9 183.3 184.4 183.9 174.9
4,353.3 4,338.8 4,397.0 4,478.5 4,561.8 4,776.4 4,861.1 5,025.6 5,100.2 5,201.8 5,241.7 5,400.9 5,481.3 5,585.0
2,653.9 2,577.3 2,593.1 2,605.9 2,634.5 2,759.2 2,812.2 2,885.5 2,922.8 2,964.3 2,955.4 3,023.8 3,026.0 3,034.4
Consumer loans 1,699.3 1,761.5 1,803.9 1,872.5 1,927.2 2,017.1 2,048.8 2,140.0 2,177.4 2,237.5 2,286.2 2,377.0 2,455.2 2,550.5
Housing loans 1,554.1 1,624.2 1,672.2 1,744.8 1,803.1 1,892.7 1,927.0 2,022.1 2,060.6 2,124.0 2,174.6 2,267.5 2,347.7 2,444.9
Public sector 688.5 628.7 541.5 673.7 535.0 617.5 636.0 496.7 495.7 419.5 400.1 254.6 309.4 279.9
*Including sole proprietors
03/9 04/3 04/9 05/3 05/9 06/3 06/9 07/3 07/9 08/3 08/9 09/3 09/9 10/3
Domestic loans 5,749.6 5,662.3 5,637.2 5,865.5 5,791.3 6,147.8 6,347.0 6,377.1 6,531.7 6,629.9 6,832.1 6,945.3 7,108.7 7,115.8
Chiba Prefecture 4,695.9 4,638.3 4,663.9 4,731.3 4,796.5 4,934.3 5,022.8 5,101.7 5,196.2 5,222.3 5,248.7 5,381.1 5,434.4 5,457.8
Others 1,053.6 1,024.0 973.2 1,134.2 994.7 1,213.4 1,324.2 1,275.3 1,335.4 1,407.6 1,583.4 1,564.1 1,674.3 1,657.9
Mid-sizedcompaniesSmall and medium-sized companies, etc.
Small and medium-sized companies*
Domestic Loans - Balance

Appendix-18
Domestic Loans - Breakdown
03/9 04/3 04/9 05/3 05/9 06/3 06/9 07/3 07/9 08/3 08/9 09/3 09/9 10/3
Domestic loans 100.0% 100.0% 100.0% 100.0% 100.0% 100.0% 100.0% 100.0% 100.0% 100.0% 100.0% 100.0% 100.0% 100.0%
Major companies 9.2% 9.3% 9.4% 9.4% 9.1% 9.6% 10.7% 10.8% 11.6% 12.5% 14.7% 15.9% 16.0% 15.1%
3.1% 3.0% 3.0% 2.8% 2.8% 2.6% 2.6% 2.6% 2.7% 2.7% 2.7% 2.6% 2.6% 2.5%
75.7% 76.6% 78.0% 76.4% 78.8% 77.7% 76.6% 78.8% 78.1% 78.5% 76.7% 77.8% 77.1% 78.5%
46.2% 45.5% 46.0% 44.4% 45.5% 44.9% 44.3% 45.2% 44.7% 44.7% 43.3% 43.6% 42.6% 42.6%
Consumer loans 29.6% 31.1% 32.0% 31.9% 33.3% 32.8% 32.3% 33.6% 33.3% 33.8% 33.5% 34.2% 34.5% 35.8%
Housing loans 27.0% 28.7% 29.7% 29.7% 31.1% 30.8% 30.4% 31.7% 31.5% 32.0% 31.8% 32.6% 33.0% 34.4%
Public sector 12.0% 11.1% 9.6% 11.5% 9.2% 10.0% 10.0% 7.8% 7.6% 6.3% 5.9% 3.7% 4.4% 3.9%
*Including sole proprietors
03/9 04/3 04/9 05/3 05/9 06/3 06/9 07/3 07/9 08/3 08/9 09/3 09/9 10/3
Domestic loans 100.0% 100.0% 100.0% 100.0% 100.0% 100.0% 100.0% 100.0% 100.0% 100.0% 100.0% 100.0% 100.0% 100.0%
Chiba Prefecture 81.7% 81.9% 82.7% 80.7% 82.8% 80.3% 79.1% 80.0% 79.6% 78.8% 76.8% 77.5% 76.4% 76.7%
Others 18.3% 18.1% 17.3% 19.3% 17.2% 19.7% 20.9% 20.0% 20.4% 21.2% 23.2% 22.5% 23.6% 23.3%
Mid-sizedcompaniesSmall and medium-sized companies, etc.
Small and medium-sized companies*

Appendix-19
業種別貸出残高(国内店分) (\Billion) 業種別貸出残高(国内店分) (\Billion)
07/9 08/3 08/9 09/3 09/9 10/3
Proportion Proportion Proportion Proportion Proportion Proportion
Manufacturing 495.0 7.58% 524.2 7.91% 579.5 8.48% 716.0 10.31% Manufacturing 727.4 10.23% 701.7 9.86%
18.6 0.28% 20.1 0.30% 24.3 0.35% 25.1 0.36% Agriculture and Forestry 6.5 0.09% 7.9 0.11%
Construction 313.4 4.80% 314.5 4.74% 320.2 4.69% 338.3 4.87% Fishery 1.2 0.02% 1.2 0.02%
28.2 0.43% 37.2 0.56% 36.4 0.53% 16.0 0.23% Mining, quarry ing and gravel 15.7 0.22% 15.4 0.22%
34.5 0.53% 32.0 0.48% 38.8 0.57% 37.3 0.54% Construction 324.0 4.56% 314.1 4.41%
Transport 188.8 2.89% 188.7 2.85% 188.1 2.75% 208.4 3.00% 22.2 0.31% 20.2 0.28%
Wholesale and Retail Trade 590.0 9.04% 615.8 9.29% 636.4 9.33% 660.6 9.51% 42.2 0.60% 39.8 0.56%
Finance and Insurance 271.1 4.15% 272.9 4.12% 343.2 5.02% 339.7 4.89% Transport and postal serv ice 206.2 2.90% 206.1 2.90%
Real Estate 1,466.2 22.45% 1,470.4 22.18% 1,463.2 21.42% 1,442.6 20.77% Wholesale and retail trade 675.4 9.50% 655.9 9.22%
Real Estate Rental and Management 1,081.6 16.56% 1,101.0 16.61% 1,111.0 16.26% 1,142.4 16.45% Finance and Insurance 338.0 4.75% 331.7 4.66%
Real Estate Trading, etc 384.5 5.89% 369.3 5.57% 352.1 5.15% 300.1 4.32% Real Estate and leasing 1,610.8 22.66% 1,618.2 22.74%
Various Serv ices 578.1 8.85% 603.8 9.11% 604.8 8.85% 620.4 8.94% Real Estate 1,441.2 20.27% 1,456.6 20.47%
351.1 5.38% 295.2 4.45% 293.8 4.30% 146.4 2.11% Real estate rental and management 1,180.8 16.61% 1,216.4 17.10%
2,196.2 33.62% 2,254.5 34.01% 2,302.8 33.71% 2,394.0 34.47% Real estate trading, etc. 260.4 3.66% 240.1 3.37%
Total 6,531.7 100.00% 6,629.9 100.00% 6,832.1 100.00% 6,945.3 100.00% Leasing 169.5 2.39% 161.6 2.27%
451.9 6.36% 446.7 6.28%
213.8 3.01% 191.3 2.69%
2,473.0 34.79% 2,564.9 36.05%
Total 7,108.7 100.00% 7,115.8 100.00%
<不動産業向け> (\Billion) <不動産業向け> (\Billion)
07/9 08/3 08/9 09/3 09/9 10/3
Proportion Proportion Proportion Proportion Proportion Proportion
Real Estate Rental and Management 1,081.6 73.77% 1,101.0 74.88% 1,111.0 75.93% 1,142.4 79.19% 1,180.8 81.93% 1,216.4 83.51%
Apartment and condominium rentals 749.7 51.13% 765.1 52.03% 774.2 52.91% 809.1 56.09% 852.7 59.17% 891.9 61.23%
Office and Commercial rentals 246.8 16.84% 253.5 17.25% 253.8 17.35% 250.3 17.35% 247.9 17.20% 244.1 16.76% Land rental and Real estate management, etc 85.0 5.80% 82.3 5.60% 82.9 5.67% 82.9 5.75% 80.1 5.56% 80.3 5.52%
Real Estate Trading, etc 384.5 26.23% 369.3 25.12% 352.1 24.07% 300.1 20.81% Real Estate Trading, etc 260.4 18.07% 240.1 16.49%
Home construction and development 215.6 14.71% 206.5 14.04% 213.0 14.56% 165.0 11.44% 143.0 9.92% 128.3 8.81% Real estate brokerage and Land trading, etc 60.9 4.16% 64.9 4.42% 56.6 3.87% 49.9 3.46% 41.4 2.88% 41.0 2.82%
Public corporations 107.9 7.36% 97.8 6.66% 82.4 5.64% 85.2 5.91% 75.9 5.27% 70.7 4.86%
Total 1,466.2 100.00% 1,470.4 100.00% 1,463.2 100.00% 1,442.6 100.00% Total 1,441.2 100.00% 1,456.6 100.00%
Others (Mainly Consumer Loans)
Information and Communications
Medical, welfare and other serv icesGovernment, local public sector
Agriculture, Forestry, Fishery and Mining
Electricity, Gas, Heat Supply and Water
Information and Communications
Government and Local Public Sector
Electricity , Gas, Heat Supply and Water
Real estate brokerage and Land trading, etc
Public corporations
Apartment and condominium rentalsOffice and Commercial rentalsLand rental and Real estate management, etc
Home construction and development
Others (mainly consumer loans)
Real Estate Rental and Management
Loans, Borrowers Classified by IndustryDomestic OperationsDomestic Operations
Details of Loans to the Real Estate IndustryDetails of Loans to the Real Estate Industry
~09/3
~09/3 09/9~
09/9~
*Classification has changed since September 2009 because of the revision of Japan Standardized Industrial Classification.

Appendix-20
Profit Structure of Loans
Return After Capital CostReturn After Capital Cost*1
(2nd half of FY 09)
Small and medium-sized companies¥ 3.1 trillion
(43%)
Housing Loans¥ 2.4 trillion
(33%)
Consumer Loans¥ 0.1 trillion
(1%)
Average balance of loans
(Proportion)
Large & midsized enterprises¥ 1.3 trillion
(18%)
7.39%
Funding cost
Insurance premium and guarantee fee
(Housing and consumer loans only)
Credit cost
Capital cost
Return After capital cost(RACC)
Return After capital cost(RACC)
Actual yield of lending
0.48%
1.89%
0.32%
1.15%
3.55%3.55%
2.04%
0.98%
2.12%
(0.17%)(0.17%)
0.56%
0.33%
0.26%
0.31%0.31% 0.62%0.62%
0.62%
0.65%
0.46%
0.25%0.19%0.19%
0.87%
*4
*5
*2
*6
*3
*1.Before deducting operating costs*2.Average balance:Segmented by Internal management base. Housing loans are before securitization and consumer loans do not include credit cards.*3.Funding cost:Internal transfer rate ×Average balance*4.Insurance premium and guarantee fee: Actual expenditure. Only guarantee fees for external guarantee companies are included.*5.Credit cost:Internally used notional allowance. (EL=PD×LGD×balance)*6.Capital cost :Unexpected loss as of 10/3(UL:BaselⅡ base) ×5.1%÷(1-tax rate)

Appendix-21
Domestic Deposits - Balance(\Billion)
03/9 04/3 04/9 05/3 05/9 06/3 06/9 07/3 07/9 08/3 08/9 09/3 09/9 10/3Domestic deposits 7,130.8 7,177.0 7,260.2 7,465.5 7,596.6 7,799.0 7,815.2 8,146.9 8,077.1 8,222.6 8,293.8 8,405.7 8,519.4 8,663.4
Personal 5,480.9 5,511.3 5,576.2 5,642.5 5,760.6 5,882.7 5,951.3 6,107.2 6,224.9 6,367.8 6,489.4 6,594.0 6,693.8 6,762.2Corporate (incl. NGOs) 1,327.4 1,287.1 1,376.4 1,376.3 1,441.0 1,454.5 1,468.0 1,538.2 1,506.5 1,467.7 1,475.1 1,429.1 1,447.3 1,412.0National & local government 282.9 345.8 274.5 403.7 361.9 420.3 311.4 441.9 308.8 342.0 292.4 304.6 350.0 446.9Financial institutions (incl. BOJ) 39.4 32.6 33.0 42.8 33.0 41.3 84.3 59.5 36.7 44.9 36.7 77.8 28.1 42.1
Liquid deposits 4,211.4 4,311.2 4,389.3 4,609.9 4,742.4 4,984.5 4,941.5 5,208.9 4,970.5 5,035.2 4,954.0 5,057.5 5,056.2 5,263.9Current 163.1 169.8 163.6 190.9 192.4 211.8 192.6 204.5 184.5 175.9 169.4 177.8 162.9 176.2Savings 3,564.4 3,695.5 3,798.1 3,996.7 4,147.5 4,357.9 4,341.7 4,631.1 4,429.9 4,490.7 4,414.8 4,494.3 4,559.3 4,748.6
Personal 2,884.1 2,957.0 3,032.4 3,103.9 3,241.2 3,405.5 3,442.8 3,529.6 3,546.5 3,589.8 3,593.5 3,645.2 3,676.1 3,754.8Current 3.6 3.5 3.2 3.4 3.7 3.5 3.1 3.4 3.2 3.1 3.1 2.9 2.7 2.9Savings 2,512.7 2,601.1 2,686.9 2,772.1 2,918.1 3,089.0 3,138.9 3,234.1 3,260.5 3,312.4 3,324.0 3,381.9 3,418.8 3,501.5
Corporate (incl. NGOs) 1,035.9 1,000.9 1,079.7 1,079.1 1,146.6 1,144.9 1,147.4 1,208.1 1,132.0 1,090.3 1,090.1 1,054.4 1,083.0 1,049.4Current 135.8 154.5 150.3 178.0 180.6 197.9 181.2 193.1 173.4 165.7 159.2 169.0 153.7 166.8Savings 806.3 784.4 870.1 838.7 904.3 876.1 934.8 983.0 908.7 868.4 853.2 834.1 874.1 835.4
National & local government 252.7 321.4 245.4 385.5 325.5 396.7 271.1 415.9 259.4 314.2 237.8 282.5 271.7 420.3Current 6.7 3.7 3.0 0.8 0.5 0.3 0.5 0.5 0.6 0.4 0.4 0.7 1.3 1.5Savings 232.6 298.5 228.3 374.0 315.6 383.6 259.2 402.9 247.9 301.7 229.3 269.7 258.6 404.2
Financial institutions (incl. BOJ) 38.5 31.7 31.7 41.3 28.9 37.2 80.1 55.2 32.3 40.8 32.4 75.2 25.3 39.3Current 16.9 7.9 6.8 8.6 7.4 9.9 7.6 7.5 7.0 6.5 6.5 5.0 4.9 4.9Savings 12.6 11.3 12.7 11.7 9.3 8.9 8.6 10.9 12.7 8.1 8.1 8.5 7.6 7.3
Time deposits 2,859.7 2,795.4 2,790.1 2,769.6 2,776.1 2,752.3 2,815.6 2,889.4 3,059.5 3,133.1 3,286.2 3,284.4 3,397.2 3,330.5Personal 2,547.3 2,493.0 2,471.3 2,461.8 2,450.6 2,422.6 2,459.3 2,537.2 2,640.3 2,734.1 2,851.1 2,894.6 2,961.6 2,948.4Corporate (incl. NGOs) 281.3 277.1 288.5 288.0 285.1 301.9 311.7 321.8 365.5 367.1 376.2 365.0 354.5 352.5National & local government 30.1 24.3 29.0 18.1 36.3 23.6 40.3 26.0 49.4 27.7 54.6 22.1 78.3 26.6Financial institutions (incl. BOJ) 0.8 0.9 1.2 1.4 4.0 4.1 4.2 4.3 4.3 4.1 4.2 2.5 2.8 2.8
Foreign-currency deposits 59.6 70.3 80.6 85.7 77.9 61.6 57.5 48.0 46.5 53.7 53.1 63.4 65.6 68.5Personal 49.4 61.2 72.4 76.6 68.8 54.5 49.2 40.3 38.0 43.9 44.7 54.1 56.1 58.8Corporate (incl. NGOs) 10.1 9.0 8.1 8.9 9.1 7.1 8.3 7.6 8.5 9.8 8.3 9.3 9.4 9.7National & local government 0.0 0.0 0.0 0.0 0.0 0.0 0.0 0.0 0.0 0.0 0.0 0.0 0.0 0.0Financial institutions (incl. BOJ) 0.0 0.0 0.0 0.0 0.0 0.0 0.0 0.0 0.0 0.0 0.0 0.0 0.0 0.0
03/9 04/3 04/9 05/3 05/9 06/3 06/9 07/3 07/9 08/3 08/9 09/3 09/9 10/3Domestic deposits 7,130.8 7,177.0 7,260.2 7,465.5 7,596.6 7,799.0 7,815.2 8,146.9 8,077.1 8,222.6 8,293.8 8,405.7 8,519.4 8,663.4
Chiba Prefecture 6,911.8 6,973.1 7,056.3 7,254.4 7,377.6 7,568.0 7,543.5 7,912.0 7,844.4 7,961.4 8,054.3 8,113.7 8,225.3 8,402.5
Others 219.0 203.9 203.8 211.1 219.0 230.9 271.6 234.8 232.6 261.2 239.4 291.9 294.1 260.8
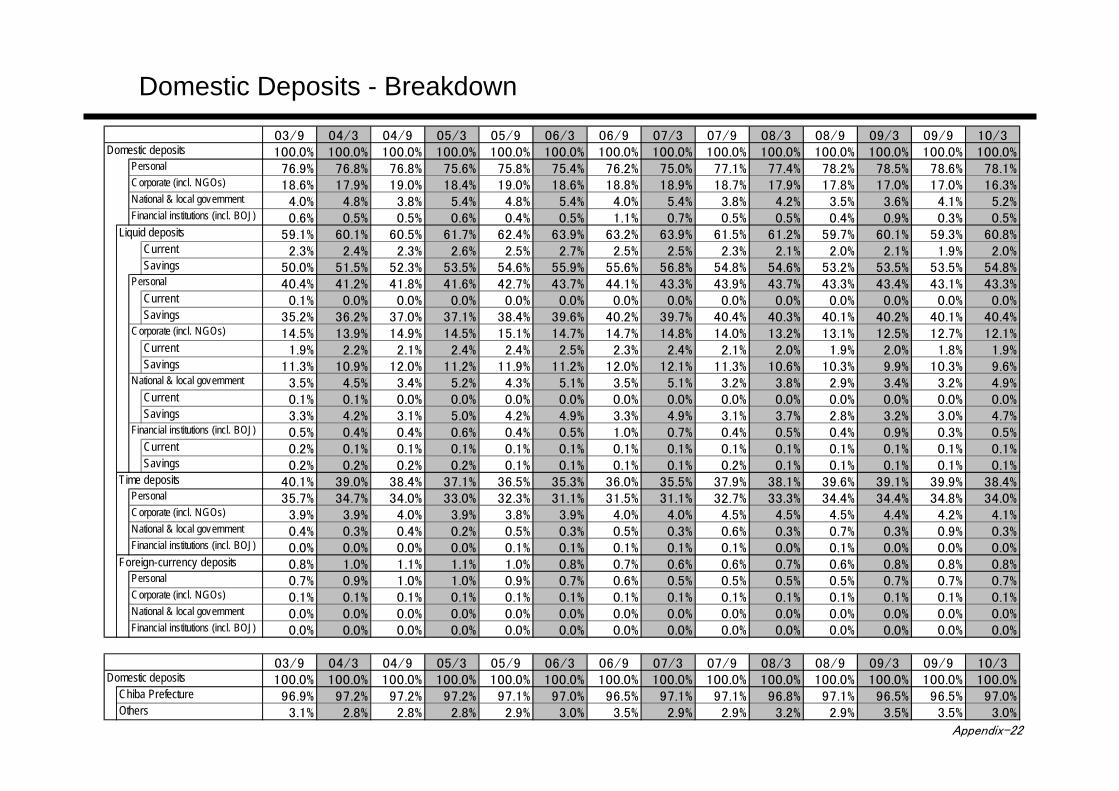
Appendix-22
Domestic Deposits - Breakdown
03/9 04/3 04/9 05/3 05/9 06/3 06/9 07/3 07/9 08/3 08/9 09/3 09/9 10/3Domestic deposits 100.0% 100.0% 100.0% 100.0% 100.0% 100.0% 100.0% 100.0% 100.0% 100.0% 100.0% 100.0% 100.0% 100.0%
Personal 76.9% 76.8% 76.8% 75.6% 75.8% 75.4% 76.2% 75.0% 77.1% 77.4% 78.2% 78.5% 78.6% 78.1%Corporate (incl. NGOs) 18.6% 17.9% 19.0% 18.4% 19.0% 18.6% 18.8% 18.9% 18.7% 17.9% 17.8% 17.0% 17.0% 16.3%National & local government 4.0% 4.8% 3.8% 5.4% 4.8% 5.4% 4.0% 5.4% 3.8% 4.2% 3.5% 3.6% 4.1% 5.2%Financial institutions (incl. BOJ) 0.6% 0.5% 0.5% 0.6% 0.4% 0.5% 1.1% 0.7% 0.5% 0.5% 0.4% 0.9% 0.3% 0.5%
Liquid deposits 59.1% 60.1% 60.5% 61.7% 62.4% 63.9% 63.2% 63.9% 61.5% 61.2% 59.7% 60.1% 59.3% 60.8%Current 2.3% 2.4% 2.3% 2.6% 2.5% 2.7% 2.5% 2.5% 2.3% 2.1% 2.0% 2.1% 1.9% 2.0%Savings 50.0% 51.5% 52.3% 53.5% 54.6% 55.9% 55.6% 56.8% 54.8% 54.6% 53.2% 53.5% 53.5% 54.8%
Personal 40.4% 41.2% 41.8% 41.6% 42.7% 43.7% 44.1% 43.3% 43.9% 43.7% 43.3% 43.4% 43.1% 43.3%Current 0.1% 0.0% 0.0% 0.0% 0.0% 0.0% 0.0% 0.0% 0.0% 0.0% 0.0% 0.0% 0.0% 0.0%Savings 35.2% 36.2% 37.0% 37.1% 38.4% 39.6% 40.2% 39.7% 40.4% 40.3% 40.1% 40.2% 40.1% 40.4%
Corporate (incl. NGOs) 14.5% 13.9% 14.9% 14.5% 15.1% 14.7% 14.7% 14.8% 14.0% 13.2% 13.1% 12.5% 12.7% 12.1%Current 1.9% 2.2% 2.1% 2.4% 2.4% 2.5% 2.3% 2.4% 2.1% 2.0% 1.9% 2.0% 1.8% 1.9%Savings 11.3% 10.9% 12.0% 11.2% 11.9% 11.2% 12.0% 12.1% 11.3% 10.6% 10.3% 9.9% 10.3% 9.6%
National & local government 3.5% 4.5% 3.4% 5.2% 4.3% 5.1% 3.5% 5.1% 3.2% 3.8% 2.9% 3.4% 3.2% 4.9%Current 0.1% 0.1% 0.0% 0.0% 0.0% 0.0% 0.0% 0.0% 0.0% 0.0% 0.0% 0.0% 0.0% 0.0%Savings 3.3% 4.2% 3.1% 5.0% 4.2% 4.9% 3.3% 4.9% 3.1% 3.7% 2.8% 3.2% 3.0% 4.7%
Financial institutions (incl. BOJ) 0.5% 0.4% 0.4% 0.6% 0.4% 0.5% 1.0% 0.7% 0.4% 0.5% 0.4% 0.9% 0.3% 0.5%Current 0.2% 0.1% 0.1% 0.1% 0.1% 0.1% 0.1% 0.1% 0.1% 0.1% 0.1% 0.1% 0.1% 0.1%Savings 0.2% 0.2% 0.2% 0.2% 0.1% 0.1% 0.1% 0.1% 0.2% 0.1% 0.1% 0.1% 0.1% 0.1%
Time deposits 40.1% 39.0% 38.4% 37.1% 36.5% 35.3% 36.0% 35.5% 37.9% 38.1% 39.6% 39.1% 39.9% 38.4%Personal 35.7% 34.7% 34.0% 33.0% 32.3% 31.1% 31.5% 31.1% 32.7% 33.3% 34.4% 34.4% 34.8% 34.0%Corporate (incl. NGOs) 3.9% 3.9% 4.0% 3.9% 3.8% 3.9% 4.0% 4.0% 4.5% 4.5% 4.5% 4.4% 4.2% 4.1%National & local government 0.4% 0.3% 0.4% 0.2% 0.5% 0.3% 0.5% 0.3% 0.6% 0.3% 0.7% 0.3% 0.9% 0.3%Financial institutions (incl. BOJ) 0.0% 0.0% 0.0% 0.0% 0.1% 0.1% 0.1% 0.1% 0.1% 0.0% 0.1% 0.0% 0.0% 0.0%
Foreign-currency deposits 0.8% 1.0% 1.1% 1.1% 1.0% 0.8% 0.7% 0.6% 0.6% 0.7% 0.6% 0.8% 0.8% 0.8%Personal 0.7% 0.9% 1.0% 1.0% 0.9% 0.7% 0.6% 0.5% 0.5% 0.5% 0.5% 0.7% 0.7% 0.7%Corporate (incl. NGOs) 0.1% 0.1% 0.1% 0.1% 0.1% 0.1% 0.1% 0.1% 0.1% 0.1% 0.1% 0.1% 0.1% 0.1%National & local government 0.0% 0.0% 0.0% 0.0% 0.0% 0.0% 0.0% 0.0% 0.0% 0.0% 0.0% 0.0% 0.0% 0.0%Financial institutions (incl. BOJ) 0.0% 0.0% 0.0% 0.0% 0.0% 0.0% 0.0% 0.0% 0.0% 0.0% 0.0% 0.0% 0.0% 0.0%
03/9 04/3 04/9 05/3 05/9 06/3 06/9 07/3 07/9 08/3 08/9 09/3 09/9 10/3Domestic deposits 100.0% 100.0% 100.0% 100.0% 100.0% 100.0% 100.0% 100.0% 100.0% 100.0% 100.0% 100.0% 100.0% 100.0%
Chiba Prefecture 96.9% 97.2% 97.2% 97.2% 97.1% 97.0% 96.5% 97.1% 97.1% 96.8% 97.1% 96.5% 96.5% 97.0%Others 3.1% 2.8% 2.8% 2.8% 2.9% 3.0% 3.5% 2.9% 2.9% 3.2% 2.9% 3.5% 3.5% 3.0%

Appendix-23
Expansion of Personal Deposits
5,882.7
6,107.2
6,367.8
6,594.0
6,762.2
2,838.1
2,972.8
3,170.5
3,325.1
3,484.6
4,000
4,500
5,000
5,500
6,000
6,500
06/3 07/3 08/3 09/3 10/3
2,000
2,500
3,000
3,500
4,000
(¥ Bil.)
814 830 850 854 852
334347
365 384 407
1,1481,178
1,2161,238
1,260
300
600
900
1,200
06/3 07/3 08/3 09/3 10/3
(¥ Bil.)
(Thousandaccounts)
Personal depositsPersonal deposits Accounts with autoAccounts with auto--pension transfer pension transfer and autoand auto--salary transfersalary transfer
Balance of accounts withBalance of accounts withautoauto--pension transfer andpension transfer and
autoauto--salary transfersalary transfer
Accounts withAccounts withautoauto--pension transferpension transfer
Accounts withAccounts withautoauto--salary transfersalary transfer

Appendix-24
(\Billion)
03/9 04/3 04/9 05/3 05/9 06/3 06/9 07/3 07/9 08/3 08/9 09/3 09/9 10/3
Investment trusts 222.3 265.5 314.9 361.6 411.4 444.1 510.2 576.1 625.0 554.5 534.6 413.5 480.8 505.7
Bond funds 40.6 36.7 30.8 29.4 26.5 19.0 19.8 15.5 15.0 14.0 13.5 9.5 9.1 8.3
Stock funds 181.6 228.7 284.1 332.1 384.9 425.0 490.4 560.5 610.0 540.4 521.0 403.9 471.6 497.4
Personal Investors 216.6 259.4 307.7 353.4 403.0 435.7 501.7 566.4 615.0 544.2 524.2 405.1 471.7 496.2
Bond funds 37.0 33.4 27.8 26.9 24.0 16.9 17.8 13.6 13.2 12.4 12.0 8.1 7.7 7.1
Stock funds 179.5 226.0 279.9 326.5 378.9 418.7 483.8 552.7 601.8 531.8 512.2 396.9 463.9 489.0
(\Billion)
03/9 04/3 04/9 05/3 05/9 06/3 06/9 07/3 07/9 08/3 08/9 09/3 09/9 10/3
Foreign-currency deposits 59.6 70.3 80.6 85.7 77.9 61.6 57.5 48.0 46.5 53.7 53.1 63.4 65.6 68.5
Personal 49.4 61.2 72.4 76.6 68.8 54.5 49.2 40.3 38.0 43.9 44.7 54.1 56.1 58.8
Corporate 10.1 9.0 8.1 8.9 9.1 7.1 8.3 7.6 8.5 9.8 8.3 9.3 9.4 9.7
National & local governments 0.0 0.0 0.0 0.0 0.0 0.0 0.0 0.0 0.0 0.0 0.0 0.0 0.0 0.0
Financial institutions 0.0 0.0 0.0 0.0 0.0 0.0 0.0 0.0 0.0 0.0 0.0 0.0 0.0 0.0
(\Billion)
03/9 04/3 04/9 05/3 05/9 06/3 06/9 07/3 07/9 08/3 08/9 09/3 09/9 10/3
Personal annuities* 92.8 154.7 200.5 240.0 278.3 312.7 343.4 371.7 411.3 446.6 498.3 529.8 578.6 653.6
Variable 11.4 22.8 46.2 65.8 91.7 122.3 151.1 177.9 215.9 248.1 296.1 324.8 362.0 375.6
Fixed 81.3 131.9 154.3 174.1 186.5 190.1 190.9 191.5 192.1 193.3 195.3 196.9 205.6 219.8
Whole Life Insurance - - - - - 0.3 1.3 2.2 3.2 5.1 6.8 8.0 10.9 58.1*Totals are an accumulation from October 2002. (\Billion)
03/9 04/3 04/9 05/3 05/9 06/3 06/9 07/3 07/9 08/3 08/9 09/3 09/9 10/3
Public bonds 181.8 167.7 170.1 174.7 184.3 194.6 213.5 188.1 202.8 204.9 224.5 218.1 227.0 225.3
Personal 147.0 138.5 139.9 146.3 154.0 167.4 173.9 160.9 171.3 177.1 188.4 193.4 198.9 202.4
Financial Products

Appendix-25
(\Billion)
03/9 04/3 04/9 05/3 05/9 06/3 06/9 07/3 07/9 08/3 08/9 09/3 09/9 10/3
1,255.1 1,104.9 1,028.0 993.9 1,060.9 1,062.2 1,117.0 1,094.6 1,136.8 1,131.5 1,222.2 1,254.6 1,339.7 1,373.5
Assets Requiring Caution 946.8 893.9 856.1 840.0 922.3 946.4 1,006.6 990.5 1,038.2 1,036.6 1,126.8 1,157.4 1,240.8 1,284.0
Other Assets RequiringCaution 717.3 702.3 680.1 685.9 779.5 816.0 882.5 873.8 933.7 922.0 1,004.9 1,088.8 1,162.1 1,216.2
Substandard Assets 229.4 191.6 175.9 154.0 142.8 130.4 124.0 116.6 104.4 114.6 121.8 68.6 78.6 67.7
Potentially Bankrupt Assets 175.9 171.5 135.6 122.5 111.7 90.3 82.3 77.1 71.4 65.4 60.0 61.2 65.6 60.6
132.3 39.4 36.2 31.3 26.8 25.3 28.0 27.0 27.0 29.3 35.3 35.9 33.3 28.9
Normal Assets* 4,657.5 4,695.9 4,747.8 5,007.6 4,854.7 5,224.7 5,391.1 5,460.1 5,573.2 5,696.0 5,829.4 5,903.4 5,955.5 5,906.5
Total 5,912.7 5,800.8 5,775.8 6,001.6 5,915.7 6,286.9 6,508.1 6,554.8 6,710.0 6,827.5 7,051.6 7,158.1 7,295.3 7,280.1
(\Billion)
03/9 04/3 04/9 05/3 05/9 06/3 06/9 07/3 07/9 08/3 08/9 09/3 09/9 10/3
477.1 361.4 311.5 276.0 252.3 226.4 215.6 202.3 185.9 186.6 193.0 152.2 158.0 143.1
132.3 39.4 36.2 31.3 26.8 25.3 28.0 27.0 27.0 29.3 35.3 35.9 33.3 28.9
175.9 171.5 135.6 122.5 111.7 90.3 82.3 77.1 71.4 65.4 60.0 61.2 65.6 60.6
168.7 150.3 139.6 122.1 113.7 110.6 105.2 98.1 87.4 91.8 97.6 55.0 59.1 53.5
Normal Claims 5435.6 5439.4 5464.3 5725.6 5663.3 6060.5 6292.5 6352.4 6524.0 6640.9 6858.6 7005.8 7137.2 7137.0
Total 5912.7 5800.8 5775.8 6001.6 5915.7 6286.9 6508.1 6554.8 6710.0 6827.5 7051.6 7158.1 7295.3 7280.1
8.06% 6.23% 5.39% 4.59% 4.26% 3.60% 3.31% 3.08% 2.77% 2.73% 2.73% 2.12% 2.16% 1.96%Proportion to total claims
Assets Requiring Caution or worse
Bankrupt and Ef f ectiv elyBankrupt Assets
Disclosed Claims under theFinancial Reconstruction Law
Bankrupt and SubstantiallyBankrupt Claims
Doubtf ul Claims
Substandard Claims
Loans Disclosed under Self-Assessment and the Financial Reconstruction Law
*Including loans with no debtor classification.
*From March 2004, disclosed claims are after partial direct write-offs.
SelfSelf--Assessment Results (NonAssessment Results (Non--consolidated)consolidated)
Disclosed Claims under the Financial Reconstruction Law (NonDisclosed Claims under the Financial Reconstruction Law (Non--consolidated)consolidated)

Appendix-26
(Billion)
Factors for Fluctuations in Assets Requiring Caution
AssetsRequiring Caution(120.7)
Normal
RepaymentNew
Loans Made
92.4
56.0
4.522.7
298.5
123.2
FY 08(08/3→09/3)
Downgraded
FY 07(07/3→08/3)
Normal
New Loans Made
AssetsRequiring Caution(46.1)
Downgraded
Repayment
52.8 122.4
92.6221.2
5.017.6
Analysis of yearly net change of Assets Requiring CautionAnalysis of yearly net change of Assets Requiring Caution(including Substandard loans)
FY 09(09/3→10/3)
Normal
New Loans Made
AssetsRequiring Caution(126.5)
Repayment
Downgraded
331.4 82.7
6.128.2
54.2

Appendix-27
(¥Billion) (¥Billion)
1.7 1.4 1.30.6
1.0 1.3 1.1
4.0
1.31.7
0.6 0.8 0.9
60
80
112
9199
6276
105110
154
78
51
102
0.0
2.0
4.0
6.0
8.0
10.0
12.0
14.0
16.0
2H/0
3
1H/0
4
2H/0
4
1H/0
5
2H/0
5
1H/0
6
2H/0
6
1H/0
7
2H/0
7
1H/0
8
2H/0
8
1H/0
9
2H/0
9
0
100
200
4.94.4
8.0
5.25.56.05.9
4.7
7.3
4.9
6.2
9.8
11.0194 193 199
161 164
363
306
242
186
209
183195 193
0.0
5.0
10.0
15.0
20.0
2H/0
3
1H/0
4
2H/0
4
1H/0
5
2H/0
5
1H/0
6
2H/0
6
1H/0
7
2H/0
7
1H/0
8
2H/0
8
1H/0
9
2H/0
9-100
0
100
200
300
400
500
Disposal of Collateral
(Cases)
Amount of recoveriesAmount of recoveries
Number of recoveriesNumber of recoveries
Amount of recoveriesAmount of recoveries
Recoveries through SalesRecoveries through Sales(Included in the left-hand chart)
Recoveries through AuctionsRecoveries through Auctions
(Cases)
Number of recoveriesNumber of recoveries

Appendix-28
Efforts to Facilitate Financing
Requests to revise loan terms, etc. (based on legal disclosure)Requests to revise loan terms, etc. (based on legal disclosure)
[As of Dec. 31, 2009]
Revised Refused Under evaluation Withdrawn
Cases 1,050 323 4 715 8
Total (\ Mil.) 26,909 8,591 45 18,163 109
Revised Refused Under evaluation Withdrawn
Cases 94 17 1 75 1
Total (\ Mil.) 1,526 275 40 1,200 9
[As of Mar. 31, 2010]
Revised Refused Under evaluation Withdrawn
Cases 6,176 4,542 11 1,302 321
Total (\ Mil.) 167,210 125,066 196 34,109 7,838
Revised Refused Under evaluation Withdrawn
Cases 543 353 1 157 32
Total (\ Mil.) 8,327 5,580 40 2,227 479
Applications
Small andmedium-sizedenterprises
Term
09/12/4~10/3/31
Residentialmortgageborrowers
Term
09/12/4~10/3/31
Small andmedium-sizedenterprises 09/12/4
~09/12/30
Residentialmortgageborrowers
Term
09/12/4~09/12/30
ApplicationsTerm
Applications
Applications
※Figures after the decimal point are omitted

Appendix-29
Capital Ratio
07/9 08/3 08/9 09/3 09/9 10/3
(a) (b) (c) (c)-(a) (c)-(b)Capital ratio 11.22% 11.72% 10.74% 11.12% 12.02% 12.14% 1.02% 0.12%
TierⅠratio 9.58% 10.26% 9.82% 9.62% 10.61% 10.78% 1.16% 0.17%
Capital (\ Bil.) 580.3 579.7 547.3 565.2 599.6 611.8 46.6 12.2
Tier I 495.6 507.8 500.3 488.9 529.7 543.1 54.2 13.4
Risk Assets (\ Bil.) 5,170.0 4,946.3 5,092.7 5,082.7 4,988.2 5,038.8 (43.9) 50.5
Credit risk 4,836.1 4,590.0 4,721.7 4,690.2 4,592.4 4,637.6 (52.6) 45.2
Market risk 48.3 64.6 70.6 86.6 88.0 94.1 7.5 6.1
Operational risk 285.5 291.6 300.4 305.8 307.7 306.9 1.1 (0.8)
Consolidated
07/9 08/3 08/9 09/3 09/9 10/3
(a) (b) (c) (c)-(a) (c)-(b)Capital ratio 11.66% 12.20% 11.31% 11.70% 12.71% 12.80% 1.09% 0.09%
TierⅠratio 10.00% 10.72% 10.35% 10.17% 11.25% 11.39% 1.22% 0.13%
Capital (\ Bil.) 612.4 617.7 586.4 604.4 641.3 653.8 49.3 12.4
Tier I 525.2 542.6 536.7 525.2 567.9 581.9 56.7 13.9
Risk Assets (\ Bil.) 5,252.0 5,060.2 5,182.1 5,162.3 5,045.0 5,106.1 (56.1) 61.0
Credit risk 4,893.8 4,665.3 4,787.5 4,747.9 4,627.8 4,683.9 (64.0) 56.0
Market risk 48.5 64.8 70.8 86.7 88.1 94.3 7.5 6.2
Operational risk 309.6 315.6 323.7 327.5 329.0 327.9 0.3 (1.1)

Appendix-30
Risk Capital Allocation
Capital forallocation
Credit riskCredit risk¥¥185.0 185.0 bilbil..
Market riskMarket risk
¥¥220.0 220.0 bilbil..
Operational riskOperational risk¥¥25.0 25.0 bilbil..
Domestic BusinessDomestic Business¥¥188.0 188.0 bilbil..
Treasury BusinessTreasury Business¥¥159.4 159.4 bilbil..
ALMALM
¥¥113.0 113.0 bilbil..
OthersOthers((Strategic holdings Strategic holdings
of stocks etcof stocks etc))
¥¥164.4 164.4 bilbil..
Integrated Integrated managementmanagement
((totally managedtotally managed))
¥¥194.8 194.8 bilbil..
TTierierⅠⅠ
¥¥529.0 529.0 bilbil..**
*Amount forecasted at allocation.
Domestic BusinessDomestic Business¥¥64.0 64.0 bilbil..
Treasury BusinessTreasury Business¥¥8.7 8.7 bilbil..
ALMALM
¥¥10.2 10.2 bilbil..
OthersOthers((Strategic holdings Strategic holdings
of stocks etcof stocks etc))
¥¥1.3 1.3 bilbil..
80% of Tier ⅠCapped with "Core Capital" (TierⅠ excluding tax effect, etc.)
Confidence interval 99.9% Holding period 1year
Credit riskUL + Changes in EL + Direct write offs + Losses on salesof claims
Maket risk VaR + Changes in unrealized gains + gain/loss on sales
Opreational risk Basel Ⅱ basis
Capital forallocationIntegrated riskcapital
Interest rate risks in banking business ① \ 37.0 Bil.
TierⅠ + TierⅡ ② \ 627.2 Bil.
Outlier ratio ①/② 5.9%
8080%% of of TTierierⅠⅠ¥¥473.0 473.0 bilbil..**
Tax effect, etc.Tax effect, etc.
¥¥56.0 56.0 bilbil..
Risk Capital AllocationRisk Capital Allocation
Outlier Standard(10/3)
Confirmed [Interest rate risks in banking business<20% of capital]
**Interest rate shockInterest rate shock:: 99 percentile99 percentile
Risk capital allocation for first half of FY 10Risk capital allocation for first half of FY 10
Risk capital allocated by risk category
Risk capital allocated by internal sector
Earnings Projectionsby internal sector

Appendix-31
Strengthening staff training
Upgrading the work skills of new employeesUpgrading the work skills of new employees
Employed for less than Employed for less than five yearsfive years
About 30About 30%%
OJTOJT
Results-oriented trainingResults-oriented training+
Proportion of employeesProportion of employees((10/510/5))
Improving of business and management skillsImproving of business and management skills
Mentoring support system
The closest supporter
recruitrecruit
2nd-year or 3rd-year
employees
2nd-year or 3rd-year
employees
Early upgrading of work skills and competitive skillsEarly upgrading of work skills and competitive skills
Expansion of training for freshmen
Expansion of training for freshmen
Newly-instituted training for 2nd-year employees
Newly-instituted training for 2nd-year employees
09/4~
09/4~
Support for midSupport for mid--career/senior employees career/senior employees
and female employeesand female employees
BranchesBranches
Visiting and passing on know-how directly
Head officeHead office
Humanity training for managers
One night-stay humanity training at Kencho-ji Temple in Kamakura
09/8~
40
60
80
09/3 10/3
(people)
Increasing the assignment of Increasing the assignment of
midmid--career/senior employeescareer/senior employees
to branchesto branches
Certified as a company which is creating an environment for work-life balance according to the Act for Measures to Support the Development of the Next Generation.
09/5
Revival of companies
Revival of companies
Deposit activities
Deposit activities
Finance activities
Finance activities
Development of facilities for training of finance specialists
Development of facilities for training of finance specialists
Progress of on-the-job trainingProgress of on-the-job training
10/4~
10/4~

Appendix-32
CSR activities
The Chiba Bank is actively promoting corporate social responsibility for continual regional growth.
Strengthen the financial intermediation functions
(Main business)
Offering smooth and expeditious financing mainly for small and mid-sized companies.
Contributing to the local community
(social contribution activities)
Working to contribute to “people”“environment” and “industry” under our policy “cultivating the future.”
Improve the development of human resources
Having all group employees work in unison to improve customer satisfaction and is expanding its efforts in this area.
Progress in customer satisfaction
Compliance
CSR PolicyCSR Policy
Recent Social Contribution activitiesRecent Social Contribution activities
09/10CSR Promotion
office set up.
Cultivating “people”Cultivating “people” Cultivating “industry”Cultivating “industry”Cultivating “environment”Cultivating “environment”
Economic Quiz Contest (09/11~)
Financial class at junior high school (09/11~)
Public trust “Chibagin HeartfulWelfare fund” (09/11~)
Holding seminar to encourage return to work (09/12~)
Participation in the “Enterprise for
the cooperation between businesses to promote cancer medical examinations in Chiba Prefecture”(09/12~)
Placing a greenery on the roof of branches (starting with the renewed Kinshicho branch)(09/12~)
Introduce LED lightning for illuminated poster cases. (starting with renewed Kinshicho branch) (09/12~)
Preservation of “the third Chibaginforest” in Shirako-machi, Chosei-gun
(10/3~)
Expansion of loans for eco-housing (10/4~)
Agribusiness seminar (09/11~)
Tourism business talk association (09/12~)
Presentations on local information (national sports events, tourism) through in-branch video displays

Appendix-33
Branch Network
Name of Bank 10/3
Chiba Bank 155
Chiba Kogyo Bank 71
Keiyo Bank 117
Bank of Tokyo-Mitsubishi UFJ 26
Mizuho Bank 25
Sumitomo Mitsui Banking Corporation 22
Resona Bank 12
10/3change
from 05/3Outlets 175 +13
Domestic 172 +13
Chiba Pref. 155 +5
Others 17 +8
Overseas 3 0Money exchange counters 3 +1
Representative off ice 1 0
Chiba BankChiba Bank’’s Branch Network (Domestic)s Branch Network (Domestic) Number of Offices in Chiba PrefectureNumber of Offices in Chiba Prefecture
Total number of Chiba Bank outletsTotal number of Chiba Bank outlets
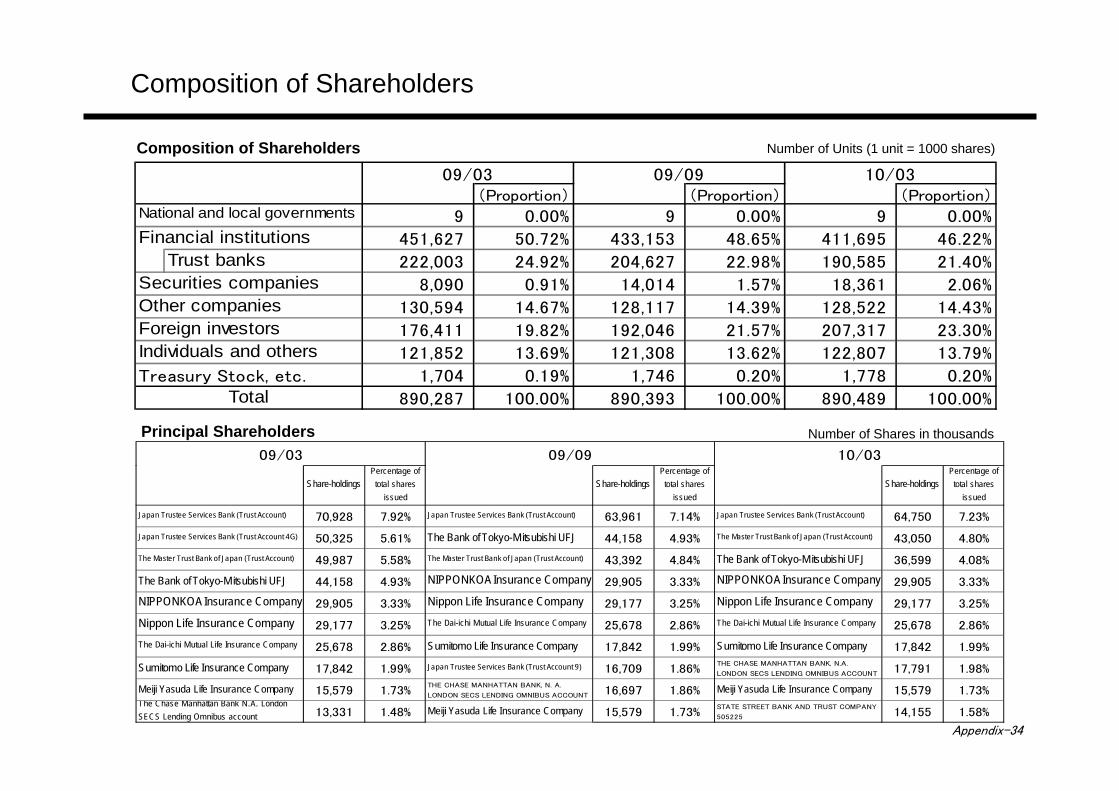
Appendix-34
09/03 09/09 10/03(Proportion) (Proportion) (Proportion)
9 0.00% 9 0.00% 9 0.00%Financial institutions 451,627 50.72% 433,153 48.65% 411,695 46.22%
Trust banks 222,003 24.92% 204,627 22.98% 190,585 21.40%Securities companies 8,090 0.91% 14,014 1.57% 18,361 2.06%Other companies 130,594 14.67% 128,117 14.39% 128,522 14.43%Foreign investors 176,411 19.82% 192,046 21.57% 207,317 23.30%Individuals and others 121,852 13.69% 121,308 13.62% 122,807 13.79%
Treasury Stock, etc. 1,704 0.19% 1,746 0.20% 1,778 0.20%Total 890,287 100.00% 890,393 100.00% 890,489 100.00%
National and local governments
09/03 09/09 10/03
Share-holdingsPercentage oftotal shares
issuedShare-holdings
Percentage oftotal shares
issuedShare-holdings
Percentage oftotal shares
issued
Japan Trustee Services Bank (Trust Account) 70,928 7.92% Japan Trustee Services Bank (Trust Account) 63,961 7.14% Japan Trustee Services Bank (Trust Account) 64,750 7.23%
Japan Trustee Services Bank (Trust Account 4G) 50,325 5.61% The Bank of Tokyo-Mitsubishi UFJ 44,158 4.93% The Master Trust Bank of Japan (Trust Account) 43,050 4.80%
The Master Trust Bank of Japan (Trust Account) 49,987 5.58% The Master Trust Bank of Japan (Trust Account) 43,392 4.84% The Bank of Tokyo-Mitsubishi UFJ 36,599 4.08%
The Bank of Tokyo-Mitsubishi UFJ 44,158 4.93% NIPPONKOA Insurance Company 29,905 3.33% NIPPONKOA Insurance Company 29,905 3.33%
NIPPONKOA Insurance Company 29,905 3.33% Nippon Life Insurance Company 29,177 3.25% Nippon Life Insurance Company 29,177 3.25%
Nippon Life Insurance Company 29,177 3.25% The Dai-ichi Mutual Life Insurance Company 25,678 2.86% The Dai-ichi Mutual Life Insurance Company 25,678 2.86%
The Dai-ichi Mutual Life Insurance Company 25,678 2.86% Sumitomo Life Insurance Company 17,842 1.99% Sumitomo Life Insurance Company 17,842 1.99%
Sumitomo Life Insurance Company 17,842 1.99% Japan Trustee Services Bank (Trust Account 9) 16,709 1.86%THE CHASE MANHATTAN BANK, N.A.
LONDON SECS LENDING OMNIBUS ACCOUNT 17,791 1.98%
Meiji Yasuda Life Insurance Company 15,579 1.73%THE CHASE MANHATTAN BANK, N. A.
LONDON SECS LENDING OMNIBUS ACCOUNT 16,697 1.86% Meiji Yasuda Life Insurance Company 15,579 1.73%The Chase Manhattan Bank N.A. LondonSECS Lending Omnibus account 13,331 1.48% Meiji Yasuda Life Insurance Company 15,579 1.73%
STATE STREET BANK AND TRUST COMPANY
505225 14,155 1.58%
Composition of Shareholders
Composition of Shareholders Number of Units (1 unit = 1000 shares)
Principal Shareholders Number of Shares in thousands

Appendix-35
Changes in Composition of Shareholders
16.0 15.8 15.7 15.4 15.2 14.9 14.9 15.2 15.5 15.7 15.517.0 16.8
13.6 13.7
8.6 8.6 8.9 9.210.4 10.3 10.2 9.8 9.7 10.0 9.6
10.5
14.2
21.1 21.2 21.9
23.9 24.4 23.9
21.520.1 20.3
21.4
3.3 3.8 3.9 4.2 4.2 4.7 4.4 4.4 4.6 4.4 4.83.0
5.94.9
10.6
8.0 7.4 7.38.6
10.4
13.5
26.0
19.821.5
46.3 46.3 46.4 46.3 45.9 46.1 46.5 47.0 46.5 46.5 47.146.1
40.6 40.2
36.037.6 37.7 37.7 37.0
32.530.9
29.7 29.228.1
25.9 26.3 26.1 26.3 26.627.5 26.7 27.2 26.8
25.6 25.2 24.9 24.7 24.2 23.7 23.7 23.4 23.4 23.2 22.7 23.122.3 22.1
19.9
15.0 15.0 14.7 14.8 14.6 14.416.5
11.811.3
14.1
15.414.514.714.514.4
13.614.8
12.9 12.2
14.3
11.912.912.2
13.6
21.822.0
18.420.116.0
20.421.7
24.921.4
22.924.725.2
19.5
21.5
15.9
23.524.4
24.2
23.3
18.817.7 17.5
16.8 16.619.0
16.416.6
19.715.6 15.3 14.3
0
5
10
15
20
25
30
35
40
45
50
94/3 95/3 96/3 97/3 98/3 99/3 00/3 01/3 02/3 03/3 04/3 05/3 06/3 07/3 08/3 09/3 10/3
Personal investors, others
Trust banks
Foreign Investors
Financial institutions (excl. trust banks, incl. securities companies)
Domestic enterprises
Share sell-offs
Public Offering
(%)

Appendix-36
Recent News
2009 May.12 Accredited as “general business operator” in conformity with the Law for Measures to Support the Development of the Next Generation
Jun.26 Revision of the management structure and organization of headquartersJul.1 Started new brand advertising campaignJul.21 “Kanamachi Branch” moved to new building
Sep.14 Added prepayment and interest rate choice application functions for housing loans to the personal internet banking service
Sep.17 Started handling insurance products by mailSep.28 Certified in the “CO2 absorption program through forestry activities” by Chiba Prefecture (the first certificated entity)
Oct.1 Established CSR Promotion OfficeNov.4 Held “Chibagin Agri-business seminar”Nov.10 Started an alliance with the “Organization for Small & Medium Enterprises and Regional Innovation” Kanto Branch
Nov.13 Founded the Committee for Facilitating Financing Nov.30 Set up the public trust “Chibagin Heartful Welfare Fund”
Dec.14 “Kinshicho Branch” moved to new building Dec.16 Held the First Chiba Tourism Business Talk Association2010 Jan.7 Complete renewal of a Bank’s homepage Jan.29 Established a Financing Facilitation Policy Jan.29 Held the “Shanghai Business Exchange meeting 2010” Mar.8 Started a new telephone banking system Mar.18 Expanded privileges for stockholders (set up a new financing course) Mar.28 Planted trees at the third Chibagin forest Apr.19 Added prepayment and interest rate choice application functions for housing loans to the personal internet service for
cash card customers May 14 Announced the name change for Chuo Securities and the relocation of the head office May 14 Announced the abolition of the retirement lump-sum plan for directors and the introduction of stock options

Inquiries related to this presentation should be addressed to
The Chiba Bank, Ltd.Corporate Planning Division
Investor Relations
Tel:(81) 43-301-8147Fax:(81) 43-242-9121
e-mail:[email protected]
This material contains forward-looking statements. These statements are not represented as providing a guarantee of the Bank’s future performance, and actual results may be subject to risks and uncertainties. Please note that future performance may be different from the views presented here owing to changes in the operating environment and other factors.