
Financial Results & Business Update · 2020. 1. 24. · (Security code #6787) May 21, 2014...
28
(Security code #6787) May 21, 2014 Financial Results & Business Update FY2013 (Ended March 31, 2014)
Transcript of Financial Results & Business Update · 2020. 1. 24. · (Security code #6787) May 21, 2014...
(Security code #6787) May 21, 2014
Financial Results & Business Update
FY2013 (Ended March 31, 2014)

1
1
2
FY2013 Summary
FY2014 Forecast
2
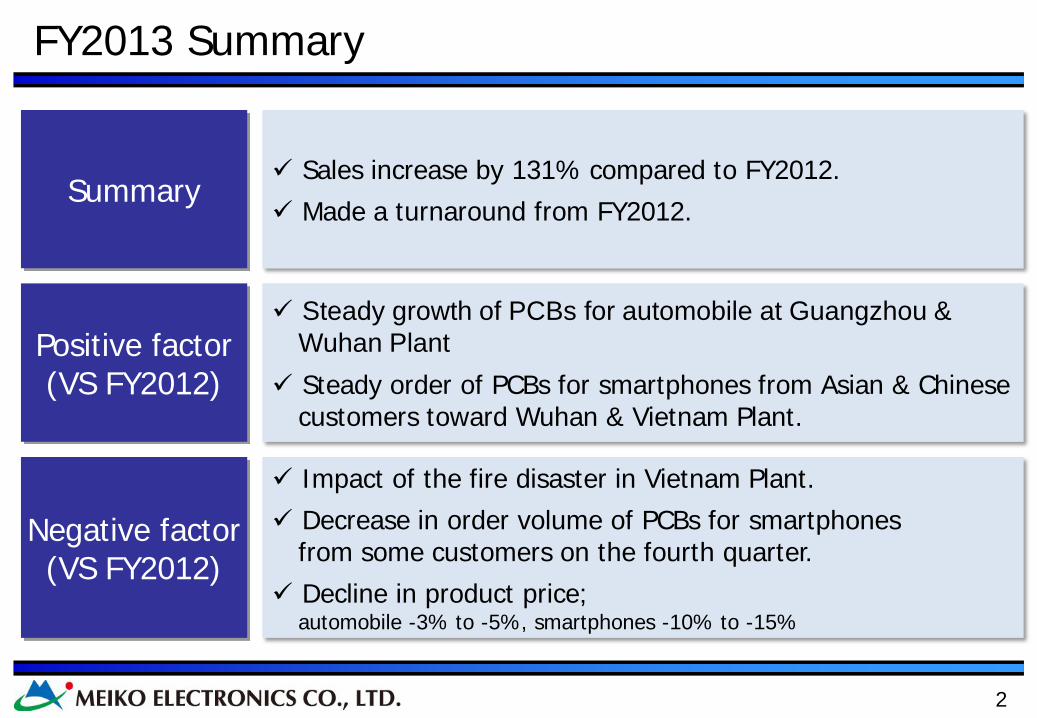
FY2013 Summary
Sales increase by 131% compared to FY2012. Made a turnaround from FY2012.
Summary
Positive factor (VS FY2012)
Negative factor (VS FY2012)
Steady growth of PCBs for automobile at Guangzhou & Wuhan Plant
Steady order of PCBs for smartphones from Asian & Chinese customers toward Wuhan & Vietnam Plant.
Impact of the fire disaster in Vietnam Plant. Decrease in order volume of PCBs for smartphones
from some customers on the fourth quarter. Decline in product price;
automobile -3% to -5%, smartphones -10% to -15%

3
FY2013 Consolidated Financial Results
FY2013 results
FY2012 results
YoY Growth margin
Net sales 79,231 60,709 18,522 130.5%
Operating income
1.2% 922 -1.0% -605 1,527 -
Ordinary income
2.4% 1,931 -0.6% -386 2,317 -
Net income 0.0% 23 -2.6% -1,567 1,590 -
(unit: million of JPY)
4
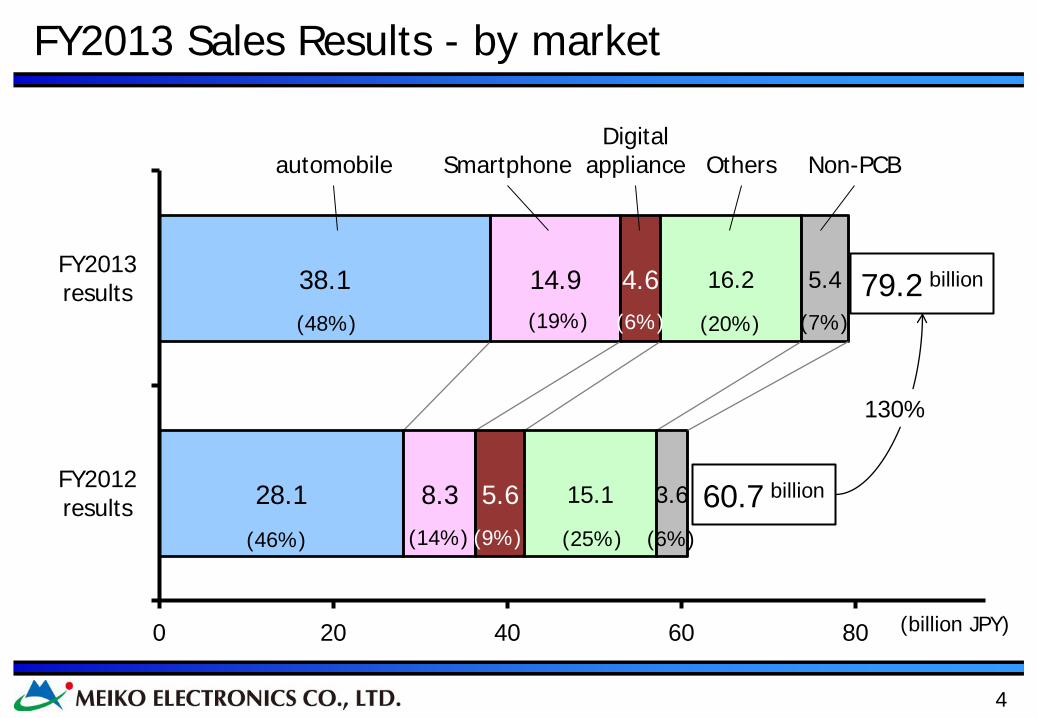
FY2013 Sales Results - by market
28.1
38.1
8.3
14.9
5.6
4.6
15.1
16.2
3.6
5.4
0 20 40 60 80
FY2012 results
FY2013 results
(billion JPY)
automobile Smartphone Digital
appliance Others Non-PCB
79.2 billion
60.7 billion
130%
(48%) (19%) (20%) (7%) (6%)
(46%) (14%) (25%) (6%) (9%)

5
FY2013 Sales Results - by product
6.4
7.3
22
29.9
11.2
12.5
14.3
21.4
3.2
2.7
3.6
5.4
0 20 40 60 80
FY2012 results
FY2013 results
79.2billion
60.7billion
Double-sided 4 layers 6 layers or more Other PCB Non-PCB HDI
(9%) (38%) (27%) (7%) (16%)
(11%) (36%) (24%) (5%) (18%) (6%)
(3%)
(billion JPY)

6
-6.1
86.8
-29.3
-17.4
-3.3 -10.3
-11.3 9.2
-20
0
20
40
60
80
FY2012 FY2013
Marginal profit
increase due to sales growth
Labor cost increase
Utility expense increase
Repair expense increase Other fix cost
increase Sales, general & admin expense increase
Analysis on Variation of Operating Income FY2013
(unit: 100 million JPY)
Improved by 1.5billion JPY
7
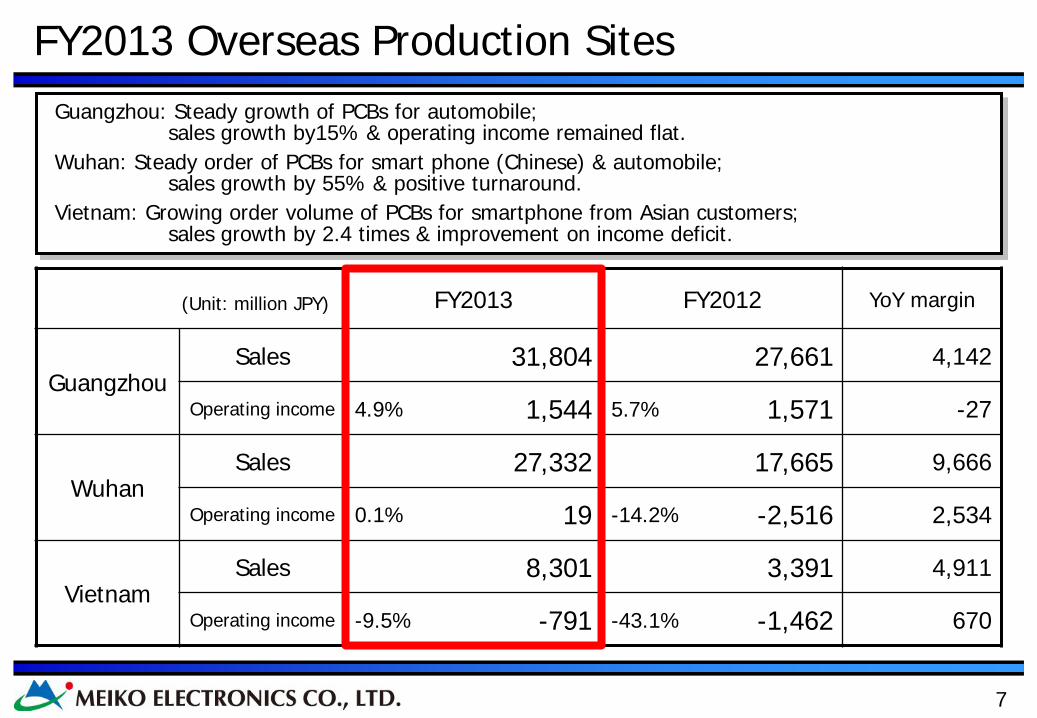
FY2013 Overseas Production Sites Guangzhou: Steady growth of PCBs for automobile;
sales growth by15% & operating income remained flat. Wuhan: Steady order of PCBs for smart phone (Chinese) & automobile;
sales growth by 55% & positive turnaround. Vietnam: Growing order volume of PCBs for smartphone from Asian customers;
sales growth by 2.4 times & improvement on income deficit.
FY2013 FY2012 YoY margin
Guangzhou Sales 31,804 27,661 4,142
Operating income 4.9% 1,544 5.7% 1,571 -27
Wuhan Sales 27,332 17,665 9,666
Operating income 0.1% 19 -14.2% -2,516 2,534
Vietnam Sales 8,301 3,391 4,911
Operating income -9.5% -791 -43.1% -1,462 670
(Unit: million JPY)

8
1
2
FY2013 Summary
FY2014 Forecast
9
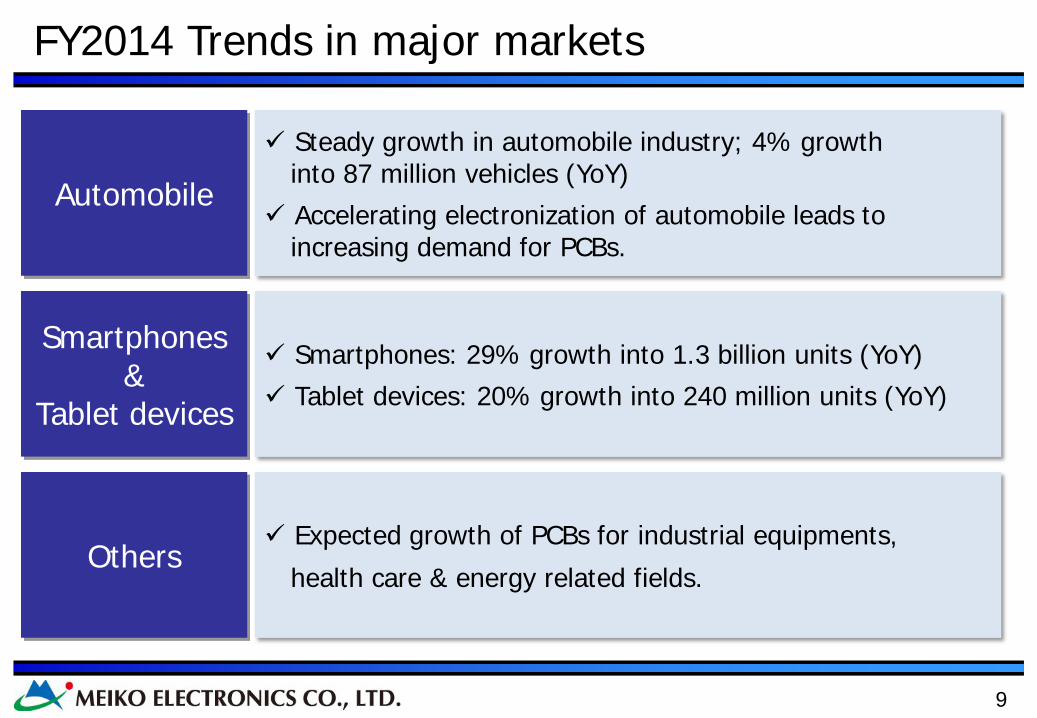
FY2014 Trends in major markets
Expected growth of PCBs for industrial equipments,
health care & energy related fields. Others
Smartphones: 29% growth into 1.3 billion units (YoY) Tablet devices: 20% growth into 240 million units (YoY)
Smartphones &
Tablet devices
Steady growth in automobile industry; 4% growth into 87 million vehicles (YoY)
Accelerating electronization of automobile leads to increasing demand for PCBs.
Automobile

10
FY2014 Business Initiatives
Sales 1. Improving sales structure toward automobile market. 2. Sales promotion for PCBs for high-end smartphones. 3. Generating leads in ASEAN region.
Production 1. Enhancing & developing the production system in Vietnam. 2. Establishing the production basis aiming for No. 1 quality &
capacity of PCBs for automobile.
R&D 1. Developing & launching new products, looking ahead of
customers’ needs. - Automobile: HDI & Radio Frequency (RF) PCB - High-end smartphone: High layer count Anylayer PCB
Expanding sales by centering on automobile & smartphone market. Higher earnings on higher sales through further improvement on quality & cost
reduction.

11
FY2014 Consolidated forecast
FY2014 forecast FY2013 results
YoY margin (ratio)
1st half 2nd half Annual
Net sales 41,500 44,500 86,000 79,231 +6,769 (108.5%)
Operating income
1.6% 4.1% 2.9% 1.2% +1,578 (2.7 times) 670 1,830 2,500 922
Ordinary income
0.6% 2.8% 1.7% 2.4% -431
(77%) 260 1,240 1,500 1,931
Net income 0.2% 1.4% 0.9% 0.0%
+677 (30.4 times) 70 630 700 23
(unit: million of JPY)

12
28.1
38.1
401
8.3
14.9
198
5.6
4.6
4.5
15.1
16.2
165
3.6
5.4
5.1
0 20 40 60 80
FY2012
FY2013
FY2014 forecast
(billion JPY)
(48%) (19%) (20%) (7%) (6%)
(46%) (14%) (25%) (6%) (9%)
(47%) (23%) (19%) (6%) (5%)
79.2billion
60.7billion
130%
86.0billion
109%
Automobile Smartphone Digital
appliance Others Non-PCB
FY2014 Sales Forecast – by market

13
6.4
7.3
7.3
22
29.9
32.6
11.2
12.5
13.4
14.3
21.4
25.5
3.2
2.7
2.1
3.6
5.4
5.1
0 20 40 60 80
FY2012
FY2013
FY2014 forecast
79.2billion
60.7billion
86.0billion (8%) (38%) (30%)
(7%)
(16%) (2%) (6%)
(3%) (27%) (16%) (38%) (9%)
(36%) (11%) (18%) (24%) (5%) (6%)
Double-sided 4 layers 6 layers or more Other PCB Non-PCB HDI
(billion JPY)
FY2014 Sales Forecast – by product
14
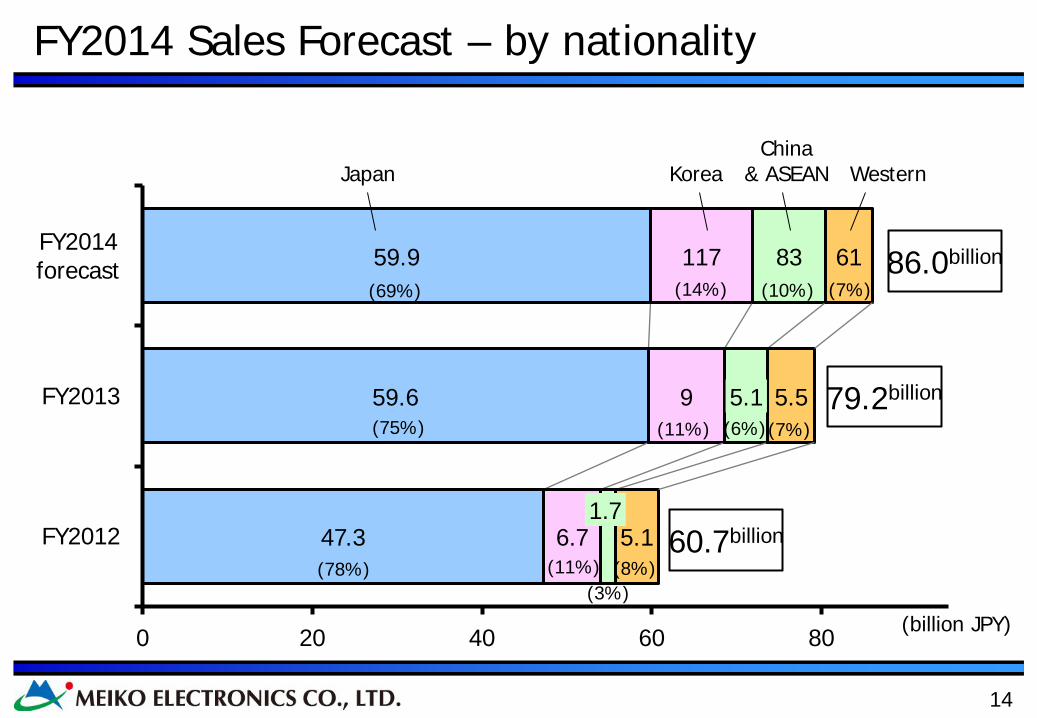
47.3
59.6
59.9
6.7
9
117
1.7
5.1
83
5.1
5.5
61
0 20 40 60 80
FY2012
FY2013
FY2014 forecast
Japan Korea China
& ASEAN Western
79.2billion
60.7billion
86.0billion
(11%) (78%)
(18%)
(8%) (3%)
(11%) (75%) (7%) (6%)
(14%) (69%) (7%) (10%)
FY2014 Sales Forecast – by nationality
(billion JPY)

15
9.2
42.1
-14.0
-3.5 -2.2
-3.9 -2.7
25.0
0
20
40
FY2013 FY2014 forecast
(unit: 100 million JPY)
Marginal profit
increase due to sales growth
Labor cost increase
Utility expense increase
Repair expense increase Other fix cost
increase Sales, general & admin expense increase
Improving by 1.58billion JPY
Analysis on Variation of Operating Income FY2014
16
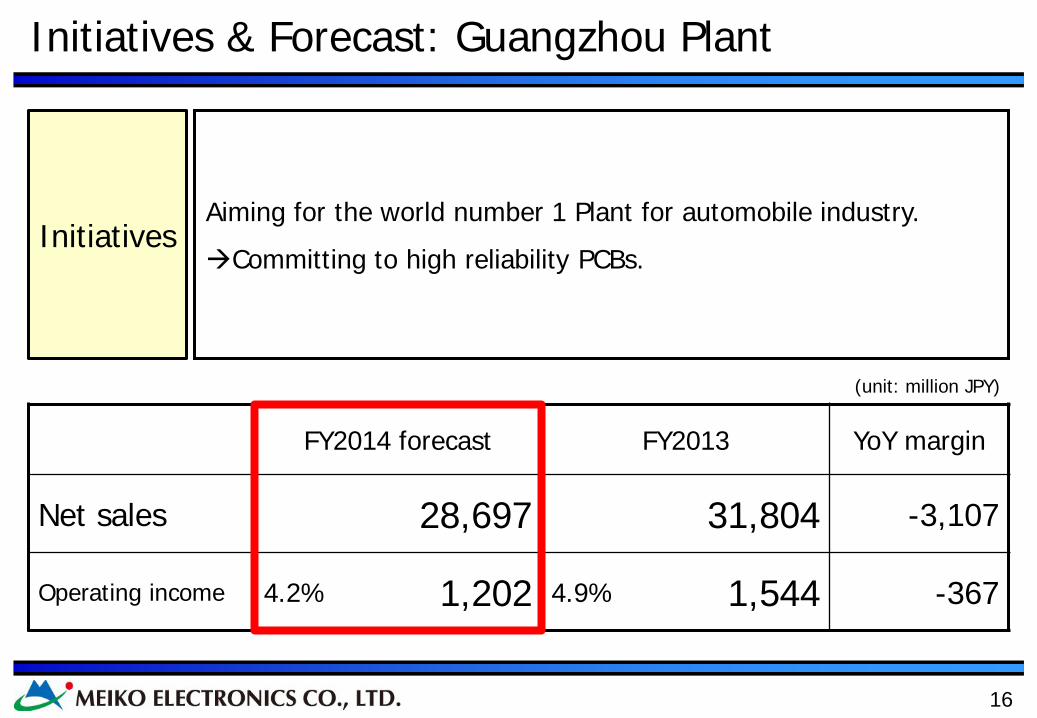
Initiatives & Forecast: Guangzhou Plant
Aiming for the world number 1 Plant for automobile industry.
Committing to high reliability PCBs. Initiatives
FY2014 forecast FY2013 YoY margin
Net sales 28,697 31,804 -3,107
Operating income 4.2% 1,202 4.9% 1,544 -367
(unit: million JPY)
17
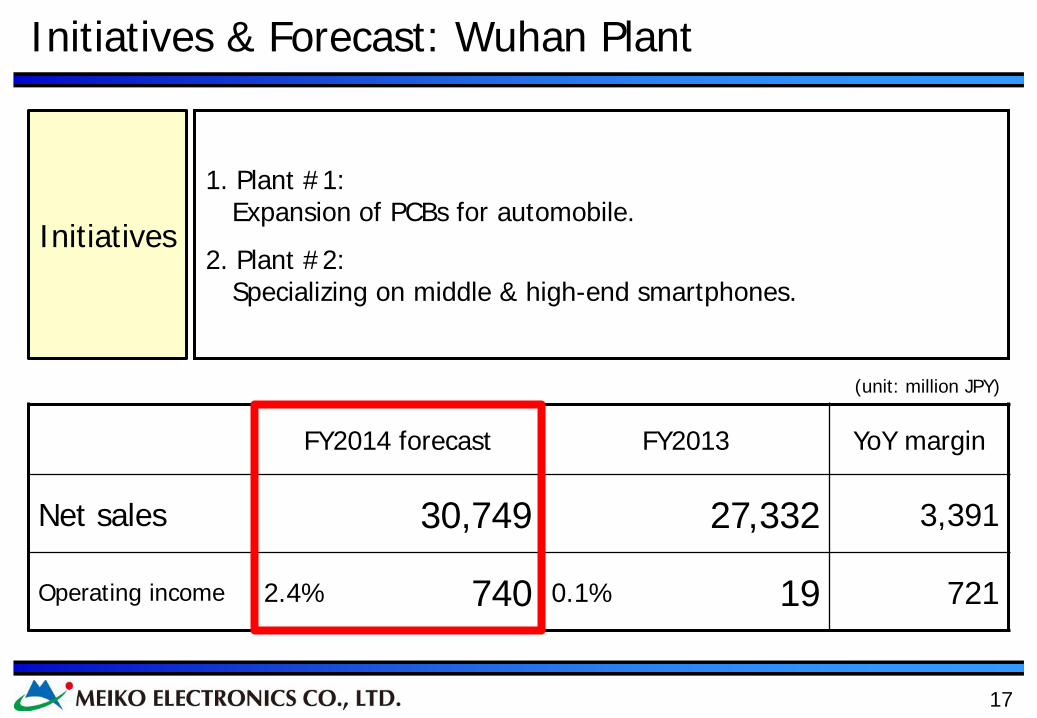
1. Plant #1: Expansion of PCBs for automobile.
2. Plant #2: Specializing on middle & high-end smartphones.
Initiatives
FY2014 forecast FY2013 YoY margin
Net sales 30,749 27,332 3,391
Operating income 2.4% 740 0.1% 19 721
(unit: million JPY)
Initiatives & Forecast: Wuhan Plant
18
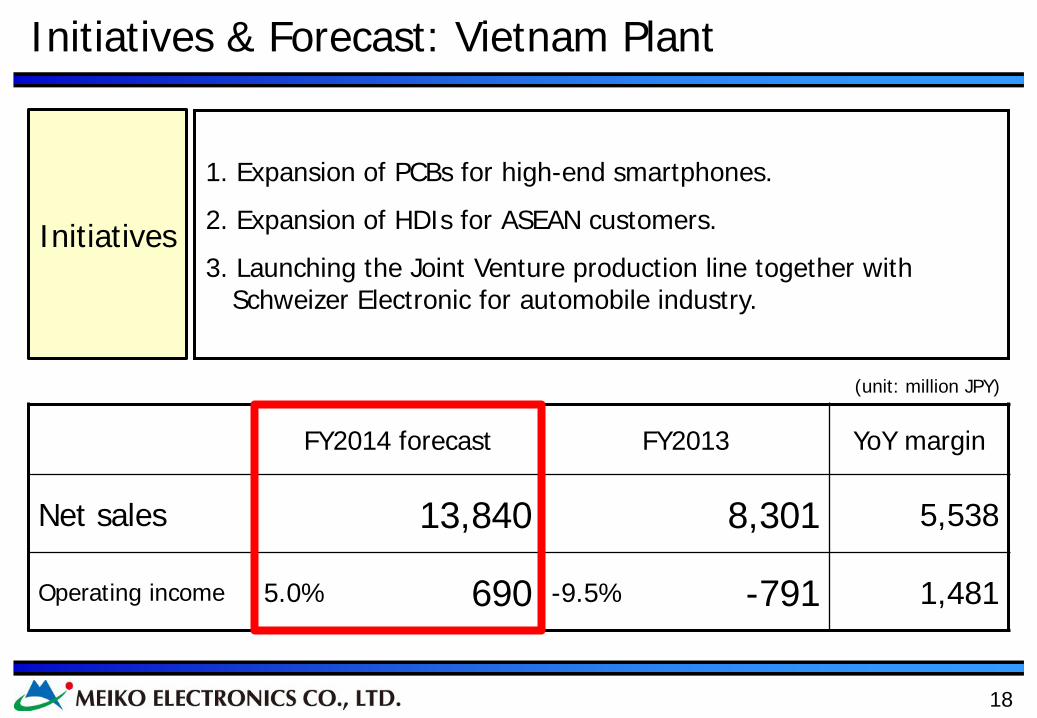
1. Expansion of PCBs for high-end smartphones.
2. Expansion of HDIs for ASEAN customers.
3. Launching the Joint Venture production line together with Schweizer Electronic for automobile industry.
Initiatives
FY2014 forecast FY2013 YoY margin
Net sales 13,840 8,301 5,538
Operating income 5.0% 690 -9.5% -791 1,481
(unit: million JPY)
Initiatives & Forecast: Vietnam Plant
19
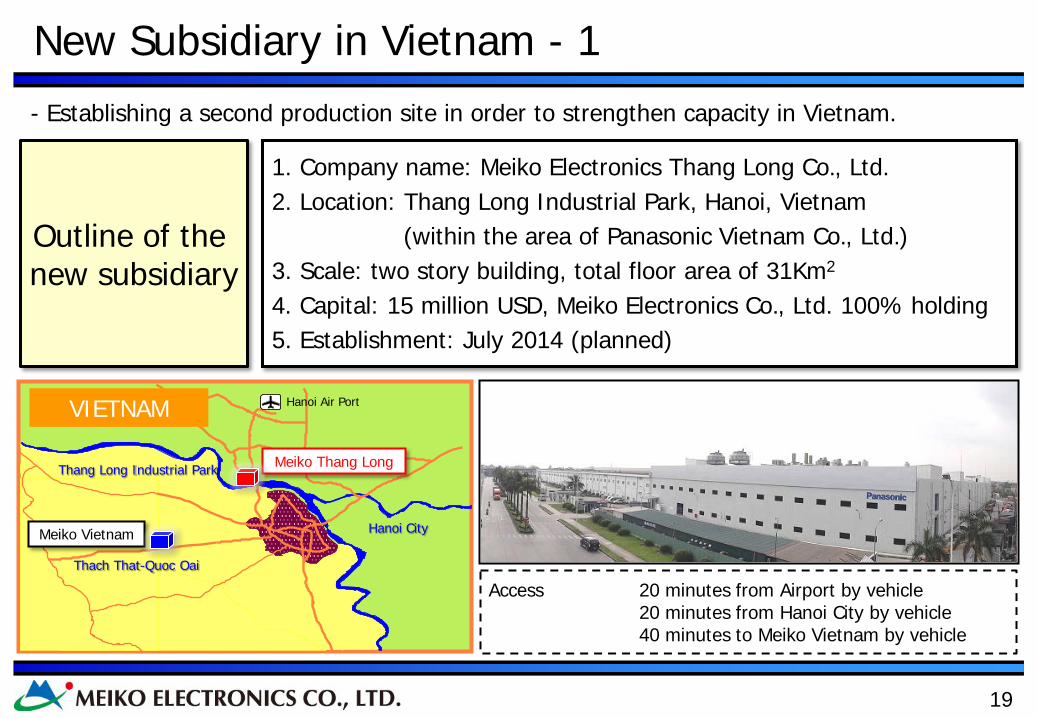
New Subsidiary in Vietnam - 1
1. Company name: Meiko Electronics Thang Long Co., Ltd. 2. Location: Thang Long Industrial Park, Hanoi, Vietnam (within the area of Panasonic Vietnam Co., Ltd.) 3. Scale: two story building, total floor area of 31Km2 4. Capital: 15 million USD, Meiko Electronics Co., Ltd. 100% holding 5. Establishment: July 2014 (planned)
Outline of the new subsidiary
- Establishing a second production site in order to strengthen capacity in Vietnam.
Access 20 minutes from Airport by vehicle 20 minutes from Hanoi City by vehicle 40 minutes to Meiko Vietnam by vehicle
Hanoi City
Hanoi Air Port
Thach That-Quoc Oai
VIETNAM
Thang Long Industrial Park
Meiko Vietnam
Meiko Thang Long
20
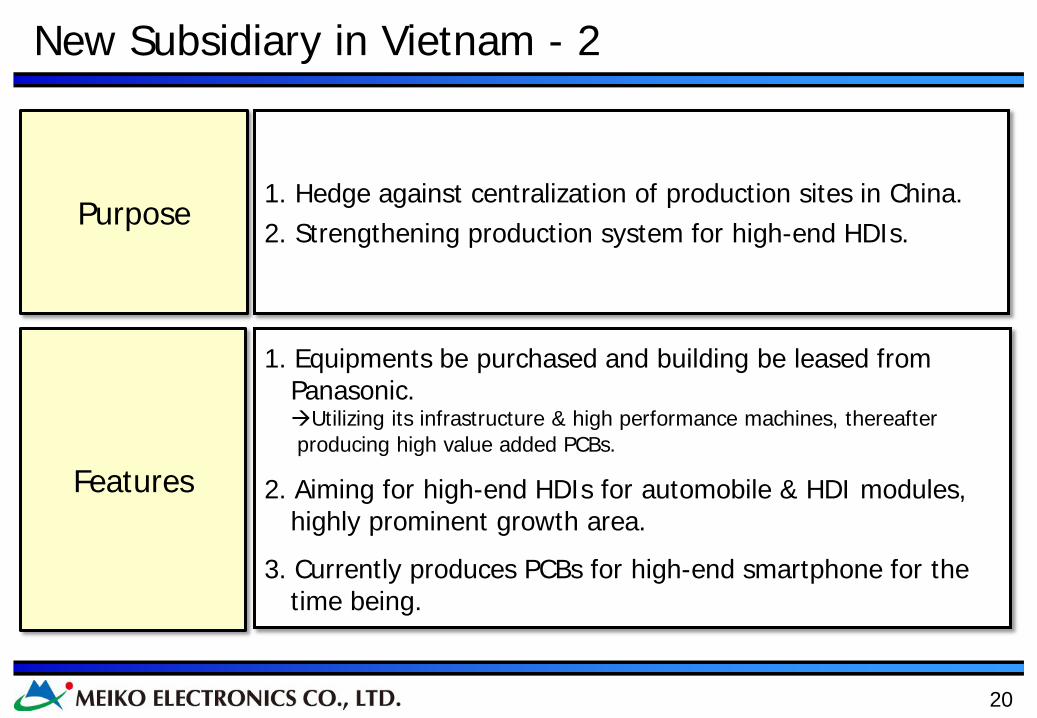
New Subsidiary in Vietnam - 2
Purpose 1. Hedge against centralization of production sites in China. 2. Strengthening production system for high-end HDIs.
Features
1. Equipments be purchased and building be leased from Panasonic. Utilizing its infrastructure & high performance machines, thereafter producing high value added PCBs.
2. Aiming for high-end HDIs for automobile & HDI modules, highly prominent growth area.
3. Currently produces PCBs for high-end smartphone for the time being.
21
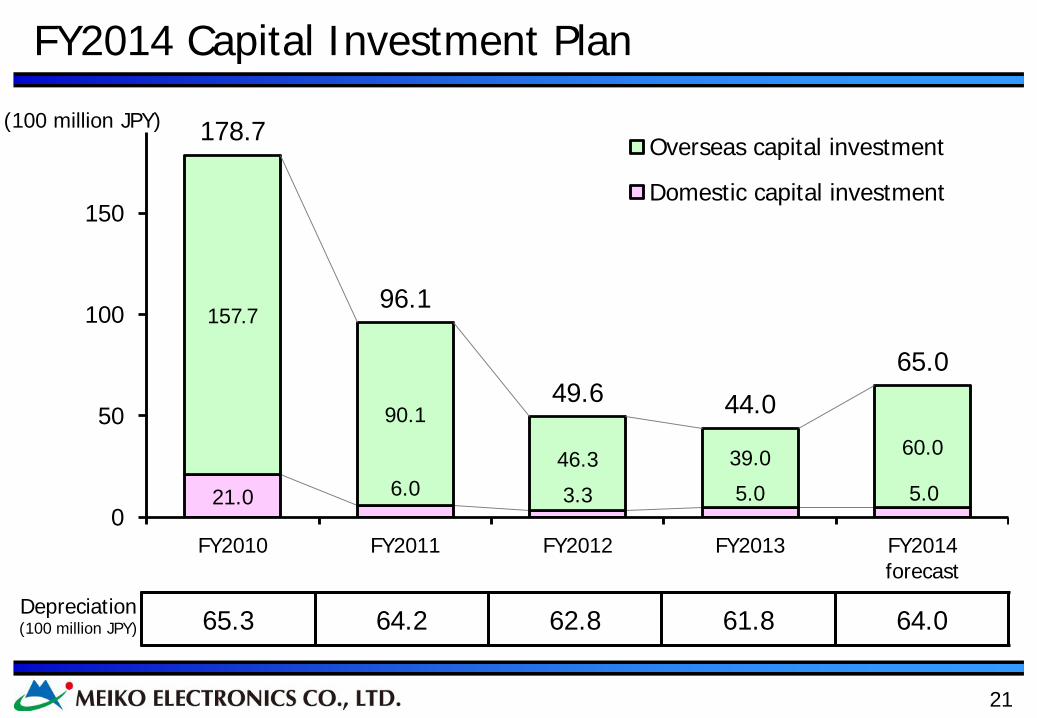
21.0 6.0 3.3 5.0 5.0
157.7
90.1
46.3 39.0 60.0
178.7
96.1
49.6 44.0
65.0
0
50
100
150
FY2010 FY2011 FY2012 FY2013 FY2014 forecast
Overseas capital investment
Domestic capital investment
FY2014 Capital Investment Plan
(100 million JPY)
65.3 64.2 62.8 61.8 64.0 Depreciation (100 million JPY)
22
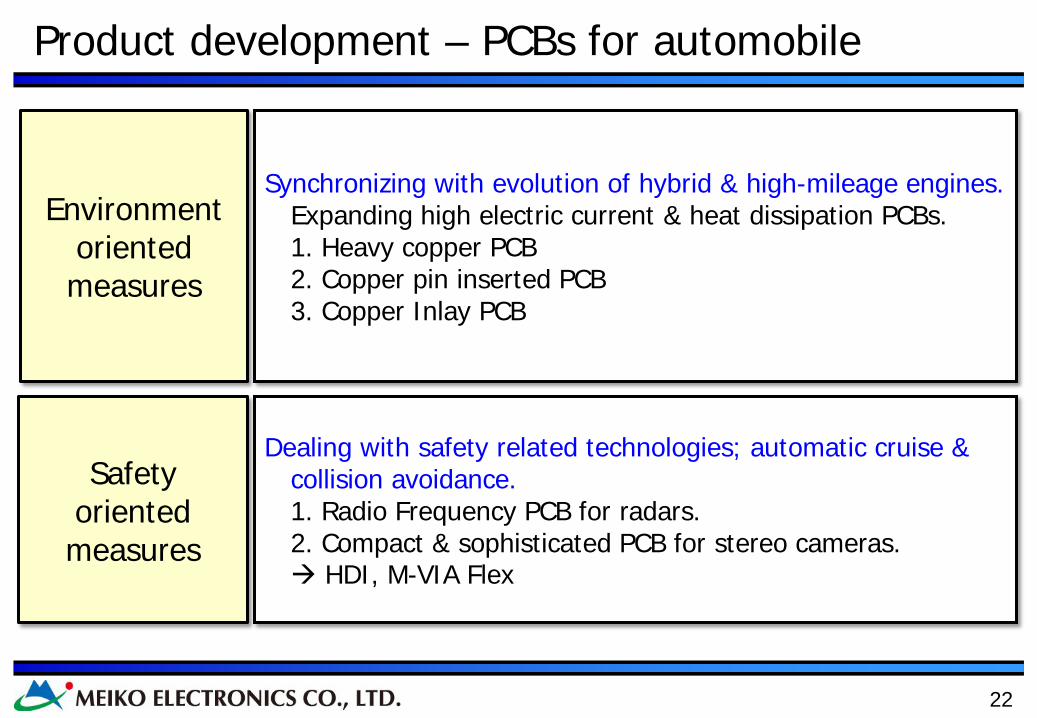
Product development – PCBs for automobile
Environment oriented measures
Safety oriented measures
Synchronizing with evolution of hybrid & high-mileage engines. Expanding high electric current & heat dissipation PCBs. 1. Heavy copper PCB 2. Copper pin inserted PCB 3. Copper Inlay PCB
Dealing with safety related technologies; automatic cruise & collision avoidance.
1. Radio Frequency PCB for radars. 2. Compact & sophisticated PCB for stereo cameras. HDI, M-VIA Flex
23
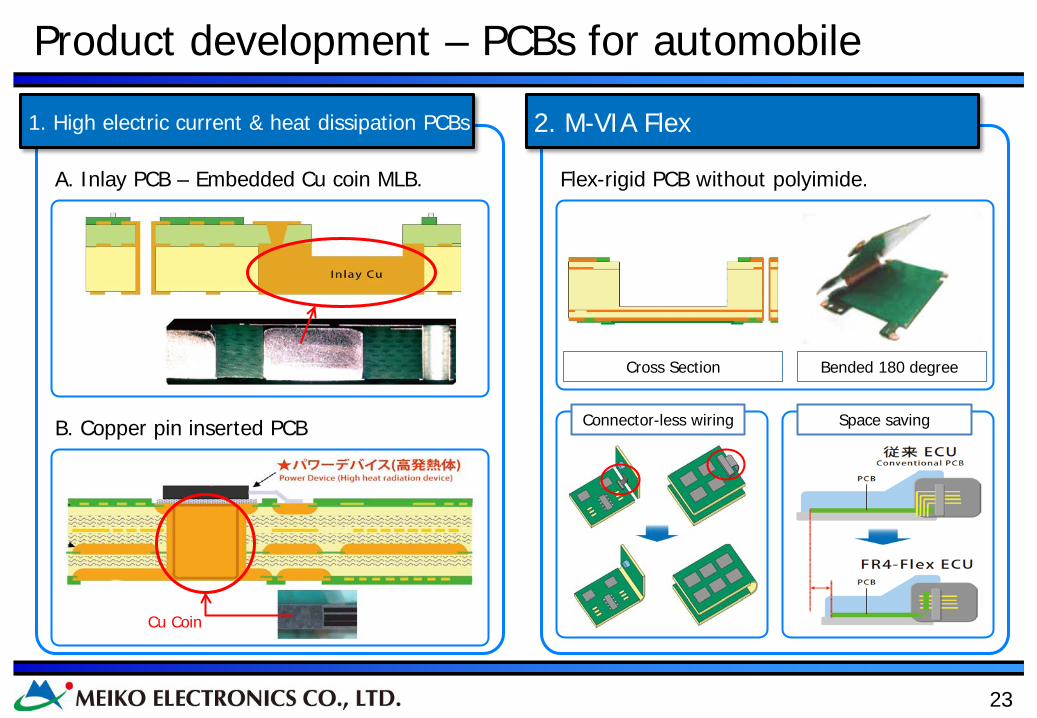
Connector-less wiring Space saving
Cross Section Bended 180 degree
2. M-VIA Flex 1. High electric current & heat dissipation PCBs
Flex-rigid PCB without polyimide.
B. Copper pin inserted PCB
Cu Coin
Product development – PCBs for automobile
A. Inlay PCB – Embedded Cu coin MLB.
24
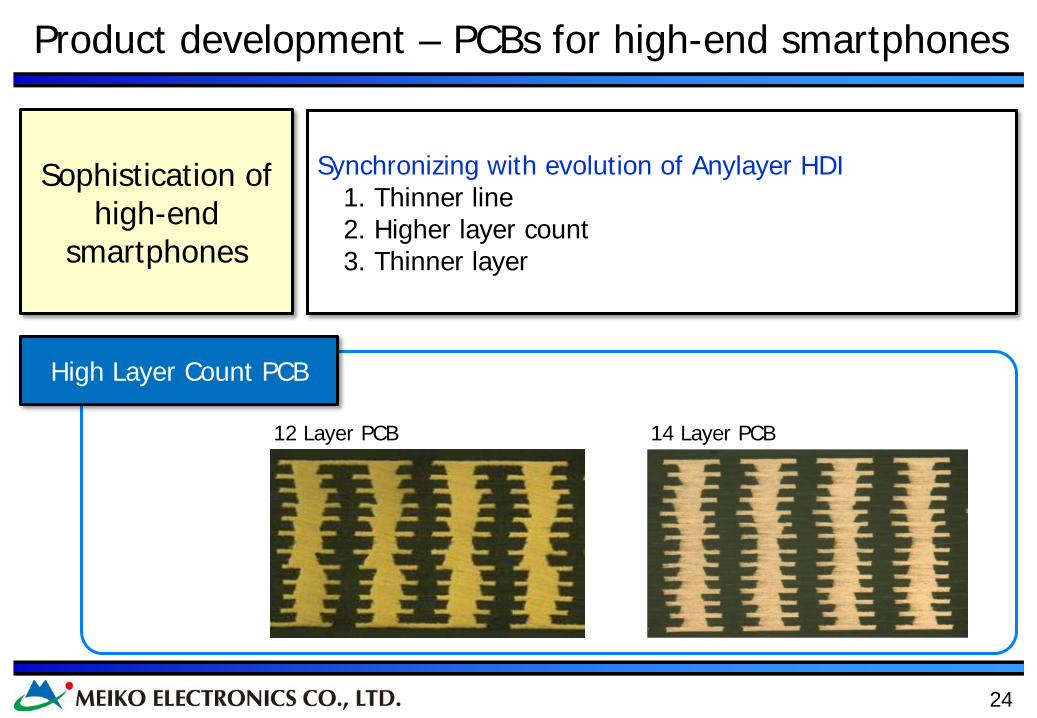
Sophistication of high-end
smartphones
Synchronizing with evolution of Anylayer HDI 1. Thinner line
2. Higher layer count 3. Thinner layer
High Layer Count PCB
12 Layer PCB 14 Layer PCB
Product development – PCBs for high-end smartphones

25
280 352 385 413
331 390 429 446
383
538 666
792
881
730 640
550 1,875
2,010 2,120 2,200
0
500
1,000
1,500
2,000
2013 2014 2015 2016
Feature phone
Low-end smartphone
Middle-end smartphone
High-end smartphone
(million units)
(EM Data Service)
(15%) (18%) (18%) (19%)
(53%)
(64%)
(70%)
(75%)
(100%)
(100%) (100%)
(100%)
Market Trend of Mobile Phones

26
http://www.meiko-elec.com/

27
Disclaimer
This presentation contains forward-looking statements concerning Meiko Group’s future plans, strategies and performance. However, Meiko does not publish this presentation as a disclosure document based on the Financial Instruments and Exchange Act of Japan. These forward-looking statements are not historical facts, rather they represent assumptions and beliefs based on comprehensive data currently available. Furthermore, the Printed Circuit Board business is subject to a number of risks and uncertainties that relate to raw material price, conditions of customers’ market, technological trends, foreign currency exchange rates, tax rules, regulations, disasters, international conflicts and other factors. Meiko therefore wishes to caution that actual results may differ materially from our expectations.


![Results of EGM [Company Update]](https://static.fdocuments.in/doc/165x107/577c7f4b1a28abe054a3ef19/results-of-egm-company-update.jpg)
![Results Press Release & Investor Update [Company Update]](https://static.fdocuments.in/doc/165x107/577cb4891a28aba7118c8067/results-press-release-investor-update-company-update.jpg)


![Financial Results with Results Press Release, Investor Update & Limited Review Report for June 30, 2015 [Company Update]](https://static.fdocuments.in/doc/165x107/577cb40d1a28aba7118c46c3/financial-results-with-results-press-release-investor-update-limited-review.jpg)


![Identification and Characterization of Two Distinct a …cancerres.aacrjournals.org/content/canres/50/21/6787.full.pdf[CANCER RESEARCH 50, 6787-6792. November 1, 1990] Identification](https://static.fdocuments.in/doc/165x107/5b09e6407f8b9a45518b60de/identification-and-characterization-of-two-distinct-a-cancer-research-50-6787-6792.jpg)
![Results Update Presentation [Company Update]](https://static.fdocuments.in/doc/165x107/577ca7a11a28abea748c7c9d/results-update-presentation-company-update.jpg)


![Results Presentation [Company Update]](https://static.fdocuments.in/doc/165x107/577cb4341a28aba7118c5b10/results-presentation-company-update.jpg)