Financial Results Briefing for FY2019 2nd Quarter
24
November 12, 2019 Financial Results Briefing for FY2019 2nd Quarter Note: This is an accurate and complete translation of original Japanese version prepared for the convenience of our English-speaking investors. In case of any discrepancy between the Japanese and English versions, the former shall prevail.
Transcript of Financial Results Briefing for FY2019 2nd Quarter

November 12, 2019
Financial Results Briefing
for FY2019 2nd Quarter
Note: This is an accurate and complete translation of original Japanese version prepared for the convenience of our
English-speaking investors. In case of any discrepancy between the Japanese and English versions, the former shall
prevail.

All Rights Reserved © 2019 YONDEN Shikoku Electric Power Co., Inc.
Contents
1. Highlights of FY2019 2nd Quarter
Financial Results
2.Initiatives for Revenue Growth
in the Power Generation Business
3.Progress toward Achieving
Management Targets
1

All Rights Reserved © 2019 YONDEN Shikoku Electric Power Co., Inc.
2
1.Highlights of FY2019 2nd Quarter
Financial Results

All Rights Reserved © 2019 YONDEN Shikoku Electric Power Co., Inc.
Highlights of FY2019 2nd Quarter Financial Results
FY2019-2Q
Change
from
FY2018-2Q
Points
Operating revenues 3,732 145Decrease in retail electricity sales,
Sharp increase in wholesale electricity
sales, etc.
Operating expenses 3,396 (75)Decrease in fuel and power purchase
cost due to operation of Ikata Unit No.3,
etc.
Operating profit 336 221 -
Ordinary profit 324 203 -
Profit attributable to
owners of parent233 156 -
(100 million yen)
3
【Consolidated】

All Rights Reserved © 2019 YONDEN Shikoku Electric Power Co., Inc.
Factors Contributing to Change in Ordinary Profit 4
【Consolidated】(100 million yen)
FY2019
2Q
FYFY2018
2Q
Decrease in
depreciation
Decrease in
maintenance
cost, etc.
121
324
+214
+25(64)
・Increase in the electricity
volume generated
by nuclear power plants+220 , etc.
+28
Improvement of
income related to
demand and supply
Increase in
nuclear
Back-end cost

All Rights Reserved © 2019 YONDEN Shikoku Electric Power Co., Inc.
1
101
FY2019-2Q FY2018-2Q
45
16
73
77
38
40
<(5.2%)>
(100 million kWh)
Summer
Jun.-Sep.25.9 ℃ 26.3 ℃
155
133
<(5.7%)>
<Average temperatures>
<182.4%>
(Note) Figures in < > are Year-on-Year growth rates.
Retail
111<(5.4%)> 117
Wholesale
Power
Lighting
<16.9%>
Retail Sales
・ Decrease in contract power
・ Decrease in reaction to
higher summer temperatures
in the previous year, etc.
5
Electricity Sales

All Rights Reserved © 2019 YONDEN Shikoku Electric Power Co., Inc.
0
100
FY2019-2Q FY2018-2Q
4 13
17 17
64
71
21
21
40 0
22
23
Decrease in flow rate
(110.3 % → 105.1%)
Increase in capacity factor
of Ikata Unit No.3
(0% → 102.7%)
Thermal
85<(15.6%)>
101
6
<(6.5%)>
<(10.6%)>
<1.9%>
<(66.8%)>
<2.2%>
Hydro
Coal
Nuclear
Gas
Oil
Renewable
Energy
(Note) Figures in < > are Year-on-Year growth rates.
Electricity Supplied
(100 million kWh)

All Rights Reserved © 2019 YONDEN Shikoku Electric Power Co., Inc.
Cash Flows
(100 million yen)
FY2019 2Q
<a>
Fy2018 2Q
<b><a-b>
Cash Flows from
Operating
Activities
Ordinary Profit 324 121
Depreciation 294 319
Others (130) (617)
<Decrease in accrued expenses and
accounts payable-trade><(170)> <(215)>
<Increase(Decrease) in accrued taxes> <54> <(108)>
Subtotal 487 (175) 662
Cash Flows from
Investing
Activities
Capital Expenditures (397) (391)
Investments (70) (25)
Subtotal (468) (416) (52)
Free Cash Flows 19 (592) 611
Cash Flows from
Financing
Activities
Cash Dividends Paid (31) (31)
Bonds and Loans (27) 288
Purchase of treasury shares (2) (0)
Subtotal (60) 254
Net Increase (Decrease) in Cash and Cash Equivalents (43) (338)
7
(Note) Positive numbers mean cash inflows, negative numbers mean cash outflows.

All Rights Reserved © 2019 YONDEN Shikoku Electric Power Co., Inc.
Financial Position
(100 million yen)
Sep 30, 2019
<a>
Mar 31, 2019
<b><a-b>
Total Assets 13,574 13,539 35
<Plant and equipment, and intangible assets>
(except Special account related to nuclear power
decommissioning, Special account related to
reprocessing of spent nuclear fuel )
<8,343> <8,282> <61>
<Investments, etc.> <4,059> <4,067> <(8)>
Liabilities 10,179 10,327 (148)
<Bonds and loans> <7,015> <7,042> <(27)>
<Accrued expenses, etc.> <3,164> <3,284> <(120)>
Total Net Assets 3,394 3,211 183
<Retained earnings> <1,904> <1,702> <202>
Shareholders’ Equity Ratio 24.9% 23.6% -
8

All Rights Reserved © 2019 YONDEN Shikoku Electric Power Co., Inc.
Forecasts of Financial Results for FY2019
(100 million yen, %)
FY2019Forecast
<a>
FY2018
<b>
<c=a-b> <c/b>
Operating revenues 7,340 7,372 (32) (0.4)
Operating profit 250 257 (7) (2.8)
Ordinary profit 240 251 (11) (4.5)
Profit attributable to
owners of parent170 169 1 0.0
Profit per share ¥83 ¥83 ¥0 -
9
【Consolidated】

All Rights Reserved © 2019 YONDEN Shikoku Electric Power Co., Inc.
FY2019 FY2018
Interim ¥15 ¥15
Year-end ¥15Forecast
¥15
Total ¥30Forecast
¥30
Dividends per Share
10
Dividends Forecasts for FY2019

All Rights Reserved © 2019 YONDEN Shikoku Electric Power Co., Inc.
11
2.Initiatives for Revenue Growth
in the Power Generation Business

All Rights Reserved © 2019 YONDEN Shikoku Electric Power Co., Inc.
Creation and expansion
of profit sources outside
of the electric power
business
Business Composition of the Shikoku Electric Power Group
Electric Power
13.6
Telecommunications
7.3
Construction and
Engineering
1.1
Energy
1.1
Others
1.8
Profits by Segments
Consolidated
¥25.7
billion(FY2018)
*The above breakdown is before the elimination of transactions between segments.
Comprehensive
improvements in cost
efficiency and maintaining
and improving profitability
in the electric power
business
Outside of
Electric Power
Over 30%
12

All Rights Reserved © 2019 YONDEN Shikoku Electric Power Co., Inc.
Revenue
Growth
Initiatives for Revenue Growth in the Power Generation Business13
Safe and stable
operation of supply
facilities
Dealing with highly
efficient supply
equipment
and aged facilities
Maximum utilization
of renewable energy
Ensuring the safe and stable operation
of Ikata Power Station
Maintaining and improving power supply
reliability
Replacing Saijo Unit No.1 with ultra supercritical
(USC) generation equipment
Extension of periodic operator inspection intervals
for thermal power generation facilities
Decommissioning of Anan Units No. 1 and No. 2, and
shutdown of No. 4
Decommissioning of Ikata Units No. 1 and No. 2
Expansion of adoption as a unified group both in
Japan and overseas
Supply-demand balance and grid voltage/limitations
related measures for expansion of adoption
Maximizing profits by
effectively leveraging
new markets
Maximizing profits by harnessing
Baseload Market, Non-Fossil Value Trading
Market and Capacity Market

All Rights Reserved © 2019 YONDEN Shikoku Electric Power Co., Inc.
Target for Renewable Energy Introduction14
Proactively working as a Group to develop renewable
energy power sources
in Japan and abroad
Seeking to develop 500 MW
by 2030
[Introduction and Development capacity of renewable energy in Japan and abroad]
*Japan :Calculated based on the investment ratio of each Group company*Abroad:Our owned capacity(Including projects to begin operating in the future)
Sep. 30, 2019 2030
Solar
HydroWind
Hydro(Indonesia)0.2
Wind(Taiwan) 2.8
Solar(Chile) 2.9
(10MW)
Japan
Abroad
17
50
6335
(Hydro: increase in output after Fiscal 2000)

All Rights Reserved © 2019 YONDEN Shikoku Electric Power Co., Inc.
Initiatives for Expanding Adoption of Renewable Energy15
Increase in output at hydropower station
New development of hydropower station
Expanding adoption of renewable energy
by our group companies
1
2
[Performance of Yonden Engineering]
◆Construction of wind farm(as of Sep. 30, 2019)
Number of construction 47
(25 of them were EPCs)
Total output Approx. 880MW
Number of unit 447
[Benefits after Fiscal 2000] [Overview of new development concept]
River nameMaekawa river basin
(Niyodogawa river system)
Candidate sites for
Development
Kumakogen Town, Ehime Prefecture
Type Run-of-river
Maximum output
Annual power generation
1.9 MW
7.9GWh
* EPC :Engineering, Procurement and Construction
* O&M:Operation and Maintenance
Increase in output
Approx. 30 MW
Increase in annual power generation
Approx. 70 GWh
Adopting high-efficiency turbines by taking the opportunity to upgrade
Study on new development of hydropower station
Promoting initiatives carried out by group companies
including Yonden Engineering Co., Inc.
Expanding project participation through EPC and O&M

All Rights Reserved © 2019 YONDEN Shikoku Electric Power Co., Inc.
16
Expanding adoption of renewable energy overseas3
[Project overviews]
Project
Generation method
(Country: Output)
Huatacondo IPP
Solar
(Chile: 98MW)
Yunlin IPP
Offshore wind
(Taiwan: 640 MW)
Batang Toru 3 IPP
Mini hydro
(Indonesia: 10 MW)
Our share
(Equity stake)
Approx. 30MW(30%)
Approx. 30 MW(4.4%)
Approx. 1.5 MW(15%)
Off-taker Electricity market in Chile Taiwan Power Company PLN
Partners Sojitz and otherswpd, Sojitz,
C&C Investment, JXTG Mitsui, Terregra
Commercial Operation
DateSeptember 2019 2021(planned) 2020 (planned)
Solar power station in the desert that utilizes the
highest level of insolation in the world (Chile)
Steady execution of existing projects and development of new projects
Increasing Introduction of Renewable Energy

All Rights Reserved © 2019 YONDEN Shikoku Electric Power Co., Inc.
■Deadline for installation:March 22, 2021(within a five year period after approval of plan for construction work of main facility)
Introduction of Specialized Safety Facility at Ikata Power Station17
■Main initiatives for shortening the construction period
Steady acquisition of construction work plan approvals
Building construction and electrical work proceeding in parallel
Work being carried out during the day, at night and on holidays
Commencement of construction work scheduled to start from
the next periodic inspection brought forward
1
2
3
Application Approval
1st division Dec. 7, 2017 Mar. 25, 2019
2nd division Mar. 16, 2018Review in progress
3rd division May 11, 2018
4th divisionAug. 13, 2018
Amended : Jul. 11, 2019Oct. 10, 2019
5th division Jul. 11, 2019 Review in progress
[Status of application for approval of construction work plan]

All Rights Reserved © 2019 YONDEN Shikoku Electric Power Co., Inc.
Initiative for Improving Efficiency in Thermal Power Stations18
Current Unit No. 1 New Unit No. 1
Output 156 MW 500 MW
Generation type Coal-fired
Thermal efficiency*
Approx. 39%(Approx. 38%)
More than 45%(More than 43%)
Start of operations November 1965 June 2023 (scheduled)
* Figures for thermal efficiency not enclosed in parentheses represent lower thermal efficiency while figures in parentheses represent higher thermal efficiency.
[Current status of construction]
[ Status of procedures for acquiring system S rating]
Inspection
Interval
up to 6 years
Reduce
maintenance
cost
Flexibly set
Implementation
time
Improve
operating
ratio
Main equipment yard(as of Oct.23, 2019)
Replacing Saijo Unit No.11
Extension of periodic operator inspection intervals 2
[Overview of replacement plan]
Steady advancement of replacement work to highly efficient USC generation equipment
Orderly acquisition of system S rating in accordance with the new safety management
inspection system for more flexible and efficient operation
Sakaide
Unit No. 3 and Unit No. 4
Acquired S rating
on April 5, 2018
Sakaide Unit No. 2Acquired S rating
on June 14, 2019
Anan Unit No. 3 Screening schedule for
1st Half of FY2020Tachibana-wan
Saijo Unit No. 2 Screening schedule for
2nd Half of FY2020Sakaide Unit No. 1
Boiler Turbinebuilding
Chimney
All Rights Reserved © 2019 YONDEN Shikoku Electric Power Co., Inc.
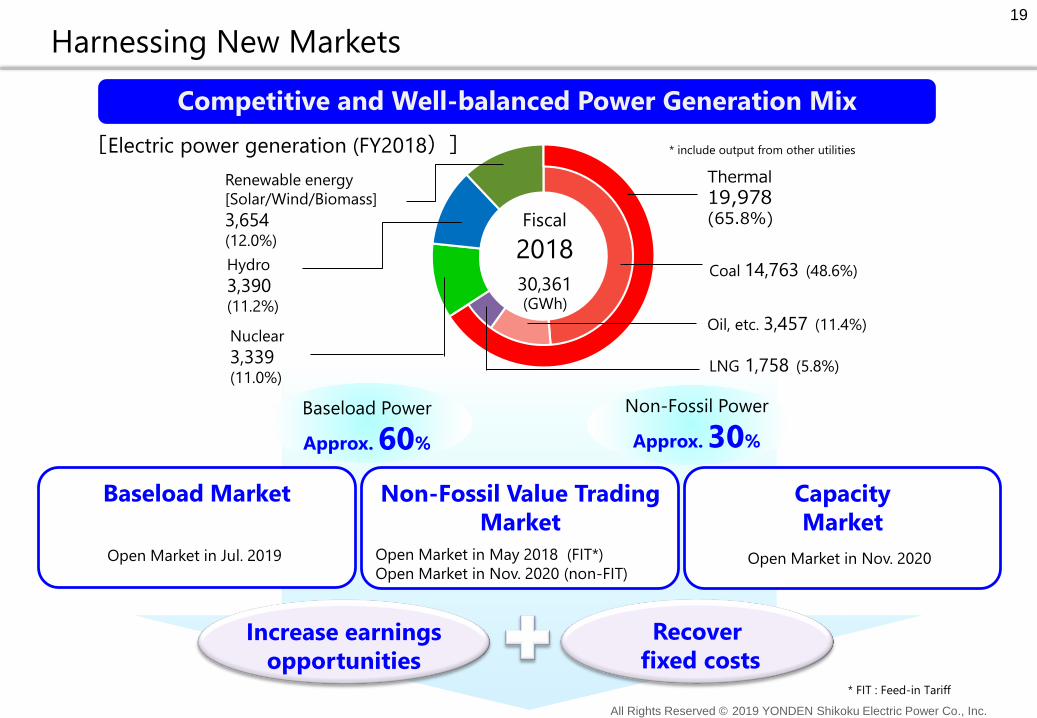
Harnessing New Markets19
Competitive and Well-balanced Power Generation Mix
Baseload Market Non-Fossil Value Trading
Market
Increase earnings
opportunities
Recover
fixed costs
Capacity
Market
Open Market in Jul. 2019 Open Market in May 2018 (FIT*)
Open Market in Nov. 2020 (non-FIT)Open Market in Nov. 2020
Baseload Power
Approx. 60%
Non-Fossil Power
Approx. 30%
* FIT : Feed-in Tariff
* include output from other utilities
Fiscal
2018
Thermal
19,978(65.8%)
30,361(GWh)
[Electric power generation (FY2018)]
Coal 14,763 (48.6%)
Oil, etc. 3,457 (11.4%)
LNG 1,758 (5.8%)
Hydro
3,390(11.2%)
Renewable energy
[Solar/Wind/Biomass]
3,654(12.0%)
Nuclear
3,339(11.0%)

All Rights Reserved © 2019 YONDEN Shikoku Electric Power Co., Inc.
20
3.Progress toward Achieving
Management Targets

All Rights Reserved © 2019 YONDEN Shikoku Electric Power Co., Inc.
Progress toward Achieving Management Goals21
21.6% 21.5%20.4%
23.3% 23.5% 23.6%24.9%
Approx.
24%25%
54.3
100.1 91.7 81.7
123.5
54.5 48.7
Approx.
89.0104.0
(1.3)%
2.5% 2.2% 1.8%2.7% 2.4%
5.2%
Approx.
2%3%ROA
FY2020Approximately3%
(ROE: Approx. 7%)
Shareholders’ Equity
Ratio
End of FY2020More than 25%
(Interest-Bearing Debt Ratio:
Less than 2.0 times)
Cash flows from
Operating Activities
Five-Year Cumulative
Total
Over ¥520.0 billion
FY2015
[Billions of yen]
FY2011~2013
Average
FY2014 FY2020(Target)
■ Management
Targets
(Consolidated)
Aiming for Sustainable Growth with
Profitability Innovation
Overcome the business challenges
associated with the suspension of
all nuclear power operations
* ROA: (Ordinary income + Interest expense) / Average total assets (Average of assets at the beginning and end of the fiscal year)
Five-Year Average
[(5.9)%] [3.6%] [3.8%] [7%]
Interest-Bearing Debt Ratio : Times
[2.4] [2.5] [2.0][1.9]
ROE
FY2016
[3.9%]
[2.3]
FY2017
[2.2]
FY2018
[6.4%] [5.4%]
[2.2]
[14.2%]
[2.1]
FY2019
2Q
FY2019(Forecast)

All Rights Reserved © 2019 YONDEN Shikoku Electric Power Co., Inc.
Shareholder Return Policy22
Basic Policy
Our basic policy for shareholder returns is to issue stable dividend payments.
Dividend levels are determined based on thorough consideration of such factors as
business performance, financial condition,
and the medium- to long-term outlook for the business environment.
Dividend payment of ¥50 per share
Target for Which We Aim to Achieve
We will work toward dividend payments of ¥50 per share, assuming
the safe and stable operation of Ikata Unit No.3 leads to such outcomes as
normalized business operations and the securing of stable profits.

Disclaimer
This presentation contains business forecasts and other forward-looking statements.
These statements are based on our assumptions and judgments in consideration of the information
available at the time, and are therefore subject to risks and contain an element of uncertainty.
It is also possible that such forecasts will be revised at a later date in light of changes in business areas of
our group, such as economic, social and weather conditions, the government energy policy, systems
pertaining to electric power business, regulations related to nuclear power generation, tougher competition,
and rapid changes of currency exchange rates and fuel prices. We ask that readers take these factors into
consideration.