Financial Results Presentation€¦ · · 2015-09-15P13 New Approach After theNew Approach After...
25
FY2013 for FY2013 for Financial Res Financial Res r the 1st Quarter r the 1st Quarter sults Presentation sults Presentation February 8, 2013 Securities Code:9438
Transcript of Financial Results Presentation€¦ · · 2015-09-15P13 New Approach After theNew Approach After...

FY2013 forFY2013 for
Financial ResFinancial Resr the 1st Quarterr the 1st Quarter
sults Presentationsults Presentation
February 8, 2013Securities Code:9438

CONTENTS
Overview of Consolidated FinaFinancial Highlights for the 1st Quarter
P2
P3
Consolidated Statements of Income
Selling, General and Administrative Expenses
Consolidated Balance Sheets Statements
P4
P5
P6 Consolidated Balance Sheets Statements
Business Overview
P6
P7
New Approach After the 1st QuP13 New Approach After the 1st QuBasic Policy of the Fiscal Year
P13
P14
Focus on iPhone UsersP15
Enlargement of Contents Services
New Approach
P16
P18
Focus on iPhone Users
AppendixP21
Consolidated Forecast for the First HalfP20
ancial Results for the 1st Quarter
s
uarteruarter
P1

Financial Re
For the 1st QuFor the 1st Qu
esults Overview
uarteruarter
P2

Financial Highlights for the 1st Quar
The number of paying subscribers
Smartphones 3
Total 8Total 8
Financial results
Net sales: 7Financial results
Operating income:
Net income:
rter
(+0 54 million yoy)
3.67 million paying subscribers(+0.54 million, yoy)
8 16 million paying subscribers(+0.03 million, yoy)
8.16 million paying subscribers
( 154 illi f 2 1%)
7,331 millions of yen(-154 millions of yen, -2.1%)
millions of yen214(-756 millions of yen -77 9%)(-756 millions of yen, -77.9%)
millions of yen185(+1 millions of yen, +1.0%)
P3P3
( y , %)

Consolidated Statements of Income
(Millions of yen)Three months endedSeptember 30, 2013
Three months endedSeptember 30, 2012
7 331 7 485Net sales 7,331 7,485Cost of sales 1,231 1,597Gross profit 6,099 5,887Gross profit 6,099 5,887(Gross profit ratio) 83.2% 78.7%Selling, general and administrative 5 885 4 916administrative expenses
5,885 4,916
Operating income 214 970(Operating income ratio) 2 9% 13 0%
Breakdown in the P5
(Operating income ratio) 2.9% 13.0%Ordinary income 216 961(Ordinary income ratio) 2.9% 12.8%Net income 185 183(Net income ratio) 2.5% 2.5%
Change
Amount Ratio(%)
154 2 1%
・Steadily increased in the system development orders to consolidated subsidiary Jibe Mobile K.K.
-154 -2.1%
-366 -22.9%
+212 +3.6%
・Decreased in the number ofdownloads in music contents
+212 +3.6%
+968 +19 7%
・Actively developed advertising campaigns in the release of smartphone new models.
+968 +19.7%
-756 -77.9% FY2013 FY2012
Extraordinary i
44 ‐
-745 -77.5%
gain
Extraordinary loss
16 283
Income tax 46 329
+1 +1.0% ・Sharply decreased in extraordinary loss.
・Sharply decreased in income taxes current
P4
in income taxes-current.

Selling, General and Administrative E
(Millions of yen)Three months endedSeptember 30, 2013
Three months endedSeptember 30, 2012
Total 5,885 4,916
Advertising expenses 2,176 1,348g p , ,
Personal expenses 1,421 1,377
Commission fee 812 823
Subcontract expenses 440 368
Depreciation 424 314
Other 609 683
Expenses
Change
Amount Ratio(%)
+968 +19.7%
+827 +61.4%・Actively developed advertising
campaigns in the release of smartphone new models
+43 +3.2%
of smartphone new models.
-11 -1.4%
+72 +19.6%
+110 +35.0%
-73 -10.8%
P5

Consolidated Balance Sheets StatemenNet cash is ¥1.91 billion at the end of December 31(¥2.40 billion at the end of September 30, 2012)
f b f b(Millions of yen) As of December 31, 2012
As of September 30, 2012 Change
Current assets 9,380 9,630 -250
Cash and deposit 2,027 2,563 -535p , ,
Accounts receivable-trade 6,245 6,188 +56
Other 1,347 1,147 +200
Allowance for doubtful accounts -241 -268 +26accounts
Noncurrent assets 4,497 4,340 +156
Tangible fixed assets 213 218 -4
Intangible fixed assets 2,512 2,483 +28
Include software 2,247 2,255 -7
l d d ll 193 171 22Include goodwill 193 171 +22
Investments and other assets 1,771 1,639 +132
Include investment securities 403 376 +27
Total assets 13,877 13,971 - 93
nts1, 2012
A f b A f S b(Millions of yen) As of December 31, 2012
As of September 30, 2012 Change
Liabilities 4,868 4,566 +301
Accounts payable trade 1,044 1,233 -188p yCurrent portion of long-term loans payable 49 99 -50
Account payable-other 2,548 1,964 +583
Income taxes payable 49 7 +41
Allowance for coin usage 430 420 +9
Other 748 840 +92
Noncurrent liabilities 510 482 +27
Provision for retirement benefits 399 363 +36Provision for retirement benefits 399 363 +36
Other 110 119 -8
Total liabilities 5,378 5,049 +329
Capital stock 2,562 2,562 -
Capital surplus 3,078 3,078 -
Retained earning 3,062 3,394 -332
Treasury stock -695 -397 -297
S b i ti i ht t h 225 211 13Subscription rights to shares 225 211 +13
Minority interest 220 64 +155
Other 44 7 37
Net assets 8,499 8,922 -423
P6P6
Total liabilities and net assets 13,877 13,971 -93
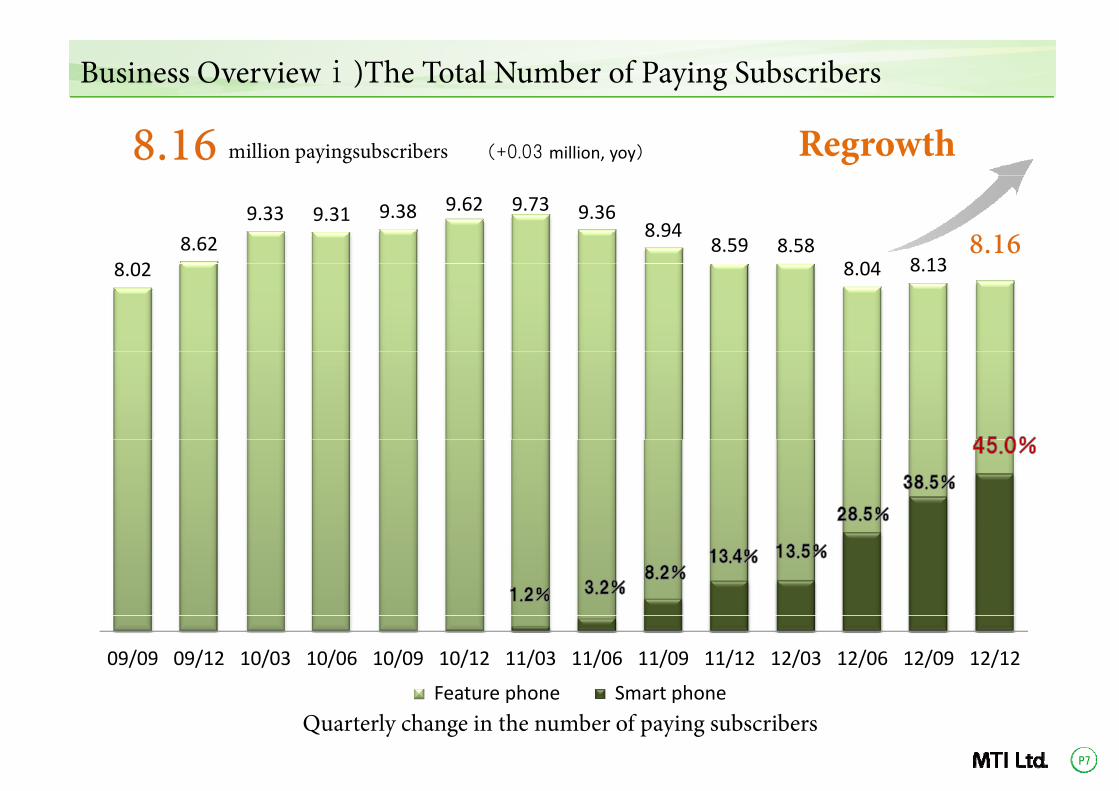
Business Overviewⅰ)The Total Numb)
8.16 (+0.03 mmillion payingsubscribers
8 028.62
9.33 9.31 9.38 9.62 9.73
8.02
09/09 09/12 10/03 10/06 10/09 10/12 11/03フィーチャーフォンFeature phone
Quarterly change in the nu
ber of Paying Subscribersy g
million, yoy) Regrowth9.36
8.94 8.59 8.58
8 04 8 138.16
8.04 8.13
11/06 11/09 11/12 12/03 12/06 12/09 12/12ン スマートフォンSmart phone
P7
mber of paying subscribers

Business Overview ⅱ)The Number o
Steadily increasing
The number of subscribers by iPhone are also increasing.
1.97 mil
1.15 million
0.73 million
1月 2月 3月 4月 5月 6月 7月 8月 9月 10月 11月 12月 1月
Monthly change in the number of p
Jan JanFeb Mar Apr May Jun Jul Aug Sep Oct Nov Dec
Monthly change in the number of p
of Paying Subscribers(Smartphones)y g p
3 67 illi3.673.13 million
million(+0.54 million, yoy)
3.13 million
3.0 million
2 29 ll
llion2.0 million
2.29 million
1 0 million
iPhone
1.0 million
2月 3月 4月 5月 6月 7月 8月 9月 10月 11月 12月
paying subscribers for smartphones
0.32million0Feb Mar Apr May Jun Jul Aug Sep Oct Nov Dec
P8
paying subscribers for smartphones

Business Overview docomo”d-menu”
No.1 Continued on the docomo”d-menu”on the docomo d menu in each category . New serv
No.1
※ Source: Ranking data from “d-menu”, a portal site for smartphone services, by
” Rankingg
vices ranked up on the list!No.2
No.1 No.1
No.3No.3
©Eiichiro Oda/SHUEISHA Inc.
P9
NTT docomo Co., Ltd. as of January 21, 2013

Business Overview e-Book Service
Steadily increased in paying subscrib
¥315 per monthAll d lAll-you-can-read novels
iOS, AndroidTablets
Windows8iPhoneAndroid
¥315 to ¥5250 per monthAll-you-can-read comics
AndroidTablets
Under repair for adoption to iOS and Windows8
Android
©Eiichiro Oda/SHUEISHA Inc.
Tablets
bers.
¥315 per monthAll h d b kAll-you-can-hear audio books
©AIUEOKAN Co.,Ltd./Syogo HirataUnder repair for adoption to iPhone
iOS, AndroidTablets
Windows8Android
¥315 per monthAll-you-can-look at photo books
iOS, AndroidTablets
Windows8iPhoneAndroid
P10

Business Overview Consolidated Sub
Received steady orders for the de
"twitter","mixi","Faccan be operated for
Social news viewAvailable for checknews checked by fr
bsidiary Jibe Mobile y J
evelopment of carrier systems.
cebook","GREE" r only one time line.
werking in real time riends of yours.
P11

Business Overview mopita BusinesspAuthentication and payment platform
(Unit : million)
7.00
8.00
ID数(累計) 決済数
(Unit : million)
The number of Issued IDs(Accum) The number of paymen
4 00
5.00
6.00
2.00
3.00
4.00
.0
1.00
10/09 10/12 11/03 11/060/09 0/ /03 /06
※Softbank paymentp y
Achieved
7.00Achieved
millionissued IDs
・ Collaborated with the various point-services・ Increased to pay for purchases
nts
11/09 11/12 12/03 12/06 12/09 12/12/09 / /03 /06 /09 /
P12
※Mobile Suica is trademark resistered to East Japan Railway Company.

New ApAfter t
pproachthe 1st Quarter
P13

Basic Policy of the FY2013Basic Policy of the FY2013
E i i th N b f
yy
Expansion in the Number of
Focus on iPhone Users
Enlargement of Conten
New Approach
f P i S b ibf Paying Subscribers
nts Services
P14
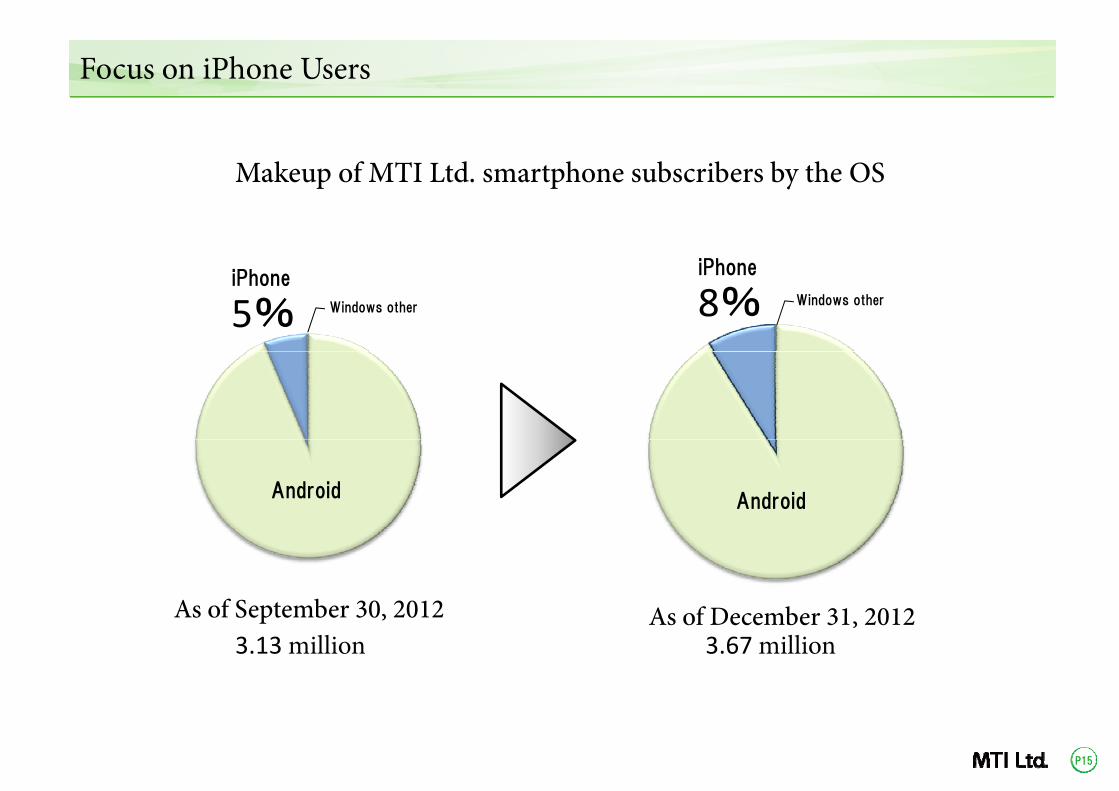
Focus on iPhone Users
Makeup of MTI Ltd smartpMakeup of MTI Ltd. smartp
iPhone
5% Windows other
Android
As of September 30, 2012As of September 30, 20123.13 million
phone subscribers by the OSphone subscribers by the OS
iPhone
8%iPhone
Windows other
Android
As of December 31 2012As of December 31, 20123.67 million
P15

Enlargement of Contents Services ⅰ)g )
~Distribution service of tStarted in Jan 2013Jan, 2013
music.jpjp
the high-quality sound high resolution~g q y g
Wh t’ “hi h l ti ”?Whats high resolution ?
・Sound quality:24bit/ 96kHz 24bit/192kHz etc24bit/ 96kHz, 24bit/192kHz etc.( CD; 16bit/44.1kHz)
・Device with play functions:High sound quality audio players/PCsHigh sound quality audio players/PCs
・Music data with broad frequency recording range
E h b l d
g g→ Sense of reality for richer music enjoyment.
Each song can be sampledfor 90 seconds before downloading.
P16
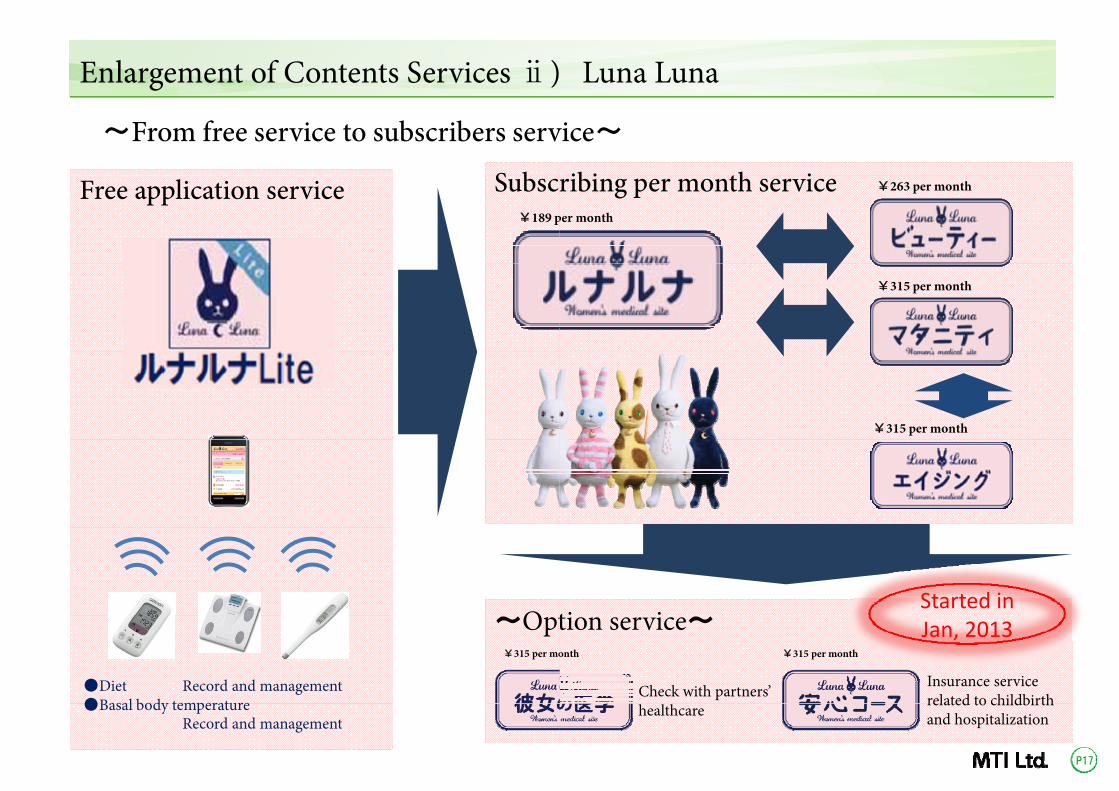
Enlargement of Contents Services ⅱ)
~From free service to subscribers serv
S b
g )
SubscrFree application service¥189 p
O t~Opt
●Diet Record and management●Basal body temperature
¥315 per mo
●Basal body temperature Record and management
Luna Luna
vice~
ibi th iribing per month service ¥263 per month
per month
¥315 per month
¥315 per month
ti iStarted in
tion service~onth ¥315 per month
Check with partners’ Insurance service related to childbirth
Jan, 2013
P17
healthcare related to childbirth and hospitalization

New Approach ⅰ) Healthcare-relate
Membership registration 1st “Gen¥315 per month
・Diagnostic result・Die
Inspection kit 3,980 ye
Diagnostic result
・Consult to specialist lightly.・Genetic test ordered gene kit.
ed Service
2nd “Gene kit”ne kit”
“Karadamedicagene skin care”
Started in Dec, 2012
In preparation
et record and management
en 3rd “Gene kit”
In preparation
P18

New Approach ⅱ) Social Activation
~For enlargement of our fans in main co
Search portal created by own users
Activates the whole music market!Activates the whole music market!
ontents~
Data management
Users communityUsers community
300 thousand members
P19
300 thousand members

Earnings Forecast for the First halfg
(Millions of yen) Q1 result 1st half forecas
Net sales 7,331 14,50,33 ,50Cost of sales 1,231 2,70Gross profit 6,099 11,80(Gross profit ratio) 83.2% 81.4Selling, general and administrative expenses 5,885 11,70p
Operating income 214 10
(Operating income ratio) 2.9% 0.7p g
Ordinary income 216 10(Ordinary income ratio) 2.9% 0.7( y ) 2.9% 0.7
Net income 185 5(Net income ratio) 2.5% 0.3
st Progress ratio
00 50.6%00 50.6%00 45.6%00 51.7%%
00 50.3%
00 214.6%
%
No forecast revision=================
・Actively developed advertising
00 216.0%%
Actively developed advertising campaigns in the release of smartphone new models.
%
50 370.7%%
P20

Appendix
P21

Trends in Consolidated Statements of
Year ended (Millions of yen)
Q1 Q2
Net sales 7,485 7,21Net sales 7,485 7,21
Cost of sales 1,597 1,40
5 887 5 80Gross profit 5,887 5,80(Gross profit ratio) 78.7% 80.5
Selling general and 4 916 5 62Selling, general and administrative expenses 4,916 5,62
Operating income 970 17(Operating income ratio) 13.0% 2.5
Ordinary income 961 17(Ordinary income ratio) 12.8% 2.5
Net income 183(Net income ratio) 2.5% -0.1
Income
September 30, 2012 Year ended S t b 30 2013p , September 30, 2013
Q3 Q4 Q1
15 7,251 7,429 7,33115 7,251 7,429 7,331
07 1,355 1,304 1,231
07 5 896 6 125 6 09907 5,896 6,125 6,0995% 81.3% 82.4% 83.2%
28 5 391 6 075 5 88528 5,391 6,075 5,885
79 504 49 2145% 7.0% 0.7% 2.9%
78 506 50 2165% 7.0% 0.7% 2.9%
-6 234 -301 185
P22
1% 3.2% -4.1% 2.5%

Trends in Consolidated Selling, General
Year ended(Millions of yen)
Year ended
Q1 Q2
l 4 916 5Total 4,916 5,
Advertising expenses 1,348 2,
Personal expenses 1,377 1,
Commission fee 823
S b 368Subcontract expenses 368
Depreciation 314
Other 683
and Administrative Expenses
d September 30 2012 Year ended September d September 30, 2012 30, 2013
Q3 Q4 Q1
628 5 391 6 075 5 885628 5,391 6,075 5,885
104 1,714 2,483 2,176
258 1,457 1,427 1,421
824 821 819 812
407 376 391 440407 376 391 440
343 373 402 424
689 647 552 609
P23
Thank you
〈ContaPlanning Relations & InvesPlanning Relations & Inves
TEL:+81-3-5333-6323Mail:ir@
www.m
This report contains forward-looking statements on business perfomanagement using the information available at the time. Actual reeconomic conditions or changes in internal or external business enlatent risks or various other factors. In addition, risk and uncertainffuture events.
very much.
act us〉stor Relations Developmentstor Relations Development
ormance based on the judgments, assumptions, and beliefs of esults may dier substantially due to changes in domestic or overseas nvironments or aspects of uncertainty contained in the forecasts, nty factors include unpredictable elements that could arise from