Financial Reporting Management Accounting: Voluntary ... Reporting and Management... · Income...
36
Financial Reporting & Management Accounting: Voluntary Redundancy A Report/Essay by George Blekas CITY Liberal Studies Affiliated Institution of the University of Sheffield February 2006 1
Transcript of Financial Reporting Management Accounting: Voluntary ... Reporting and Management... · Income...
Financial Reporting
&
Management Accounting:
Voluntary Redundancy
A Report/Essay by George Blekas
CITY Liberal Studies
Affiliated Institution of the
University of Sheffield
February 2006
1

Abstract
A Financial/Accounting investigation is being attempted having a Voluntary
Redundancy Program on the main stage. Its impact, over various entities such
as the balance sheet(s), financial ratios and individual accounts affected, is
considered. The task becomes more difficult since the investigation in question
is being complicated by posting of the financial results over two fiscal years. For
simplicity reasons it is assumed that the dates where this redundancy takes
place are single ones (i.e. a single day for each fiscal year), since the
investigation would have been diverted if it was meant to investigate the
redundancy issue equally spread over a period of time (i.e. few employees
leaving every day) .
Furthermore the cost of the salaries of the redundant employees is being
taken into consideration since the company has to bear the redundancy cost (i.e.
employees’ compensation) but on the other hand the total operating results are
diminishing due to not having to bear – anymore – the salaries of the departing
employees.
Focus is also being drawn on the way the relevant figures are being posted
keeping in mind the accounting rules of Valuation, Recognition and
Classification. Results are being drawn and interpreted utilizing Ratio analysis
on both the short-run (same fiscal year) and also the medium-run (next fiscal
year) and comparisons are being made on 2004/2005 figures with and without
the redundancy scheme.
2

Contents
1. Introduction p.4
2. Company Profile p.5
3. Voluntary Redundancy Program (VRP) p.6
4. Accounting Records’ Analysis p.7
5. Financial Statements’ Analysis p.8
6. 2004 Ratio Analysis p.10
a. Profit Margin, 2004 p.10
b. Return on Assets, 2004 p.11
c. Debt to Equity, 2004 p.12
d. Return on Equity, 2004 p.13
e. 2004 Ratio Analysis Summary p.13
7. 2005 Ratio Analysis p.14
a. Profit Margin, 2005 p.16
b. Return on Assets, 2005 p.16
c. Debt to Equity, 2005 p.17
d. Return on Equity, 2005 p.18
e. 2005 Ratio Analysis Summary & Comparison with 2004 p.18
8. Conclusion p.19
9. Literature Overview p.21
3

1) Introduction
A Financial Reporting investigation of a company’s report produces valuable
findings in crucial domains such as profitability and liquidity. These are actually
representing a firm’s overall picture and when properly monitored and analyzed
can pinpoint existing or even forthcoming problems. Furthermore these findings
can be a guide map pinpointing towards the direction – in general terms since
critical thinking is always required – of proper action(s) needed to be taken by
the management.
In our case an evaluation of the financial impact of employment redundancy
is being performed. We shall step into Chief Financing Officer’s (CFO) shoes in
order to study/evaluate the redundancy versus accounting and financial
implications. For this reason a case study will be utilized, based on actual data,
in order to shed light behind the numbers, or even better through them, and
reaching conclusions taking into consideration financial reporting and
accounting theories/principles.
Remark: Some of the presented figures might have a last decimal
discrepancy due to rounding.
4

2) Company Profile
Intracom S.A. (the Firm) is the largest multinational Information &
Communications Technology (ICT) solutions provider headquartered in Greece.
It was founded in 1977 and is listed on the Athens Stock Exchange since 1990.
The Firm serves primarily the following business markets:
• Telecommunications
• Government
• Banking & Enterprise
• Defence
The Firm’s activities are organized along three Sectors (Operating
Divisions): Telecommunications Systems, Services & Operations, and Defence
Electronics (appendix 1: Organizational Plan).
The Firm, at November 2005, was employing 2.995 professionals of whom
60% corresponds to higher education graduates with extensive scientific
training (appendix 2: Human Resources Distribution):
• 19% Postgraduate Studies (MSc, PhD)
• 40% University - College Degree
• 41% High School - Junior College Degree
In 2004, the Firm’s revenues reached €478M and profit before taxes
reached €36,1M.
5

3) Voluntary Redundancy Program (VRP)
Employment redundancy is “the planned process of cutting back on human
resources” (Hardy, 1986). On 1st of November 2004 the Firm announced its
VRP in an attempt to reduce its personnel. Eligible applicants were those
having at least two years of employment and also having a labour contract of
indefinite period. Both direct and indirect motives have been introduced
(additional compensation apart from the one specified by the law, insurance
coverage for a year after disengagement, etc). The program was initially
announced to end by the end of December 2004 while afterwards it has been
extended until 31/3/2005. For simplicity reasons it is assumed that the dates the
VRP takes place (i.e. the relevant accounts are being debited) are on
31/12/2004 and 31/3/2005, impacting the fiscal years 2004 and 2005
respectively, since the investigation would have been diverted if it was meant to
investigate a VRP equally spread over a period of time (i.e. few employees
departing every day)
Calculations performed based on applicants’ number along with the relevant
categorization of each of them (i.e. expertise, level of salary, etc), raised the
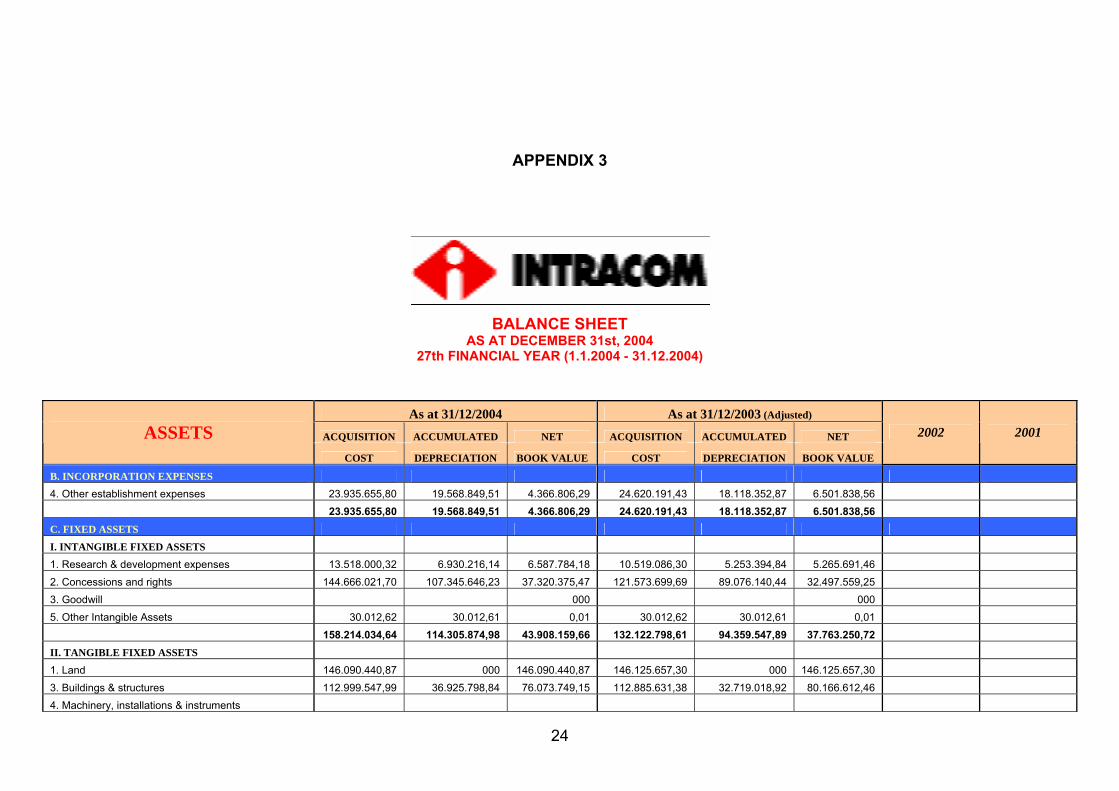
cost of the redundancy program to the amount of €11,490M. The Firm decided
to post the amount of €3,853M in the Profit and Loss Statement of the financial
year 2004, the amount of €4,418M to be covered by existing provision, while the
amount of €3,219M to be posted in the Profit and Loss Statement of the
financial year 2005 (appendix 3: 2004 Balance Sheet along with 2003 and
partially 2002 and 2001, appendix 4: VRP Posting Cost Summary). What is not
clear at the present point is whether the existing provisions account was going
6

to be utilized once (i.e. only 2004) or twice (for both 2004 and 2005) and by
which proportion. The issue is investigated further on.
4) Accounting Records’ Analysis
Employees willing to participate in the redundancy program have applied to
do so through the Human Resources Directorate. Utilizing this approach the
Firm had precise picture of the personnel (to be) involved in the program and
was able to perform custom tailoring according to its needs (upon program’s
announcement it was stated that it was on the Firm’s discretion to accept any
filled application).
The aforementioned allowed the Firm to have a precise cost calculation and
thus fulfilling the Valuation accounting rule. Parallel the Recognition rule has
also been addressed since the program span a two year – fiscal – period and
thus the required trimming – when/if needed – could have taken place (i.e
acceptance of application). The last – but not least – accounting rule of the
Classification has been addressed by Firm’s on a two-pole scheme:
• Administrative Expenses: part of the Profit & Loss account (i.e.
Income Statement). The relevant distribution has been performed
based on Firm’s decision of distribution of redundancy personnel over
the program’s period
• Provision for severance and retirement payment: The amount
remaining after the cost distribution on the Profit & Loss accounts of
2004 and 2005 is being recorded in this account. According to
7

relevant legislation the Firm is obliged to maintain such an account in
order to be able to compensate for severances and retirements. This
account is updated and presents a debit balance since 1987
Upon expiration of the program, on 31/3/2005, three hundred ninety one (391)
people have been successfully awarded.
5) Financial Statements’ Analysis
The Owners’ (i.e. shareholders) Equity & Liabilities Statement has been
impacted in its Provision for severance and retirement pay account. This – long
term liability – account at 31/12/2003 presented a credit balance of €6,239M
while at 31/12/2004 the same account presents a credit balance of €4,266M.
During 2004 only very few employees have been retired, and thus these can be
taken out of the equation, assuming that the difference of €1,973M was utilized
to cover a portion of the VRP. The Provisions account of 2004 has been debited
accordingly.
According to the Firm’s statement on 2004 Balance Sheet an amount of
€4,418M is to be debited to the Provisions account. Following the
aforementioned the amount of €4,418M - €1,973M = €2,445M was to be
debited on the 2005 Provisions account.
8

The Profit & Loss account has been similarly utilized and was debited for an
amount of €7,072M for both 2004 and 2005. This account is actually consisted
of three “sub-accounts” of:
• Administrative Expenses
• Research & Development Expenses
• Distribution Expenses
All of them have been debited accordingly based on the number of applicants
per category along with applicants’ “weight” (i.e. cost based on existing salary,
years of employment impacting on VRP compensation, etc) for the total of
€7,072M. According to the Firm’s decision this amount was distributed as
€3,853M on 2004 and €3,219M on 2005.
Summing up we have total debits of:
• 2004: €1,973M + €3,853Μ = €5,826Μ
• 2005: €2,445M + €3,219Μ = €5,664Μ
The aforementioned indicate how the Firm has distributed the cost over the
VRP’s period (1/11/2004 – 31/3/2005). Although VRP spans over two months of
2004 and three months of 2005 and while the time distribution percentages are
40% and 60% the actual cost distribution percentages are 49% and 51%
respectively. Based on the analysis performed on chapter 4 it can be deducted
that the Firm utilized the applications’ approvals the best way possible in order
to achieve acceptable cost distribution between the two fiscal years.
9

6) 2004 Ratio Analysis
Utilizing ratios analysis we can reach meaningful conclusions out of the
figures contained in the Balance Sheet(s) and the relevant statements. Its
primary purpose is to pinpoint areas needing further investigation (Needles,
2005) and thus allowing management to proceed to the relevant counter-
measurements. However “applied and interpreted intelligently, financial ratios
are very powerful analytical and planning tools, but they should carry a “wealth
warning” as their improper use can lead to erroneous diagnoses and invalid
conclusions” (McMenamin, 1999). These are analyzed below based on Firm’s
Balance Sheets impacted by the VRP (appendix 5: Ratio Analysis).
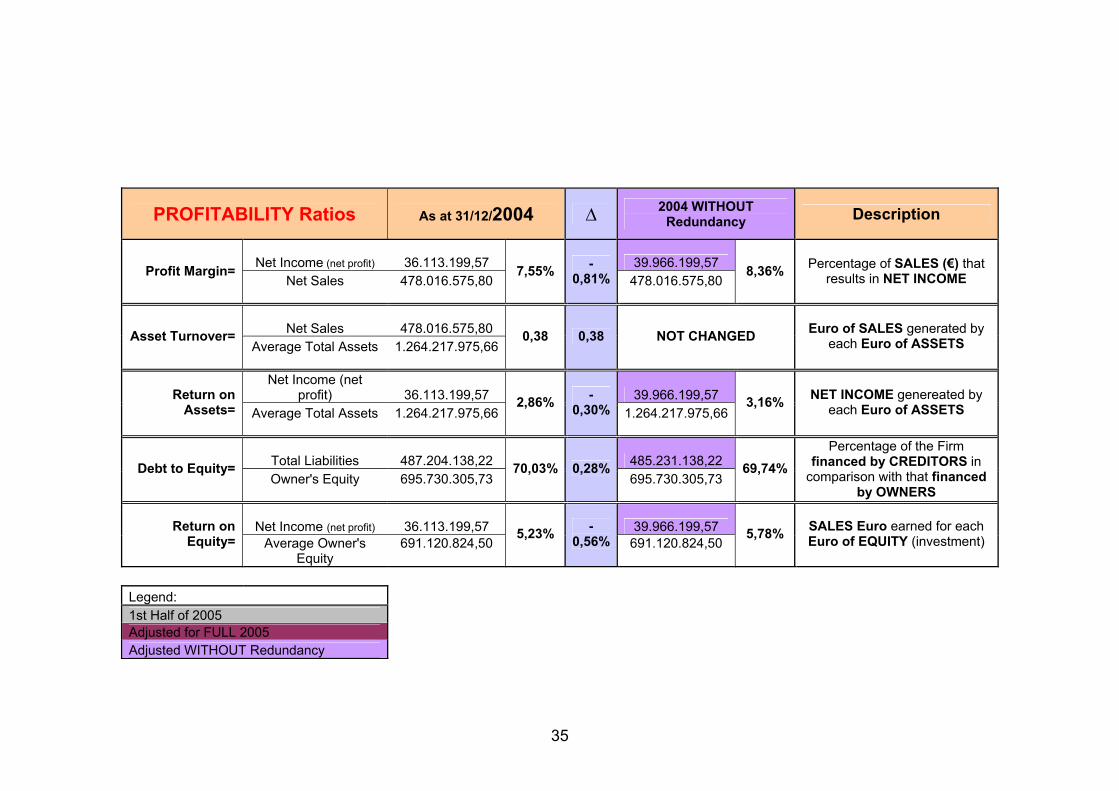
a) Profit Margin, 2004
A ratio presenting the percentage of the Sales resulted in Net Income:
Profit Margin = Sales Net
Income Net
In the Firm’s case, and for the year 2004, the ratio was:
Profit Margin = Sales Net
Income Net = €478,017Μ€36,113M = 7,55%
In case of not having implementing the VRP, the Firm would not have
debited its Profit & Loss account for an amount of €3,853M and thus would
have achieved an increased Net Income impacting its Profit Margin:
10

Profit Margin = Sales Net
Income Net = €478,017Μ€39,966M = 8,36%
A difference of -0,81 percent exists which translates into €0,81 less net
income received for – every Euro of – goods sold.
b) Return on Assets, 2004
Presents the relationship of achieved income per asset:
Return on Assets = AssetsTotal Average
Income Net
In the Firm’s case, and for the year 2004, the ratio was:
Return on Assets = AssetsTotal Average
Income Net = Μ€1.264,218
€36,113M = 2,86%
If VRP had not been implemented the Firm would not have debited its
Profit & Loss account for an amount of €3,853M and thus would have an
increased Net Income resulting in an increased Return on Assets:
Return on Assets = AssetsTotal Average
Income Net = Μ€1.264,218
€39,966M = 3,16%
The difference of -0,30 percent stands of €0,30 less income received for
every – Euro – of the Firm’s assets.
11

c) Debt to Equity, 2004
States the correlation of external financing (i.e. creditors) versus self
financing (i.e. stakeholders):
Debt to Equity = Equity Owners'
sLiabilitie Total
In the Firm’s case, and for the year 2004, the ratio has been calculated:
Debt to Equity = Equity Owners'
sLiabilitie Total = €695,730Μ€487,204M = 70,03%
VRP not having been implemented, the Firm would not have debited its
Owners’ Equity account for an amount of €1,973M, corresponding to
Provision for severance and retirement pay, and thus would have
experienced less Total Liabilities and consequently a better Debt to Equity
ratio:
Debt to Equity = Equity Owners'
sLiabilitie Total = €695,730Μ€485,231M = 69,74%
The interpretation of the aforementioned is that an additional percentage
of +0,28 percent of the Firm is being financed by its creditors.
12

d) Return on Equity, 2004
A ratio presenting the Net Income earned over Owners’ Equity
(averaged):
Return on Equity = Equity Owners' Average
Income Net
In the Firm’s case, and for the year 2004, the ratio was:
Return on Equity = Equity Owners' Average
Income Net = €691,121Μ€36,113M = 5,23%
In case VRP had not been implemented the Firm would not have debited
its Profit & Loss account for an amount of €3,853M and thus would have
achieved an increased Net Income impacting its Return on Equity:
Return on Equity = Equity Owners' Average
Income Net = €691,121Μ€39,966M = 5,78%
The difference of -0,55 percent stands of €0,55 less income received for
– every Euro of – the investment (i.e. Owners’ Equity).
e) 2004 Ratio Analysis Summary
Compared to the Firm not having implemented VRP it can be identified
that the overall Firm’s picture has diminished. The Firm has made less profit
13

per sales, achieved less return out of its assets, was financed more by
external sources instead of its own and had achieved less profit compared to
its investment. All of the aforementioned are valid but it is needed to be kept
in mind that this was a short-term analysis of the VRP’s impact.
7) 2005 Ratio Analysis
For the year 2005 the actual figures are available (i.e. published and made
public by the Firm) only for the first half of the year (appendix 6: Financial
Information 1/1/2005 – 30/6/2005) requiring some assumption(s) to be made in
order to obtain comparable figures. This can be that the Firm is not involved in a
seasonal business and thus it can be – quite safely – assumed that its business
volume on the second half of 2005 will be similar to that of the first half. This
involves mostly ratios such as Return on Assets and Return on Equity – heavily
impacted by Net Income – on which the numerator is being influenced by the
time period (i.e. first half versus whole 2005) while the denominator is – fairly –
stable over it, and less Debt to Equity – impacted by the Provision account.
The Profit and Loss account has been debited for an amount of €3,219M
due to the VRP. On the other hand VRP was completed on 31/3/2005 having
391 participants of whom, according to the cost distribution investigated on
chapter 5, 192 of them (49%) were posted during 2004 and the remaining 199
(51%) on 2005. Thus the salary cost of the 192 employees involved by
31/12/2004 has not debited this account at all as it should if the VRP had not
been performed. Similarly the salary cost of the remaining 199 employees
14

involved by 31/3/2005 has not debited this account, as it should if the VRP had
not been performed, for 2005Q2. In terms of figures, an approximation might be
utilizing the average monthly salary cost of an employ times the employees
involved in the VRP (for simplicity reasons we assume that employees have
been awarded on 31/12/2004 and 31/3/2005 respectively):
• 192 employees x €2.300 x 6 months = €2,650M
• 199 employees x €2.300 x 3 months = €1,373M
For the first half of the year 2005, the Firm had €4,023M less liabilities due to
VRP and thus the Profit & Loss account has totally been credited, instead of
debited, for the amount of €4,023M - €3,219M = €0,804M. Since for some ratios
we have to perform the calculations for the whole 2005 the relevant amounts
are:
• 192 employees x €2.300 x 12 months = €5,299M
• 199 employees x €2.300 x 9 months = €4,119M
So for the full year 2005, the Firm would have €9,418Μ less liabilities due to
VRP and thus the Profit & Loss account would, on the total, have been credited,
instead of debited, for the amount of €9,418Μ - €3,219M = €6,199M.
It is also assumed that in order to satisfy the accounting rule of Recognition
the amounts to be debited during 2005 due to VRP have been debited on the
first half where the VRP took place.
15
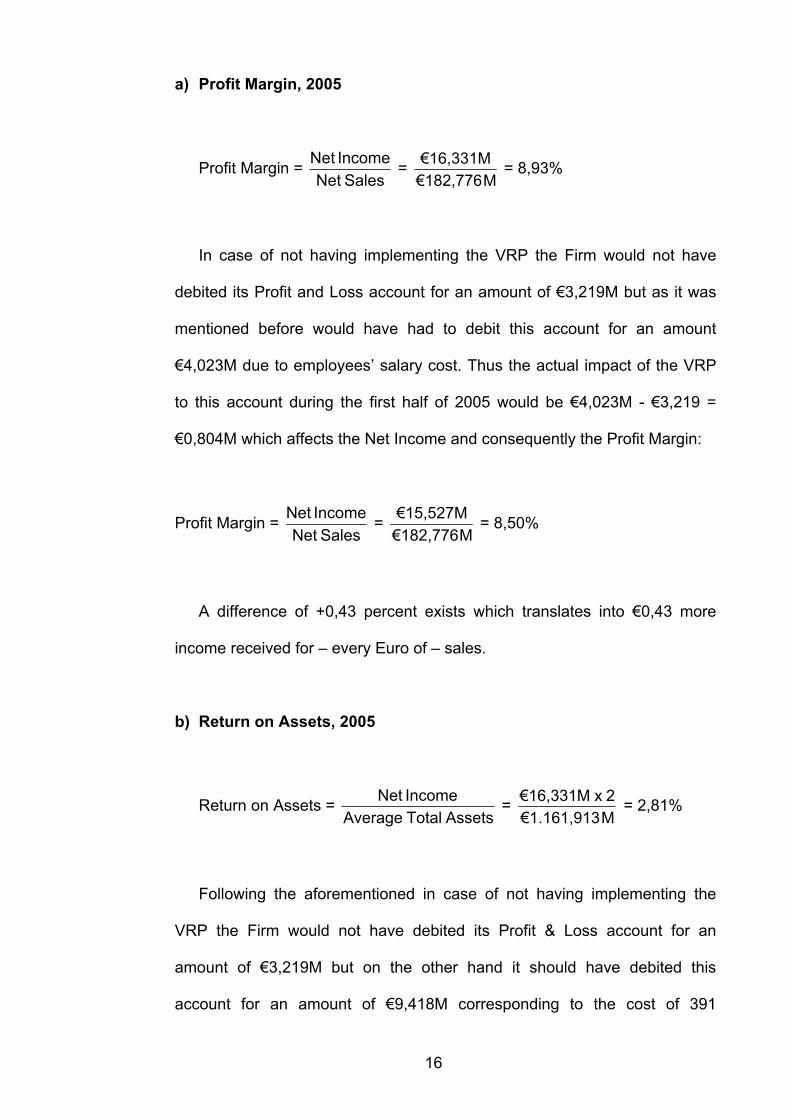
a) Profit Margin, 2005
Profit Margin = Sales Net
Income Net = €182,776Μ€16,331M = 8,93%
In case of not having implementing the VRP the Firm would not have
debited its Profit and Loss account for an amount of €3,219M but as it was
mentioned before would have had to debit this account for an amount
€4,023M due to employees’ salary cost. Thus the actual impact of the VRP
to this account during the first half of 2005 would be €4,023M - €3,219 =
€0,804M which affects the Net Income and consequently the Profit Margin:
Profit Margin = Sales Net
Income Net = €182,776Μ€15,527M = 8,50%
A difference of +0,43 percent exists which translates into €0,43 more
income received for – every Euro of – sales.
b) Return on Assets, 2005
Return on Assets = AssetsTotal Average
Income Net = Μ€1.161,9132 x €16,331M = 2,81%
Following the aforementioned in case of not having implementing the
VRP the Firm would not have debited its Profit & Loss account for an
amount of €3,219M but on the other hand it should have debited this
account for an amount of €9,418Μ corresponding to the cost of 391
16
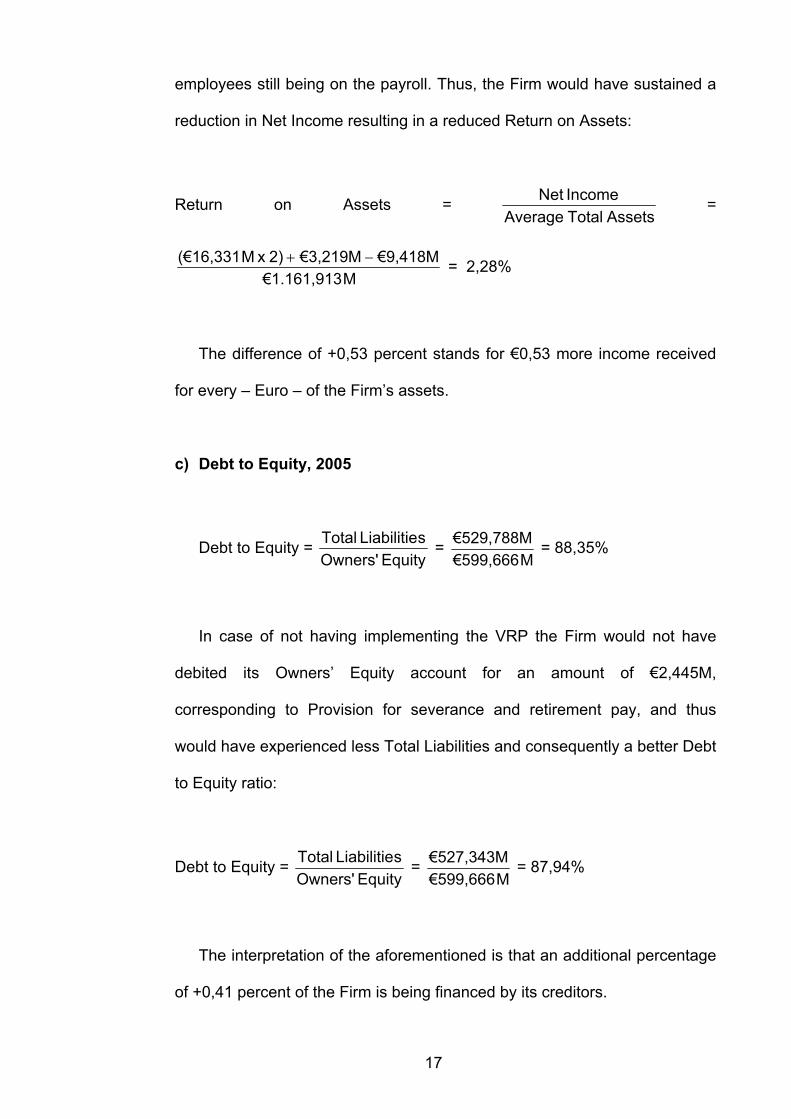
employees still being on the payroll. Thus, the Firm would have sustained a
reduction in Net Income resulting in a reduced Return on Assets:
Return on Assets = AssetsTotal Average
Income Net =
Μ€1.161,913€9,418M€3,219M 2) x (€16,331Μ −+ = 2,28%
The difference of +0,53 percent stands for €0,53 more income received
for every – Euro – of the Firm’s assets.
c) Debt to Equity, 2005
Debt to Equity = Equity Owners'
sLiabilitie Total = €599,666Μ€529,788M = 88,35%
In case of not having implementing the VRP the Firm would not have
debited its Owners’ Equity account for an amount of €2,445M,
corresponding to Provision for severance and retirement pay, and thus
would have experienced less Total Liabilities and consequently a better Debt
to Equity ratio:
Debt to Equity = Equity Owners'
sLiabilitie Total = €599,666Μ€527,343M = 87,94%
The interpretation of the aforementioned is that an additional percentage
of +0,41 percent of the Firm is being financed by its creditors.
17

d) Return on Equity, 2005
Return on Equity = Equity Owners' Average
Income Net = €647,698Μ
2 x €16,331M = 5,04%
In case of not having implementing the VRP the Firm would not have
debited its Profit and Loss account for an amount of €3,219M but it would
have had to debit this account for an amount €9,418M due to employees’
salary cost. Thus the actual impact of the VRP to this account during the first
half of 2005 would be €4,023M - €3,219 = €0,804M which affects the Net
Income and consequently the Profit Margin:
Return on Equity = Equity Owners' Average
Income Net =
€647,698Μ€9,418M€3,219M 2) x (€16,331Μ −+ = 4,09%
The difference of +0,96 percent stands of €0,96 more income received
for – every Euro of – the investment (i.e. Owners’ Equity).
e) 2005 Ratio Analysis Summary & Comparison with 2004
• The Profit Margin taking the VRP in mind has been improved from
7,55% on 2004 to 8,93% on 2005 for a difference of +1,38%.
Similarly, in case the VRP was not performed, the improvement of
2005 over 2004 would have been a mere +0,14% (8,36% for 2004
versus 8,50% for 2005)
18
• The Return on Assets has slightly diminished, by -0,05% (2,86%
for 2004 and 2,81% for 2005) while in case of not implementing
the VRP it would have diminished much more for a percentage of
-0,88% (3,16% for 2004 versus 2,28% for 2005)
• The Debt to Equity have increased from 70,03% in 2004 to
88,35% in 2005 for a total of +18,32% while in case of not having
the VRP the figures would have been 69,74% on 2004 versus
87,94% on 2005 for a similar difference of +18,20%
• The Return on Equity has diminished by -0,19% (5,23% on 2004
versus 5,04% on 2005) while by avoiding the VRP would have
diminished by -1,69% (5,78% on 2004 versus 4,09% on 2005)
8) Conclusion
Comparing the issue of having or not the VRP and its impact over the
various ratios it has been shown that although in the short term (i.e. 2004) all
ratios have diminished moderately (except Debt to Equity which actually works
in reverse) the situation have turned around on the middle run (i.e. 2005) where
the ratios have either simply mitigated (i.e. Profit Margin) or simply crossed over
to the positive side (i.e. Return on Assets, Return on Equity).
Furthermore, and by the general picture we presented on chapter 7e, it
seems that the financial results of the Firm would have been more depressing
instead of the present ones utilizing the VRP.
19

As presented a Voluntary Redundancy Program might prove to be a useful
tool for an organization in it’s pursuit of prosperity. However what needs to be
borne in mind is that the relevant timing, amount and category of personnel
involved, and lastly, but definitely not least, the proper posting of its financial
results.
20

Literature Review
Published Literature (Books/Journals)
• Hardy, C. (1986) Strategies for Redundancy: Reconciling Individual and
Organizational Needs. Canadian Journal of Administrative Science, 3,
p.275.
• McMenamin, J. (1999) Financial Management: An Introduction.
Routledge, p.322.
• Needles, B. et al (2005) Principles of Accounting. 9th Edition. USA,
Houghton Mifflin Company, p.765.
Online Literature/Sources
• Intracom S.A. (2006) Organisation. [online]. Available from:
http://www.intracom.gr/en/company/profile/organisation.htm [Accessed
23/2/2006]
• Intracom S.A. (2006) Human Resources. [online]. Available from:
http://www.intracom.gr/en/company/profile/human_resources.htm
[Accessed 23/2/2006]
• Intracom S.A. (2006) Investor Relations: Financial Statements. [online].
Available from: http://www.intracom.gr/en/invest/balance.htm [Accessed
8/2/2006]
21

APPENDIX 1
INTRACOM S.A. Organizational Plan
22

Human Resources Distribution by Educational Background
Human Resources Distribution by Function
23
APPENDIX 2
19% Postgraduate Studies (MSc, PhD)
40% University - College Degree 41% High School - Junior College Degree
Data: November 2005
21% Production-Systems Operation
14% Technical Support 20% Research & Development
22% Software Development 15% Administration/Finance
8% Marketing & Sales
Data: November 2005
APPENDIX 3
BALANCE SHEET
AS AT DECEMBER 31st, 2004 NANCIAL YEAR (1.1.2004 - 31.127th FI 2.2004)
As at 31/12/2004 As at 31/12/2003 (Adjusted)
ACQUISITION ACCUMULATED NET ACQUISITION ACCUMULATED NET ASSETS COST DEPRECIATION BOOK VALUE COST DEPRECIATION BOOK VALUE
2002 2001
B. INCORPORATION EXPENSES
4. Other establishment expenses 23.935.655,80 19.568.849,51 4.366.806,29 24.620.191,43 18.118.352,87 6.501.838,56 23.935.655,80 19.568.849,51 4.366.806,29 24.620.191,43 18.118.352,87 6.501.838,56 C. FIXED ASSETS
I. INTANGIBLE FIXED ASSETS
1. Research & development expenses 13.518.000,32 6.930.216,14 6.587.784,18 10.519.086,30 5.253.394,84 5.265.691,46
2. Concessions and rights 144.666.021,70 107.345.646,23 37.320.375,47 121.573.699,69 89.076.140,44 32.497.559,25 3. Goodwill 000 000
5. Other Intangible Assets 30.012,62 30.012,61 0,01 30.012,62 30.012,61 0,01 158.214.034,64 114.305.874,98 43.908.159,66 132.122.798,61 94.359.547,89 37.763.250,72 II. TANGIBLE FIXED ASSETS 1. Land 146.090.440,87 000 146.090.440,87 146.125.657,30 000 146.125.657,30
3. Buildings & structures 112.999.547,99 36.925.798,84 76.073.749,15 112.885.631,38 32.719.018,92 80.166.612,46 4. Machinery, installations & instruments
24

- Machinery 17.226.527,77 13.110.341,71 4.116.186,06 17.134.000,39 11.810.974,27 5.323.026,12
- Instruments 25.854.063,87 19.649.093,47 6.204.970,40 26.826.519,95 20.588.647,17 6.237.872,78
5. Motor Vehicles 1.128.305,43 870.248,53 258.056,90 1.278.202,89 982.828,68 295.374,21
6. Furniture & other equipment
- Furniture & fittings 15.974.965,61 12.320.032,91 3.654.932,70 15.346.771,23 10.796.260,30 4.550.510,93
- Office Equipment 1.174.914,80 1.020.507,93 154.406,87 1.207.632,11 972.759,11 234.873,00
- Computers 33.793.388,66 31.229.423,55 2.563.965,11 33.476.214,77 29.791.665,37 3.684.549,40 7. Tangible assets under construction & advances 15.183.239,29 000 15.183.239,29 13.845.382,80 000 13.845.382,80 369.425.394,29 115.125.446,94 254.299.947,35 368.126.012,82 107.662.153,82 260.463.859,00
INTANGIBLE & TANGIBLE FIXED ASSETS (CI+CII) 527.639.428,93 229.431.321,92 298.208.107,01 500.248.811,43 202.021.701,71 298.227.109,72
III. EQUITY PARTICIPATIONS AND OTHER LONG-TERM RECEIVABLES
1. Equity participations in related companies 129.245.074,20 140.136.254,90
2. Equity participations in other companies 19.468.775,61 19.509.505,49 Less: Provisions for devaluations 102.511.305,20 46.202.544,61 110.019.969,50 49.625.790,89
6. Long - Term Equity participations 374.864,10 000
7. Other long-term receivables 86.536.601,06 85.329.257,58 133.114.009,77 134.955.048,47
TOTAL FIXED ASSETS (CI+CII+CIII) 431.322.116,78 433.182.158,19
D. CURRENT ASSETS I. INVENTORIES 1. Merchandise 8.987.175,93 9.711.295,66
2. Finished and semifinished goods, by-products 50.467.181,63 56.757.037,08
3. Work in progress 19.045.199,81 17.308.094,16
4. Raw materials, spare parts & packing materials 69.636.908,55 69.296.696,84 5. Advances for inventory purchases 10.149.813,85 10.446.140,25 158.286.279,77 163.519.263,99
II. RECEIVABLES 1. Trade debtors 436.665.690,03 415.368.904,89
Less Provisions for bad & doubtful debts 6.102.453,00 430.563.237,03 6.114.205,90 409.254.698,99
25

3a. Cheques receivable 1.368.574,29 548.883,15
11. Sundry debtors 29.983.308,24 27.663.826,04 12. Account for the management of advances and credits 2.076.811,01 1.048.382,94 463.991.930,57 438.515.791,12 III. SECURITIES 1. Shares 18.772.384,56 21.555.368,58
4. Treasury stock 12.186.086,80 10.767.277,20
Less Provisions for devaluation of shares 14.872.907,76 16.085.563,60 9.257.285,88 23.065.359,90
IV. BANK AND CASH 1. Cash 1.054.410,49 1.279.311,73
3. Bank accounts 107.781.556,92 258.655.519,32 108.835.967,41 259.934.831,05
TOTAL CURRENT ASSETS (DI+DII+DIII+DIV) 747.199.741,35 885.035.246,06 834.720.070,00 926.733.367,00
E. TRANSITORY ASSET ACCOUNTS 1. Deferred expenses 6.015.501,76 2.901.915,22
2. Accrued income 3.986.148,53 5.554.192,17
3. Other transitory asset accounts 1.481.707,22 888.579,18
11.483.357,51 9.344.686,57
TOTAL ASSETS ( B + C + D + E ) 1.194.372.021,93 1.334.063.929,38 1.524.327.094,00 1.664.281.216,00 CONTINGENT DEBIT ACCOUNTS 2. Letters of Guarantee & guarantees granted 237.738.394,79 274.830.717,40
3. Receivables under dual binding contracts 548.592.822,30 682.679.820,00
4. Other contingent debit accounts 424.850.254,07 377.783.559,96
1.211.181.471,16 1.335.294.097,36
26

SHAREHOLDERS' EQUITY AND LIABILITIES
As at 31/12/2004
As at 31/12/2003
(Adjusted) 2002 2001
A. SHAREHOLDERS' EQUITY (SHARE CAPITAL & RESERVES) I. SHARE CAPITAL (130.826.005 Common Registered Shares of € 2,11each)
1. Paid up share capital 276.956.008,92 276.042.870,55 276.956.008,92 276.042.870,55 II. SHARE PREMIUM 1. Paid up share premium 190.909.970,91 190.576.184,21 190.909.970,91 190.576.184,21 III. REVALUATION & SUBSIDIES RESERVES
1. Reserves from equity participations and securities revaluation 844.661,29 815.321,35
3. Reserves from subsidies for investment in fixed assets 686.426,11 515.649,65 1.531.087,40 1.330.971,00 IV. RESERVES
1. Statutory reserve 26.718.725,66 25.518.725,66 3. Special reserves according to Law 1892/90 Article 23A & Law 2601/98, Article 3 8.069.112,25 8.069.112,25
4. Extraordinary reserves 70.106.438,83 65.466.471,55
5. Tax-exempt reserves arising from special legislation 109.004.390,46 108.700.435,92
6. Reserves for Treasury stock 12.186.086,80 10.767.277,20 226.084.754,00 218.522.022,58 V. RETAINED EARNINGS RESERVES
1. Profit carried forward 248.484,50 39.294,92
TOTAL SHAREHOLDERS' EQUITY (AI+AII+AIII+AIV+AV) 695.730.305,73 686.511.343,26 693.188.721,00 687.610.815,00 B. PROVISIONS 1. Provision for severance and retirement pay 4.266.328,53 6.238.647,13 8.122.866,00 6.668.289,00
2. Other provisions 3.773.661,44 3.763.633,37 8.039.989,97 10.002.280,50 C. LIABILITIES
27

I. LONG-TERM LIABILITIES
2. Bank loans 118.000.000,00 153.500.000,00 118.000.000,00 153.500.000,00
II. CURRENT LIABILITIES
1. Suppliers 111.579.081,45 102.927.633,64
2. Notes payable 1.945.307,29 2.024.465,16
3. Short-term bank loans 153.644.709,86 264.951.518,25 4. Trade debtors advances 66.280.645,40 67.058.338,18
5. Taxes payable 14.207.262,15 23.208.902,67
6. Social security 4.463.672,55 4.458.160,37
7. Long term liabilities payable within the next financial period 0 0
10. Dividends payable 13.125.877,20 12.820.157,50
11. Sundry accounts payable 3.957.582,32 4.016.723,58 369.204.138,22 481.465.899,35
TOTAL LIABILITIES (CI + CII) 487.204.138,22 634.965.899,35 506.124.551,00 784.835.623,00 D. TRANSITORY LIABILITY ACCOUNTS 1. Deferred income 36.949,04 221.114,68
2. Accrued expenses 1.338.818,62 1.962.336,67
3. Other transitory liability accounts 2.021.820,35 400.954,92 3.397.588,01 2.584.406,27
SHAREHOLDERS' EQUITY & TOTAL LIABILITIES ( A + B + C + D ) 1.194.372.021,93 1.334.063.929,38 CONTINGENT CREDIT ACCOUNTS
2. Letters of Guarantee and guarantees granted 237.738.394,79 274.830.717,40
3. Liabilities under dual binding contracts 548.592.822,30 682.679.820,00
4. Other contingent credit accounts 424.850.254,07 377.783.559,96
1.211.181.471,16 1.335.294.097,36
28

PROFIT and LOSS ACCOUNT at 31/12/2004 at 31/12/2003 (Adjusted) 2002 2001
I. OPERATING RESULTS Sales 478.016.575,80 494.019.426,97 687.121.487,00 770.481.103,00
Less : Cost of goods sold 333.012.636,60 345.027.164,81 Gross profit 145.003.939,20 148.992.262,16
Plus : Other operating income 987.391,73 1.657.088,96
TOTAL 145.991.330,93 150.649.351,12 Less :
1. Administrative expenses 38.245.030,94 43.118.077,38
2. Research and development expenses 26.512.439,82 35.551.861,21 3. Distribution Expenses 30.714.374,38 30.081.737,61 95.471.845,14 108.751.676,20
SUBTOTAL FOR OPERATING PROFIT 50.519.485,79 41.897.674,92 Plus :
1. Income from equity participations 9.161.741,57 13.084.426,95
2. Income from securities 211.502,56 435.650,60 3. Gains from the sale of equity participations & securities 387.822,40 30.824.825,00
4. Interest & other relevant income 299.811,77 10.060.878,30 1.536.642,12 45.881.544,67
Less : 1. Provisions against devaluation of equity participations & securities 41.349,00
2. Expenses & losses from securities 122.290,25 285.280,00
3. Interest & other relevant expenses 17.890.447,90 18.054.087,15 -7.993.208,85 36.696.565,89 36.981.845,89 8.899.698,78
NET OPERATING PROFIT 42.526.276,94 50.797.373,70
II. PLUS EXTRAORDINARY & OPERATING RESULTS 1. Extraordinary & non-operating income 6.789.468,06 4.899.197,75
2. Extraordinary gains 80.436,67 1.266.002,60
29

3. Prior years' income 1.003.705,90 2.234.308,25
4. Receipts from prior years provisions 1.139.103,92 9.012.714,55 8.526.735,40 16.926.244,00
Less: 1. Extraordinary & non-operating expenses 10.937.661,98 13.731.275,46
2. Extraordinary losses 407.644,39 2.863.949,61
3. Prior years' expenses 1.309.442,93 1.234.432,33
4. Provisions for bad & doubtful debts 1.701.098,14 14.355.847,44 -5.343.132,89 5.878.010,01 23.707.667,41 -6.781.423,41
NET OPERATING & EXTRAORDINARY PROFIT 37.183.144,05 44.015.950,29 Less: Depreciation of fixed assets 39.096.924,32 44.285.538,63
Less: Depreciation included in operating cost 38.026.979,84 1.069.944,48 43.242.418,12 1.043.120,51
PROFIT BEFORE TAX 36.113.199,57 42.972.829,78 102.826.087,00 128.189.256,00
30

APPROPRIATION ACCOUNT For the year
ended 31/12/2004
For the year ended
31/12/20043
PROFIT BEFORE TAX 36.113.199,57 42.972.829,78 (+) : Retained earnings brought forward 39.294,92 483.930,94 (-) : Tax audit differences from previous years 5.668.159,00 (+) : Reserves after tax to be distributed 2.360.032,72 1.598.673,65
TOTAL 38.512.527,21 39.387.275,37
Less: 1. Income tax 8.798.196,86 8.183.893,74 2. Other taxes not included in operating cost 561.159,05 2.866.652,01
PROFIT TO BE DISTRIBUTED 29.153.171,30 28.336.729,62 Profit is distributed as follows: 1. Statutory reserve 1.200.000,00 1.210.000,00 2. Dividends from current year profit 10.765.844,48 11.221.483,85 - Dividends from prior years profit 2.360.032,72 1.598.673,65 2a. Reserves for Own Shares buy back 1.418.809,60 10.767.277,20 5. Special & Extraordinary reserves 5a. Extraordinary reserves 7.000.000,00 3.185.000,00 5b. Special reserves according to Law 2601/98, Article 3 000 6. Tax-exempt reserves 000 6a. Reserves from tax-exempt income according to Law 3220/2004, Article 2 5.700.000,00 000 6b. Reserves from specially taxed income 000 7. Board of directors' fees 460.000,00 315.000,00 8. Retained earnings carried forward 248.484,50 39.294,92
29.153.171,30 28.336.729,62
31

NOTES: 1. Upon the 20/12/2004 decision of the Board of Directors, Company's Share Capital increased by € 913,138,37 through the issuance of 432,767 new shares and was paid up in cash. Upon the resolutions of the same decision, Company's "share premium reserves" account increased by € 333,786.70. The aforementioned amount was paid in from those who exercised their pre-emptive
roghts (L. 2190/1920,par. 9, art. 13), upon the decisions of the Shareholders General Meetings of 28/06/2000, 18/07/2001 and 12/06/2002.
2. According to Company’s decision, announced to the employees on 01/11/2004, a redundancy program was materialized. The total cost of this programme, as of today, amounts to
€ 11,489,997,37 of which (€ 4,417,899.52) is covered by existing provision. 3. The devaluation difference of “Equity Participations” and “Securities” account of € 5,396,045.46 was counterbalanced by existing reserves of L. 3229/2004, article 15.
4. The account "Equity participations and other long term receivables" includes overdue receivables of client abroad of Company’s Legal Advisor the recourse has significant probability to proliferate. Apart from this case, there are no litigation or other issues that can influence materially the Company’s assets and
liabilities structure and it’s financial position. 5. For compatibility reasons some figures of FY 2003 have been adjusted where needed.
32

APPENDIX 4
VRP Posting Cost Summary
Amount (€) (negative numbers corresponds to DEBIT)
Account
2005 1st Half of 2005
WITHOUT Redundancy
FULL 2005 WITHOUT
Redundancy 2004
TOTALS
Profit & Loss
Operating Expenses
Administrative Expenses -3.219.000 -4.022.700 -9.418.500 -
3.853.000 -7.072.000
Shareholders' Equity & Liabilities
Provisions
Provision for severance and retirement pay -2.445.000 0 0 -
1.973.000 -4.418.000
-5.664.000 -4.022.700 -9.418.500 -
5.826.000 -11.490.000 TOTALS
-11.490.000,00
Cost Distribution 49,30% 50,70%
33

APPENDIX 5
Ratio Analysis
PROFITABILITY Ratios As at 30/6/2005 ∆ 2005 WITHOUT Redundancy Description
Net Income (net profit) 16.331.000,00 15.527.300,00 Profit Margin= Net Sales 182.776.000,00
8,93% 0,44%182.776.000,00
8,50% Percentage of SALES (€) that results in NET INCOME
Net Sales 182.776.000,00 Asset Turnover= Average Total Assets 1.161.913.010,97
0,16 0,16 NOT CHANGED Euro of SALES generated by each Euro of ASSETS
Net Income (net profit) 32.662.000,00 26.462.500,00 Return on
Assets= Average Total Assets 1.161.913.010,972,81% 0,53%
1.161.913.010,972,28% NET INCOME genereated by
each Euro of ASSETS
Total Liabilities 529.788.000,00 527.343.000,00 Debt to Equity= Owner's Equity 599.666.000,00
88,35% 0,41%599.666.000,00
87,94%Percentage of the Firm
financed by CREDITORS in comparison with that financed
by OWNERS
Net Income (net profit) 32.662.000,00 26.462.500,00 Return on Equity= Average Owner's
Equity 647.698.152,87
5,04% 0,96%647.698.152,87
4,09% SALES Euro earned for each Euro of EQUITY (investment)
Legend: 1st Half of 2005 Adjusted for FULL 2005 Adjusted WITHOUT Redundancy
34
35
PROFITABILITY Ratios As at 31/12/2004 ∆ 2004 WITHOUT Redundancy Description
Net Income (net profit) 36.113.199,57 39.966.199,57 Profit Margin= Net Sales 478.016.575,80
7,55% -0,81% 478.016.575,80
8,36% Percentage of SALES (€) that results in NET INCOME
Net Sales 478.016.575,80 Asset Turnover= Average Total Assets 1.264.217.975,66
0,38 0,38 NOT CHANGED Euro of SALES generated by each Euro of ASSETS
Net Income (net profit) 36.113.199,57 39.966.199,57 Return on
Assets= Average Total Assets 1.264.217.975,662,86% -
0,30% 1.264.217.975,663,16% NET INCOME genereated by
each Euro of ASSETS
Total Liabilities 487.204.138,22 485.231.138,22 Debt to Equity= Owner's Equity 695.730.305,73
70,03% 0,28%695.730.305,73
69,74%Percentage of the Firm
financed by CREDITORS in comparison with that financed
by OWNERS
Net Income (net profit) 36.113.199,57 39.966.199,57 Return on Equity= Average Owner's
Equity 691.120.824,50
5,23% -0,56% 691.120.824,50
5,78% SALES Euro earned for each Euro of EQUITY (investment)
Legend: 1st Half of 2005 Adjusted for FULL 2005 Adjusted WITHOUT Redundancy

APPENDIX 6
FINANCIAL INFORMATION
For the period 1 January 2005 to 30 June 2005
36