FINANCIAL REPORT - lgpi.ca · FINANCIAL REPORT City of Saskatoon ... include only those revenues...
58
City of Saskatoon 2 0 0 8 A n n u a l R e p o r t 27 FINANCIAL REPORT City of Saskatoon Saskatchewan Canada
Transcript of FINANCIAL REPORT - lgpi.ca · FINANCIAL REPORT City of Saskatoon ... include only those revenues...

C i t y o f S a s k a t o o n 2 0 0 8 A n n u a l R e p o r t 27
FINANCIAL REPORTCity of Saskatoon
Saskatchewan Canada

28 C i t y o f S a s k a t o o n 2 0 0 8 A n n u a l R e p o r t C i t y o f S a s k a t o o n 2 0 0 8 A n n u a l R e p o r t
Management’s Report
The accompanying Consolidated Financial Statements and all other information contained in this Annual Report are the responsibility of management . The Consolidated Financial Statements have been prepared by management in accordance with Canadian generally accepted accounting principles for local governments established by the Public Sector Accounting Board (PSAB) of the Canadian Institute of Chartered Accountants (CICA) . The preparation of the statements necessarily includes some amounts which are based on the best estimates and judgements of management . Financial data elsewhere in the Annual Report is consistent with that of the financial statements .
To assist in its responsibility, management maintains accounting, budget and other controls to provide reasonable assurance that transactions are appropriately authorized and accurately recorded, that assets are properly accounted for and safeguarded and that financial records are reliable for the presentation of financial statements .
The Audit Committee of the City of Saskatoon comprises five elected officials who are appointed annually . The Committee recommends the engagement of the Internal and External Auditors, approves the annual and long-term audit plans, reviews the audit reports and the audited financial statements for presentation to City Council .
Deloitte & Touche, LLP, Chartered Accountants, the City’s appointed external auditors, have audited the Consolidated Financial Statements . Their report to the Mayor and City Council, stating the scope of their examination and opinion on the Consolidated Financial Statements, follows .
Murray Totland, P.Eng, MBA Marlys Bilanski, CMA, FCMACity Manager General Manager, Corporate Services
June 22, 2009

C i t y o f S a s k a t o o n 2 0 0 8 A n n u a l R e p o r t C i t y o f S a s k a t o o n 2 0 0 8 A n n u a l R e p o r t 29
Auditors’ ReportDeloitte & Touche LLP Chartered Accountants
His Worship the Mayor and City Council:
We have audited the Consolidated Statement of Financial Position of the City of Saskatoon as at December 31, 2008 and the Consolidated Statements of Financial Activities and the Changes in Financial Position for the year then ended . These financial statements are the responsibility of the City’s management . Our responsibility is to express an opinion on these financial statements based on our audit .
We conducted our audit in accordance with Canadian generally accepted auditing standards . Those standards require that we plan and perform the audit to obtain reasonable assurance whether the financial statements are free of material misstatement . An audit includes examining, on a test basis, evidence supporting the amounts and disclosures in the financial statements . An audit also includes assessing the accounting principles used and significant estimates made by management, as well as evaluating the overall financial statement presentation .
In our opinion, these consolidated financial statements present fairly, in all material respects, the financial position of the City of Saskatoon as at December 31, 2008 and the results of its operations and its changes in financial position for the year then ended in accordance with Canadian generally accepted accounting principles .
Our audit was conducted for the purpose of forming an opinion on the basic financial statements . The current year’s supplementary information included in the schedules and appendices is not a required part of the basic financial statements . Such supplementary information has been subjected to the auditing procedures applied in the basic financial statements and, in our opinion, is fairly stated, in all material respects, in relations to the basic financial statements taken as a whole .
Chartered AccountantsSaskatoon, Saskatchewan
April 24, 2009

30 C i t y o f S a s k a t o o n 2 0 0 8 A n n u a l R e p o r t C i t y o f S a s k a t o o n 2 0 0 8 A n n u a l R e p o r t
Consolidated Statement of Financial PositionAs at December 31, 2008 (in thousands of dollars)
2007 2008
Assets
Cash and Cash Equivalents (Note 2) $ 64,244 $ 76,297
Taxes Receivable (Note 3) 6,468 7,263
Accounts Receivable and User Charges (Note 3) 107,210 106,858
Loan Receivable (Note 4) 6,297 5,912
Land Inventory for Resale 20,728 41,531
Other Assets (Note 5) 5,366 5,167
Investments (Note 6) 147,790 150,554
Accrued Pension Asset (Note 8) 65,012 63,799
Total Financial Assets 423,115 457,381
Financial Liabilities
Accounts Payable and Accrued Liabilities (Note 9) 85,144 106,842
Deferred Revenue (Note 10) 66,561 70,865
Long-Term Liabilities (Note 11) 47,656 89,144
Employee Benefits Payable (Note 12) 20,310 21,419
Total Financial Liabilities 219,671 288,270
Total Net Financial Assets 203,444 169,111
Net Assets
Prepaid Expenditures 1,290 2,630
Inventory of Materials and Supplies 9,428 9,586
Total Non-Financial Assets 10,718 12,216
Total Net Assets $ 214,162 $ 181,327
See accompanying notes .

C i t y o f S a s k a t o o n 2 0 0 8 A n n u a l R e p o r t C i t y o f S a s k a t o o n 2 0 0 8 A n n u a l R e p o r t 31
2007 2008 2008 Budget (Unaudited)
Revenues
Taxation $ 119,171 $ 128,320 $ 127,741
Grants in Lieu of Taxes 4,147 4,345 4,305
User Charges 220,008 234,465 237,157
Federation of Canadian Municipalities 52 35 -
Government Transfers (Note 14) 46,224 63,982 42,081
Investment Income 10,757 12,690 9,514
Contribution from Developers 106,138 77,011 11,550
Other 58,451 62,703 60,290
Total Revenues 564,948 583,551 492,638
Expenditures
General Government 24,602 25,978 24,479
Transportation 102,005 94,337 91,709
Protection of Persons and Property 94,670 94,334 102,435
Recreation and Culture 80,575 110,569 71,854
Social and Family Services 2,429 2,212 2,022
Planning and Development 20,012 27,487 22,979
Property Purchases and Development 79,867 79,001 75,137
Saskatoon Light & Power 83,096 86,346 98,225
Environmental Health 65,842 85,755 112,758
Debt Servicing Costs 6,728 10,367 11,146
Total Expenditures 559,826 616,386 612,744
Excess (Deficiency) of Revenues over Expenditures 5,122 (32,835) (120,106)
Net Assets, Beginning of Year 209,040 214,162
Net Assets, End of Year (Note 13) $ 214,162 $ 181,327
See accompanying notes .
Consolidated Statement of Financial ActivitiesFor the Year Ended December 31, 2008 (in thousands of dollars)

32 C i t y o f S a s k a t o o n 2 0 0 8 A n n u a l R e p o r t C i t y o f S a s k a t o o n 2 0 0 8 A n n u a l R e p o r t
Consolidated Statement of Changes in Financial PositionFor the Year Ended December 31, 2008 (in thousands of dollars)
2007 2008
Cash Flows from (used in) Operating Activities:
Excess (Deficiency) of Revenues over Expenditures $ 5,122 $ (32,835)
Changes in Non-Cash Items
Taxes Receivable 1,996 (795)
Accounts Receivable and User Charges (38,357) 352
Loan Receivable 375 385
Land Inventory for Resale (6,478) (20,803)
Other Current Assets 785 199
Accrued Pension Asset (5,543) 1,213
Prepaid Expenditures 560 (1,340)
Inventory of Materials and Supplies (768) (158)
Accounts Payable and Accrued Liabilities 9,027 21,698
Deferred Revenue 52,748 4,304
Employee Benefits Payable 776 1,109
Total Cash from (used in) Operating Activities 20,243 (26,671)
Cash Flows used in Investing Activities:
Net Increase in Investments (2,763) (2,764)
Cash Flows from (used in) Financing Activities:
Debentures Issued 9,645 47,100
Long-Term Net Debt Repaid (4,708) (5,612)
Total Cash from Financing Activities 4,937 41,488
Net increase in Cash and Cash Equivalents 22,417 12,053
Cash and Cash Equivalents at beginning of period 41,827 64,244
Cash and Cash Equivalents at end of period $ 64,244 $ 76,297

C i t y o f S a s k a t o o n 2 0 0 8 A n n u a l R e p o r t C i t y o f S a s k a t o o n 2 0 0 8 A n n u a l R e p o r t 33
Notes to the Consolidated Financial StatementsFor the Year Ended December 31, 2008 (in thousands of dollars)
1. Accounting Policies
The consolidated financial statements of the City of Saskatoon (the City) are prepared by management in accordance with generally accepted accounting principles for local governments, as recommended by the Public Sector Accounting Board of the Canadian Institute of Chartered Accountants (CICA) . Significant aspects of the accounting policies adopted by the City are as follows:
a. Basis of Consolidation
i. Reporting Entity
The consolidated financial statements reflect the assets, liabilities, revenue, expenditures and fund balances of the reporting entity . The reporting entity is comprised of all organizations and enterprises accountable for the administration of their financial affairs and resources to the City and which are owned or controlled by the City, namely:
> General Revenue and Capital Funds> Board of Police Commissioners> Wastewater Utility> Storm Water Management Utility> Water Utility> Saskatoon Light & Power> Transit Utility> Mendel Art Gallery> Centennial Auditorium (Operating as TCU Place)> Saskatchewan Place (Operating as Credit Union Centre)> Saskatoon Public Library> Reserve Funds
All interfund loans, other than normal trade accounts payable/receivable, have been eliminated through the consolidation . Schedule 5, and supporting Appendices 1 to 7, include only those revenues and expenditures reflected in the City’s annual Operating Budget, which is prepared to identify the City’s property tax requirements . Excluded from this Schedule are the operations of the Mendel Art Gallery, TCU Place, Credit Union Centre, Saskatoon Public Library, and the Sinking Fund .
ii. Trust and Pension Funds
Trust funds (see Note 17) and pension funds and their related operations administered by the City are not reflected in the consolidated financial statements .
iii. Accounting for School Board Transactions
The taxation, other revenues, expenditures, assets and liabilities with respect to the operations of the school boards, are not reflected in the municipal fund balances of these financial statements . Amounts due to/from school boards are reported on the Consolidated Statement of Financial Position as accounts payable/accounts receivable .

34 C i t y o f S a s k a t o o n 2 0 0 8 A n n u a l R e p o r t C i t y o f S a s k a t o o n 2 0 0 8 A n n u a l R e p o r t
Notes to the Consolidated Financial StatementsFor the Year Ended December 31, 2008 (in thousands of dollars)
1. Accounting Policies (continued)
b. Basis of Accounting
i. Revenues
Revenues are accounted for in the period in which the transactions or events occurred that gave rise to the revenues . Funds from development charges for services that have not yet been provided at the time the charges are collected are accounted for as deferred revenue until used for the purposes specified . Expenditures are accounted for in the period the goods and services are acquired and a liability is incurred or transfers are due .
ii. Property Tax Revenue
Property tax revenue is based on assessments determined in accordance with Saskatchewan legislation and the formulas, principles and rules in the Saskatchewan Assessment Manual . Tax mill rates are established annually . Taxation revenues are recorded at the time tax billings are issued . Assessments are subject to appeal . A provision has been recorded in Accounts Payable and Accrued Liabilities for potential losses on assessment appeals outstanding as of December 31, 2008 .
iii. Inventories for Resale
Inventories held for resale are valued at the lower of cost and net realizable value . Cost is determined using average laid-in costs . Inventories of materials and supplies represent amounts to be financed in future years as these inventories are consumed .
iv. Land Inventory for Resale
Land inventory for resale is recorded at the lower of adjusted cost and net realizable value . Adjusted cost includes amounts for land acquisition and improvements to prepare the land for sale . Land is available for resale when approved for sale by the Land Bank Committee and when all municipal services have been completed .
v. Capital Outlay Financed by Long-Term Liabilities to be Recovered in Future Years
Capital outlay financed by long-term liabilities to be recovered in future years represents the outstanding principal portion of unmatured long-term liabilities for municipal expenditures, less Sinking Fund requirements (see Note 11) .
vi. Capitalization
The historical cost and accumulated depreciation for physical assets are not recorded for municipal purposes . Physical assets are reported as an expenditure on the Consolidated Statement of Financial Activities in the year of acquisition . The proceeds from debt issues for those physical assets financed by long-term indebtedness are reported on the Consolidated Statement of Financial Activities as amounts to be recovered .
vii. Investments
All investments are recorded at cost less any amounts written off to reflect a permanent decline in value . Premiums and discounts are amortized over the life of the investment . Investment transactions are accounted for at the settlement date . Investment income is recorded on the accrual basis .
viii. Development Charges
The City receives, either from private developers or as a result of the sale of its own developed properties, levies for services which have not yet been provided at the time the levies are collected . These revenues are not recognized until the applicable expenditures for such services are incurred .

C i t y o f S a s k a t o o n 2 0 0 8 A n n u a l R e p o r t C i t y o f S a s k a t o o n 2 0 0 8 A n n u a l R e p o r t 35
1. Accounting Policies (continued)
b. Basis of Accounting (continued)
ix. Property Development
The City is one of the primary property developers in the municipality . Expenditures relating to the servicing of new subdivisions within the City are charged against the prepaid services account (which forms part of the unexpended capital financing – see Note 13) . Proceeds from the sale of lots are credited to the prepaid services, land bank, or Property Realized Reserve for the applicable portion attributable to services or to land . Any property purchased for future land development is funded by the Property Realized Reserve .
x. Government Transfers
Government transfers are recognized in the financial statements as revenues in the period in which events giving rise to the transfer occur, providing the transfers are authorized, eligibility criteria have been met, and reasonable estimates can be made .
xi. Superannuation Contributions
The City of Saskatoon makes contributions to the General Superannuation, Part-Time and Seasonal Employee Superannuation, Police Superannuation, and Fire and Protective Services Department Superannuation Plans on behalf of its staff . Pension expenditures are recorded based on current service requirements and have been included as an expenditure in the current year .
xii. Use of Estimates
The preparation of consolidated financial statements in accordance with Canadian generally accepted accounting principles requires management to make estimates and assumptions that affect the reported amounts of assets and liabilities and disclosure of contingent assets and liabilities at the date of the consolidated financial statements and the reported amounts of revenues and expenses during the reporting period . Actual results could differ from those estimates and may have an impact on future periods .
xiii. Segmented Reporting
In April 2006, the CICA added Section PS2700, Segment Disclosures . This section establishes standards on how to provide for meaningful segmented reporting in government financial statements and is applicable to financial statements for fiscal years beginning on or after April 1, 2007 .
Segmented information on the Consolidated Financial Activities is presented on Schedule 4 . It is based on capital and operating services for both utilities and the general City programs, plus information on the Saskatoon Public Library, Mendel Art Gallery, TCU Place and Credit Union Centre .
xiv. Derivative Financial Instruments
The City has entered into two interest rate swap agreements with the Royal Bank of Canada in order to manage the interest rate exposure associated with its Banker’s Acceptance loans . The agreements arrange for the exchanging of the floating interest rate cash flows from the underlying debt instruments with fixed interest rate cash flows based on a notional amount . Because the long-term swap agreement effectively and completely hedges the interest costs on the underlying debt obligations, the City is reflecting the obligation as long-term debt .
Notes to the Consolidated Financial StatementsFor the Year Ended December 31, 2008 (in thousands of dollars)

36 C i t y o f S a s k a t o o n 2 0 0 8 A n n u a l R e p o r t C i t y o f S a s k a t o o n 2 0 0 8 A n n u a l R e p o r t
2. Cash And Cash Equivalents
Cost Market
2007 2008 2007 2008
Cash $ 11,596 $ 8,033 $ 11,596 $ 8,033
Treasury bills, provincial promissory notes, bankers acceptance, commercial paper 52,648 68,264 53,149 68,606
$ 64,244 $ 76,297 $ 64,745 $ 76,639
Effective interest rates are 1 .52 percent to 1 .82 percent .
3. Receivables
It is the normal practice of the City to review its accounts receivable on a regular basis and write off, against current operating revenues, any accounts which are considered to be uncollectable . A general allowance of $1,202 (2007 - $1,597) for uncollectable taxes is included in the balance of Taxes Receivable .
4. Loan Receivable
City Bylaw No . 8418 was approved by City Council in 2005 to authorize a 15 year loan in the amount of $10,550 from the City to Saskatoon Soccer Centre Inc . for the construction of the North East Soccer Park, in Forest Park, in Saskatoon . The total annual payment under the loan is shared by Saskatoon Soccer Centre Inc . and the City resulting in an amount receivable from the Saskatoon Soccer Centre Inc . of $7,037 and a deferred grant of $3,513 that is amortized over the life of the loan payments . Interest is recognized as earned at 2 .80 percent to 4 .60 percent over the life of the loan . Security on the loan is by way of an assignment lease against the Henk Ruys Soccer Centre and the North East Soccer Park . The amount receivable and deferred grant as at the end of December 31, 2008 are $5,912 and $2,951 respectively .
5. Other Assets
2007 2008
Deferred Charges $ 5,184 $ 4,973
Other Inventory for Resale 182 194
$ 5,366 $ 5,167
6. Investments
Cost Market
2007 2008 2007 2008
Federal, provincial, municipal, federal government agency, and corporate bonds . $ 147,790 $ 150,554 $ 148,111 $ 157,833
Maturities are between 2009 - 2018 with effective interest rates of 1 .08 percent to 5 .25 percent .
Notes to the Consolidated Financial StatementsFor the Year Ended December 31, 2008 (in thousands of dollars)
C i t y o f S a s k a t o o n 2 0 0 8 A n n u a l R e p o r t C i t y o f S a s k a t o o n 2 0 0 8 A n n u a l R e p o r t 37
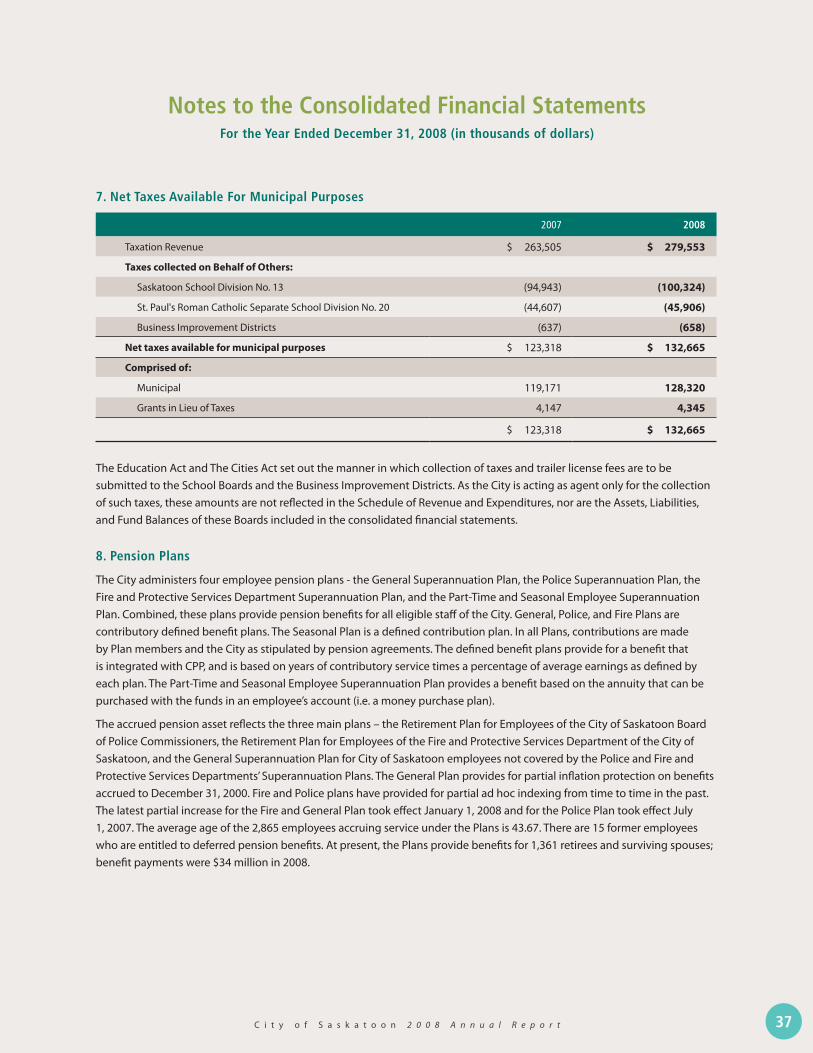
7. Net Taxes Available For Municipal Purposes
2007 2008
Taxation Revenue $ 263,505 $ 279,553
Taxes collected on Behalf of Others:
Saskatoon School Division No . 13 (94,943) (100,324)
St . Paul's Roman Catholic Separate School Division No . 20 (44,607) (45,906)
Business Improvement Districts (637) (658)
Net taxes available for municipal purposes $ 123,318 $ 132,665
Comprised of:
Municipal 119,171 128,320
Grants in Lieu of Taxes 4,147 4,345
$ 123,318 $ 132,665
The Education Act and The Cities Act set out the manner in which collection of taxes and trailer license fees are to be submitted to the School Boards and the Business Improvement Districts . As the City is acting as agent only for the collection of such taxes, these amounts are not reflected in the Schedule of Revenue and Expenditures, nor are the Assets, Liabilities, and Fund Balances of these Boards included in the consolidated financial statements .
8. Pension Plans
The City administers four employee pension plans - the General Superannuation Plan, the Police Superannuation Plan, the Fire and Protective Services Department Superannuation Plan, and the Part-Time and Seasonal Employee Superannuation Plan . Combined, these plans provide pension benefits for all eligible staff of the City . General, Police, and Fire Plans are contributory defined benefit plans . The Seasonal Plan is a defined contribution plan . In all Plans, contributions are made by Plan members and the City as stipulated by pension agreements . The defined benefit plans provide for a benefit that is integrated with CPP, and is based on years of contributory service times a percentage of average earnings as defined by each plan . The Part-Time and Seasonal Employee Superannuation Plan provides a benefit based on the annuity that can be purchased with the funds in an employee’s account (i .e . a money purchase plan) .
The accrued pension asset reflects the three main plans – the Retirement Plan for Employees of the City of Saskatoon Board of Police Commissioners, the Retirement Plan for Employees of the Fire and Protective Services Department of the City of Saskatoon, and the General Superannuation Plan for City of Saskatoon employees not covered by the Police and Fire and Protective Services Departments’ Superannuation Plans . The General Plan provides for partial inflation protection on benefits accrued to December 31, 2000 . Fire and Police plans have provided for partial ad hoc indexing from time to time in the past . The latest partial increase for the Fire and General Plan took effect January 1, 2008 and for the Police Plan took effect July 1, 2007 . The average age of the 2,865 employees accruing service under the Plans is 43 .67 . There are 15 former employees who are entitled to deferred pension benefits . At present, the Plans provide benefits for 1,361 retirees and surviving spouses; benefit payments were $34 million in 2008 .
Notes to the Consolidated Financial StatementsFor the Year Ended December 31, 2008 (in thousands of dollars)

38 C i t y o f S a s k a t o o n 2 0 0 8 A n n u a l R e p o r t C i t y o f S a s k a t o o n 2 0 0 8 A n n u a l R e p o r t
8. Pension Plans (continued)
Employees make contributions of approximately 6 .8 percent of salary (7 .0 percent for Police Plan members) and the City (Board of Police Commissioners) contributes an equal amount . In 2008, total contributions for current service were $24 million . A separate pension fund is maintained for each Plan . Pension fund assets are invested entirely in marketable investments of organizations external to the City . The pension liability at December 31 includes the following components:
2007 2008
Accrued benefit obligation $ (768,728) $ (842,216)
Pension fund assets
Marketable securities 847,613 777,292
78,885 (64,924)
Unamortized actuarial (gains) losses (11,173) 128,723
Accrued benefit asset 67,712 63,799
Valuation allowance (2,700) –
Net carrying value of accrued benefit asset $ 65,012 $ 63,799
Actuarial valuations for accounting purposes are performed at least triennially using the projected benefit method prorated on services . The most recent valuations were prepared by AON Consulting for all three Plans as at December 31, 2007 . The accrued benefit obligations shown for 2008 is based on an extrapolation of the 2007 valuations . There is a net unamortized actuarial loss to be amortized on a straight-line basis over the expected average remaining service life of the related employee groups applicable to each of the Plans (13 .40 years on average) .
The actuarial valuations were based on a number of assumptions about future events, such as inflation rates, interest rates, wage and salary increases, and employee turnover and mortality . The assumptions used represent the City’s best estimates . The expected inflation rate is 3 .5 percent (3 .0 percent for the Fire Plan) . The discount rate used to determine the accrued benefit obligation is 6 .25 percent .
Pension fund assets are valued using a market-related value which amortizes realized and unrealized gains and losses over a five-year period . The expected rate of return on Plan assets is 6 .25 percent . The actual rate of return on Plan assets in 2008 was -6 .65 percent . The market value of assets at January 1, 2008 and December 31, 2008 was $856,982 and $706,628 respectively .
Notes to the Consolidated Financial StatementsFor the Year Ended December 31, 2008 (in thousands of dollars)

C i t y o f S a s k a t o o n 2 0 0 8 A n n u a l R e p o r t C i t y o f S a s k a t o o n 2 0 0 8 A n n u a l R e p o r t 39
8. Pension Plans (continued)
The total expenditures related to pensions in 2008 include the following components:
2007 2008
Current period benefit cost $ 26,121 $ 30,259
Less: Employee contributions (9,598) (11,944)
Plan amendments 9,177 3,799
Amortization of actuarial (gain) loss 190 (18)
Decrease in valuation allowance (16,588) (2,700)
Pension expenditure 9,302 19,396
Interest cost on the average accrued benefit obligation 46,311 48,841
Expected return on average pension plan assets (51,624) (55,208)
Pension interest expenditure (5,313) (6,367)
Total expenditures related to pensions $ 3,989 $ 13,029
9. Accounts Payable
Included in liabilities is $6,089 (2007 - $4,655) of the estimated total landfill closure and post closure care expenditures of $6,324 . The balance is included under Reserves (Landfill Reserve) . The estimated liability for these expenditures is recognized as the landfill site’s capacity is used and the reported liability represents the portion of the estimated total expenditures recognized as at December 31, 2008, based on the cumulative capacity used at that date, compared to the total estimated landfill capacity . Estimated total expenditures represent the sum of the discounted future cash flows for closure and post closure care activities discounted at the City’s average long-term borrowing rate of 4 .22 percent .
Landfill closure and post closure care requirements have been defined in accordance with industry standards and include final covering and landscaping of the landfill, pumping of ground water and leachates from the site, and ongoing environmental monitoring, site inspection, and maintenance . The reported liability is based on estimates and assumptions with respect to events extending over a forty-year period using the best information available to management . Future events may result in significant changes to the estimated total expenditures, capacity used or total capacity and the estimated liability, and would be recognized prospectively, as a change in estimate, when applicable .
The estimated remaining capacity of the landfill is 39 .61 percent of its total estimated capacity and its estimated remaining life is 20 years . The period for post closure care is estimated to be 40 years .
Notes to the Consolidated Financial StatementsFor the Year Ended December 31, 2008 (in thousands of dollars)

40 C i t y o f S a s k a t o o n 2 0 0 8 A n n u a l R e p o r t C i t y o f S a s k a t o o n 2 0 0 8 A n n u a l R e p o r t
10. Deferred Revenue
2007 2008
Development Charges $ 28,188 $ 40,536
Government Transfers 27,857 12,971
Ticket Sales and Other 10,516 17,358
$ 66,561 $ 70,865
11. Long-Term Liabilities
a. Debt
Year Repayable 2007 2008
2008 $ 5,612 $ –
2009 4,846 10,322
2010 5,049 10,726
2011 5,269 11,156
2012 5,509 11,612
2013 3,559 9,888
2014 3,711 6,964
2015 3,874 7,258
2016 1,565 5,085
2017 1,634 5,296
2018 1,705 5,514
2019 1,781 1,781
2020 1,862 1,862
2021 821 821
2022 859 859
Total Debt 47,656 89,144
Sinking funds accumulated to retire debt (910) –
Net Debt $ 46,746 $ 89,144
Interest rates range from 1 .75 percent to 10 .5 percent . All long-term debt instruments have been issued in Canadian Funds .
Notes to the Consolidated Financial StatementsFor the Year Ended December 31, 2008 (in thousands of dollars)

C i t y o f S a s k a t o o n 2 0 0 8 A n n u a l R e p o r t C i t y o f S a s k a t o o n 2 0 0 8 A n n u a l R e p o r t 41
11. Long-Term Liabilities (continued)
b. Derivative Financial Instruments
2007 2008
Royal Bank Banker's Acceptance Loan - offering rate plus spread of 0 .20% revolves quarterly at progressively smaller amounts until October 2013 (offering rate at December 31, 2008 was 2 .68286%)
– $ 15,000
Long-term financial instrument created by interest rate swap agreement - 3 .00% terminates October 2013
(notional amount equal to above)
Royal Bank Banker’s Acceptance Loan - offering rate plus spread of 0 .20%, revolves quarterly at progressively smaller amounts until October 2018 (offering rate at December 31, 2008 was 2 .68286%)
– $ 32,100
Long-term financial instrument created by interest rate swap agreement - 3 .58% terminates October 2018
(notional amount equal to above)
Total – $ 47,100
c. Regulations
The regulations under The Cities Act require that individual debenture issue bylaws be submitted, reviewed, and approved by the Saskatchewan Municipal Board (SMB) with the exception that an urban municipality with a population greater than 30,000 can apply to the SMB for a debt limit . The City’s debt limit is $298,000 as approved by the SMB .
d. Long-term investments held by the City
Of the total long-term liabilities of $89,144 (2007 - $47,656) the following are held by the City as long-term investments:
2007 2008
Consolidated Funds $ 1,071 $ –
12. Employee Benefits Payable
Vacation leave is credited to employees on a monthly basis based on contractual obligations . Such credits are accumulated from the period April 1 to March 31 and may not be taken in advance . Therefore, credits earned from April 1, 2008 to December 31, 2008 would normally be available to employees after April 1, 2009 .
The City operates a number of Sick Leave Benefit Plans as stipulated within agreements with the various Unions and Associations of employees . These plans are based on the accumulation of sick leave credits to a specified maximum, or are guaranteed long-term disability plans . For those Unions with accumulated sick leave plans, the employee is entitled to a cash payment under specified circumstances, including retirements, based upon a formula stipulated in the union agreements .
Notes to the Consolidated Financial StatementsFor the Year Ended December 31, 2008 (in thousands of dollars)

42 C i t y o f S a s k a t o o n 2 0 0 8 A n n u a l R e p o r t C i t y o f S a s k a t o o n 2 0 0 8 A n n u a l R e p o r t
12. Employee Benefits Payable (continued)
Employee benefits payable are recorded as financial liabilities on the Consolidated Statement of Financial Position, offset by a reduction in fund balances . The total of these liabilities is as follows:
2007 2008
a) Vacation leave accrual $ 13,850 $ 15,177
b) Sick leave credits 6,460 6,242
$ 20,310 $ 21,419
13. Net Assets
2007 2008
Fund Balances
Funds to offset taxation or user charges in future years (Schedule 1) $ 38,615 $ 35,049
Unexpended capital financing (Schedule 2) 97,793 127,151
Reserves (Schedule 3) 119,082 87,396
$ 255,490 $ 249,596
Amounts to be Recovered
Capital outlay financed by long-term liabilities to be recovered in future years (Note 1b(v)) (41,328) (68,269)
Total Net Assets $ 214,162 $ 181,327
14. Government Transfers
The following transfers have been included in revenues:
2007 2008
Operating Transfers
Federal $ 607 $ 1,031
Provincial 22,775 25,856
23,382 26,887
Capital Transfers
Federal 12,757 23,248
Provincial 10,085 13,847
22,842 37,095
$ 46,224 $ 63,982
Notes to the Consolidated Financial StatementsFor the Year Ended December 31, 2008 (in thousands of dollars)
C i t y o f S a s k a t o o n 2 0 0 8 A n n u a l R e p o r t C i t y o f S a s k a t o o n 2 0 0 8 A n n u a l R e p o r t 43
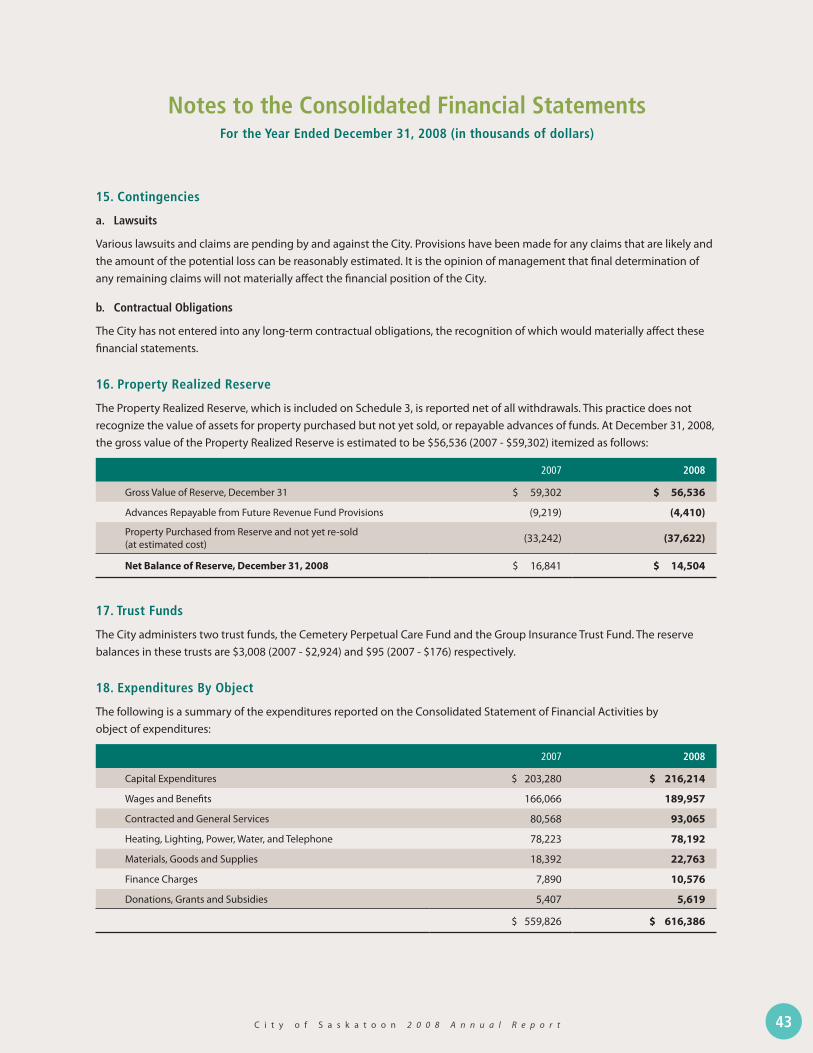
15. Contingencies
a. Lawsuits
Various lawsuits and claims are pending by and against the City . Provisions have been made for any claims that are likely and the amount of the potential loss can be reasonably estimated . It is the opinion of management that final determination of any remaining claims will not materially affect the financial position of the City .
b. Contractual Obligations
The City has not entered into any long-term contractual obligations, the recognition of which would materially affect these financial statements .
16. Property Realized Reserve
The Property Realized Reserve, which is included on Schedule 3, is reported net of all withdrawals . This practice does not recognize the value of assets for property purchased but not yet sold, or repayable advances of funds . At December 31, 2008, the gross value of the Property Realized Reserve is estimated to be $56,536 (2007 - $59,302) itemized as follows:
2007 2008
Gross Value of Reserve, December 31 $ 59,302 $ 56,536
Advances Repayable from Future Revenue Fund Provisions (9,219) (4,410)
Property Purchased from Reserve and not yet re-sold (at estimated cost) (33,242) (37,622)
Net Balance of Reserve, December 31, 2008 $ 16,841 $ 14,504
17. Trust Funds
The City administers two trust funds, the Cemetery Perpetual Care Fund and the Group Insurance Trust Fund . The reserve balances in these trusts are $3,008 (2007 - $2,924) and $95 (2007 - $176) respectively .
18. Expenditures By Object
The following is a summary of the expenditures reported on the Consolidated Statement of Financial Activities by object of expenditures:
2007 2008
Capital Expenditures $ 203,280 $ 216,214
Wages and Benefits 166,066 189,957
Contracted and General Services 80,568 93,065
Heating, Lighting, Power, Water, and Telephone 78,223 78,192
Materials, Goods and Supplies 18,392 22,763
Finance Charges 7,890 10,576
Donations, Grants and Subsidies 5,407 5,619
$ 559,826 $ 616,386
Notes to the Consolidated Financial StatementsFor the Year Ended December 31, 2008 (in thousands of dollars)

44 C i t y o f S a s k a t o o n 2 0 0 8 A n n u a l R e p o r t C i t y o f S a s k a t o o n 2 0 0 8 A n n u a l R e p o r t
19. Comparative Figures
a. Reclassified to conform with current year
Certain comparative figures have been reclassified to conform with the current year’s consolidated financial statements presentation .
20. Future Accounting Policies
a. Tangible Capital Assets
In September 2006, the CICA revised Section PS 3150, Tangible Capital Assets . This section establishes standards on how to account for and report tangible capital assets in government financial statements and will be applicable to financial statements for fiscal years beginning on or after January 1, 2009 . This section applies to all levels of government, including local government . The impact of this section has not yet been determined .
Public Sector Guideline 7 requires the disclosure of tangible capital asset information in the notes to the financial statements to the extent that reliable information is available . The City is currently working on a plan to implement PS 3150 but as at December 31, 2008 the City does not have detailed tangible capital asset information to disclose . For the year ended December 31, 2008 tangible capital expenditures incurred during the year are recorded as capital expenditures in the consolidated statements of financial activities .
b. Financial Statement Concepts, Objectives and Presentation
In January 2007, the CICA revised Section PS 1000, Financial Statement Concepts, Section PS 1100, Financial Statement Objectives and Section PS 1200, Financial Statement Presentation . The revised Sections will be applicable to financial statements relating to fiscal years beginning on or after January 1, 2009 . These sections will be applicable to local governments and replaces Section PS 1700, Objective of Financial Statements – Local Governments, and Section PS 1800, General Standards of Financial Statement Presentation – Local Governments . Section PS 1000 on financial statement concepts outlines the conceptual framework for accounting by governments . Section PS 1100 on financial statement objectives sets out the objectives related to government financial statements, reporting financial positions, annual results, changes in net debt and cash flows, and objectives related to legislative control and financial accountability . Section PS 1200 on presentation establishes standards for presentation and disclosure of information in government financial statements .
Notes to the Consolidated Financial StatementsFor the Year Ended December 31, 2008 (in thousands of dollars)

C i t y o f S a s k a t o o n 2 0 0 8 A n n u a l R e p o r t C i t y o f S a s k a t o o n 2 0 0 8 A n n u a l R e p o r t 45
2007 2008
Balance, Beginning of Year $ 34,704 $ 38,615
Transfer from Revenue Stabilization Reserve 1,843 1,432
Decrease in Employee Benefit Payables (776) (1,109)
Increase (Decrease) in Accrued Pension Asset 5,543 (1,213)
Increase in Landfill Closure/Post Closure Care Liability (1,267) (1,434)
Deficit for the Year (Schedule 5) (1,432) (1,242)
Balance, End of Year $ 38,615 $ 35,049
Schedule 1 - Schedule of Funds to Offset Taxation or User Charges in Future Years
For the Year Ended December 31, 2008 (in thousands of dollars)

46 C i t y o f S a s k a t o o n 2 0 0 8 A n n u a l R e p o r t C i t y o f S a s k a t o o n 2 0 0 8 A n n u a l R e p o r t
Schedule 2 - Schedule of Capital Operations
For the Year Ended December 31, 2008 (in thousands of dollars)
2007 2008 2008 Budget (unaudited)
Source of Funds
Province of Saskatchewan $ 10,046 $ 943 $ 708
Saskatchewan Water Corporation 27 712 677
Federal Gas Tax Program – 11,327 –
Canada Strategic Infrastructure Fund 6,112 4,905 182
Municipal Rural Infrastructure Fund 2,114 4,656 1,507
Provincial Building Communities Program – 3,650 944
Provincial Community Shares Program – 1,753 –
Government of Canada 21 211 293
Cultural Capitals of Canada Program 1,058 776 –
Federal Transit Funding Program 3,434 6,839 11,800
Federation of Canadian Municipalities 52 35 –
Taxation 1,627 5,138 1,619
Utility Contribution – 6,470 3,152
Borrowing 500 32,100 34,375
Contributions from Developers Benefitting Property Owners and Other Users 9,288 12,300 11,550
Appropriations
From Reserves 160,084 165,072 148,570
194,363 256,887 215,377
Expenditures
General Government 4,332 6,337 2,659
Protection of Persons and Property 3,063 4,354 10,399
Transportation 55,071 40,097 39,864
Environmental Health 28,711 36,088 68,466
Social and Family Services 574 102 –
Planning and Development 4,889 11,462 7,335
Recreation and Culture 15,934 34,425 6,969
Property Purchases and Development 80,122 83,258 72,954
Saskatoon Light & Power Expansion and Replacements 9,857 11,406 6,731
202,553 227,529 215,377
Increase (Decrease) in Unexpended Capital Financing (8,190) 29,358 –
Unexpended Capital Financing, Beginning of Year 105,983 97,793 –
Unexpended Capital Financing, End of Year $ 97,793 $ 127,151 $ –

C i t y o f S a s k a t o o n 2 0 0 8 A n n u a l R e p o r t C i t y o f S a s k a t o o n 2 0 0 8 A n n u a l R e p o r t 47
Schedule 3 - Schedule of Reserves
For the Year Ended December 31, 2008 (in thousands of dollars)
2007 2008
Replacement
Albert Community Centre $ 48 $ 50
Automated Garbage Containers 275 125
Access Transit 140 136
Boards:
TCU Place (515) (460)
Saskatoon Public Library 1,825 2,262
Mendel Art Gallery 116 88
Credit Union Centre 1,023 1,080
Buildings and Ground Equipment 200 79
Bus Replacement 1,410 1,530
Civic Vehicles and Equipment 1,292 815
Saskatoon Light & Power 8,130 7,622
Computer Equipment 922 1,009
Fire Equipment 130 213
Fire Apparatus 741 (802)
Infrastructure Replacement:
Surface Improvements (1,070) (66)
Water and Sewer Replacement 5,507 (10,166)
Parks (736) (310)
Storm Water Management 880 516
Landfill 757 1,538
Leisure Service Equipment 264 176
Photocopy Machine 318 348
Police - Vehicle/Radio 166 514
Radio Trunking 76 176
Wastewater Collection/Treatment 374 1,064
Water Utility 3,700 1,523
Weigh Scales 181 181
Balance, End of Year $ 26,154 $ 9,241

48 C i t y o f S a s k a t o o n 2 0 0 8 A n n u a l R e p o r t C i t y o f S a s k a t o o n 2 0 0 8 A n n u a l R e p o r t
Schedule 3 - Schedule of Reserves (continued)
For the Year Ended December 31, 2008 (in thousands of dollars)
2007 2008
Future Expenditures
Animal Services $ 46 $ 76
Animal Trading - Zoo 64 51
Access Transit Stabilization – 60
Affordable Housing - Capital 99 67
Affordable Housing - Operating 3,316 4,578
Boards:
TCU Place (116) 846
Saskatoon Public Library 8,443 9,482
Mendel Art Gallery 261 322
Credit Union Centre 2,527 3,487
Building Permits/Inspections 2,500 3,220
Campsite 84 171
Civic Buildings Comprehensive Maintenance 3,248 3,534
Civic Hospitality 22 54
Community Support Grant 41 67
Corporate Information Systems Development 295 274
Dedicated Lands 1,854 1,685
Dedicated Roadways 1,179 1,205
Downtown Housing 147 169
Saskatoon Light & Power Distribution Extension 329 68
Saskatoon Light & Power Revenue Stabilization 1,569 243
Fire Department Uniforms 386 554
Forestry Farm Park Development 33 65
Forestry Farm Auditorium 7 13
General Voting 79 132
Golf Course Capital 65 14
Golf Course Stabilization Reserve – 108
Heritage Fund 278 287
Holiday Park Golf Course Development 180 293
Interest Stabilization 2,521 2,426
Land Bank (504) (23,379)
Land Operations 2,663 2,325
Neighbourhood Park Enhancement 685 776
Parking Facilities 1,186 1,090
Pest Control 65 65
Police Facilities Major Repair 947 213
Police Equipment 550 57
Subtotal to next page $ 35,049 $ 14,698

C i t y o f S a s k a t o o n 2 0 0 8 A n n u a l R e p o r t C i t y o f S a s k a t o o n 2 0 0 8 A n n u a l R e p o r t 49
Schedule 3 - Schedule of Reserves (continued)
For the Year Ended December 31, 2008 (in thousands of dollars)
2007 2008
Future Expenditures (continued)
Subtotal from previous page $ 35,049 $ 14,698
Planning Levy 406 395
Prepaid Services 25,988 35,545
Property Realized 16,841 14,504
Public Works Building (2) 12
Reserve for Capital Expenditures 800 785
Revenue Stabilization 1,832 399
Sinking Fund 623 702
Special Events 89 118
Spectator Ball Fields 8 –
Sports Participation 65 67
Storm Water Management Utility Stabilization 635 1,019
Streetscape 817 3,641
Sundry 7,054 3,773
Traffic Noise Attenuation 21 (956)
Traffic Safety (57) 259
Transit Capital 171 302
Transportation Infrastructure Expansion 1 1,144
Urban Development Agreement 256 29
Vehicle and Equipment Acquisition 349 102
Waste Minimization 100 100
Wastewater Collection/Treatment Capital (1,340) 361
Water and Wastewater Utility Stabilization 1,809 –
Water Capital Projects 1,413 1,088
Saskatchewan Infrastructure Growth Initiative Reserve – 68
Balance, End of Year 92,928 78,155
Total Reserves, End of Year $ 119,082 $ 87,396

50 C i t y o f S a s k a t o o n 2 0 0 8 A n n u a l R e p o r t C i t y o f S a s k a t o o n 2 0 0 8 A n n u a l R e p o r t
Sche
dule
4 -
Sche
dule
of F
inan
cial
Act
ivit
ies
by S
egm
ent
For
the
Year
End
ed D
ecem
ber
31, 2
007
(in
thou
sand
s of
dol
lars
)
Reve
nues
Taxa
tion
$107
,062
$
–$
1
,627
$
–$
11,
960
$
–$
–
$
–$
(4,4
78)
$ 11
9,17
1
Gra
nts
in L
ieu
of T
axes
24,9
05–
––
––
––
(20,
758)
4,14
7
Use
r Cha
rges
19,3
4621
0,08
2–
213
397
408
8,95
113
,496
(32,
885)
220,
008
Fede
ratio
n of
Can
adia
n M
unic
ipal
ities
––
52–
––
––
–52
Gov
ernm
ent T
rans
fers
22,2
62–
18,2
494,
563
595
525
––
3046
,224
Inve
stm
ent I
ncom
e9,
766
––
––
–74
229
688
10,7
57
Cont
ribut
ion
from
Dev
elop
ers
––
11,6
1555
7–
––
–93
,966
106,
138
Oth
er54
,315
––
––
6–
–4,
130
58,4
51
Borr
owin
g–
––
––
––
–(3
2,10
0)–
From
Res
erve
s–
–13
3,99
932
,888
––
––
(166
,887
)–
Util
ity C
ontr
ibut
ion
––
––
––
––
––
Tota
l Rev
enue
s23
7,65
621
0,08
216
5,54
238
,221
12,9
5293
99,
025
13,7
25(1
23,1
94)
564,
948
Expe
ndit
ures
Gen
eral
Gov
ernm
ent
30,8
30–
4,24
0–
––
––
(10,
468)
24,6
02
Prot
ectio
n of
Per
sons
and
Pro
pert
y95
,737
–2,
998
––
––
–(4
,065
)94
,670
Tran
spor
tatio
n49
,140
28,0
1846
,939
6,97
4–
––
–(2
9,06
6)10
2,00
5
Envi
ronm
enta
l Hea
lth9,
241
56,7
5310
,373
17,7
31–
––
–(2
8,25
6)65
,842
Soci
al a
nd F
amily
Ser
vice
s1,
906
–56
2–
––
––
(39)
2,42
9
Plan
ning
and
Dev
elop
men
t15
,996
–4,
786
––
––
–(7
70)
20,0
12
Recr
eatio
n an
d Cu
lture
30,4
00–
21,9
83–
12,6
7891
98,
834
13,4
35(7
,674
)80
,575
Prop
erty
Pur
chas
es a
nd D
evel
opm
ent
4,74
4–
75,1
23–
––
––
–79
,867
Sask
atoo
n Li
ght &
Pow
er–
98,5
50–
9,64
9–
––
–(2
5,10
3)83
,096
Deb
t Ser
vici
ng C
osts
3,62
34,
817
––
––
––
(1,7
12)
6,72
8
Tota
l Exp
endi
ture
s24
1,61
718
8,13
816
7,00
434
,354
12,6
7891
98,
834
13,4
35(1
07,1
53)
559,
826
Exce
ss (D
efici
ency
) of R
even
ues
ov
er E
xpen
ditu
res
$ (3
,961
)$
21,
944
$ (1
,462
)$
3
,867
$
2
74$
20
$
1
91$
290
$(16
,041
)$5
,122
General
Operating
Utility
Capital
Mendel
Utility
Operating
TCU Place
Eliminatio
ns
General
Capital
Library
Credit Union
Centre
Total Conso
lidated
2007

C i t y o f S a s k a t o o n 2 0 0 8 A n n u a l R e p o r t C i t y o f S a s k a t o o n 2 0 0 8 A n n u a l R e p o r t 51
Sche
dule
4 -
Sche
dule
of F
inan
cial
Act
ivit
ies
by S
egm
ent
For
the
Year
End
ed D
ecem
ber
31, 2
008
(in
thou
sand
s of
dol
lars
)
Reve
nues
Taxa
tion
$ 1
15,1
95$
–
$
5
,138
$
–$
1
2,80
5$
–
$
–$
–
$
(4,8
18)
$ 12
8,32
0
Gra
nts
in L
ieu
of T
axes
25,0
17–
––
––
––
(20,
672)
4,34
5
Use
r Cha
rges
19,9
8421
3,07
226
628
384
405
13,4
0621
,146
(34,
586)
234,
465
Fede
ratio
n of
Can
adia
n M
unic
ipal
ities
––
–35
––
––
–35
Gov
ernm
ent T
rans
fers
25,8
02–
25,6
0610
,189
638
448
––
1,29
963
,982
Inve
stm
ent I
ncom
e8,
328
––
––
–88
166
4,10
812
,690
Cont
ribut
ion
from
Dev
elop
ers
––
23,1
5219
8–
––
–53
,661
77,0
11
Oth
er59
,718
––
––
20–
–2,
965
62,7
03
Borr
owin
g–
–31
,600
500
––
––
(32,
100)
–
From
Res
erve
s–
–12
7,20
237
,870
––
––
(165
,072
)–
Util
ity C
ontr
ibut
ion
––
–6,
470
––
––
(6,4
70)
–
Tota
l Rev
enue
s25
4,04
421
3,07
221
2,72
455
,890
13,8
2787
313
,494
21,3
12(2
01,6
85)
583,
551
Expe
ndit
ures
Gen
eral
Gov
ernm
ent
32,4
43–
6,37
9–
––
––
(12,
844)
25,9
78
Prot
ectio
n of
Per
sons
and
Pro
pert
y93
,955
–4,
383
––
––
–(4
,004
)94
,334
Tran
spor
tatio
n55
,195
31,2
0328
,337
12,0
25–
––
–(3
2,42
3)94
,337
Envi
ronm
enta
l Hea
lth10
,452
61,9
245,
819
30,5
08–
––
–(2
2,94
8)85
,755
Soci
al a
nd F
amily
Ser
vice
s2,
151
–10
3–
––
––
(42)
2,21
2
Plan
ning
and
Dev
elop
men
t17
,390
–11
,538
––
––
–(1
,441
)27
,487
Recr
eatio
n an
d Cu
lture
33,8
81–
36,6
76–
13,9
2087
813
,583
21,1
68(9
,537
)11
0,56
9
Prop
erty
Pur
chas
es a
nd D
evel
opm
ent
3,18
0–
76,8
86–
––
––
(1,0
65)
79,0
01
Sask
atoo
n Li
ght &
Pow
er–
114,
296
–11
,482
––
––
(39,
432)
86,3
46
Deb
t Ser
vici
ng C
osts
4,81
95,
289
––
––
––
259
10,3
67
Tota
l Exp
endi
ture
s25
3,46
621
2,71
217
0,12
154
,015
13,9
2087
813
,583
21,1
68(1
23,4
77)
616,
386
Exce
ss (D
efici
ency
) of R
even
ues
ov
er E
xpen
ditu
res
$
578
$
360
$
42,
603
$
1
,875
$
(93)
$
(5
)$
(8
9)$
1
44$
(78
,208
)$
(32,
835)
General
Operating
Utility
Capital
Mendel
Utility
Operating
TCU Place
Eliminatio
ns
General
Capital
Library
Credit Union
Centre
Total Conso
lidated
2008

52 C i t y o f S a s k a t o o n 2 0 0 8 A n n u a l R e p o r t C i t y o f S a s k a t o o n 2 0 0 8 A n n u a l R e p o r t
Schedule 5 - Schedule of Revenues and Expenditures
For the Year Ended December 31, 2008 (in thousands of dollars)
2007 2008 2008 Budget (unaudited)
Revenues
Taxation $ 107,062 $ 115,195 $ 114,984
Grants in Lieu of Taxes 24,905 25,017 25,444
Services Provided to Other Governments 828 870 828
Sale of Services 25,814 27,168 29,646
Other Revenues from Own Sources 37,355 38,422 37,537
Transfers from Other Governments 22,262 25,802 24,832
Other Transactions 19,430 21,569 21,570
Total Revenues for the Year (Appendix 1) 237,656 254,043 254,841
Expenditures
General Government 31,496 32,209 32,926
Protection of Persons and Property 89,804 95,430 94,451
Transportation 50,202 54,838 52,285
Environmental Health 8,146 8,959 8,525
Social and Family Services 1,947 2,137 2,022
Planning and Development 16,342 17,280 16,589
Land Management 4,744 3,181 6,289
Recreation and Culture 31,058 33,658 34,714
Debt Servicing Costs 5,349 7,593 7,040
Total Expenditures for the Year (Appendix 2) 239,088 255,285 254,841
Deficit $ (1,432) $ (1,242) $ –

C i t y o f S a s k a t o o n 2 0 0 8 A n n u a l R e p o r t C i t y o f S a s k a t o o n 2 0 0 8 A n n u a l R e p o r t 53
2007 2008 2008 Budget (unaudited)
Taxation
Property Levy $ 106,656 $ 115,328 $ 115,002
Local Improvements Levy 40 – –
Municipal Services Agreement 108 116 104
Trailer Occupancy 74 116 78
Amusement 415 57 44
Tax Discounts (82) (102) (85)
Contribution Capital (149) (320) (159)
107,062 115,195 114,984
Grants in Lieu of Taxes
Senior Governments and Agencies 4,146 4,345 4,250
Own Utilities - Saskatoon Light & Power 15,770 15,391 21,139
Own Utilities - Water 2,725 2,912 –
Own Utilities - Wastewater 2,061 2,148 –
Own Utilities - Transit 121 122 –
Land Bank Program 82 99 55
24,905 25,017 25,444
Services Provided to Other Governments
R .M . of Corman Park 60 60 60
Provincial Government 768 810 768
828 870 828
Appendix 1 - Schedule of Revenues
For the Year Ended December 31, 2008 (in thousands of dollars)

54 C i t y o f S a s k a t o o n 2 0 0 8 A n n u a l R e p o r t C i t y o f S a s k a t o o n 2 0 0 8 A n n u a l R e p o r t
Appendix 1 - Schedule of Revenues (continued)
For the Year Ended December 31, 2008 (in thousands of dollars)
2007 2008 2008 Budget (unaudited)
Sale of Services
Legal Fees $ 132 $ 123 $ 143
Tax Searches and Enforcement 215 189 210
Police 974 954 727
Fire 172 153 82
Engineering 29 248 242
Parking 3,186 4,065 4,093
Solid Waste Management 3,435 3,306 3,463
Environmental Protection 296 306 174
Transportation 157 172 157
Cemetery 693 748 792
Planning 302 340 312
Tourist Campsite 322 392 295
Forestry Farm Park 428 680 434
Kinsmen Park Rides 149 160 186
Albert Community Centre 131 134 128
Marr Residence 1 – 1
Swimming Pools 294 301 313
Golf Courses 2,355 2,656 2,782
Skating Rinks 1,569 1,625 1,627
Rentals 2,926 3,339 3,330
Programming 3,076 3,845 3,617
Ball Fields 34 35 34
Outdoor Sports Fields 194 210 214
Land Administration Fee 4,744 3,180 6,290
River Landing – 7 –
25,814 27,168 29,646
Other Revenues from Own Source
Licence and Permits 4,377 4,806 3,357
Fines and Penalties 4,641 5,288 5,270
Automated Enforcement Fines 692 954 680
Property Rentals 744 1,029 807
Franchise Fees 16,044 16,764 16,735
Interest Earnings 9,766 8,328 9,324
Tax Penalties 1,001 914 1,100
Other Revenue 90 339 264
37,355 38,422 37,537

C i t y o f S a s k a t o o n 2 0 0 8 A n n u a l R e p o r t C i t y o f S a s k a t o o n 2 0 0 8 A n n u a l R e p o r t 55
Appendix 1 - Schedule of Revenues (continued)
For the Year Ended December 31, 2008 (in thousands of dollars)
2007 2008 2008 Budget (unaudited)
Transfers from Other Governments
Federal:
Police $ 387 $ 376 $ 271
Community Development 72 67 85
City Clerk's - Special Programs 5 17 18
Gas Tax Program – 373 –
Provincial:
Revenue Sharing 17,776 20,541 20,541
West Nile Virus Control 262 223 –
Police - Special Programs 2,990 3,323 3,084
Fire - Special Programs 78 78 78
Access Transit 578 599 595
Community Development 92 162 137
Social Development – 20 –
Dutch Elm Disease 22 23 23
22,262 25,802 24,832
Other Transactions
Utility Return on Investment 17,499 18,088 18,093
Administrative Recovery 1,847 1,895 1,895
Other 84 86 82
Land Bank – 1,500 1,500
19,430 21,569 21,570
Total Revenues $ 237,656 $ 254,043 $ 254,841

56 C i t y o f S a s k a t o o n 2 0 0 8 A n n u a l R e p o r t C i t y o f S a s k a t o o n 2 0 0 8 A n n u a l R e p o r t
Appendix 2 - Schedule of Expenditures
For the Year Ended December 31, 2008 (in thousands of dollars)
2007 2008 2008 Budget (unaudited)
General Government
Legislative $ 940 $ 1,074 $ 1,173
Administrative 6,701 7,268 7,020
Financial 4,538 4,717 5,082
Assessment 2,546 2,580 2,803
Common Services 14,453 15,298 16,338
General Payroll Costs 1,150 4 174
Other 532 954 1
Local Improvement Tax on Exempt Properties 3 – –
Grants 50 50 50
Tax Abatements 583 264 285
31,496 32,209 32,926
Protection of Persons and Property
Police 54,349 57,671 58,408
Province of Saskatchewan - Court Costs 996 1,164 1,033
Automated Enforcement Costs 692 954 680
Fire 28,330 29,882 30,203
Emergency Measures 149 168 195
Inspections 3,565 3,902 2,547
Animal and Pest Control 1,723 1,689 1,385
89,804 95,430 94,451
Transportation
Engineering 2,164 2,927 2,761
Roads and Streets 3,249 3,142 3,571
Drainage and Snow Removal 5,811 4,966 4,747
Street Cleaning 1,744 1,902 1,594
Bridges, Crossings, Subways 412 451 516
Street Lighting 4,115 4,234 4,209
Transportation Services 11,740 12,863 12,177
Parking 2,841 3,195 3,133
Transit Operations-Excludes Surplus 15,709 18,355 16,793
Access Transit 2,417 2,803 2,784
50,202 54,838 52,285

C i t y o f S a s k a t o o n 2 0 0 8 A n n u a l R e p o r t C i t y o f S a s k a t o o n 2 0 0 8 A n n u a l R e p o r t 57
Appendix 2 - Schedule of Expenditures (continued)
For the Year Ended December 31, 2008 (in thousands of dollars)
2007 2008 2008 Budget (unaudited)
Environmental Health
Waste Collection and Disposal $ 7,195 $ 7,779 $ 7,572
Environmental Protection 951 1,180 953
8,146 8,959 8,525
Social and Family Services
Cemetery 906 957 941
Burial of Indigents 31 38 28
Social Housing Facilitation 93 115 112
White Buffalo Youth Lodge 105 109 109
Safer City 25 43 30
Detoxification Centre 100 100 100
Grants 687 702 702
Social Development – 73 –
1,947 2,137 2,022
Planning and Development
Planning 3,249 3,135 3,267
Buildings and Grounds Maintenance 10,256 10,836 10,569
Tourist Campsite 322 392 295
Tourism Saskatoon 358 365 365
Economic Development 1,384 1,800 1,321
Meewasin Valley Authority 640 640 640
Business Improvement Districts 86 106 106
Urban Design 47 6 26
16,342 17,280 16,589

58 C i t y o f S a s k a t o o n 2 0 0 8 A n n u a l R e p o r t C i t y o f S a s k a t o o n 2 0 0 8 A n n u a l R e p o r t
Appendix 2 - Schedule of Expenditures (continued)
For the Year Ended December 31, 2008 (in thousands of dollars)
2007 2008 2008 Budget (unaudited)
Property Purchases and Development
Land Management $ 4,744 $ 3,181 $ 6,289
4,744 3,181 6,289
Recreation and Culture
Administration 1,938 1,951 2,102
Forestry Farm Park 1,672 1,943 1,870
Community Services 2,484 2,625 2,828
Kinsmen Park Rides 157 196 197
Albert Community Center 194 218 219
Marr Residence 14 15 19
Swimming Pools 1,704 1,708 1,843
Golf Courses 2,401 2,655 2,782
Skating Rinks 1,841 1,875 1,937
Recreation/Competitive Facilities:
Rentals 6,248 6,662 6,825
Programming 4,781 5,885 5,945
Ball fields 223 239 239
Outdoor Sports Fields 295 306 306
Boards:
Credit Union Centre 559 559 559
TCU Place 1,302 1,412 1,412
Mendel Art Gallery 1,715 1,864 1,864
River Landing – 77 –
Building Maintenance 626 370 601
Program Development 1,401 1,561 1,629
Subsidy-Minor Sports 1,119 1,103 1,103
Wanuskewin Heritage Park 184 184 184
Special Events 200 250 250
31,058 33,658 34,714
Debt Servicing Costs
Debt Charges 4,487 6,317 5,769
Interest Paid to Utilities 707 1,120 1,121
Banking Services 155 156 150
5,349 7,593 7,040
Total Expenditures $ 239,088 $ 255,285 $ 254,841
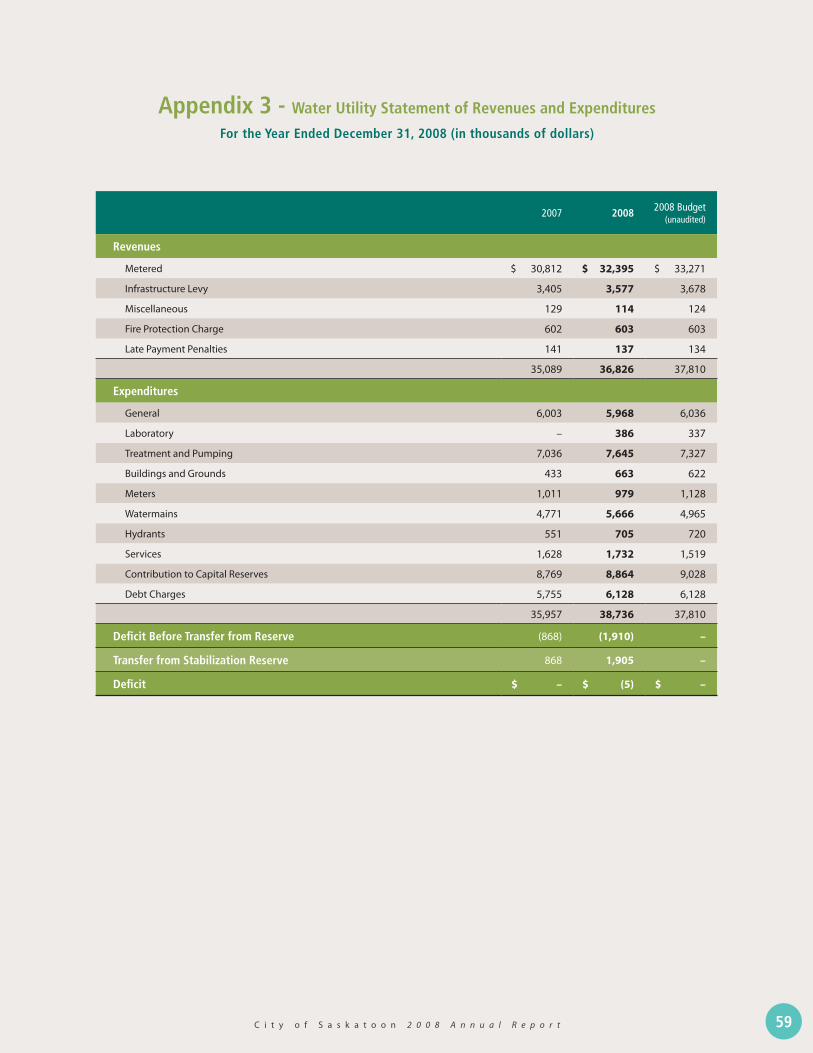
C i t y o f S a s k a t o o n 2 0 0 8 A n n u a l R e p o r t C i t y o f S a s k a t o o n 2 0 0 8 A n n u a l R e p o r t 59
2007 2008 2008 Budget (unaudited)
Revenues
Metered $ 30,812 $ 32,395 $ 33,271
Infrastructure Levy 3,405 3,577 3,678
Miscellaneous 129 114 124
Fire Protection Charge 602 603 603
Late Payment Penalties 141 137 134
35,089 36,826 37,810
Expenditures
General 6,003 5,968 6,036
Laboratory – 386 337
Treatment and Pumping 7,036 7,645 7,327
Buildings and Grounds 433 663 622
Meters 1,011 979 1,128
Watermains 4,771 5,666 4,965
Hydrants 551 705 720
Services 1,628 1,732 1,519
Contribution to Capital Reserves 8,769 8,864 9,028
Debt Charges 5,755 6,128 6,128
35,957 38,736 37,810
Deficit Before Transfer from Reserve (868) (1,910) –
Transfer from Stabilization Reserve 868 1,905 –
Deficit $ – $ (5) $ –
Appendix 3 - Water Utility Statement of Revenues and Expenditures
For the Year Ended December 31, 2008 (in thousands of dollars)

60 C i t y o f S a s k a t o o n 2 0 0 8 A n n u a l R e p o r t C i t y o f S a s k a t o o n 2 0 0 8 A n n u a l R e p o r t
Appendix 4 - Wastewater Utility Statement of Revenues and Expenditures
For the Year Ended December 31, 2008 (in thousands of dollars)
2007 2008 2008 Budget (unaudited)
Revenues
Metered $ 22,209 $ 23,658 $ 24,680
Infrastructure Levy 4,702 4,940 5,079
Late Payment Penalties 94 92 90
Miscellaneous 603 474 592
Flood Protection Levy 2,211 2,250 2,200
29,819 31,414 32,641
Expenditures
General 4,653 4,469 4,428
Laboratory – 402 420
Lift Stations 892 857 964
Pollution Control Plant 4,859 5,179 5,156
Sludge Handling and Disposal 1,826 1,946 1,880
Sewer Engineering 317 314 341
Sewer Inspections 219 188 350
Sewer Maintenance 1,635 2,001 2,689
Service Connections 1,306 1,741 2,038
Contribution to Capital Reserves 12,053 12,058 12,212
Debt Charges 1,174 2,163 2,163
28,934 31,318 32,641
Surplus Before Transfer to Reserve 885 96 –
Transfer to Stabilization Reserve (885) (96) –
Surplus (Deficit) $ – $ – $ –
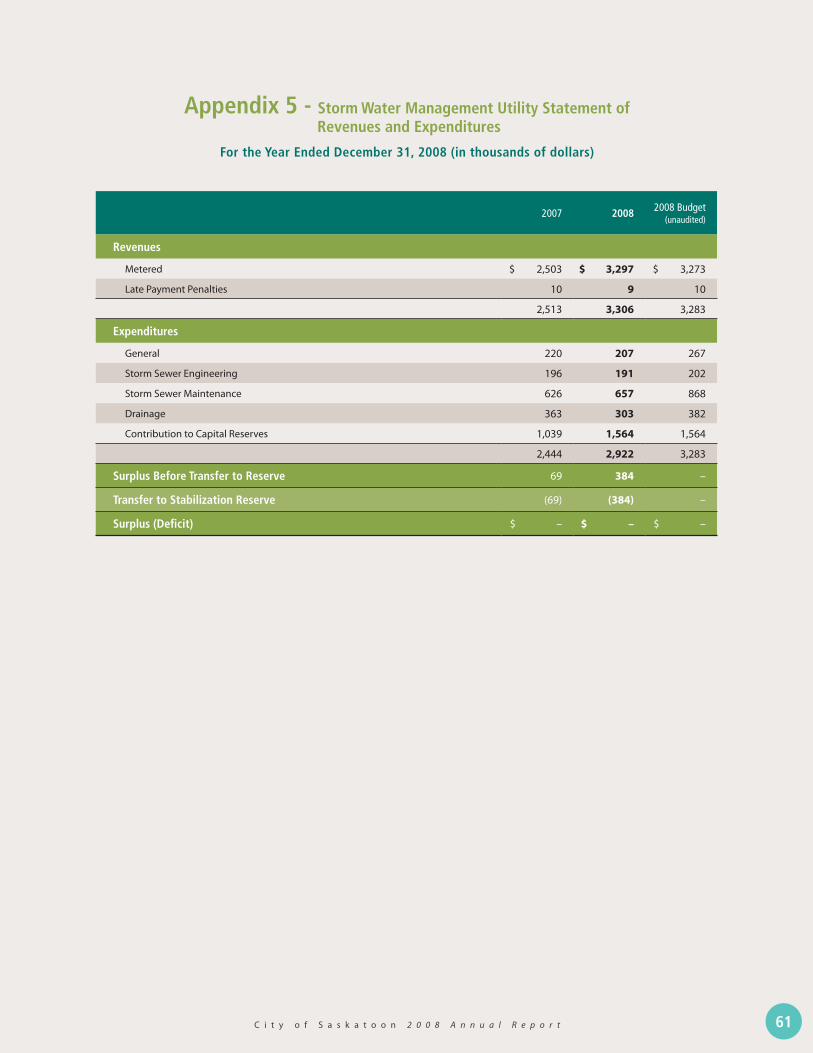
C i t y o f S a s k a t o o n 2 0 0 8 A n n u a l R e p o r t C i t y o f S a s k a t o o n 2 0 0 8 A n n u a l R e p o r t 61
Appendix 5 - Storm Water Management Utility Statement of Revenues and Expenditures
For the Year Ended December 31, 2008 (in thousands of dollars)
2007 2008 2008 Budget (unaudited)
Revenues
Metered $ 2,503 $ 3,297 $ 3,273
Late Payment Penalties 10 9 10
2,513 3,306 3,283
Expenditures
General 220 207 267
Storm Sewer Engineering 196 191 202
Storm Sewer Maintenance 626 657 868
Drainage 363 303 382
Contribution to Capital Reserves 1,039 1,564 1,564
2,444 2,922 3,283
Surplus Before Transfer to Reserve 69 384 –
Transfer to Stabilization Reserve (69) (384) –
Surplus (Deficit) $ – $ – $ –

62 C i t y o f S a s k a t o o n 2 0 0 8 A n n u a l R e p o r t C i t y o f S a s k a t o o n 2 0 0 8 A n n u a l R e p o r t
Appendix 6 - Saskatoon Light & Power Utility Statement of Revenues and Expenditures
For the Year Ended December 31, 2008 (in thousands of dollars)
2007 2008 2008 Budget (unaudited)
Revenues
Metered $ 105,107 $ 102,587 $ 105,198
Municipal Surcharge 10,510 10,258 10,520
Service Connection Fee 490 434 499
Miscellaneous 391 463 427
Tax Collection Commission 2 2 2
Late Payment Penalties 235 229 224
116,735 113,973 116,870
Expenditures
General 19,666 19,549 19,739
Power Purchased 64,208 63,683 65,329
Buildings and Grounds 623 560 604
Poles, Lines, and Feeders 2,984 3,387 3,228
Substations 335 729 724
Street Lighting 1,042 915 824
Meters 945 1,026 966
System Operations 99 85 92
Provision for Capital Extension 1,364 1,241 1,364
Provision for Capital Replacement 6,479 6,031 5,907
97,745 97,206 98,777
Surplus Before Transfer (to) from Reserve 18,990 16,767 18,093
Transfer (to) from Stabilization Reserve (1,491) 1,326 -
Surplus $ 17,499 $ 18,093 $ 18,093

C i t y o f S a s k a t o o n 2 0 0 8 A n n u a l R e p o r t C i t y o f S a s k a t o o n 2 0 0 8 A n n u a l R e p o r t 63
Appendix 7 - Transit Utility Statement of Revenues and Expenditures
For the Year Ended December 31, 2008 (in thousands of dollars)
2007 2008 2008 Budget (unaudited)
Revenues
Mail Carriers $ 18 $ 9 $ 11
Passes 4,474 5,260 5,314
Cash Fares 1,997 2,061 1,807
Ticket Sales 1,717 1,466 1,815
Charter 767 740 851
Senior Citizens’ Passes 324 362 339
General Services Operating Allowance 14,806 16,793 16,793
Advertising 314 375 456
Province of Saskatchewan 606 487 540
25,023 27,553 27,926
Expenditures
General 1,798 2,103 2,036
Transportation:
Planning 322 319 377
Operating 12,005 13,033 12,779
Supervision 1,240 1,594 1,459
Customer Services 612 570 545
Equipment Servicing 6,902 8,067 7,433
Equipment Repair 548 576 474
Stores 114 156 113
Buildings 879 890 903
Contribution to Capital Reserves 1,748 1,807 1,807
26,168 29,115 27,926
Deficit Before Transfer from Reserve (1,145) (1,562) –
Transfer from Stabilization Reserve 242 – –
Deficit $ (903) $ (1,562) $ –

64 C i t y o f S a s k a t o o n 2 0 0 8 A n n u a l R e p o r t C i t y o f S a s k a t o o n 2 0 0 8 A n n u a l R e p o r t
C i t y o f S a s k a t o o n 2 0 0 8 A n n u a l R e p o r t C i t y o f S a s k a t o o n 2 0 0 8 A n n u a l R e p o r t 65
TRUST FUNDSCity of Saskatoon
Saskatchewan Canada

66 C i t y o f S a s k a t o o n 2 0 0 8 A n n u a l R e p o r t C i t y o f S a s k a t o o n 2 0 0 8 A n n u a l R e p o r t
Auditors’ ReportDeloitte & Touche LLP Chartered Accountants
His Worship the Mayor and City Council:
We have audited the Balance Sheet of the Trust Funds of the City of Saskatoon as at December 31, 2008 and the Statement of Changes in Net Assets for the year then ended . These financial statements are the responsibility of the City’s management . Our responsibility is to express an opinion on these financial statements based on our audit .
We conducted our audit in accordance with Canadian generally accepted auditing standards . Those standards require that we plan and perform the audit to obtain reasonable assurance whether the financial statements are free of material misstatement . An audit includes examining, on a test basis, evidence supporting the amounts and disclosures in the financial statements . An audit also includes assessing the accounting principles used and significant estimates made by management, as well as evaluating the overall financial statement presentation .
In our opinion, these financial statements present fairly, in all material respects, the financial position of the Trust Funds of the City of Saskatoon as at December 31, 2008 and the results of its operations and the changes in its financial position for the year then ended in accordance with Canadian generally accepted accounting principles .
Chartered AccountantsSaskatoon, Saskatchewan
April 24, 2009

C i t y o f S a s k a t o o n 2 0 0 8 A n n u a l R e p o r t C i t y o f S a s k a t o o n 2 0 0 8 A n n u a l R e p o r t 67
Trust Funds - Balance Sheet
As at December 31, 2008 (in thousands of dollars)
2007 2008 2008 2008
TotalCemetery Perpetual
Care
Group Insurance
TrustTotal
Assets
Cash and Cash Equivalents $ 423 $ 237 $ 94 $ 331
Accounts Receivable 4 5 – 5
Accrued Interest 29 23 1 24
Investments 2,671 2,771 – 2,771
3,127 3,036 95 3,131
Liabilities and Net Assets
Accounts Payable 27 28 – 28
Net Assets 3,100 3,008 95 3,103
$ 3,127 $ 3,036 $ 95 $ 3,131
See accompanying notes .
Trust Funds - Statement of Changes in Net Assets
For the Year Ended December 31, 2008 (in thousands of dollars)
2007 2008 2008 2008
TotalCemetery Perpetual
Care
Group Insurance
TrustTotal
Increase in Net Assets
Sale of Cemetery Plots $ 68 $ 78 $ – $ 78
Interest Earned 152 144 6 150
220 222 6 228
Decrease in Assets
Transfer to Revenue Fund 221 138 87 225
221 138 87 225
Increase (Decrease) in Net Assets (1) 84 (81) 3
Net Assets, Beginning of Year 3,101 2,924 176 3,100
Net Assets, End of Year $ 3,100 $ 3,008 $ 95 $ 3,103
See accompanying notes .

68 C i t y o f S a s k a t o o n 2 0 0 8 A n n u a l R e p o r t C i t y o f S a s k a t o o n 2 0 0 8 A n n u a l R e p o r t
Trust Funds - Notes to the Financial Statements
For the Year Ended December 31, 2008 (in thousands of dollars)
1. Accounting Policies
Basis of Accounting
a. Trust Funds
The Trust Funds operate on the accrual basis of accounting . Any interest earned but not received as at December 31 has been recorded in Accrued Interest .
2. Investments
a. Trust Funds
The total of investments of $2,771 (2007 - $2,671) recorded on the Balance Sheet at cost, have a market value of $3,000 (2007 - $2,874) at December 31 . Investments consist of provincial promissory notes and federal, provincial, municipal government, and corporate bonds with an effective interest rate ranging from 1 .076 percent to 5 .213 percent .
3. Fund Purpose
a. Group Insurance Trust Fund
Premiums are shared equally between the employer and the employee . Surpluses are generated when premiums exceed administration charges and claims payments by the carrier . A portion of the accumulated funds are used to reduce both the employer’s and employee’s premiums . In the event of a surplus, under the terms of the Underwriting Agreement, the claims Fluctuation Reserve held by the Group Insurance Trust Fund for 2008 must be at least 25 percent of premiums paid, or $258 .
b. Cemetery Perpetual Care Trust Fund
The Perpetual Care Fund is intended to provide the necessary annual funding for the maintenance services to the cemetery in perpetuity .

C i t y o f S a s k a t o o n 2 0 0 8 A n n u a l R e p o r t C i t y o f S a s k a t o o n 2 0 0 8 A n n u a l R e p o r t 69
STATISTICSCity of Saskatoon
Saskatchewan Canada
70 C i t y o f S a s k a t o o n 2 0 0 8 A n n u a l R e p o r t C i t y o f S a s k a t o o n 2 0 0 8 A n n u a l R e p o r t
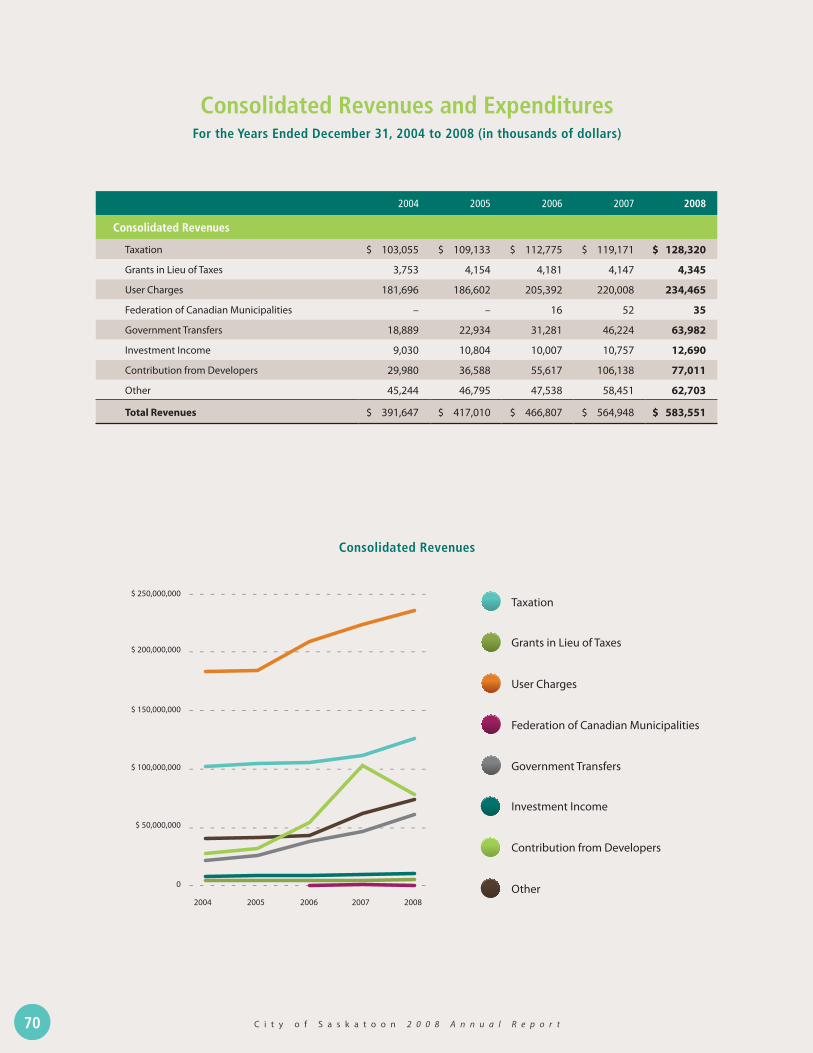
Consolidated Revenues and ExpendituresFor the Years Ended December 31, 2004 to 2008 (in thousands of dollars)
2004 2005 2006 2007 2008
Consolidated Revenues
Taxation $ 103,055 $ 109,133 $ 112,775 $ 119,171 $ 128,320
Grants in Lieu of Taxes 3,753 4,154 4,181 4,147 4,345
User Charges 181,696 186,602 205,392 220,008 234,465
Federation of Canadian Municipalities – – 16 52 35
Government Transfers 18,889 22,934 31,281 46,224 63,982
Investment Income 9,030 10,804 10,007 10,757 12,690
Contribution from Developers 29,980 36,588 55,617 106,138 77,011
Other 45,244 46,795 47,538 58,451 62,703
Total Revenues $ 391,647 $ 417,010 $ 466,807 $ 564,948 $ 583,551
Taxation
Grants in Lieu of Taxes
User Charges
Federation of Canadian Municipalities
Government Transfers
Investment Income
Contribution from Developers
Other
$ 250,000,000
$ 200,000,000
$ 150,000,000
$ 100,000,000
$ 50,000,000
2004 2005 2006 2007 2008
0
Consolidated Revenues

C i t y o f S a s k a t o o n 2 0 0 8 A n n u a l R e p o r t C i t y o f S a s k a t o o n 2 0 0 8 A n n u a l R e p o r t 71
2004 2005 2006 2007 2008
Consolidated Expenditures
General Government $ 23,160 $ 24,024 $ 24,507 $ 24,602 $ 25,978
Transportation 62,085 78,460 113,864 102,005 94,337
Protection of Persons and Property 79,037 79,332 83,179 94,670 94,334
Recreation and Culture 59,358 66,684 74,130 80,575 110,569
Social and Family Services 5,034 4,315 2,140 2,429 2,212
Planning and Development 16,917 17,406 18,715 20,012 27,487
Property Purchases and Development 18,826 23,370 41,807 79,867 79,001
Saskatoon Light & Power 71,427 77,818 85,186 83,096 86,346
Environmental Health 44,022 63,191 67,986 65,842 85,755
Debt Servicing Costs 4,259 3,896 4,082 6,728 10,367
Total Expenditures $ 384,125 $ 438,496 $ 515,596 $ 559,826 $ 616,386
Excess (Deficiency) of Revenues over Expenditures $ 7,522 $ (21,486) $ (48,789) $ 5,122 $ (32,835)
Saskatoon Light & Power
Protection of Persons and Property
Transportation
Recreation and Culture
Environmental Health
General Government
Planning and Development
Property Purchases and Development
Social and Family Services
Debt Servicing Costs
$120,000,000
$100,000,000
$80,000,000
$60,000,000
$40,000,000
2004 2005 2006 2007 2008
$20,000,000
0
Consolidated Expenditures
Consolidated Revenues and Expenditures (continued)
For the Years Ended December 31, 2004 to 2008 (in thousands of dollars)

72 C i t y o f S a s k a t o o n 2 0 0 8 A n n u a l R e p o r t C i t y o f S a s k a t o o n 2 0 0 8 A n n u a l R e p o r t
2004 2005 2006 2007 2008
Taxation $ 92,013 $ 97,795 $ 101,104 $ 107,062 $ 115,195
Grants in Lieu of Taxes 20,004 21,332 22,646 24,905 25,017
Services Provided to Other Governments 1,261 803 807 828 870
Sale of Services 17,932 18,461 18,748 25,814 27,168
Other Revenues from Own Sources 30,956 33,803 34,178 37,355 38,422
Transfers from Other Governments 13,586 13,462 18,219 22,262 25,802
Other Transactions 17,136 17,808 17,448 19,430 21,569
$ 192,888 $ 203,464 $ 213,150 $ 237,656 $ 254,043
Summary of RevenuesFor the Years Ended December 31, 2004 to 2008 (in thousands of dollars)
45.3% Taxation 9.9% Grants in Lieu of Taxes
8.5% Other Transactions
10.7% Sales of Services 0.3% Services Provided to Other Governments
15.1% Other Revenue from Own Sources
10.2% Transfer from Other Governments
2008

C i t y o f S a s k a t o o n 2 0 0 8 A n n u a l R e p o r t C i t y o f S a s k a t o o n 2 0 0 8 A n n u a l R e p o r t 73
Summary of ExpendituresFor the Years Ended December 31, 2004 to 2008 (in thousands of dollars)
2004 2005 2006 2007 2008
General Government $ 25,738 $ 27,995 $ 29,939 $ 31,496 $ 32,209
Protection of Persons and Property 72,116 75,676 82,063 89,804 95,430
Transportation 38,887 40,543 44,865 50,202 54,838
Environmental Health 6,054 6,265 6,556 8,146 8,959
Social and Family Services 3,946 3,761 1,922 1,947 2,137
Planning and Development 13,491 13,846 14,899 16,342 17,280
Land Management 18,826 23,370 41,807 4,744 3,181
Recreation and Culture 27,072 28,178 29,795 31,058 33,658
Debt Servicing Costs 4,249 4,494 4,954 5,349 7,593
$ 210,379 $ 224,128 $ 256,800 $ 239,088 $ 255,285
37.4% Protection of Persons and Property 3.5% Environmental Health
3.0% Debt Servicing Costs
13.2% Recreation and Culture
12.6% General Government
1.2% Land Management
0.8% Social and Family Services
21.5% Transportation
6.8% Planning and Development
2008

74 C i t y o f S a s k a t o o n 2 0 0 8 A n n u a l R e p o r t C i t y o f S a s k a t o o n 2 0 0 8 A n n u a l R e p o r t
Summary of Capital OperationsFor the Years Ended December 31, 2004 to 2008 (in thousands of dollars)
2004 2005 2006 2007 2008
Sources of Funds
Province of Saskatchewan $ 385 $ 358 $ 8,152 $ 10,046 $ 943
Saskatchewan Water Corporation – 23 250 27 712
Canada Strategic Infrastructure Fund – – – 6,112 4,905
Federal Gas Tax Program – – 3,647 – 11,327
Municipal Rural Infrastructure Fund – 1,502 399 2,114 4,656
Canada/Saskatchewan Infrastructure Program 3,730 5,225 34 – –
Provincial Building Communities Program – – – – 3,650
Provincial Community Shares Program – – – – 1,753
Government of Canada – – 59 21 211
Cultural Capitals of Canada Program – – 30 1,058 776
Transport Canada 82 137 – – –
Federal Transit Funding Program – – – 3,434 6,839
Federation of Canadian Municipalities – – 16 52 35
Taxation 225 50 1,376 1,627 5,138
Utility Contribution – – – – 6,470
Borrowing – 21,841 – 500 32,100
Contributions from Developers Benefitting Property Owners and Other Users 5,558 5,820 15,250 9,288 12,300
Appropriations:
Sinking Fund – – 3,000 – –
Operating Surplus – 100 500 – –
Reserves 80,708 97,903 127,836 160,084 165,072
90,688 132,959 160,549 194,363 256,887
Application of Funds
General Government 4,176 4,033 3,002 4,332 6,337
Protection of Persons and Property 1,618 1,688 1,799 3,063 4,354
Transportation 23,250 35,711 60,357 55,071 40,097
Environmental Health 11,568 26,308 27,553 28,711 36,088
Social and Family Services 1,234 541 737 574 102
Planning and Development 3,749 3,597 3,633 4,889 11,462
Recreation and Culture 4,017 6,373 8,237 15,934 34,425
Property Purchases and Development 15,672 24,000 36,162 80,122 83,258
Saskatoon Light & Power Expansion and Replacements 8,699 9,431 10,302 9,857 11,406
73,983 111,682 151,782 202,553 227,529
Increase (Decrease) in Unexpended Capital Financing 16,705 21,277 8,767 (8,190) 29,358
Unexpended Capital Financing, Beginning of Year 59,234 75,939 97,216 105,983 97,793
Unexpended Capital Financing, End of Year $ 75,939 $ 97,216 $ 105,983 $ 97,793 $ 127,151

C i t y o f S a s k a t o o n 2 0 0 8 A n n u a l R e p o r t C i t y o f S a s k a t o o n 2 0 0 8 A n n u a l R e p o r t 75
Cons
olid
ated
Sum
mar
y of
Exp
endi
ture
s (b
y ob
ject
cod
e)
For
the
Year
s En
ded
Dec
embe
r 31
, 200
4 to
200
8 (i
n th
ousa
nds
of d
olla
rs)
Gen
eral
Gov
ernm
ent
$
17,
759
$
3,
531
$
393
$
130
$
1
,023
$
14
$
3
,128
$ 2
5,97
8
Prot
ectio
n of
Per
sons
and
Pro
pert
y 7
4,58
7 1
3,63
9 1
40 4
97 1
,024
–
4,4
47 9
4,33
4
Tran
spor
tatio
n 3
2,43
7 1
0,73
5 –
4
,694
6,2
36 7
1 4
0,16
4 9
4,33
7
Envi
ronm
enta
l Hea
lth 1
7,92
8 2
9,71
6 –
3
,630
3,2
21 –
3
1,26
0 8
5,75
5
Soci
al a
nd F
amily
Ser
vice
s 5
42 6
26 7
45 5
8 1
37 1
103
2,2
12
Plan
ning
and
Dev
elop
men
t 8
,546
3,5
18 2
,137
1,2
08 5
48 7
11,
523
27,
487
Recr
eatio
n an
d Cu
lture
31,
712
24,
967
2,2
04 4
,009
9,8
55 1
,194
36,
628
110
,569
Prop
erty
Pur
chas
es a
nd D
evel
opm
ent
1,3
41 1
,257
–
8 1
5 –
7
6,38
0 7
9,00
1
Sask
atoo
n Li
ght &
Pow
er 5
,105
5,0
76 –
6
3,95
8 7
04 –
1
1,50
3 8
6,34
6
Deb
t Ser
vici
ng C
osts
–
–
–
–
–
9,2
89 1
,078
10,
367
Tota
l 200
8$
189,
957
$ 9
3,06
5 $
5
,619
$ 7
8,19
2$
22,
763
$ 1
0,57
6$
216,
214
$ 61
6,38
6
Tota
l 200
7$
166
,066
$
75,8
24$
5,40
7$
78
,223
$
18,
392
$
7,8
90$
203
,280
$ 5
55,0
82
Tota
l 200
6$
180
,014
$
71,6
22$
5,11
4$
76
,409
$
16,
081
$
4,5
50$
161
,806
$ 5
15,5
96
Tota
l 200
5$
160
,665
$
65,1
05$
4,50
7$
69
,690
$
15,
619
$
4,2
68$
118
,642
$ 4
38,4
96
Tota
l 200
4$
152
,643
$
63,6
65$
4,08
5$
66
,594
$
13,
247
$
4,7
13$
79
,178
$ 3
84,1
25
Wages and
Benefits
Heating, L
ight, Power,
Water, Telephone
Capital
Expenditures
Total
Contracted and
General Service
s
Materials,
Goods,
Supplies
Donations, G
rants,
Subsidies
Finance Charg
es

76 C i t y o f S a s k a t o o n 2 0 0 8 A n n u a l R e p o r t C i t y o f S a s k a t o o n 2 0 0 8 A n n u a l R e p o r t
Summary of Public Utilities Operating ResultsFor the Years Ended December 31, 2004 to 2008 (in thousands of dollars)
Summary of Reserves and SurplusFor the Years Ended December 31, 2004 to 2008 (in thousands of dollars)
2004 2005 2006 2007 2008
Net surplus after deducting operating expenses, debt charges and contributions to reserves:
Saskatoon Light & Power $ 15,407 $ 15,999 $ 15,582 $ 17,499 $ 18,093
Transit System (before contribution from General Revenue) (11,680) (12,465) (13,222) (15,709) (18,355)
Net Surplus $ 3,727 $ 3,534 $ 2,360 $ 1,790 $ (262)
Amount contributed by Utilities to Revenue as Grant in Lieu of Taxes $ 16,203 $ 17,169 $ 18,440 $ 20,677 $ 20,573
2004 2005 2006 2007 2008
Reserves
Property Realized $ 21,907 $ 19,906 $ 7,833 $ 16,841 $ 14,504
Replacement 30,896 27,994 24,554 26,154 9,241
Future Expenditures 88,170 81,691 67,223 76,087 63,651
Surplus (Deficit) 1,335 2,706 (1,843) (1,432) (1,242)
$ 142,308 $ 132,297 $ 97,767 $ 117,650 $ 86,154

C i t y o f S a s k a t o o n 2 0 0 8 A n n u a l R e p o r t C i t y o f S a s k a t o o n 2 0 0 8 A n n u a l R e p o r t 77
Summary of Long-Term Debt and Required Sinking Fund Consolidation of All Obligations
As at December 31, 2004 to 2008
Summary of Long-Term Debt and Required Sinking Fund By Responsibility Centre
For the Year Ended December 31, 2008
2004 2005 2006 2007 2008
Total Long-Term Debt $ 23,192,246 $ 48,125,223 $ 42,719,327 $ 47,656,006 $ 89,144,000
Less Sinking Fund 3,064,218 2,689,183 1,459,273 910,144 –
$ 20,128,028 $ 45,436,040 $ 41,260,054 $ 46,745,862 $ 89,144,000
Population Estimate at Dec . 31 (1) 205,900 206,500 207,200 208,300 209,400
Gross Debt Per Capita $ 113 $ 233 $ 206 $ 229 $ 426
Net Debt Per Capita $ 98 $ 220 $ 199 $ 224 $ 426
Mill Rate Supported Debt $ 69 $ 121 $ 110 $ 145 $ 353
Legal Debt Limit $ 298,000,000 $ 298,000,000 $ 298,000,000 $ 298,000,000 $ 298,000,000
Debt servicing costs as a percentage of total expenditures
1 .110% 0 .890% 0 .790% 1 .210% 0.660%
(1) Population data is provided by the City Planning Branch, derived from Statistics Canada census data .
2007 Sinking Fund at Dec. 31/07 2008 Sinking Fund at
Dec. 31/08
Waterworks Utility $ 9,095,706 $ 637,668 $ 9,627,020 $ –
Wastewater Utility 8,071,751 (27,275) 5,593,980 –
Local Improvements - Property Share (1) 325,294 311,973 – –
Total Debt Not Supported by Civic Mill Rate $ 17,492,751 $ 922,366 $ 15,221,000 $ –
Total Civic Mill Rate Debt $ 30,163,255 $ (12,222) $ 73,923,000 $ –
Total Long-Term Debt $ 47,656,006 $ 89,144,000
Total Sinking Fund (910,144)
Net Debt (2) $ 46,745,862 $ 89,144,000
Population Estimate at Dec . 31 (3) 208,300 209,400
Gross Debt Per Capita $ 229 $ 426
Net Debt Per Capita $ 224 $ 426
Mill Rate Supported Debt $ 145 $ 353
(1) Including City share of Water and Wastewater Local Improvements . (2) All figures are based on book values and have not been adjusted for foreign currency exchange . (3) Population data is provided by the City Planning Branch, derived from Statistics Canada census data .

78 C i t y o f S a s k a t o o n 2 0 0 8 A n n u a l R e p o r t C i t y o f S a s k a t o o n 2 0 0 8 A n n u a l R e p o r t
Long-Term Debt Maturing With PercentagesAs at December 31, 2008
Year Debentures Maturing Percentage Yearly Percentage Reduction Accumulated
2009 $ 10,322,000 11 .580% 11 .580%
2010 10,726,000 12 .030% 23 .610%
2011 11,156,000 12 .520% 36 .130%
2012 11,612,000 13 .030% 49 .160%
2013 9,888,000 11 .090% 60 .250%
2014 6,964,000 7 .810% 68 .060%
2015 7,258,000 8 .140% 76 .200%
2016 5,085,000 5 .700% 81 .900%
2017 5,296,000 5 .940% 87 .840%
2018 5,514,000 6 .190% 94 .030%
2019 1,781,000 2 .000% 96 .030%
2020 1,862,000 2 .090% 98 .120%
2021 821,000 0 .920% 99 .040%
2022 859,000 0 .960% 100 .000%
Total $ 89,144,000 100.000%

C i t y o f S a s k a t o o n 2 0 0 8 A n n u a l R e p o r t C i t y o f S a s k a t o o n 2 0 0 8 A n n u a l R e p o r t 79
Summary of Property Assessment and Tax LevyFor the Years Ended December 31, 2004 to 2008
2004 2005* 2006 2007 2008
Gross Assessments $ 8,944,970,489 $ 10,179,196,988 $ 10,362,452,800 $ 10,535,989,990 $10,727,114,965
Exemptions 2,136,589,287 2,377,784,262 2,357,374,005 2,380,698,125 2,378,230,390
Assessed Value for Taxation $ 6,808,381,202 $ 7,801,412,726 $ 8,005,078,795 $ 8,155,291,865 $ 8,348,884,575
Mills Mills Mills Mills Mills
Tax Rate:
General 13 .35 12 .27 12 .45 12 .98 13.67
Library 1 .58 1 .42 1 .43 1 .45 1.52
Education:
Public Board/Separate Board 18 .84 17 .10 17 .58 18 .07 18.78
Total 33 .77 30 .79 31 .46 32 .50 33.97
$ 238,184,852 $ 242,572,222 $ 252,905,014 $ 262,313,610 $ 277,404,968
Property Roll Collections:
Current $ 234,268,076 $ 240,523,030 $ 250,106,925 $ 260,549,795 $ 275,395,743
Arrears 7,229,023 6,554,429 7,409,207 6,383,337 4,949,478
Total Collected $ 241,497,099 $ 247,077,459 $ 257,516,132 $ 266,933,132 $ 280,345,221
Percentage of Levy Collected:
Current 97 .34% 94 .34% 94 .54% 93 .89% 97.79%
Current and Arrears 96 .69% 93 .72% 93 .33% 93 .62% 97.55%
Taxes Outstanding:
Current $ 6,532,495 $ 5,912,631 $ 5,212,455 $ 3,835,898 $ 4,822,306
Arrears 2,425,158 3,142,864 2,393,853 1,924,893 1,095,263
Net Outstanding $ 8,957,653 $ 9,055,495 $ 7,606,308 $ 5,760,791 $ 5,917,569
* Reassessment

80 C i t y o f S a s k a t o o n 2 0 0 8 A n n u a l R e p o r t C i t y o f S a s k a t o o n 2 0 0 8 A n n u a l R e p o r t
Economic Highlights
Saskatoon Economic StatisticsFor the Years Ended December 31, 2004 to 2008 (in thousands of dollars)
2004 2005 2006 2007 2008
Saskatoon population (December 31)*: 205,900 206,500 207,200 208,300 209,400
Annual change 0 .300% 0 .300% 0 .330% 0 .530% 0.530%
Saskatoon inflation rate - annual change 2 .100% 2 .300% 2 .100% 3 .400% 3.900%
Saskatoon unemployment rate - annual average 8 .000% 6 .600% 5 .900% 5 .700% 5.700%
No . of Persons Employed in Saskatoon 122,200 126,400 128,000 135,500 138,200
Saskatoon Building Permits:
Total Number 2,481 2,444 2,709 3,672 3,516
Total Value $ 217,500 $ 276,600 $ 323,400 $ 549,400 $ 610,200
Annual Change (6 .100)% 27 .200% 16 .900% 69 .900% 11.070%
* Population data is provided by the City Planning Branch, derived from Statistics Canada census data .
Sources of Information: Statistics Canada City of Saskatoon - Planning Branch, Community Services Department
Major Taxpayers in Saskatoon2008 Taxable Assessment (in thousands of dollars)
Centre At Circle & Eighth Property Inc . $ 63,308
Midtown Plaza Inc . 58,859
Boardwalk Reit Properties Holdings Ltd . 48,504
Westfair Properties Ltd . 44,085
101042414 Saskatchewan Ltd . 31,581
Maple Leaf Foods 31,168
2055190 Ontario Ltd . 30,944
Saskatoon Airport Authority 28,396
959630 Alberta Inc . 27,910
CNH Canada Ltd . 27,787
Preston Crossing Properties Inc . 27,775
First Line Properties Ltd . 20,063
Confederation Shopping Centre Inc 19,858
Saskatoon Co-operative Association Ltd . 19,073
$ 44
2.56
$ 46
9.76
$ 47
9.26
$ 50
7.14
$ 54
3.95
2004 2005 2006 2007 2008
100
0
200
300
400
500
600
Municipal Property Tax (Per Capita)

C i t y o f S a s k a t o o n 2 0 0 8 A n n u a l R e p o r t C i t y o f S a s k a t o o n 2 0 0 8 A n n u a l R e p o r t 81
Economic Highlights (continued)
Building Permits Statistics for 2008 vs 2007
Number of Permits Construction Value ($million)
Category Dec 31/08 Dec 31/07 Change % Dec 31/08 Dec 31/07 Change %
Residential 2458 2565 -4 .2% $ 110.7 $ 125 .1 -11 .5%
Apartments and Housing Projects 232 270 -14 .1% $ 92.2 $ 98 .4 -6 .3%
Commercial 319 299 6 .7% $ 120.0 $ 81 .0 48 .1%
Industrial 174 146 19 .2% $ 87.2 $ 63 .5 37 .3%
Institutional and Assembly 87 75 16 .0% $ 177.7 $ 82 .0 116 .7%
Other (includes demolition permits) 246 317 -22 .4% $ 22.4 $ 99 .4 -77 .5%
Total 3516 3672 -4 .2% $ 610.2 $ 549 .4 11 .1%
Summary of Major Projects Approved in 2008(in millions of dollars)
Academic Health Sciences $ 123 .3 (Included in “Institutional & Assembly” above)
New Hospital - Centre for Mental Health $ 19 .1 (Included in “Institutional & Assembly” above)
New Apartment - Retirement Residence $ 18 .5 (Included in “Apartments & Housing Projects” above)
New Office Building - Cameco $ 17 .6 (Included in “Commercial” above)
402
369
499
386
631
756
330 41
6
2005 2006 2007 2008
100
0
200
300
400500
600700
800900
1000
1100
771885
961
1172
New Licensed Businesses
Commercial / Industrial
Home Based
2,01
55,
276
2,20
55,
325
2,55
45,
385
2,94
95,
506
2005 2006 2007 2008
1000
0
2000
3000
4000
5000
6000
7000
8000 7,291 7,5307,939
8,455
Total Licensed Businesses
Commercial / Industrial
Home Based

82 C i t y o f S a s k a t o o n 2 0 0 8 A n n u a l R e p o r t
205,
900
132,
800
2,53
8
2.1%
5.5%
3.24
%
206,
500
133,
000
2,57
6
2.3%
5.6%
3.94
%
207,
200
138,
100
2,63
1
2.1%
3.3%
1.86
%
208,
300
209,
400
143,
400
143,
900
2,73
7
2,82
1
3.4%
2.5%
3.8%
4.0%
4.76
%
5.44
%
2004 2005 2006 2007 2008
150,000
126,000
0
0
0
160,000
128,000
170,000
130,000
2,400
180,000
132,000
2,450
190,000
134,000
2,500
200,000
210,000
136,000
2,550
138,000
140,000
142,000144,000
2,600
2,750
2,650
2,800
2,700
2004 2005 2006 2007 2008
2004 2005 2006 2007 2008
2004 2005 2006 2007 2008
2004 2005 2006 2007 2008
2004 2005 2006 2007 2008
1
1
0 .5
1 .0
1 .5
2 .0
0
0
0 .0
2
2
2 .5
3
3
3 .0
3 .5
4 .0
4
5
6
4 .5
5 .0
5 .5
Population (as at December 31st)
Labour Force (for month of December)
Municipal Budgeted Staff YearsIncluding Boards and Commissions - excluding Library
Average Annual Consumer Price Index
Unemployment(for month of December)
Mill Rate Increase
Key Statistics

C i t y o f S a s k a t o o n 2 0 0 8 A n n u a l R e p o r t

WWW.SASKATOON.CAFor additional copies of this report, please contact (306) 975-3207