Financial Report for the Year Ended March 31, 2020 (FY2019 ...
29
June 4, 2020 Financial Report for the Year Ended March 31, 2020 (FY2019) [J-GAAP] (Consolidated) This document has been translated from the Japanese original, for reference purposes only. In the event of any discrepancy between this translated document and the Japanese original, the original shall prevail. Company name: Japan Airport Terminal Co., Ltd. (“the Company”) Listed stock exchange: Tokyo, 1st Section Code number: 9706 URL: https://www.tokyo-airport-bldg.co.jp/company/en/ Representative: Nobuaki Yokota, President and COO Contact: Kazuhito Tanaka, Managing Director TEL 03-5757-8409 Scheduled date of annual general meeting of shareholders: June 25, 2020 Scheduled date of filing securities report: June 25, 2020 Scheduled date of commencing dividend payment: June 26, 2020 Supplementary materials on financial results (yes/no): Yes Holding of earnings announcement (yes/no): Yes (for institutional investors and financial analysts) (Figures are rounded down to the nearest million yen.) 1. Consolidated Financial Results for the Year Ended March 31, 2020 (April 1, 2019 to March 31, 2020) (1) Consolidated Business Results (%: Change from the previous period) Operating revenues Operating income Ordinary income Net income attributable to owners of the parent Millions of yen % Millions of yen % Millions of yen % Millions of yen % FY2019 249,756 -8.7 9,892 -56.0 8,705 -57.3 5,012 -84.8 FY2018 273,618 21.1 22,481 67.4 20,379 22.1 33,004 180.3 (Note) Comprehensive income: FY2019 ¥4,119 million (-88.8%) FY2018 ¥36,748 million (167.1%) Net income per share Diluted net income per share Return on equity Ordinary income to total assets Operating income to operating revenues Yen Yen % % % FY2019 61.71 60.20 3.1 1.7 4.0 FY2018 406.31 388.03 22.2 5.6 8.2 (Reference) Equity in earnings of affiliates: FY2019 ¥462 million FY2018 ¥297 million (2) Consolidated Financial Position Total assets Net assets Equity capital to total assets Net assets per share Millions of yen Millions of yen % Yen As of March 31, 2020 521,363 201,899 31.2 2,001.83 As of March 31, 2019 484,654 201,390 33.7 2,011.61 (Reference) Equity capital: As of March 31, 2020 ¥162,605 million As of March 31, 2019 ¥163,399 million (3) Consolidated Cash Flows Cash flows from operating activities Cash flows from investing activities Cash flows from financing activities Cash and cash equivalents at the year-end Millions of yen Millions of yen Millions of yen Millions of yen FY2019 20,222 (57,334) 21,644 71,795 FY2018 34,288 (8,489) 19,152 87,273 2. Dividends Dividends per share Total dividends (annual) Dividend payout ratio (consolidated) Dividends on net assets (consolidated) Q1-End Q2-End Q3-End Year-end Annual Yen Yen Yen Yen Yen Millions of yen % % FY2018 - 23.00 - 22.00 45.00 3,655 31.2 2.5 FY2019 - 22.00 - 10.00 32.00 2,599 51.9 1.6 FY2020 (Forecast) - - - - - - (Note) We have decided to postpone the announcement of the outlook for dividend payment for the fiscal year ending March 31, 2021 3. Forecast of Consolidated Financial Results for the Year Ending March 31, 2021 (April 1, 2020 to March 31, 2021) With respect to the earnings forecast for the fiscal year ending March 31, 2021, since it is difficult to determine the impact of the new corona virus infection on an appropriate and reasonable basis, we have decided to postpone the announcement of our earnings forecast. We will announce our consolidated earnings forecast in the future as soon as when conditions are such that it becomes possible to disclose a reasonable estimate. For details, please refer to page 7 (Appendix) of Financial Report for the Year Ended March 31, 2020
Transcript of Financial Report for the Year Ended March 31, 2020 (FY2019 ...

June 4, 2020
Financial Report for the Year Ended March 31, 2020 (FY2019) [J-GAAP] (Consolidated)
This document has been translated from the Japanese original, for reference purposes only. In the event of any discrepancy between this translated
document and the Japanese original, the original shall prevail.
Company name: Japan Airport Terminal Co., Ltd. (“the Company”) Listed stock exchange: Tokyo, 1st Section
Code number: 9706 URL: https://www.tokyo-airport-bldg.co.jp/company/en/
Representative: Nobuaki Yokota, President and COO
Contact: Kazuhito Tanaka, Managing Director TEL 03-5757-8409
Scheduled date of annual general meeting of shareholders: June 25, 2020
Scheduled date of filing securities report: June 25, 2020
Scheduled date of commencing dividend payment: June 26, 2020
Supplementary materials on financial results (yes/no): Yes
Holding of earnings announcement (yes/no): Yes (for institutional investors and financial analysts)
(Figures are rounded down to the nearest million yen.)
1. Consolidated Financial Results for the Year Ended March 31, 2020 (April 1, 2019 to March 31, 2020)
(1) Consolidated Business Results (%: Change from the previous period)
Operating revenues Operating income Ordinary income Net income attributable to
owners of the parent
Millions of yen % Millions of yen % Millions of yen % Millions of yen %
FY2019 249,756 -8.7 9,892 -56.0 8,705 -57.3 5,012 -84.8
FY2018 273,618 21.1 22,481 67.4 20,379 22.1 33,004 180.3(Note) Comprehensive income: FY2019 ¥4,119 million (-88.8%) FY2018 ¥36,748 million (167.1%)
Net income per
share
Diluted net income
per share Return on equity
Ordinary income to
total assets
Operating income to
operating revenues
Yen Yen % % %
FY2019 61.71 60.20 3.1 1.7 4.0
FY2018 406.31 388.03 22.2 5.6 8.2 (Reference) Equity in earnings of affiliates: FY2019 ¥462 million FY2018 ¥297 million
(2) Consolidated Financial Position
Total assets Net assets Equity capital to
total assets Net assets per share
Millions of yen Millions of yen % Yen
As of March 31, 2020 521,363 201,899 31.2 2,001.83
As of March 31, 2019 484,654 201,390 33.7 2,011.61 (Reference) Equity capital: As of March 31, 2020 ¥162,605 million As of March 31, 2019 ¥163,399 million
(3) Consolidated Cash Flows
Cash flows from operating
activities
Cash flows from investing
activities
Cash flows from financing
activities
Cash and cash equivalents
at the year-end
Millions of yen Millions of yen Millions of yen Millions of yen
FY2019 20,222 (57,334) 21,644 71,795
FY2018 34,288 (8,489) 19,152 87,273
2. Dividends
Dividends per share Total dividends (annual)
Dividend payout ratio
(consolidated)
Dividends on net assets
(consolidated) Q1-End Q2-End Q3-End Year-end Annual
Yen Yen Yen Yen Yen Millions of yen % %
FY2018 - 23.00 - 22.00 45.00 3,655 31.2 2.5
FY2019 - 22.00 - 10.00 32.00 2,599 51.9 1.6 FY2020
(Forecast) - - - - - -
(Note) We have decided to postpone the announcement of the outlook for dividend payment for the fiscal year ending March 31, 2021
3. Forecast of Consolidated Financial Results for the Year Ending March 31, 2021 (April 1, 2020 to March 31, 2021)
With respect to the earnings forecast for the fiscal year ending March 31, 2021, since it is difficult to determine the impact of the new
corona virus infection on an appropriate and reasonable basis, we have decided to postpone the announcement of our earnings forecast.
We will announce our consolidated earnings forecast in the future as soon as when conditions are such that it becomes possible to
disclose a reasonable estimate. For details, please refer to page 7 (Appendix) of Financial Report for the Year Ended March 31, 2020

(FY2019) “1. Analysis of Business and Financial Results (4) Forecast for FY2020 (the Fiscal year ending March 31, 2021)”.
Other Information
(1) Significant changes in subsidiaries during the year under review (changes in specified subsidiaries involving changes in scope of
consolidation): No
New: None Excluded: None
(2) Changes in accounting policies, accounting estimates, and restatement of revisions
1) Changes in accounting policies due to revisions of accounting standards, etc.: None
2) Changes in accounting policies other than 1) above: None
3) Changes in accounting estimates: None
4) Restatement of revisions: None
(3) Number of shares outstanding (common stock)
1) Number of shares outstanding at the year-end (including treasury stock):
As of March 31, 2020 84,476,500 shares As of March 31, 2019 84,476,500 shares
2) Number of treasury stock at the year-end:
As of March 31, 2020 3,248,324 shares As of March 31, 2019 3,247,973 shares
3) Average number of shares outstanding during the period:
Year ended March 31, 2020 81,228,396 shares Year ended March 31, 2019 81,228,641 shares
(Reference) Summary of Non-Consolidated Financial Results
Financial Results for the Year Ended March 31, 2020 (April 1, 2019 to March 31, 2020)
(1) Non-Consolidated Business Results (%: Change from the previous period)
Operating revenues Operating income Ordinary income Net income
Millions of yen % Millions of yen % Millions of yen % Millions of yen %
FY2019 174,269 -7.4 471 -93.2 1,250 -83.4 759 -86.1
FY2018 188,121 6.8 6,880 -11.9 7,517 -14.3 5,460 -12.4
Net income per share Diluted net income per share
Yen Yen
FY2019 9.34 9.04
FY2018 67.23 64.03
(2) Non-Consolidated Financial Position
Total assets Net assets Equity capital to
total assets Net assets per share
Millions of yen Millions of yen % Yen
As of March 31, 2020 282,426 100,830 35.7 1,241.32
As of March 31, 2019 246,452 105,384 42.8 1,297.38 (Reference) Equity capital: As of March 31, 2020 ¥100,830 million As of March 31, 2019 ¥105,384 million
* This financial report is not subject to audits by certified public accountants or auditing firms.
* Statements regarding the proper use of financial forecast and other special remarks
Notes on the use of forward-looking statements
With respect to the earnings forecast for the fiscal year ending March 31, 2021, since it is difficult to determine the impact of the new
corona virus infection on an appropriate and reasonable basis, we have decided to postpone the announcement of our earnings
forecast. For details, please refer to page 7 of the appendix materials “1. Analysis of Business and Financial Results (4) Forecast for
FY 2020 (the fiscal year ending March 31, 2021).
Supplementary materials on financial results and details of presentation at earnings announcement
Earnings announcement is planned to be held on June 10, 2020 for financial analysts. Video of the presentation as well as
presentation materials used in the earnings announcement will be promptly posted on the Company’s website following the meeting.

Japan Airport Terminal Co., Ltd. (9706) Financial Report for the Year Ended March 31, 2020 (FY2019)
- 1 -
Contents of the Appendix Materials
1. ANALYSIS OF BUSINESS AND FINANCIAL RESULTS ..................................................................................... - 2 -
(1) ANALYSIS OF CONSOLIDATED BUSINESS RESULTS FOR FY 2019 .................................................................................. - 2 -
(2) ANALYSIS OF CONSOLIDATED FINANCIAL POSITION FOR FY2019 ................................................................................ - 5 -
(3) ANALYSIS OF CONSOLIDATED CASH FLOWS FOR FY 2019............................................................................................ - 5 -
(4) FORECAST FOR FY 2019 (THE FISCAL YEAR ENDING MARCH 31, 2020) ........................................................................ - 7 -
(5) BASIC POLICY ON DISTRIBUTION OF PROFITS AND DIVIDEND PAYMENT FOR FY2019/FY2020 ....................................... - 7 -
2. BASIC APPROACH ON SELECTION OF ACCOUNTING STANDARDS ............................................................. - 7 -
3. CONSOLIDATED FINANCIAL STATEMENTS AND MAIN NOTES ................................................................... - 8 -
(1) CONSOLIDATED BALANCE SHEETS .............................................................................................................................. - 8 -
(2) CONSOLIDATED STATEMENTS OF INCOME AND CONSOLIDATED STATEMENTS OF COMPREHENSIVE INCOME ............... - 10 -
Consolidated Statements of Income ............................................................................................................................. - 10 -
Consolidated Statements of Comprehensive Income ...................................................................................................... - 12 -
(3) CONSOLIDATED STATEMENTS OF CHANGES IN SHAREHOLDERS’ EQUITY .................................................................... - 13 -
(4) CONSOLIDATED STATEMENTS OF CASH FLOWS .......................................................................................................... - 15 -
(5) NOTES ON THE CONSOLIDATED FINANCIAL STATEMENTS .......................................................................................... - 17 -
(Notes on the Premise of a Going Concern) .................................................................................................................. - 17 -
(Basic Important Conditions to Prepare Consolidated Financial Statements) ................................................................... - 17 -
(Additional Information) ............................................................................................................................................ - 19 -
(Notes on Consolidated Balance Sheets) ...................................................................................................................... - 20 -
(Notes on Consolidated Statements of Income) ............................................................................................................. - 21 -
(Notes on Consolidated Statements of Cash Flows) ....................................................................................................... - 22 -
(Segment Information) ............................................................................................................................................... - 23 -
(Per Share Information) ............................................................................................................................................. - 26 -
(Significant Subsequent Events) .................................................................................................................................. - 26 -
4. OTHERS ......................................................................................................................................................... - 27 -

Japan Airport Terminal Co., Ltd. (9706) Financial Report for the Year Ended March 31, 2020 (FY2019)
- 2 -
1. Analysis of Business and Financial Results
(1) Analysis of Consolidated Business Results for FY 2019
During the fiscal year ended March 31, 2020 (FY 2019), the Japanese economy was experiencing gradual
recovery until February 2020, but the impact of the new corona virus infection (COVID-19) since March has
put a significant downward pressure on the economy placing us in a difficult situation. Looking ahead, the
situation is rapidly worsening due to the impact of COVID-19 and the situation is expected to continue to be
extremely difficult. With respect to our business environment, up to December 2019, the accumulated number of inbound
tourists to Japan reached a record high of 31.88 million in 2019 (January through December). However, since
the end of January 2020, due to the outbreak of COVID-19, group tours have been banned and the number of
flights originating from China and other countries has been reduced, resulting in a sharp decrease in inbound
tourists by approximately 60% in February 2020. In March, as the impact of COVID-19 spread worldwide and
many countries imposed countermeasures such as overseas travel restrictions and curfews, and tighter
quarantines as well as visa cancellations occurred in Japan, the number of visitors to Japan from around the
world fell approximately 90% below the previous year's level. Since April, there has been no sign of an end to
the outbreak of COVID-19, and movement has been suppressed all over the world due to people refraining
from traveling, so the environment remains challenging. With respect to international flights at Haneda Airport in particular, about half of all flights from China
were cancelled in February 2020. Subsequently all flights from China and South Korea were cancelled in
March. In addition, flights on other routes including those from Europe and the United States, were cancelled
so the number of passengers fell by more than 80% compared to the same month during the previous year.
Although there were no cancellations of domestic flights at Haneda Airport until February, scheduled flight
reductions have been implemented since early March, resulting in a 60% decrease in passenger volume in
March compared to the same month during the previous year. In addition, since February 2020, passenger
volume, especially international passenger volume, has significantly decreased at international hub airports
that we operate such as Narita Airport.
Amidst all of this, from the end of January to February 2020, the Japan Airport Terminal Group (“JAT
Group”) cooperated with relevant ministries and airlines to accept chartered flights dispatched by the Japanese
government to return Japanese nationals from Wuhan, China. We have also taken prompt actions appropriate
for this situation, such as the closure of certain facilities in the airport terminal and shortening of operating
hours, or temporary closure, of our directly managed stores.
Under these circumstances, JAT Group aspires to best satisfy the needs of all stakeholders. To create
business and revenue generation opportunities and achieve sustainable growth, we have set our long-term
vision “To be a World Best Airport”. Based on this objective, we have developed a medium-term business plan
(FY2016 – FY2020), involving three strategic pillars: 1) Pursuit of the ideal of Haneda Airport, 2) Expansion
of our business domain utilizing our strengths and the diversification of profits, and 3) Reconstruction of our
profit base and the building of competitive advantages. As a practical foundation for implementing such
strategy, we have been reorganizing our corporate structure and enhancing corporate governance.
As our management priorities for FY 2019, we have worked on preparations for operating Haneda’s
international facilities after their opening, an appropriate response to changes in the consumption trend
involving Chinese travelers to Japan, and the implementation of our profit plan to ensure that we accomplish
our guidelines for FY 2020. In particular, regarding our “preparations for opening Haneda’s international
facilities”, we changed the name of the International Terminal to “Terminal 3” on March 14, 2020 and
commenced operation of international facilities at Terminal 2 on March 29 to coincide with the increased
flight slots of international flights at Haneda Airport permitted by Japan’s Ministry of Land, Infrastructure,
Transport and Tourism (“MLIT”). Furthermore, we have implemented facility improvements, including the
expansion of office space on the north side of Terminal 2 and the expansion of Terminal 3, which were
completed in October and December 2019 respectively, as well as the promotion of "FAST TRAVEL" a
stress-free and comfortable boarding procedure that utilizes state-of-the-art technology, enhancement of
universal design, and the installation of multilingual support to ensure seamless transportation.
As part of our commercial efforts, we opened and renovated shops at domestic and international terminals.
In addition, to "respond to changes in consumption trends" we opened 34 stores in the commercial area of the
international facility at Terminal 2 under the concept of "TOKYO AIR" where visitors can experience the
atmosphere of Tokyo and opened "HANEDA VIRTUAL BOUTIQUE", the first virtual boutique in the
domestic duty-free market that fuses real and digital environments.
Other activities include the acquisition of shares of AGP Corporation (“AGP”) in February 2020, turning
AGP into a company accounted for using equity method. We believe that new synergies can be created in the
future through the expansion of our business domain and application to our airport operations, both
domestically and internationally. Furthermore, we entered into a comprehensive business alliance agreement
with JTB Corporation in March with the aim of jointly creating new attractions and exchanges, as well as
businesses that improve the experience of customers originating from Haneda Airport. In addition to providing

Japan Airport Terminal Co., Ltd. (9706) Financial Report for the Year Ended March 31, 2020 (FY2019)
- 3 -
new services at Haneda Airport, we will contribute to the revitalization of the local community by providing
tourist information and promotions at the newly opened Welcome Center in Terminal 2, and by introducing a
café that utilizes local food to showcase the charm of the area. As part of our ESG related efforts, in consideration of the global environment, we began construction of a
new recycling facility in February 2020 which is planned to commence operation during the fiscal year ending
March 31, 2021 with the aim of achieving more efficient waste disposal as a countermeasure to the future
increase in Haneda Airport’s waste volume. Also, in March we switched to “Bio LIMEX” shopping bags,
which are mainly composed of limestone and plant-derived resin, as a frontrunner among domestic airports.
We plan to introduce these bags at all of our directly managed stores by June. This measure is expected to
reduce the annual consumption of petroleum-derived plastics at Haneda Airport by approximately 462 tons
and annual CO2 emissions by approximately 1,000 tons. In addition, as a social contribution activity for
human resource development, we supported the “Japan Public-Private Partnership Student Study Abroad
Program (TOBITATE! Young Ambassador Program),” a public-private partnership project.
Lastly, the decision to postpone the Tokyo Olympic and Paralympic Games was made in March 2020, but
this decision is expected to have only a minor impact on our business performance. As the sky gateway to the
Tokyo metropolitan area, we will continue preparations to ensure the smooth hosting of the games.
As a result of the above, with respect to consolidated financial results for FY 2019 (April 1, 2019 – March
31, 2020), operating revenues were ¥249,756 million (down 8.7% year-on-year), operating income was ¥9,892
million (down 56.0%), ordinary income was ¥8,705 million (down 57.3%), and without the extraordinary income
due to the consolidation of Tokyo International Air Terminal Corp. (TIAT) as a consolidated subsidiary
recognized last fiscal year, net income attributable to owners of the parent was ¥5,012 million (down 84.8%).
With respect to operating revenue, although there was an increase in rent revenue in Facilities
Management, revenue decreased in Merchandise Sales and Food and Beverage as a result of a decrease in the
number of domestic and international passengers due to the impact of COVID-19. As for operating income, a
decrease in revenue and the recognition of a one-time cost due to the opening of the international facility at
Terminal 2 resulted in a decline in profits, despite implementing a variety of cost-reduction measures to
achieve our profit plan amidst the global pandemic, including shortened opening hours and temporary closures
of directly managed stores, a reduction in the number of free shuttle buses operating at airports, and the
postponement of renovation work at existing facilities.
(Millions of yen)
Operating Results
FY2018
(from April 1, 2018 to
March 31, 2019)
FY2019
(from April 1, 2019 to
March 31, 2020)
Year-on-Year
(%)
Operating revenues 273,618 249,756 -8.7
[Facilities Management] 82,050 82,942 1.1
[Merchandise Sales] 171,472 147,893 -13.8
[Food and Beverage] 20,095 18,920 -5.8
Operating income 22,481 9,892 -56.0
Ordinary income 20,379 8,705 -57.3
Quarterly net income attributable to
owners of the parent 33,004 5,012 -84.8
In the Skytrax (UK) “Global Airport Rating” published in November 2019, Haneda Airport’s passenger
terminals were awarded the world’s highest standard “5-star Airport” for the sixth consecutive year.
Moreover, in May 2020, we were awarded second place globally in the World’s Best Airports, which
comprehensively evaluates various aspects of international airports in 2020. Furthermore, we were awarded first
place in the World's Cleanest Airports (for the fifth year in a row), World's Best Domestic Airports (for the
eighth consecutive year), and World's Best PRM / Accessible Facilities (for the second consecutive year). JAT
Group will continue to work cooperatively as an entire airport so that both domestic and international
terminals offer a high level of customer convenience, comfort, and functionality. In pursuit of the ideal of
Haneda Airport, we aim to be the airport that earns the long-term trust of customers from all over the world.
The following is a breakdown of earnings by segment. Note that the figures for operating income are
equivalent to those for segment income.

Japan Airport Terminal Co., Ltd. (9706) Financial Report for the Year Ended March 31, 2020 (FY2019)
- 4 -
Overview by Segment
[Facilities Management]
(Millions of yen)
Operating Results
FY2018
(from April 1, 2018 to
March 31, 2019)
FY2019
(from April 1, 2019 to
March 31, 2020)
Year-on-Year
(%)
Facilities Management 82,050 82,942 1.1
Rent revenue 17,454 18,259 4.6
Facility user charges revenue 43,505 41,019 -5.7
Other revenues 21,090 23,662 12.2
Intersegment sales and transfers 5,533 5,697 3.0
Total of Operating Revenues 87,584 88,640 1.2
Segment income 14,339 6,932 -51.7
Rent revenue rose from the previous year due to the opening of “THE HANEDA HOUSE” in the
previous fiscal year and an increase in rental spaces to airline companies including floor expansion of office
space on the north side of Terminal 2 in October 2019.
Revenue from facility user charges decreased from the previous year since the user charge decreased due
to the decline in volume of domestic and international passengers by the impact of COVID-19.
Other revenues rose from the previous year primarily because of revenue increase in contracting
construction work and security and other outsourced operations with respect to the construction work of the
international facilities at Terminal 2.
As a result, operating revenues from facilities management operations increased to ¥88,640 million (up
1.2% year-on-year). Operating income for the segment decreased to ¥6,932 million (down 51.7%
year-on-year). The decrease in income was due to an increase in depreciation expense and operating expense
related to the boarding stations and the satellite facility in Terminal 2 that commenced operation last fiscal year,
the expansion of P4 parking, and the expansion part of the international terminal that commenced operation in
December 2019, an increase in maintenance expenses upon the completion of renovation work of Terminal 1
in September 2019 and the floor expansion of office space on the north side of Terminal 2 in October 2019,
and one-time costs including real estate acquisition tax when international facility at Terminal 2 commenced
operation in March 2020.
[Merchandise Sales]
(Millions of yen)
Operating Results
FY2018
(from April 1, 2018 to
March 31, 2019)
FY2019
(from April 1, 2019 to
March 31, 2020)
Year-on-Year
(%)
Merchandise Sales 171,472 147,893 -13.8
Sales at domestic terminal stores 36,212 33,148 -8.5
Sales at international terminal
stores 98,515 84,420 -14.3
Other revenues 36,745 30,323 -17.5
Intersegment sales and transfers 1,523 1,378 -9.5
Total of Operating Revenues 172,996 149,272 -13.7
Segment income 15,760 10,823 -31.3
Sales at domestic terminal stores fell from the previous year because of the closure of stores such as
Isetan Haneda Store (men’s) in Terminal 2 due to construction work of the international facility at Terminal 2
and decrease in passenger volume by the impact of COVID-19.
Sales at international terminal stores at Haneda Airport slightly exceeded the same period of the previous
year until December 2019 due to the renewal effect of TIAT DUTY FREE SHOP CENTRAL amid the
declining consumption trend of the visitors from China. Since February 2020, the impact of COVID-19,
especially the decline in the number of Chinese passengers due to flight cancellations in China was significant,
sales were lower than in the previous year. At Narita Airport and Japan Duty Free GINZA, an airport-style
duty-free shop, due to the impact of temporary closures in the first half of the year for store renovations, a
decline in Chinese consumption, and a decline in passenger volume by the impact of COVID-19 that began in
February 2020, the sales were significantly lower than the previous year.
With respect to other revenues, the wholesaling business and outsourced store operations at Narita Airport
decreased and wholesale business at regional airports decreased resulting from fewer inbound tourists from

Japan Airport Terminal Co., Ltd. (9706) Financial Report for the Year Ended March 31, 2020 (FY2019)
- 5 -
Korea since July 2019. In addition, due to cancellation of international flights by the spread of COVID-19 that
resulted in lower sales in the wholesaling business, other revenues fell significantly below the same period of
the previous year.
As a result, operating revenues from merchandise sales operations decreased to ¥149,272 million (down
13.7% year-on-year). Operating income decreased to ¥10,823 million (down 31.3% year-on-year) due to the
increase in one-time costs for the renovation of duty free shops in Narita Airport and airport-style in-city
duty-free shop, and newly opened stores including duty free shops in Haneda Airport Terminal 2 in addition to
the effect of the decline in revenue.
[Food and Beverage]
(Millions of yen)
Operating Results
FY2018
(from April 1, 2018 to
March 31, 2019)
FY2019
(from April 1, 2019 to
March 31, 2020)
Year-on-Year
(%)
Food and Beverage 20,095 18,920 -5.8
Sales from food and beverage
stores 12,514 11,514 -8.0
Sales from in-flight meals 6,764 6,543 -3.3
Other revenues 816 863 5.8
Intersegment sales and transfers 2,518 2,641 4.9
Total of Operating Revenues 22,613 21,561 -4.7
Segment income 880 451 -48.7
Sales from food and beverage operations decreased from the previous year due to the shortened operating
hours and temporary closure of food and beverage shops in light of the decrease in passenger volume by the
impact of COVID-19 in addition to the closures of shops because of the construction work for the international
facility at Terminal 2.
Sales from in-flight meals decreased from the previous year due to decline in passenger volume since
February 2020, although sales rose up to December 2019 compared to the same period during the previous
year due to an increase in the passenger numbers of foreign carriers, our clients in this business.
As a result, operating revenues from food and beverage operations decreased to ¥21,561 million (down
4.7% year-on-year). Operating income for the segment decreased to ¥451 million (down 48.7% year-on-year)
due to the significant impact of the decline in sales despite cost-saving efforts in procurement and other costs.
(2) Analysis of Consolidated Financial Position for FY 2019
[Assets]
Regarding current assets, cash and deposits decreased primarily due to payment for construction work.
Regarding fixed assets, buildings and structures increased resulting from the completion of facilities including
the international facility at Terminal 2, expansion of Terminal 3 and floor expansion of office space on the
north side of Terminal 2 which are part of the investment to internationalize Haneda Airport, despite the
progress of depreciation of buildings and structures. In addition, activities such as the acquisition of share of
AGP, together resulted in an increase in total assets by ¥36,708 million from the previous fiscal year end to
¥521,363 million.
[Liabilities]
Liabilities increased due to additional borrowings of long-term loans payable combined with issuance of
unsecured straight bonds despite redemption of bonds with stock acquisition rights and repayment of
long-term loans payable. As a result, total liabilities increased by ¥36,199 million from the previous fiscal year
end to ¥319,464 million.
[Net assets]
Net income for the year increased retained earnings and non-controlling interests despite the decrease due
to dividend payment and valuation difference on available-for-sale securities.
This has increased total net assets by ¥509 million from the previous fiscal year end to ¥201,899 million.
As a result, equity ratio was 31.2% (compared to 33.7% at the previous fiscal year end).
(3) Analysis of Consolidated Cash Flows for FY 2019
Cash and cash equivalents (hereinafter referred to as “cash”) at the current fiscal year end decreased by
¥15,477 million compared to the previous fiscal year end to ¥71,795 million.
The following is a summary of cash flows and the factors behind these flows for the current fiscal year.
Japan Airport Terminal Co., Ltd. (9706) Financial Report for the Year Ended March 31, 2020 (FY2019)
- 6 -
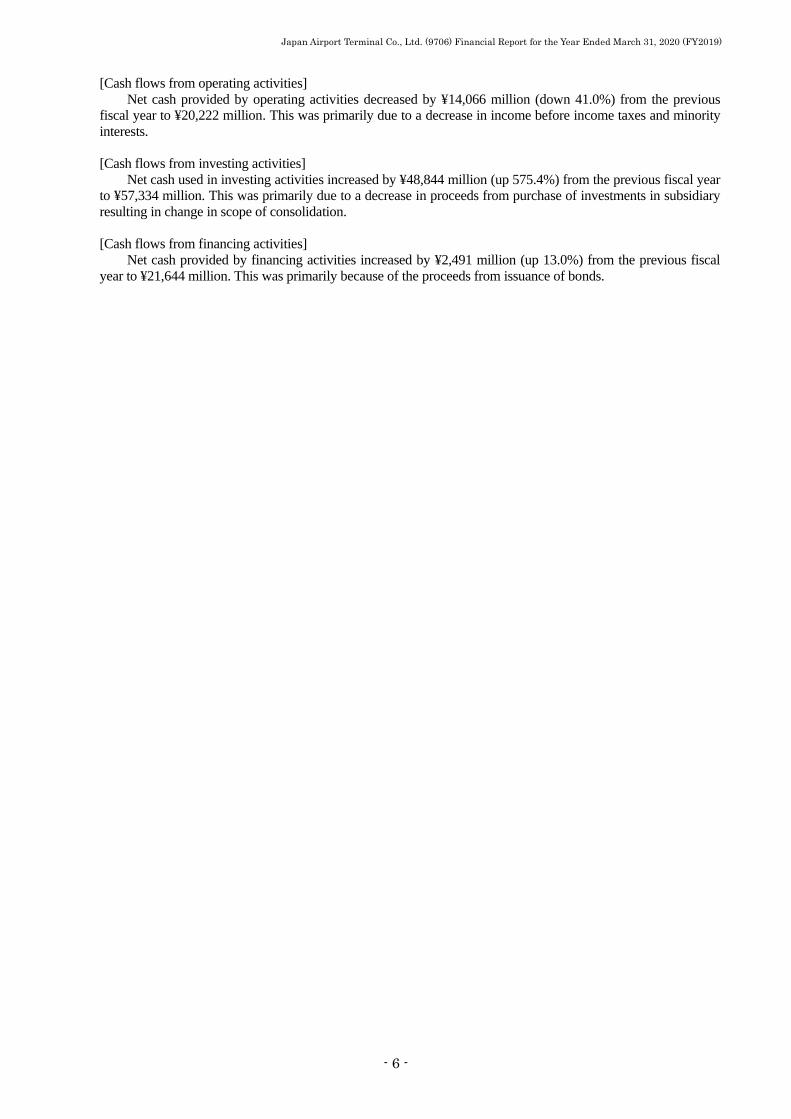
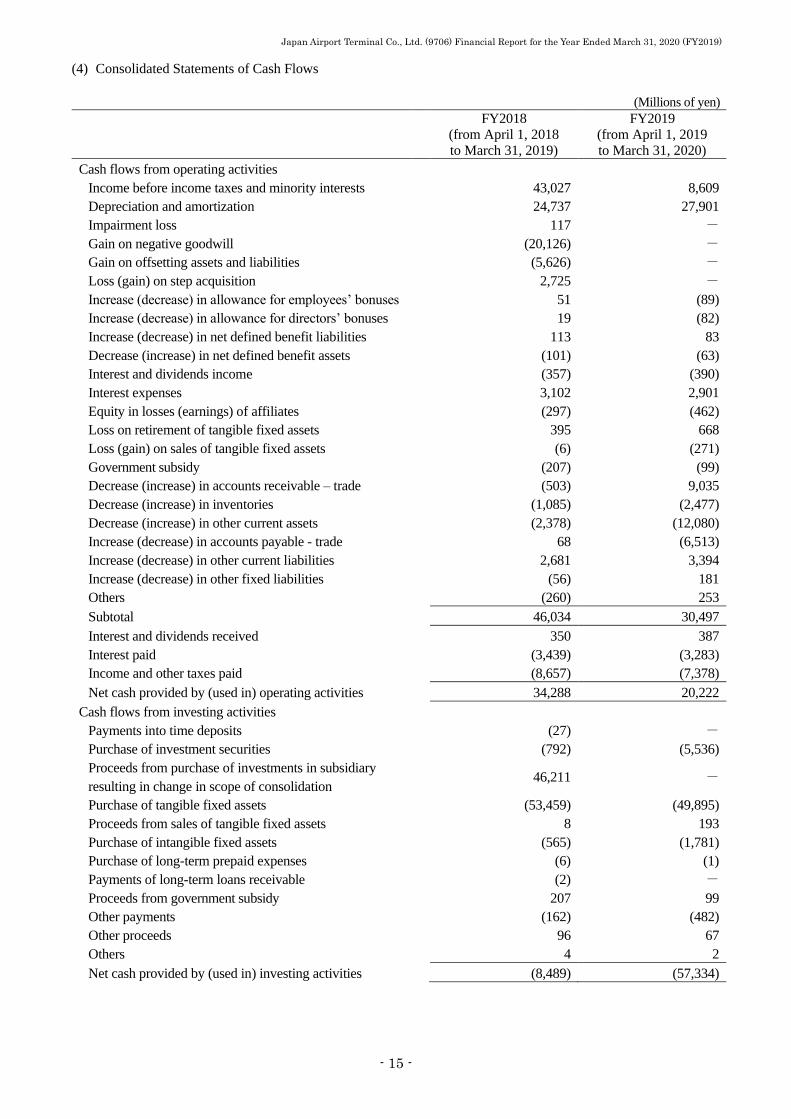
[Cash flows from operating activities]
Net cash provided by operating activities decreased by ¥14,066 million (down 41.0%) from the previous
fiscal year to ¥20,222 million. This was primarily due to a decrease in income before income taxes and minority
interests.
[Cash flows from investing activities]
Net cash used in investing activities increased by ¥48,844 million (up 575.4%) from the previous fiscal year
to ¥57,334 million. This was primarily due to a decrease in proceeds from purchase of investments in subsidiary
resulting in change in scope of consolidation.
[Cash flows from financing activities]
Net cash provided by financing activities increased by ¥2,491 million (up 13.0%) from the previous fiscal
year to ¥21,644 million. This was primarily because of the proceeds from issuance of bonds.

Japan Airport Terminal Co., Ltd. (9706) Financial Report for the Year Ended March 31, 2020 (FY2019)
- 7 -
(4) Forecast for FY 2020 (the fiscal year ending March 31, 2021)
Due to the impact of COVID-19, the airline industry is facing a significant decline in demand for air
travel due to travel restrictions around the world and the request for voluntary refrain from domestic travel.
After Japan’s declaration of a state of emergency on April 7, more than 90% of international flights and
70% of domestic passenger flights have been cancelled at Haneda Airport, resulting in a significant decrease in
passenger volume. To ensure the health and safety of airport users and employees, as well as to prevent the
further spread of infection, we have temporarily closed or shortened hours of operation for some of our stores
and facilities in the airport terminal. In addition, we offered rent reduction and exemption to our tenants
including airlines, retail shops and restaurants. This has had a significant impact on our Group’s performance,
including continued declines in rent revenue, facility user charge revenue, parking revenue, paid lounge sales,
merchandise sales, and food and beverage sales.
As countermeasures, JAT Group has implemented cost-cutting efforts such as reducing operating and
management costs by limiting the operating areas at airport terminals and other facilities and partially reducing
executive compensation. From a financial perspective, we secured a short-term borrowing facility of ¥20.0
billion from several banks in April 2020, in addition to an existing commitment line of ¥9.0 billion, in order to
avoid the risk of insufficient funds due to our revenue decline. We will continue to consider further measures to
secure sufficient funding to counteract the prolonged impact of a decline in revenue.
With respect to the earnings forecast, although Japan’s state of emergency has been lifted, since it is
difficult to determine the outlook of the recovery in demand for both domestic and international flights, we
have decided to postpone the announcement of our earnings forecast for the fiscal year ending March 31, 2021.
We will announce our earnings forecast in the future when conditions are such that it becomes possible to
provide a reasonable estimate.
The impact of COVID-19 is expected to significantly change the course of society as a whole including
more people working outside of their offices, and the outlook of the airline industry remains uncertain.
However, in the medium- to long-term, we expect a further increase in demand for air travel, and we will
continue to work towards increasing the value of Haneda Airport by further improving the convenience,
functionality, and comfort of the terminal buildings as the sky gateway to the Tokyo metropolitan area.
(5) Basic Policy on Distribution of Profits and Dividend Payment for FY2019/FY2020
Due to the nature of the Company’s business to operate the Haneda Airport terminal, large-scale
investments take place once every several years, so we believe it is necessary to secure sufficient retained
earnings that take into account such large-scale investments including facility renewal work. At the same time,
we consider the return of profits to our shareholders to be one of our most important management priorities.
Our basic policy is to maintain stable dividend payment and proactively return profits in accordance with our
business performance, with a dividend ratio of 30% or more as the target indicator in our medium-term
business plan. Although the impact of COVID-19 has a significant impact on our performance, we believe that
it is a temporary factor and we have no plans to change our basic policy regarding return of profits to our
shareholders.
Our performance up to third quarter of the fiscal year ended March 31, 2020 was generally in line with
our earnings forecast, but net income for FY2019 fell approximately 40% below the forecast due to a
significant decrease of profit during the fourth quarter by the impact of COVID-19. Taking this outcome into
account, we have decided to pay a year-end dividend of ¥10 per share for the fiscal year ended March 31, 2020.
This matter will be submitted to the 76th Ordinary General Meeting of Shareholders to be held on June 25,
2020. As a result, the annual dividend for the fiscal year ended March 31, 2020, together with the interim
dividend of ¥22 per share, will be ¥32 per share, bringing the dividend ratio to 51.9%.
With respect to our planned dividend payment for the fiscal year ending March 31, 2021, we have decided
to postpone the announcement. We will announce our planned dividend payment in the future when conditions
are such that it becomes possible to announce a reasonable earnings forecast.
2. Basic Approach on Selection of Accounting Standards To secure comparability between companies and between fiscal years, the Group prepares its consolidated
financial statements in accordance with the Ordinance on Terminology, Forms and Preparation Methods of
Consolidated Financial Statements (Finance Ministry Ordinance No. 28 of 1976), excluding Chapter 7 and
Chapter 8.
The Group will appropriately consider the possibility of adoption of international accounting standards
taking into consideration of conditions in Japan and overseas.

Japan Airport Terminal Co., Ltd. (9706) Financial Report for the Year Ended March 31, 2020 (FY2019)
- 8 -
3. Consolidated Financial Statements and Main Notes
(1) Consolidated Balance Sheets
(Millions of yen)
FY2018
(As of March 31, 2019)
FY2019
(As of March 31, 2020)
ASSETS
Current assets
Cash and deposits 87,458 71,958
Accounts receivable 17,959 8,924
Merchandise and finished products 10,968 13,440
Raw materials and stored goods 141 146
Other current assets 7,306 19,797
Allowance for doubtful accounts (16) (18)
Total current assets 123,817 114,248
Fixed assets
Tangible fixed assets
Buildings and structures 459,499 552,854
Accumulated depreciation and impairment loss (261,619) (277,692)
Buildings and structures (net) 197,879 275,162
Machinery, equipment and vehicles 23,945 37,743
Accumulated depreciation and impairment loss (13,457) (15,266)
Machinery, equipment and vehicles (net) 10,488 22,476
Land 11,371 12,881
Lease assets 1,261 3,622
Accumulated depreciation and impairment loss (695) (965)
Lease assets (net) 565 2,657
Construction in progress 58,988 6,258
Other tangible fixed assets 59,926 67,111
Accumulated depreciation and impairment loss (46,826) (50,994)
Other tangible fixed assets (net) 13,099 16,116
Total tangible fixed assets 292,393 335,551
Intangible fixed assets
Leasehold right 37,050 35,205
Other intangible fixed assets 2,586 3,614
Total intangible fixed assets 39,637 38,820
Investments and other assets
Investment securities 16,835 20,082
Deferred tax assets 6,981 8,748
Net defined benefit assets 1,385 387
Other investments 3,604 3,523
Total investments and other assets 28,806 32,742
Total fixed assets 360,837 407,114
TOTAL ASSETS 484,654 521,363

Japan Airport Terminal Co., Ltd. (9706) Financial Report for the Year Ended March 31, 2020 (FY2019)
- 9 -
(Millions of yen)
FY2018
(As of March 31, 2019)
FY2019
(As of March 31, 2020)
LIABILITIES
Current liabilities
Accounts payable 9,774 3,261
Short-term loans payable 12,724 13,646
Current portion of bonds with stock acquisition
rights
15,013 -
Accrued expenses 13,547 8,736
Income taxes payable 4,482 1,517
Allowance for employees’ bonuses 1,725 1,635
Allowance for directors’ bonuses 269 186
Other current liabilities 10,355 35,343
Total current liabilities 67,894 64,327
Fixed liabilities
Bonds 11,127 50,985
Bonds with stock acquisition rights 15,031 15,020
Long-term loans payable 161,345 161,011
Lease obligations 409 2,402
Deferred tax liabilities 14,204 13,357
Allowance for directors’ retirement benefits 57 55
Net defined benefit liabilities 4,059 4,141
Asset retirement obligations 478 486
Other fixed liabilities 8,656 7,675
Total fixed liabilities 215,370 255,136
TOTAL LIABILITIES 283,264 319,464
NET ASSETS
Shareholders’ equity
Common stock 17,489 17,489
Capital surplus 21,337 21,337
Retained earnings 122,012 123,451
Treasury stock (3,246) (3,248)
Total shareholders’ equity 157,592 159,029
Accumulated other comprehensive income
Valuation difference on available-for-sale
securities
5,506 3,637
Deferred gains or losses on hedges 197 609
Foreign currency translation adjustment 47 37
Remeasurements of defined benefit plans 55 (708)
Total accumulated other comprehensive income 5,807 3,575
Non-controlling interests 37,990 39,294
TOTAL NET ASSETS 201,390 201,899
TOTAL LIABILITIES AND NET ASSETS 484,654 521,363

Japan Airport Terminal Co., Ltd. (9706) Financial Report for the Year Ended March 31, 2020 (FY2019)
- 10 -
(2) Consolidated Statements of Income and Consolidated Statements of Comprehensive Income
Consolidated Statements of Income
(Millions of yen)
FY2018
(from April 1, 2018
to March 31, 2019)
FY2019
(from April 1, 2019
to March 31, 2020)
Operating revenues
Rent revenue 17,454 18,259
Facility user charges revenue 43,505 41,019
Other revenues 21,314 23,801
Sale of merchandise 171,249 147,563
Sale of food and beverage 20,095 19,111
Total operating revenues 273,618 249,756
Cost of sales
Cost of sales of merchandise 121,195 104,288
Cost of sales of food and beverage 10,934 10,336
Total cost of sales 132,129 114,625
Gross profit 141,489 135,130
Selling, general and administrative expenses
Salaries and wages 12,072 12,816
Provision for employees’ bonuses 1,620 1,628
Provision for directors’ bonuses 269 186
Expenses for retirement benefits 955 904
Rent expenses 16,974 16,297
Outsourcing and commission 30,333 27,576
Depreciation expenses 24,634 27,807
Other costs and expenses 32,147 38,021
Total selling, general and administrative expenses 119,007 125,238
Operating income 22,481 9,892
Non-operating income
Interest income 26 25
Dividends income 330 364
Equity in gains of affiliates 297 462
Contributions in aid of construction 41 353
Miscellaneous income 1,078 1,281
Total non-operating income 1,775 2,488
Non-operating expenses
Interest expenses 3,102 2,901
Loss on retirement of fixed assets 82 240
Fee and commission expenses 584 459
Miscellaneous expenses 107 74
Total non-operating expenses 3,877 3,675
Ordinary income 20,379 8,705

Japan Airport Terminal Co., Ltd. (9706) Financial Report for the Year Ended March 31, 2020 (FY2019)
- 11 -
(Millions of yen)
FY2018
(from April 1, 2018
to March 31, 2019)
FY2019
(from April 1, 2019
to March 31, 2020)
Extraordinary gains
Gains on sales of fixed assets - 271
Gain on offsetting assets and liabilities 5,626 -
Gain on negative goodwill 20,126 -
Government subsidy 207 99
Other extraordinary gains - 5
Total extraordinary gains 25,960 376
Extraordinary loss
Impairment loss 117 -
Loss on retirement of fixed assets 315 429
Loss of step acquisition 2,725 -
Loss on reduction entry of fixed assets - 44
Other extraordinary loss 152 -
Total extraordinary loss 3,311 473
Income before income taxes and non-controlling interests 43,027 8,609
Income taxes – current 7,742 3,966
Income taxes for prior periods - 494
Income taxes – deferred (381) (1,840)
Total income taxes 7,360 2,620
Net income before non-controlling interests 35,666 5,988
Net income attributable to non-controlling interests 2,662 975
Net income attributable to owners of the parent 33,004 5,012

Japan Airport Terminal Co., Ltd. (9706) Financial Report for the Year Ended March 31, 2020 (FY2019)
- 12 -
Consolidated Statements of Comprehensive Income
(Millions of yen)
FY2018
(from April 1, 2018
to March 31, 2019)
FY2019
(from April 1, 2019
to March 31, 2020)
Net income before non-controlling interests 35,666 5,988
Other comprehensive income
Valuation difference on available-for-sale securities (772) (1,893)
Deferred gains (losses) on hedges 386 808
Foreign currency translation adjustment (6) (10)
Remeasurements of defined benefit plans 238 (738)
Share of other comprehensive income of associates
accounted for using equity method
1,235 (35)
Total other comprehensive income 1,081 (1,869)
Comprehensive income 36,748 4,119
Comprehensive income attributable to:
Comprehensive income attributable to owners of the
parent
33,856 2,781
Comprehensive income attributable to non-controlling
interests
2,891 1,338
Japan Airport Terminal Co., Ltd. (9706) Financial Report for the Year Ended March 31, 2020 (FY2019)
- 13 -
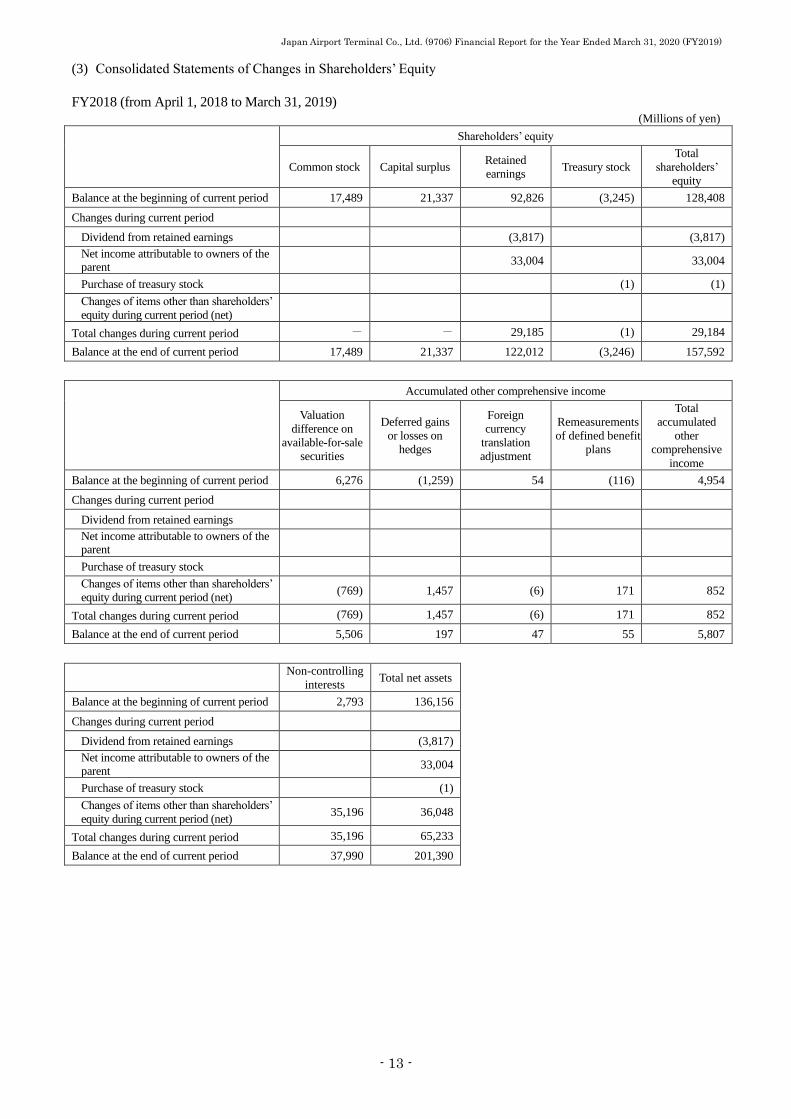
(3) Consolidated Statements of Changes in Shareholders’ Equity
FY2018 (from April 1, 2018 to March 31, 2019)
(Millions of yen)
Shareholders’ equity
Common stock Capital surplus Retained
earnings Treasury stock
Total
shareholders’
equity
Balance at the beginning of current period 17,489 21,337 92,826 (3,245) 128,408
Changes during current period
Dividend from retained earnings (3,817) (3,817)
Net income attributable to owners of the parent
33,004 33,004
Purchase of treasury stock (1) (1)
Changes of items other than shareholders’
equity during current period (net)
Total changes during current period - - 29,185 (1) 29,184
Balance at the end of current period 17,489 21,337 122,012 (3,246) 157,592
Accumulated other comprehensive income
Valuation
difference on
available-for-sale
securities
Deferred gains
or losses on
hedges
Foreign
currency
translation
adjustment
Remeasurements
of defined benefit
plans
Total
accumulated
other
comprehensive
income
Balance at the beginning of current period 6,276 (1,259) 54 (116) 4,954
Changes during current period
Dividend from retained earnings
Net income attributable to owners of the parent
Purchase of treasury stock
Changes of items other than shareholders’
equity during current period (net) (769) 1,457 (6) 171 852
Total changes during current period (769) 1,457 (6) 171 852
Balance at the end of current period 5,506 197 47 55 5,807
Non-controlling
interests Total net assets
Balance at the beginning of current period 2,793 136,156
Changes during current period
Dividend from retained earnings (3,817)
Net income attributable to owners of the parent
33,004
Purchase of treasury stock (1)
Changes of items other than shareholders’
equity during current period (net) 35,196 36,048
Total changes during current period 35,196 65,233
Balance at the end of current period 37,990 201,390

Japan Airport Terminal Co., Ltd. (9706) Financial Report for the Year Ended March 31, 2020 (FY2019)
- 14 -
FY2019 (from April 1, 2019 to March 31, 2020)
(Millions of yen)
Shareholders’ equity
Common stock Capital surplus Retained
earnings Treasury stock
Total
shareholders’
equity
Balance at the beginning of current period 17,489 21,337 122,012 (3,246) 157,592
Changes during current period
Dividend from retained earnings (3,574) (3,574)
Net income attributable to owners of the parent
5,012 5,012
Purchase of treasury stock (1) (1)
Changes of items other than shareholders’
equity during current period (net)
Total changes during current period - - 1,438 (1) 1,436
Balance at the end of current period 17,489 21,337 123,451 (3,248) 159,029
Accumulated other comprehensive income
Valuation
difference on
available-for-sale
securities
Deferred gains
or losses on
hedges
Foreign
currency
translation
adjustment
Remeasurements
of defined benefit
plans
Total
accumulated
other
comprehensive
income
Balance at the beginning of current period 5,506 197 47 55 5,807
Changes during current period
Dividend from retained earnings
Net income attributable to owners of the parent
Purchase of treasury stock
Changes of items other than shareholders’
equity during current period (net) (1,869) 412 (10) (764) (2,231)
Total changes during current period (1,869) 412 (10) (764) (2,231)
Balance at the end of current period 3,637 609 37 (708) 3,575
Non-controlling
interests Total net assets
Balance at the beginning of current period 37,990 201,390
Changes during current period
Dividend from retained earnings (3,574)
Net income attributable to owners of the parent
5,012
Purchase of treasury stock (1)
Changes of items other than shareholders’
equity during current period (net) 1,303 (927)
Total changes during current period 1,303 509
Balance at the end of current period 39,294 201,899
Japan Airport Terminal Co., Ltd. (9706) Financial Report for the Year Ended March 31, 2020 (FY2019)
- 15 -
(4) Consolidated Statements of Cash Flows
(Millions of yen)
FY2018
(from April 1, 2018
to March 31, 2019)
FY2019
(from April 1, 2019
to March 31, 2020)
Cash flows from operating activities
Income before income taxes and minority interests 43,027 8,609
Depreciation and amortization 24,737 27,901
Impairment loss 117 -
Gain on negative goodwill (20,126) -
Gain on offsetting assets and liabilities (5,626) -
Loss (gain) on step acquisition 2,725 -
Increase (decrease) in allowance for employees’ bonuses 51 (89)
Increase (decrease) in allowance for directors’ bonuses 19 (82)
Increase (decrease) in net defined benefit liabilities 113 83
Decrease (increase) in net defined benefit assets (101) (63)
Interest and dividends income (357) (390)
Interest expenses 3,102 2,901
Equity in losses (earnings) of affiliates (297) (462)
Loss on retirement of tangible fixed assets 395 668
Loss (gain) on sales of tangible fixed assets (6) (271)
Government subsidy (207) (99)
Decrease (increase) in accounts receivable – trade (503) 9,035
Decrease (increase) in inventories (1,085) (2,477)
Decrease (increase) in other current assets (2,378) (12,080)
Increase (decrease) in accounts payable - trade 68 (6,513)
Increase (decrease) in other current liabilities 2,681 3,394
Increase (decrease) in other fixed liabilities (56) 181
Others (260) 253
Subtotal 46,034 30,497
Interest and dividends received 350 387
Interest paid (3,439) (3,283)
Income and other taxes paid (8,657) (7,378)
Net cash provided by (used in) operating activities 34,288 20,222
Cash flows from investing activities
Payments into time deposits (27) -
Purchase of investment securities (792) (5,536)
Proceeds from purchase of investments in subsidiary
resulting in change in scope of consolidation
46,211 -
Purchase of tangible fixed assets (53,459) (49,895)
Proceeds from sales of tangible fixed assets 8 193
Purchase of intangible fixed assets (565) (1,781)
Purchase of long-term prepaid expenses (6) (1)
Payments of long-term loans receivable (2) -
Proceeds from government subsidy 207 99
Other payments (162) (482)
Other proceeds 96 67
Others 4 2
Net cash provided by (used in) investing activities (8,489) (57,334)

Japan Airport Terminal Co., Ltd. (9706) Financial Report for the Year Ended March 31, 2020 (FY2019)
- 16 -
(Millions of yen)
FY2018
(from April 1, 2018
to March 31, 2019)
FY2019
(from April 1, 2019
to March 31, 2020)
Cash flows from financing activities
Net increase (decrease) of short-term loans payable 300 -
Proceeds from long-term loans payable 40,110 11,850
Repayment of long-term loans payable (17,224) (11,060)
Proceeds from issuance of corporate bond - 39,789
Redemption of convertible bond - (15,000)
Repayments of lease obligations (180) (324)
Dividends paid by parent company (3,817) (3,574)
Dividends paid to non-controlling shareholders (33) (34)
Others (1) (1)
Net cash provided by (used in) financing activities 19,152 21,644
Effect of exchange rate change on cash and cash
equivalents
(8) (9)
Increase (decrease) in cash and cash equivalents 44,943 (15,477)
Cash and cash equivalents at the beginning of period 42,329 87,273
Cash and cash equivalents at the end of period 87,273 71,795

Japan Airport Terminal Co., Ltd. (9706) Financial Report for the Year Ended March 31, 2020 (FY2019)
- 17 -
(5) Notes on the Consolidated Financial Statements
(Notes on the Premise of a Going Concern)
There is nothing to report.
(Basic Important Conditions to Prepare Consolidated Financial Statements)
1. Scope of consolidation
1) Number of consolidated subsidiaries: 20 companies
Names of consolidated subsidiaries
Tokyo International Air Terminal Corp.
Tokyo Airport Restaurant Co., Ltd.
Japan Duty Free Fa-So-La Isetan Mitsukoshi Co., Ltd
Cosmo Enterprise Co., Ltd.
International Trade Inc.
Japan Airport Logitem Co., Ltd.
BIG WING Co., Ltd.
Japan Airport Techno Co., Ltd.
Air BIC Inc.
Haneda Airport Enterprise Co., Ltd.
Haneda Airport Security Co., Ltd.
Haneda Passenger Service Co., Ltd.
Japan Airport Ground Handling Co., Ltd.
Haneda Future Research Institute Inc.
Japan Airport Terminal Trading (Chengdu) Co., Ltd.
LANI KE AKUA PACIFIC, INC.
Sakura Co., Ltd.
Hamashin Co., Ltd.
CTT Co., Ltd.
Kaikan Development Co., Ltd.
2) Number of Non-consolidated subsidiaries: 2 companies
Names of Non-consolidated subsidiaries
Tsukizi Hamashin Co., Ltd.
Felix International LLC.
The two non-consolidated subsidiaries are excluded from the scope of consolidation since they are small in
size, and their total assets, operating revenues, net income/loss, and retained earnings do not have a significant
impact on the consolidated financial statements.
2. Application of equity method
1) Number of affiliated company that is accounted for using the equity method: 3 companies
Names of affiliated company that is accounted for using the equity method
Airport Transport Service Co., Ltd.
Japan Airport Delica Inc.
AGP Corporation
During the current fiscal year, the Company acquired shares of AGP Corporation which is now included in the
scope of application of equity method.
2) The non-consolidated subsidiaries and Seikousha Inc. and eight other affiliated companies are not included in the
scope of the application of equity method, since the aggregate amounts corresponding to the shares held by the
Company of those companies’ net income/loss and retained earnings do not have a significant impact on those
of consolidated financial statements.
3. Fiscal year of consolidated subsidiaries
Of consolidated subsidiaries, Japan Airport Terminal Trading (Chengdu) Co., Ltd. and LANI KE AKUA
PACIFIC, INC. end the fiscal year on December 31. Necessary adjustments arising from important transactions
during the period between its closing date and the consolidated closing date are made.

Japan Airport Terminal Co., Ltd. (9706) Financial Report for the Year Ended March 31, 2020 (FY2019)
- 18 -
4. Summary of significant accounting policies
1) Valuation standards and methods for important assets
(A) Securities
(i) Held-to-maturity securities are carried at cost.
(ii) Other securities
Other securities with fair values are stated at fair value based on the market value at the year-end, with
valuation differences included in net assets. Cost of securities sold is determined by the moving average
method.
Other securities without fair values are stated at cost based on moving average method.
(B) Derivatives
Derivative financial instruments are stated at fair value.
(C) Inventories
At the Company and major consolidated subsidiaries, inventories are principally stated at cost determined by
the retail method (book value of inventories in the balance sheet is written-down when their profitability
declines). Certain consolidated subsidiaries use last-purchase-price method (book value of inventories in the
balance sheet is written-down when their profitability declines).
2) Depreciation method of important depreciable assets
(A) Tangible fixed assets (excluding lease assets)
The Company uses the declining balance method. Consolidated subsidiaries principally use the straight-line
method.
(B) Intangible fixed assets (excluding lease assets)
Amortization of intangible fixed assets is calculated by the straight-line method. Software intended for internal
use is amortized by the straight-line method over its estimated useful life of 5 years.
(C) Lease assets
The straight-line method is adopted in which the lease term is treated as useful life and the asset is depreciated
to zero or residual value.
3) Accounting policies for important allowances
(A) Allowance for doubtful accounts
To prepare for losses from doubtful accounts, estimated uncollectible amounts are recorded, which are
computed either by using historical default rate for normal receivables or by considering individual
collectibility for particular receivables such as highly doubtful accounts.
(B) Allowance for employees’ bonuses
To prepare for the payment of bonuses to employees, the estimated amount is recorded as allowance.
(C) Allowance for directors’ bonuses
To prepare for the payment of bonuses to directors, the estimated amount is recorded as allowance.
(D) Allowance for directors’ retirement benefits
To provide for future payments of retirement benefits to directors, certain consolidated subsidiaries record the
amount that would be required at the end of the fiscal period in accordance with their internal rules.
4) Accounting method for employees' retirement benefits
(A) Allocation method of projected retirement benefits to each period
The benefit formula method is used to allocate the projected retirement benefits to each period up to the end of
the fiscal year.
(B) Amortization of actuarial gains and losses and prior service costs
Prior service costs are amortized under the straight-line method over a certain number of years within the
average remaining service years (5-10 years). Actuarial gains and losses are amortized, beginning in the year
following their occurrence, under the straight-line method over a certain number of years within the average
remaining service years (5-10 years).
(C) Adoption of simplified methods at small companies
Certain consolidated subsidiaries adopt a simplified method of using the amounts payable for voluntary
retirement of employees at fiscal year-end in calculating net defined benefit liabilities and expenses for

Japan Airport Terminal Co., Ltd. (9706) Financial Report for the Year Ended March 31, 2020 (FY2019)
- 19 -
retirement benefits.
5) Recognition of significant revenues and costs
Standards for recognition of revenues and costs of construction contracts (i) Construction of which the percentage of completion by the end of the fiscal year can be reliably estimated
The percentage-of-completion method is used to recognize revenues and costs. Percentage of completion is
calculated based on cost proportion method.
(ii) Other constructions
The completed-contract method is used to recognize revenues and costs.
6) Accounting standards for important hedging transactions
(A) Hedge accounting method
Hedging transactions are accounted for under deferred hedge accounting method. Interest rate swaps that meet
certain conditions are accounted for using special treatment.
(B) Hedging instrument and hedged item
Hedging instrument ----------- Interest rate swap
Hedged item -------------------- Floating rate borrowings
(C) Hedging policy
Hedging transactions are executed to avoid the risk of interest rate fluctuation, and our basic policy is that they
are not used for speculation purposes.
(D) Evaluation of hedging effectiveness
The effectiveness of hedging is evaluated by comparing the cumulative changes of hedging instruments and
corresponding changes in underlying hedged items. The evaluation is omitted regarding interest rate swaps
that meet the requirements for special treatment.
7) Scope of “Cash and cash equivalents” in consolidated statements of cash flows
“Cash and cash equivalents” in the consolidated statements of cash flows consist of cash on hand, deposits
with banks that are withdrawable on demand, and short-term investments which are easily convertible to cash
with insignificant risk of fluctuation in values whose maturity will come within three months.
8) Capitalization of borrowing costs
At certain consolidated subsidiaries, interest costs and related expenses on borrowings during construction
period of passenger terminals and other facilities are included in acquisition cost (¥217 million for FY 2019,
¥4,517 million for accumulated amount as of March 31, 2020) and recorded as tangible asset.
9) Other important matters regarding preparing consolidated financial statements
Consumption Taxes Consumption taxes are excluded from transaction amounts.
(Additional Information)
Accounting estimates with respect to the impact of the spread of COVID-19
To judge the recoverability of deferred tax assets, the Company is developing and evaluating scenarios based on
the information from external sources available at the time of preparation of the consolidated financial statements.
Certain assumptions have been made that the recovery in number of passengers which affect earnings and other
factors will take about two years for domestic flights and four years for international flights. Accounting
estimates based on such assumptions have been reflected to the accounting treatments.

Japan Airport Terminal Co., Ltd. (9706) Financial Report for the Year Ended March 31, 2020 (FY2019)
- 20 -
(Notes on Consolidated Balance Sheets)
1. Assets pledged as collateral and corresponding liabilities with collateral
The following are assets pledged as collateral.
(Millions of yen)
FY2018
(As of March 31, 2019)
FY2019
(As of March 31, 2020)
Cash and deposits 54,379 45,997
Accounts receivable 47 35
Buildings and structures 184,937 256,065
Machinery, equipment and vehicles 1,576 11,276
Land 53 53
Investment Securities (Note) - 3,661
Other investments 1,000 1,000
Total 241,994 318,089
(Note) Pledged as collateral for borrowings by affiliated companies
The followings are liabilities for which assets are pledged as collateral.
(Millions of yen)
FY2018
(As of March 31, 2019)
FY2019
(As of March 31, 2020)
Short-term loans payable 1,700 850
Long-term loans payable 98,277 94,057
Total 99,977 94,907
2. The following item is related to non-consolidated subsidiaries and affiliated companies.
(Millions of yen)
FY2018
(As of March 31, 2019)
FY2019
(As of March 31, 2020)
Investment securities (shares) 1,942 7,023
3. Liabilities guaranteed
The Company provides a guarantee to the following group companies for its borrowing from financial institutions.
(1) Debt guarantee
(Millions of yen)
FY2018
(As of March 31, 2019)
FY2019
(As of March 31, 2020)
Japan Airport Delica Inc. 548 million yen 225
Japan Airport Delica Inc.
548 million yen 225
(2) Commitment to guarantee
(Millions of yen)
FY2018
(As of March 31, 2019)
FY2019
(As of March 31, 2020)
Haneda Future Tokutei Mokuteki
Kaisha -
Haneda Future Tokutei Mokuteki
Kaisha 548 million yen 666
4. Amount of reduction entry
Due to receipt of government subsidy, etc. for the acquisition of assets, reduction entry of the following amount is
deducted from the acquisition costs of tangible fixed assets.
(Millions of yen)
FY2018
(As of March 31, 2019)
FY2019
(As of March 31, 2020)
Buildings and structures 88 132

Japan Airport Terminal Co., Ltd. (9706) Financial Report for the Year Ended March 31, 2020 (FY2019)
- 21 -
(Notes on Consolidated Statements of Income)
1. Gains on sale of fixed assets
(Millions of yen)
FY2018
(from April 1, 2018 to
March 31, 2019)
FY2019
(from April 1, 2019 to
March 31, 2020)
Land - 142
Buildings - 128
Total - 271
2. Impairment loss
The JAT Group recognized impairment loss on the assets as follows:
FY2018 (from April 1, 2018 to March 31, 2019)
Location Use Type Impairment loss
Ota-ku, Tokyo Incinerator Construction in progress 117 million yen
The JAT Group classifies assets into groups primarily according to business locations.
By examining impairment for fixed assets based on the groupings, since the plan to construct incinerator was
cancelled by the consolidated subsidiary, the carrying amount was reduced to the recoverable value and the reduced
amount was recognized as impairment loss of ¥117 million in extraordinary loss. Recoverable value was measured
as zero based on its value in use.
FY2019 (from April 1, 2019 to March 31, 2020)
There is nothing to report.
3. Loss on retirement of fixed assets
(Millions of yen)
FY2018
(from April 1, 2018
to March 31, 2019)
FY2019
(from April 1, 2019
to March 31, 2020)
Buildings and structures 273 423
Machinery, equipment and vehicles 0 -
Furniture and fixtures 41 4
Software - 0
Total 315 429

Japan Airport Terminal Co., Ltd. (9706) Financial Report for the Year Ended March 31, 2020 (FY2019)
- 22 -
(Notes on Consolidated Statements of Cash Flows)
Relationship between the closing balance of cash and cash equivalents and the value of items listed on the consolidated
balance sheets
(Millions of yen)
FY2018
(from April 1, 2018
to March 31, 2019)
FY2019
(from April 1, 2019
to March 31, 2020)
Cash and deposits 87,458 71,958
Time deposits with a maturity greater than 3 months (185) (162)
Cash and cash equivalents 87,273 71,795
Breakdown of assets and liabilities of the company that newly became a subsidiary through acquisition of shares
FY2018 (from April 1, 2018 to March 31, 2019)
Breakdown of assets and liabilities of TIAT at the start of consolidation which is newly consolidated after
acquisition of shares, and the relationship between the purchase price of share of TIAT and proceeds (net) from the
purchase of investment of TIAT are shown as below.
(Millions of yen)
Current assets 54,374
Fixed assets 180,137
Current liabilities (17,261)
Fixed liabilities (159,785)
Non-controlling interests (32,338)
Gain on negative goodwill (20,126)
Amount of investment received through third party allotment of shares 8,530
Subtotal 13,530
Consolidated book value up to the time of acquisition of control (9,705)
Loss of step acquisition 2,725
Purchase price of additional shares 6,550
Cash and cash equivalents (52,761)
Balance: Proceeds from purchase of investment 46,211

Japan Airport Terminal Co., Ltd. (9706) Financial Report for the Year Ended March 31, 2020 (FY2019)
- 23 -
(Segment Information)
Segment Information
1. Overview of reportable segments
The reportable segments of the Group are units for which separate financial information is available and whose
operating results are regularly reviewed by the Board of Directors in order to decide how to allocate management
resources and evaluate their performances.
The Company is primarily engaged in the management of passenger terminal buildings and the provision of
services to users at Haneda Airport. Business divisions at the Company’s headquarters develop comprehensive
business strategies and pursue business activities.
The Company is, therefore, composed of business segments with different services based on the business
divisions. Its three reportable segments are the facilities management operations, merchandise sales operations, and
food and beverage operations.
The segment of facilities management operations leases, maintains and repairs, and operates passenger terminal
facilities at Haneda Airport. It also provides services for passengers. The segment of merchandise sales operations is
engaged in retail sales of products to passengers and others, wholesales of products to companies operating airport
terminals and others, and other activities incidental to these two sales operations. The segment of food and beverage
operations provides food and beverage services to parties including users of Haneda Airport and Narita International
Airport. It is also engaged in the production and sales of in-flight meals and other incidental activities.
2. Method of calculations of sales, income (loss), assets, liabilities, and other items by reportable segments
Accounting methods for reportable business segments are, in general, the same as those described in “Basic
Important Conditions to Prepare the Consolidated Financial Statements.”
Segment income is based on operating income. Intersegment sales and transfers are based on prevailing market
price.
3. Sales, income (loss), assets, liabilities, and other items by reportable segments
FY2018 (from April 1, 2018 to March 31, 2019)
(Millions of yen)
Reportable segments Adjustments
(Notes 1)
Consolidated
financial
statements
(Notes 2) Facilities
Management
Merchandise
Sales
Food and
Beverage Total
Operating revenues
Sales to external
customers 82,050 171,472 20,095 273,618 - 273,618
Intersegment sales
and transfers 5,533 1,523 2,518 9,574 (9,574) -
Total 87,584 172,996 22,613 283,193 (9,574) 273,618
Segment income 14,339 15,760 880 30,979 (8,497) 22,481
Segment assets 331,815 83,010 17,634 432,461 88,902 521,363
Other items
Depreciation and
amortization 21,974 1,609 558 24,142 594 24,737
Increase in tangible fixed
assets and intangible fixed assets
54,467 2,944 231 57,643 479 58,123
(Notes) 1. Details of adjustments are as follows:
(1) Adjustments to the segment income include ¥8,506 million of administration expenses for the parent company’s
administration and other divisions at head office and certain subsidiaries which are not allocated to each of the reportable
segments.
(2) Adjustments to the segment assets include ¥134,993 million of corporate assets which are not allocated to each of the
reportable segments, which includes excess funds managed by the parent company, long-term investment (investment
securities), assets related to administration divisions, special purpose funds of certain subsidiaries and other assets.
(3) Adjustments to depreciation and amortization include ¥599 million of depreciation with respect to parent company’s
administration divisions and other divisions at head office and certain subsidiaries which are not allocated to each of the
reportable segments.
(4) Adjustments to increase in tangible fixed assets and intangible fixed assets (¥479 million) are primarily due to acquisition
of a company dormitory for employees of parent company’s head office.

Japan Airport Terminal Co., Ltd. (9706) Financial Report for the Year Ended March 31, 2020 (FY2019)
- 24 -
2. Segment income is adjusted with operating income recorded in the Consolidated Statements of Income.
FY2019 (from April 1, 2019 to March 31, 2020)
(Millions of yen)
Reportable segments Adjustments
(Notes 1)
Consolidated
financial
statements
(Notes 2) Facilities
Management
Merchandise
Sales
Food and
Beverage Total
Operating revenues
Sales to external
customers 82,942 147,893 18,920 249,756 - 249,756
Intersegment sales
and transfers 5,697 1,378 2,641 9,717 (9,717) -
Total 88,640 149,272 21,561 259,473 (9,717) 249,756
Segment income 6,932 10,823 451 18,207 (8,315) 9,892
Segment assets 360,509 53,734 17,634 431,879 89,484 521,363
Other items
Depreciation and
amortization 24,445 2,335 577 27,357 543 27,901
Increase in tangible fixed assets and intangible fixed assets
55,358 11,941 1,089 68,389 2,392 70,782
(Notes) 1. Details of adjustments are as follows:
(1) Adjustments to the segment income include ¥8,321 million of administration expenses for the parent company’s
administration and other divisions at head office and certain subsidiaries which are not allocated to each of the reportable
segments.
(2) Adjustments to the segment assets include ¥144,458 million of corporate assets which are not allocated to each of the
reportable segments, which includes excess funds managed by the parent company, long-term investment (investment
securities), assets related to administration divisions, special-purpose funds of certain subsidiaries and other assets.
(3) Adjustments to depreciation and amortization include ¥549 million of depreciation with respect to the parent company’s
administration and other divisions at head office and certain subsidiaries which are not allocated to each of the reportable
segments.
(4) Adjustments to increase in tangible fixed assets and intangible fixed assets (¥2,392 million) are primarily due to
acquisition of a company dormitory for employees of parent company’s head office.
2. Segment income is adjusted with operating income recorded in the Consolidated Statements of Income.
Related Information
FY2018 (from April 1, 2018 to March 31, 2019)
1. Information by product and service
Sales to external customers by product and service is equivalent to the amount described in segment
information, thus the information is omitted.
2. Information by area
(1) Operating revenues
Operating revenues in Japan account for more than 90% of the operating revenues recorded in the
Consolidated Statements of Income, thus the information is omitted.
(2) Tangible fixed assets
Tangible fixed assets in Japan account for more than 90% of the tangible fixed assets recorded in the
Consolidated Balance Sheet, thus the information is omitted.
3. Information by major customer
Not applicable
FY2019 (from April 1, 2019 to March 31, 2020)
1. Information by product and service
Sales to external customers by product and service is equivalent to the amount described in segment
information, thus the information is omitted.

Japan Airport Terminal Co., Ltd. (9706) Financial Report for the Year Ended March 31, 2020 (FY2019)
- 25 -
2. Information by area
(1) Operating revenues
Operating revenues in Japan account for more than 90% of the operating revenues recorded in the
Consolidated Statements of Income, thus the information is omitted.
(2) Tangible fixed assets
Tangible fixed assets in Japan account for more than 90% of the tangible fixed assets recorded in the
Consolidated Balance Sheet, thus the information is omitted.
3. Information by major customer
Not applicable
Information on impairment loss of fixed assets by reportable segment FY2018 (from April 1, 2018 to March 31, 2019)
(Millions of yen)
Facilities
Management
Merchandise
Sales
Food and
Beverage
Corporation /
Elimination Total
Impairment Loss 117 - - - 117
FY2019 (from April 1, 2019 to March 31, 2020)
Not applicable
Information on amortized amount and unamortized balance of goodwill by reportable segment FY2018 (from April 1, 2018 to March 31, 2019)
Not applicable
FY2019 (from April 1, 2019 to March 31, 2020)
Not applicable
Information on gain on negative goodwill by reportable segment FY2018 (from April 1, 2018 to March 31, 2019)
The Company completed the acquisition of shares in TIAT, which changed TIAT’s status for our consolidated
accounting to a consolidated subsidiary. Though ¥20,126 million was recorded as gain on negative goodwill as
a result of the acquisition, the amount is not allocated to reportable segment.
FY2019 (from April 1, 2019 to March 31, 2020)
Not applicable
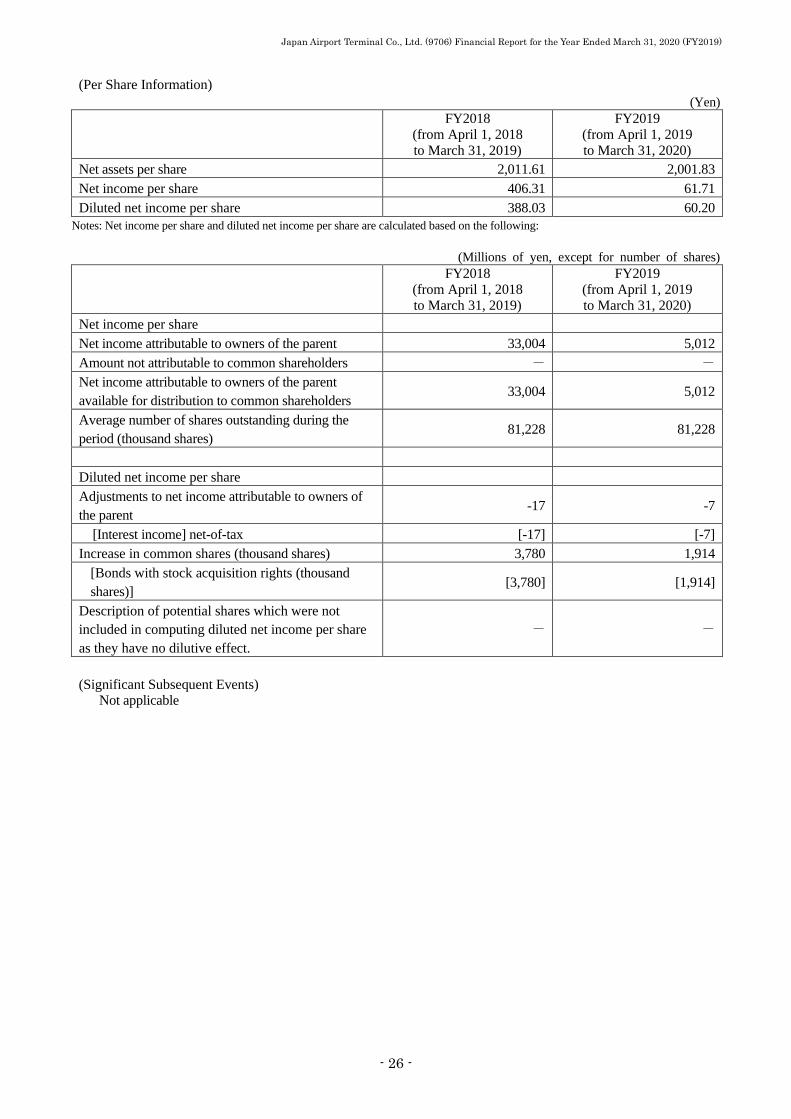
Japan Airport Terminal Co., Ltd. (9706) Financial Report for the Year Ended March 31, 2020 (FY2019)
- 26 -
(Per Share Information)
(Yen)
FY2018
(from April 1, 2018
to March 31, 2019)
FY2019
(from April 1, 2019
to March 31, 2020)
Net assets per share 2,011.61 2,001.83
Net income per share 406.31 61.71
Diluted net income per share 388.03 60.20
Notes: Net income per share and diluted net income per share are calculated based on the following:
(Millions of yen, except for number of shares)
FY2018
(from April 1, 2018
to March 31, 2019)
FY2019
(from April 1, 2019
to March 31, 2020)
Net income per share
Net income attributable to owners of the parent 33,004 5,012
Amount not attributable to common shareholders - -
Net income attributable to owners of the parent
available for distribution to common shareholders 33,004 5,012
Average number of shares outstanding during the
period (thousand shares) 81,228 81,228
Diluted net income per share
Adjustments to net income attributable to owners of
the parent -17 -7
[Interest income] net-of-tax [-17] [-7]
Increase in common shares (thousand shares) 3,780 1,914
[Bonds with stock acquisition rights (thousand
shares)] [3,780] [1,914]
Description of potential shares which were not
included in computing diluted net income per share
as they have no dilutive effect.
- -
(Significant Subsequent Events) Not applicable

Japan Airport Terminal Co., Ltd. (9706) Financial Report for the Year Ended March 31, 2020 (FY2019)
- 27 -
4. Others Production, orders received and sales
As for production and other results, the JAT Group finds it difficult to present production and orders received for
each segment.
Therefore, regarding the status of production, orders received, and sales, please see “1. Analysis of Business and
Financial Results” in relation to the financial results for each segment.
Operating revenues the current fiscal year were as follows:
(Millions of Yen) FY2018
(from April 1, 2018
to March 31, 2019)
FY2019
(from April 1, 2019
to March 31, 2020)
Facilities Management 82,050 82,942
Rent revenue 17,454 18,259
Facility user charges revenue 43,505 41,019
Other revenues 21,090 23,662
Merchandise Sales 171,472 147,893
Sales at domestic terminal shops 36,212 33,148
Sales at international terminal shops 98,515 84,420
Other sales 36,745 30,323
Food and Beverage 20,095 18,920
Sales from food and beverage operations 12,514 11,514
Sales from in-flight meals 6,764 6,543
Other sales 816 863
Total 273,618 249,756
Notes
1) The amounts above do not include consumption taxes.
2) Data on leasing regarding rental revenue in Facilities Management is summarized as follows:
(㎡) FY2018
(from April 1, 2018
to March 31, 2019)
FY2019
(from April 1, 2019
to March 31, 2020)
Total floor space owned by the JAT Group 874,602 953,957
Total leasable floor space 274,206 308,951
Total leased floor space 268,740 304,359
Airlines 149,545 158,917
General tenants 63,381 63,152
Used by the JAT Group 55,814 82,289
For part of the area of Terminal 2 which commenced operation in March 2020, measurement of the area has not been completed yet, so
the figure is an estimate subject to possible change in the future.


![SBI Holdings, Inc.SBI Holdings, Inc. April 28, 2020 FY2019 Financial Results (Fiscal Year Ended March 31, 2020) [Unauthorized reproduction is prohibited] 1 Note: Fiscal Year (“FY”)](https://static.fdocuments.in/doc/165x107/5f0261167e708231d403fb8b/sbi-holdings-inc-sbi-holdings-inc-april-28-2020-fy2019-financial-results-fiscal.jpg)


