Financial Report and Audited Consolidated Financial ... · Tuesday, February 25, 2014 Financial...
140
Financial Report and Audited Consolidated Financial Statements for the Year Ended December 31, 2013 February 25, 2014
Transcript of Financial Report and Audited Consolidated Financial ... · Tuesday, February 25, 2014 Financial...
Financial Report and Audited Consolidated Financial Statements for the Year Ended December 31, 2013
February 25, 2014

Tuesday, February 25, 2014
Financial Report and Audited Consolidated Financial Statements for the Year Ended December 31, 2013 Vivendi /2
VIVENDI
Société anonyme with a Management Board and a Supervisory Board with a share capital of €7,367,854,620.50
Head Office: 42 avenue de Friedland – 75380 PARIS CEDEX 08 – FRANCE
IMPORTANT NOTICE: READERS ARE STRONGLY ADVISED TO READ THE IMPORTANT DISCLAIMERS AT THE END OF THIS FINANCIAL REPORT.

Tuesday, February 25, 2014
Financial Report and Audited Consolidated Financial Statements for the Year Ended December 31, 2013 Vivendi /3
SELECTED KEY CONSOLIDATED FINANCIAL DATA ........................................................................................................................................ 5
I – 2013 FINANCIAL REPORT................................................................................................................................................................................... 7
1 SIGNIFICANT EVENTS ........................................................................................................................................................................... 7
1.1 SIGNIFICANT EVENTS IN 2013 ......................................................................................................................................................................... 7 1.2 SIGNIFICANT EVENTS SINCE DECEMBER 31, 2013 ............................................................................................................................................ 10
2 EARNINGS ANALYSIS ......................................................................................................................................................................... 11
2.1 CONSOLIDATED STATEMENT OF EARNINGS AND ADJUSTED STATEMENT OF EARNINGS ......................................................................................... 11 2.2 EARNINGS REVIEW ....................................................................................................................................................................................... 12
3 CASH FLOW FROM OPERATIONS ANALYSIS ................................................................................................................................. 14
4 BUSINESS SEGMENT PERFORMANCE ANALYSIS........................................................................................................................ 16
4.1 REVENUES, EBITA, AND CASH FLOW FROM OPERATIONS BY BUSINESS SEGMENT ................................................................................................. 17 4.2 COMMENTS ON THE OPERATING PERFORMANCE OF BUSINESS SEGMENTS ............................................................................................................ 18
5 TREASURY AND CAPITAL RESOURCES ........................................................................................................................................... 27
5.1 SUMMARY OF VIVENDI’S EXPOSURE TO CREDIT AND LIQUIDITY RISKS ................................................................................................................... 27 5.2 FINANCIAL NET DEBT CHANGES ..................................................................................................................................................................... 29 5.3 ANALYSIS OF FINANCIAL NET DEBT CHANGES.................................................................................................................................................. 30 5.4 CHANGES IN FINANCINGS ............................................................................................................................................................................. 31
6 FORWARD LOOKING STATEMENTS ................................................................................................................................................. 32
7 OTHER DISCLAIMERS ......................................................................................................................................................................... 32
II - APPENDICES TO THE FINANCIAL REPORT: UNAUDITED SUPPLEMENTARY FINANCIAL DATA ................................................... 33
1. EBITA (ADJUSTED EARNINGS BEFORE INTEREST AND INCOME TAXES) AND ADJUSTED NET INCOME ......................................... 33
2. REVENUES AND EBITA BY BUSINESS SEGMENT - 2013 AND 2012 QUARTERLY DATA ..................................................................... 35
Tuesday, February 25, 2014
Financial Report and Audited Consolidated Financial Statements for the Year Ended December 31, 2013 Vivendi /4
III - CONSOLIDATED FINANCIAL STATEMENTS FOR THE YEAR ENDED DECEMBER 31, 2013 ............................................................ 38
STATUTORY AUDITORS’ REPORT ON THE CONSOLIDATED FINANCIAL STATEMENTS ...................................................................... 38
CONSOLIDATED STATEMENT OF EARNINGS................................................................................................................................................ 40
CONSOLIDATED STATEMENT OF COMPREHENSIVE INCOME .................................................................................................................. 41
CONSOLIDATED STATEMENT OF FINANCIAL POSITION ............................................................................................................................ 42
CONSOLIDATED STATEMENT OF CASH FLOWS ........................................................................................................................................... 43
CONSOLIDATED STATEMENTS OF CHANGES IN EQUITY........................................................................................................................... 44
NOTES TO THE CONSOLIDATED FINANCIAL STATEMENTS ...................................................................................................................... 46
NOTE 1 ACCOUNTING POLICIES AND VALUATION METHODS ................................................................................................................... 46
NOTE 2 MAJOR CHANGES IN THE SCOPE OF CONSOLIDATION ................................................................................................................ 63
NOTE 3 SEGMENT DATA .............................................................................................................................................................................. 66
NOTE 4 EBIT ................................................................................................................................................................................................... 70
NOTE 5 FINANCIAL CHARGES AND INCOME .............................................................................................................................................. 72
NOTE 6 INCOME TAXES ................................................................................................................................................................................ 73
NOTE 7 DISCONTINUED OPERATIONS ......................................................................................................................................................... 77
NOTE 8 EARNINGS PER SHARE .................................................................................................................................................................... 81
NOTE 9 CHARGES AND INCOME DIRECTLY RECOGNIZED IN EQUITY ........................................................................................................ 82
NOTE 10 GOODWILL ........................................................................................................................................................................................ 83
NOTE 11 CONTENT ASSETS AND COMMITMENTS ...................................................................................................................................... 87
NOTE 12 OTHER INTANGIBLE ASSETS ........................................................................................................................................................... 89
NOTE 13 PROPERTY, PLANT AND EQUIPMENT .............................................................................................................................................. 90
NOTE 14 INTANGIBLE AND TANGIBLE ASSETS OF TELECOM OPERATIONS ............................................................................................... 91
NOTE 15 INVESTMENTS IN EQUITY AFFILIATES............................................................................................................................................ 92
NOTE 16 FINANCIAL ASSETS ......................................................................................................................................................................... 93
NOTE 17 NET WORKING CAPITAL .................................................................................................................................................................. 93
NOTE 18 CASH AND CASH EQUIVALENTS..................................................................................................................................................... 94
NOTE 19 EQUITY .............................................................................................................................................................................................. 95
NOTE 20 PROVISIONS ..................................................................................................................................................................................... 96
NOTE 21 EMPLOYEE BENEFITS ....................................................................................................................................................................... 97
NOTE 22 SHARE-BASED COMPENSATION PLANS ...................................................................................................................................... 102
NOTE 23 BORROWINGS AND OTHER FINANCIAL LIABILITIES .................................................................................................................... 106
NOTE 24 FINANCIAL INSTRUMENTS AND MANAGEMENT OF FINANCIAL RISKS .................................................................................... 110
NOTE 25 CONSOLIDATED CASH FLOW STATEMENT .................................................................................................................................. 118
NOTE 26 TRANSACTIONS WITH RELATED PARTIES.................................................................................................................................... 119
NOTE 27 CONTRACTUAL OBLIGATIONS AND OTHER COMMITMENTS ..................................................................................................... 120
NOTE 28 LITIGATION ..................................................................................................................................................................................... 126
NOTE 29 MAJOR CONSOLIDATED ENTITIES OR ENTITIES ACCOUNTED UNDER EQUITY METHOD ......................................................... 134
NOTE 30 STATUTORY AUDITORS FEES ........................................................................................................................................................ 135
NOTE 31 AUDIT EXEMPTIONS FOR UMG SUBSIDIARIES IN THE UNITED KINGDOM ................................................................................ 136
NOTE 32 SUBSEQUENT EVENTS ................................................................................................................................................................... 137
NOTE 33 ADJUSTMENT OF COMPARATIVE INFORMATION ....................................................................................................................... 137
Tuesday, February 25, 2014
Financial Report and Audited Consolidated Financial Statements for the Year Ended December 31, 2013 Vivendi /5
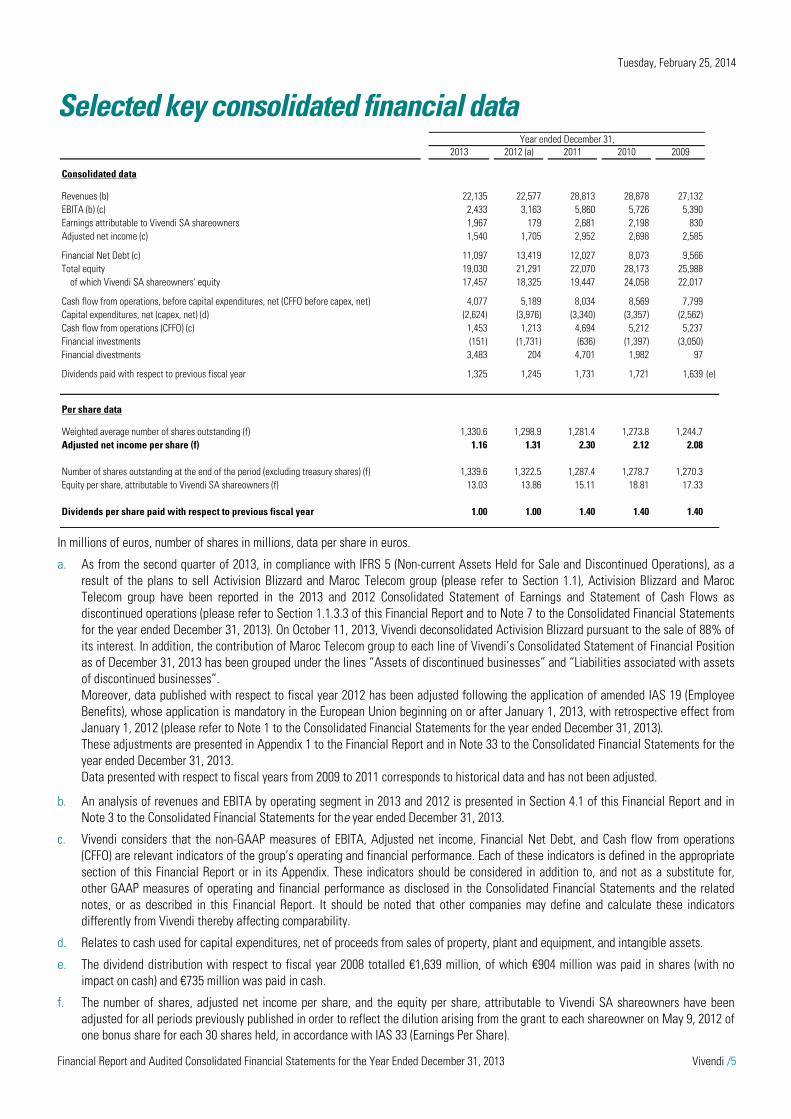
Selected key consolidated financial data
In millions of euros, number of shares in millions, data per share in euros.
a. As from the second quarter of 2013, in compliance with IFRS 5 (Non-current Assets Held for Sale and Discontinued Operations), as a result of the plans to sell Activision Blizzard and Maroc Telecom group (please refer to Section 1.1), Activision Blizzard and Maroc Telecom group have been reported in the 2013 and 2012 Consolidated Statement of Earnings and Statement of Cash Flows as discontinued operations (please refer to Section 1.1.3.3 of this Financial Report and to Note 7 to the Consolidated Financial Statements for the year ended December 31, 2013). On October 11, 2013, Vivendi deconsolidated Activision Blizzard pursuant to the sale of 88% of its interest. In addition, the contribution of Maroc Telecom group to each line of Vivendi’s Consolidated Statement of Financial Position as of December 31, 2013 has been grouped under the lines “Assets of discontinued businesses” and “Liabilities associated with assets of discontinued businesses”. Moreover, data published with respect to fiscal year 2012 has been adjusted following the application of amended IAS 19 (Employee Benefits), whose application is mandatory in the European Union beginning on or after January 1, 2013, with retrospective effect from January 1, 2012 (please refer to Note 1 to the Consolidated Financial Statements for the year ended December 31, 2013). These adjustments are presented in Appendix 1 to the Financial Report and in Note 33 to the Consolidated Financial Statements for the year ended December 31, 2013. Data presented with respect to fiscal years from 2009 to 2011 corresponds to historical data and has not been adjusted.
b. An analysis of revenues and EBITA by operating segment in 2013 and 2012 is presented in Section 4.1 of this Financial Report and in Note 3 to the Consolidated Financial Statements for the year ended December 31, 2013.
c. Vivendi considers that the non-GAAP measures of EBITA, Adjusted net income, Financial Net Debt, and Cash flow from operations (CFFO) are relevant indicators of the group’s operating and financial performance. Each of these indicators is defined in the appropriate section of this Financial Report or in its Appendix. These indicators should be considered in addition to, and not as a substitute for, other GAAP measures of operating and financial performance as disclosed in the Consolidated Financial Statements and the related notes, or as described in this Financial Report. It should be noted that other companies may define and calculate these indicators differently from Vivendi thereby affecting comparability.
d. Relates to cash used for capital expenditures, net of proceeds from sales of property, plant and equipment, and intangible assets.
e. The dividend distribution with respect to fiscal year 2008 totalled €1,639 million, of which €904 million was paid in shares (with no impact on cash) and €735 million was paid in cash.
f. The number of shares, adjusted net income per share, and the equity per share, attributable to Vivendi SA shareowners have been adjusted for all periods previously published in order to reflect the dilution arising from the grant to each shareowner on May 9, 2012 of one bonus share for each 30 shares held, in accordance with IAS 33 (Earnings Per Share).
Year ended December 31,2013 2012 (a) 2011 2010 2009
Consolidated data
Revenues (b) 22,135 22,577 28,813 28,878 27,132EBITA (b) (c) 2,433 3,163 5,860 5,726 5,390Earnings attributable to Vivendi SA shareowners 1,967 179 2,681 2,198 830Adjusted net income (c) 1,540 1,705 2,952 2,698 2,585
Financial Net Debt (c) 11,097 13,419 12,027 8,073 9,566Total equity 19,030 21,291 22,070 28,173 25,988
of which Vivendi SA shareowners' equity 17,457 18,325 19,447 24,058 22,017
Cash flow from operations, before capital expenditures, net (CFFO before capex, net) 4,077 5,189 8,034 8,569 7,799Capital expenditures, net (capex, net) (d) (2,624) (3,976) (3,340) (3,357) (2,562)Cash flow from operations (CFFO) (c) 1,453 1,213 4,694 5,212 5,237Financial investments (151) (1,731) (636) (1,397) (3,050)Financial divestments 3,483 204 4,701 1,982 97
Dividends paid with respect to previous fiscal year 1,325 1,245 1,731 1,721 1,639 (e)
Per share data
Weighted average number of shares outstanding (f) 1,330.6 1,298.9 1,281.4 1,273.8 1,244.7Adjusted net income per share (f) 1.16 1.31 2.30 2.12 2.08
Number of shares outstanding at the end of the period (excluding treasury shares) (f) 1,339.6 1,322.5 1,287.4 1,278.7 1,270.3Equity per share, attributable to Vivendi SA shareowners (f) 13.03 13.86 15.11 18.81 17.33
Dividends per share paid with respect to previous fiscal year 1.00 1.00 1.40 1.40 1.40
Tuesday, February 25, 2014
Financial Report and Audited Consolidated Financial Statements for the Year Ended December 31, 2013 Vivendi /6
Nota:
In accordance with European Commission Regulation (EC) 809/2004 (Article 28) which sets out the disclosure obligations for issuers of securities listed on a regulated market within the European Union (implementing Directive 2003/71/EC, the “Prospectus Regulation”), the following items are incorporated by reference:
2012 Financial Report and the Consolidated Financial Statements for the year ended December 31, 2012, prepared under IFRS and the related Statutory Auditors’ Report presented in pages 168 to 319 of the “Document de Référence” No. D.13-0170, filed on March 18, 2013 with the French Autorité des Marchés Financiers (AMF), and in pages 168 to 319 of the English translation of this “Document de Référence”; and
2011 Financial Report and the Consolidated Financial Statements for the year ended December 31, 2011, prepared under IFRS and the related Statutory Auditors’ Report presented in pages 130 to 266 of the “Document de Référence” No. D.12-0175, filed on March 19, 2012 with the French Autorité des Marchés Financiers (AMF), and in pages 128 to 264 of the English translation of this “Document de Référence”.

Tuesday, February 25, 2014
Financial Report and Audited Consolidated Financial Statements for the Year Ended December 31, 2013 Vivendi /7
I – 2013 Financial Report Preliminary comments:
On February 19, 2014, during a meeting held at the headquarters of the company, the Management Board approved the Annual Financial Report and the Consolidated Financial Statements for the year ended December 31, 2013. Having considered the Audit Committee’s recommendation given at its meeting held on February 18, 2014, the Supervisory Board, at its meeting held on February 21, 2014, reviewed the Annual Financial Report and the Consolidated Financial Statements for the year ended December 31, 2013, as approved by the Management Board on February 19, 2014.
The Consolidated Financial Statements for the year ended December 31, 2013 have been audited and certified by the Statutory Auditors with no qualified opinion. The Statutory Auditors’ Report on the Consolidated Financial Statements is included in the preamble to the Financial Statements.
1 Significant events
1.1 Significant events in 2013
1.1.1 Ongoing strategic review
As publicly announced to shareholders on several occasions in 2012 and 2013, Vivendi’s Management Board and Supervisory Board are carrying out a review of the group’s strategic development. In 2013, Vivendi sold most of its interest in Activision Blizzard and entered into a definitive agreement with Etisalat to sell its interest in Maroc Telecom. The group has decided to focus on its media and content activities, which hold leading positions and are taking advantage of the growing digital market. It has strengthened its presence in Canal+ France, now fully owned. Vivendi is also reshaping SFR. The operator has begun to benefit from its transformation plan, by re-taking the commercial lead and by reducing costs. SFR has also entered into an agreement to share part of its mobile network with Bouygues Telecom, allowing it to offer better coverage and strengthened service quality to its customers. Based on this, the group aims to position the future Vivendi as a dynamic player in media and content. With SFR, it intends to participate in the reorganization of the telecommunication sector in France, exploring actively all potential opportunities.
During the second half of 2013, the group reached important strategic milestones:
on October 11, 2013, Vivendi completed the sale of 88% of its interest in Activision Blizzard for $8.2 billion (or €6 billion), in cash. In addition, Vivendi retained 83 million Activision Blizzard shares, representing 11.9% of Activision Blizzard’s outstanding share capital, which are subject to a staggered 15-month lock-up period;
on November 4, 2013, Vivendi entered into a definitive agreement with Etisalat for the sale of Vivendi’s 53% interest in Maroc Telecom group for €4.2 billion in cash, including a €310 million dividend distribution with respect to fiscal year 2012, according to the financial terms known to date. Completion of this transaction is contingent upon the satisfaction of certain closing conditions, including receipt of required regulatory approvals in Morocco and the countries in which Maroc Telecom group operates, as well as finalization of the shareholders’ agreement between Etisalat and the Kingdom of Morocco. This transaction is expected to be completed during the first months of 2014; and
on November 5, 2013, Vivendi acquired Lagardère Group’s 20% interest in Canal+ France for €1,020 million in cash.
As a result of the sale of Activision Blizzard, Vivendi has begun to significantly reduce its debt during the fourth quarter of 2013 by implementing a US dollar and euro bond repurchase program in an aggregate amount of €3 billion; thus gaining greater financial flexibility (please refer to Section 5).
1.1.2 Planned demerger of the group
On November 26, 2013, Vivendi’s Supervisory Board approved the group’s planned demerger to form two separate companies: (i) a new international media group based in France, with very strong positions in music (as the worldwide leader), in European cinema, in pay-TV in France, Africa, Vietnam, and Poland, and in the Internet and associated services in Brazil, and (ii) SFR. The decision to implement this project could be taken in the near future and, if appropriate, submitted to the General Shareholders' Meeting for approval on June 24, 2014.
Vivendi considers that the conditions for the application of IFRS 5 to the proposed demerger in the 2013 Financial Statements are not met.

Tuesday, February 25, 2014
Financial Report and Audited Consolidated Financial Statements for the Year Ended December 31, 2013 Vivendi /8
1.1.3 Sales of Activision Blizzard and Maroc Telecom group
1.1.3.1 Activision Blizzard
On October 11, 2013, Vivendi completed the sale of 88% of its interest in Activision Blizzard, or 600.64 million shares priced at $13.60 per share, for $8,169 million (€6,044 million) in cash.
The key terms of this sale are as follows: through the acquisition of a Vivendi subsidiary, Activision Blizzard repurchased 428.68 million shares at $13.60 per share for a cash
consideration of $5,830 million; concomitantly, Vivendi sold 171.97 million Activision Blizzard shares at $13.60 per share for a cash consideration of $2,339 million
to an investor group (ASAC II LP) led by Mr. Robert Kotick, Activision Blizzard’s Chief Executive Officer, and Mr. Brian Kelly, the Chairman of the Board of Directors. ASAC II LP owns approximately 24.7% of the outstanding share capital (following the repurchase of 428.68 million shares by Activision Blizzard);
pursuant to the simultaneous closings of both sales on October 11, 2013, Vivendi retained 83 million Activision Blizzard shares, representing 11.9% of Activision Blizzard’s outstanding share capital (following the repurchase of 428.68 million shares by Activision Blizzard). Vivendi’s remaining ownership interest is subject to a staggered 15-month lock-up period as described in Note 7 to the Consolidated Financial Statements for the year ended December 31, 2013. The sale proceeds from the remaining ownership interest are estimated at a total of $1,129 million (€832 million), assuming the hypothesis of $13.60 per share and at $1,480 million (€1,078 million), assuming the hypothesis of Activision Blizzard’s share price on December 31, 2013 of $17.83 per share; and
the agreement governing the transaction includes certain continuing commitments given by the parties (please refer to Note 7 to the Consolidated Financial Statements for the year ended December 31, 2013).
Deconsolidation of Activision Blizzard as from October 11, 2013
As from October 11, 2013, as a result of the sale of 600.64 million shares of, or a 53.46% interest in Activision Blizzard, Vivendi lost control of and deconsolidated Activision Blizzard. In the Consolidated Financial Statements for the year ended December 31, 2013, the remaining 83 million Activision Blizzard shares have been recorded as assets held for sale, subject to the staggered lock-up period.
Capital gain on divestiture
From an accounting perspective and in accordance with IFRS, Vivendi is considered to have sold 100% of its interest in Activision Blizzard following the loss of control of this subsidiary. The gain on sale has been determined as the difference between the value of 100% of the Activision Blizzard shares owned by Vivendi at a price of $13.60 per share (less costs to sell) (€6,851 million) and the value of Activision Blizzard’s net assets attributable to Vivendi SA shareowners, as recorded in Vivendi’s Consolidated Financial Statements at the date of the loss of control (€4,491 million). Moreover, in accordance with IFRS, foreign currency translation adjustments attributable to Vivendi SA shareowners in relation to Activision Blizzard have been reclassified to profit or loss, i.e., a gain of €555 million. Thus the total capital gain on the divestiture which amounted to €2,915 million with no tax impact, has been recognized in the Consolidated Statements under the line “Earnings from discontinued operations”.
1.1.3.2 Maroc Telecom group
On November 4, 2013, Vivendi entered into a definitive agreement with Etisalat, with whom exclusive negotiations had begun on July 22, 2013, regarding the sale of Vivendi’s 53% interest in Maroc Telecom group. The key terms of this agreement known to date are as follows:
the agreement values the interest in Maroc Telecom group at MAD 92.6 per share or sale proceeds to Vivendi of approximately €4.2 billion in cash, including a €310 million dividend distribution with respect to fiscal year 2012, according to the financial terms known to date . Taking into account Maroc Telecom group’s net debt, the transaction reflects a proportional enterprise value of €4.5 billion for Vivendi’s interest, equal to an EBITDA multiple of 6.2x; and
the completion of this transaction is contingent upon the satisfaction of certain closing conditions, including receipt of required regulatory approvals in Morocco and the countries in which Maroc Telecom group operates, as well as finalization of the shareholders’ agreement between Etisalat and the Kingdom of Morocco. This transaction is expected to be completed during the first months of 2014.
1.1.3.3 Accounting implications in the Consolidated Financial Statements
As from the second quarter of 2013, and in compliance with IFRS 5 taking into account the anticipated closing dates of the effective sales, Activision Blizzard and Maroc Telecom group have been reported in Vivendi’s Consolidated Statement of Earnings, Statement of Cash Flows, and Statement of Financial Position as discontinued operations.
Tuesday, February 25, 2014
Financial Report and Audited Consolidated Financial Statements for the Year Ended December 31, 2013 Vivendi /9
In practice, Activision Blizzard and Maroc Telecom group have been reported as follows: their contribution, until the effective sale, if any, to each line of Vivendi’s Consolidated Statement of Earnings (before non-
controlling interests) has been grouped under the line “Earnings from discontinued operations”. Their share of net income has been excluded from Vivendi’s adjusted net income; and
their contribution, until the effective sale, if any, to each line of Vivendi’s Consolidated Statement of Cash Flows has been grouped under the line “Cash flows from discontinued operations”.Their cash flow from operations (CFFO), cash flow from operations before capital expenditures, net (CFFO before capex, net), and cash flow from operations after interest and income taxes (CFAIT) have been excluded from Vivendi’s CFFO, CFFO before capex, net, and CFAIT.
In accordance with IFRS 5, these adjustments have been applied to all periods presented in the Consolidated Financial Statements (2013 and 2012) to ensure consistency of information.
Moreover, the contribution of Maroc Telecom group to each line of Vivendi’s Consolidated Statement of Financial Position as of December 31, 2013 has been grouped under the lines “assets of discontinued businesses” and “liabilities associated with assets of discontinued businesses”. Its Financial Net Debt was excluded from Vivendi’s Financial Net Debt as of December 31, 2013.
Please refer to Note 7 to the Consolidated Financial Statements for the year ended December 31, 2013.
1.1.4 Acquisition of Lagardère group’s non-controlling interest in Canal+ France
On November 5, 2013, Vivendi acquired Lagardère Group’s 20% interest in Canal+ France, for €1,020 million in cash. In accordance with IFRS 10, Vivendi recorded this transaction as an acquisition of a non-controlling interest. The difference between the consideration paid and the carrying value of the acquired non-controlling interest was recorded as a deduction from equity attributable to Vivendi SA shareowners (-€636 million). In addition, Vivendi and Lagardère Group have settled all disputes between them (please refer to Note 28 to the Consolidated Financial Statements for the year ended December 31, 2013). Thereafter, Canal+ France S.A. was merged with and into Canal+ Group S.A., pursuant to a simplified merger, with retroactive effect to January 1, 2013.
1.1.5 Completion of the acquisition of EMI Recorded Music by Vivendi and Universal Music Group (UMG)
As a reminder, on September 28, 2012 Vivendi and UMG completed the acquisition of 100% of the recorded music business of EMI Group Global Limited (EMI Recorded Music). EMI Recorded Music has been fully consolidated since that date. The purchase price, in enterprise value, amounted to £1,130 million (€1,404 million). The authorization by the European Commission was notably conditional upon the divestment of the Parlophone, Now, and Mute labels. In accordance with IFRS 5, Vivendi reported these assets as assets held for sale at market value (less costs to sell), in the Statements of Financial Position, until completion of the sale.
On February 7, 2013, Vivendi and UMG announced that they had entered into an agreement for the sale of Parlophone Label Group to Warner Music Group for an enterprise value of £487 million to be paid in cash. Following the approval by the European Commission on May 15, 2013, the sale of Parlophone Label Group was completed on July 1, 2013 and Vivendi received consideration of £501 million (€591 million), including the provisional estimated contractual price adjustments (£14 million).
Moreover, the divestments of Sanctuary, Now, and Mute were completed.
The aggregate amount of divestments made in compliance with the conditions imposed by the regulatory authorities in connection with the acquisition of EMI Recorded Music was £543 million, less costs to sell (approximately €679 million, including €39 million in gains on foreign exchange hedging and a consideration of €19 million remaining payable as of December 31, 2013).
1.1.6 Agreement to share a part of SFR’s mobile access networks
On January 31, 2014, SFR and Bouygues Telecom entered into a strategic agreement to share a part of their mobile access networks, following a period of negotiations announced in July 2013. They will roll out a new shared network in an area covering 57% of the French population. This agreement will enable both operators to improve their mobile coverage and generate significant savings over time.
The agreement is based on two principles: the creation of a joint company, to manage the shared base station assets; and entry by the operators into a RAN-sharing service agreement covering 2G, 3G, and 4G services in the shared area.
This network-sharing agreement is similar to numerous arrangements already existing in other European countries. Each operator will retain its own innovation capacity as well as complete commercial and pricing independence.
The network-sharing agreement took effect upon the signing of the agreement and the shared network is expected to be completed by the end of 2017.
From an accounting perspective, this agreement had no impact on the accounts for fiscal year 2013.

Tuesday, February 25, 2014
Financial Report and Audited Consolidated Financial Statements for the Year Ended December 31, 2013 Vivendi /10
1.1.7 Acquisitions by Canal+ Group
Acquisition of a 51% interest in Mediaserv
On July 12, 2013, Canal+ Overseas entered into an agreement with Loret Group to acquire a 51% majority interest in Mediaserv, an overseas telecom operator. On February 10, 2014, the French Competition Authority approved this acquisition, which was completed on February 13, 2014.
Acquisition of a 60% interest in Red Production Company
On December 5, 2013, Studiocanal acquired a 60% majority interest in Red Production Company, a British company which produces television series.
Acquisition of an additional interest in N-Vision
On November 30, 2012, Canal+ Group acquired a 40% interest in N-Vision, which indirectly holds a 52% interest in TVN. On December 18, 2013, in accordance with the shareholders’ agreement, ITI exercised its put option to sell to Canal+ Group a 9% interest in N-Vision’s share capital and voting rights for €62 million, paid in cash in February 2014: Canal+ Group’s ownership interest in N-Vision thus increased to 49%.
1.1.8 Financial Net Debt change
For a detailed description of the new financings set up in 2013 as well as the redemptions following the closing of the Activision Blizzard sale, please refer to Section 5. For a detailed description of the maturities of the bonds and bank credit facilities as of December 31, 2013, please refer to Note 23 to the Consolidated Financial Statements for the year ended December 31, 2013.
1.2 Significant events since December 31, 2013 The significant events that have occurred since December 31, 2013 were as follows:
on January 14, 2014, Canal+ Group won the exclusive broadcasting rights to the national French Rugby Championship “TOP 14” for five seasons (2014-2015 to 2018-2019). These rights relate to all of the TOP 14 matches, across all media and all territories;
on January 31, 2014, SFR and Bouygues Telecom entered into a strategic agreement to share a part of their mobile access networks; and
on February 13, 2014, Vivendi entered into exclusive negotiations with Belgacom to acquire 100% of its subsidiary Telindus France Group, a leader on the French markets of telecommunication integration and networks. Once signed, the transaction will be submitted to the French competition authority approval.
Tuesday, February 25, 2014
Financial Report and Audited Consolidated Financial Statements for the Year Ended December 31, 2013 Vivendi /11
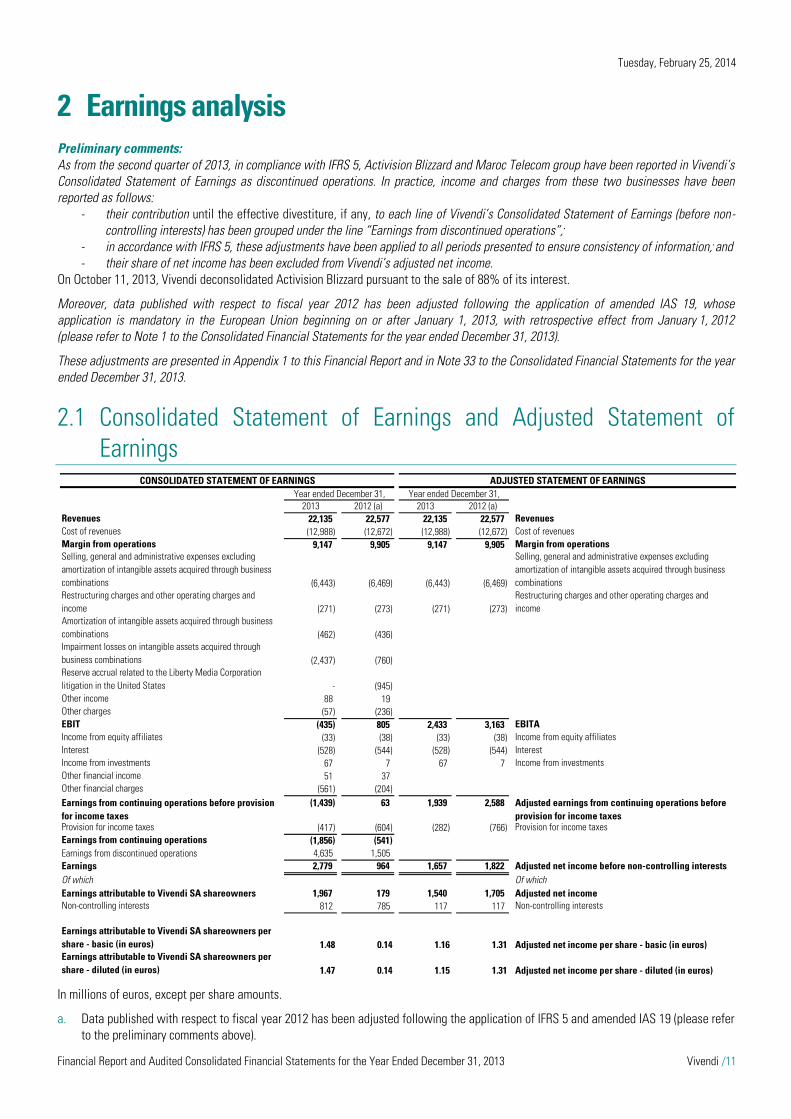
2 Earnings analysis Preliminary comments: As from the second quarter of 2013, in compliance with IFRS 5, Activision Blizzard and Maroc Telecom group have been reported in Vivendi’s Consolidated Statement of Earnings as discontinued operations. In practice, income and charges from these two businesses have been reported as follows:
- their contribution until the effective divestiture, if any, to each line of Vivendi’s Consolidated Statement of Earnings (before non-controlling interests) has been grouped under the line “Earnings from discontinued operations”;
- in accordance with IFRS 5, these adjustments have been applied to all periods presented to ensure consistency of information; and - their share of net income has been excluded from Vivendi’s adjusted net income.
On October 11, 2013, Vivendi deconsolidated Activision Blizzard pursuant to the sale of 88% of its interest.
Moreover, data published with respect to fiscal year 2012 has been adjusted following the application of amended IAS 19, whose application is mandatory in the European Union beginning on or after January 1, 2013, with retrospective effect from January 1, 2012 (please refer to Note 1 to the Consolidated Financial Statements for the year ended December 31, 2013).
These adjustments are presented in Appendix 1 to this Financial Report and in Note 33 to the Consolidated Financial Statements for the year ended December 31, 2013.
2.1 Consolidated Statement of Earnings and Adjusted Statement of Earnings
In millions of euros, except per share amounts.
a. Data published with respect to fiscal year 2012 has been adjusted following the application of IFRS 5 and amended IAS 19 (please refer to the preliminary comments above).
CONSOLIDATED STATEMENT OF EARNINGS ADJUSTED STATEMENT OF EARNINGSYear ended December 31, Year ended December 31,
2013 2012 (a) 2013 2012 (a)Revenues 22,135 22,577 22,135 22,577 RevenuesCost of revenues (12,988) (12,672) (12,988) (12,672) Cost of revenuesMargin from operations 9,147 9,905 9,147 9,905 Margin from operationsSelling, general and administrative expenses excluding amortization of intangible assets acquired through business combinations (6,443) (6,469) (6,443) (6,469)
Selling, general and administrative expenses excluding amortization of intangible assets acquired through business combinations
Restructuring charges and other operating charges and income (271) (273) (271) (273)
Restructuring charges and other operating charges and income
Amortization of intangible assets acquired through business combinations (462) (436)Impairment losses on intangible assets acquired through business combinations (2,437) (760)Reserve accrual related to the Liberty Media Corporation litigation in the United States - (945)Other income 88 19Other charges (57) (236)EBIT (435) 805 2,433 3,163 EBITAIncome from equity affiliates (33) (38) (33) (38) Income from equity affiliatesInterest (528) (544) (528) (544) InterestIncome from investments 67 7 67 7 Income from investmentsOther financial income 51 37Other financial charges (561) (204)Earnings from continuing operations before provision for income taxes
(1,439) 63 1,939 2,588 Adjusted earnings from continuing operations before provision for income taxes
Provision for income taxes (417) (604) (282) (766) Provision for income taxesEarnings from continuing operations (1,856) (541)Earnings from discontinued operations 4,635 1,505Earnings 2,779 964 1,657 1,822 Adjusted net income before non-controlling interestsOf which Of whichEarnings attributable to Vivendi SA shareowners 1,967 179 1,540 1,705 Adjusted net incomeNon-controlling interests 812 785 117 117 Non-controlling interests
Earnings attributable to Vivendi SA shareowners per share - basic (in euros) 1.48 0.14 1.16 1.31 Adjusted net income per share - basic (in euros)Earnings attributable to Vivendi SA shareowners per share - diluted (in euros) 1.47 0.14 1.15 1.31 Adjusted net income per share - diluted (in euros)

Tuesday, February 25, 2014
Financial Report and Audited Consolidated Financial Statements for the Year Ended December 31, 2013 Vivendi /12
2.2 Earnings review Adjusted net income analysis
Adjusted net income was €1,540 million (or €1.16 per share2), compared to €1,705 million (or €1.31 per share) in 2012. This €165 million decrease (-9.7%) resulted primarily from:
a €730 million decrease in EBITA to a total of €2,433 million (compared to €3,163 million in 2012). This change mainly reflected the decline in the performances of SFR (-€527 million), GVT (-€83 million, primarily due to the decline in value of the Brazilian Real), Canal+ Group (-€52 million, including the increase in transition costs related to D8/D17 and “n” for -€39 million), and Universal Music Group (-€15 million, including the increase in restructuring charges for -€35 million and integration costs related to EMI Recorded Music for -€8 million). Moreover, this change included the costs related to the launch of Watchever in Germany (-€66 million);
a €5 million increase attributable to the change in income from equity affiliates; a €16 million decrease in interest; a €60 million increase in income from investments; and a €484 million decrease in income tax expense, mainly reflecting the impact of the decline in the group’s business segments’
taxable income (+€199 million), primarily due to SFR, the favorable impact of certain non-recurring items (+€149 million), and the increase in the current tax savings related to Vivendi SA’s tax group System (+€50 million), primarily due to Canal+ Group.
Breakdown of the main items from the Statement of Earnings
Revenues were €22,135 million, compared to €22,577 million in 2012 (-2.0%, or +0.2% at constant currency). For a breakdown of revenues by business segment, please refer to Section 4 of this Financial Report.
Costs of revenues amounted to €12,988 million, compared to €12,672 million in 2012, a €316 million increase (+2.5%).
Margin from operations decreased by €758 million, to €9,147 million, compared to €9,905 million in 2012 (-7.7%).
Selling, general and administrative expenses, excluding the amortization of intangible assets acquired through business combinations, amounted to €6,443 million, compared to €6,469 million in 2012, a €26 million decrease (-0.4%).
Depreciation and amortization of tangible and intangible assets are included either in the cost of revenues or in selling, general and administrative expenses. Depreciation and amortization, excluding amortization of intangible assets acquired through business combinations, amounted to €2,207 million (compared to €2,079 million in 2012), an additional €128 million charge (+6.2%). This change mainly resulted from the increase in the depreciation of telecommunication network assets of SFR and GVT.
Restructuring charges and other operating charges and income amounted to a net charge of €271 million, compared to a net charge of €273 million in 2012. In 2013, restructuring charges were €208 million (compared to €273 million in 2012) and included €114 million incurred by UMG (compared to €79 million in 2012) and €93 million incurred by SFR (compared to €187 million in 2012). In 2013, transition costs incurred by Canal+ Group and UMG amounted to €50 million (of which €43 million related to “n” and €7 million related to D8/D17, compared to €11 million in 2012) and €27 million (compared to €19 million in 2012), respectively. Moreover, in 2012, other operating charges included the €66 million fine ordered against SFR by the French Competition Authority in December 2012.
EBITA was €2,433 million, compared to €3,163 million in 2012, a €730 million decrease (-23.1%, or -20.6% at constant currency). For a breakdown of EBITA by business segment, please refer to Section 4 of this Financial Report.
Amortization of intangible assets acquired through business combinations was €462 million, compared to €436 million in 2012, a €26 million increase (+6.0%), mainly related to the amortization of music rights and catalogs acquired by Universal Music Group from EMI Recorded Music on September 28, 2012.
Impairment losses on intangible assets acquired through business combinations amounted to €2,437 million, compared to €760 million in 2012. In 2013, they reflected the impairment of SFR’s goodwill (€2,431 million). In 2012, they related to the impairment of Canal+ France’s goodwill (€665 million) and certain goodwill and music catalogs of Universal Music Group (€94 million).
As of December 31, 2012, based on the verdict rendered on June 25, 2012 in relation to the Liberty Media Corporation litigation in the United States, which was confirmed by the court in New York on January 9, 2013 and entered into the record by the judge on January 17, 2013, Vivendi accrued a reserve for the full amount of the judgment (€945 million), representing €765 million in damages and €180 million in pre-judgment interest covering the period from December 16, 2001 to January 17, 2013, at the rate of one-year U.S. Treasury notes. As of December 31, 2013, this €945 million reserve as well as the €100 million reserve recognized at year-end 2010 in relation to the Securities
2 For the details of adjusted net income per share, please refer to Appendix 1 to this Financial Report.
Tuesday, February 25, 2014
Financial Report and Audited Consolidated Financial Statements for the Year Ended December 31, 2013 Vivendi /13
Class Action in the United States were unchanged. Please refer to Note 28 to the Consolidated Financial Statements for the year ended December 31, 2013.
Other income amounted to €88 million, compared to €19 million in 2012. In 2013, it notably included the gain related to Universal Music Group’s 2.8% interest dilution in Vevo (€18 million).
Other charges amounted to €57 million, compared to €236 million in 2012. In 2012, they mainly included the €119 million impairment loss on Canal+ Group’s interest in N-Vision in Poland and €63 million in acquisition costs (EMI Recorded Music, and the strategic partnership in Poland).
EBIT was a €435 million loss, compared to a €805 million gain in 2012, an unfavorable change of €1,240 million, mainly reflecting the decrease in 2013 EBITA (-€730 million), as well as the impairment of SFR’s goodwill (€2,431 million) as of December 31, 2013, partially offset by the reserve accrual in relation to the Liberty Media Corporation litigation in the United States (€945 million) and the impairment of Canal+ France’s goodwill (€665 million) as of December 31, 2012.
Income from equity affiliates was a €33 million charge, compared to a €38 million charge in 2012.
Interest was an expense of €528 million, compared to €544 million in 2012, a €16 million decrease (-2.9%). In 2013, interest expense on borrowings amounted to €553 million, compared to €572 million in 2012. This change was mainly attributable to the decrease in the average interest rate on borrowings to 3.38% (compared to 3.46% in 2012) and to the stability in the average outstanding borrowings of €16.3 billion in 2013 (compared to €16.5 billion in 2012). Indeed, the impact on the average outstanding borrowings of the sales of Activision Blizzard on October 11, 2013 (€6 billion) and of Parlophone Label Group on July 1, 2013 (€0.7 billion), was offset by the impact of the acquisitions of EMI Recorded Music on September 28, 2012 (€1.4 billion) and of Lagardère’s interest in Canal+ France on November 5, 2013 (€1 billion). Interest income earned on cash and cash equivalents amounted to €25 million, compared to €28 million in 2012, a €3 million decrease.
Income from investments amounted to €67 million, compared to €7 million in 2012. It included interest and dividends received from unconsolidated companies, notably including a €54 million dividend received by UMG from Beats in 2013.
Other financial charges and income amounted to a net charge of €510 million, compared to a net charge of €167 million in 2012. They mainly included premiums and costs related to the early bond redemptions made during the fourth quarter of 2013 following the sale of the majority of Vivendi’s interest in Activision Blizzard (-€207 million) as well as the -€186 million foreign exchange loss (compared to a €76 million foreign exchange loss in 2012) on GVT’s intercompany euro loan from Vivendi, due to the decline in value of the Brazilian Real. Please refer to Note 5 to the Consolidated Financial Statements for the year ended December 31, 2013.
Income taxes reported to adjusted net income was a net charge of €282 million, compared to a net charge of €766 million in 2012, a €484 million decrease. This change mainly reflected the impact of the decline in the group’s business segments’ taxable income (+€199 million), primarily due to SFR, the favorable impact of certain non-recurring items (+€149 million), which reflected the change, during the period, in the assessment of risks related to previous years’ income taxes, and the increase in current tax savings related to Vivendi SA’s tax group System (+€50 million), primarily related to Canal+ Group. The effective tax rate reported to adjusted net income was 14.3%, compared to 29.2% in 2012. Excluding the favorable impact of certain non-recurring items, the effective tax rate on adjusted net income was 20.8% in 2013 (compared to 28.3% in 2012). In addition, provision for income taxes was a net charge of €417 million, compared to a net charge of €604 million in 2012, a €187 million decrease. In addition to the factors explaining the decrease in income taxes reported to adjusted net income, this change reflected the additional contribution of 3% on Vivendi SA’s dividend for fiscal year 2012 (€40 million) as well as the change in deferred tax savings related to Vivendi SA’s tax group System, which was a €161 million charge in 2013 (compared to a €48 million charge in 2012).
Earnings from discontinued operations (before non-controlling interests) amounted to €4,635 million, compared to €1,505 million in 2012. In 2013, it included the capital gain on the divestiture of Activision Blizzard on October 11, 2013 (€2,915 million) and the change in value, since that date, of the 83 million Activision Blizzard shares still owned by Vivendi as of December 31, 2013 (gain of €245 million). Moreover, earnings from discontinued operations included Activision Blizzard’s earnings until the effective date of divestiture (€692 million, compared to €873 million in 2012), as well as Maroc Telecom group’s earnings (€783 million in 2013, compared to €632 million in 2012). In 2013, these earnings also took into account the discontinuation of the amortization of tangible and intangible assets of these two businesses since July 1, 2013, in accordance with accounting standards (+€270 million impact in 2013). Please refer to Note 7 to the Consolidated Financial Statements for the year ended December 31, 2013.
Earnings attributable to non-controlling interests amounted to €812 million, compared to €785 million in 2012, a €27 million increase (+3.4%). It primarily included Maroc Telecom group’s non-controlling interests (€435 million in 2013, compared to €335 million in 2012) and Activision Blizzard’s non-controlling interests (€269 million from January 1, 2013 to October 11, 2013, compared to €337 million in 2012).
Adjusted net income attributable to non-controlling interests amounted to €117 million, unchanged compared to December 31, 2012, and primarily included Lagardère’s non-controlling interest in Canal+ Group until November 5, 2013.
Tuesday, February 25, 2014
Financial Report and Audited Consolidated Financial Statements for the Year Ended December 31, 2013 Vivendi /14
In 2013, earnings attributable to Vivendi SA shareowners amounted to €1,967 million (or €1.48 per share), compared to €179 million (or €0.14 per share) in 2012, a €1,788 million increase. This change mainly reflected in 2013, the capital gain on the divestiture of Activision Blizzard (€2,915 million), partially offset by the impairment of SFR’s goodwill (-€2,431 million), and in 2012, the reserve accrual in relation to the Liberty Media Corporation litigation in the United States (-€945 million) and the impairment of Canal+ France’s goodwill (-€665 million).
The reconciliation of earnings attributable to Vivendi SA shareowners to adjusted net income is further described in Appendix 1 to this Financial Report. In 2013, this reconciliation primarily included the capital gain on the divestiture of Activision Blizzard (+€2,915 million), the change in value of the 83 million shares in Activision Blizzard still owned by Vivendi as of December 31, 2013 (gain of €245 million), Activision Blizzard’s earnings until October 11, 2013 (+€423 million, after non-controlling interests) and Maroc Telecom group’s earnings in 2013 (+€348 million, after non-controlling interests), offset by the impairment of SFR’s goodwill (-€2,431 million), the amortization and impairment of intangible assets acquired through business combinations (-€320 million, after taxes), as well as other financial charges, net (-€510 million). In 2012, this reconciliation primarily included earnings from Activision Blizzard and Maroc Telecom group (+€833 million, after non-controlling interests), the reserve accrual in relation to the Liberty Media Corporation litigation in the United States (-€945 million), the impairment of Canal+ France’s goodwill (-€665 million), and amortization and impairment losses on intangible assets acquired through business combinations (-€388 million, after taxes).
3 Cash flow from operations analysis Preliminary comments: Vivendi considers that the non-GAAP measures cash flow from operations (CFFO), cash flow from operations before capital
expenditures (CFFO before capex, net) and cash flow from operations after interest and taxes (CFAIT) are relevant indicators of the group’s operating and financial performance. These indicators should be considered in addition to, and not as substitutes for, other GAAP measures as reported in Vivendi’s Cash Flow Statement, contained in the group’s Consolidated Financial Statements.
As from the second quarter of 2013, in compliance with IFRS 5, Activision Blizzard and Maroc Telecom group have been reported in Vivendi’s Consolidated Statement of Cash Flows as discontinued operations. In practice, cash flows from these two businesses have been reported as follows:
- their contribution until the effective sale, if any, to each line of Vivendi’s Consolidated Statement of Cash Flows has been grouped under the line “Cash flows from discontinued operations”;
- in accordance with IFRS 5, these adjustments have been applied to all periods presented to ensure consistency of information; and
- their cash flow from operations (CFFO), cash flow from operations before capital expenditures, net (CFFO before capex, net), and cash flow from operations after interest and income taxes (CFAIT) have been excluded from Vivendi’s CFFO, CFFO before capex, net, and CFAIT.
In 2013, cash flow from operations (CFFO) generated by business segments was €1,453 million (compared to €1,213 million in 2012), an improvement of €240 million (+19.8%). In 2012, capital expenditures notably included the acquisition by SFR of 4G mobile spectrum for €1,065 million. Excluding this impact, CFFO decreased by €825 million (-36.2%).
In 2013, cash flow from operations before capital expenditures (CFFO before capex, net) generated by business segments amounted to €4,077 million (compared to €5,189 million in 2012), a €1,112 million decrease. This change reflected a decrease in EBITDA after changes in net working capital (-€999 million), primarily related to SFR’s decrease. It also reflected the increase in restructuring charges paid by SFR (+€150 million) and UMG (+€25 million), partially offset by the dividends paid by Beats to UMG (€54 million).
In 2013, capital expenditures, net amounted to €2,624 million (compared to €3,976 million in 2012), a €1,352 million decrease, notably attributable to the acquisition by SFR in January 2012 of 4G mobile spectrum for €1,065 million. Excluding this impact, capital expenditures, net decreased by €287 million.
Cash payments for financial activities amounted to €877 million (compared to €640 million in 2012), a €237 million increase. This change was primarily due to the premiums paid (€182 million) and foreign exchange losses incurred (€34 million) in relation to the early redemption of bonds (euro-denominated and US dollar-denominated bonds) for an aggregate amount of €3 billion, following the sale of 88% of its interest in Activision Blizzard on October 11, 2013. In 2012, cash payments for financial activities notably included a €78 million foreign exchange loss attributable to the redemption in April 2012 of a $700 million bond. Moreover, cash payments for financial activities included interest paid, net of €528 million (compared to €544 million in 2012), a €16 million decrease.
Income taxes paid amounted to €197 million (compared to €353 million in 2012), a €156 million decrease, reflecting the decrease in the amount of income tax installments paid by the group’s entities (-€491 million), partially offset by lower refunds received as part of Vivendi’s SA’s tax group System (€201 million received in 2013, compared to €530 million received in 2012). In 2013, the amount of taxes paid included the new additional contribution of 3% on the dividend paid by Vivendi SA (€40 million).
Therefore, in 2013, cash flow from operations after interest and income taxes paid (CFAIT) amounted to €379 million (compared to €220 million in 2012), a €159 million increase.

Tuesday, February 25, 2014
Financial Report and Audited Consolidated Financial Statements for the Year Ended December 31, 2013 Vivendi /15
na: not applicable.
a. Data published with respect to fiscal year 2012 has been adjusted following the application of IFRS 5 (please refer to the preliminary comments above) and amended IAS 19.
b. EBITDA, a non-GAAP measure, is described in Section 4 of this Financial Report.
c. As presented in net cash provided by operating activities of continuing operations in the Financial Net Debt changes table (please refer to Section 5.3).
d. As presented in net cash provided by/(used for) investing activities of continuing operations in the Financial Net Debt changes table (please refer to Section 5.3).
e. Relates to cash used for capital expenditures, net of proceeds from property, plant and equipment, and intangible assets as presented in the investing activities of continuing operations in the Financial Net Debt changes table (please refer to Section 5.3).
f. As presented in net cash provided by/(used for) financing activities of continuing operations in the Financial Net Debt changes table (please refer to Section 5.3).
g. In 2012, SFR’s capital expenditures notably included the acquisition of 4G spectrum for €1,065 million in January 2012.
(in millions of euros) 2013 2012 (a) € Change % Change
Revenues 22,135 22,577 -442 -2.0%Operating expenses excluding depreciation and amortization (17,207) (17,027) -180 -1.1%EBITDA (b) 4,928 5,550 -622 -11.2%Restructuring charges paid (282) (114) -168 x 2.5Content investments, net (148) (145) -3 -2.1%
of which film and television rights, net at Canal+ Group Acquisition of film and television rights (869) (760) -109 -14.3% Consumption of film and television rights 743 703 +40 +5.7%
(126) (57) -69 x 2.2of which sports rights, net at Canal+ Group
Acquisition of sports rights (714) (654) -60 -9.2% Consumption of sports rights 759 672 +87 +12.9%
45 18 +27 x 2.5of which payments to artists and repertoire owners, net at UMG
Payments to artists and repertoire owners (599) (647) +48 +7.4% Recoupment of advances and other movements 561 603 -42 -7.0%
(38) (44) +6 +13.6%Neutralization of change in provisions included in EBITDA (90) (144) +54 +37.5%Other cash operating items excluded from EBITDA (80) (31) -49 x 2.6Other changes in net working capital (308) 69 -377 naNet cash provided by operating activities before income tax paid (c) 4,020 5,185 -1,165 -22.5%Dividends received from equity affiliates (d) 3 3 - -Dividends received from unconsolidated companies (d) 54 1 +53 x 54.0Cash flow from operations, before capital expenditures, net (CFFO before capex, net) 4,077 5,189 -1,112 -21.4%Capital expenditures, net (capex, net) (e) (2,624) (3,976) +1,352 +34.0%
of which GVT (769) (947) +178 +18.8%SFR (g) (1,610) (2,736) +1,126 +41.2%
Cash flow from operations (CFFO) 1,453 1,213 +240 +19.8%Interest paid, net (f) (528) (544) +16 +2.9%Other cash items related to financial activities (f) (349) (96) -253 x 3.6
of which gains/(losses) on currency transactions - (143) (50) -93 x 2.9fees and premium on borrowings issued/redeemed and early unwinding of hedging derivative instruments
- (194) (9) -185 x 21.6Financial activities cash payments (877) (640) -237 -37.0%
and Consolidated Global Profit Tax Systems 201 536 -335 -62.5%Other taxes paid (398) (889) +491 +55.2%Income tax (paid)/received, net (c) (197) (353) +156 +44.2%Cash flow from operations after interest and income tax paid (CFAIT) 379 220 +159 +72.3%
Year ended December 31,
Payment received from the French State Treasury as part of the Vivendi SA's French Tax Group

Tuesday, February 25, 2014
Financial Report and Audited Consolidated Financial Statements for the Year Ended December 31, 2013 Vivendi /16
4 Business segment performance analysis Preliminary comments:
Vivendi Management evaluates the performance of Vivendi’s business segments and allocates the necessary resources to them based on certain operating performance indicators, notably the non-GAAP measures EBITA (Adjusted Earnings Before Interest and Income Taxes) and EBITDA (Earnings Before Interest, Taxes, Depreciation and Amortization):
- the difference between EBITA and EBIT consists of the amortization of intangible assets acquired through business combinations, the impairment of goodwill and other intangibles acquired through business combinations, and EBIT’s “other charges” and “other income” as defined in Note 1.2.3 to the Consolidated Financial Statements for the year ended December 31, 2013; and
- as defined by Vivendi, EBITDA is calculated as EBITA as presented in the Adjusted Statement of Earnings, before depreciation and amortization of tangible and intangible assets, restructuring charges, gains/(losses) on the sale of tangible and intangible assets, and other non-recurring items (as presented in the Consolidated Statement of Earnings by operating segment - Please refer to Note 3 to the Consolidated Financial Statements for the year ended December 31, 2013).
Moreover, it should be noted that other companies may define and calculate EBITA and EBITDA differently from Vivendi, thereby affecting comparability.
As from the second quarter of 2013, in compliance with IFRS 5, Activision Blizzard and Maroc Telecom group have been reported in Vivendi’s Consolidated Statement of Earnings as discontinued operations. In practice, income and charges from these two businesses have been reported as follows:
- their contribution until the effective sale, if any, to each line of Vivendi’s Consolidated Statement of Earnings (before non-controlling interests) has been grouped under the line “Earnings from discontinued operations”;
- in accordance with IFRS 5, these adjustments have been applied to all periods presented to ensure consistency of information; and
- their share of net income has been excluded from Vivendi’s adjusted net income.
Data presented below also takes into account the consolidation of the following entities as from the indicated dates: - at Canal+ Group: D8 and D17 (September 27, 2012) and “n” (November 30, 2012); and - at Universal Music Group: EMI Recorded Music (September 28, 2012).
Moreover, as of January 1, 2013, Vivendi applied, with retrospective effect from January 1, 2012, amended IAS 19, whose application is mandatory in the European Union beginning on or after January 1, 2013 (please refer to Note 1 to the Consolidated Financial Statements for the year ended December 31, 2013). As a result, the 2012 Financial Statements, notably EBITA, were adjusted in accordance with the new standard.
Please refer to Appendix 1 of this Financial Report for a presentation of the adjustments made to previously published data.
Tuesday, February 25, 2014
Financial Report and Audited Consolidated Financial Statements for the Year Ended December 31, 2013 Vivendi /17
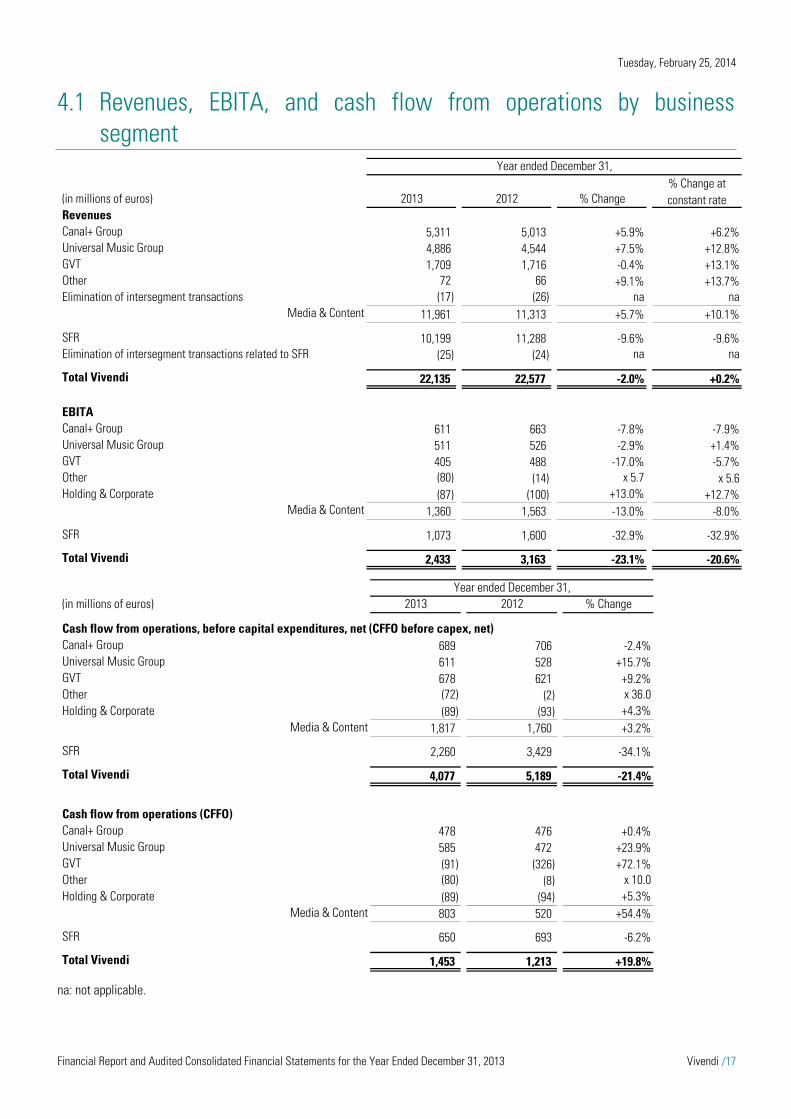
4.1 Revenues, EBITA, and cash flow from operations by business segment
na: not applicable.
(in millions of euros) 2013 2012 % Change% Change at constant rate
RevenuesCanal+ Group 5,311 5,013 +5.9% +6.2%Universal Music Group 4,886 4,544 +7.5% +12.8%GVT 1,709 1,716 -0.4% +13.1%Other 72 66 +9.1% +13.7%Elimination of intersegment transactions (17) (26) na na
Media & Content 11,961 11,313 +5.7% +10.1%
SFR 10,199 11,288 -9.6% -9.6%Elimination of intersegment transactions related to SFR (25) (24) na na
Total Vivendi 22,135 22,577 -2.0% +0.2%
EBITACanal+ Group 611 663 -7.8% -7.9%Universal Music Group 511 526 -2.9% +1.4%GVT 405 488 -17.0% -5.7%Other (80) (14) x 5.7 x 5.6Holding & Corporate (87) (100) +13.0% +12.7%
Media & Content 1,360 1,563 -13.0% -8.0%
SFR 1,073 1,600 -32.9% -32.9%
Total Vivendi 2,433 3,163 -23.1% -20.6%
Year ended December 31,
(in millions of euros) 2013 2012 % Change
Cash flow from operations, before capital expenditures, net (CFFO before capex, net)Canal+ Group 689 706 -2.4%Universal Music Group 611 528 +15.7%GVT 678 621 +9.2%Other (72) (2) x 36.0Holding & Corporate (89) (93) +4.3%
Media & Content 1,817 1,760 +3.2%
SFR 2,260 3,429 -34.1%
Total Vivendi 4,077 5,189 -21.4%
Cash flow from operations (CFFO)Canal+ Group 478 476 +0.4%Universal Music Group 585 472 +23.9%GVT (91) (326) +72.1%Other (80) (8) x 10.0Holding & Corporate (89) (94) +5.3%
Media & Content 803 520 +54.4%
SFR 650 693 -6.2%
Total Vivendi 1,453 1,213 +19.8%
Year ended December 31,

Tuesday, February 25, 2014
Financial Report and Audited Consolidated Financial Statements for the Year Ended December 31, 2013 Vivendi /18
4.2 Comments on the operating performance of business segments
4.2.1 Canal+ Group
a. Relates to pay-TV operations in French overseas territories, Africa, Vietnam, and Poland (whose “n” platform has been consolidated since November 30, 2012).
b. Includes the free-to-air channels D8 and D17, consolidated since September 27, 2012, as well as i>Télé and advertising activities outside of the group’s scope.
c. Includes individual and collective subscriptions with commitment and without commitment (Canal, CanalSat and CanalPlay).
Year ended December 31,
(in millions of euros, except for margins) 2013 2012 % Change% Change at constant rate
Pay-TV in Mainland France 3,544 3,593 -1.4% -1.4%International Pay-TV (a) 1,122 890 +26.1% +27.1%Free-to-air TV in France (b) 172 64 x 2.7 x 2.7Studiocanal 473 466 +1.5% +2.9%Total Revenues 5,311 5,013 +5.9% +6.2%
EBITDA 905 940 -3.7% -3.6%
EBITA 611 663 -7.8% -7.9%Transition costs (50) (11)EBITA excluding transition costs 661 674 -1.9% -2.0%
Cash flow from operations (CFFO) 478 476 +0.4%Cash flow from operations (CFFO) excluding transition costs 528 499 +5.8%
Subscriptions (in thousands)Pay-TV in Mainland France (c) 9,534 9,719 -185 International Pay-TV 5,137 4,735 +402 Total Canal+ Group 14,671 14,454 +217
Individual subscribers (in thousands)Pay-TV in Mainland France 6,091 6,117 -26 International Pay-TV 4,352 4,077 +275 Total Canal+ Group 10,443 10,194 +249
Churn, per individual subscriber with commitment (Mainland France) 14.9% 13.8% +1.1 ptNet ARPU, in euros per individual subscriber with commitment (Mainland France) 44.2 43.2 +2.3%
Tuesday, February 25, 2014
Financial Report and Audited Consolidated Financial Statements for the Year Ended December 31, 2013 Vivendi /19
Revenues and EBITA
Canal+ Group’s revenues were €5,311 million, a 5.9% increase (-0.5% at constant perimeter and currency) year-on-year. This growth was primarily driven by the development of pay-TV operations outside of France, notably in Africa and Poland, and by the acquisition and successful re-launch of the free-to-air channels D8 and D17.
At the end of December 2013, Canal+ Group reached 10.4 million individual subscribers (+249,000 year-on-year) for a total of 14.7 million subscriptions. This growth was due to strong performance in overseas countries, where total individual subscribers reached 4.4 million (+275,000 compared to year-end 2012). In mainland France, total individual subscribers remained almost stable at 6.1 million despite a challenging economic and competitive environment. Net average revenue per individual subscriber in mainland France continued to grow, reaching €44.2, compared to €43.2 in 2012.
Free-to-air TV operations strongly contributed to revenue growth, thanks to the integration of D8 and D17. In December 2013, these channels had aggregated an audience share of 4.7%, including 3.4% for D8, which only a year after its re-launch, regularly ranks as the fifth national channel in France.
Studiocanal’s revenues increased due to the development of TV sales and international rights (in particular "Non-Stop" by Jaume Collet-Serra and "Hunger Games 2" in Germany). In 2013, Studiocanal supported major productions including the Coen brothers’ film “Inside Llewyn Davis”, winner of the Grand Prix du Jury at Cannes in 2013, and the series “Crossing Lines”, which is notably broadcast in the United States, Canada, France, and Italy. In order to strengthen its position in TV series production, Studiocanal acquired 60% of the British company Red in 2013.
Excluding transition costs related to D8, D17 and the new operations in Poland, Canal+ Group’s EBITA was €661 million, down 1.9% compared to 2012. This change was due to lower advertising revenues on pay-TV channels and higher programming costs due to an increase in exclusive content. Including costs related to the integration of D8, D17 and the new operations in Poland, EBITA was €611 million. D8 and D17 achieved breakeven in the fourth quarter of 2013.
On January 14, 2014, the French rugby league (LNR) awarded Canal+ Group exclusive broadcasting rights for the TOP 14 French rugby championship for five new seasons (2014/2015 to 2018/2019). These rights cover all TOP 14 games, across all platforms and in all territories. They complete the portfolio of major sports rights already owned by Canal+ Group, in particular the best French and European football (two live games on every Ligue 1, match day and the top pick on every Champions League day, and the full English Premier League) and the Formula 1 world championship.
Moreover, the quality of Original Creations, in the heart of Canal+ programming, has been recognized again. In 2013, the series “Les Revenants” was given the best drama series award at the International Emmy Awards and “Maison Close” received the award for best French series at the Television Festival of Monte-Carlo.
Cash flow from operations (CFFO)
Canal+ Group’s cash flow from operations amounted to €478 million, compared to €476 million in 2012. The unfavorable change in EBITDA after changes in net working capital and the transition costs paid were offset by the decrease in content investments, net (notably at Studiocanal) and capital expenditures, net.
Tuesday, February 25, 2014
Financial Report and Audited Consolidated Financial Statements for the Year Ended December 31, 2013 Vivendi /20
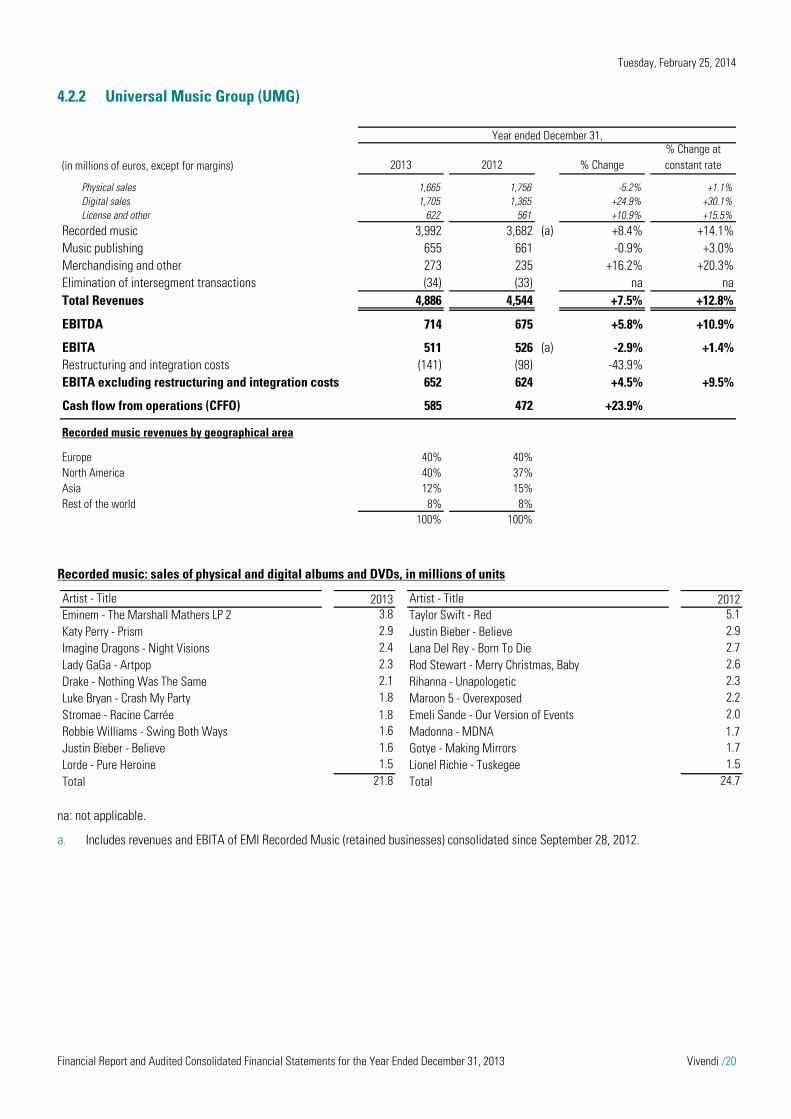
4.2.2 Universal Music Group (UMG)
Recorded music: sales of physical and digital albums and DVDs, in millions of units
na: not applicable.
a. Includes revenues and EBITA of EMI Recorded Music (retained businesses) consolidated since September 28, 2012.
Year ended December 31,
(in millions of euros, except for margins) 2013 2012 % Change% Change at constant rate
Physical sales 1,665 1,756 -5.2% +1.1%Digital sales 1,705 1,365 +24.9% +30.1%License and other 622 561 +10.9% +15.5%
Recorded music 3,992 3,682 (a) +8.4% +14.1%Music publishing 655 661 -0.9% +3.0%Merchandising and other 273 235 +16.2% +20.3%Elimination of intersegment transactions (34) (33) na naTotal Revenues 4,886 4,544 +7.5% +12.8%
EBITDA 714 675 +5.8% +10.9%
EBITA 511 526 (a) -2.9% +1.4%Restructuring and integration costs (141) (98) -43.9%EBITA excluding restructuring and integration costs 652 624 +4.5% +9.5%
Cash flow from operations (CFFO) 585 472 +23.9%
Recorded music revenues by geographical area
Europe 40% 40%North America 40% 37%Asia 12% 15%Rest of the world 8% 8%
100% 100%
Artist - Title 2013 Artist - Title 2012Eminem - The Marshall Mathers LP 2 3.8 Taylor Swift - Red 5.1 Katy Perry - Prism 2.9 Justin Bieber - Believe 2.9 Imagine Dragons - Night Visions 2.4 Lana Del Rey - Born To Die 2.7 Lady GaGa - Artpop 2.3 Rod Stewart - Merry Christmas, Baby 2.6 Drake - Nothing Was The Same 2.1 Rihanna - Unapologetic 2.3 Luke Bryan - Crash My Party 1.8 Maroon 5 - Overexposed 2.2 Stromae - Racine Carrée 1.8 Emeli Sande - Our Version of Events 2.0 Robbie Williams - Swing Both Ways 1.6 Madonna - MDNA 1.7Justin Bieber - Believe 1.6 Gotye - Making Mirrors 1.7 Lorde - Pure Heroine 1.5 Lionel Richie - Tuskegee 1.5 Total 21.8 Total 24.7

Tuesday, February 25, 2014
Financial Report and Audited Consolidated Financial Statements for the Year Ended December 31, 2013 Vivendi /21
Revenues and EBITA
Universal Music Group (UMG) revenues were €4,886 million, up 12.8% at constant currency compared to 2012 (+7.5% at actual currency). At constant currency, excluding EMI recorded music, revenues were in line with the prior year, as the decline in physical sales was offset by the growth in digital and other revenues, with subscription and streaming revenue increasing by approximately 75% over the prior year. For the first time in 2013, yearly digital sales exceeded physical sales.
Recorded music best sellers for 2013 included Eminem, Katy Perry, Imagine Dragons, Lady Gaga, Drake, Robin Thicke as well as French-language artist, Stromae. The company’s commercial and creative success set many records over the course of the year, including UMG becoming the first company to achieve all ten of the Top 10 songs on the U.S. charts and nine of the Top 10 albums in the U.S. In addition, UMG signed new agreements with leading labels including Disney Music Group, Glassnote Entertainment and Roc Nation, as well legendary artists including Neil Diamond, Queen, The Rolling Stones and Frank Sinatra.
UMG’s EBITA of €511 million was up 1.4% at constant currency (-2.9% at actual currency) compared to 2012. Excluding restructuring and integration costs, and at constant currency, EBITA was up 9.5% compared to 2012, due to revenue growth and cost management efforts.
UMG achieved this performance despite a very difficult industry environment in Japan, the world’s second largest music market.
The company’s integration of EMI remains on track to deliver the previously disclosed synergies of more than £100 million by the end of 2014.
Cash flow from operations (CFFO)
UMG’s cash flow from operations amounted to €585 million (compared to €472 million in 2012), a €113 million increase compared to 2012. This included UMG’s operating performances (EBITDA after changes in net working capital increased by €117 million), the exceptional dividends received by UMG from Beats (€54 million) and property disposals (€27 million).

Tuesday, February 25, 2014
Financial Report and Audited Consolidated Financial Statements for the Year Ended December 31, 2013 Vivendi /22
4.2.3 GVT
a. In 2013, GVT changed the presentation of revenues: due to a new segmentation, some Corporate clients were re-classified as SME during the third quarter of 2013. 2012 amounts were amended to ensure consistency of information presented.
(in millions of euros, except for margins) 2013 2012 (a) % Change% Change at constant rate
Telecoms 1,382 1,434 -3.6% +9.4%Pay-TV 174 83 x 2.1 x 2,4
Retail and SME 1,556 1,517 +2.6% +16.4%Corporate and wholesale 153 199 -23.1% -12.3%Total Revenues 1,709 1,716 -0.4% +13.1%
EBITDA 707 740 -4.5% +8.7%EBITDA margin rate (%) 41.4% 43.1% -1.7 pt
EBITA 405 488 -17.0% -5.7%
Capital expenditures, net (capex net) 769 947 -18.8%
Cash flow from operations (CFFO) (91) (326) +72.1%
Year ended December 31,
2013 2012 (a) % ChangeRevenues (IFRS, in millions of BRL)Retail and SME 4,427 3,804 +16.4%Corporate and wholesale 435 496 -12.3%Total 4,862 4,300 +13.1%
Number of covered cities 150 139 +11
Retail and SMERevenue Generating Units (in thousands)
Voice 3,934 3,489 +12.8%Broadband Internet 2,621 2,239 +17.1%
Proportion of offers ≥ 10 Mbps 86% 80% +6 ptsTotal Telecoms 6,555 5,728 +14.4%Pay-TV 643 406 +58.4%
Total 7,198 6,134 +17.3%
Net New Additions (in thousands)Voice 445 660 -32.6%Broadband Internet 382 515 -25.8%
Total Telecoms 827 1,175 -29.6%Pay-TV 237 374 -36.6%
Total 1,064 1,549 -31.3%
ARPU (BRL/month)Voice 58.6 63.5 -7.7%Broadband Internet 49.2 51.5 -4.5%Pay-TV 78.7 77.2 +1.9%
Year ended December 31,

Tuesday, February 25, 2014
Financial Report and Audited Consolidated Financial Statements for the Year Ended December 31, 2013 Vivendi /23
Revenues and EBITA
GVT’s revenues increased by 13.1% at constant currency (-0.4% at actual currency) compared to 2012, reaching €1,709 million. This performance was achieved in a highly competitive environment and a strong slowdown in the Brazilian economy. At year-end 2013, GVT services covered 150 cities, compared to 139 cities one year earlier.
GVT’s pay-TV service performed well and generated revenues of €174 million, around 10% of GVT’s revenues. The number of subscribers reached about 643,000 at the end of 2013 (+58.4% year-on-year), representing a 24.6% penetration rate among GVT’s broadband customer base. In addition to hybrid technology (satellite and IPTV), GVT launched an offer providing pay-TV service via satellite only.
The quality of the GVT offers continued to receive several accolades. The company was ranked by Info Exame magazine as the operator delivering the best broadband service in Brazil for the fifth consecutive year. It also offers the highest average broadband speed to its customers (13.4 Mbps, compared to the Brazilian average of 2.7 Mbps), according the Akamai Institute.
GVT’s EBITDA reached €707 million, an 8.7% increase at constant currency (-4.5% at actual currency) compared to 2012. EBITDA margin reached 41.4%, which is the highest margin in the Brazilian telecom operators market.
GVT’s EBITA was €405 million, a 5.7% decrease at constant currency (-17.0% at actual currency) compared to 2012. This change was due to increased depreciation expenses attributed to the development of pay-TV and continued high capital expenditure to support its growth.
In 2013, EBITDA-Capex was close to breakeven for the full year, and became positive in the second half of the year thanks to a strong performance in the telecom activities.
Cash flow from operations (CFFO)
GVT’s cash flow from operations amounted to -€91 million (compared to -€326 million in 2012), a €235 million increase. This change reflected the growth in EBITDA after changes in net working capital (+€52 million) as well as a decrease in capital expenditures (€769 million, compared to €947 million in 2012). Cash flow from operations before capital expenditures (CFFO before capex, net) increased by 9.2% in 2013, to €678 million.

Tuesday, February 25, 2014
Financial Report and Audited Consolidated Financial Statements for the Year Ended December 31, 2013 Vivendi /24
4.2.4 SFR
a. Relates to wholesale operators, SRR (a SFR subsidiary in Reunion Island) as well as the elimination of inter-company flows.
b. Relates to net cash outflows in relation to acquisitions and disposals of tangible and intangible assets.
c. The customer base as of December 31, 2013 includes the Retail billing system migration in the fourth quarter of 2013 of 92,000 inactive customers pursuant to a technical purge (no impact on revenues). The customer base as of December 31, 2012 relates to published data (before the technical purge).
d. Relates to the Metropolitan market, excluding SRR.
(in millions of euros, except for margins)2013 2012 % Change
Retail 6,873 7,974 -13.8%B2B 1,789 1,871 -4.4%Wholesale and other (a) 1,537 1,443 +6.5%Total Revenues 10,199 11,288 -9.6%
EBITDA 2,766 3,299 -16.2%
EBITA 1,073 1,600 -32.9%Restructuring costs (93) (187) +50.3%EBITA excluding restructuring costs 1,166 1,787 -34.8%
Capital expenditures, net (capex net) (b) 1,610 2,736 -41.2%of which acquisitions of mobile spectrum - 1,065 -100.0%
capital expenditures, net excluding acquisitions of mobile spectrum 1,610 1,671 -3.7%
Cash flow from operations (CFFO) 650 693 -6.2%of which acquisitions of mobile spectrum - (1,065) +100.0%Of which cash flow from operations excluding acquisitions of mobile spectrum 650 1,758 -63.0%
SFR GroupNumber of Mobile customers (in thousands) (c) 21,354 20,690 +3.2%Acquisition cost (in millions of euros) 430 497 -67 Retention cost (in millions of euros) 541 634 -93 Number of Internet customers (in thousands) 5,257 5,075 +3.6%
Retail market (d)Number of Mobile customers (in thousands) (c) 14,555 15,057 -3.3%Number of Mobile postpaid customers (in thousands) (c) 11,381 11,194 +1.7%Smartphone penetration (in % of customers) 64% 51% +13 pts 12-month rolling Mobile ARPU (in euros/month) 24.1 28.3 -15.0%Number of Broadband Internet customers (in thousands) (d) 5,209 5,039 +3.4%12-month rolling Broadband Internet ARPU (in euros/month) 32.5 33.3 -2.6%
Year ended December 31,
Tuesday, February 25, 2014
Financial Report and Audited Consolidated Financial Statements for the Year Ended December 31, 2013 Vivendi /25
Revenues and EBITA
SFR’s revenues were €10,199 million, a 9.6% decrease compared to 2012, due to the impact of price cuts in response to the competitive environment and to tariff cuts imposed by the regulators3. Excluding the impact of the tariff cuts imposed by the regulators, revenues decreased by 7.2%.
In 2013, SFR’s total mobile customer base increased by 756,0004 net additions since December 31, 2012 and reached 21.354 million4. At the end of December 2013, the broadband Internet residential customer base increased by 182,000 net additions to 5.257 million.
Retail5 revenues amounted to €6,873 million, down 13.8% compared to 2012.
Within the Mobile Retail market5, SFR’s postpaid customer base increased by 279,0004 net additions in 2013. At the end of December, SFR’s postpaid mobile customer base reached 11.381 million, a 2.5%4 increase compared to end December 2012. In the Retail Postpaid customer market, in the fourth quarter, SFR recorded its best net sales performance since the fourth quarter of 2011, and its best December in three years. SFR’s total (postpaid and prepaid) Mobile Retail customer base reached 14.555 million4. Mobile Internet usage continued to improve, with 64% of SFR Retail customers equipped with a smartphone (51% at end December 2012).
One year after having launched 4G, SFR covers more than 40% of the population representing 1,200 cities, with more than 1 million customers at year-end. SFR also covers over 70% of the population in Dual Carrier.
Within the Fixed Retail market5, the broadband Internet residential customer base in mainland France reached 5.209 million at the end of December 2013, with 170,000 net additions since December 31, 2012, and an acceleration of fiber recruitments. The “Multi-Pack de SFR” offer attracted 2.355 million subscribers at the end of December 2013, representing 45% of the broadband Internet customer base.
In a challenging macroeconomic environment, B2B6 revenues amounted to €1,789 million, down 4.4%.
On February 13, 2014, Vivendi announced it had entered into exclusive negotiations with Belgacom Group to acquire 100% of the shares of Telindus France Group. Telindus Group is a leader on the French market of telecommunication integration and operations of ICT (Information and Communication Technologies) infrastructures, and the first Cisco distributor in France. Telindus France would further strengthen Vivendi’s Telecoms division, sitting alongside the SFR group. SFR will thus substantially expand its presence on the related market of telecommunication integration and will provide new services to its corporate customers in addition to those offered by the SFR Business Team.
Wholesale and other7 revenues amounted to €1,537 million, a 6.5% increase year-on-year, mainly due to growth on Wholesale activity.
SFR’s EBITDA amounted to €2,766 million, a 16.2% decrease compared to 2012 (excluding non-recurring items8, EBITDA decreased by 16.5%).
SFR continues to implement its transformation plan. Since the end of 2011, operating expenditures, both fixed and variable, have decreased by more than €1 billion (excluding non-recurring items8).
Cash flow from operations (CFFO)
SFR’s cash flow from operations amounted to €650 million, a 6.2% decrease compared to 2012. In 2012, it notably included the impact of the acquisition of mobile spectrum for €1,065 million. Excluding this impact, cash flow from operations amounted to €1,108 million (-63.0%), primarily due to the decrease in EBITDA after changes in net working capital (-€992 million) and the increase in restructuring charges paid (-€150 million).
3 Tariff cuts imposed by regulatory decision: i) 33% decrease in mobile voice termination regulated price on July 1, 2012 and a further 20% decrease on January 1, 2013; ii) 33% decrease in SMS termination regulated price on July 1, 2012; iii) Roaming tariff cuts on July 1, 2012 and on July 1, 2013; and iv) 50% decrease in fixed voice termination regulated price on July 1, 2012 and a further 47% decrease on January 1, 2013. 4 Following a Retail billing system migration, 92,000 inactive customers were excluded from the final customer base (no impact on revenues). 5 Metropolitan market, all brands combined. 6 Metropolitan market, SFR Business Team brand. 7 Mainly Wholesale revenues, SRR (SFR’s subsidiary in La Réunion) revenues, and elimination of intersegment operations. 8 +€51 million in the third quarter of 2012, and -€66 million in the fourth quarter of 2012.

Tuesday, February 25, 2014
Financial Report and Audited Consolidated Financial Statements for the Year Ended December 31, 2013 Vivendi /26
4.2.5 Other operations of the group
Revenues and EBITA
Revenues from other operations of the group amounted to €72 million, a €6 million increase. It included revenues from Digitick (€13 million compared to €11 million in 2012), See Tickets (€31 million compared to €33 million in 2012), Watchever (€12 million, compared to €8 million in 2012), and Wengo (€16 million, compared to €13 million in 2012).
EBITA from other operations of the group amounted to -€80 million, compared to -€14 million in 2012.
Cash flow from operations (CFFO)
Cash flow from operations from other operations of the group amounted to -€80 million, compared to -€8 million in 2012. This change was mainly related to the change in EBITA.
4.2.6 Holding & Corporate
EBITA
Holding & Corporate’s EBITA was -€87 million (compared to -€100 million in 2012), a €13 million increase, primarily related to the decrease in charges related to litigation in 2013.
Cash flow from operations (CFFO)
Holding & Corporate’s cash flow from operations amounted to -€89 million, compared to -€94 million in 2012. The change was mainly attributable to the change in EBITA.
Year ended December 31,(in millions of euros) 2013 2012
Other operations 72 66Elimination of intersegment transactions (42) (50)Total Revenues 30 16
EBITA (80) (14)
Cash flow from operations (CFFO) (80) (8)
Year ended December 31,(in millions of euros) 2013 2012
EBITA (87) (100)Cash flow from operations (CFFO) (89) (94)

Tuesday, February 25, 2014
Financial Report and Audited Consolidated Financial Statements for the Year Ended December 31, 2013 Vivendi /27
5 Treasury and capital resources
Preliminary comments:
Vivendi considers Financial Net Debt, a non-GAAP measure, to be a relevant indicator in measuring Vivendi’s indebtedness. Financial Net Debt is calculated as the sum of long-term and short-term borrowings and other long-term and short-term financial liabilities as reported on the Consolidated Statement of Financial Position, less cash and cash equivalents as reported on the Consolidated Statement of Financial Position as well as derivative financial instruments in assets, cash deposits backing borrowings, and certain cash management financial assets (included in the Consolidated Statement of Financial Position under “financial assets”). Financial Net Debt should be considered in addition to, and not as a substitute for, other GAAP measures reported on the Consolidated Statement of Financial Position, as well as other measures of indebtedness reported in accordance with GAAP. Vivendi Management uses Financial Net Debt for reporting and planning purposes, as well as to comply with certain debt covenants of Vivendi.
In addition, cash and cash equivalents are not fully available for debt repayments since they are used for several purposes, including but not limited to, acquisitions of businesses, capital expenditures, dividends, contractual obligations and working capital.
5.1 Summary of Vivendi’s exposure to credit and liquidity risks As part of the strategic review undertaken by the Supervisory Board and Management Board, Vivendi announced in July 2013 its plans to sell its interests in Activision Blizzard and Maroc Telecom, and in November 2013, the group’s planned demerger to form two separate companies: (i) a media group and (ii) SFR, subject to information and consultation procedures with the relevant French employee representative bodies and approval by the relevant regulatory authorities, as well as, if appropriate, its approval by the General Shareholders' Meeting. In the meantime, Vivendi has pursued its financing policy in relation to expiring bank credit facilities or bonds. Thus, Vivendi early refinanced a €1.5 billion bank credit facility, maturing in May 2014 with a new bank credit facility for the same amount, maturing in March 2018, and issued a new €750 million bond, with a coupon of 2.375%, which early refinances the €894 million residual amount bond issued in January 2009 with a coupon of 7.75%, maturing in January 2014.
On October 11, 2013, Vivendi completed the sale of 88% of its interest in Activision Blizzard for $8.2 billion (€6 billion) in cash. Vivendi used cash on hand to early redeem most of its US dollar-denominated bonds, as well as a portion of its euro-denominated bonds, having the shortest maturity, for an aggregate amount of €3 billion (including $2.1 billion and €1.5 billion), either through a tender offer in October 2013 and a make-whole redemption in November 2013. In addition, Vivendi used the available balance to redeem drawn bank credit facilities. These transactions were as follows:
72% redemption of three US dollar-denominated bonds, following a tender offer: - $459 million redeemed on the $700 million bond, maturing in April 2018; - $541 million redeemed on the $800 million bond, maturing in April 2022; and - $555 million redeemed on the $650 million bond, maturing in January 2018.
early full redemption of one US dollar-denominated bond and two euro-denominated bonds: - $550 million, maturing in April 2015; - €500 million, maturing in November 2015; and - €1,000 million, maturing in July 2015.
In October 2013, Vivendi also redeemed, upon its contractual maturity date, a €700 million bond, refinanced in December 2012, by a bond for the same amount, maturing in January 2020, and cancelled SFR’s €1.2 billion bank credit facility.
Moreover, on November 5, 2013, Vivendi acquired the 20% non-controlling interest in Canal+ France held by Lagardère for €1,020 million, in cash.
Finally, on November 26, 2013, the Supervisory Board approved the group’s planned demerger to form two separate entities: (i) a media group and (ii) SFR. Subject to information and consultation procedures with the relevant French employee representative bodies and approval by the relevant regulatory authorities, it could be submitted, if appropriate, to the General Shareholders' Meeting for approval on June 24, 2014. The potential impacts of this demerger on the group’s financing structure will become effective if and when a final decision to implement such a transaction is taken.
Tuesday, February 25, 2014
Financial Report and Audited Consolidated Financial Statements for the Year Ended December 31, 2013 Vivendi /28
As of February 19, 2014, the date of the Management Board meeting that approved Vivendi’s Financial Statements for the year ended December 31, 2013:
Vivendi SA had available confirmed credit facilities in the aggregate amount of €7,140 million, of which €600 million was drawn. Given the amount of commercial paper issued at that date, and backed to bank credit facilities for €4,143 million, these facilities were available for an aggregate amount of €2,397 million; and
bonds amounted to €6.9 billion, following the redemption in January 2014 upon its contractual maturity, of the bond issued in January 2009, with a 7.75% coupon, for €894 million.
Moreover, on March 4, 2013, a letter of credit for €975 million was issued in connection with Vivendi’s appeal against the Liberty Media judgment. This off-balance sheet financial commitment has no impact on Vivendi’s net debt.
Contractual agreements in relation to credit facilities and letters of credit granted to Vivendi SA (notably the letter of credit issued in connection with the appeal against the Liberty Media judgment) do not include provisions that tie the conditions of the loan to its financial strength ratings from rating agencies. They contain customary provisions related to events of default and, at the end of each half-year, Vivendi SA is notably required to comply with a financial covenant (please refer to Note 23 to the Consolidated Financial Statements for the year ended December 31, 2013). The credit facilities granted to group companies other than Vivendi SA are intended to finance either the general needs of the borrowing subsidiary or a specific project.
After taking into account the proceeds from the sale of the 53% interest in Maroc Telecom group (€4.2 billion) expected during the first months of 2014, Vivendi’s adjusted Financial Net Debt would be approximately €6.9 billion (compared to €11.1 billion as of December 31, 2013 and €13.4 billion as of December 31, 2012).
a. “Other financial items” include commitments to purchase non-controlling interests, derivative financial instruments (assets and
liabilities), and cash deposits backed to borrowings.
b. Assuming the hypothesis that the sale of the 53% interest in Maroc Telecom group is completed during the first months of 2014 according to the financial terms known to date.
c. Following the sale of 88% of its interest in Activision Blizzard on October 11, 2013, Vivendi retained 83 million Activision Blizzard shares. This remaining ownership interest is subject to a staggered 15-month lock-up period, which is described in Note 7 to the Consolidated Financial Statements for the year ended December 31, 2013. Proceeds from the sale of these remaining shares are estimated at an aggregate amount of $1,480 million (€1,078 million), on the basis of $17.83 per share, Activision Blizzard’s share price on December 31, 2013.
Financial Net Debt as of December 31, 2013
As from June 30, 2013, in compliance with IFRS 5, Activision Blizzard and Maroc Telecom group have been reported until their effective sale, in Vivendi’s Consolidated Statement of Financial Position as discontinued businesses.
In practice, as of December 31, 2013, Maroc Telecom group’s assets and liabilities have been grouped under the specific lines “assets of discontinued businesses” and “liabilities associated with assets of discontinued businesses”. As of December 31, 2013, this accounting reclassification resulted in a €314 million decrease in Vivendi’s Financial Net Debt, which related to Maroc Telecom group’s Financial Net Debt as of that date.
(in millions of euros)
Cash and cash equivalents
Borrowings and other financial items (a)
Impact on Financial Net Debt
Financial Net Debt as of December 31, 2012 (3,894) 17,313 13,419
Outflows/(inflows) related to continuing operations:Operating activities (3,823) - (3,823)Investing activities (765) 76 (689)Financing activities 7,702 (4,598) 3,104
Foreign currency translation adjustments of continuing operations 48 (167) (119)Outflows/(inflows) related to continuing operations 3,162 (4,689) (1,527)
Outflows/(inflows) related to discontinued operations (705) 224 (481)Reclassification of Financial Net Debt from discontinued operations as of December 31, 2013 396 (710) (314)Change related to discontinued operations (309) (486) (795)
Financial Net Debt as of December 31, 2013 (1,041) 12,138 11,097
Expected proceeds from the sale of the 53% interest in Maroc Telecom group (b) (4,187)Financial Net Debt as of December 31, 2013 adjusted for the sale of Maroc Telecom Group 6,910Expected proceeds from the sale of the remaining ownership interest in Activision Blizzard (c) (1,078)Financial Net Debt as of December 31, 2013 adjusted for transactions in progress 5,832

Tuesday, February 25, 2014
Financial Report and Audited Consolidated Financial Statements for the Year Ended December 31, 2013 Vivendi /29
As of December 31, 2013:
Vivendi’s Financial Net Debt, in IFRS, amounted to €11,097 million. Borrowings and other financial liabilities amounted to €12,138 million (compared to €17,313 million as of December 31, 2012), a €5,175 million decrease. This change was due to the impact of the sale of Activision Blizzard (€6,044 million), net of divested cash (€3,349 million), and of Parlophone (€699 million), offset by the acquisition of Lagardère’s non-controlling interest in Canal+ France (€1,020 million);
the group’s bond debt amounted to €7,827 million (compared to €10,888 million as of December 31, 2012). This €3,061 million decrease was related to the early redemption of bonds ($2.1 billion and €1.5 billion) in the fourth quarter of 2013 following the sale of Activision Blizzard. The bond debt represented 64.1% of the borrowings in the group’s Statement of Financial Position (compared to 61.5% as of December 31, 2012);
the total amount of the group’s confirmed credit facilities amounted to €7,629 million (compared to €9,039 million as of December 31, 2012). The group’s aggregate amount of credit facilities neither drawn nor backed by commercial paper amounted to €3,648 million (compared to €3,361 million as of December 31, 2012);
Vivendi SA’s total confirmed credit facilities amounted to €7,140 million (unchanged compared to December 31, 2012) and included €2,600 million in available swinglines. All these credit facilities have a maturity greater than one year. These credit facilities were drawn for €1,655 million as of December 31, 2013. Considering the €1,906 million commercial paper issued as of that date and backed to bank credit facilities, these facilities were available up to a maximum amount of €3,579 million; and
the “economic” average term of the group’s debt was 4.2 years as of December 31, 2013 (compared to 4.4 years as of December 31, 2012).
5.2 Financial Net Debt changes As of December 31, 2013, Vivendi’s Financial Net Debt amounted to €11,097 million (compared to €13,419 million as of December 31, 2012), a €2,322 million decrease.
This change notably reflected:
proceeds received on October 11, 2013 with respect to the sale of Vivendi’s interest in Activision Blizzard (€6,044 million), net of divested cash (€3,349 million);
the cash provided by operating activities of continuing operations910(€3,823 million);
the proceeds from the sale by UMG of Parlophone and other labels (€699 million);
the capital increase subscribed for by employees in connection with Vivendi SA’s employee stock purchase plan in July 2013 (€149 million); and
the accounting reclassification of Maroc Telecom group’s Financial Net Debt as of December 31, 2013 (€314 million),
partially offset by:
cash payments related to capital expenditures of continuing operations9 (€2,624 million, of which €1,610 million for SFR and €769 million for GVT);
cash payments related to dividends paid to Vivendi SA shareowners (€1,325 million);
the acquisition of Lagardère’s non-controlling interest in Canal+ France (€1,020 million); and
cash payments related to financial activities (€877 million, of which €528 million of interest paid and €182 million of premium paid as part of the early redemption of bonds, denominated in US dollars and in euros).
9 Continuing operations relate to Canal+ Group, Universal Music Group, GVT, SFR, other operations of the group, as well as Holding & Corporate.
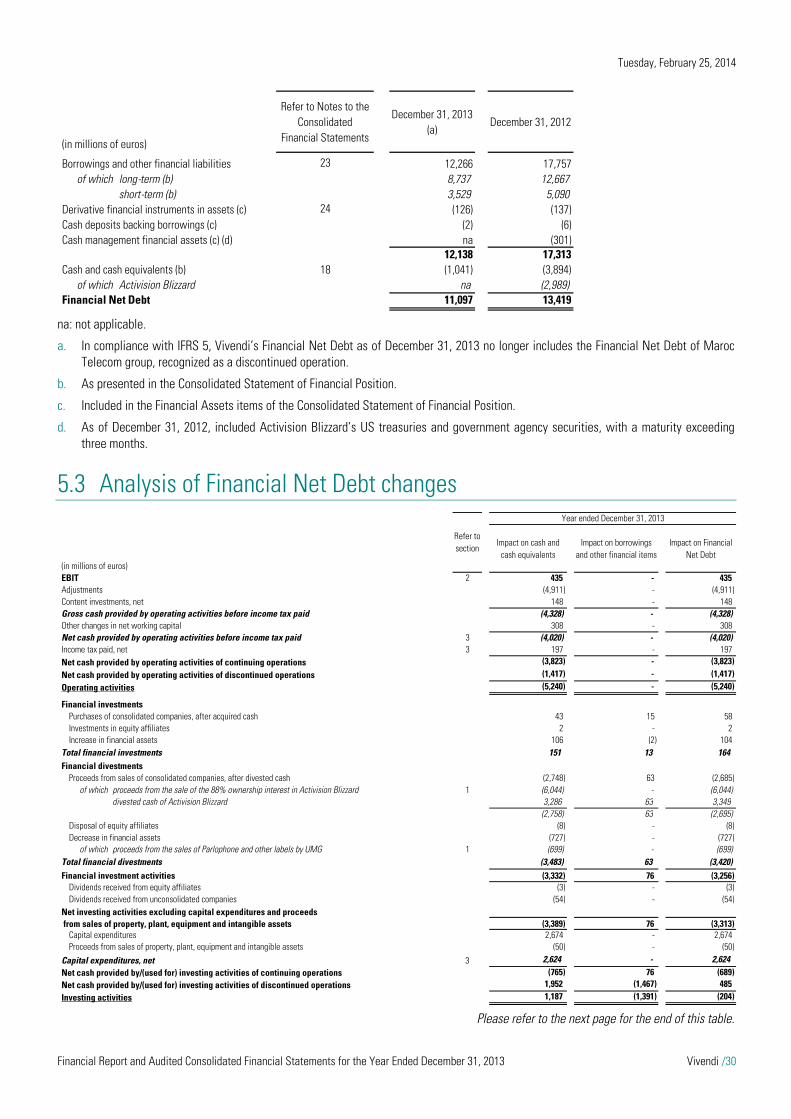
Tuesday, February 25, 2014
Financial Report and Audited Consolidated Financial Statements for the Year Ended December 31, 2013 Vivendi /30
na: not applicable.
a. In compliance with IFRS 5, Vivendi’s Financial Net Debt as of December 31, 2013 no longer includes the Financial Net Debt of Maroc Telecom group, recognized as a discontinued operation.
b. As presented in the Consolidated Statement of Financial Position.
c. Included in the Financial Assets items of the Consolidated Statement of Financial Position.
d. As of December 31, 2012, included Activision Blizzard’s US treasuries and government agency securities, with a maturity exceeding three months.
5.3 Analysis of Financial Net Debt changes
Please refer to the next page for the end of this table.
(in millions of euros)
Refer to Notes to the Consolidated
Financial Statements
December 31, 2013(a)
December 31, 2012
Borrowings and other financial liabilities 23 12,266 17,757of which long-term (b) 8,737 12,667
short-term (b) 3,529 5,090Derivative financial instruments in assets (c) 24 (126) (137)Cash deposits backing borrowings (c) (2) (6)Cash management financial assets (c) (d) na (301)
12,138 17,313Cash and cash equivalents (b) 18 (1,041) (3,894)
of which Activision Blizzard na (2,989)Financial Net Debt 11,097 13,419
(in millions of euros)
Impact on cash and cash equivalents
Impact on borrowings and other financial items
Impact on Financial Net Debt
EBIT 2 435 - 435Adjustments (4,911) - (4,911)Content investments, net 148 - 148Gross cash provided by operating activities before income tax paid (4,328) - (4,328)Other changes in net working capital 308 - 308Net cash provided by operating activities before income tax paid 3 (4,020) - (4,020)Income tax paid, net 3 197 - 197Net cash provided by operating activities of continuing operations (3,823) - (3,823)Net cash provided by operating activities of discontinued operations (1,417) - (1,417)Operating activities A (5,240) - (5,240)
Financial investmentsPurchases of consolidated companies, after acquired cash 43 15 58Investments in equity affiliates 2 - 2Increase in financial assets 106 (2) 104
Total financial investments 151 13 164Financial divestments
Proceeds from sales of consolidated companies, after divested cash (2,748) 63 (2,685)of which proceeds from the sale of the 88% ownership interest in Activision Blizzard 1 (6,044) - (6,044)
divested cash of Activision Blizzard 3,286 63 3,349(2,758) 63 (2,695)
Disposal of equity affiliates (8) - (8)Decrease in financial assets (727) - (727)
of which proceeds from the sales of Parlophone and other labels by UMG 1 (699) - (699)Total financial divestments (3,483) 63 (3,420)Financial investment activities (3,332) 76 (3,256)
Dividends received from equity affiliates (3) - (3)Dividends received from unconsolidated companies (54) - (54)
(3,389) 76 (3,313)Capital expenditures 2,674 - 2,674Proceeds from sales of property, plant, equipment and intangible assets (50) - (50)
Capital expenditures, net 3 2,624 - 2,624Net cash provided by/(used for) investing activities of continuing operations (765) 76 (689)Net cash provided by/(used for) investing activities of discontinued operations 1,952 (1,467) 485Investing activities B 1,187 (1,391) (204)
from sales of property, plant, equipment and intangible assets
Year ended December 31, 2013
Refer to section
Net investing activities excluding capital expenditures and proceeds

Tuesday, February 25, 2014
Financial Report and Audited Consolidated Financial Statements for the Year Ended December 31, 2013 Vivendi /31
Continued from previous page.
5.4 Changes in financings Financings put into place
On March 28, 2013, Vivendi completed the early refinancing of a €1.5 billion bank credit facility maturing in May 2014 by entering into a new bank credit facility for the same amount with a five-year maturity.
On July 9, 2013, Vivendi issued a €750 million bond, maturing in January 2019, with a 2.375% coupon, and an effective rate of 2.51%. This transaction enabled the refinancing of the bond issued in January 2009, with a 7.75% coupon redeemed in January 2014.
Redemptions
72% redemption of three US dollar-denominated bonds, following a tender offer, in October 2013: - $459 million redeemed on the $700 million bond, maturing in April 2018; - $541 million redeemed on the $800 million bond, maturing in April 2022; and - $555 million redeemed on the $650 million bond, maturing in January 2018.
early full redemption of one US dollar-denominated bond and two euro-denominated bonds, in November 2013: - $550 million, maturing in April 2015; - €500 million, maturing in November 2015; and - €1,000 million, maturing in July 2015.
redemption in October 2013, upon its contractual maturity, of a €700 million bond, refinanced in December 2012, by a bond for the same amount, maturing in January 2020; and
cancellation of SFR’s €1.2 billion bank credit facility in October 2013.
For a detailed analysis of the bonds and bank credit facilities as of December 31, 2013 (please refer to Note 23 to the Consolidated Financial Statements for the year ended December 31, 2013).
(in millions of euros)
Impact on cash and cash equivalents
Impact on borrowings and other financial items
Impact on Financial Net Debt
Transactions with shareownersNet proceeds from issuance of common shares in connection with Vivendi SA's share-based compensation plans (195) - (195)
of which capital increase subscribed by employees in connection with the stock purchase plan (149) - (149)exercise of stock options by executive management and employees (46) - (46)
(Sales)/purchases of Vivendi SA's treasury shares - - -Dividends paid by Vivendi SA (€1 per share) 1 1,325 - 1,325Other transactions with shareowners 1,046 - 1,046
of which acquisition of Lagadère Group's non-controlling interest in Canal+ France 1 1,020 - 1,020Dividends paid by consolidated companies to their non-controlling interests 1 37 - 37
Total transactions with shareowners 2,213 - 2,213
Transactions on borrowings and other financial liabilitiesSetting up of long-term borrowings and increase in other long-term financial liabilities 5.4 (2,491) 2,491 -
of which bank credit facilities (1,655) 1,655 -bonds (750) 750 -
Principal payments on long-term borrowings and decrease in other long-term financial liabilities 5.4 1,923 (1,923) -of which bank credit facilities 1,894 (1,894) -
Principal payments on short-term borrowings 5.4 5,211 (5,211) -of which bonds 3,736 (3,736) -
commercial paper 1,349 (1,349) -Other changes in short-term borrowings and other financial liabilities (31) 31 -Non-cash transactions - 14 14Interest paid, net 3 528 - 528Other cash items related to financial activities 3 349 - 349Total transactions on borrowings and other financial liabilities 5,489 (4,598) 891
Net cash provided by/(used for) financing activities of continuing operations 7,702 (4,598) 3,104Net cash provided by/(used for) financing activities of discontinued operations (1,284) 1,696 412Financing activities C 6,418 (2,902) 3,516
Foreign currency translation adjustments of continuing operations D 48 (167) (119)Foreign currency translation adjustments of discontinued operations E 44 (5) 39Reclassification of Financial Net Debt from discontinued operations F 396 (710) (314)
Change in Financial Net Debt A+B+C+D+E+F 2,853 (5,175) (2,322)
Refer to section
Year ended December 31, 2013

Tuesday, February 25, 2014
Financial Report and Audited Consolidated Financial Statements for the Year Ended December 31, 2013 Vivendi /32
6 Forward looking statements Cautionary note
This Financial Report contains forward-looking statements with respect to Vivendi’s financial condition, results of operations, business, strategy, plans, and outlook of Vivendi, including the impact of certain transactions. Although Vivendi believes that such forward-looking statements are based on reasonable assumptions, such statements are not guarantees of future performance. Actual results may differ materially from the forward-looking statements as a result of a number of risks and uncertainties, many of which are outside Vivendi’s control, including, but not limited to, the risks related to antitrust and other regulatory approvals as well as any other approvals which may be required in connection with certain transactions and the risks described in the documents of the group filed with the Autorité des Marchés Financiers (AMF) (the French securities regulator), which are also available in English on Vivendi’s website (www.vivendi.com). Accordingly, we caution you against relying on forward looking statements. These forward-looking statements are made as of the date of this Financial Report. Vivendi disclaims any intention or obligation to provide, update or revise any forward-looking statements, whether as a result of new information, future events or otherwise.
7 Other Disclaimers Unsponsored ADRs
Vivendi does not sponsor an American Depositary Receipt (ADR) facility in respect of its shares. Any ADR facility currently in existence is “unsponsored” and has no ties whatsoever to Vivendi. Vivendi disclaims any liability in respect of any such facility.
Translation
This Financial Report is an English translation of the French version of the report and is provided for informational purposes only. This translation is qualified in its entirety by the French version, which is available on the company’s website (www.vivendi.com). In the event of any inconsistencies between the French version of this Financial Report and the English translation, the French version will prevail.
Tuesday, February 25, 2014
Financial Report and Audited Consolidated Financial Statements for the Year Ended December 31, 2013 Vivendi /33
II - Appendices to the Financial Report: Unaudited supplementary financial data
1. EBITA (Adjusted Earnings Before Interest and Income Taxes) and adjusted net income
Vivendi considers EBITA (Adjusted Earnings Before Interest and Income Taxes) and adjusted net income, non-GAAP measures, to be relevant indicators of the group’s operating and financial performance. Vivendi Management uses EBITA and adjusted net income because they illustrate the underlying performance of continuing operations more effectively by excluding most non-recurring and non-operating items. EBITA and adjusted net income are defined in Note 1.2.3 to the Consolidated Financial Statements for the year ended December 31, 2013.
Adjustment of comparative information
As from the second quarter of 2013, in compliance with IFRS 5, Activision Blizzard and Maroc Telecom group have been reported in Vivendi’s Consolidated Statement of Earnings as discontinued operations. In practice, income and charges from these two businesses have been reported as follows:
- their contribution until the effective sale, if any, to each line of Vivendi’s Consolidated Statement of Earnings (before non-controlling interests) has been grouped under the line “Earnings from discontinued operations”; and
- their share of net income has been excluded from Vivendi’s adjusted net income.
Moreover, as of January 1, 2013, Vivendi applied, with retrospective effect from January 1, 2012, amended IAS 19, whose application is mandatory in the European Union beginning on or after January 1, 2013 (please refer to Note 1 to the Consolidated Financial Statements for the year ended December 31, 2013).
As a result, the 2012 Financial Statements and the first quarter of 2013 Financial Statements were adjusted, as the case may be, as presented below:

Tuesday, February 25, 2014
Financial Report and Audited Consolidated Financial Statements for the Year Ended December 31, 2013 Vivendi /34
na: not applicable.
Reconciliation of earnings attributable to Vivendi SA shareowners to adjusted net income
a. As reported in the Consolidated Statement of Earnings.
2012
(in millions of euros, except per share amounts)
Three months ended March 31,
Three months ended June 30,
Six months ended June 30,
Three months ended September
30,
Adjusted earnings before interest and income taxes (EBITA) (as previously published) 1,621 1,316 2,937 1,394
Reclassifications related to the application of IFRS 5 for Activision Blizzard - 395 - 177 - 572 - 182Reclassifications related to the application of IFRS 5 for Maroc Telecom Group - 273 - 190 - 463 - 266Adjustments related to the application of amended IAS 19
Selling, general and administrative expenses + 2 + 2 + 4 + 2
Adjusted earnings before interest and income taxes (EBITA) (restated) 955 951 1,906 948
Adjusted net income (as previously published) 823 706 1,529 665Reclassifications related to the application of IFRS 5 - 272 - 134 - 406 - 194Adjustments related to the application of amended IAS 19
Selling, general and administrative expenses + 2 + 2 + 4 + 2Provision for income taxes - - - -
Adjusted net income (restated) 553 574 1,127 473
Adjusted net income per share (as previously published) 0.64 0.55 1.19 0.51Adjusted net income per share (restated) 0.43 0.45 0.88 0.36
2012 2013
(in millions of euros, except per share amounts)
Nine months ended September
30,
Three months ended December
31,
Year ended December 31,
Three months ended March 31,
Adjusted earnings before interest and income taxes (EBITA) (as previously published) 4,331 952 5,283 1,344
Reclassifications related to the application of IFRS 5 for Activision Blizzard - 754 - 395 - 1,149 - 442Reclassifications related to the application of IFRS 5 for Maroc Telecom Group - 729 - 259 - 988 - 273Adjustments related to the application of amended IAS 19
Selling, general and administrative expenses + 6 + 11 + 17 na
Adjusted earnings before interest and income taxes (EBITA) (restated) 2,854 309 3,163 629
Adjusted net income (as previously published) 2,194 356 2,550 672Reclassifications related to the application of IFRS 5 - 600 - 259 - 859 - 306Adjustments related to the application of amended IAS 19
Selling, general and administrative expenses + 6 + 11 + 17 naProvision for income taxes - - 3 - 3 na
Adjusted net income (restated) 1,600 105 1,705 366
Adjusted net income per share (as previously published) 1.70 0.27 1.96 0.51Adjusted net income per share (restated) 1.24 0.08 1.31 0.28
Year ended December 31,(in millions of euros) 2013 2012
Earnings attributable to Vivendi SA shareowners (a) 1,967 179AdjustmentsAmortization of intangible assets acquired through business combinations 462 436Impairment losses on intangible assets acquired through business combinations (a) 2,437 760Reserve accrual related to the Liberty Media Corporation litigation in the United States (a) - 945Other income (a) (88) (19)Other charges (a) 57 236Other financial income (a) (51) (37)Other financial charges (a) 561 204Earnings from discontinued operations (a) (4,635) (1,505)
of which capital gain on the divestiture of Activision Blizzard (2,915) -Change in deferred tax asset related to Vivendi SA's French Tax Group and to the Consolidated Global Profit Tax Systems 161 48Non-recurring items related to provision for income taxes 194 (25)Provision for income taxes on adjustments (220) (185)Non-controlling interests on adjustments 695 668
Adjusted net income 1,540 1,705

Tuesday, February 25, 2014
Financial Report and Audited Consolidated Financial Statements for the Year Ended December 31, 2013 Vivendi /35
Adjusted net income per share
a. Net of treasury shares (please refer to Note 19 to the Consolidated Financial Statements for the year ended December 31, 2013).
b. Does not include accretive instruments as of December 31, 2013 and December 31, 2012 which could potentially become dilutive. The balance of common shares in connection with Vivendi SA’s share based compensation plan is presented in Note 22.2.2 to the Consolidated Financial Statements for the year ended December 31, 2013.
2. Revenues and EBITA by business segment - 2013 and 2012 quarterly data Preliminary comments:
As from the second quarter of 2013, in compliance with IFRS 5, Activision Blizzard and Maroc Telecom group have been reported in Vivendi’s Consolidated Statement of Earnings as discontinued operations. In practice, income and charges from these two businesses have been reported as follows: - their contribution until their effective sale, if any, to each line of Vivendi’s Consolidated Statement of Earnings (before non-
controlling interests) has been grouped under the line “Earnings from discontinued operations”; - in accordance with IFRS 5, these adjustments have been applied to all periods presented to ensure consistency of information; and - their share of net income has been excluded from Vivendi’s adjusted net income.
Data presented below also takes into account the consolidation of the following entities as from the indicated dates: - at Canal+ Group: D8 and D17 (September 27, 2012) and “n” (November 30, 2012); and - at Universal Music Group: EMI Recorded Music (September 28, 2012).
Moreover, as of January 1, 2013, Vivendi applied, with retrospective effect from January 1, 2012, amended IAS 19, whose application is mandatory in the European Union beginning on or after January 1, 2013 (please refer to Note 1 to the Consolidated Financial Statements for the year ended December 31, 2013). As a result, the 2012 Financial Statements, notably EBITA, were adjusted in accordance with the new standard.
Please refer to Appendix 1 of this Financial Report for a presentation of the adjustments made on the data previously published.
Basic Diluted Basic Diluted
Adjusted net income (in millions of euros) 1,540 1,540 1,705 1,705
Number of shares (in millions)Weighted average number of shares outstanding (a) 1,330.6 1,330.6 1,298.9 1,298.9Potential dilutive effects related to share-based compensation (b) - 4.7 - 3.5Adjusted weighted average number of shares 1,330.6 1,335.3 1,298.9 1,302.4
Adjusted net income per share (in euros) 1.16 1.15 1.31 1.31
Year ended December 31,2013 2012

Tuesday, February 25, 2014
Financial Report and Audited Consolidated Financial Statements for the Year Ended December 31, 2013 Vivendi /36
2013
(in millions of euros)1st Quarter ended
March 312nd Quarter ended
June 303rd Quarter ended
Sept. 304th Quarter ended
Dec. 31RevenuesCanal+ Group 1,286 1,314 1,257 1,454Universal Music Group 1,091 1,145 1,162 1,488GVT 438 446 413 412Other 16 17 18 21Elimination of intersegment transactions (5) (3) (5) (4)
Media & Content 2,826 2,919 2,845 3,371
SFR 2,594 2,514 2,508 2,583Elimination of intersegment transactions related to SFR (5) (6) (5) (9)
Total Vivendi 5,415 5,427 5,348 5,945
EBITACanal+ Group 183 247 217 (36)Universal Music Group 55 88 112 256GVT 99 97 102 107Other (14) (23) (21) (22)Holding & Corporate (22) (25) (14) (26)
Media & Content 301 384 396 279
SFR 328 378 334 33
Total Vivendi 629 762 730 312
2012
(in millions of euros)1st Quarter ended
March 312nd Quarter ended
June 303rd Quarter ended
Sept. 304th Quarter ended
Dec. 31RevenuesCanal+ Group 1,232 1,238 1,177 1,366Universal Music Group 961 961 981 1,641GVT 432 421 429 434Other 15 15 17 19Elimination of intersegment transactions (6) (9) (5) (6)
Media & Content 2,634 2,626 2,599 3,454
SFR 2,927 2,834 2,747 2,780Elimination of intersegment transactions related to SFR (5) (8) (7) (4)
Total Vivendi 5,556 5,452 5,339 6,230
EBITACanal+ Group 236 247 239 (59)Universal Music Group 68 88 82 288GVT 116 107 118 147Other (3) (2) (3) (6)Holding & Corporate (23) (41) (25) (11)
Media & Content 394 399 411 359
SFR 561 552 537 (50)
Total Vivendi 955 951 948 309

Tuesday, February 25, 2014
Financial Report and Audited Consolidated Financial Statements for the Year Ended December 31, 2013 Vivendi /37
Intentionally left blank.

Tuesday, February 25, 2014
Financial Report and Audited Consolidated Financial Statements for the Year Ended December 31, 2013 Vivendi /38
III - Consolidated Financial Statements for the year ended December 31, 2013
Statutory Auditors’ report on the Consolidated Financial Statements
To the Shareholders,
In compliance with the assignment entrusted to us by your Annual General Shareholders’ Meetings, we hereby report to you for the year ended December 31, 2013 on:
the audit of the accompanying Consolidated Financial Statements of Vivendi, hereinafter referred to as “the Company”;
the justification of our assessments; and
the specific verifications required by law.
These Consolidated Financial Statements have been approved by your Management Board. Our role is to express an opinion on the financial statements, based on our audit.
I. Opinion on the Consolidated Financial Statements
We conducted our audit in accordance with professional standards applicable in France; those standards require that we plan and perform the audit to obtain reasonable assurance about whether the Consolidated Financial Statements are free of material misstatement. An audit involves performing procedures, using sampling techniques or other methods of selection, to obtain audit evidence about the amounts and disclosures in the Consolidated Financial Statements. An audit also includes evaluating the appropriateness of accounting policies used and the reasonableness of significant accounting estimates made, as well as the overall presentation of the Consolidated Financial Statements. We believe that the audit evidence we have obtained is sufficient and appropriate to provide a basis for our audit opinion.
In our opinion, the Consolidated Financial Statements give a true and fair view of the assets and liabilities and of the results of its operations for the year then ended in accordance with International Financial Reporting Standards as adopted by the European Union.
II. Justification of our assessments
In accordance with the requirements of Article L.823-9 of the French Commercial Code (Code de Commerce) relating to the justification of our assessments, we draw your attention to the following matters:
In connection with our assessment of the accounting principles applied by your Company:
Note 1.3.6 to theConsolidated Financial Statements describes the applicable criteria for classification and accounting for discontinued operations or assets held for sale in accordance with IFRS 5. We verified the correct application of this accounting principle and we ensured that Notes 2.1 and 7 to the Consolidated Financial Statements provide appropriate disclosures with respect to management’s position as of December 31, 2013.
At each financial year end, your Company systematically performs impairment tests of goodwill and assets with indefinite useful lives, and also assesses whether there is any indication of impairment of other tangible and intangible assets, according to the methods described in Note 1.3.5.7 to the Consolidated Financial Statements. We examined the methods used to perform these impairment tests, as well as the main assumptions and estimates, and ensured that Notes 1.3.5.7 and 10 to the Consolidated Financial Statements provide appropriate disclosures thereon.
Note 1.3.9 to the Consolidated Financial Statements describes the accounting principles applicable to deferred tax and note 1.3.8 describes the methods used to assess and recognize provisions. We verified the correct application of these accounting principles and also examined the assumptions underlying the positions as of December 31, 2013. We ensured Note 6 to the Consolidated Financial Statements gives appropriate information on tax assets and liabilities and on your company’s tax positions.
Notes 1.3.8 and 28 to the Consolidated Financial Statements describe the methods used to assess and recognize provisions for litigation. We examined the methods used within your group to identify, calculate, and determine the accounting for such litigation. We also examined the assumptions and data underlying the estimates made by the Company. As stated in Note 1.3.1 to the Consolidated Financial Statements, facts and circumstances may lead to changes in estimates and assumptions which could have an impact upon the reported amount of provisions.
Tuesday, February 25, 2014
Financial Report and Audited Consolidated Financial Statements for the Year Ended December 31, 2013 Vivendi /39
Our assessments were made as part of our audit of the Consolidated Financial Statements taken as a whole, and therefore contributed to the opinion we formed which is expressed in the first part of this report.
III. Specific verifications
We have also verified, in accordance with professional standard applicable in France, the information provided in the group management report, as required by law.
We have no matters to report as its fair presentation and its conformity with the Consolidated Financial Statements.
Paris-La Défense, February 25, 2014
The Statutory Auditors
KPMG Audit Département de KPMG S.A.
ERNST & YOUNG ET AUTRES
Frédéric Quélin
Jean-Yves Jégourel
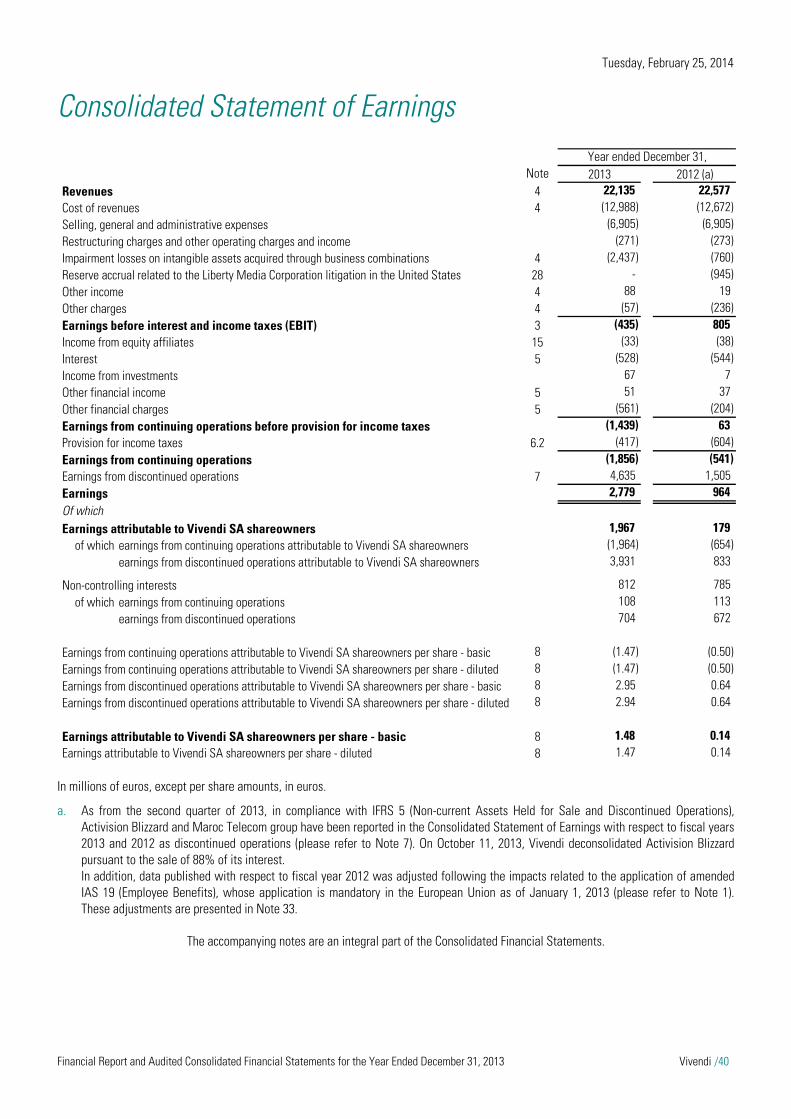
Tuesday, February 25, 2014
Financial Report and Audited Consolidated Financial Statements for the Year Ended December 31, 2013 Vivendi /40
Consolidated Statement of Earnings
In millions of euros, except per share amounts, in euros.
a. As from the second quarter of 2013, in compliance with IFRS 5 (Non-current Assets Held for Sale and Discontinued Operations), Activision Blizzard and Maroc Telecom group have been reported in the Consolidated Statement of Earnings with respect to fiscal years 2013 and 2012 as discontinued operations (please refer to Note 7). On October 11, 2013, Vivendi deconsolidated Activision Blizzard pursuant to the sale of 88% of its interest. In addition, data published with respect to fiscal year 2012 was adjusted following the impacts related to the application of amended IAS 19 (Employee Benefits), whose application is mandatory in the European Union as of January 1, 2013 (please refer to Note 1). These adjustments are presented in Note 33.
The accompanying notes are an integral part of the Consolidated Financial Statements.
Year ended December 31,Note 2013 2012 (a)
Revenues 4 22,135 22,577Cost of revenues 4 (12,988) (12,672)Selling, general and administrative expenses (6,905) (6,905)Restructuring charges and other operating charges and income (271) (273)Impairment losses on intangible assets acquired through business combinations 4 (2,437) (760)Reserve accrual related to the Liberty Media Corporation litigation in the United States 28 - (945)Other income 4 88 19Other charges 4 (57) (236)Earnings before interest and income taxes (EBIT) 3 (435) 805Income from equity affiliates 15 (33) (38)Interest 5 (528) (544)Income from investments 67 7Other financial income 5 51 37Other financial charges 5 (561) (204)Earnings from continuing operations before provision for income taxes (1,439) 63Provision for income taxes 6.2 (417) (604)Earnings from continuing operations (1,856) (541)Earnings from discontinued operations 7 4,635 1,505Earnings 2,779 964Of whichEarnings attributable to Vivendi SA shareowners 1,967 179
of which earnings from continuing operations attributable to Vivendi SA shareowners (1,964) (654)earnings from discontinued operations attributable to Vivendi SA shareowners 3,931 833
Non-controlling interests 812 785of which earnings from continuing operations 108 113
earnings from discontinued operations 704 672
Earnings from continuing operations attributable to Vivendi SA shareowners per share - basic 8 (1.47) (0.50)Earnings from continuing operations attributable to Vivendi SA shareowners per share - diluted 8 (1.47) (0.50)Earnings from discontinued operations attributable to Vivendi SA shareowners per share - basic 8 2.95 0.64Earnings from discontinued operations attributable to Vivendi SA shareowners per share - diluted 8 2.94 0.64
Earnings attributable to Vivendi SA shareowners per share - basic 8 1.48 0.14Earnings attributable to Vivendi SA shareowners per share - diluted 8 1.47 0.14
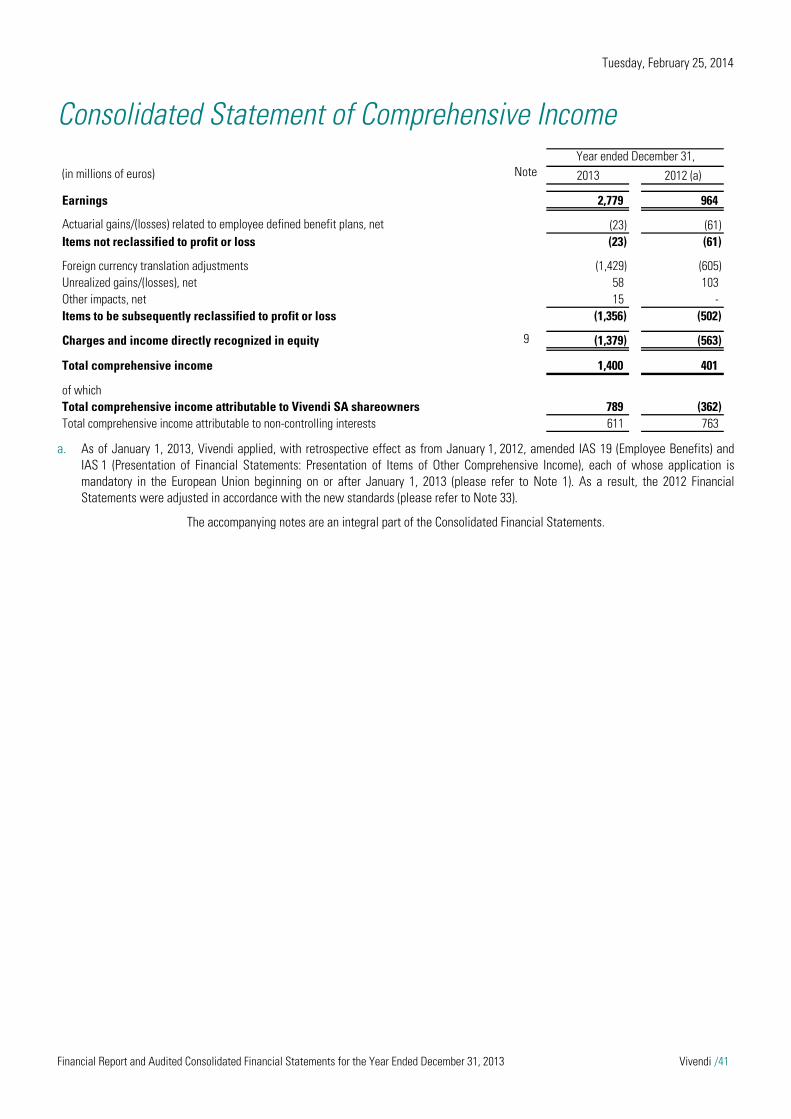
Tuesday, February 25, 2014
Financial Report and Audited Consolidated Financial Statements for the Year Ended December 31, 2013 Vivendi /41
Consolidated Statement of Comprehensive Income
a. As of January 1, 2013, Vivendi applied, with retrospective effect as from January 1, 2012, amended IAS 19 (Employee Benefits) and IAS 1 (Presentation of Financial Statements: Presentation of Items of Other Comprehensive Income), each of whose application is mandatory in the European Union beginning on or after January 1, 2013 (please refer to Note 1). As a result, the 2012 Financial Statements were adjusted in accordance with the new standards (please refer to Note 33).
The accompanying notes are an integral part of the Consolidated Financial Statements.
Year ended December 31,(in millions of euros) Note 2013 2012 (a)
Earnings 2,779 964
Actuarial gains/(losses) related to employee defined benefit plans, net (23) (61)Items not reclassified to profit or loss (23) (61)
Foreign currency translation adjustments (1,429) (605)Unrealized gains/(losses), net 58 103Other impacts, net 15 -Items to be subsequently reclassified to profit or loss (1,356) (502)
Charges and income directly recognized in equity 9 (1,379) (563)
Total comprehensive income 1,400 401
of whichTotal comprehensive income attributable to Vivendi SA shareowners 789 (362)Total comprehensive income attributable to non-controlling interests 611 763
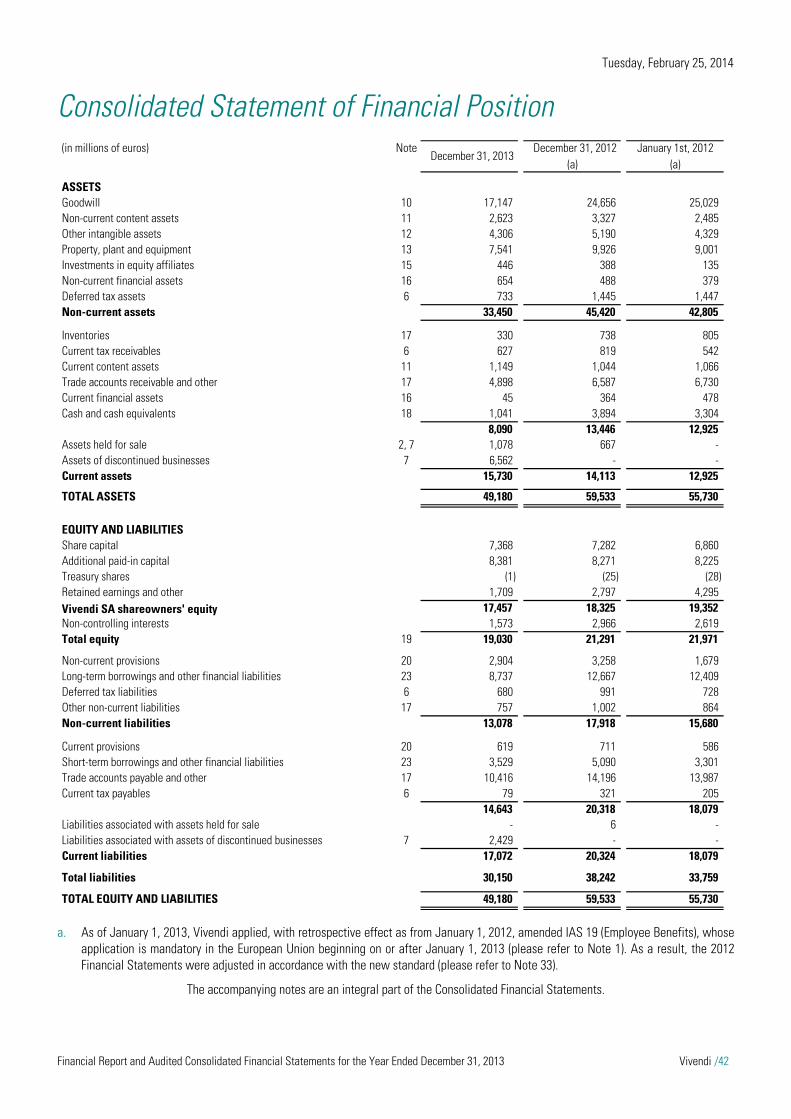
Tuesday, February 25, 2014
Financial Report and Audited Consolidated Financial Statements for the Year Ended December 31, 2013 Vivendi /42
Consolidated Statement of Financial Position
a. As of January 1, 2013, Vivendi applied, with retrospective effect as from January 1, 2012, amended IAS 19 (Employee Benefits), whose application is mandatory in the European Union beginning on or after January 1, 2013 (please refer to Note 1). As a result, the 2012 Financial Statements were adjusted in accordance with the new standard (please refer to Note 33).
The accompanying notes are an integral part of the Consolidated Financial Statements.
(in millions of euros) Note December 31, 2012 January 1st, 2012(a) (a)
ASSETSGoodwill 10 17,147 24,656 25,029Non-current content assets 11 2,623 3,327 2,485Other intangible assets 12 4,306 5,190 4,329Property, plant and equipment 13 7,541 9,926 9,001Investments in equity affiliates 15 446 388 135Non-current financial assets 16 654 488 379Deferred tax assets 6 733 1,445 1,447Non-current assets 33,450 45,420 42,805
Inventories 17 330 738 805Current tax receivables 6 627 819 542Current content assets 11 1,149 1,044 1,066Trade accounts receivable and other 17 4,898 6,587 6,730Current financial assets 16 45 364 478Cash and cash equivalents 18 1,041 3,894 3,304
8,090 13,446 12,925Assets held for sale 2, 7 1,078 667 -Assets of discontinued businesses 7 6,562 - -Current assets 15,730 14,113 12,925
TOTAL ASSETS 49,180 59,533 55,730
EQUITY AND LIABILITIESShare capital 7,368 7,282 6,860Additional paid-in capital 8,381 8,271 8,225Treasury shares (1) (25) (28)Retained earnings and other 1,709 2,797 4,295Vivendi SA shareowners' equity 17,457 18,325 19,352Non-controlling interests 1,573 2,966 2,619Total equity 19 19,030 21,291 21,971
Non-current provisions 20 2,904 3,258 1,679Long-term borrowings and other financial liabilities 23 8,737 12,667 12,409Deferred tax liabilities 6 680 991 728Other non-current liabilities 17 757 1,002 864Non-current liabilities 13,078 17,918 15,680
Current provisions 20 619 711 586Short-term borrowings and other financial liabilities 23 3,529 5,090 3,301Trade accounts payable and other 17 10,416 14,196 13,987Current tax payables 6 79 321 205
14,643 20,318 18,079Liabilities associated with assets held for sale 2, 7 - 6 -Liabilities associated with assets of discontinued businesses 7 2,429 - -Current liabilities 17,072 20,324 18,079
Total liabilities 30,150 38,242 33,759
TOTAL EQUITY AND LIABILITIES 49,180 59,533 55,730
December 31, 2013

Tuesday, February 25, 2014
Financial Report and Audited Consolidated Financial Statements for the Year Ended December 31, 2013 Vivendi /43
Consolidated Statement of Cash Flows
a. As from the second quarter of 2013, in compliance with IFRS 5, Activision Blizzard and Maroc Telecom group have been reported in the
Consolidated Statement of Cash Flows with respect to fiscal years 2013 and 2012 as discontinued operations (please refer to Note 7). On October 11, 2013, Vivendi deconsolidated Activision Blizzard pursuant to the sale of 88% of its interest. In addition, data published with respect to fiscal year 2012 has been adjusted following the impacts related to the application of amended IAS 19, whose application is mandatory in the European Union as of January 1, 2013 (please refer to Note 1). These adjustments are presented in Note 33.
The accompanying notes are an integral part of the Consolidated Financial Statements.
Year ended December 31,(in millions of euros) Note 2013 2012 (a)
Operating activitiesEBIT 3 (435) 805Adjustments 25 4,911 4,456Content investments, net (148) (145)Gross cash provided by operating activities before income tax paid 4,328 5,116Other changes in net working capital 17 (308) 69Net cash provided by operating activities before income tax paid 4,020 5,185Income tax paid, net 6.3 (197) (353)Net cash provided by operating activities of continuing operations 3,823 4,832 Net cash provided by operating activities of discontinued operations 7 1,417 2,274 Net cash provided by operating activities 5,240 7,106
Investing activitiesCapital expenditures 3 (2,674) (3,999)Purchases of consolidated companies, after acquired cash 2 (43) (1,374)Investments in equity affiliates 15 (2) (322)Increase in financial assets 16 (106) (35)Investments (2,825) (5,730)Proceeds from sales of property, plant, equipment and intangible assets 3 50 23Proceeds from sales of consolidated companies, after divested cash 7 2,748 13Disposal of equity affiliates 15 8 11Decrease in financial assets 16 727 180Divestitures 3,533 227Dividends received from equity affiliates 3 3Dividends received from unconsolidated companies 54 1Net cash provided by/(used for) investing activities of continuing operations 765 (5,499)Net cash provided by/(used for) investing activities of discontinued operations 7 (1,952) (543)Net cash provided by/(used for) investing activities (1,187) (6,042)
Financing activitiesNet proceeds from issuance of common shares in connection with Vivendi SA's share-based compensation plans 22 195 131Sales/(purchases) of Vivendi SA's treasury shares - (18)Dividends paid by Vivendi SA to its shareowners 19 (1,325) (1,245)Other transactions with shareowners 2 (1,046) (1)Dividends paid by consolidated companies to their non-controlling interests (37) (33)Transactions with shareowners (2,213) (1,166)Setting up of long-term borrowings and increase in other long-term financial liabilities 23 2,491 5,833Principal payment on long-term borrowings and decrease in other long-term financial liabilities 23 (1,923) (4,211)Principal payment on short-term borrowings 23 (5,211) (2,494)
Other changes in short-term borrowings and other financial liabilities 23 31 2,808Interest paid, net 5 (528) (544)Other cash items related to financial activities (349) (96)Transactions on borrowings and other financial liabilities (5,489) 1,296Net cash provided by/(used for) financing activities of continuing operations (7,702) 130Net cash provided by/(used for) financing activities of discontinued operations 7 1,284 (557)Net cash provided by/(used for) financing activities (6,418) (427)
Foreign currency translation adjustments of continuing operations (48) (29)Foreign currency translation adjustments of discontinued operations 7 (44) (18)
Change in cash and cash equivalents (2,457) 590Reclassification of discontinued operations' cash and cash equivalents 7 (396) -
Cash and cash equivalentsAt beginning of the period 18 3,894 3,304
At end of the period 18 1,041 3,894
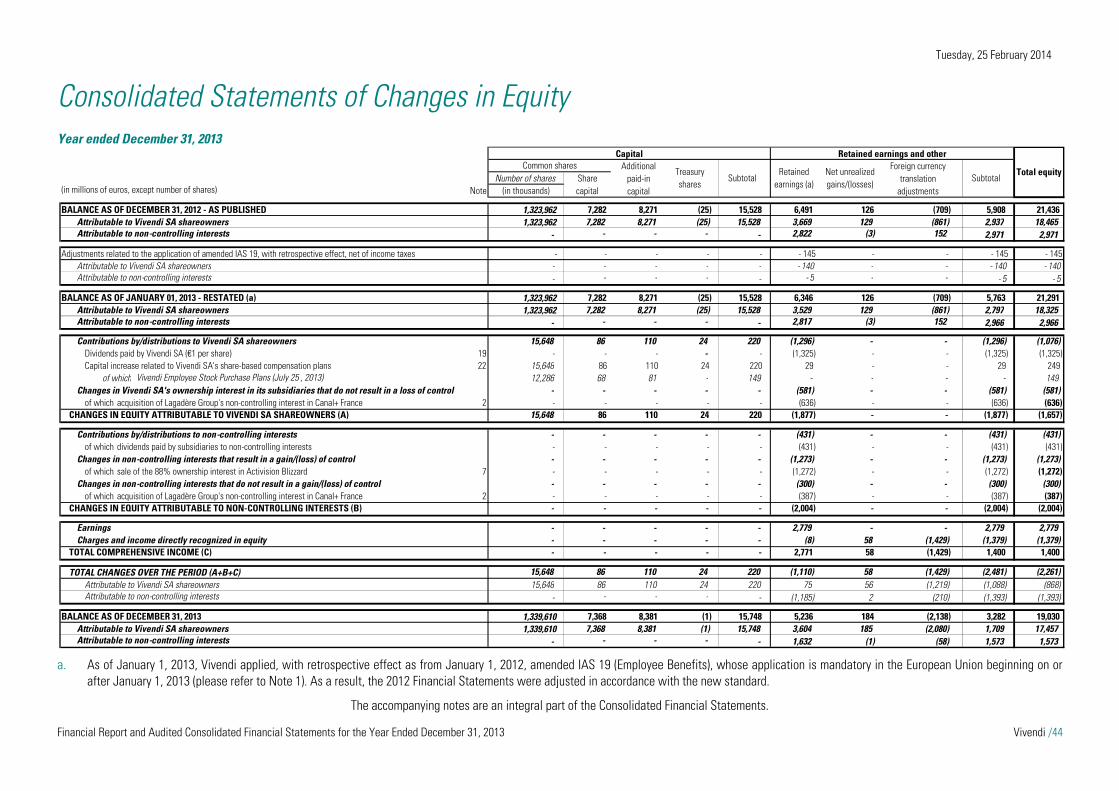
Tuesday, 25 February 2014
Financial Report and Audited Consolidated Financial Statements for the Year Ended December 31, 2013 Vivendi /44
Consolidated Statements of Changes in Equity Year ended December 31, 2013
a. As of January 1, 2013, Vivendi applied, with retrospective effect as from January 1, 2012, amended IAS 19 (Employee Benefits), whose application is mandatory in the European Union beginning on or after January 1, 2013 (please refer to Note 1). As a result, the 2012 Financial Statements were adjusted in accordance with the new standard.
The accompanying notes are an integral part of the Consolidated Financial Statements.
(in millions of euros, except number of shares) Note
BALANCE AS OF DECEMBER 31, 2012 - AS PUBLISHED 1,323,962 7,282 8,271 (25) 15,528 6,491 126 (709) 5,908 21,436Attributable to Vivendi SA shareowners 1,323,962 7,282 8,271 (25) 15,528 3,669 129 (861) 2,937 18,465Attributable to non-controlling interests - - - - - 2,822 (3) 152 2,971 2,971
Adjustments related to the application of amended IAS 19, with retrospective effect, net of income taxes - - - - - - 145 - - - 145 - 145Attributable to Vivendi SA shareowners - - - - - - 140 - - - 140 - 140Attributable to non-controlling interests - - - - - - 5 - - - 5 - 5
BALANCE AS OF JANUARY 01, 2013 - RESTATED (a) 1,323,962 7,282 8,271 (25) 15,528 6,346 126 (709) 5,763 21,291Attributable to Vivendi SA shareowners 1,323,962 7,282 8,271 (25) 15,528 3,529 129 (861) 2,797 18,325Attributable to non-controlling interests - - - - - 2,817 (3) 152 2,966 2,966
Contributions by/distributions to Vivendi SA shareowners 15,648 86 110 24 220 (1,296) - - (1,296) (1,076)Dividends paid by Vivendi SA (€1 per share) 19 - - - - - (1,325) - - (1,325) (1,325)Capital increase related to Vivendi SA's share-based compensation plans 22 15,648 86 110 24 220 29 - - 29 249
of which Vivendi Employee Stock Purchase Plans (July 25 , 2013) 12,286 68 81 - 149 - - - - 149Changes in Vivendi SA's ownership interest in its subsidiaries that do not result in a loss of control - - - - - (581) - - (581) (581)
of which acquisition of Lagadère Group's non-controlling interest in Canal+ France 2 - - - - - (636) - - (636) (636)CHANGES IN EQUITY ATTRIBUTABLE TO VIVENDI SA SHAREOWNERS (A) 15,648 86 110 24 220 (1,877) - - (1,877) (1,657)
Contributions by/distributions to non-controlling interests - - - - - (431) - - (431) (431)of which dividends paid by subsidiaries to non-controlling interests - - - - - (431) - - (431) (431)
Changes in non-controlling interests that result in a gain/(loss) of control - - - - - (1,273) - - (1,273) (1,273)of which sale of the 88% ownership interest in Activision Blizzard 7 - - - - - (1,272) - - (1,272) (1,272)
Changes in non-controlling interests that do not result in a gain/(loss) of control - - - - - (300) - - (300) (300)of which acquisition of Lagadère Group's non-controlling interest in Canal+ France 2 - - - - - (387) - - (387) (387)
CHANGES IN EQUITY ATTRIBUTABLE TO NON-CONTROLLING INTERESTS (B) - - - - - (2,004) - - (2,004) (2,004)
Earnings - - - - - 2,779 - - 2,779 2,779Charges and income directly recognized in equity - - - - - (8) 58 (1,429) (1,379) (1,379)
TOTAL COMPREHENSIVE INCOME (C) - - - - - 2,771 58 (1,429) 1,400 1,400
TOTAL CHANGES OVER THE PERIOD (A+B+C) 15,648 86 110 24 220 (1,110) 58 (1,429) (2,481) (2,261)Attributable to Vivendi SA shareowners 15,648 86 110 24 220 75 56 (1,219) (1,088) (868)Attributable to non-controlling interests - - - - - (1,185) 2 (210) (1,393) (1,393)
BALANCE AS OF DECEMBER 31, 2013 1,339,610 7,368 8,381 (1) 15,748 5,236 184 (2,138) 3,282 19,030Attributable to Vivendi SA shareowners 1,339,610 7,368 8,381 (1) 15,748 3,604 185 (2,080) 1,709 17,457Attributable to non-controlling interests - - - - - 1,632 (1) (58) 1,573 1,573
Retained earnings and other
Total equityCommon shares Additional
paid-in capital
Treasury shares
SubtotalRetained
earnings (a)Net unrealized gains/(losses)
Foreign currency translation
adjustmentsSubtotalNumber of shares Share
capital(in thousands)
Capital
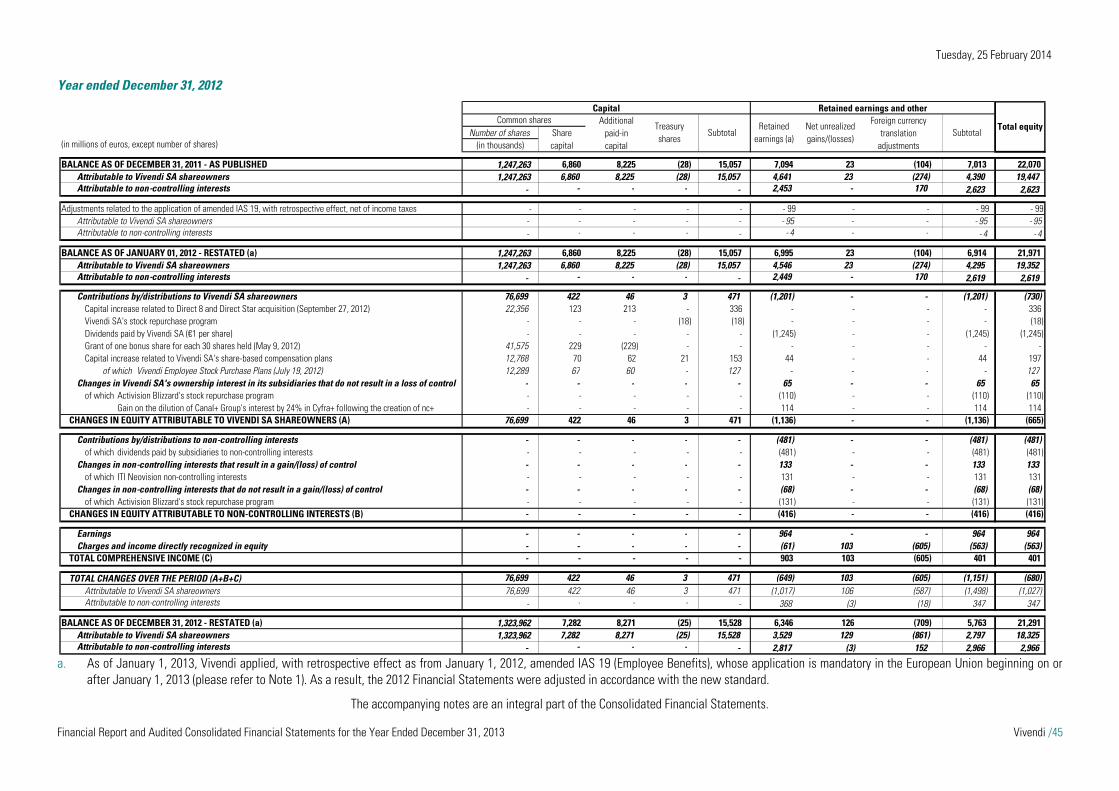
Tuesday, 25 February 2014
Financial Report and Audited Consolidated Financial Statements for the Year Ended December 31, 2013 Vivendi /45
Year ended December 31, 2012
a. As of January 1, 2013, Vivendi applied, with retrospective effect as from January 1, 2012, amended IAS 19 (Employee Benefits), whose application is mandatory in the European Union beginning on or
after January 1, 2013 (please refer to Note 1). As a result, the 2012 Financial Statements were adjusted in accordance with the new standard.
The accompanying notes are an integral part of the Consolidated Financial Statements.
(in millions of euros, except number of shares)
BALANCE AS OF DECEMBER 31, 2011 - AS PUBLISHED 1,247,263 6,860 8,225 (28) 15,057 7,094 23 (104) 7,013 22,070Attributable to Vivendi SA shareowners 1,247,263 6,860 8,225 (28) 15,057 4,641 23 (274) 4,390 19,447Attributable to non-controlling interests - - - - - 2,453 - 170 2,623 2,623
Adjustments related to the application of amended IAS 19, with retrospective effect, net of income taxes - - - - - - 99 - - - 99 - 99Attributable to Vivendi SA shareowners - - - - - - 95 - - - 95 - 95Attributable to non-controlling interests - - - - - - 4 - - - 4 - 4
BALANCE AS OF JANUARY 01, 2012 - RESTATED (a) 1,247,263 6,860 8,225 (28) 15,057 6,995 23 (104) 6,914 21,971Attributable to Vivendi SA shareowners 1,247,263 6,860 8,225 (28) 15,057 4,546 23 (274) 4,295 19,352Attributable to non-controlling interests - - - - - 2,449 - 170 2,619 2,619
Contributions by/distributions to Vivendi SA shareowners 76,699 422 46 3 471 (1,201) - - (1,201) (730)Capital increase related to Direct 8 and Direct Star acquisition (September 27, 2012) 22,356 123 213 - 336 - - - - 336Vivendi SA's stock repurchase program - - - (18) (18) - - - - (18)Dividends paid by Vivendi SA (€1 per share) - - - - - (1,245) - - (1,245) (1,245)Grant of one bonus share for each 30 shares held (May 9, 2012) 41,575 229 (229) - - - - - - -Capital increase related to Vivendi SA's share-based compensation plans 12,768 70 62 21 153 44 - - 44 197
of which Vivendi Employee Stock Purchase Plans (July 19, 2012) 12,289 67 60 - 127 - - - - 127Changes in Vivendi SA's ownership interest in its subsidiaries that do not result in a loss of control - - - - - 65 - - 65 65
of which Activision Blizzard's stock repurchase program - - - - - (110) - - (110) (110)Gain on the dilution of Canal+ Group's interest by 24% in Cyfra+ following the creation of nc+ - - - - - 114 - - 114 114
CHANGES IN EQUITY ATTRIBUTABLE TO VIVENDI SA SHAREOWNERS (A) 76,699 422 46 3 471 (1,136) - - (1,136) (665)
Contributions by/distributions to non-controlling interests - - - - - (481) - - (481) (481)of which dividends paid by subsidiaries to non-controlling interests - - - - - (481) - - (481) (481)
Changes in non-controlling interests that result in a gain/(loss) of control - - - - - 133 - - 133 133of which ITI Neovision non-controlling interests - - - - - 131 - - 131 131
Changes in non-controlling interests that do not result in a gain/(loss) of control - - - - - (68) - - (68) (68)of which Activision Blizzard's stock repurchase program - - - - - (131) - - (131) (131)
CHANGES IN EQUITY ATTRIBUTABLE TO NON-CONTROLLING INTERESTS (B) - - - - - (416) - - (416) (416)
Earnings - - - - - 964 - - 964 964Charges and income directly recognized in equity - - - - - (61) 103 (605) (563) (563)
TOTAL COMPREHENSIVE INCOME (C) - - - - - 903 103 (605) 401 401
TOTAL CHANGES OVER THE PERIOD (A+B+C) 76,699 422 46 3 471 (649) 103 (605) (1,151) (680)Attributable to Vivendi SA shareowners 76,699 422 46 3 471 (1,017) 106 (587) (1,498) (1,027)Attributable to non-controlling interests - - - - - 368 (3) (18) 347 347
BALANCE AS OF DECEMBER 31, 2012 - RESTATED (a) 1,323,962 7,282 8,271 (25) 15,528 6,346 126 (709) 5,763 21,291Attributable to Vivendi SA shareowners 1,323,962 7,282 8,271 (25) 15,528 3,529 129 (861) 2,797 18,325Attributable to non-controlling interests - - - - - 2,817 (3) 152 2,966 2,966
Retained earnings and other
Total equityCommon shares Additional
paid-in capital
Treasury shares
SubtotalRetained
earnings (a)Net unrealized gains/(losses)
Foreign currency translation
adjustmentsSubtotalNumber of shares Share
capital(in thousands)
Capital
Tuesday, February 25, 2014
Financial Report and Audited Consolidated Financial Statements for the Year Ended December 31, 2013 Vivendi /46
Notes to the Consolidated Financial Statements Vivendi is a limited liability company (société anonyme) incorporated under French law, subject to French commercial company law and, in particular, the French Commercial Code (Code de commerce). Vivendi was incorporated on December 18, 1987, for a term of 99 years expiring on December 17, 2086, except in the event of an early dissolution or unless the term is extended. Its registered office is located at 42 avenue de Friedland - 75008 Paris (France). Vivendi is listed on Euronext Paris (Compartment A).
Vivendi operates a number of companies that are leaders in content, media, and telecommunication. Canal+ Group is the French leader in pay-TV and is also present in francophone African countries, Poland, and Vietnam; its subsidiary Studiocanal, is a leading European player in the production, acquisition, distribution and, sale of films. Universal Music Group, the world’s leader in music, recently strengthened and diversified itself through the acquisition of EMI Recorded Music. GVT is the leading Brazilian alternative operator. In addition, Vivendi controls SFR, the leading alternative telecommunications operator in France. On October 11, 2013, Vivendi deconsolidated Activision Blizzard pursuant to the sale of 88% of its interest. Moreover, as a result of the plans to sell Maroc Telecom group, it has been reported in Vivendi’s Consolidated Statement of Earnings as a discontinued operation, in accordance with IFRS 5.
The Consolidated Financial Statements reflect the financial and accounting situation of Vivendi and its subsidiaries (the “group”) together with interests in equity affiliates. Amounts are reported in euros and all values are rounded to the nearest million.
On February 19, 2014, during a meeting held at the headquarters of the company, the Management Board approved the Financial Report and the Consolidated Financial Statements for the year ended December 31, 2013. Having considered the Audit Committee’s recommendation given at its meeting held on February 18, 2014, the Supervisory Board, at its meeting held on February 21, 2014, reviewed the Financial Report and the Consolidated Financial Statements for the year ended December 31, 2013, as approved by the Management Board on February 19, 2014.
On June 24, 2014, the Consolidated Financial Statements for the year ended December 31, 2013 will be submitted for approval at Vivendi’s Annual General Shareholders’ meeting.
Note 1 Accounting policies and valuation methods
1.1 Compliance with accounting standards
The 2013 Consolidated Financial Statements of Vivendi SA have been prepared in accordance with International Financial Reporting Standards (IFRS) as endorsed by the European Union (EU), and in accordance with IFRS published by the International Accounting Standards Board (IASB) with mandatory application as of December 31, 2013.
Vivendi applied new standards and amendments to its Consolidated Financial Statement for the year ended December 31, 2013, the most significant of which concern:
presentation of other items in the consolidated statement of comprehensive income; employee benefit plans; and principles of consolidation.
1.1.1 Presentation of Financial Statements
Amendments to IAS 1 - Presentation of Financial Statements: Presentation of Items of Other Comprehensive Income, as published by the IASB on June 16, 2011, were endorsed by the EU on June 5, 2012 and published in the EU Official Journal on June 6, 2012. These amendments mandatorily apply to periods beginning on or after January 1, 2013, with retrospective effect as from January 1, 2012. They relate to the presentation of items of other comprehensive income (denominated “Charges and income directly recognized in equity” in the Consolidated Statement of Comprehensive Income), which are henceforth grouped according to whether or not they are recycled in the Statement of Earnings.
1.1.2 Employee benefit plans
Amendments to IAS 19 (Employee Benefits) as published by the IASB on June 16, 2011, were endorsed by the EU on June 5, 2012, and published in the EU Official Journal on June 6, 2012. These amendments mandatorily apply to periods beginning on or after January 1, 2013, with retrospective effect as from January 1, 2012.

Tuesday, February 25, 2014
Financial Report and Audited Consolidated Financial Statements for the Year Ended December 31, 2013 Vivendi /47
The main impacts of these amendments for Vivendi are: elimination of the “corridor method” relating to the recognition through profit and loss for the year of actuarial gains and losses on
defined employee benefit plans: thus, actuarial gains and losses not yet recognized as of December 31, 2011 were recorded against consolidated equity as of January 1, 2012;
as from January 1, 2012, actuarial gains and losses are immediately recognized in other comprehensive income in the Statement of Comprehensive Income, and will no longer be recycled in profit and loss. As a consequence, the Consolidated Financial Statements for the year ended December 31, 2012 were adjusted to reflect the cancellation of the recognition of actuarial gains and losses in selling, administrative and general expenses, and the recording of actuarial gains and losses generated in 2012 in items of other comprehensive income not reclassified to profit and loss;
as from January 1, 2012, past service costs resulting from plan amendments or curtailments are immediately recognized in profit and loss, as selling, administrative and general expenses, unvested rights being no longer spread over the vesting period. As a consequence, past service costs not yet recognized as of December 31, 2011 were recorded against consolidated equity as of January 1, 2012, and the Consolidated Financial Statements for the year ended December 31, 2012 were adjusted to reflect the cancellation of the recognition of past service costs in selling, administrative and general expenses; and
expected return on plan assets is calculated using the discount rate retained for the valuation of the benefit obligation.
Due to the retrospective application of the amendments to IAS 19 (Employee Benefits), the Consolidated Financial Statements for the year ended December 31, 2012 were adjusted for comparison purposes. A detailed description of these adjustments is presented in Note 33.
Please note that accounting policies and valuation methods related to employee benefit plans are presented in their entirety in Note 1.3.8.
1.1.3 Principles of consolidation
New standards relating to the principles of consolidation: IFRS 10 - Consolidated Financial Statements, IFRS 11 - Joint Arrangements, IFRS 12 - Disclosure of Interests in Other Entities, IAS 27 - Separate Financial Statements, and IAS 28 - Investments in Associates and Joint Ventures, as published by the IASB on May 12, 2011, were endorsed by the EU on December 11, 2012 and published in the EU Official Journal on December 29, 2012. These standards mandatorily apply to periods beginning on or after January 1, 2014. However, Vivendi elected to early apply them to the interim Financial Statements for the year 2013 and, retrospectively, as of January 1, 2012. The application of these standards had no material impact on Vivendi’s financial statements.
New principles of consolidation introduced by these new standards are presented in Note 1.3.2.
1.1.4 Other
New standard IFRS 13 - Fair Value Measurement, relating to the definition of the concept of fair value in terms of measurement and disclosures, as issued by the IASB on May 12, 2011, was endorsed by the EU on December 11, 2012 and published in the EU Official Journal on December 29, 2012. IFRS 13 applies prospectively and mandatorily to periods beginning on or after January 1, 2013. There has been no significant impact on Vivendi’s valuation methods, or on the information disclosed in the notes to the financial statements, pursuant to its application.
Amendments to various IFRS included in the Annual Improvements to IFRSs 2009-2011 Cycle as published by the IASB on May 2012, were endorsed by the EU on March 27, 2013 and published in the EU Official Journal on March 28, 2013. These amendments mandatorily apply to periods beginning on or after January 1, 2013, retrospectively from January 1, 2012. Their application has had no significant impact on Vivendi’s financial statements.
1.2 Presentation of the Consolidated Financial Statements
1.2.1 Consolidated Statement of Earnings
The main line items presented in Vivendi’s Consolidated Statement of Earnings are revenues, income from equity affiliates, interest, provision for incomes taxes, earnings from discontinued or held for sale operations, and earnings. The Consolidated Statement of Earnings presents a subtotal for Earnings Before Interest and Tax (EBIT) equal to the difference between charges and income (excluding those financing activities, equity affiliates, discontinued or held for sale operations, and income taxes).
The charges and income related to financing activities consist of interest, income from investments, as well as other financial charges and income as defined in paragraph 1.2.3 and presented in Note 5.
1.2.2 Consolidated Statement of Cash Flows
Net cash provided from operating activities
Net cash provided from operating activities is calculated using the indirect method based on EBIT. EBIT is adjusted for non-cash items and changes in net working capital. Net cash provided from operating activities excludes the cash impact of financial charges and income and net changes in working capital related to property, plant and equipment, and intangible assets.
Tuesday, February 25, 2014
Financial Report and Audited Consolidated Financial Statements for the Year Ended December 31, 2013 Vivendi /48
Net cash used for investing activities
Net cash used for investing activities includes changes in net working capital related to property, plant and equipment, and intangible assets as well as cash from investments (particularly dividends received from equity affiliates). It also includes any cash flows arising from the gain or loss of control of subsidiaries.
Net cash used for financing activities
Net cash used for financing activities includes net interest paid on borrowings, cash and cash equivalents, bank overdrafts, as well as the cash impact of other items related to financing activities such as premiums from the early redemption of borrowings and the settlement of derivative instruments. It also includes cash flows from changes in ownership interests in a subsidiary that do not result in a loss of control (including increases in ownership interests).
1.2.3 Operating performance of each operating segment and of the group
Vivendi considers Adjusted Earnings Before Interest and Tax (EBITA), Adjusted net income (ANI), and Cash Flow From Operations (CFF0), non-GAAP measures, to be relevant indicators of the group’s operating and financial performance.
EBITA
Vivendi considers EBITA, a non-GAAP measure, to be a relevant measure to assess the performance of its operating segments as reported in the segment data. The method used in calculating EBITA excludes the accounting impact of the amortization of intangible assets acquired through business combinations, impairment losses on goodwill and other intangibles acquired through business combinations, and other income and charges related to financial investing transactions and to transactions with shareowners. This enables Vivendi to measure and compare the operating performance of operating segments regardless of whether their performance is driven by the operating segment’s organic growth or acquisitions.
The difference between EBITA and EBIT consists of the amortization of intangible assets acquired through business combinations, impairment losses on goodwill and other intangibles acquired through business combinations, as well as other financial income and charges related to financial investing transactions and to transactions with shareowners that are included in EBIT. The charges and income related to financial investing transactions include gains and losses recognized in business combinations, capital gains or losses related to divestitures or the depreciation of equity affiliates and other financial investments, as well as gains or losses incurred from the gain or loss of control in a business.
Adjusted net income
Vivendi considers adjusted net income, a non-GAAP measure, to be a relevant measure to assess the group’s operating and financial performance. Vivendi Management uses adjusted net income because it better illustrates the underlying performance of continuing operations by excluding most non-recurring and non-operating items. Adjusted net income includes the following items:
EBITA (**); income from equity affiliates (*) (**); interest (*) (**), corresponding to interest expense on borrowings net of interest income earned on cash and cash equivalents; income from investments (*) (**), including dividends and interest received from unconsolidated companies; and taxes and non-controlling interests related to these items.
It does not include the following items: amortization of intangibles acquired through business combinations (**) as well as impairment losses on goodwill and other
intangibles acquired through business combinations (*) (**); other income and charges related to financial investing transactions and to transactions with shareowners (*), as defined above; other financial charges and income (*) (**), equal to the profit and loss related to the change in value of financial assets and the
termination or change in value of financial liabilities, which primarily include changes in fair value of derivative instruments, premiums from the early redemption of borrowings, the early unwinding of derivative instruments, the cost of issuing or cancelling credit facilities, the cash impact of foreign exchange transactions (other than those related to operating activities, included in the EBIT), as well as the effect of undiscounting assets and liabilities, and the financial components of employee benefits (interest cost and expected return on plan assets);
earnings from discontinued operations (*) (**); and provisions for income taxes and adjustments attributable to non-controlling interests and non-recurring tax items (notably the
changes in deferred tax assets pursuant to Vivendi SA’s tax group and the Consolidated Global Profit Tax Systems, and the reversal of tax liabilities relating to risks extinguished over the period).
(*) Items as presented in the Consolidated Statement of Earnings; (**) Items as reported by each operating segment.
Tuesday, February 25, 2014
Financial Report and Audited Consolidated Financial Statements for the Year Ended December 31, 2013 Vivendi /49
Cash Flow From Operations (CFFO)
Vivendi considers cash flow from operations (CFFO), a non-GAAP measure, to be a relevant measure to assess the group’s operating and financial performance. The CFFO includes net cash provided by operating activities, before income tax paid, as presented in the Statement of Cash Flows, as well as dividends received from equity affiliates and unconsolidated companies. It also includes capital expenditures, net that relate to cash used for capital expenditures, net of proceeds from sales of property, plant and equipment, and intangible assets.
The difference between CFFO and net cash provided by operating activities, before income tax consists of dividends received from equity affiliates and unconsolidated companies and capital expenditures, net, which are included in net cash used for investing activities and of income tax paid, net, which are excluded from CFFO.
1.2.4 Consolidated Statement of Financial Position
Assets and liabilities that are expected to be realized, or intended for sale or consumption, within the entity’s normal operating cycle (generally 12 months), are recorded as current assets or liabilities. If their maturity exceeds this period, they are recorded as non-current assets or liabilities. Moreover, certain reclassifications have been made to the 2012 and 2011 Consolidated Financial Statements to conform to the presentation of the 2013 and 2012 Consolidated Financial Statements.
1.3 Principles governing the preparation of the Consolidated Financial Statements
Pursuant to IFRS principles, the Consolidated Financial Statements have been prepared on a historical cost basis, with the exception of certain assets and liabilities detailed below.
The Consolidated Financial Statements include the financial statements of Vivendi and its subsidiaries after eliminating intragroup items and transactions. Vivendi has a December 31 year-end. Subsidiaries that do not have a December 31 year-end prepare interim financial statements at that date, except when their year-end falls within the three months prior to December 31.
Acquired subsidiaries are included in the Consolidated Financial Statements of the group as of the date of acquisition.
1.3.1 Use of estimates
The preparation of Consolidated Financial Statements in compliance with IFRS requires the group management to make certain estimates and assumptions that they consider reasonable and realistic. Even though these estimates and assumptions are regularly reviewed by Vivendi Management based, in particular, on past or anticipated achievements, facts and circumstances may lead to changes in these estimates and assumptions which could impact the reported amount of group assets, liabilities, equity or earnings.
The main estimates and assumptions relate to the measurement of:
revenue: estimates of provisions for returns and price guarantees, and rewards as part of loyalty programs deducted from certain revenue items (please refer to Note 1.3.4);
provisions: risk estimates, performed on an individual basis, noting that the occurrence of events during the course of procedures may lead to a risk reassessment at any time (please refer to Notes 1.3.8 and 20);
employee benefits: assumptions are updated annually, such as the probability of employees remaining within the group until retirement, expected changes in future compensation, the discount rate and inflation rate (please refer to Notes 1.3.8 and 21);
share-based compensation: assumptions are updated annually, such as the estimated term, volatility and the estimated dividend yield (please refer to Notes 1.3.10 and 22);
certain financial instruments: fair value estimates (please refer to Notes 1.3.5.8, 1.3.7 and 24); deferred taxes: estimates concerning the recognition of deferred tax assets are updated annually with factors such as expected tax
rates and future tax results of the group (please refer to Notes 1.3.9 and 6); goodwill and other intangible assets: valuation methods adopted for the identification of intangible assets acquired through
business combinations (please refer to Notes 1.3.5.2 and 2); goodwill, intangible assets with indefinite useful lives and assets in progress: assumptions are updated annually relating to
impairment tests performed on each of the group’s cash-generating units (CGUs), future cash flows and discount rates (please refer to Notes 1.3.5.7, 10, 12, and 13); and
UMG content assets: estimates of the future performance of beneficiaries who were granted advances are recognized in the Statement of Financial Position (please refer to Notes 1.3.5.3 and 11).
Tuesday, February 25, 2014
Financial Report and Audited Consolidated Financial Statements for the Year Ended December 31, 2013 Vivendi /50
1.3.2 Principles of consolidation
A list of Vivendi’s major subsidiaries, joint ventures and associated entities is presented in Note 29.
Consolidation
All companies in which Vivendi has a controlling interest, namely those in which it has the power to govern financial and operational policies to obtain benefits from their operations, are fully consolidated.
The new model of control, introduced by IFRS 10 superseding IAS 27 revised - Consolidated and Separate Financial Statements, and interpretation SIC 12 - Consolidation - Special Purpose Entities, is based on the following three criteria to be fulfilled simultaneously to conclude that the parent company exercises control:
a parent company has power over a subsidiary when the parent company has existing rights that give it the current ability to direct the relevant activities of the subsidiary, i.e., the activities that significantly affect the subsidiary’s returns. Power may arise from existing or potential voting rights, or contractual agreements. Voting rights must be substantial, i.e., they shall be exercisable at any time, without limitation particularly during decision making related to significant activities. The assessment of the exercise of power depends on the nature of the subsidiary’s relevant activities, the internal decision-making process, and the allocation of rights among the subsidiary’s other shareowners;
the parent company is exposed, or has rights, to variable returns from its involvement with the subsidiary which may vary as a result of the subsidiary’s performance. The concept of returns is broadly defined and includes, among others, dividends and other distributions of economic benefits, changes in the value of the investment in the subsidiary, economies of scale, and business synergies; and
the parent company has the ability to use its power to affect the returns. Power without any impact on returns does not qualify as control.
Consolidated Financial Statements of a group are presented as if the group was a single economic entity with two categories of owners: the owners of the parent company on the one hand (Vivendi SA shareowners) and the owners of non-controlling interests on the other. A non-controlling interest is defined as the interest in a subsidiary that is not attributable, directly or indirectly, to a parent. As a result, changes to a parent company’s ownership interest in a subsidiary that do not result in a loss of control only impact equity, as control does not change within the economic entity. Hence, in the event of the acquisition of an additional interest in a consolidated entity after January 1, 2009, Vivendi recognizes the difference between the acquisition price and the carrying value of non-controlling interests acquired as a change in equity attributable to Vivendi SA shareowners. Conversely, any acquisition of control achieved in stages or a loss of control gives rise to profit or loss in the statement of earnings.
Accounting for joint arrangements
IFRS 11, which supersedes IAS 31 – Financial Reporting of Interests in Joint Ventures, and interpretation SIC 13 - Jointly Controlled Entities - Non-monetary Contributions by Venturers, establishes principles for financial reporting by parties to a joint arrangement.
In a joint arrangement, parties are bound by a contractual arrangement, giving these parties joint control of the arrangement. An entity that is a party to an arrangement shall assess whether the contractual arrangement gives all the parties or a group of the parties, control of the arrangement collectively. Once it has been established that all the parties or a group of the parties collectively control the arrangement, joint control exists only when decisions about the relevant activities require the unanimous consent of the parties that collectively control the arrangement.
Joint arrangements are classified into two categories:
Joint operations: these are joint arrangements whereby the parties that have joint control of the arrangement have rights to the assets, and obligations for the liabilities, relating to the arrangement. Those parties are called joint operators. A joint operator shall recognize 100% of wholly-owned assets/liabilities, expenses/revenues of the joint operation, and its share of any of those items held jointly; and
Joint ventures: these are joint arrangements whereby the parties that have joint control of the arrangement have rights to the net assets of the arrangement. Those parties are called joint venturers. Each joint venturer shall recognize its interest in a joint venture as an investment, and shall account for that investment using the equity method in accordance with IAS 28 (please refer below).
The elimination of proportionate consolidation for joint ventures has no impact on Vivendi, which already accounted for under the equity method companies that were jointly controlled by Vivendi, directly or indirectly, and a limited number of other shareholders under the terms of a contractual arrangement.

Tuesday, February 25, 2014
Financial Report and Audited Consolidated Financial Statements for the Year Ended December 31, 2013 Vivendi /51
Equity accounting
Entities over which Vivendi exercises significant influence as well as joint ventures are accounted for under the equity method.
Significant influence is presumed to exist when Vivendi holds, directly or indirectly, at least 20% of voting rights in an entity unless it can be clearly demonstrated that Vivendi does not exercise significant influence. Significant influence can be evidenced through other criteria, such as representation on the board of directors or the entity’s equivalent governing body, participation in policy-making processes, material transactions with the entity or the interchange of managerial personnel.
1.3.3 Foreign currency translation
The Consolidated Financial Statements are presented in millions of euros. The functional currency of Vivendi SA and the presentation currency of the group is the euro.
Foreign currency transactions
Foreign currency transactions are initially recorded in the functional currency of the entity at the exchange rate prevailing at the date of the transaction. At the closing date, foreign currency monetary assets and liabilities are translated into the entity’s functional currency at the exchange rate prevailing on that date. All foreign currency differences are expensed, with the exception of differences resulting from borrowings in foreign currencies which constitute a hedge of the net investment in a foreign entity. These differences are allocated directly to charges and income directly recognized in equity until the divestiture of the net investment.
Financial statements denominated in a foreign currency
Except in cases of significant exchange rate fluctuation, financial statements of subsidiaries, joint ventures or other associated entities for which the functional currency is not the euro are translated into euros as follows: the Consolidated Statement of Financial Position is translated at the exchange rate at the end of the period, and the Consolidated Statement of Earnings and the Consolidated Statement of Cash Flow are translated using average monthly exchange rates for the period. The resulting translation gains and losses are recorded as foreign currency translation differences in charges and income directly recognized in equity. In accordance with IFRS 1, Vivendi elected to reverse the accumulated foreign currency translation differences against retained earnings as of January 1, 2004. These foreign currency translation differences resulted from the translation into euro of the financial statements of subsidiaries having foreign currencies as their functional currencies. Consequently, these adjustments are not applied to earnings on the subsequent divestiture of subsidiaries, joint ventures or associates, whose functional currency is not the euro.
1.3.4 Revenues from operations and associated costs
Revenues from operations are recorded when it is probable that future economic benefits will be obtained by the group and when they can be reliably measured. Revenues are reported net of discounts.
1.3.4.1 Canal+ Group
Pay and free-to-air television
Revenues from television subscription services for terrestrial, satellite or cable pay-television platforms are recognized over the service period, net of gratuities granted. Revenues from advertising are recognized over the period during which advertising commercials are broadcasted. Revenues from ancillary services (such as interactive or video-on-demand services) are recognized when the service is rendered. Subscriber management and acquisition costs, as well as television distribution costs, are included in selling, general and administrative expenses.
Equipment rentals
IFRIC 4 - Determining Whether an Arrangement Contains a Lease, applies to equipment for which a right of use is granted. Equipment lease revenues are generally recognized on a straight-line basis over the life of the lease agreement.
Film and television programming
Theatrical revenues are recognized as the films are screened. Revenues from film distribution and from video and television or pay television licensing agreements are recognized when the films and television programs are available for telecast and all other conditions of sale have been met. Home video product revenues, less a provision for estimated returns (please refer to Note 1.3.4.4) and rebates, are recognized upon shipment and availability of the product for retail sale. Amortization of film and television capitalized and acquisition costs, theatrical print costs, home video inventory costs and television, and home video marketing costs are included in costs of revenues.

Tuesday, February 25, 2014
Financial Report and Audited Consolidated Financial Statements for the Year Ended December 31, 2013 Vivendi /52
1.3.4.2 Universal Music Group (UMG)
Recorded music
Revenues from the physical sale of recorded music, net of a provision for estimated returns (please refer to Note 1.3.4.5) and rebates, are recognized upon shipment to third parties, at the shipping point for products sold free on board (FOB) and on delivery for products sold free on destination.
Revenues from the digital sale of recorded music, for which UMG has sufficient, accurate, and reliable data from certain distributors, are recognized based on their estimate at the end of the month in which those sales were made to the final customer. In the absence of such data, revenues are recognized upon notification by the distribution platform (on-line or mobile music distributor) to UMG of a sale to the final customer.
Music publishing
Revenues from the third-party use of copyrights on musical compositions owned or administered by UMG are recognized when royalty statements are received and collectability is assured.
Costs of revenues
Costs of revenues include manufacturing and distribution costs, royalty and copyright expenses, artists’ costs, recording costs, and direct overheads. Selling, general and administrative expenses primarily include marketing and advertising expenses, selling costs, provisions for doubtful receivables and indirect overheads.
1.3.4.3 GVT, SFR, and Maroc Telecom group
Separable components of bundled offers
Revenues from telephone packages are recognized as multiple-component sales in accordance with IAS 18. Revenues from the sale of telecommunication equipment (mobile phones and other equipment), net of discounts granted to customers through the distribution channel, are recognized upon activation of the line. Revenues from telephone subscriptions are recognized on a straight-line basis over the subscription contract period. Revenues from incoming and outgoing traffic are recognized when the service is rendered.
Customer acquisition and loyalty costs for mobile phones, principally consisting of rebates on the sale of equipment to customers through distributors, are recognized as a deduction from revenues. Customer acquisition and loyalty costs consisting of premiums not related to the sale of equipment as part of telephone packages and commissions paid to distributors are recognized as selling and general expenses.
Equipment rentals
IFRIC 4 - Determining Whether an Arrangement Contains a Lease applies to equipment for which a right of use is granted. Equipment lease revenues are generally recognized on a straight-line basis over the life of the lease agreement.
Content sales
Sales of services provided to customers managed on behalf of content providers (mainly premium rate numbers) are either accounted for gross, or net of the content providers’ fees when the provider is responsible for the content and for setting the price payable by subscribers.
Custom contracts
Service access and installation costs invoiced primarily to the operator’s clients on the installation of services such as a broadband connection, bandwidth service or IP connection are recognized over the expected duration of the contractual relationship and the supply of the primary service.
Access to telecommunication infrastructure is provided to clients pursuant to various types of contracts: lease arrangements, hosting contracts or Indefeasible Right of Use (IRU) agreements. IRU agreements, which are specific to the telecommunication sector, confer an exclusive and irrevocable right to use an asset (cables, fiber optic or bandwidth) during a (generally lengthy) defined period without a transfer of ownership of the asset. Revenue generated by leases, hosting contracts in the Netcenters and IRU agreements is recognized over the duration of the corresponding contract, except in the case of a finance lease whereby the equipment is considered as a sale on credit.
In the case of IRU agreements and certain lease or service contracts, services are paid in advance the first year. Where the contract is not qualified as a finance lease, these non-refundable advance payments are recorded as deferred income and recognized ratably over the contract term. The deferral period is thus between 10 and 25 years for IRU agreements and between 1 and 25 years for leases or service contracts.

Tuesday, February 25, 2014
Financial Report and Audited Consolidated Financial Statements for the Year Ended December 31, 2013 Vivendi /53
Costs of revenues
Costs of revenues comprise purchasing costs (including purchases of mobile phones), interconnection and access costs, network, and equipment costs. Selling, general and administrative expenses notably include commercial costs relating to marketing and customer care expenses.
1.3.4.4 Other
Provisions for estimated returns and price guarantees are deducted from sales of products to customers through distributors. They are estimated based on past sales statistics and they take into account the economic environment and product sales forecast to final customers.
The recognition of awards associated with loyalty programs in the form of free or discounted goods or services are recorded according to IFRIC 13. Loyalty programs of SFR (valid until the third quarter of 2012), Maroc Telecom, and Canal+ Group grant to existing customers awards in the form of free services, according to the length of the relationship with the customer and/or loyalty points for subsequent conversion into either handset renewal subsidies, or free services. IFRIC 13 - Interpretation is based upon the principle of measuring loyalty awards by reference to their fair value. Fair value is defined as the excess price over the sales incentive that would be granted to any new customer and, should any such excess price exist, would result in deferring the recognition of the revenue associated with the subscription in the amount of such excess price.
Selling, general and administrative expenses primarily include salaries and employee benefits, rent, consulting and service fees, insurance costs, travel and entertainment expenses, administrative department costs, provisions for receivables and other operating expenses.
Advertising costs are expensed as incurred.
Slotting fees and cooperative advertising expenses are recorded as a reduction in revenues. However, cooperative advertising at UMG is treated as a marketing expense and expensed when its expected benefit is individualized and can be estimated.
1.3.5 Assets
1.3.5.1 Capitalized financial interest
Until December 31, 2008, Vivendi did not capitalize financial interest incurred during the construction and acquisition period of intangible assets, and property, plant and equipment. Since January 1, 2009, according to amended IAS 23 - Borrowing Costs, this interest is included in the cost of qualifying assets. Vivendi applies this amendment to qualifying assets for which the commencement date for capitalization of costs is January 1, 2009 onwards.
1.3.5.2 Goodwill and business combinations
Business combinations from January 1, 2009
Business combinations are recorded using the acquisition method. Under this method, upon the initial consolidation of an entity over which the group has acquired exclusive control:
the identifiable assets acquired and the liabilities assumed are recognized at their fair value on the acquisition date; and non-controlling interests are measured either at fair value or at the non-controlling interest’s proportionate share of the acquiree’s
net identifiable assets. This option is available on a transaction-by-transaction basis.
On the acquisition date, goodwill is initially measured as the difference between: (i) the fair value of the consideration transferred, plus the amount of non-controlling interests in the acquiree and, in a business combination achieved in stages, the acquisition-date fair value of the previously held equity interest in the acquiree; and (ii) the net fair value of the identifiable assets and liabilities assumed on the acquisition date.
The measurement of non-controlling interests at fair value results in an increase in goodwill up to the extent attributable to these interests, thereby leading to the recognition of a “full goodwill”. The purchase price allocation shall be performed within 12 months after the acquisition date. If goodwill is negative, it is recognized in the Statement of Earnings. Subsequent to the acquisition date, goodwill is measured at its initial amount less recorded accumulated impairment losses (please refer to Note 1.3.5.7 below).

Tuesday, February 25, 2014
Financial Report and Audited Consolidated Financial Statements for the Year Ended December 31, 2013 Vivendi /54
In addition, the following principles are applied to business combinations:
on the acquisition date, to the extent possible, goodwill is allocated to each cash-generating unit likely to benefit from the business combination;
contingent consideration in a business combination is recorded at fair value on the acquisition date, and any subsequent adjustment occurring after the purchase price allocation period is recognized in the Statements of Earnings;
acquisition-related costs are recognized as expenses when incurred; in the event of the acquisition of an additional interest in a subsidiary, Vivendi recognizes the difference between the acquisition
price and the carrying value of non-controlling interests acquired as a change in equity attributable to Vivendi SA shareowners; and goodwill is not amortized.
Business combinations prior to January 1, 2009
Pursuant to IFRS 1, Vivendi elected not to restate business combinations that occurred prior to January 1, 2004. IFRS 3, as published by the IASB in March 2004, retained the acquisition method. However, its provisions differed from those of the revised standard on the main following items:
minority interests were measured at their proportionate share of the acquiree’s net identifiable assets as there was no option of measurement at fair value;
contingent consideration was recognized in the cost of acquisition only if the payment was likely to occur and the amounts could be reliably measured;
transaction costs that were directly attributable to the acquisition formed part of acquisition costs; and in the event of the acquisition of an additional interest in a subsidiary, the difference between the acquisition cost and the carrying
value of minority interests acquired was recognized as goodwill.
1.3.5.3 Content assets
Canal+ Group
Film, television or sports broadcasting rights
When entering into contracts for the acquisition of film, television or sports broadcasting rights, the rights acquired are classified as contractual commitments. They are recorded in the Statement of Financial Position and classified as content assets as follows:
film and television broadcasting rights are recognized at their acquisition cost, when the program is available for screening and are expensed over their broadcasting period;
sports broadcasting rights are recognized at their acquisition cost, at the opening of the broadcasting period of the related sports season or upon the first payment and are expensed as they are broadcast; and
expensing of film, television or sports broadcasting rights is included in cost of revenues.
Theatrical film and television rights produced or acquired to be sold
Theatrical film and television rights produced or acquired before their initial exhibition, to be sold, are recorded as a content asset at capitalized cost (mainly direct production and overhead costs) or at their acquisition cost. Theatrical film and television rights are amortized, and other related costs are expensed, pursuant to the estimated revenue method (i.e., based on the ratio of the current period’s gross revenues to estimated total gross revenues from all sources on an individual production basis). Vivendi considers that amortization pursuant to the estimated revenue method reflects the rate at which the entity plans to consume the future economic benefits related to the asset. Accumulated amortization under this rate is, for this activity, generally not lower than the charge that would be obtained under the straight-line amortization method. If, however, the accumulated amortization would be lower than this charge, a minimum straight-line amortization would be calculated over a maximum 12-year period, which corresponds to the typical screening period of each film.
Where appropriate, estimated losses in value are provided in full against earnings for the period in which the losses are estimated, on an individual product basis.
Film and television rights catalogs
Catalogs are comprised of film rights acquired for a second television exhibition, or produced or acquired film and television rights that are sold after their first television screening (i.e., after their first broadcast on a free terrestrial channel). They are recognized as an asset at their acquisition or transfer cost and amortized as groups of films, or individually, based respectively on the estimated revenue method.

Tuesday, February 25, 2014
Financial Report and Audited Consolidated Financial Statements for the Year Ended December 31, 2013 Vivendi /55
UMG
Music publishing rights and catalogs include music catalogs, artists’ contracts and publishing rights, acquired through business combinations, amortized in selling, general and administrative expenses over a period not exceeding 15 years.
Royalty advances to artists, songwriters, and co-publishers are capitalized as an asset when their current popularity and past performances provide a reasonable basis to conclude that the probable future recoupment of such royalty advances against earnings otherwise payable to them is reasonably assured. Royalty advances are recognized as an expense as subsequent royalties are earned by the artist, songwriter or co-publisher. Any portion of capitalized royalty advances not deemed to be recoverable against future royalties is expensed during the period in which the loss becomes evident. These expenses are recorded in cost of revenues.
Royalties earned by artists, songwriters, and co-publishers are recognized as an expense in the period during which the sale of the product occurs, less a provision for estimated returns.
1.3.5.4 Research and development costs
Research costs are expensed when incurred. Development expenses are capitalized when the feasibility and, in particular, profitability of the project can reasonably be considered certain.
Cost of internal use software
Direct internal and external costs incurred for the development of computer software for internal use, including website development costs, are capitalized during the application development stage. Application development stage costs generally include software configuration, coding, installation and testing. Costs of significant upgrades and enhancements resulting in additional functionality are also capitalized. These capitalized costs, mainly recognized at SFR, are amortized over 4 years. Maintenance and minor upgrade and enhancement costs are expensed as incurred.
1.3.5.5 Other intangible assets
Intangible assets acquired separately are recorded at cost, and intangible assets acquired in connection with a business combination are recorded at their fair value at the acquisition date. The historical cost model is applied to intangible assets after they have been recognized. Assets with an indefinite useful life are not amortized but are all subject to an annual impairment test. Amortization is accrued for assets with a finite useful life. Useful life is reviewed at the end of each reporting period.
Other intangible assets include trade names, customer bases and licenses. Music catalogs, trade names, subscribers’ bases and market shares generated internally are not recognized as intangible assets.
GVT, SFR, and Maroc Telecom group
Licenses to operate telecom networks are recorded at historical cost based upon the discounted value of deferred payments and amortized on a straight-line basis from their effective service start date over their estimated useful life until maturity. Licenses to operate in France are recognized in the amount of the fixed, upfront fee paid upon the granting of the license. The variable fee, which cannot be reliably determined (equal to 1% of the revenues generated by the activity in the case of the telecommunication licenses in France), is recorded as an expense when incurred.
1.3.5.6 Property, plant and equipment
Property, plant and equipment are carried at historical cost less any accumulated depreciation and impairment losses. Historical cost includes the acquisition cost or production cost, the costs directly attributable to transporting an asset to its physical location and preparing it for use in operations, the estimated costs for the demolition and the collection of property, plant and equipment, and the rehabilitation of the physical location resulting from the incurred obligation.
When property, plant and equipment include significant components with different useful lives, they are recorded and amortized separately. Amortization is computed using the straight-line method based on the estimated useful life of the assets. Useful life is reviewed at the end of each reporting period.
Tuesday, February 25, 2014
Financial Report and Audited Consolidated Financial Statements for the Year Ended December 31, 2013 Vivendi /56
Property, plant and equipment mainly consist of the network equipment of telecommunications activities, each part of which is amortized generally over 1 to 50 years. The useful lives of the main components are as follows:
buildings: over 8 to 25 years; fiber optic equipment: 50 years; pylons: over 15 to 20 years; radio and transmission equipment: over 3 to 10 years; switch centers: 8 years; and servers and hardware: over 1 to 8 years.
Assets financed by finance lease contracts are capitalized at the lower of the fair value of future minimum lease payments and of the market value and the related debt is recorded as “Borrowings and other financial liabilities”. In general, these assets are amortized on a straight-line basis over their estimated useful life, corresponding to the duration applicable to property, plant and equipment from the same category. Amortization expenses on assets acquired under such leases are included in amortization expenses.
After initial recognition, the cost model is applied to property, plant and equipment.
Vivendi has elected not to apply the option available under IFRS 1, involving the remeasurement of certain property, plant and equipment at their fair value as of January 1, 2004.
On January 1, 2004, in accordance with IFRS 1, Vivendi decided to apply IFRIC Interpretation 4 - Determining whether an arrangement contains a lease, which currently mainly applies to commercial supply agreements for the Canal+ Group and GVT satellite capacity and for GVT, SFR, and Maroc Telecom group telecommunications services:
Indefeasible Right of Use (IRU) agreements confer an exclusive and irrevocable right to use an asset during a defined period. IRU agreements are leases which convey a specific right of use for a defined portion of the underlying asset in the form of dedicated fibers or wavelengths. IRU agreements are capitalized if the agreement period covers the major part of the useful life of the underlying asset. IRU contract costs are capitalized and amortized over the contract term; and
Some IRU contracts are commercial service agreements that do not convey a right to use a specific asset; contract costs under these agreements are consequently expensed as operational costs for the period.
1.3.5.7 Asset impairment
Each time events or changes in the economic environment indicate a current risk of impairment of goodwill, other intangible assets, property, plant and equipment, and assets in progress, Vivendi re-examines the value of these assets. In addition, goodwill, other intangible assets with an indefinite useful life, and intangible assets in progress are all subject to an annual impairment test undertaken in the fourth quarter of each fiscal year, with some exceptions. This test is performed to compare the recoverable amount of each Cash Generating Unit (CGU) or, if necessary, groups of CGU to the carrying value of the corresponding assets (including goodwill). A Cash Generating Unit is the smallest identifiable group of assets that generates cash inflows that are largely independent of the cash inflows from other assets or groups of assets. The Vivendi group operates through different communication businesses. Each business offers different products and services that are marketed through different channels. CGUs are independently defined at each business level, corresponding to the group operating segments. Vivendi CGUs and groups of CGUs are presented in Note 10.
The recoverable amount is determined as the higher of either: (i) the value in use; or (ii) the fair value (less costs to sell) as described hereafter, for each individual asset. If the asset does not generate cash inflows that are largely independent of other assets or groups of assets, the recoverable amount is determined for the group of assets. In particular, an impairment test of goodwill is performed by Vivendi for each CGU or group of CGUs, depending on the level at which Vivendi Management measures return on operations.
The value in use of each asset or group of assets is determined as the discounted value of future cash flows (discounted cash flow method (DCF)) by using cash flow projections consistent with the budget of the following year and the most recent forecasts prepared by the operating segments.
Applied discount rates are determined by reference to available external sources of information, usually based on financial institutions’ benchmarks, and reflect the current assessment by Vivendi of the time value of money and risks specific to each asset or group of assets.
Perpetual growth rates used for the evaluation of CGUs are those used to prepare budgets for each CGU or group of CGUs, and beyond the period covered, are consistent with growth rates estimated by the business by extrapolating growth rates used in the budgets, without exceeding the long-term average growth rate for the markets in which the group operates.
The fair value (less costs to sell) is the price that would be received from the sale of an asset or group of assets in an orderly transaction between market participants at the measurement date, less costs to sell. These values are determined on the basis of market data (stock market prices or comparison with similar listed companies, with the value attributed to similar assets or companies in recent transactions) or on discontinued future cash flows in the absence of reliable data.

Tuesday, February 25, 2014
Financial Report and Audited Consolidated Financial Statements for the Year Ended December 31, 2013 Vivendi /57
If the recoverable amount is lower than the carrying value of an asset or group of assets, an impairment loss equal to the difference is recognized in EBIT. In the case of a group of assets, this impairment loss is recorded first against goodwill.
The impairment losses recognized in respect of property, plant and equipment, and intangible assets (other than goodwill) may be reversed in a later period if the recoverable amount becomes greater than the carrying value, within the limit of impairment losses previously recognized. Impairment losses recognized in respect of goodwill cannot be reversed at a later date.
1.3.5.8 Financial assets
Financial assets consist of financial assets measured at fair value and financial assets recognized at amortized cost. Financial assets are initially recognized at the fair value corresponding, in general, to the consideration paid, for which the best evidence is the acquisition cost (including associated acquisition costs, if any).
Financial assets at fair value
Financial assets at fair value include available-for-sale securities, derivative financial instruments with a positive value (please refer to Note 1.3.7) and other financial assets measured at fair value through profit or loss. Most of these financial assets are actively traded in organized public markets, their fair value being calculated by reference to the published market price at period end. For financial assets for which there exists no published market price in an active market, fair value is then estimated. As a last resort, the group values financial assets at historical cost, less any impairment losses, when a reliable estimate of fair value cannot be made using valuation techniques in the absence of an active market.
Available-for-sale securities consist of unconsolidated interests and other securities not qualifying for classification in the other financial asset categories described below. Unrealized gains and losses on available-for-sale securities are recognized in charges and income directly recognized in equity until the financial asset is sold, collected or removed from the Statement of Financial Position in another way, or until there is objective evidence that the investment is impaired, at which time the accumulated gain or loss previously reported in charges and income directly recognized in equity is expensed in other financial charges and income.
Other financial assets measured at fair value through profit or loss mainly consist of assets held for trading which Vivendi intends to sell in the near future (primarily marketable securities). Unrealized gains and losses on these assets are recognized in other financial charges and income.
Financial assets at amortized cost
Financial assets at amortized cost consist of loans and receivables (primarily loans to affiliates and associates, current account advances to equity affiliates and unconsolidated interests, cash deposits, securitized loans and receivables, and other loans and receivables, and debtors) and held-to-maturity investments (financial assets with fixed or determinable payments and fixed maturity). At the end of each period, these assets are measured at amortized cost using the effective interest method. If there is objective evidence that an impairment loss has been incurred, the amount of this loss, measured as the difference between the financial asset’s carrying value and its recoverable amount (equal to the present value of estimated future cash flows discounted at the financial asset’s initial effective interest rate), is recognized in profit or loss. Impairment losses may be reversed if the recoverable amount of the asset subsequently increases in the future.
1.3.5.9 Inventories
Inventories are valued at the lower of cost or net realizable value. Cost comprises purchase costs, production costs and other supply and packaging costs. They are usually computed at the weighted average cost method. Net realizable value is the estimated selling price in the normal course of business, less estimated completion costs and selling costs.
1.3.5.10 Trade account receivables
Trade accounts receivable are initially recognized at fair value, which generally equals the nominal value. Provisions for impairment of receivables are specifically evaluated in each business unit, generally using a default percentage based on the unpaid amounts during one reference period related to revenues for this same period. Thus, for the group’s businesses which are based partly or fully on subscription (Canal+ Group, GVT, and SFR), the depreciation rate of trade account receivables is assessed on the basis of historical account receivables from former customers, primarily on a statistical basis. In addition, account receivables from customers subject to insolvency proceedings or customers with whom Vivendi is involved in litigation or a dispute are generally impaired in full.
1.3.5.11 Cash and cash equivalents
The “cash and cash equivalents” category consists of cash in banks, monetary UCITS, which satisfy AMF position No. 2011-13, and other highly liquid investments with initial maturities of generally three months or less. Investments in securities, investments with initial maturities of more than three months without the possibility of early termination and bank accounts subject to restrictions (blocked accounts), other than restrictions due to regulations specific to a country or activity sector (e.g., exchange controls), are not classified as cash equivalents but as

Tuesday, February 25, 2014
Financial Report and Audited Consolidated Financial Statements for the Year Ended December 31, 2013 Vivendi /58
financial assets. Moreover, the historical performance of the investments is monitored regularly to confirm their cash equivalents accounting classification.
1.3.6 Assets held for sale and discontinued operations
A non-current asset or a group of assets and liabilities is held for sale when its carrying value may be recovered principally through its divestiture and not by its continued utilization. To meet this definition, the asset must be available for immediate sale and the divestiture must be highly probable. These assets and liabilities are recognized as assets held for sale and liabilities associated with assets held for sale, without offset. The related assets recorded as assets held for sale are valued at the lowest value between the fair value (net of divestiture fees) and the carrying value, or cost less accumulated depreciation and impairment losses, and are no longer depreciated.
An operation is qualified as discontinued when it represents a separate major line of business and the criteria for classification as an asset held for sale have been met or when Vivendi has sold the asset. Discontinued operations are reported on a single line of the Statement of Earnings for the periods reported, comprising the earnings after tax of discontinued operations until divestiture and the gain or loss after tax on sale or fair value measurement, less costs to divest the assets and liabilities of the discontinued operations. In addition, cash flows generated by discontinued operations are reported on a separate line of the Statement of Consolidated Cash Flows for the relevant periods.
Accounting principles and valuation methods applicable specifically to Activision Blizzard (video games), a business divested in 2013
Revenue and related costs
The major portion of Activision Blizzard revenue is generated by the sale of boxes for video games, net of a provision for estimated returns and price guarantees as well as rebates, if any. Regarding video games with significant online functionality or Massively Multiplayer Online Role Playing Games, revenues are recorded ratably over the estimated relationship period with the customer, usually and respectively beginning in the month following the shipment or upon activation of the subscription. The estimated relationship period with the customer over which revenues are recognized currently ranges from a minimum of five months to a maximum of less than a year. Costs of sales associated with revenues from the sale of boxes for video games with significant online functionality are recorded ratably according to the same method as for revenues.
Content assets
Licensing activities and internally developed franchises are recognized as contents assets at their acquisition cost or development cost and are amortized over their estimated useful life on the basis of the rate at which the related economic benefits are consumed. This generally leads to an amortization period of 3 to 10 years for licenses, and 11 to 12 years for franchises.
Cost of software for rental, sale or commercialization
Software development costs (video games) are capitalized when, notably, the technical feasibility of the software is established and they are deemed recoverable. These costs are mainly generated by Activision Blizzard as part of the games development process and are amortized using the estimated revenue method (i.e., based on the ratio of the current period’s gross revenues to estimated total gross revenues) for a given product, which generally leads to the amortization of costs over a maximum period of 6 months commencing on a product’s release date. Non-capitalized software development costs are immediately recorded as research and development costs.
1.3.7 Financial liabilities
Long-term and short-term borrowings and other financial liabilities include:
bonds and credit facilities, as well as various other borrowings (including commercial paper and debt related to finance leases) and related accrued interest;
obligations arising in respect of commitments to purchase non-controlling interests; bank overdrafts; and the negative value of other derivative financial instruments. Derivatives with positive values are recorded as financial assets in the
Statement of Financial Position.
Borrowings
All borrowings are initially accounted for at fair value net of transaction costs directly attributable to the borrowing. Borrowings bearing interest are subsequently valued at amortized cost, applying the effective interest method. The effective interest rate is the internal yield rate that exactly discounts future cash flows over the term of the borrowing. In addition, where the borrowing comprises an embedded derivative (e.g., an exchangeable bond) or an equity instrument (e.g., a convertible bond), the amortized cost is calculated for the debt component only, after separation of the embedded derivative or equity instrument. In the event of a change in expected future cash flows (e.g., redemption earlier than initially expected), the amortized cost is adjusted against earnings to reflect the value of the new expected cash flows, discounted at the initial effective interest rate.
Tuesday, February 25, 2014
Financial Report and Audited Consolidated Financial Statements for the Year Ended December 31, 2013 Vivendi /59
Commitments to purchase non-controlling interests
Vivendi has granted commitments to purchase non-controlling interests to certain shareowners of its fully consolidated subsidiaries. These purchase commitments may be optional (e.g., put options) or firm (e.g., forward purchase contracts).
The following accounting treatment has been adopted for commitments granted on or after January 1, 2009:
upon initial recognition, the commitment to purchase non-controlling interests is recognized as a financial liability for the present value of the purchase consideration under the put option or forward purchase contract, mainly offset through the book value of non-controlling interests and the remaining balance through equity attributable to Vivendi SA shareowners;
subsequent changes in the value of the commitment are recognized as a financial liability by an adjustment to equity attributable to Vivendi SA shareowners; and
upon maturity of the commitment, if the non-controlling interests are not purchased, the entries previously recognized are reversed; if the non-controlling interests are purchased, the amount recognized in financial liabilities is reversed, offset by the cash outflow relating to the purchase of the non-controlling interests.
Derivative financial instruments
Vivendi uses derivative financial instruments to manage and reduce its exposure to fluctuations in interest rates, and foreign currency exchange rates. All instruments are either listed on organized markets or traded over-the-counter with highly-rated counterparties. These instruments include interest rate and currency swaps, and forward exchange contracts. All these derivative financial instruments are used for hedging purposes.
When these contracts qualify as hedges for accounting purposes, gains and losses arising on these contracts are offset in earnings against the gains and losses relating to the hedged item. When the derivative financial instrument hedges exposures to fluctuations in the fair value of an asset or a liability recognized in the Statement of Financial Position or of a firm commitment which is not recognized in the Statement of Financial Position, it is a fair value hedge. The instrument is remeasured at fair value in earnings, with the gains or losses arising on remeasurement of the hedged portion of the hedged item offset on the same line of the Statement of Earnings, or, as part of a forecasted transaction relating to a non-financial asset or liability, at the initial cost of the asset or liability. When the derivative financial instrument hedges cash flows, it is a cash flow hedge. The hedging instrument is remeasured at fair value and the portion of the gain or loss that is determined to be an effective hedge is recognized through charges and income directly recognized in equity, whereas its ineffective portion is recognized in earnings, or, as part of a forecasted transaction on a non-financial asset or liability, they are recognized at the initial cost of the asset or liability. When the hedged item is realized, accumulated gains and losses recognized in equity are released to the Statement of Earnings and recorded on the same line as the hedged item. When the derivative financial instrument hedges a net investment in a foreign operation, it is recognized in the same way as a cash flow hedge. Derivative financial instruments which do not qualify as a hedge for accounting purposes are remeasured at fair value and resulting gains and losses are recognized directly in earnings, without remeasurement of the underlying instrument.
Furthermore, income and expenses relating to foreign currency instruments used to hedge highly probable budget exposures and firm commitments contracted pursuant to the acquisition of editorial content rights (including sports, audiovisual and film rights) are recognized in EBIT. In all other cases, gains and losses arising on the fair value remeasurement of instruments are recognized in other financial charges and income.
1.3.8 Other liabilities
Provisions
Provisions are recognized when, at the end of the reporting period, Vivendi has a legal obligation (legal, regulatory or contractual) or a constructive obligation, as a result of past events, and it is probable that an outflow of resources embodying economic benefits will be required to settle the obligation and the obligation can be reliably estimated. Where the effect of the time value of money is material, provisions are discounted to their present value using a pre-tax discount rate that reflects current market assessments of the time value of money. If no reliable estimate can be made of the amount of the obligation, no provision is recorded and a disclosure is made in the Notes to the Consolidated Financial Statements.
Employee benefit plans
In accordance with the laws and practices of each country in which it operates, Vivendi participates in, or maintains, employee benefit plans providing retirement pensions, post-retirement health care, life insurance and post-employment benefits to eligible employees, former employees, retirees and such of their beneficiaries who meet the required conditions. Retirement pensions are provided for substantially all employees through defined contribution plans, which are integrated with local social security and multi-employer plans, or defined benefit plans, which are generally managed via group pension plans. The plan funding policy implemented by the group is consistent with applicable government funding requirements and regulations.

Tuesday, February 25, 2014
Financial Report and Audited Consolidated Financial Statements for the Year Ended December 31, 2013 Vivendi /60
Defined contribution plans
Contributions to defined contribution and multi-employer plans are expensed during the year.
Defined benefit plans
Defined benefit plans may be funded by investments in various instruments such as insurance contracts or equity and debt investment securities, excluding Vivendi shares or debt instruments.
Pension expenses and defined benefit obligations are calculated by independent actuaries using the projected unit credit method. This method is based on annually updated assumptions, which include the probability of employees remaining with Vivendi until retirement, expected changes in future compensation and an appropriate discount rate for each country in which Vivendi maintains a pension plan. The assumptions adopted in 2012 and 2013, and the means of determining these assumptions, are presented in Note 21. A provision is recorded in the Statement of Financial Position equal to the difference between the actuarial value of the related benefits (actuarial liability) and the fair value of any associated plan assets, and includes past service cost and actuarial gains and losses.
The cost of defined benefit plans consists of 3 components recognized as follows:
the service cost is included in selling, general and administrative expenses. It comprises current service cost, past service cost resulting from a plan amendment or a curtailment, immediately recognized in profit and loss, and gains and losses on settlement;
the financial component, recorded in other financial charges and income, consists of the undiscounting of the obligation, less the expected return on plan assets determined using the discount rate retained for the valuation of the benefit obligation; and
the remeasurements of the net defined benefit liability (asset), recognized in items of other comprehensive income not reclassified to profit and loss, mainly consist of actuarial gains and losses, i.e. changes in the present value of the defined benefit obligation and plan assets resulting from changes in actuarial assumptions and experience adjustments (representing the differences between the expected effect of some actuarial assumptions applied to previous valuations and the effective effect).
Where the value of plan assets exceeds benefit obligations, a financial asset is recognized up to the present value of future refunds and the expected reduction in future contributions.
Some other post-employment benefits, such as life insurance and medical coverage (mainly in the United States) are subject to provisions which are assessed through an actuarial computation comparable to the method used for pension provisions.
On January 1, 2004, in accordance with IFRS 1, Vivendi decided to record unrecognized actuarial gains and losses against consolidated equity.
1.3.9 Deferred taxes
Differences existing at closing between the tax base value of assets and liabilities and their carrying value in the Consolidated Statement of Financial Position give rise to temporary differences. Pursuant to the liability method, these temporary differences result in the accounting of:
deferred tax assets, when the tax base value is greater than the carrying value (expected future tax saving); and deferred tax liabilities, when the tax base value is lower than the carrying value (expected future tax expense).
Deferred tax assets and liabilities are measured at the expected tax rates for the year during which the asset will be realized or the liability settled, based on tax rates (and tax regulations) enacted or substantially enacted by the closing date. They are reviewed at the end of each year, in line with any changes in applicable tax rates.
Deferred tax assets are recognized for all deductible temporary differences, tax loss carry-forwards and unused tax credits, insofar as it is probable that a taxable profit will be available, or when a current tax liability exists to make use of those deductible temporary differences, tax loss carry-forwards and unused tax credits, except where the deferred tax asset associated with the deductible temporary difference is generated by initial recognition of an asset or liability in a transaction which is not a business combination, and that, at the transaction date, does not impact earnings, nor tax income or loss.
For deductible temporary differences resulting from investments in subsidiaries, joint ventures and other associated entities, deferred tax assets are recorded to the extent that it is probable that the temporary difference will reverse in the foreseeable future and that a taxable profit will be available against which the temporary difference can be utilized.
The carrying value of deferred tax assets is reviewed at each closing date, and revalued or reduced to the extent that it is more or less probable that a taxable profit will be available to allow the deferred tax asset to be utilized. When assessing the probability of a taxable profit being available, account is taken, primarily, of prior years’ results, forecasted future results, non-recurring items unlikely to occur in the future and the tax strategy. As such, the assessment of the group’s ability to utilize tax losses carried forward is to a large extent judgment-based. If the future taxable results of the group proved to differ significantly from those expected, the group would be required to increase or decrease the carrying value of deferred tax assets with a potentially material impact on the Statement of Financial Position and Statement of Earnings of the group.
Tuesday, February 25, 2014
Financial Report and Audited Consolidated Financial Statements for the Year Ended December 31, 2013 Vivendi /61
Deferred tax liabilities are recognized for all taxable temporary differences, except where the deferred tax liability results from goodwill or initial recognition of an asset or liability in a transaction which is not a business combination, and that, at the transaction date, does not impact earnings, nor tax income or loss.
For taxable temporary differences resulting from investments in subsidiaries, joint ventures and other associated entities, deferred tax liabilities are recorded except to the extent that both of the following conditions are satisfied: the parent, investor or venturer is able to control the timing of the reversal of the temporary difference and it is probable that the temporary difference will not be reversed in the foreseeable future.
Current tax and deferred tax shall be charged or credited directly to equity, and not earnings, if the tax relates to items that are credited or charged directly to equity.
1.3.10 Share-based compensation
With the aim of aligning the interests of its executive management and employees with its shareholders’ interests by providing them with an additional incentive to improve the company’s performance and increase its share price on a long-term basis, Vivendi maintains several share-based compensation plans (share purchase plans, performance share plans, and bonus share plans) or other equity instruments based on the value of the Vivendi share price (stock options), which are settled either in equity instruments or in cash. Grants under these plans are approved by the Management Board and the Supervisory Board. In addition, the definitive grant of stock options and performance shares is contingent upon the achievement of specific performance objectives fixed by the Management Board and the Supervisory Board. Moreover, all granted plans are conditional upon active employment at the vesting date.
In addition, Universal Music Group maintains Equity Long-Term Incentive Plans. Under these plans, certain key executives are awarded equity units, which are settled in cash. These equity units are phantom stock units whose value is intended to reflect the value of Universal Music Group.
Please refer to Note 22 for details of the features of these plans.
Share-based compensation is recognized as a personnel cost at the fair value of the equity instruments granted. This expense is spread over the vesting period, i.e. 3 years for stock option plans and 2 years for performance shares and bonus share plans at Vivendi, other than in specific cases.
Vivendi use a binomial model to assess the fair value of such instruments. This method relies on assumptions updated at the valuation date such as the computed volatility of the relevant shares, the discount rate corresponding to the risk-free interest rate, the expected dividend yield, and the probability of relevant managers and employees remaining employed within the group until the exercise of their rights.
However, depending on whether the equity instruments granted are equity-settled or cash-settled, the valuation and recognition of the expense will differ:
Equity-settled instruments: the expected term of the option granted is deemed to be the mid-point between the vesting date and the end of the contractual
term; the value of the instruments granted is estimated and fixed at grant date; and the expense is recognized with a corresponding increase in equity.
Cash-settled instruments: the expected term of the instruments granted is deemed to be equal to one-half of the residual contractual term of the instrument
for vested rights, and to the average of the residual vesting period at the remeasurement date and the residual contractual term of the instrument for unvested rights;
the value of instruments granted is initially estimated at grant date and is then re-estimated at each reporting date until the payment date and the expense is adjusted pro rata taking into account the vested rights at each such reporting date;
the expense is recognized as a provision; and moreover, as plans settled in cash are primarily denominated in US dollars, the value fluctuates based on the EUR/USD exchange
rate.
Share-based compensation cost is allocated to each operating segment, pro rata the number of equity instruments or equivalent instruments granted to their managers and employees.
The dilutive effect of stock options and performance shares settled in equity through the issuance of Vivendi shares which are in the process of vesting is reflected in the calculation of diluted earnings per share.
In accordance with IFRS 1, Vivendi elected to retrospectively apply IFRS 2 as of January 1, 2004. Consequently, all share-based compensation plans for which rights remained to be vested as of January 1, 2004 were accounted for in accordance with IFRS 2.

Tuesday, February 25, 2014
Financial Report and Audited Consolidated Financial Statements for the Year Ended December 31, 2013 Vivendi /62
1.4 Related parties
Group-related parties are those companies over which the group exercises exclusive control, joint control or significant influence, shareholders exercising joint control over group joint ventures, non-controlling interests exercising significant influence over group subsidiaries, corporate officers, group management and directors and companies over which the latter exercise exclusive control, joint control, or significant influence.
The transactions realized with subsidiaries over which the group exercises a control are eliminated in the intersegment operations (a list of the principal consolidated subsidiaries is presented in Note 29). Moreover, commercial relationships among subsidiaries of the group, aggregated in operating segments, are conducted on an arm’s length basis under terms and conditions similar to those which would be offered by third parties. The operating costs of Vivendi SA’s headquarters in Paris and of its New York City office, after the allocation of a portion of these costs to each of the group’s businesses, are included in the Holding and Corporate operating segment. (Please refer to Note 3 for a detailed description of the transactions between the parent company and the subsidiaries of the group, aggregated by operating segments).
1.5 Contractual obligations and contingent assets and liabilities
Once a year, Vivendi and its subsidiaries prepare detailed reports on all material contractual obligations, commercial and financial commitments and contingent obligations, for which they are jointly and severally liable. These detailed reports are updated by the relevant departments and reviewed by senior management on a regular basis. To ensure completeness, accuracy and consistency of these reports, some dedicated internal control procedures are performed, including (but not limited to) the review of:
minutes of meetings of the shareholders, Management Board, Supervisory Board and committees of the Supervisory Board in respect of matters such as contracts, litigation, and authorization of asset acquisitions or divestitures;
pledges and guarantees with banks and financial institutions; pending litigation, claims (in dispute) and environmental matters as well as related assessments for unrecorded contingencies with
internal and/or external legal counsels; tax examiner’s reports and, if applicable, notices of reassessments and tax expense analyses for prior years; insurance coverage for unrecorded contingencies with the risk management department and insurance agents and brokers with
whom the group contracted; related-party transactions for guarantees and other given or received commitments; and more generally major contracts and agreements.
1.6 New IFRS standards and IFRIC interpretations that have been published but are not yet effective
The IFRS standards that have been published by the IASB, which are not yet effective but which have been applied in anticipation are detailed in Note 1.1.
Among other IFRS accounting standards and IFRIC interpretations issued by the IASB/IFRIC at the date of approval of these Consolidated Financial Statements, but which are not yet effective, and for which Vivendi has not elected for an earlier application and which may have an impact on Vivendi include mainly IFRIC 21 interpretation Levies, issued by IFRIC on May 20, 2013, which applies mandatorily from January 1, 2014. IFRIC 21 addresses the accounting for a liability to pay a levy that is imposed by governments on entities in accordance with legislation (i.e., laws and/or regulations), except for income tax and value-added taxes. Applying this interpretation would lead to modifying, where necessary, the determination of the obligating event that triggers the recognition of the liability.
Vivendi is currently assessing the potential impact on the Statement of Comprehensive Income, the Statement of Financial Position, the Statement of Cash Flows, and the content of the Notes to the Consolidated Financial Statements in applying this interpretation.
Tuesday, February 25, 2014
Financial Report and Audited Consolidated Financial Statements for the Year Ended December 31, 2013 Vivendi /63
Note 2 Major changes in the scope of consolidation
Ongoing strategic review
As publicly announced to shareholders on several occasions in 2012 and 2013, Vivendi’s Management Board and Supervisory Board are carrying out a review of the group’s strategic development. In 2013, Vivendi sold most of its interest in Activision Blizzard and entered into a definitive agreement with Etisalat to sell its interest in Maroc Telecom. The group has decided to focus on its media and content activities, which hold leading positions and are taking advantage of the growing digital market. It has strengthened its presence in Canal+ France, now fully owned. Vivendi is also reshaping SFR. The operator has begun to benefit from its transformation plan, by re-taking the commercial lead and by reducing costs. SFR has also entered into an agreement to share part of its mobile network with Bouygues Telecom, allowing it to offer better coverage and strengthened service quality to its customers. Based on this, the group aims to position the future Vivendi as a dynamic player in media and content. With SFR, it intends to participate in the reorganization of the telecommunication sector in France, exploring actively all potential opportunities.
During the second half of 2013, the group reached important strategic milestones:
on October 11, 2013, Vivendi completed the sale of 88% of its interest in Activision Blizzard for $8.2 billion (or €6 billion), in cash. In addition, Vivendi retained 83 million Activision Blizzard shares, representing 11.9% of Activision Blizzard’s outstanding share capital, which are subject to a staggered 15-month lock-up period;
on November 4, 2013, Vivendi entered into a definitive agreement with Etisalat for the sale of Vivendi’s 53% interest in Maroc Telecom group for €4.2 billion in cash, including a €310 million dividend distribution with respect to fiscal year 2012, according to the financial terms known to date. Completion of this transaction is contingent upon the satisfaction of certain closing conditions, including receipt of required regulatory approvals in Morocco and the countries in which Maroc Telecom group operates, as well as finalization of the shareholders’ agreement between Etisalat and the Kingdom of Morocco. This transaction is expected to be completed during the first months of 2014 (please refer to Note 7); and
on November 5, 2013, Vivendi acquired Lagardère Group’s 20% interest in Canal+ France for €1,020 million in cash.
As a result of the sale of Activision Blizzard, Vivendi has begun to significantly reduce its debt during the fourth quarter of 2013 by implementing a US dollar and euro bond repurchase program in an aggregate amount of €3 billion; thus gaining greater financial flexibility (please refer to Note 24).
2.1 Planned demerger of the group
On November 26, 2013, Vivendi’s Supervisory Board approved the group’s planned demerger to form two separate companies: (i) a new international media group based in France, with very strong positions in music (as the worldwide leader), in European cinema, in pay-TV in France, Africa, Vietnam, and Poland, and in the Internet and associated services in Brazil, and (ii) SFR. The decision to implement this project could be taken in the near future and, if appropriate, submitted to the General Shareholders' Meeting for approval on June 24, 2014.
Vivendi considers that the conditions for the application of IFRS 5 to the proposed demerger in the 2013 Financial Statements are not met.
2.2 Acquisition of Lagardère group’s non-controlling interest in Canal+ France
On November 5, 2013, Vivendi acquired Lagardère Group’s 20% interest in Canal+ France, for €1,020 million in cash. In accordance with IFRS 10, Vivendi recorded this transaction as an acquisition of a non-controlling interest. The difference between the consideration paid and the carrying value of acquired non-controlling interest was recorded as a deduction from equity attributable to Vivendi SA shareowners (-€636 million). In addition, Vivendi and Lagardère Group have settled all disputes between them (please refer to Note 28). Thereafter, Canal+ France S.A. was merged with and into Canal+ Group S.A., pursuant to a simplified merger, with retroactive effect to January 1, 2013.
2.3 Completion of the acquisition of EMI Recorded Music by Vivendi and Universal Music Group (UMG)
As a reminder, on September 28, 2012 Vivendi and UMG completed the acquisition of 100% of the recorded music business of EMI Group Global Limited (EMI Recorded Music). EMI Recorded Music has been fully consolidated since that date. The purchase price, in enterprise value, amounted to £1,130 million (€1,404 million). The authorization by the European Commission was notably conditional upon the divestment of the Parlophone, Now, and Mute labels. In accordance with IFRS 5, Vivendi reported these assets as assets held for sale at market value (less costs to sell), in the Statements of Financial Position, until completion of the sale.
On February 7, 2013, Vivendi and UMG announced that they had entered into an agreement for the sale of Parlophone Label Group to Warner Music Group for an enterprise value of £487 million to be paid in cash. Following the approval by the European Commission on May 15, 2013, the sale of Parlophone Label Group was completed on July 1, 2013 and Vivendi received a consideration of £501 million (€591 million), including the provisional estimated contractual price adjustments (£14 million).
Moreover, the divestments of Sanctuary, Now, and Mute were completed.
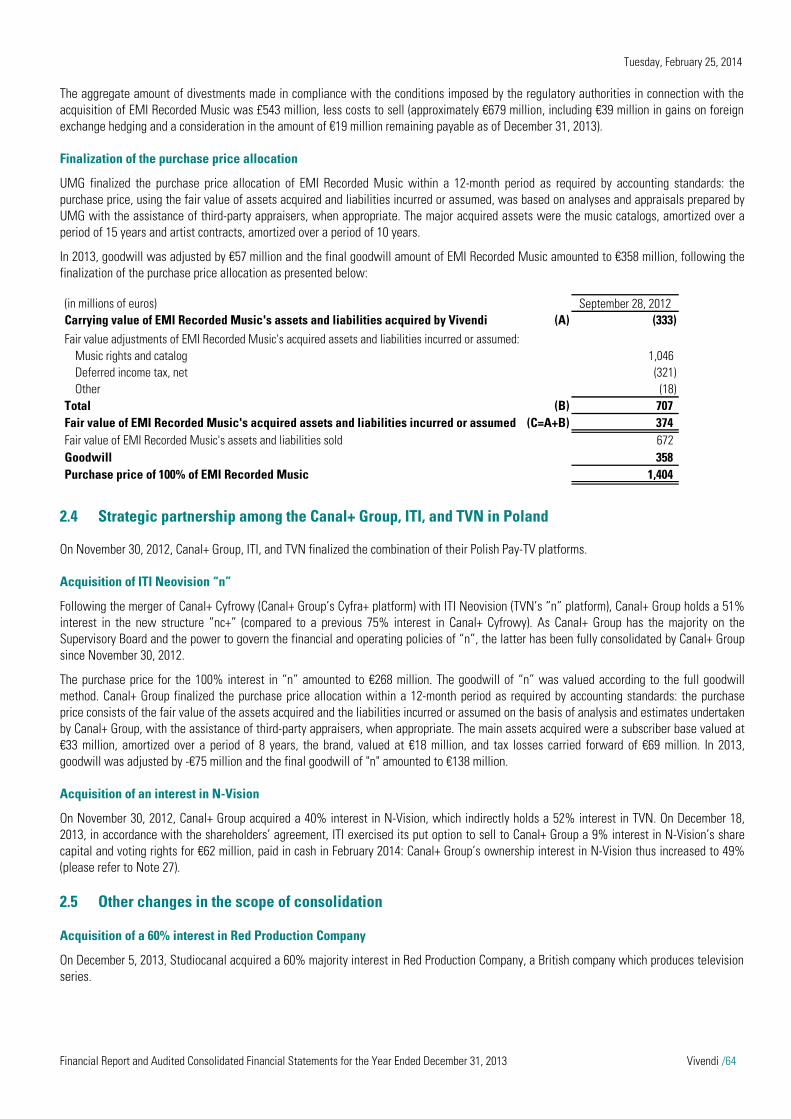
Tuesday, February 25, 2014
Financial Report and Audited Consolidated Financial Statements for the Year Ended December 31, 2013 Vivendi /64
The aggregate amount of divestments made in compliance with the conditions imposed by the regulatory authorities in connection with the acquisition of EMI Recorded Music was £543 million, less costs to sell (approximately €679 million, including €39 million in gains on foreign exchange hedging and a consideration in the amount of €19 million remaining payable as of December 31, 2013).
Finalization of the purchase price allocation
UMG finalized the purchase price allocation of EMI Recorded Music within a 12-month period as required by accounting standards: the purchase price, using the fair value of assets acquired and liabilities incurred or assumed, was based on analyses and appraisals prepared by UMG with the assistance of third-party appraisers, when appropriate. The major acquired assets were the music catalogs, amortized over a period of 15 years and artist contracts, amortized over a period of 10 years.
In 2013, goodwill was adjusted by €57 million and the final goodwill amount of EMI Recorded Music amounted to €358 million, following the finalization of the purchase price allocation as presented below:
2.4 Strategic partnership among the Canal+ Group, ITI, and TVN in Poland
On November 30, 2012, Canal+ Group, ITI, and TVN finalized the combination of their Polish Pay-TV platforms.
Acquisition of ITI Neovision “n”
Following the merger of Canal+ Cyfrowy (Canal+ Group’s Cyfra+ platform) with ITI Neovision (TVN’s ”n” platform), Canal+ Group holds a 51% interest in the new structure ”nc+” (compared to a previous 75% interest in Canal+ Cyfrowy). As Canal+ Group has the majority on the Supervisory Board and the power to govern the financial and operating policies of “n”, the latter has been fully consolidated by Canal+ Group since November 30, 2012.
The purchase price for the 100% interest in “n” amounted to €268 million. The goodwill of “n” was valued according to the full goodwill method. Canal+ Group finalized the purchase price allocation within a 12-month period as required by accounting standards: the purchase price consists of the fair value of the assets acquired and the liabilities incurred or assumed on the basis of analysis and estimates undertaken by Canal+ Group, with the assistance of third-party appraisers, when appropriate. The main assets acquired were a subscriber base valued at €33 million, amortized over a period of 8 years, the brand, valued at €18 million, and tax losses carried forward of €69 million. In 2013, goodwill was adjusted by -€75 million and the final goodwill of "n" amounted to €138 million.
Acquisition of an interest in N-Vision
On November 30, 2012, Canal+ Group acquired a 40% interest in N-Vision, which indirectly holds a 52% interest in TVN. On December 18, 2013, in accordance with the shareholders’ agreement, ITI exercised its put option to sell to Canal+ Group a 9% interest in N-Vision’s share capital and voting rights for €62 million, paid in cash in February 2014: Canal+ Group’s ownership interest in N-Vision thus increased to 49% (please refer to Note 27).
2.5 Other changes in the scope of consolidation
Acquisition of a 60% interest in Red Production Company
On December 5, 2013, Studiocanal acquired a 60% majority interest in Red Production Company, a British company which produces television series.
(in millions of euros) September 28, 2012Carrying value of EMI Recorded Music's assets and liabilities acquired by Vivendi (A) (333)Fair value adjustments of EMI Recorded Music's acquired assets and liabilities incurred or assumed:
Music rights and catalog 1,046Deferred income tax, net (321)Other (18)
Total (B) 707Fair value of EMI Recorded Music's acquired assets and liabilities incurred or assumed (C=A+B) 374Fair value of EMI Recorded Music's assets and liabilities sold 672Goodwill 358Purchase price of 100% of EMI Recorded Music 1,404
Tuesday, February 25, 2014
Financial Report and Audited Consolidated Financial Statements for the Year Ended December 31, 2013 Vivendi /65
2.6 Transactions underway as of December 31, 2013
Agreement to share a part of SFR’s mobile access networks
On January 31, 2014, SFR and Bouygues Telecom entered into a strategic agreement to share a part of their mobile access networks, following a period of negotiations announced in July 2013. They will roll out a new shared network in an area covering 57% of the French population. This agreement will enable both operators to improve their mobile coverage and generate significant savings over time.
The agreement is based on two principles: the creation of a joint company, to manage the shared base station assets; and entry by the operators into a RAN-sharing service agreement covering 2G, 3G, and 4G services in the shared area.
This network-sharing agreement is similar to numerous arrangements already existing in other European countries. Each operator will retain its own innovation capacity as well as complete commercial and pricing independence.
The network-sharing agreement took effect upon the signing of the agreement and the shared network is expected to be completed by the end of 2017.
From an accounting perspective, this agreement had no impact on the accounts for fiscal year 2013.
Acquisition of a 51% interest in Mediaserv by Canal+ Group
On July 12, 2013, Canal+ Overseas entered into an agreement with Loret Group to acquire a 51% majority interest in Mediaserv, an overseas telecom operator. On February 10, 2014, the French Competition Authority approved this acquisition, which was completed on February 13, 2014.
Tuesday, February 25, 2014
Financial Report and Audited Consolidated Financial Statements for the Year Ended December 31, 2013 Vivendi /66
Note 3 Segment data
3.1 Operating segment data
The Vivendi group comprises several businesses that are leaders in the worlds of content, media, and telecommunications. Each business offers different products and services that are marketed through different channels. Given the unique customer base, technology, marketing and distribution requirements of each of these businesses, they are managed separately and represent the base of the internal reporting of the group. The Vivendi group has the following four main businesses:
Canal+ Group: publishing and distribution of premium and thematic pay-TV channels as well as free-to-air channels in metropolitan France, Poland, francophone Africa, French overseas territories and Vietnam as well as cinema film production and distribution in Europe;
Universal Music Group: sale of recorded music, including that of EMI Recorded Music since September 28, 2012, (physical and digital media), exploitation of music publishing rights as well as artist services and merchandising;
GVT: a Brazilian fixed telecommunication and broadband Internet operator as well as a Brazilian pay-TV provider; and
SFR: a telecommunication operator (mobile, broadband Internet, and fixed telecommunications) in France.
Vivendi Management evaluates the performance of these operating segments and allocates necessary resources to them based on certain operating indicators (segment earnings and cash flow from operations). Segment earnings relate to the EBITA of each business segment.
Additionally, segment data is prepared according to the following principles:
the operating segment “Other operations” includes operations peripheral to the group, notably, See Tickets (a British ticketing company), Digitick (the French leader in web ticketing), Wengo (the French leader in expert advisory services by phone), and Watchever (sale of digital content on the Internet, mainly in Germany);
the operating segment “Holding & Corporate” includes the cost of Vivendi SA’s headquarters in Paris and of its New York City office, after the allocation of a portion of these costs to each of the businesses;
intersegment commercial relations are conducted on an arm’s length basis on terms and conditions similar to those which would be offered by third parties; and
the operating segments presented hereunder are strictly identical to the information given to Vivendi’s Management Board.
In addition, Vivendi’s interests in Activision Blizzard and Maroc Telecom group, discontinued businesses as of December 31, 2013 (please refer to Note 7), are no longer reported in segment data as a result of the application of IFRS 5 (Non-current Assets Held for Sale and Discontinued Operations):
- the 2012 Consolidated Statement of Earnings and 2012 Consolidated Statement of Cash Flows were adjusted to ensure consistency of information; and
- Maroc Telecom group’s assets and liabilities were reclassified as unallocated assets as of December 31, 2013.
Moreover, as of January 1, 2013, Vivendi applied, with retrospective effect as from January 1, 2012, amended IAS 19 (Employee Benefits), whose application is mandatory in the European Union beginning on or after January 1, 2013 (please refer to Note 1).
For a detailed description of the adjustments made to the previously published Financial Statements, please refer to Note 33.
As of December 31, 2013, Vivendi also presented data categorized according to five geographic regions, consisting of its four main geographic markets (France, Rest of Europe, United States, and Brazil), as well as the rest of the world.
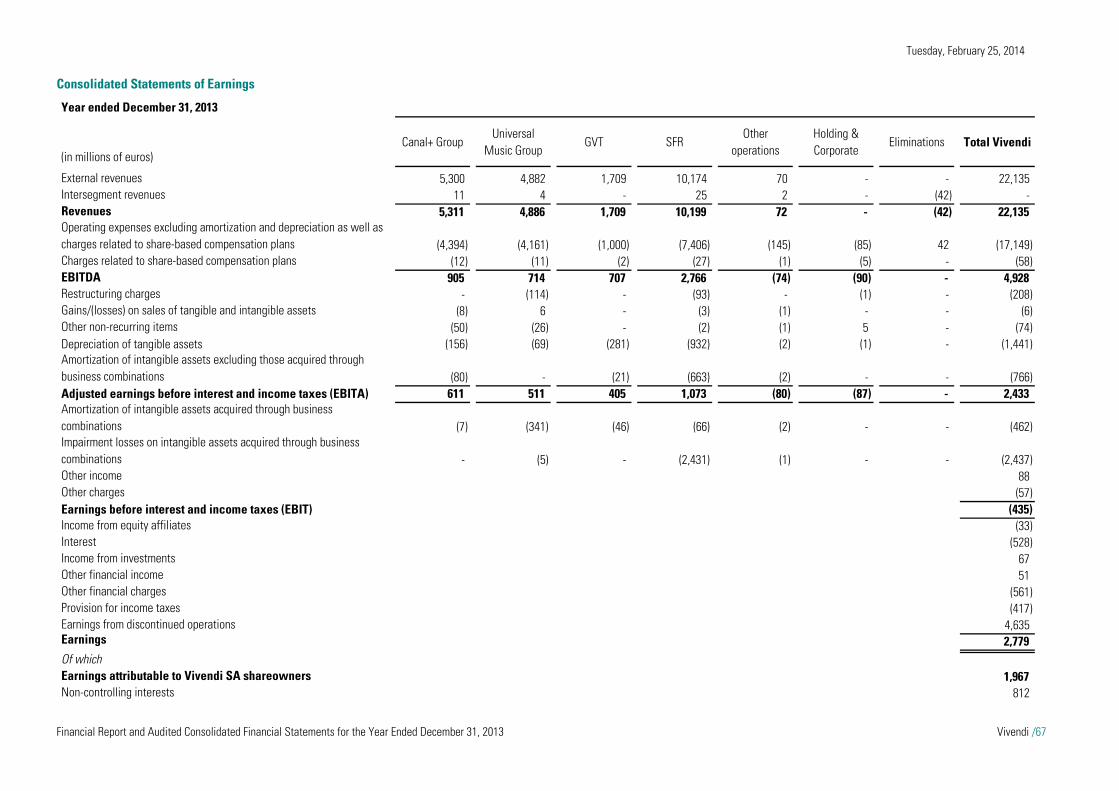
Tuesday, February 25, 2014
Financial Report and Audited Consolidated Financial Statements for the Year Ended December 31, 2013 Vivendi /67
Consolidated Statements of Earnings
Year ended December 31, 2013
(in millions of euros)Canal+ Group
Universal Music Group
GVT SFROther
operationsHolding & Corporate
Eliminations Total Vivendi
External revenues 5,300 4,882 1,709 10,174 70 - - 22,135Intersegment revenues 11 4 - 25 2 - (42) -Revenues 5,311 4,886 1,709 10,199 72 - (42) 22,135Operating expenses excluding amortization and depreciation as well as charges related to share-based compensation plans (4,394) (4,161) (1,000) (7,406) (145) (85) 42 (17,149)Charges related to share-based compensation plans (12) (11) (2) (27) (1) (5) - (58)EBITDA 905 714 707 2,766 (74) (90) - 4,928Restructuring charges - (114) - (93) - (1) - (208)Gains/(losses) on sales of tangible and intangible assets (8) 6 - (3) (1) - - (6)Other non-recurring items (50) (26) - (2) (1) 5 - (74)Depreciation of tangible assets (156) (69) (281) (932) (2) (1) - (1,441)Amortization of intangible assets excluding those acquired through business combinations (80) - (21) (663) (2) - - (766)Adjusted earnings before interest and income taxes (EBITA) 611 511 405 1,073 (80) (87) - 2,433Amortization of intangible assets acquired through business combinations (7) (341) (46) (66) (2) - - (462)Impairment losses on intangible assets acquired through business combinations - (5) - (2,431) (1) - - (2,437)Other income 88Other charges (57)Earnings before interest and income taxes (EBIT) (435)Income from equity affiliates (33)Interest (528)Income from investments 67Other financial income 51Other financial charges (561)Provision for income taxes (417)Earnings from discontinued operations 4,635Earnings 2,779Of whichEarnings attributable to Vivendi SA shareowners 1,967Non-controlling interests 812
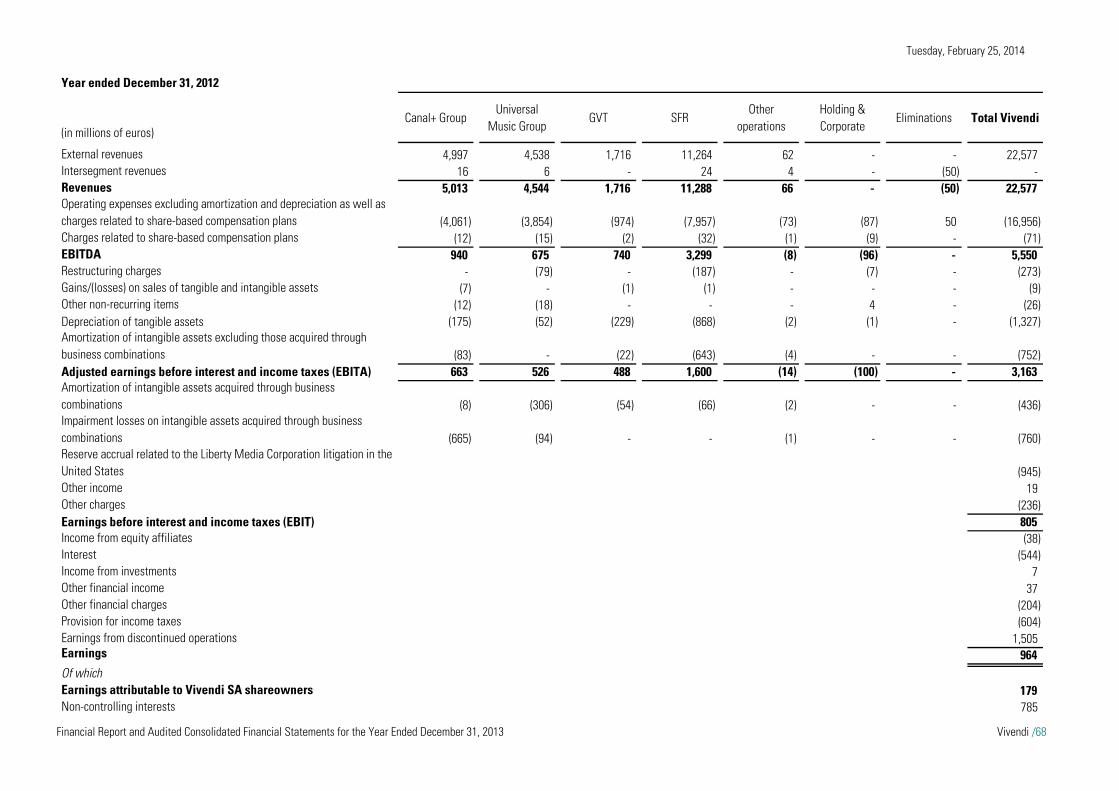
Tuesday, February 25, 2014
Financial Report and Audited Consolidated Financial Statements for the Year Ended December 31, 2013 Vivendi /68
Year ended December 31, 2012
(in millions of euros)Canal+ Group
Universal Music Group
GVT SFROther
operationsHolding & Corporate
Eliminations Total Vivendi
External revenues 4,997 4,538 1,716 11,264 62 - - 22,577Intersegment revenues 16 6 - 24 4 - (50) -Revenues 5,013 4,544 1,716 11,288 66 - (50) 22,577Operating expenses excluding amortization and depreciation as well as charges related to share-based compensation plans (4,061) (3,854) (974) (7,957) (73) (87) 50 (16,956)Charges related to share-based compensation plans (12) (15) (2) (32) (1) (9) - (71)EBITDA 940 675 740 3,299 (8) (96) - 5,550Restructuring charges - (79) - (187) - (7) - (273)Gains/(losses) on sales of tangible and intangible assets (7) - (1) (1) - - - (9)Other non-recurring items (12) (18) - - - 4 - (26)Depreciation of tangible assets (175) (52) (229) (868) (2) (1) - (1,327)Amortization of intangible assets excluding those acquired through business combinations (83) - (22) (643) (4) - - (752)Adjusted earnings before interest and income taxes (EBITA) 663 526 488 1,600 (14) (100) - 3,163Amortization of intangible assets acquired through business combinations (8) (306) (54) (66) (2) - - (436)Impairment losses on intangible assets acquired through business combinations (665) (94) - - (1) - - (760)Reserve accrual related to the Liberty Media Corporation litigation in the United States (945)Other income 19Other charges (236)Earnings before interest and income taxes (EBIT) 805Income from equity affiliates (38)Interest (544)Income from investments 7Other financial income 37Other financial charges (204)Provision for income taxes (604)Earnings from discontinued operations 1,505Earnings 964Of whichEarnings attributable to Vivendi SA shareowners 179Non-controlling interests 785
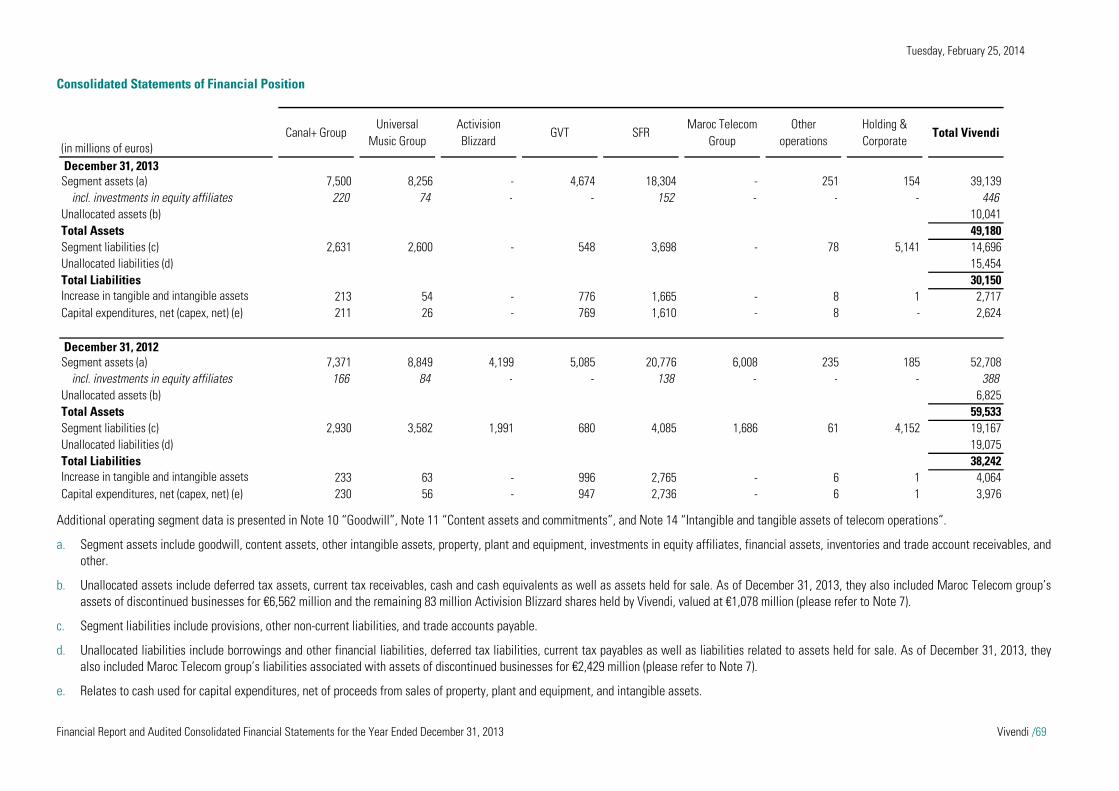
Tuesday, February 25, 2014
Financial Report and Audited Consolidated Financial Statements for the Year Ended December 31, 2013 Vivendi /69
Consolidated Statements of Financial Position
Additional operating segment data is presented in Note 10 “Goodwill”, Note 11 “Content assets and commitments”, and Note 14 “Intangible and tangible assets of telecom operations”.
a. Segment assets include goodwill, content assets, other intangible assets, property, plant and equipment, investments in equity affiliates, financial assets, inventories and trade account receivables, and other.
b. Unallocated assets include deferred tax assets, current tax receivables, cash and cash equivalents as well as assets held for sale. As of December 31, 2013, they also included Maroc Telecom group’s assets of discontinued businesses for €6,562 million and the remaining 83 million Activision Blizzard shares held by Vivendi, valued at €1,078 million (please refer to Note 7).
c. Segment liabilities include provisions, other non-current liabilities, and trade accounts payable.
d. Unallocated liabilities include borrowings and other financial liabilities, deferred tax liabilities, current tax payables as well as liabilities related to assets held for sale. As of December 31, 2013, they also included Maroc Telecom group’s liabilities associated with assets of discontinued businesses for €2,429 million (please refer to Note 7).
e. Relates to cash used for capital expenditures, net of proceeds from sales of property, plant and equipment, and intangible assets.
(in millions of euros)Canal+ Group
Universal Music Group
Activision Blizzard
GVT SFRMaroc Telecom
GroupOther
operationsHolding & Corporate
Total Vivendi
December 31, 2013Segment assets (a) 7,500 8,256 - 4,674 18,304 - 251 154 39,139
incl. investments in equity affiliates 220 74 - - 152 - - - 446Unallocated assets (b) 10,041Total Assets 49,180Segment liabilities (c) 2,631 2,600 - 548 3,698 - 78 5,141 14,696Unallocated liabilities (d) 15,454Total Liabilities 30,150Increase in tangible and intangible assets 213 54 - 776 1,665 - 8 1 2,717Capital expenditures, net (capex, net) (e) 211 26 - 769 1,610 - 8 - 2,624
December 31, 2012Segment assets (a) 7,371 8,849 4,199 5,085 20,776 6,008 235 185 52,708
incl. investments in equity affiliates 166 84 - - 138 - - - 388Unallocated assets (b) 6,825Total Assets 59,533Segment liabilities (c) 2,930 3,582 1,991 680 4,085 1,686 61 4,152 19,167Unallocated liabilities (d) 19,075Total Liabilities 38,242Increase in tangible and intangible assets 233 63 - 996 2,765 - 6 1 4,064Capital expenditures, net (capex, net) (e) 230 56 - 947 2,736 - 6 1 3,976
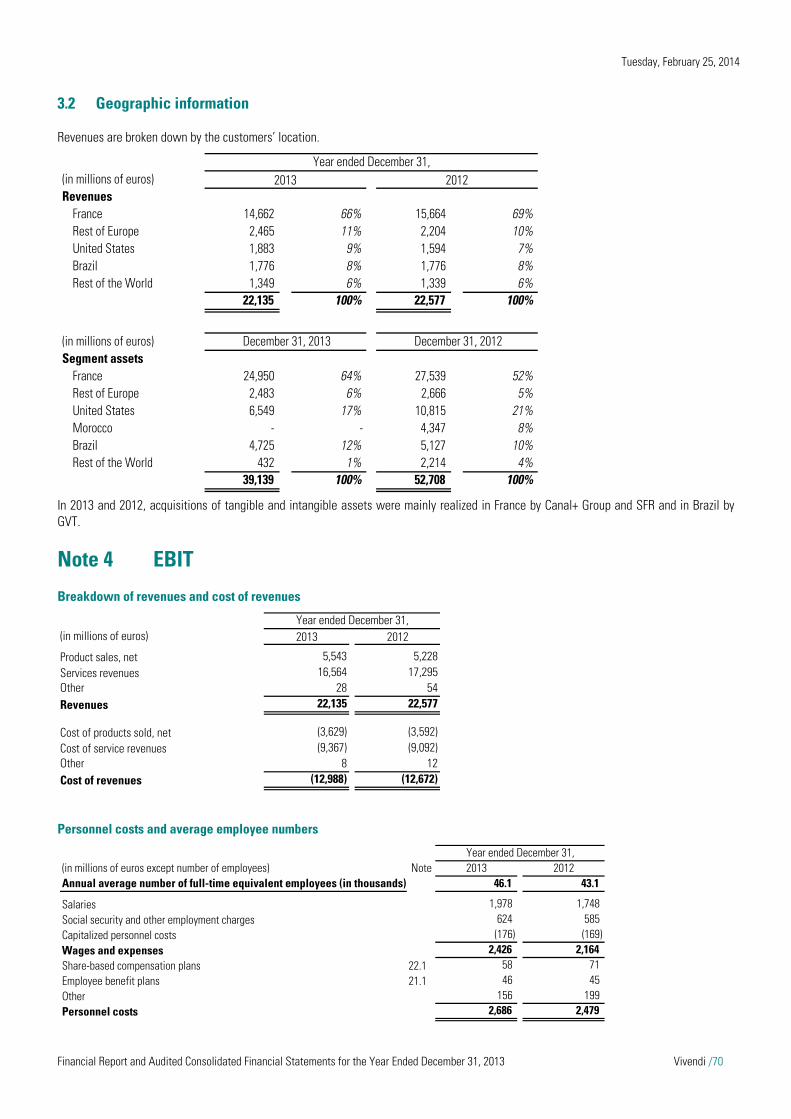
Tuesday, February 25, 2014
Financial Report and Audited Consolidated Financial Statements for the Year Ended December 31, 2013 Vivendi /70
3.2 Geographic information
Revenues are broken down by the customers’ location.
In 2013 and 2012, acquisitions of tangible and intangible assets were mainly realized in France by Canal+ Group and SFR and in Brazil by GVT.
Note 4 EBIT
Breakdown of revenues and cost of revenues
Personnel costs and average employee numbers
(in millions of euros)Revenues
France 14,662 66% 15,664 69%Rest of Europe 2,465 11% 2,204 10%United States 1,883 9% 1,594 7%Brazil 1,776 8% 1,776 8%Rest of the World 1,349 6% 1,339 6%
22,135 100% 22,577 100%
(in millions of euros)Segment assets
France 24,950 64% 27,539 52%Rest of Europe 2,483 6% 2,666 5%United States 6,549 17% 10,815 21%Morocco - - 4,347 8%Brazil 4,725 12% 5,127 10%Rest of the World 432 1% 2,214 4%
39,139 100% 52,708 100%
December 31, 2013 December 31, 2012
Year ended December 31,2013 2012
(in millions of euros) 2013 2012
Product sales, net 5,543 5,228Services revenues 16,564 17,295Other 28 54Revenues 22,135 22,577
Cost of products sold, net (3,629) (3,592)Cost of service revenues (9,367) (9,092)Other 8 12Cost of revenues (12,988) (12,672)
Year ended December 31,
(in millions of euros except number of employees) Note 2013 2012Annual average number of full-time equivalent employees (in thousands) 46.1 43.1
Salaries 1,978 1,748Social security and other employment charges 624 585Capitalized personnel costs (176) (169)Wages and expenses 2,426 2,164Share-based compensation plans 22.1 58 71Employee benefit plans 21.1 46 45Other 156 199Personnel costs 2,686 2,479
Year ended December 31,
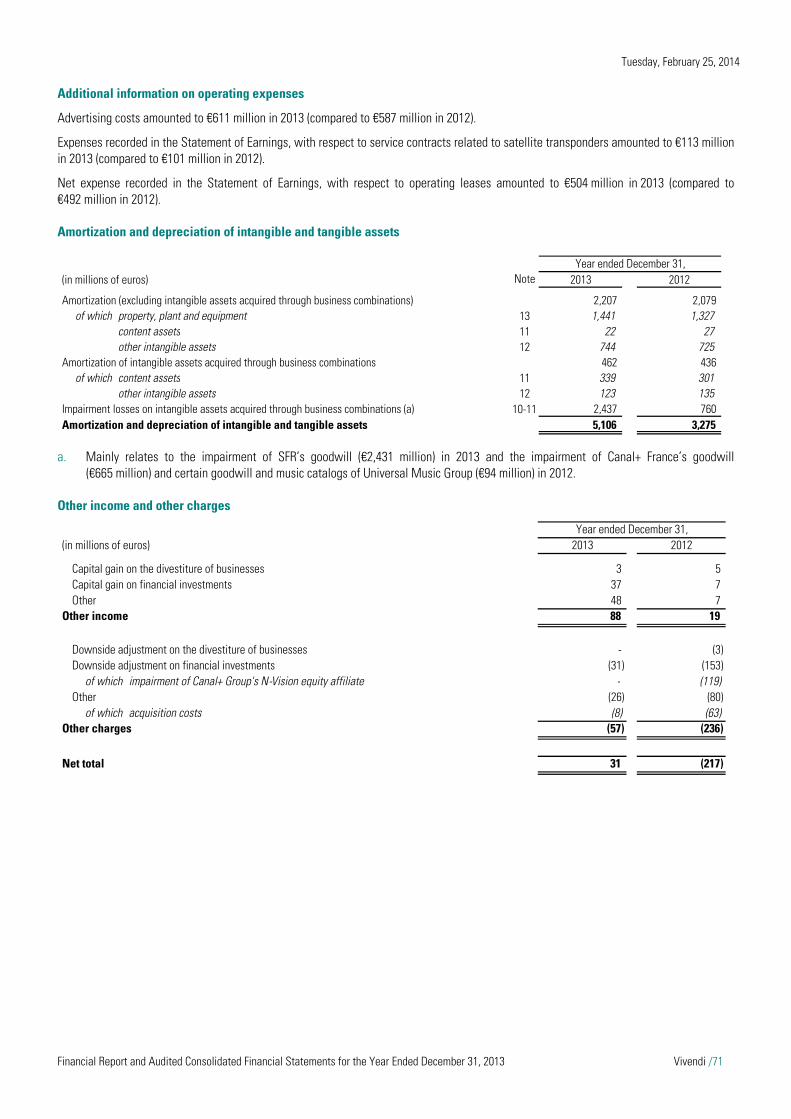
Tuesday, February 25, 2014
Financial Report and Audited Consolidated Financial Statements for the Year Ended December 31, 2013 Vivendi /71
Additional information on operating expenses
Advertising costs amounted to €611 million in 2013 (compared to €587 million in 2012).
Expenses recorded in the Statement of Earnings, with respect to service contracts related to satellite transponders amounted to €113 million in 2013 (compared to €101 million in 2012).
Net expense recorded in the Statement of Earnings, with respect to operating leases amounted to €504 million in 2013 (compared to €492 million in 2012).
Amortization and depreciation of intangible and tangible assets
a. Mainly relates to the impairment of SFR’s goodwill (€2,431 million) in 2013 and the impairment of Canal+ France’s goodwill (€665 million) and certain goodwill and music catalogs of Universal Music Group (€94 million) in 2012.
Other income and other charges
(in millions of euros) Note 2013 2012
Amortization (excluding intangible assets acquired through business combinations) 2,207 2,079of which property, plant and equipment 13 1,441 1,327
content assets 11 22 27other intangible assets 12 744 725
Amortization of intangible assets acquired through business combinations 462 436of which content assets 11 339 301
other intangible assets 12 123 135Impairment losses on intangible assets acquired through business combinations (a) 10-11 2,437 760Amortization and depreciation of intangible and tangible assets 5,106 3,275
Year ended December 31,
(in millions of euros) Note 2013 2012
Capital gain on the divestiture of businesses 3 5Capital gain on financial investments 37 7Other 48 7
Other income 88 19
Downside adjustment on the divestiture of businesses - (3)Downside adjustment on financial investments (31) (153)
of which impairment of Canal+ Group's N-Vision equity affiliate - (119)Other (26) (80)
of which acquisition costs (8) (63)Other charges (57) (236)
Net total 31 (217)
Year ended December 31,

Tuesday, February 25, 2014
Financial Report and Audited Consolidated Financial Statements for the Year Ended December 31, 2013 Vivendi /72
Note 5 Financial charges and income
Interest
Other financial income and charges
a. In accordance with accounting standards, when the effect of the time value of money is material, assets and liabilities are initially
recorded on the Statement of Financial Position in an amount corresponding to the present value of the expected revenues and expenses. At the end of each subsequent period, the present value of such assets and liabilities is adjusted to account for the passage of time. As of December 31, 2013 and 2012, these adjustments only applied to liabilities (mainly trade accounts payable and provisions).
Year ended December 31,(in millions of euros) 2013 2012(Charge)/IncomeInterest expense on borrowings (553) (572)Interest income from cash and cash equivalents 25 28Interest (528) (544)
Fees and premiums on borrowings and credit facilities issued/redeemed and early unwinding of hedging derivative instruments (207) (15)
(735) (559)
(in millions of euros) Note 2013 2012
Expected return on plan assets related to employee benefit plans 21.2 13 13Foreign exchange gain 38 -
of which GVT's euro borrowing to Vivendi SA 24 38 -Change in value of derivative instruments - 23Other - 1
Other financial income 51 37
Effect of undiscounting liabilities (a) (28) (31)Interest cost related to employee benefit plans 21.2 (33) (36)Fees and premiums on borrowings and credit facilities issued/redeemed and early unwinding of hedging derivative instruments (207) (15)Foreign exchange loss (270) (103)
of which GVT's euro borrowing to Vivendi SA 24 (224) (76)Change in value of derivative instruments (1) -Other (22) (19)
Other financial charges (561) (204)
Net total (510) (167)
Year ended December 31,

Tuesday, February 25, 2014
Financial Report and Audited Consolidated Financial Statements for the Year Ended December 31, 2013 Vivendi /73
Note 6 Income taxes
6.1 French Tax Group and Consolidated Global Profit Tax Systems
Vivendi SA benefits from the French Tax Group System and considers that it benefited, until December 31, 2011 inclusive, from the Consolidated Global Profit Tax System, as authorized under Article 209 quinquies of the French Tax Code. Therefore, since January 1, 2012, Vivendi only benefits from the French Tax Group System.
Under the French Tax Group System, Vivendi is entitled to consolidate its own tax profits and losses with the tax profits and losses of subsidiaries that are at least 95% owned directly or indirectly, and that are located in France: for 2013, this applied to Universal Music in France, SFR, and Canal+ Group.
Until December 31, 2011, the Consolidated Global Profit Tax System entitled Vivendi to consolidate its own tax profits and losses with the tax profits and losses of subsidiaries that are at least 50% owned directly or indirectly, and that are located in France or abroad, i.e., besides the French companies that are at least 95% owned directly or indirectly by Vivendi: Activision Blizzard, Universal Music Group, Maroc Telecom, GVT, Canal+ France and its subsidiaries, as well as Société d’Edition de Canal Plus (SECP). As a reminder, as of May 19, 2008, Vivendi applied to the French Ministry of Finance for the renewal of its authorization to use the Consolidated Global Profit Tax System and an authorization was granted by an order dated March 13, 2009, for a three-year period beginning with the taxable year 2009 and ending with the taxable year 2011.
In addition, as a reminder, on July 6, 2011, Vivendi lodged an appeal with the Ministry of Finance in relation to the renewal of its authorization to use the Consolidated Global Profit Tax System for a 3-year period, from January 1, 2012 to December 31, 2014.
The changes in French Tax Law in 2011 terminated the Consolidated Global Profit Tax System as of September 6, 2011 and capped the deduction for tax losses carried forward at 60% of taxable income. Since 2012, the deduction for tax losses carried forward is capped at 50% of taxable income and the deductibility of interest is limited to 85% of financial charges, net (75% as from January 1, 2014).
The impact of the French Tax Group and Consolidated Global Profit Tax Systems on the valuation of Vivendi’s tax attributes (tax losses and tax credits carried forward) are as follows:
as Vivendi considers that its entitlement to use the Consolidated Global Profit Tax System was effective until the end of the authorization granted by the French Ministry of Finance, including fiscal year ending December 31, 2011, on November 30, 2012, Vivendi filed for a refund of €366 million with respect to the tax saving for the fiscal year ended December 31, 2011. However, this fiscal position is being challenged and in its Financial Statements for the year ended December 31, 2012, Vivendi accrued a €366 million provision for the associated risk, unchanged as of December 31, 2013 (please refer to Note 6.6);
moreover, considering that the Consolidated Global Profit Tax System permitted tax credits to be carried forward upon the maturity of the authorization on December 31, 2011, Vivendi requested a refund of the taxes due, under the French Tax Group System for the year ended December 31, 2012, excluding social contributions and exceptional contributions, or €208 million, brought to €220 million, when filing the tax return with respect to fiscal year ended December 31, 2012. This fiscal position may be challenged and in its Financial Statements for the year ended December 31, 2012, Vivendi accrued a €208 million provision for the associated risk, brought to €220 million as of December 31, 2013 (please refer to Note 6.6, below);
given the foregoing, as of December 31, 2012, Vivendi recorded tax attributes representing potential tax savings in the aggregate amount of €1,553 million (compared to €2,013 million as of December 31, 2011). On February 19, 2014, the date of the Management Board meeting that approved the Financial Statements for the year ended December 31, 2013, the 2013 tax results of the subsidiaries within the scope of Vivendi SA’s French Tax Group System were determined by estimating, and as a result, the amount of tax attributes as of December 31, 2013 could not be determined with certainty;
taking into account the impact of the estimated 2013 tax results and before the impact of the consequences of the ongoing tax audits (please refer to Note 6.6) on the amount of tax attributes, Vivendi SA expects to achieve €1,527 million in tax savings from tax attributes (undiscounted value based on the current income tax rate of 38.00%); and
as of December 31, 2013, Vivendi SA valued its tax attributes under the French Tax Group System on the basis of one year’s forecast results, taken from the following year’s budget. On this basis, Vivendi would achieve tax savings from the French Tax Group System in an amount of €163 million (undiscounted value based on the current income tax rate of 38.00%).
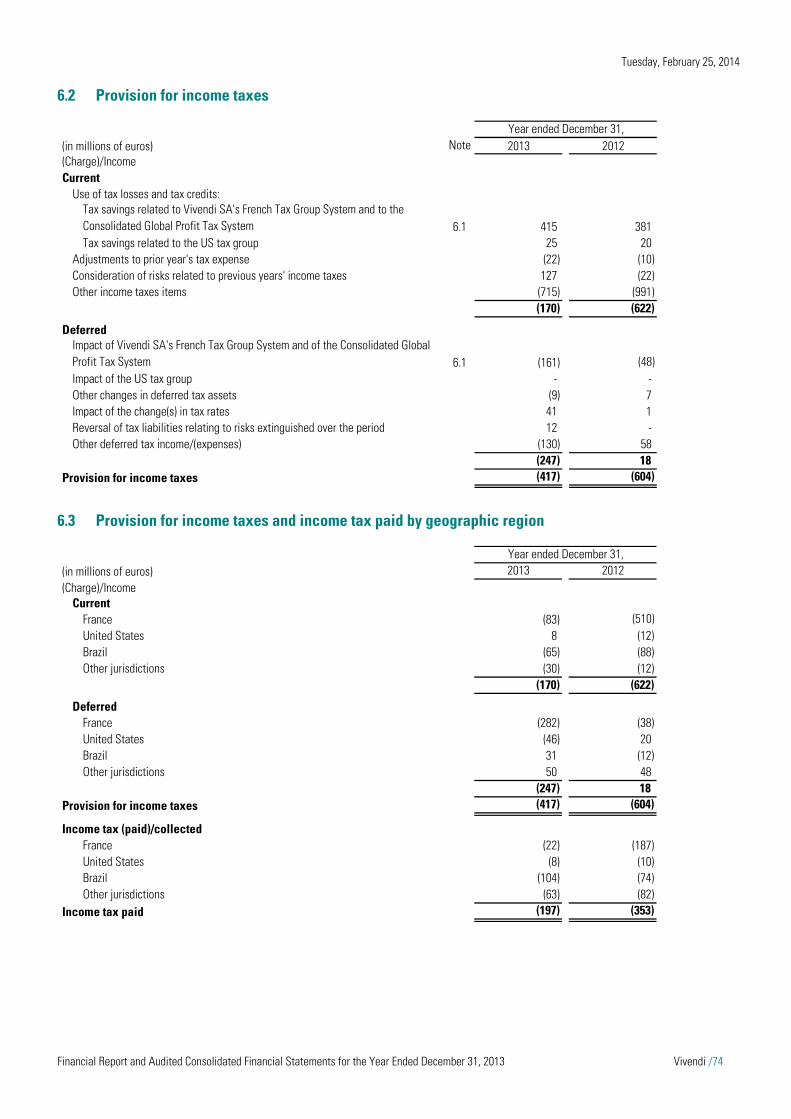
Tuesday, February 25, 2014
Financial Report and Audited Consolidated Financial Statements for the Year Ended December 31, 2013 Vivendi /74
6.2 Provision for income taxes
6.3 Provision for income taxes and income tax paid by geographic region
(in millions of euros) Note 2013 2012(Charge)/IncomeCurrent
Use of tax losses and tax credits:Tax savings related to Vivendi SA's French Tax Group System and to the Consolidated Global Profit Tax System 6.1 415 381Tax savings related to the US tax group 25 20
Adjustments to prior year's tax expense (22) (10)Consideration of risks related to previous years' income taxes 127 (22)Other income taxes items (715) (991)
(170) (622)
DeferredImpact of Vivendi SA's French Tax Group System and of the Consolidated Global Profit Tax System 6.1 (161) (48)Impact of the US tax group - -Other changes in deferred tax assets (9) 7Impact of the change(s) in tax rates 41 1Reversal of tax liabilities relating to risks extinguished over the period 12 -Other deferred tax income/(expenses) (130) 58
(247) 18Provision for income taxes (417) (604)
Year ended December 31,
(in millions of euros) 2013 2012(Charge)/Income
CurrentFrance (83) (510)United States 8 (12)Brazil (65) (88)Other jurisdictions (30) (12)
(170) (622)
DeferredFrance (282) (38)United States (46) 20Brazil 31 (12)Other jurisdictions 50 48
(247) 18Provision for income taxes (417) (604)
Income tax (paid)/collectedFrance (22) (187)United States (8) (10)Brazil (104) (74)Other jurisdictions (63) (82)
Income tax paid (197) (353)
Year ended December 31,
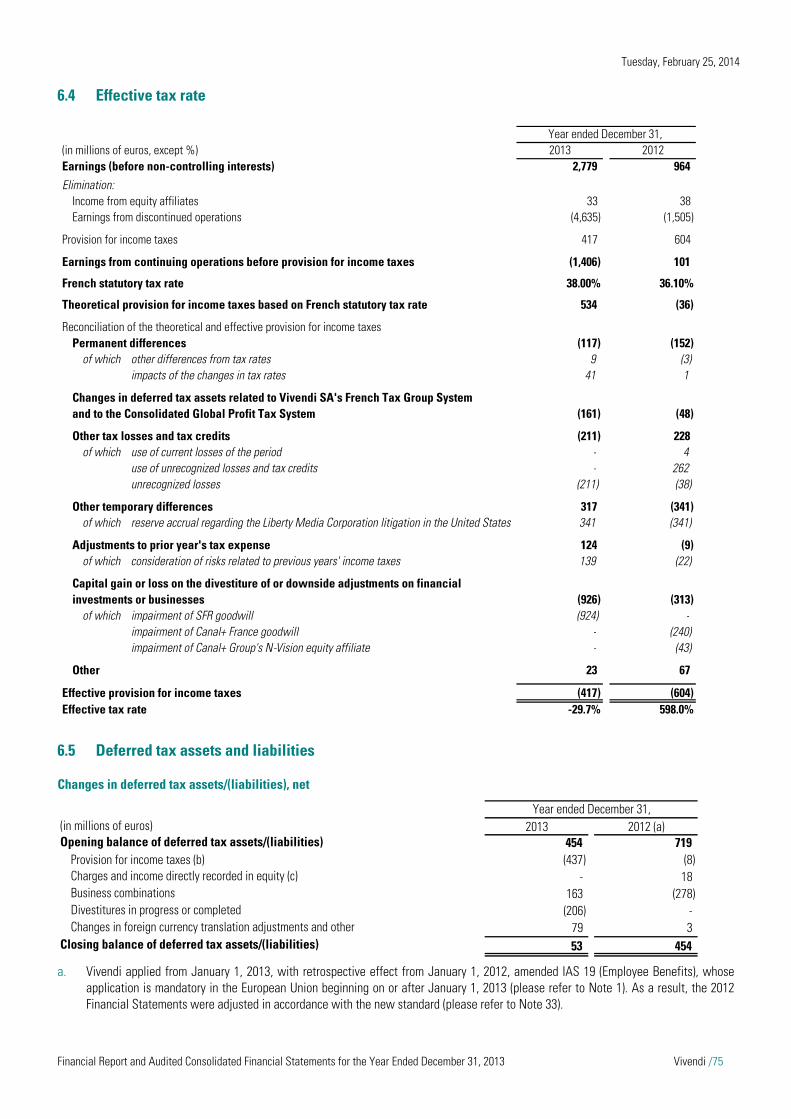
Tuesday, February 25, 2014
Financial Report and Audited Consolidated Financial Statements for the Year Ended December 31, 2013 Vivendi /75
6.4 Effective tax rate
6.5 Deferred tax assets and liabilities
Changes in deferred tax assets/(liabilities), net
a. Vivendi applied from January 1, 2013, with retrospective effect from January 1, 2012, amended IAS 19 (Employee Benefits), whose
application is mandatory in the European Union beginning on or after January 1, 2013 (please refer to Note 1). As a result, the 2012 Financial Statements were adjusted in accordance with the new standard (please refer to Note 33).
Year ended December 31, (in millions of euros, except %) Note 2013 2012Earnings (before non-controlling interests) 2,779 964Elimination:
Income from equity affiliates 33 38Earnings from discontinued operations (4,635) (1,505)
Provision for income taxes 417 604
(1,406) 101
French statutory tax rate 38.00% 36.10%
Theoretical provision for income taxes based on French statutory tax rate 534 (36)
Reconciliation of the theoretical and effective provision for income taxesPermanent differences (117) (152)
of which other differences from tax rates 9 (3)impacts of the changes in tax rates 41 1
Changes in deferred tax assets related to Vivendi SA's French Tax Group System and to the Consolidated Global Profit Tax System (161) (48)
Other tax losses and tax credits (211) 228of which use of current losses of the period - 4
use of unrecognized losses and tax credits - 262unrecognized losses (211) (38)
Other temporary differences 317 (341)of which reserve accrual regarding the Liberty Media Corporation litigation in the United States 341 (341)
Adjustments to prior year's tax expense 124 (9)of which consideration of risks related to previous years' income taxes 139 (22)
- -(926) (313)
of which impairment of SFR goodwill (924) -impairment of Canal+ France goodwill - (240)impairment of Canal+ Group's N-Vision equity affiliate - (43)
23 67
Effective provision for income taxes (417) (604)Effective tax rate -29.7% 598.0%
Capital gain or loss on the divestiture of or downside adjustments on financial investments or businesses
Other
Earnings from continuing operations before provision for income taxes
(in millions of euros) 2013 2012 (a)Opening balance of deferred tax assets/(liabilities) 454 719
Provision for income taxes (b) (437) (8)Charges and income directly recorded in equity (c) - 18Business combinations 163 (278)Divestitures in progress or completed (206) -Changes in foreign currency translation adjustments and other 79 3
Closing balance of deferred tax assets/(liabilities) 53 454
Year ended December 31,

Tuesday, February 25, 2014
Financial Report and Audited Consolidated Financial Statements for the Year Ended December 31, 2013 Vivendi /76
b. Includes income/(charge) related to Activision Blizzard and Maroc Telecom group taxes: in accordance with IFRS 5, these amounts were reclassified to the line “Earnings from discontinued operations” in the 2013 and 2012 Consolidated Statement of Earnings.
c. Includes -€43 million recognized in other items of charges and income directly recognized in equity for the year ended December 31, 2013, compared to +€22 million in 2012 (please refer to Note 9).
Components of deferred tax assets and liabilities
a. Vivendi applied from January 1, 2013, with retrospective effect from January 1, 2012, amended IAS 19 (Employee Benefits), whose
application is mandatory in the European Union beginning on or after January 1, 2013 (please refer to Note 1). As a result, the 2012 Financial Statements were adjusted in accordance with the new standard (please refer to Note 33).
b. The amounts of tax attributes, as reported in this table, were estimated at the end of the relevant fiscal years. In jurisdictions which are material to Vivendi, mainly France and the United States, tax returns are filed at the latest on May 15 and September 15 of the following year, respectively. Thus, the amounts of tax attributes reported in this table and the amounts reported to the tax authorities may differ significantly, and if necessary, may be adjusted at the end of the following year in the table above.
c. Relates to deferred tax assets recognizable in respect of tax attributes by Vivendi SA as head of the French Tax Group, representing €1,553 million as of December 31, 2012 (please refer to Note 6.1), of which €815 million related to tax losses and €738 million related to tax credits, after taking into account the estimated impact (-€26 million) of 2013 transactions (taxable income and use or expiration of tax credits), but prior to taking into account the consequences of ongoing tax audits (please refer to Note 6.6 below).
In France, tax losses can be carried forward indefinitely and tax credits can be carried forward for a period of up to 5-years. In 2013, €188 million tax credits matured as of December 31, 2013.
d. Relates to deferred tax assets recognizable in respect of tax attributes by Universal Music Group Inc. in the United States as head of the US tax group, representing $892 million as of December 31, 2012, after taking into account the estimated impact (-$393 million) of 2013 transactions (taxable income, capital losses, and tax credits that expired, capital losses and tax credits generated, as well as the divestiture of Activision Blizzard), but prior to taking into account the consequences of ongoing tax audits (please refer to Note 6.6).
As a reminder, with respect to the divestiture of Activision Blizzard and in accordance with U.S. tax rules, Vivendi allocated to the acquirer a fraction of the tax attributes that it previously deferred: tax losses were estimated at more than $700 million. In addition, the Universal Music Group Inc. replaced the Vivendi Holding I Corp. as head of the Tax Group System in the United States.
In the United States, tax losses can be carried forward for a period of up to 20-years and tax credits can be carried forward for a period of up to 10-years. No tax credit will mature prior to December 31, 2022 and no tax credit matured as of December 31, 2013.
(in millions of euros) December 31, 2013 December 31, 2012 (a)
Deferred tax assetsDeferred taxes, gross
Tax attributes (b) 2,623 2,639 of which Vivendi SA (c) 1,527 1,567
US tax group (d) 364 623 Temporary differences (e) 1,073 1,795 Netting (501) (366)
Deferred taxes, gross 3,195 4,068
Deferred taxes, unrecognizedTax attributes (b) (2,271) (2,138)
of which Vivendi SA (c) (1,364) (1,243)US tax group (d) (364) (623)
Temporary differences (e) (191) (485)Deferred taxes, unrecognized (2,462) (2,623)
Recorded deferred tax assets 733 1,445
Deferred tax liabilitiesPurchase accounting asset revaluations (f) 591 901 Other 590 456 Netting (501) (366)
Recorded deferred tax liabilities 680 991
Deferred tax assets/(liabilities), net 53 454

Tuesday, February 25, 2014
Financial Report and Audited Consolidated Financial Statements for the Year Ended December 31, 2013 Vivendi /77
e. Mainly relates to the deferred tax assets related to non-deducted provisions upon recognition, including provisions relating to employee benefit plans, and share-based compensation plans.
f. These tax liabilities, generated by asset revaluations following the purchase price allocation of companies are terminated upon the amortization or divestiture of the underlying asset and generate no current tax charge.
6.6 Tax audits
The fiscal year ended December 31, 2013 and prior years are open to tax audits by the respective tax authorities in the jurisdictions in which Vivendi has or had operations. Various tax authorities have proposed adjustments to the taxable income reported for prior years. It is not possible, at this stage of the current tax audits, to accurately assess the impact that could result from an unfavorable outcome of certain of these audits. Vivendi Management believes that these tax audits will not have a material and unfavorable impact on the financial position or liquidity of the group.
Regarding Vivendi SA, in respect of the Consolidated Global Profit Tax System, the consolidated income reported for fiscal years 2006, 2007, and 2008 is under audit by the French tax authorities. This tax audit started in January 2010. In addition, in January 2011, the French tax authorities began a tax audit on the consolidated income reported for fiscal year 2009 and in February 2013, the French tax authorities began a tax audit on the consolidated income reported for fiscal year 2010. Finally, Vivendi SA’s tax group System for the years 2011 and 2012 group is under audit since July 2013. Vivendi Management believes that it has serious legal means to defend the positions it has chosen for the determination of the taxable income of the fiscal years under audit. In any event, a provision for the impact of the Consolidated Global Profit Tax System in 2011 has been accrued (€366 million), as well as a provision for the impact in relation to the use of tax credits in 2012 (€220 million). Moreover, the tax attributes recognized by Vivendi SA with respect to the fiscal years under audit, representing tax savings of €1,527 million as of December 31, 2013, were recognized in the Consolidated Statement of Financial Position for €163 million only (please refer to Notes 6.1 and 6.5).
Regarding Vivendi’s US tax group, the fiscal years ending December 31, 2005, 2006, and 2007 were under a tax audit. The consequences of this tax audit did not materially impact the amount of tax attributes. Vivendi’s US tax group is under a tax audit for the fiscal years ending December 31, 2008, 2009, and 2010. This tax audit started in February 2012.
Finally, regarding Maroc Telecom, the fiscal years ending December 31, 2005, 2006, 2007, and 2008 were under a tax audit. This tax audit is now closed following the execution of a Memorandum Agreement on December 19, 2013, effective as of December 31, 2013.
Note 7 Discontinued operations
As from the second quarter of 2013, and in compliance with IFRS 5 taking into account the anticipated closing dates of the current sales, Activision Blizzard and Maroc Telecom group have been reported in Vivendi’s Consolidated Statement of Earnings and Statement of Cash Flows, as discontinued operations.
In practice, Activision Blizzard and Maroc Telecom group have been reported as follows: their contribution, until their effective sale, to each line of Vivendi’s Consolidated Statement of Earnings (before non-controlling
interests has been grouped under the line “Earnings from discontinued operations”; and their contribution, until their effective sale, to each line of Vivendi’s Consolidated Statement of Cash Flows has been grouped
under the line “Cash flows from discontinued operations”. In accordance with IFRS 5, these adjustments have been applied to all periods reported in the Consolidated Financial Statements (2013 and 2012) to ensure consistency of information.
On October 11, 2013, Vivendi deconsolidated Activision Blizzard pursuant to the sale of 88% of its interest.
Moreover, the contribution of Maroc Telecom group to each line of Vivendi’s Consolidated Statement of Financial Position as of December 31, 2013 has been grouped under the lines: “Assets of discontinued businesses” and “Liabilities associated with assets of discontinued businesses”.
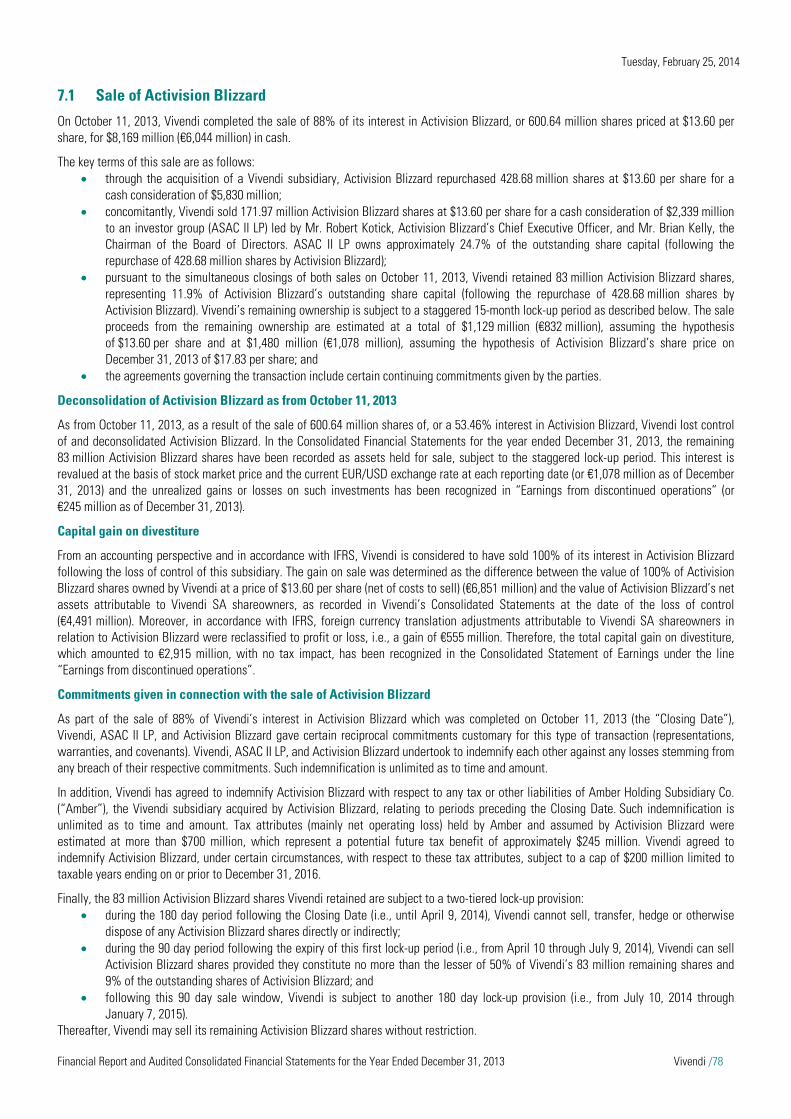
Tuesday, February 25, 2014
Financial Report and Audited Consolidated Financial Statements for the Year Ended December 31, 2013 Vivendi /78
7.1 Sale of Activision Blizzard
On October 11, 2013, Vivendi completed the sale of 88% of its interest in Activision Blizzard, or 600.64 million shares priced at $13.60 per share, for $8,169 million (€6,044 million) in cash.
The key terms of this sale are as follows: through the acquisition of a Vivendi subsidiary, Activision Blizzard repurchased 428.68 million shares at $13.60 per share for a
cash consideration of $5,830 million; concomitantly, Vivendi sold 171.97 million Activision Blizzard shares at $13.60 per share for a cash consideration of $2,339 million
to an investor group (ASAC II LP) led by Mr. Robert Kotick, Activision Blizzard’s Chief Executive Officer, and Mr. Brian Kelly, the Chairman of the Board of Directors. ASAC II LP owns approximately 24.7% of the outstanding share capital (following the repurchase of 428.68 million shares by Activision Blizzard);
pursuant to the simultaneous closings of both sales on October 11, 2013, Vivendi retained 83 million Activision Blizzard shares, representing 11.9% of Activision Blizzard’s outstanding share capital (following the repurchase of 428.68 million shares by Activision Blizzard). Vivendi’s remaining ownership is subject to a staggered 15-month lock-up period as described below. The sale proceeds from the remaining ownership are estimated at a total of $1,129 million (€832 million), assuming the hypothesis of $13.60 per share and at $1,480 million (€1,078 million), assuming the hypothesis of Activision Blizzard’s share price on December 31, 2013 of $17.83 per share; and
the agreements governing the transaction include certain continuing commitments given by the parties.
Deconsolidation of Activision Blizzard as from October 11, 2013
As from October 11, 2013, as a result of the sale of 600.64 million shares of, or a 53.46% interest in Activision Blizzard, Vivendi lost control of and deconsolidated Activision Blizzard. In the Consolidated Financial Statements for the year ended December 31, 2013, the remaining 83 million Activision Blizzard shares have been recorded as assets held for sale, subject to the staggered lock-up period. This interest is revalued at the basis of stock market price and the current EUR/USD exchange rate at each reporting date (or €1,078 million as of December 31, 2013) and the unrealized gains or losses on such investments has been recognized in “Earnings from discontinued operations” (or €245 million as of December 31, 2013).
Capital gain on divestiture
From an accounting perspective and in accordance with IFRS, Vivendi is considered to have sold 100% of its interest in Activision Blizzard following the loss of control of this subsidiary. The gain on sale was determined as the difference between the value of 100% of Activision Blizzard shares owned by Vivendi at a price of $13.60 per share (net of costs to sell) (€6,851 million) and the value of Activision Blizzard’s net assets attributable to Vivendi SA shareowners, as recorded in Vivendi’s Consolidated Statements at the date of the loss of control (€4,491 million). Moreover, in accordance with IFRS, foreign currency translation adjustments attributable to Vivendi SA shareowners in relation to Activision Blizzard were reclassified to profit or loss, i.e., a gain of €555 million. Therefore, the total capital gain on divestiture, which amounted to €2,915 million, with no tax impact, has been recognized in the Consolidated Statement of Earnings under the line “Earnings from discontinued operations”.
Commitments given in connection with the sale of Activision Blizzard
As part of the sale of 88% of Vivendi’s interest in Activision Blizzard which was completed on October 11, 2013 (the “Closing Date”), Vivendi, ASAC II LP, and Activision Blizzard gave certain reciprocal commitments customary for this type of transaction (representations, warranties, and covenants). Vivendi, ASAC II LP, and Activision Blizzard undertook to indemnify each other against any losses stemming from any breach of their respective commitments. Such indemnification is unlimited as to time and amount.
In addition, Vivendi has agreed to indemnify Activision Blizzard with respect to any tax or other liabilities of Amber Holding Subsidiary Co. (“Amber”), the Vivendi subsidiary acquired by Activision Blizzard, relating to periods preceding the Closing Date. Such indemnification is unlimited as to time and amount. Tax attributes (mainly net operating loss) held by Amber and assumed by Activision Blizzard were estimated at more than $700 million, which represent a potential future tax benefit of approximately $245 million. Vivendi agreed to indemnify Activision Blizzard, under certain circumstances, with respect to these tax attributes, subject to a cap of $200 million limited to taxable years ending on or prior to December 31, 2016.
Finally, the 83 million Activision Blizzard shares Vivendi retained are subject to a two-tiered lock-up provision: during the 180 day period following the Closing Date (i.e., until April 9, 2014), Vivendi cannot sell, transfer, hedge or otherwise
dispose of any Activision Blizzard shares directly or indirectly; during the 90 day period following the expiry of this first lock-up period (i.e., from April 10 through July 9, 2014), Vivendi can sell
Activision Blizzard shares provided they constitute no more than the lesser of 50% of Vivendi’s 83 million remaining shares and 9% of the outstanding shares of Activision Blizzard; and
following this 90 day sale window, Vivendi is subject to another 180 day lock-up provision (i.e., from July 10, 2014 through January 7, 2015).
Thereafter, Vivendi may sell its remaining Activision Blizzard shares without restriction.

Tuesday, February 25, 2014
Financial Report and Audited Consolidated Financial Statements for the Year Ended December 31, 2013 Vivendi /79
Activision Blizzard has agreed to file a registration statement prior to each sale window to enable Vivendi to sell the Activision Blizzard shares in a public offering.
Prior to any sale of Activision Blizzard shares by Vivendi in a market offering that occurs prior to the second anniversary of the Closing Date (October 11, 2015), Vivendi must notify Activision Blizzard of its intention to sell shares and Activision Blizzard may, at its election, offer to purchase some or all of the shares that Vivendi intends to sell in such market offering. Vivendi may accept or decline such offer at its sole discretion.
ASAC II LP is also subject to a lock-up provision of 180 days following the Closing Date (i.e., until April 9, 2014), provided that it may sell its Activision Blizzard shares so long as the net proceeds from such sales are used to pay amounts under its loans.
7.1.1 Statement of Earnings
Given the deconsolidation of Activision Blizzard on October 11, 2013, the line “Earnings from discontinued operations” takes into account Activision Blizzard until that date. The capital gain on divestiture from the sale of Activision Blizzard as well as the change in the value of the remaining 83 million Activision Blizzard shares were recorded under the line “Earnings from discontinued operations” for €2,915 million and €245 million, respectively.
7.1.2 Statement of Cash Flows
Given the deconsolidation of Activision Blizzard on October 11, 2013, the 2013 Statement of Cash Flows included Activision Blizzard until that date.
a. Relates to the balance of net divested cash on October 11, 2013: it was recognized as a deduction from the amount received in cash
with respect to the sale as an investing activity in Vivendi’s Consolidated Statement of Cash Flows.
Activision Blizzard Year ended December 31,(in millions of euros) 2013 2012
Revenues 2,328 3,768EBITDA 989 1,315Adjusted earnings before interest and income taxes (EBITA) 895 1,149Earnings before interest and income taxes (EBIT) 891 1,128Earnings before provision for income taxes 846 1,131Provision for income taxes (154) (258)Activision Blizzard's earnings 692 873Capital gain on the divestiture of Activision Blizzard 2,915 -Change in value of the remaining interest in Activision Blizzard 245 -Earnings from discontinued operations 3,852 873
Of which attributable to Vivendi SA shareowners 3,583 536Of which non-controlling interests 269 337
Activision Blizzard Year ended December 31,(in millions of euros) 2013 2012
Operating activitiesGross cash provided by operating activities before income tax paid 907 1,220Net cash provided by Activision Blizzard's operating activities 307 1,037
Investing activitiesCapital expenditures, net (44) (57)Change in financial assets, net (1,479) (35)
Net cash provided by/(used for) Activision Blizzard's investing activities (1,523) (92)
Financing activitiesDividends paid to non-controlling interests (66) (62)Stock repurchase program - (241)Other 1,720 15
Net cash provided by/(used for) Activision Blizzard's financing activities excluding dividends paid to Vivendi
1,654 (288)
Dividends paid to Vivendi (98) (94)Net cash provided by/(used for) Activision Blizzard's financing activities 1,556 (382)
Foreign currency translation adjustments (43) (22)Change in Activision Blizzard's cash and cash equivalents 297 541
Activision Blizzard's cash and cash equivalentsAt beginning of the period 2,989 2,448
At end of the period 3,286 (a) 2,989
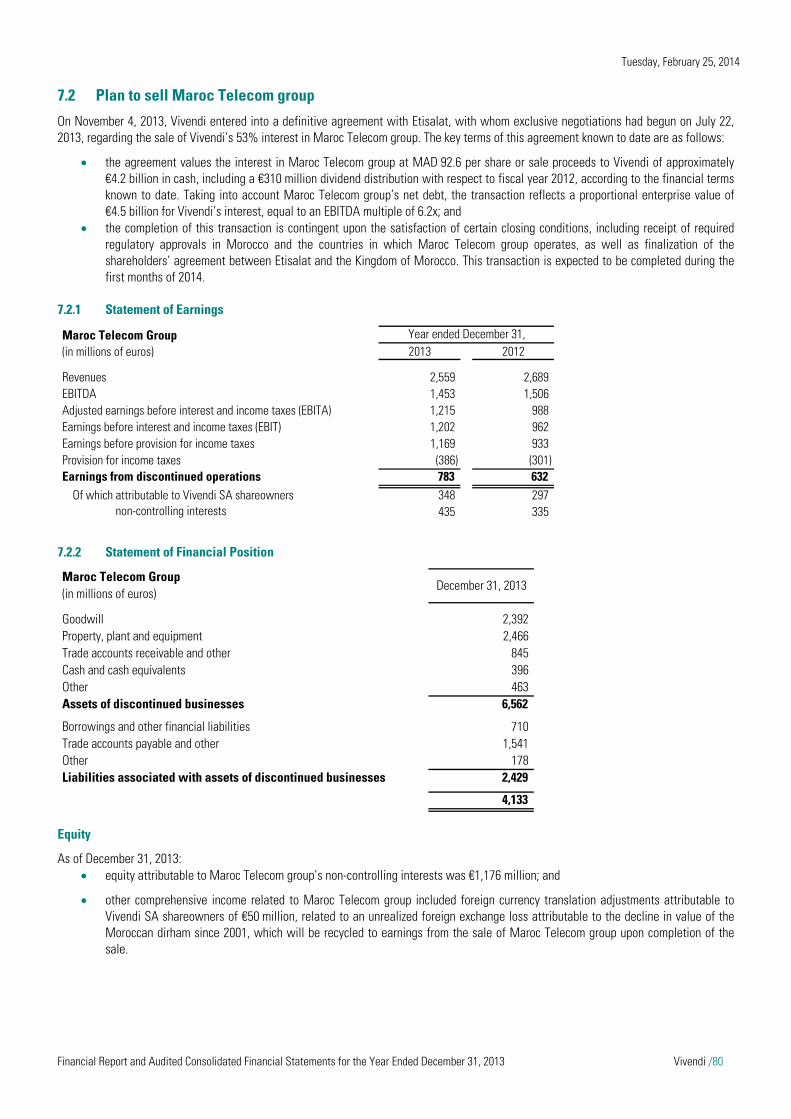
Tuesday, February 25, 2014
Financial Report and Audited Consolidated Financial Statements for the Year Ended December 31, 2013 Vivendi /80
7.2 Plan to sell Maroc Telecom group
On November 4, 2013, Vivendi entered into a definitive agreement with Etisalat, with whom exclusive negotiations had begun on July 22, 2013, regarding the sale of Vivendi’s 53% interest in Maroc Telecom group. The key terms of this agreement known to date are as follows:
the agreement values the interest in Maroc Telecom group at MAD 92.6 per share or sale proceeds to Vivendi of approximately €4.2 billion in cash, including a €310 million dividend distribution with respect to fiscal year 2012, according to the financial terms known to date. Taking into account Maroc Telecom group’s net debt, the transaction reflects a proportional enterprise value of €4.5 billion for Vivendi’s interest, equal to an EBITDA multiple of 6.2x; and
the completion of this transaction is contingent upon the satisfaction of certain closing conditions, including receipt of required regulatory approvals in Morocco and the countries in which Maroc Telecom group operates, as well as finalization of the shareholders’ agreement between Etisalat and the Kingdom of Morocco. This transaction is expected to be completed during the first months of 2014.
7.2.1 Statement of Earnings
7.2.2 Statement of Financial Position
Equity
As of December 31, 2013: equity attributable to Maroc Telecom group’s non-controlling interests was €1,176 million; and
other comprehensive income related to Maroc Telecom group included foreign currency translation adjustments attributable to Vivendi SA shareowners of €50 million, related to an unrealized foreign exchange loss attributable to the decline in value of the Moroccan dirham since 2001, which will be recycled to earnings from the sale of Maroc Telecom group upon completion of the sale.
Maroc Telecom Group Year ended December 31,(in millions of euros) 2013 2012
Revenues 2,559 2,689EBITDA 1,453 1,506Adjusted earnings before interest and income taxes (EBITA) 1,215 988Earnings before interest and income taxes (EBIT) 1,202 962Earnings before provision for income taxes 1,169 933Provision for income taxes (386) (301)Earnings from discontinued operations 783 632
Of which attributable to Vivendi SA shareowners 348 297Of which non-controlling interests 435 335
Maroc Telecom Group(in millions of euros)
Goodwill 2,392Property, plant and equipment 2,466Trade accounts receivable and other 845Cash and cash equivalents 396Other 463Assets of discontinued businesses 6,562
Borrowings and other financial liabilities 710Trade accounts payable and other 1,541Other 178Liabilities associated with assets of discontinued businesses 2,429
4,133
December 31, 2013

Tuesday, February 25, 2014
Financial Report and Audited Consolidated Financial Statements for the Year Ended December 31, 2013 Vivendi /81
Off-balance sheet commitments
As of December 31, 2013, Maroc Telecom group’s commitments were €635 million (compared to €316 million as of December 31, 2012). On January 16, 2013, Maroc Telecom and the Moroccan State entered into a fourth capital expenditure agreement for the period between 2013 and 2015. As of December 31, 2013, the amount of the remaining capital expenditure obligation was €591 million.
Moreover, commitments from Maroc Telecom and its subsidiaries include other commercial commitments and contracts entered into relating to operations such as lease contracts for satellite transponders and bank guarantees, which are for individually non-significant amounts.
7.2.3 Statement of Cash Flows
a. Includes a €310 million dividend distribution with respect to 2012 fiscal year.
Note 8 Earnings per share
a. Only includes the potential dilutive effect related to stock option plans and restricted stock rights of Activision Blizzard for a non-
material amount.
b. Net of treasury shares (please refer to Note 19). c. Does not include accretive instruments as of December 31, 2013 and December 31, 2012 which could potentially become dilutive. The
balance of common shares in connection with Vivendi SA’s share-based compensation plans is presented in Note 22.2.2.
Maroc Telecom Group Year ended December 31, (in millions of euros) 2013 2012
Operating activitiesGross cash provided by operating activities before income tax paid 1,448 1,442Net cash provided by Maroc Telecom group's operating activities 1,110 1,237
Investing activitiesCapital expenditures, net (434) (457)Other 5 6
Net cash provided by/(used for) Maroc Telecom group's investing activities (429) (451)
Financing activitiesDividends paid to non-controlling interests (328) (388)Transactions on borrowings and other financial liabilities (42) 119
Net cash provided by/(used for) Maroc Telecom group's financing activities excluding dividends paid to Vivendi (370) (269)
Dividends paid to Vivendi - (490)Net cash provided by/(used for) Maroc Telecom group's financing activities (370) (759)
Foreign currency translation adjustments (1) 3Change in Maroc Telecom group's cash and cash equivalents 310 30
Maroc Telecom group's cash and cash equivalentsAt beginning of the period 86 56
At end of the period 396 (a) 86
Basic Diluted Basic Diluted
Earnings (in millions of euros)Earnings from continuing operations attributable to Vivendi SA shareowners (1,964) (1,964) (654) (654)Earnings from discontinued operations attributable to Vivendi SA shareowners 3,931 3,928 (a) 833 830 (a)Earnings attributable to Vivendi SA shareowners 1,967 1,964 (a) 179 176 (a)
Number of shares (in millions)Weighted average number of shares outstanding (b) 1,330.6 1,330.6 1,298.9 1,298.9Potential dilutive effects related to share-based compensation (c) - 4.7 - 3.5Adjusted weighted average number of shares 1,330.6 1,335.3 1,298.9 1,302.4
Earnings per share (in euros)Earnings from continuing operations attributable to Vivendi SA shareowners per share (1.47) (1.47) (0.50) (0.50)Earnings from discontinued operations attributable to Vivendi SA shareowners per share 2.95 2.94 0.64 0.64Earnings attributable to Vivendi SA shareowners per share 1.48 1.47 0.14 0.14
Year ended December 31,2013 2012

Tuesday, February 25, 2014
Financial Report and Audited Consolidated Financial Statements for the Year Ended December 31, 2013 Vivendi /82
Note 9 Charges and income directly recognized in equity
a. As of January 1, 2013, Vivendi applied, with retrospective effect as from January 1, 2012, amended IAS 19 (Employee Benefits) and
IAS 1 (Presentation of Financial Statements: Presentation of Items of Other Comprehensive Income), each of whose application is mandatory in the European Union beginning on or after January 1, 2013 (please refer to Note 1). As a result, the 2012 Financial Statements were adjusted in accordance with the new standards (please refer to Note 33).
Year ended December 31, 2013(in millions of euros) Note Gross Tax Net
Actuarial gains/(losses) related to employee defined benefit plans 21 (22) (1) (23)Items not reclassified to profit or loss (22) (1) (23)
Foreign currency translation adjustments (1,429) - (1,429)of which changes in foreign currency translation adjustments relating to discontinued operations (117) - (117)
transferred to profit or loss as part of the sale of Activision Blizzard 7 (555) - (555)
Unrealized gains/(losses) 99 (41) 58of which Cash flow hedge instruments 24 2 1 3
Valuation gains/(losses) taken to equity 16 - 16Transferred to profit or loss of the period (14) 1 (13)
Net investment hedge instruments 24 (24) - (24)Valuation gains/(losses) taken to equity 15 - 15Transferred to profit or loss of the period (39) - (39)
Hedging instruments (22) 1 (21)
Valuation gains/(losses) taken to equity 120 (42) 78Transferred to profit or loss of the period 1 - 1
Assets available for sale 16 121 (42) 79
Other impacts 16 (1) 15Items to be subsequently reclassified to profit or loss (1,314) (42) (1,356)
Charges and income directly recognized in equity (1,336) (43) (1,379)
Year ended December 31, 2012 (a)(in millions of euros) Note Gross Tax Net
Actuarial gains/(losses) related to employee defined benefit plans 21 (82) 21 (61)Items not reclassified to profit or loss (82) 21 (61)
Foreign currency translation adjustments (605) - (605)of which changes in foreign currency translation adjustments relating to discontinued operations (113) - (113)
Unrealized gains/(losses) 102 1 103of which Cash flow hedge instruments 24 22 1 23
Valuation gains/(losses) taken to equity 41 1 42Transferred to profit or loss of the period (19) - (19)
Net investment hedge instruments 24 17 - 17Valuation gains/(losses) taken to equity 17 - 17Transferred to profit or loss of the period - - -
Hedging instruments 39 1 40
Valuation gains/(losses) taken to equity 55 - 55Transferred to profit or loss of the period 8 - 8
Assets available for sale 16 63 - 63
Items to be subsequently reclassified to profit or loss (503) 1 (502)
Charges and income directly recognized in equity (585) 22 (563)

Tuesday, February 25, 2014
Financial Report and Audited Consolidated Financial Statements for the Year Ended December 31, 2013 Vivendi /83
Note 10 Goodwill
Changes in goodwill
a. Relates to goodwill attributable to the acquisition of “n” on November 30, 2012. As of December 31, 2012, the provisional goodwill was estimated at €213 million. In 2013, goodwill was adjusted by -€75 million and the final goodwill of “n” was €138 million (please refer to Note 2).
b. Mainly relates to goodwill attributable to the acquisition of EMI Recorded Music on September 28, 2012. As of December 31, 2012, the provisional goodwill was estimated at €301 million. In 2013, goodwill was adjusted by €57 million and the final goodwill of EMI Recorded Music amounted to €358 million (please refer to Note 2).
c. Relates to goodwill attributable to the acquisition of D8 and D17 on September 27, 2012.
d. Relates to impairment losses related to certain music catalogs of Universal Music Group.
(in millions of euros) December 31, 2013 December 31, 2012
Goodwill, gross 31,539 37,940Impairment losses (14,392) (13,284)Goodwill 17,147 24,656
December 31, 2012
Impairment losses Business combinationsDivestitures in progress
or completed
Changes in foreign currency translation
adjustments and other
December 31, 2013
Canal+ Group 4,513 - (46) - (3) 4,464of which Canal+ France 3,635 - - - - 3,635
Studiocanal 207 - 30 - (1) 236D8/D17 310 - (1) - - 309nc+ 230 - (75) (a) - (2) 153
Universal Music Group 4,138 (5) 64 (b) 5 (102) 4,100GVT 2,006 - - - (330) 1,676SFR 9,153 (2,431) - - - 6,722Other operations 184 - 2 - (1) 185Activision Blizzard 2,255 - - (2,208) (47) -Maroc Telecom Group 2,407 - - (2,392) (15) -
Total 24,656 (2,436) 20 (4,595) (498) 17,147
(in millions of euros)
December 31, 2011
Impairment losses Business combinationsDivestitures in progress
or completed
Changes in foreign currency translation
adjustments and other
December 31, 2012
Canal+ Group 4,648 (665) 537 - (7) 4,513of which Canal+ France 4,309 (665) - - (9) 3,635
Studiocanal 192 - 14 - 1 207D8/D17 - - 310 (c) - - 310nc+ 25 - 213 (a) - (8) 230
Universal Music Group 4,114 (85) (d) 304 (b) (32) (163) 4,138GVT 2,222 - - - (216) 2,006SFR 9,152 - 1 - - 9,153Other operations 171 (1) 7 - 7 184Activision Blizzard 2,309 - - - (54) 2,255Maroc Telecom Group 2,413 - - - (6) 2,407
Total 25,029 (751) 849 (32) (439) 24,656
(in millions of euros)
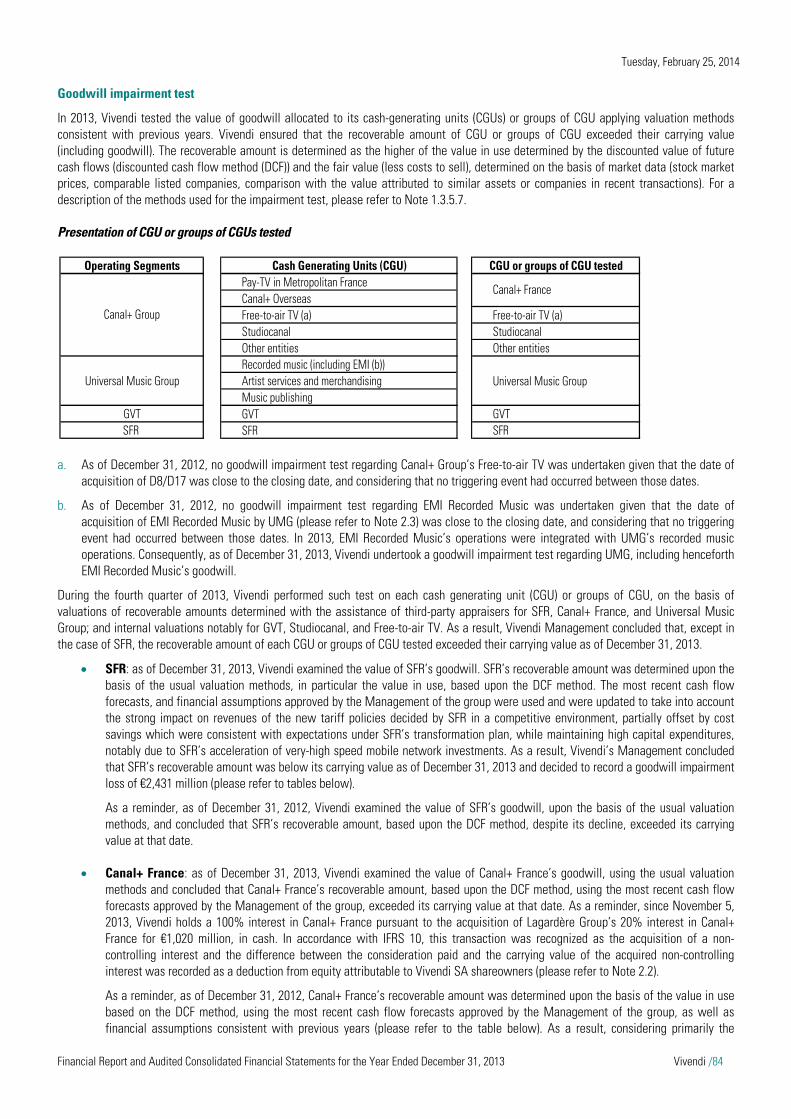
Tuesday, February 25, 2014
Financial Report and Audited Consolidated Financial Statements for the Year Ended December 31, 2013 Vivendi /84
Goodwill impairment test
In 2013, Vivendi tested the value of goodwill allocated to its cash-generating units (CGUs) or groups of CGU applying valuation methods consistent with previous years. Vivendi ensured that the recoverable amount of CGU or groups of CGU exceeded their carrying value (including goodwill). The recoverable amount is determined as the higher of the value in use determined by the discounted value of future cash flows (discounted cash flow method (DCF)) and the fair value (less costs to sell), determined on the basis of market data (stock market prices, comparable listed companies, comparison with the value attributed to similar assets or companies in recent transactions). For a description of the methods used for the impairment test, please refer to Note 1.3.5.7.
Presentation of CGU or groups of CGUs tested
a. As of December 31, 2012, no goodwill impairment test regarding Canal+ Group’s Free-to-air TV was undertaken given that the date of acquisition of D8/D17 was close to the closing date, and considering that no triggering event had occurred between those dates.
b. As of December 31, 2012, no goodwill impairment test regarding EMI Recorded Music was undertaken given that the date of acquisition of EMI Recorded Music by UMG (please refer to Note 2.3) was close to the closing date, and considering that no triggering event had occurred between those dates. In 2013, EMI Recorded Music’s operations were integrated with UMG’s recorded music operations. Consequently, as of December 31, 2013, Vivendi undertook a goodwill impairment test regarding UMG, including henceforth EMI Recorded Music’s goodwill.
During the fourth quarter of 2013, Vivendi performed such test on each cash generating unit (CGU) or groups of CGU, on the basis of valuations of recoverable amounts determined with the assistance of third-party appraisers for SFR, Canal+ France, and Universal Music Group; and internal valuations notably for GVT, Studiocanal, and Free-to-air TV. As a result, Vivendi Management concluded that, except in the case of SFR, the recoverable amount of each CGU or groups of CGU tested exceeded their carrying value as of December 31, 2013.
SFR: as of December 31, 2013, Vivendi examined the value of SFR’s goodwill. SFR’s recoverable amount was determined upon the basis of the usual valuation methods, in particular the value in use, based upon the DCF method. The most recent cash flow forecasts, and financial assumptions approved by the Management of the group were used and were updated to take into account the strong impact on revenues of the new tariff policies decided by SFR in a competitive environment, partially offset by cost savings which were consistent with expectations under SFR’s transformation plan, while maintaining high capital expenditures, notably due to SFR’s acceleration of very-high speed mobile network investments. As a result, Vivendi’s Management concluded that SFR’s recoverable amount was below its carrying value as of December 31, 2013 and decided to record a goodwill impairment loss of €2,431 million (please refer to tables below).
As a reminder, as of December 31, 2012, Vivendi examined the value of SFR’s goodwill, upon the basis of the usual valuation methods, and concluded that SFR’s recoverable amount, based upon the DCF method, despite its decline, exceeded its carrying value at that date.
Canal+ France: as of December 31, 2013, Vivendi examined the value of Canal+ France’s goodwill, using the usual valuation methods and concluded that Canal+ France’s recoverable amount, based upon the DCF method, using the most recent cash flow forecasts approved by the Management of the group, exceeded its carrying value at that date. As a reminder, since November 5, 2013, Vivendi holds a 100% interest in Canal+ France pursuant to the acquisition of Lagardère Group’s 20% interest in Canal+ France for €1,020 million, in cash. In accordance with IFRS 10, this transaction was recognized as the acquisition of a non-controlling interest and the difference between the consideration paid and the carrying value of the acquired non-controlling interest was recorded as a deduction from equity attributable to Vivendi SA shareowners (please refer to Note 2.2).
As a reminder, as of December 31, 2012, Canal+ France’s recoverable amount was determined upon the basis of the value in use based on the DCF method, using the most recent cash flow forecasts approved by the Management of the group, as well as financial assumptions consistent with previous years (please refer to the table below). As a result, considering primarily the
Operating Segments Cash Generating Units (CGU) CGU or groups of CGU testedPay-TV in Metropolitan FranceCanal+ OverseasFree-to-air TV (a) Free-to-air TV (a)Studiocanal StudiocanalOther entities Other entitiesRecorded music (including EMI (b))
Universal Music Group Artist services and merchandising Universal Music GroupMusic publishing
GVT GVT GVTSFR SFR SFR
Canal+ Group
Canal+ France
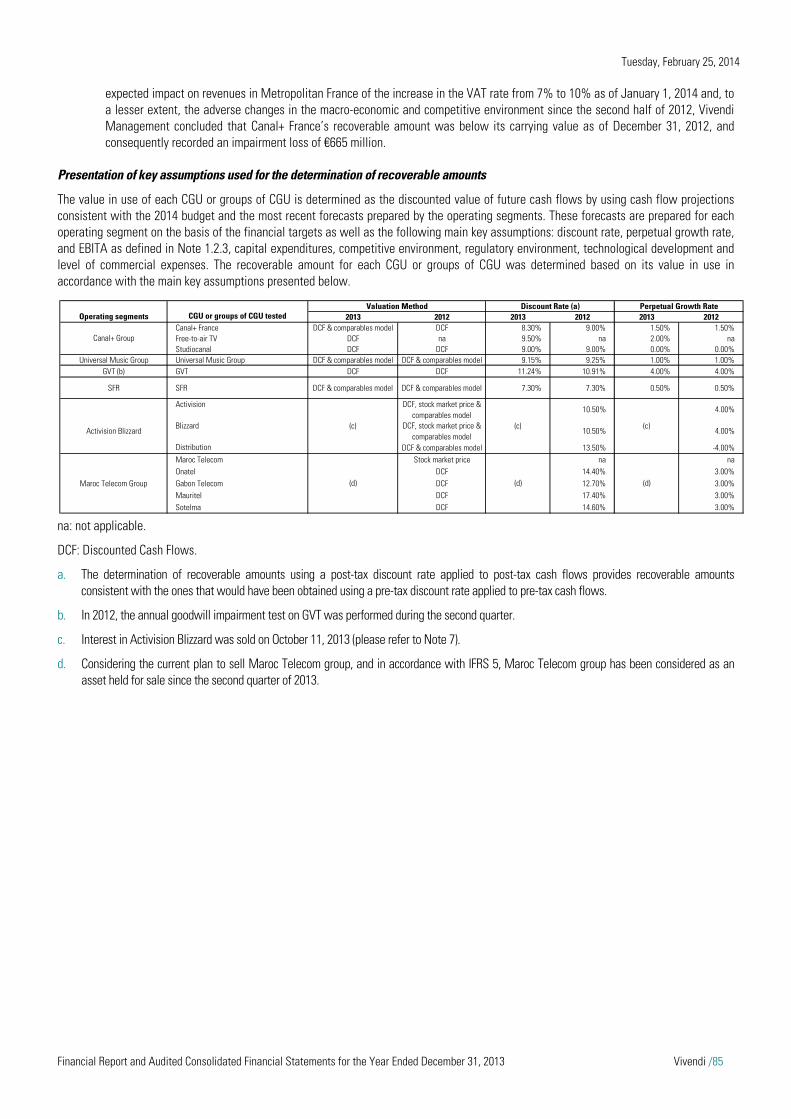
Tuesday, February 25, 2014
Financial Report and Audited Consolidated Financial Statements for the Year Ended December 31, 2013 Vivendi /85
expected impact on revenues in Metropolitan France of the increase in the VAT rate from 7% to 10% as of January 1, 2014 and, to a lesser extent, the adverse changes in the macro-economic and competitive environment since the second half of 2012, Vivendi Management concluded that Canal+ France’s recoverable amount was below its carrying value as of December 31, 2012, and consequently recorded an impairment loss of €665 million.
Presentation of key assumptions used for the determination of recoverable amounts
The value in use of each CGU or groups of CGU is determined as the discounted value of future cash flows by using cash flow projections consistent with the 2014 budget and the most recent forecasts prepared by the operating segments. These forecasts are prepared for each operating segment on the basis of the financial targets as well as the following main key assumptions: discount rate, perpetual growth rate, and EBITA as defined in Note 1.2.3, capital expenditures, competitive environment, regulatory environment, technological development and level of commercial expenses. The recoverable amount for each CGU or groups of CGU was determined based on its value in use in accordance with the main key assumptions presented below.
na: not applicable.
DCF: Discounted Cash Flows.
a. The determination of recoverable amounts using a post-tax discount rate applied to post-tax cash flows provides recoverable amounts consistent with the ones that would have been obtained using a pre-tax discount rate applied to pre-tax cash flows.
b. In 2012, the annual goodwill impairment test on GVT was performed during the second quarter.
c. Interest in Activision Blizzard was sold on October 11, 2013 (please refer to Note 7).
d. Considering the current plan to sell Maroc Telecom group, and in accordance with IFRS 5, Maroc Telecom group has been considered as an asset held for sale since the second quarter of 2013.
Valuation Method Discount Rate (a) Perpetual Growth RateOperating segments CGU or groups of CGU tested 2013 2012 2013 2012 2013 2012
Canal+ France DCF & comparables model DCF 8.30% 9.00% 1.50% 1.50%Free-to-air TV DCF na 9.50% na 2.00% naStudiocanal DCF DCF 9.00% 9.00% 0.00% 0.00%
Universal Music Group Universal Music Group DCF & comparables model DCF & comparables model 9.15% 9.25% 1.00% 1.00%GVT (b) GVT DCF DCF 11.24% 10.91% 4.00% 4.00%
SFR SFR DCF & comparables model DCF & comparables model 7.30% 7.30% 0.50% 0.50%
Activision DCF, stock market price & comparables model
10.50% 4.00%
Activision BlizzardBlizzard DCF, stock market price &
comparables model10.50% 4.00%
Distribution DCF & comparables model 13.50% -4.00%Maroc Telecom Stock market price na naOnatel DCF 14.40% 3.00%
Maroc Telecom Group Gabon Telecom DCF 12.70% 3.00%Mauritel DCF 17.40% 3.00%Sotelma DCF 14.60% 3.00%
(c)
(d)
(c)
(d)
(c)
(d)
Canal+ Group
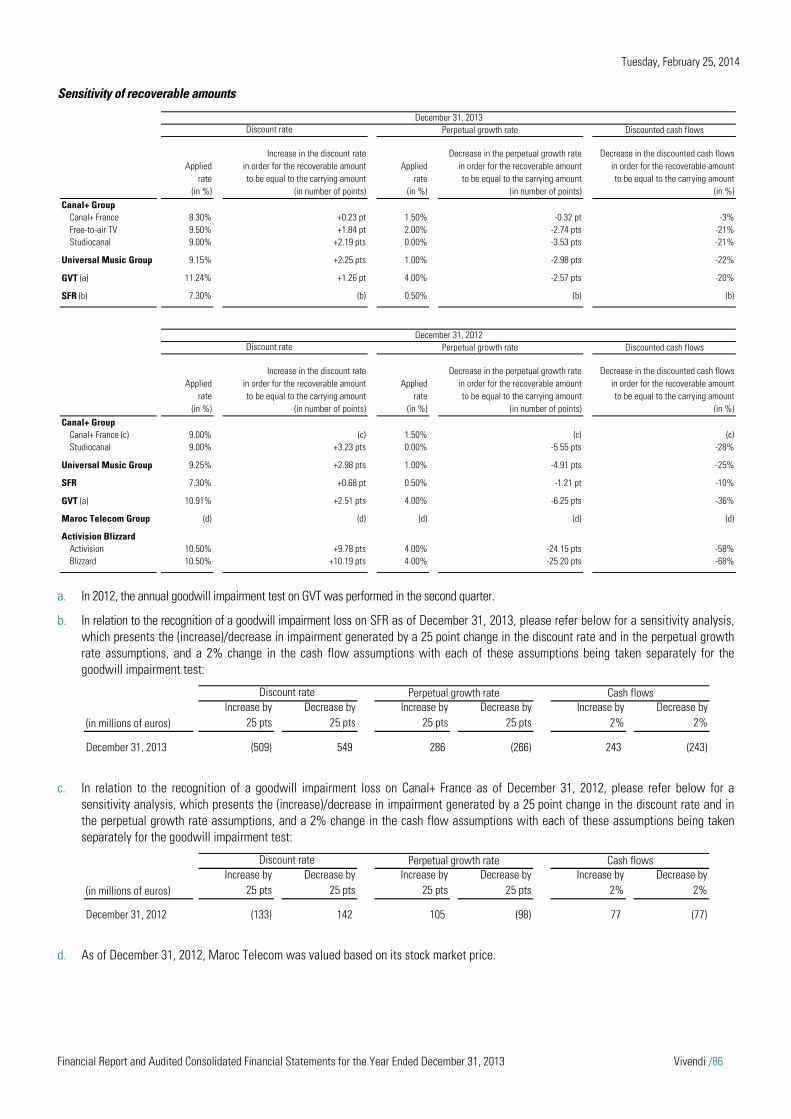
Tuesday, February 25, 2014
Financial Report and Audited Consolidated Financial Statements for the Year Ended December 31, 2013 Vivendi /86
Sensitivity of recoverable amounts
a. In 2012, the annual goodwill impairment test on GVT was performed in the second quarter.
b. In relation to the recognition of a goodwill impairment loss on SFR as of December 31, 2013, please refer below for a sensitivity analysis, which presents the (increase)/decrease in impairment generated by a 25 point change in the discount rate and in the perpetual growth rate assumptions, and a 2% change in the cash flow assumptions with each of these assumptions being taken separately for the goodwill impairment test:
c. In relation to the recognition of a goodwill impairment loss on Canal+ France as of December 31, 2012, please refer below for a sensitivity analysis, which presents the (increase)/decrease in impairment generated by a 25 point change in the discount rate and in the perpetual growth rate assumptions, and a 2% change in the cash flow assumptions with each of these assumptions being taken separately for the goodwill impairment test:
d. As of December 31, 2012, Maroc Telecom was valued based on its stock market price.
December 31, 2013Discount rate Discounted cash flows
Appliedrate
(in %)
Increase in the discount ratein order for the recoverable amountto be equal to the carrying amount
(in number of points)
Appliedrate
(in %)
Decrease in the perpetual growth ratein order for the recoverable amountto be equal to the carrying amount
(in number of points)
Decrease in the discounted cash flowsin order for the recoverable amountto be equal to the carrying amount
(in %)Canal+ Group
Canal+ France 8.30% +0.23 pt 1.50% -0.32 pt -3%Free-to-air TV 9.50% +1.84 pt 2.00% -2.74 pts -21%Studiocanal 9.00% +2.19 pts 0.00% -3.53 pts -21%
Universal Music Group 9.15% +2.25 pts 1.00% -2.98 pts -22%
GVT (a) 11.24% +1.26 pt 4.00% -2.57 pts -20%
SFR (b) 7.30% (b) 0.50% (b) (b)
December 31, 2012Discount rate Discounted cash flows
Appliedrate
(in %)
Increase in the discount ratein order for the recoverable amountto be equal to the carrying amount
(in number of points)
Appliedrate
(in %)
Decrease in the perpetual growth ratein order for the recoverable amountto be equal to the carrying amount
(in number of points)
Decrease in the discounted cash flowsin order for the recoverable amountto be equal to the carrying amount
(in %)Canal+ Group
Canal+ France (c) 9.00% (c) 1.50% (c) (c)Studiocanal 9.00% +3.23 pts 0.00% -5.55 pts -28%
Universal Music Group 9.25% +2.98 pts 1.00% -4.91 pts -25%
SFR 7.30% +0.68 pt 0.50% -1.21 pt -10%
GVT (a) 10.91% +2.51 pts 4.00% -6.25 pts -36%
Maroc Telecom Group (d) (d) (d) (d) (d)
Activision BlizzardActivision 10.50% +9.78 pts 4.00% -24.15 pts -58%Blizzard 10.50% +10.19 pts 4.00% -25.20 pts -68%
Perpetual growth rate
Perpetual growth rate
Discount rate
(in millions of euros)Increase by
25 ptsDecrease by
25 ptsIncrease by
25 ptsDecrease by
25 ptsIncrease by
2%Decrease by
2%
December 31, 2013 (509) 549 286 (266) 243 (243)
Perpetual growth rate Cash flows
Discount rate
(in millions of euros)Increase by
25 ptsDecrease by
25 ptsIncrease by
25 ptsDecrease by
25 ptsIncrease by
2%Decrease by
2%
December 31, 2012 (133) 142 105 (98) 77 (77)
Perpetual growth rate Cash flows
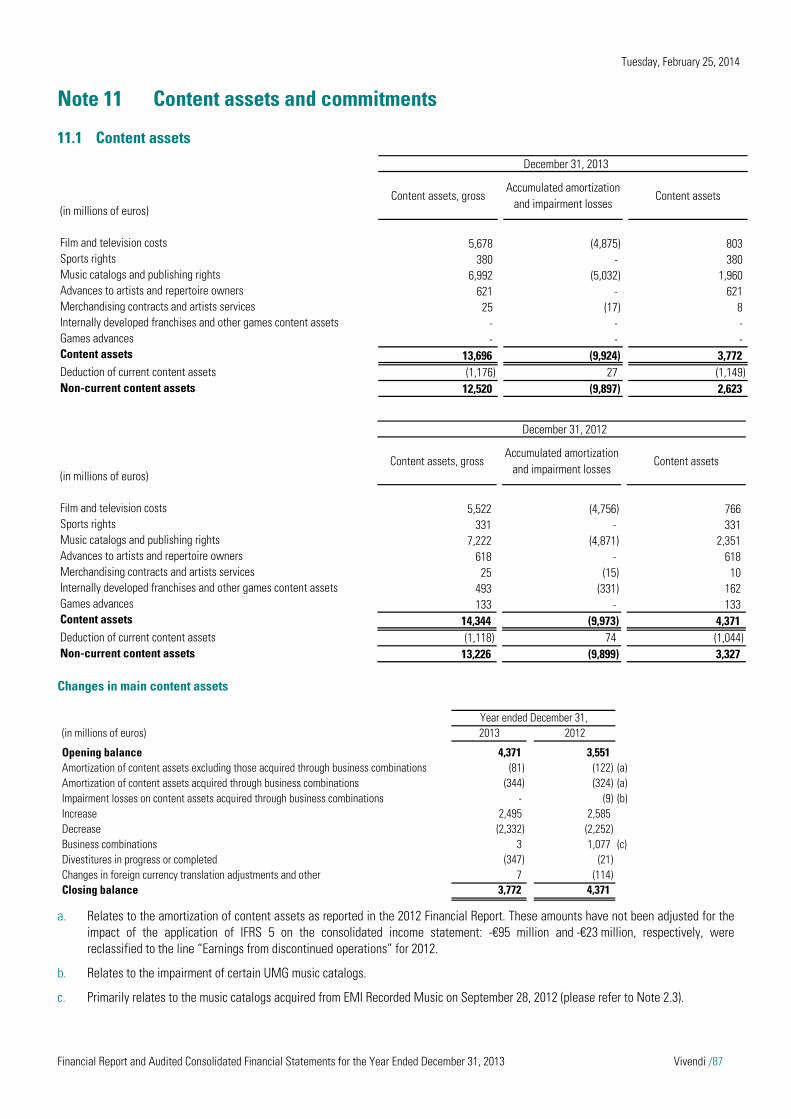
Tuesday, February 25, 2014
Financial Report and Audited Consolidated Financial Statements for the Year Ended December 31, 2013 Vivendi /87
Note 11 Content assets and commitments
11.1 Content assets
Changes in main content assets
a. Relates to the amortization of content assets as reported in the 2012 Financial Report. These amounts have not been adjusted for the
impact of the application of IFRS 5 on the consolidated income statement: -€95 million and -€23 million, respectively, were reclassified to the line “Earnings from discontinued operations” for 2012.
b. Relates to the impairment of certain UMG music catalogs.
c. Primarily relates to the music catalogs acquired from EMI Recorded Music on September 28, 2012 (please refer to Note 2.3).
December 31, 2013
(in millions of euros)Content assets, gross
Accumulated amortization and impairment losses
Content assets
Film and television costs 5,678 (4,875) 803Sports rights 380 - 380Music catalogs and publishing rights 6,992 (5,032) 1,960Advances to artists and repertoire owners 621 - 621Merchandising contracts and artists services 25 (17) 8Internally developed franchises and other games content assets - - -Games advances - - -Content assets 13,696 (9,924) 3,772Deduction of current content assets (1,176) 27 (1,149)Non-current content assets 12,520 (9,897) 2,623
December 31, 2012
(in millions of euros)Content assets, gross
Accumulated amortization and impairment losses
Content assets
Film and television costs 5,522 (4,756) 766Sports rights 331 - 331Music catalogs and publishing rights 7,222 (4,871) 2,351Advances to artists and repertoire owners 618 - 618Merchandising contracts and artists services 25 (15) 10Internally developed franchises and other games content assets 493 (331) 162Games advances 133 - 133Content assets 14,344 (9,973) 4,371Deduction of current content assets (1,118) 74 (1,044)Non-current content assets 13,226 (9,899) 3,327
(in millions of euros) 2013 2012
Opening balance 4,371 3,551Amortization of content assets excluding those acquired through business combinations (81) (122) (a)Amortization of content assets acquired through business combinations (344) (324) (a)Impairment losses on content assets acquired through business combinations - (9) (b)Increase 2,495 2,585Decrease (2,332) (2,252)Business combinations 3 1,077 (c)Divestitures in progress or completed (347) (21)Changes in foreign currency translation adjustments and other 7 (114)Closing balance 3,772 4,371
Year ended December 31,
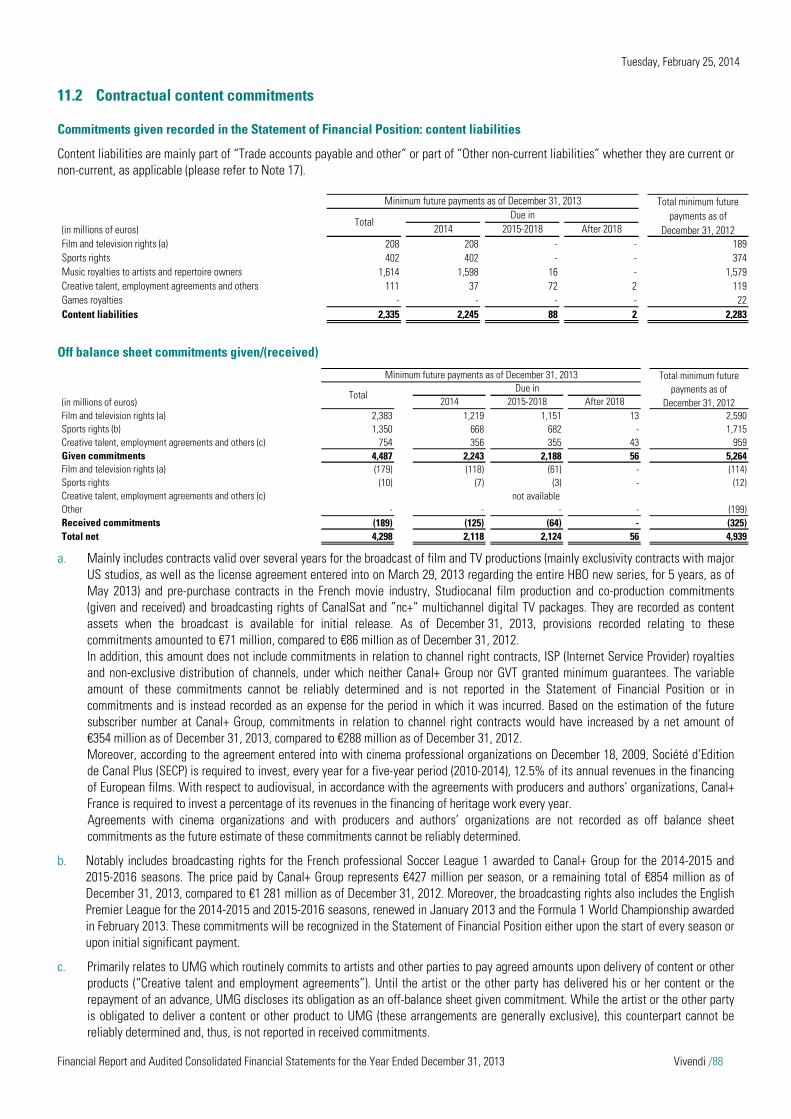
Tuesday, February 25, 2014
Financial Report and Audited Consolidated Financial Statements for the Year Ended December 31, 2013 Vivendi /88
11.2 Contractual content commitments
Commitments given recorded in the Statement of Financial Position: content liabilities
Content liabilities are mainly part of “Trade accounts payable and other” or part of “Other non-current liabilities” whether they are current or non-current, as applicable (please refer to Note 17).
Off balance sheet commitments given/(received)
a. Mainly includes contracts valid over several years for the broadcast of film and TV productions (mainly exclusivity contracts with major
US studios, as well as the license agreement entered into on March 29, 2013 regarding the entire HBO new series, for 5 years, as of May 2013) and pre-purchase contracts in the French movie industry, Studiocanal film production and co-production commitments (given and received) and broadcasting rights of CanalSat and ”nc+” multichannel digital TV packages. They are recorded as content assets when the broadcast is available for initial release. As of December 31, 2013, provisions recorded relating to these commitments amounted to €71 million, compared to €86 million as of December 31, 2012. In addition, this amount does not include commitments in relation to channel right contracts, ISP (Internet Service Provider) royalties and non-exclusive distribution of channels, under which neither Canal+ Group nor GVT granted minimum guarantees. The variable amount of these commitments cannot be reliably determined and is not reported in the Statement of Financial Position or in commitments and is instead recorded as an expense for the period in which it was incurred. Based on the estimation of the future subscriber number at Canal+ Group, commitments in relation to channel right contracts would have increased by a net amount of €354 million as of December 31, 2013, compared to €288 million as of December 31, 2012. Moreover, according to the agreement entered into with cinema professional organizations on December 18, 2009, Société d’Edition de Canal Plus (SECP) is required to invest, every year for a five-year period (2010-2014), 12.5% of its annual revenues in the financing of European films. With respect to audiovisual, in accordance with the agreements with producers and authors’ organizations, Canal+ France is required to invest a percentage of its revenues in the financing of heritage work every year. Agreements with cinema organizations and with producers and authors’ organizations are not recorded as off balance sheet commitments as the future estimate of these commitments cannot be reliably determined.
b. Notably includes broadcasting rights for the French professional Soccer League 1 awarded to Canal+ Group for the 2014-2015 and 2015-2016 seasons. The price paid by Canal+ Group represents €427 million per season, or a remaining total of €854 million as of December 31, 2013, compared to €1 281 million as of December 31, 2012. Moreover, the broadcasting rights also includes the English Premier League for the 2014-2015 and 2015-2016 seasons, renewed in January 2013 and the Formula 1 World Championship awarded in February 2013. These commitments will be recognized in the Statement of Financial Position either upon the start of every season or upon initial significant payment.
c. Primarily relates to UMG which routinely commits to artists and other parties to pay agreed amounts upon delivery of content or other products (“Creative talent and employment agreements”). Until the artist or the other party has delivered his or her content or the repayment of an advance, UMG discloses its obligation as an off-balance sheet given commitment. While the artist or the other party is obligated to deliver a content or other product to UMG (these arrangements are generally exclusive), this counterpart cannot be reliably determined and, thus, is not reported in received commitments.
(in millions of euros) 2014 2015-2018 After 2018Film and television rights (a) 208 208 - - 189 Sports rights 402 402 - - 374 Music royalties to artists and repertoire owners 1,614 1,598 16 - 1,579 Creative talent, employment agreements and others 111 37 72 2 119 Games royalties - - - - 22 Content liabilities 2,335 2,245 88 2 2,283
Total minimum future payments as of
December 31, 2012Total
Due inMinimum future payments as of December 31, 2013
(in millions of euros) 2014 2015-2018 After 2018Film and television rights (a) 2,383 1,219 1,151 13 2,590 Sports rights (b) 1,350 668 682 - 1,715 Creative talent, employment agreements and others (c) 754 356 355 43 959 Given commitments 4,487 2,243 2,188 56 5,264 Film and television rights (a) (179) (118) (61) - (114)Sports rights (10) (7) (3) - (12)Creative talent, employment agreements and others (c)Other - - - - (199)Received commitments (189) (125) (64) - (325)Total net 4,298 2,118 2,124 56 4,939
not available
Minimum future payments as of December 31, 2013 Total minimum future payments as of
December 31, 2012Total
Due in
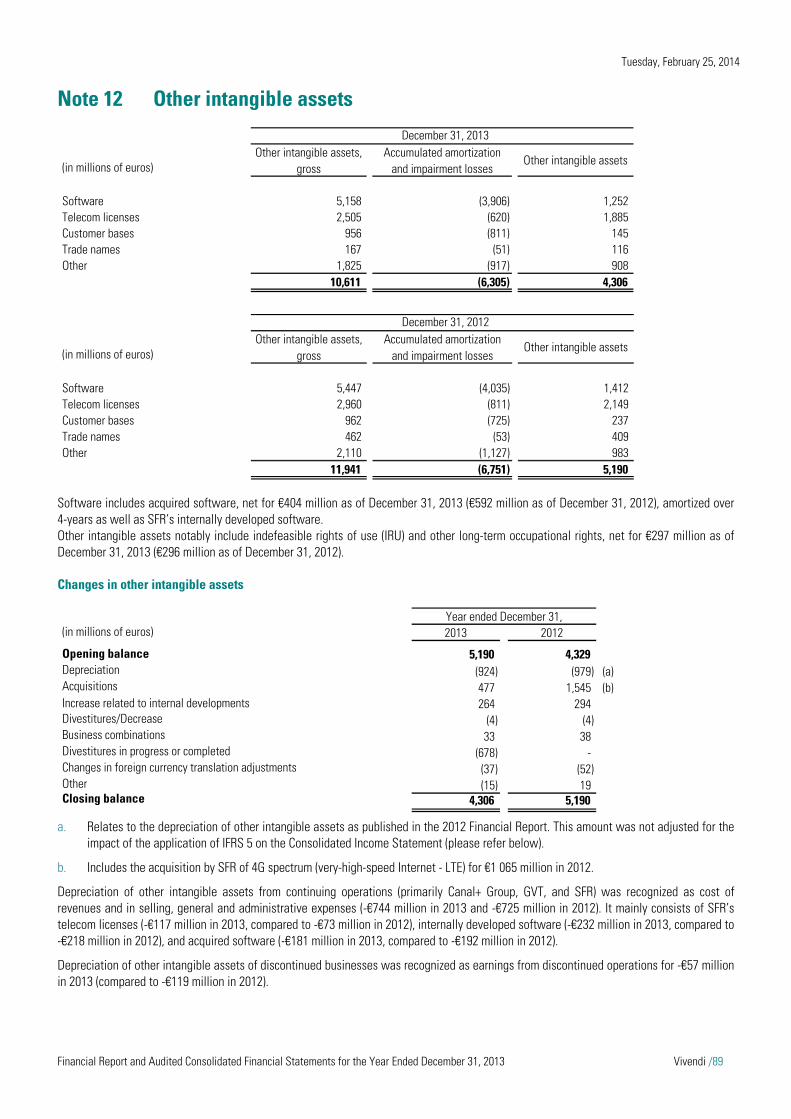
Tuesday, February 25, 2014
Financial Report and Audited Consolidated Financial Statements for the Year Ended December 31, 2013 Vivendi /89
Note 12 Other intangible assets
Software includes acquired software, net for €404 million as of December 31, 2013 (€592 million as of December 31, 2012), amortized over 4-years as well as SFR’s internally developed software. Other intangible assets notably include indefeasible rights of use (IRU) and other long-term occupational rights, net for €297 million as of December 31, 2013 (€296 million as of December 31, 2012).
Changes in other intangible assets
a. Relates to the depreciation of other intangible assets as published in the 2012 Financial Report. This amount was not adjusted for the
impact of the application of IFRS 5 on the Consolidated Income Statement (please refer below).
b. Includes the acquisition by SFR of 4G spectrum (very-high-speed Internet - LTE) for €1 065 million in 2012.
Depreciation of other intangible assets from continuing operations (primarily Canal+ Group, GVT, and SFR) was recognized as cost of revenues and in selling, general and administrative expenses (-€744 million in 2013 and -€725 million in 2012). It mainly consists of SFR’s telecom licenses (-€117 million in 2013, compared to -€73 million in 2012), internally developed software (-€232 million in 2013, compared to -€218 million in 2012), and acquired software (-€181 million in 2013, compared to -€192 million in 2012).
Depreciation of other intangible assets of discontinued businesses was recognized as earnings from discontinued operations for -€57 million in 2013 (compared to -€119 million in 2012).
(in millions of euros)Other intangible assets,
grossAccumulated amortization
and impairment lossesOther intangible assets
Software 5,158 (3,906) 1,252Telecom licenses 2,505 (620) 1,885Customer bases 956 (811) 145Trade names 167 (51) 116Other 1,825 (917) 908
10,611 (6,305) 4,306
December 31, 2013
(in millions of euros)Other intangible assets,
grossAccumulated amortization
and impairment lossesOther intangible assets
Software 5,447 (4,035) 1,412Telecom licenses 2,960 (811) 2,149Customer bases 962 (725) 237Trade names 462 (53) 409Other 2,110 (1,127) 983
11,941 (6,751) 5,190
December 31, 2012
(in millions of euros) 2013 2012
Opening balance 5,190 4,329Depreciation (924) (979) (a)Acquisitions 477 1,545 (b)Increase related to internal developments 264 294Divestitures/Decrease (4) (4)Business combinations 33 38Divestitures in progress or completed (678) -Changes in foreign currency translation adjustments (37) (52)Other (15) 19Closing balance 4,306 5,190
Year ended December 31,

Tuesday, February 25, 2014
Financial Report and Audited Consolidated Financial Statements for the Year Ended December 31, 2013 Vivendi /90
Note 13 Property, plant and equipment
As of December 31, 2013, other property, plant and equipment, net, notably included set-top boxes, for €973 million, compared to €974 million as of December 31, 2012. In addition, property, plant and equipment financed pursuant to finance leases amounted to €44 million, compared to €58 million as of December 31, 2012.
Changes in property, plant and equipment
a. Relates to the depreciation of property, plant and equipment as published in the 2012 Financial Report. This amount was not adjusted
for the impact of the application of IFRS 5 on the Consolidated Income Statement (see below).
Depreciation of property, plant and equipment (primarily Canal+ Group, UMG, GVT, and SFR) was recognized as cost of revenues and in selling, general and administrative expenses for -€1,441 million in 2013 and -€1,327 million in 2012. It mainly consists of buildings (-€126 million in 2013, compared to -€124 million in 2012) and equipment and machinery (-€852 million in 2013, compared to -€752 million in 2012).
Depreciation of property, plant and equipment of discontinued businesses was recognized as earnings from discontinued operations. It mainly consists of Activision Blizzard and Maroc Telecom group for -€45 million and -€365 million, respectively in 2013 (compared to -€70 million and -€346 million, respectively in 2012).
(in millions of euros)
Property, plant and equipment, gross
Accumulated depreciation and
impairment lossesProperty, plant and equipment
Land 82 (2) 80Buildings 3,052 (1,718) 1,334Equipment and machinery 8,768 (4,704) 4,064Construction-in-progress 353 - 353Other 4,306 (2,596) 1,710
16,561 (9,020) 7,541
December 31, 2013
(in millions of euros)
Property, plant and equipment, gross
Accumulated depreciation and
impairment lossesProperty, plant and equipment
Land 242 (2) 240Buildings 3,707 (2,143) 1,564Equipment and machinery 13,939 (8,071) 5,868Construction-in-progress 375 - 375Other 4,637 (2,758) 1,879
22,900 (12,974) 9,926
December 31, 2012
(in millions of euros) 2013 2012
Opening balance 9,926 9,001Depreciation (1,851) (1,743) (a)Acquisitions/Increase 2,448 2,769Divestitures/Decrease (115) (39)Business combinations (40) 170Divestitures in progress or completed (2,381) -Changes in foreign currency translation adjustments (444) (232)Other (2) -Closing balance 7,541 9,926
Year ended December 31,

Tuesday, February 25, 2014
Financial Report and Audited Consolidated Financial Statements for the Year Ended December 31, 2013 Vivendi /91
Note 14 Intangible and tangible assets of telecom operations
a. SFR holds licenses for its networks and for the supply of its telecommunications services in France, for a 15-year period for GSM
(between March 2006 and March 2021) and a 20-year period for both UMTS (between August 2001 and August 2021) and LTE (between January 2012 and January 2032), with the following financial conditions: for the GSM license, an annual payment over 15 years comprised of a (i) fixed portion in an amount of €25 million for each year
(capitalized over the period based on a present value of €278 million in 2006) and (ii) a variable portion equal to 1% of the yearly revenues generated by this activity;
for the UMTS license, the fixed amount paid in 2001 (€619 million) was recorded as an intangible asset and the variable part of the fee is equal to 1% of the yearly revenues generated by this activity. Moreover, as part of this license, SFR acquired new spectrum for €300 million in June 2010, over a 20-year period; and
for the LTE licenses, the fixed amounts paid in October 2011 (€150 million) and January 2012 (€1,065 million), respectively, were recorded as intangible assets at the grant date of spectrum brand published in the “Journal Officiel” in October 2011 and January 2012, and the variable portion of the fee is equal to 1% of the yearly revenues generated by this activity.
December 31, 2013
(in millions of euros)SFR GVT
Maroc Telecom Group
Total
Other intangible assets, netSoftware 1,153 55 - 1,208Telecom licenses 1,885 (a) - - 1,885Customer bases 86 21 - 107Trade names - 97 - 97Other 807 11 - 818
3,931 184 - 4,115
Property, plant and equipment, netLand 76 - - 76Buildings 1,286 15 - 1,301Equipment and machinery 2,078 1,904 - 3,982Construction-in-progress 304 - - 304Other 788 358 - 1,146
4,532 2,277 - 6,809
Intangible and tangible assets of telecom operations, net 8,463 2,461 - 10,924
December 31, 2012
(in millions of euros)SFR GVT
Maroc Telecom Group
Total
Other intangible assets, netSoftware 1,112 56 182 1,350Telecom licenses 2,002 (a) - 147 2,149Customer bases 152 72 2 226Trade names - 117 1 118Other 816 13 50 879
4,082 258 382 4,722
Property, plant and equipment, netLand 97 - 131 228Buildings 1,182 16 315 1,513Equipment and machinery 2,117 1,885 1,747 5,749Construction-in-progress 314 - - 314Other 758 334 97 1,189
4,468 2,235 2,290 8,993
Intangible and tangible assets of telecom operations, net 8,550 2,493 2,672 13,715
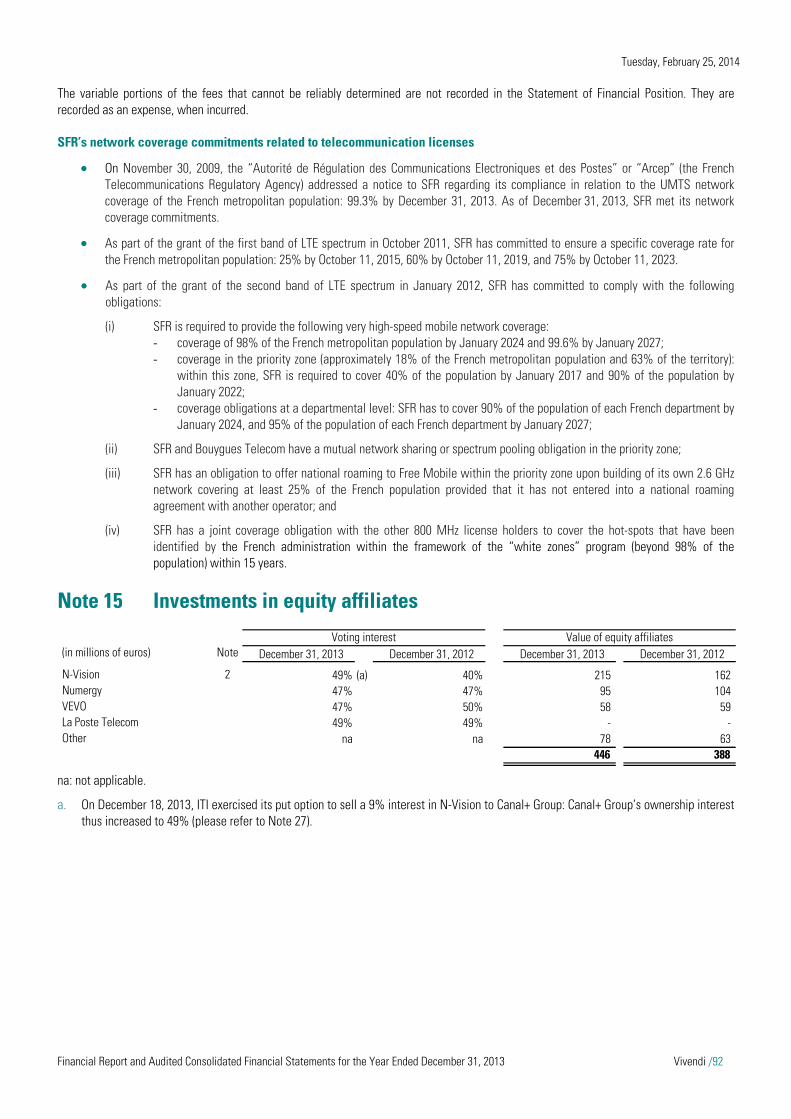
Tuesday, February 25, 2014
Financial Report and Audited Consolidated Financial Statements for the Year Ended December 31, 2013 Vivendi /92
The variable portions of the fees that cannot be reliably determined are not recorded in the Statement of Financial Position. They are recorded as an expense, when incurred.
SFR’s network coverage commitments related to telecommunication licenses
On November 30, 2009, the “Autorité de Régulation des Communications Electroniques et des Postes” or “Arcep” (the French Telecommunications Regulatory Agency) addressed a notice to SFR regarding its compliance in relation to the UMTS network coverage of the French metropolitan population: 99.3% by December 31, 2013. As of December 31, 2013, SFR met its network coverage commitments.
As part of the grant of the first band of LTE spectrum in October 2011, SFR has committed to ensure a specific coverage rate for the French metropolitan population: 25% by October 11, 2015, 60% by October 11, 2019, and 75% by October 11, 2023.
As part of the grant of the second band of LTE spectrum in January 2012, SFR has committed to comply with the following obligations:
(i) SFR is required to provide the following very high-speed mobile network coverage: ‐ coverage of 98% of the French metropolitan population by January 2024 and 99.6% by January 2027; ‐ coverage in the priority zone (approximately 18% of the French metropolitan population and 63% of the territory):
within this zone, SFR is required to cover 40% of the population by January 2017 and 90% of the population by January 2022;
‐ coverage obligations at a departmental level: SFR has to cover 90% of the population of each French department by January 2024, and 95% of the population of each French department by January 2027;
(ii) SFR and Bouygues Telecom have a mutual network sharing or spectrum pooling obligation in the priority zone;
(iii) SFR has an obligation to offer national roaming to Free Mobile within the priority zone upon building of its own 2.6 GHz network covering at least 25% of the French population provided that it has not entered into a national roaming agreement with another operator; and
(iv) SFR has a joint coverage obligation with the other 800 MHz license holders to cover the hot-spots that have been identified by the French administration within the framework of the “white zones” program (beyond 98% of the population) within 15 years.
Note 15 Investments in equity affiliates
na: not applicable.
a. On December 18, 2013, ITI exercised its put option to sell a 9% interest in N-Vision to Canal+ Group: Canal+ Group’s ownership interest thus increased to 49% (please refer to Note 27).
(in millions of euros) Note December 31, 2013 December 31, 2012 December 31, 2013 December 31, 2012
N-Vision 2 49% (a) 40% 215 162Numergy 2 47% 47% 95 104VEVO 47% 50% 58 59La Poste Telecom 49% 49% - -Other na na 78 63
446 388
Voting interest Value of equity affiliates

Tuesday, February 25, 2014
Financial Report and Audited Consolidated Financial Statements for the Year Ended December 31, 2013 Vivendi /93
Note 16 Financial assets
a. As of January 1, 2013, Vivendi applied, with retrospective effect as from January 1, 2012, amended IAS 19 (Employee Benefits), whose application is mandatory in the European Union beginning on or after January 1, 2013 (please refer to Note 1). As a result, the 2012 Financial Statements were adjusted in accordance with the new standards (please refer to Note 33).
b. Primarily related to US treasuries and government agency securities with a maturity exceeding three months held by Activision Blizzard ($387 million as of December 31, 2012).
c. Available-for-sale securities notably included securities held by UMG in Beats and Spotify for €161 million and €143 million, respectively (€70 million and €84 million as of December 31, 2012). In 2013, the fair values of these securities were reassessed with the entry of new investors to their capital. They did not include publicly quoted securities as of December 31, 2013 and December 31, 2012 and were not the subject of any significant impairment with respect to fiscal years 2013 and 2012.
Note 17 Net working capital
Changes in net working capital
a. Excludes content investments made by UMG, Canal+ Group, and Activision Blizzard. In 2012, related to amounts as published in the 2012 Annual Report; does not include the adjustments from the impact of the application of IFRS 5 on the Consolidated Cash Flow Statement.
b. Mainly includes the change in net working capital relating to content investments, capital expenditures, and other investments.
(in millions of euros) December 31, 2013 December 31, 2012 (a)
Cash management financial assets (b) - 301Other loans and receivables 206 196Derivative financial instruments 126 137Available-for-sale securities (c) 360 197Cash deposits backing borrowings 2 6Other financial assets 5 15Financial assets 699 852Deduction of current financial assets (45) (364)Non-current financial assets 654 488
(in millions of euros)
December 31, 2012
Changes in operating working
capital (a)
Business combinations
Divestitures in progress or completed
Changes in foreign currency
translation adjustments
Other (b) December 31,
2013
Inventories 738 (20) (3) (376) (9) - 330Trade accounts receivable and other 6,587 (8) (192) (1,419) (79) 9 4,898Working capital assets 7,325 (28) (195) (1,795) (88) 9 5,228
Trade accounts payable and other 14,196 (252) (8) (3,506) (211) 197 10,416Other non-current liabilities 1,002 (84) 17 (12) (23) (143) 757Working capital liabilities 15,198 (336) 9 (3,518) (234) 54 11,173
Net working capital (7,873) 308 (204) 1,723 146 (45) (5,945)
(in millions of euros)
December 31, 2011
Changes in operating working
capital (a)
Business combinations
Divestitures in progress or completed
Changes in foreign currency
translation adjustments
Other (b) December 31,
2012
Inventories 805 (80) 29 - (12) (4) 738Trade accounts receivable and other 6,730 (291) 284 (26) (84) (26) 6,587Working capital assets 7,535 (371) 313 (26) (96) (30) 7,325
Trade accounts payable and other 13,987 (307) 579 (16) (125) 78 14,196Other non-current liabilities 864 26 56 - (19) 75 1,002Working capital liabilities 14,851 (281) 635 (16) (144) 153 15,198
Net working capital (7,316) (90) (322) (10) 48 (183) (7,873)
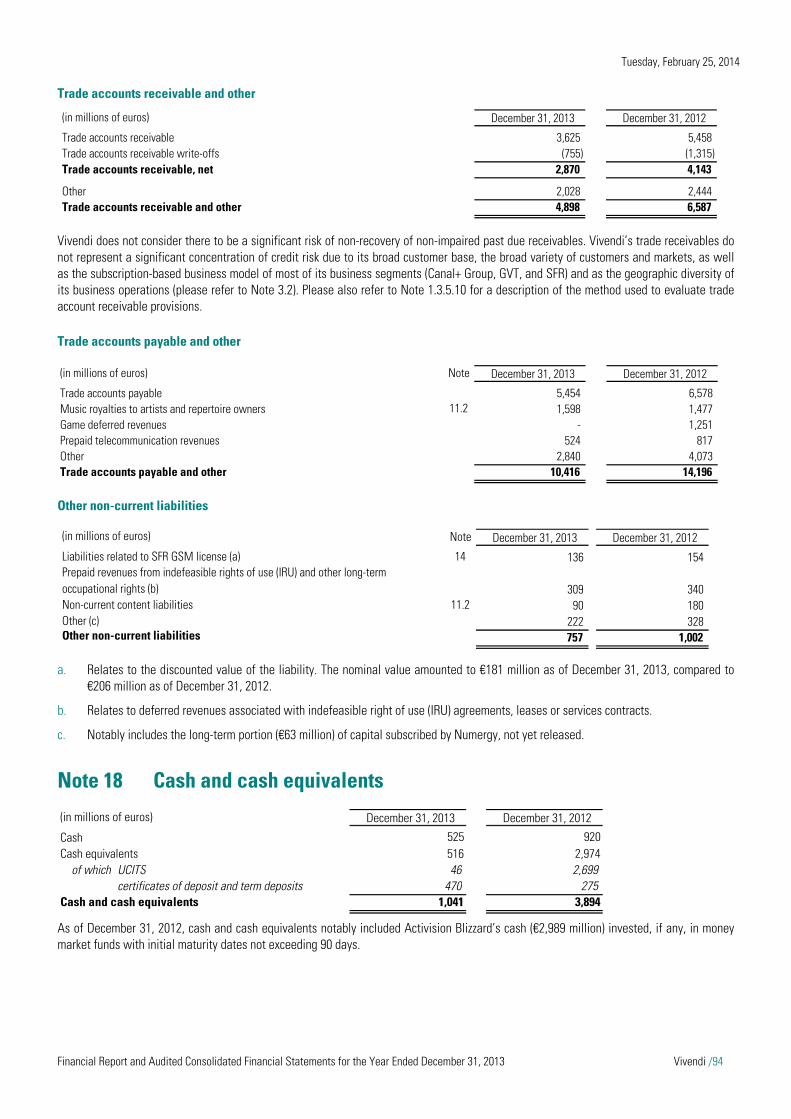
Tuesday, February 25, 2014
Financial Report and Audited Consolidated Financial Statements for the Year Ended December 31, 2013 Vivendi /94
Trade accounts receivable and other
Vivendi does not consider there to be a significant risk of non-recovery of non-impaired past due receivables. Vivendi’s trade receivables do not represent a significant concentration of credit risk due to its broad customer base, the broad variety of customers and markets, as well as the subscription-based business model of most of its business segments (Canal+ Group, GVT, and SFR) and as the geographic diversity of its business operations (please refer to Note 3.2). Please also refer to Note 1.3.5.10 for a description of the method used to evaluate trade account receivable provisions.
Trade accounts payable and other
Other non-current liabilities
a. Relates to the discounted value of the liability. The nominal value amounted to €181 million as of December 31, 2013, compared to €206 million as of December 31, 2012.
b. Relates to deferred revenues associated with indefeasible right of use (IRU) agreements, leases or services contracts.
c. Notably includes the long-term portion (€63 million) of capital subscribed by Numergy, not yet released.
Note 18 Cash and cash equivalents
As of December 31, 2012, cash and cash equivalents notably included Activision Blizzard’s cash (€2,989 million) invested, if any, in money market funds with initial maturity dates not exceeding 90 days.
(in millions of euros) December 31, 2013 December 31, 2012
Trade accounts receivable 3,625 5,458Trade accounts receivable write-offs (755) (1,315)Trade accounts receivable, net 2,870 4,143
Other 2,028 2,444Trade accounts receivable and other 4,898 6,587
(in millions of euros) Note December 31, 2013 December 31, 2012
Trade accounts payable 5,454 6,578Music royalties to artists and repertoire owners 11.2 1,598 1,477Game deferred revenues - 1,251Prepaid telecommunication revenues 524 817Other 2,840 4,073Trade accounts payable and other 10,416 14,196
(in millions of euros) Note December 31, 2013 December 31, 2012
Liabilities related to SFR GSM license (a) 14 136 154Prepaid revenues from indefeasible rights of use (IRU) and other long-term occupational rights (b) 309 340Non-current content liabilities 11.2 90 180Other (c) 222 328Other non-current liabilities 757 1,002
(in millions of euros) December 31, 2013 December 31, 2012
Cash 525 920Cash equivalents 516 2,974
of which UCITS 46 2,699certificates of deposit and term deposits 470 275
Cash and cash equivalents 1,041 3,894
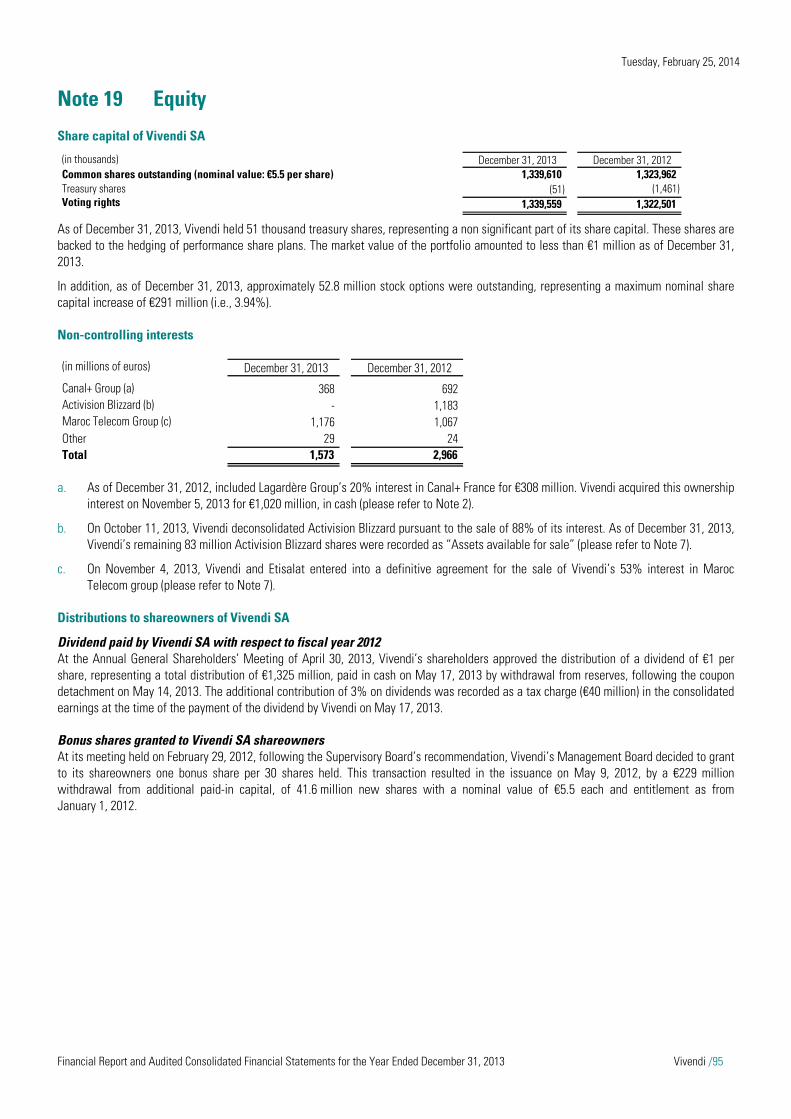
Tuesday, February 25, 2014
Financial Report and Audited Consolidated Financial Statements for the Year Ended December 31, 2013 Vivendi /95
Note 19 Equity
Share capital of Vivendi SA
As of December 31, 2013, Vivendi held 51 thousand treasury shares, representing a non significant part of its share capital. These shares are backed to the hedging of performance share plans. The market value of the portfolio amounted to less than €1 million as of December 31, 2013.
In addition, as of December 31, 2013, approximately 52.8 million stock options were outstanding, representing a maximum nominal share capital increase of €291 million (i.e., 3.94%).
Non-controlling interests
a. As of December 31, 2012, included Lagardère Group’s 20% interest in Canal+ France for €308 million. Vivendi acquired this ownership interest on November 5, 2013 for €1,020 million, in cash (please refer to Note 2).
b. On October 11, 2013, Vivendi deconsolidated Activision Blizzard pursuant to the sale of 88% of its interest. As of December 31, 2013, Vivendi’s remaining 83 million Activision Blizzard shares were recorded as “Assets available for sale” (please refer to Note 7).
c. On November 4, 2013, Vivendi and Etisalat entered into a definitive agreement for the sale of Vivendi’s 53% interest in Maroc Telecom group (please refer to Note 7).
Distributions to shareowners of Vivendi SA
Dividend paid by Vivendi SA with respect to fiscal year 2012 At the Annual General Shareholders’ Meeting of April 30, 2013, Vivendi’s shareholders approved the distribution of a dividend of €1 per share, representing a total distribution of €1,325 million, paid in cash on May 17, 2013 by withdrawal from reserves, following the coupon detachment on May 14, 2013. The additional contribution of 3% on dividends was recorded as a tax charge (€40 million) in the consolidated earnings at the time of the payment of the dividend by Vivendi on May 17, 2013.
Bonus shares granted to Vivendi SA shareowners At its meeting held on February 29, 2012, following the Supervisory Board’s recommendation, Vivendi’s Management Board decided to grant to its shareowners one bonus share per 30 shares held. This transaction resulted in the issuance on May 9, 2012, by a €229 million withdrawal from additional paid-in capital, of 41.6 million new shares with a nominal value of €5.5 each and entitlement as from January 1, 2012.
(in thousands) December 31, 2013 December 31, 2012Common shares outstanding (nominal value: €5.5 per share) 1,339,610 1,323,962Treasury shares (51) (1,461)Voting rights 1,339,559 1,322,501
(in millions of euros) December 31, 2013 December 31, 2012
Canal+ Group (a) 368 692Activision Blizzard (b) - 1,183Maroc Telecom Group (c) 1,176 1,067Other 29 24Total 1,573 2,966
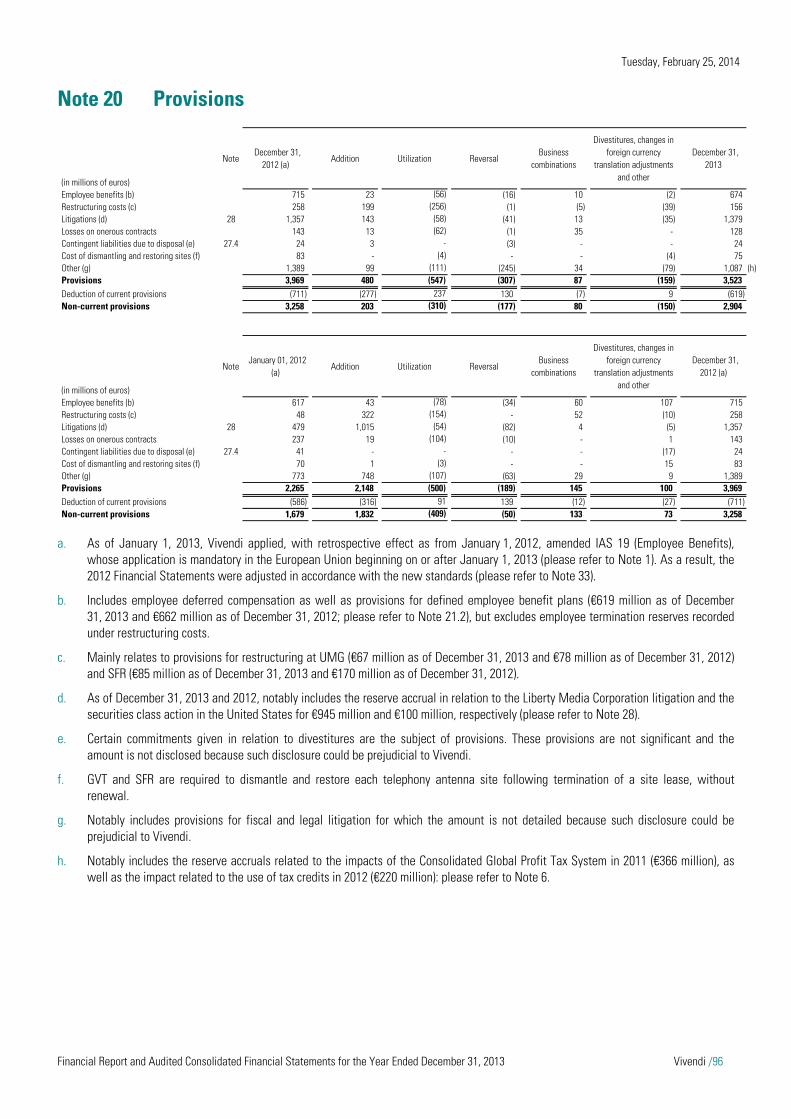
Tuesday, February 25, 2014
Financial Report and Audited Consolidated Financial Statements for the Year Ended December 31, 2013 Vivendi /96
Note 20 Provisions
a. As of January 1, 2013, Vivendi applied, with retrospective effect as from January 1, 2012, amended IAS 19 (Employee Benefits), whose application is mandatory in the European Union beginning on or after January 1, 2013 (please refer to Note 1). As a result, the 2012 Financial Statements were adjusted in accordance with the new standards (please refer to Note 33).
b. Includes employee deferred compensation as well as provisions for defined employee benefit plans (€619 million as of December 31, 2013 and €662 million as of December 31, 2012; please refer to Note 21.2), but excludes employee termination reserves recorded under restructuring costs.
c. Mainly relates to provisions for restructuring at UMG (€67 million as of December 31, 2013 and €78 million as of December 31, 2012) and SFR (€85 million as of December 31, 2013 and €170 million as of December 31, 2012).
d. As of December 31, 2013 and 2012, notably includes the reserve accrual in relation to the Liberty Media Corporation litigation and the securities class action in the United States for €945 million and €100 million, respectively (please refer to Note 28).
e. Certain commitments given in relation to divestitures are the subject of provisions. These provisions are not significant and the amount is not disclosed because such disclosure could be prejudicial to Vivendi.
f. GVT and SFR are required to dismantle and restore each telephony antenna site following termination of a site lease, without renewal.
g. Notably includes provisions for fiscal and legal litigation for which the amount is not detailed because such disclosure could be prejudicial to Vivendi.
h. Notably includes the reserve accruals related to the impacts of the Consolidated Global Profit Tax System in 2011 (€366 million), as well as the impact related to the use of tax credits in 2012 (€220 million): please refer to Note 6.
(in millions of euros)
Note December 31,
2012 (a)Addition Utilization Reversal
Business combinations
Divestitures, changes in foreign currency
translation adjustments and other
December 31, 2013
Employee benefits (b) 715 23 (56) (16) 10 (2) 674Restructuring costs (c) 258 199 (256) (1) (5) (39) 156Litigations (d) 28 1,357 143 (58) (41) 13 (35) 1,379Losses on onerous contracts 143 13 (62) (1) 35 - 128Contingent liabilities due to disposal (e) 27.4 24 3 - (3) - - 24Cost of dismantling and restoring sites (f) 83 - (4) - - (4) 75Other (g) 1,389 99 (111) (245) 34 (79) 1,087 (h)Provisions 3,969 480 (547) (307) 87 (159) 3,523Deduction of current provisions (711) (277) 237 130 (7) 9 (619)Non-current provisions 3,258 203 (310) (177) 80 (150) 2,904
(in millions of euros)
Note January 01, 2012
(a)Addition Utilization Reversal
Business combinations
Divestitures, changes in foreign currency
translation adjustments and other
December 31, 2012 (a)
Employee benefits (b) 617 43 (78) (34) 60 107 715Restructuring costs (c) 48 322 (154) - 52 (10) 258Litigations (d) 28 479 1,015 (54) (82) 4 (5) 1,357Losses on onerous contracts 237 19 (104) (10) - 1 143Contingent liabilities due to disposal (e) 27.4 41 - - - - (17) 24Cost of dismantling and restoring sites (f) 70 1 (3) - - 15 83Other (g) 773 748 (107) (63) 29 9 1,389Provisions 2,265 2,148 (500) (189) 145 100 3,969Deduction of current provisions (586) (316) 91 139 (12) (27) (711)Non-current provisions 1,679 1,832 (409) (50) 133 73 3,258
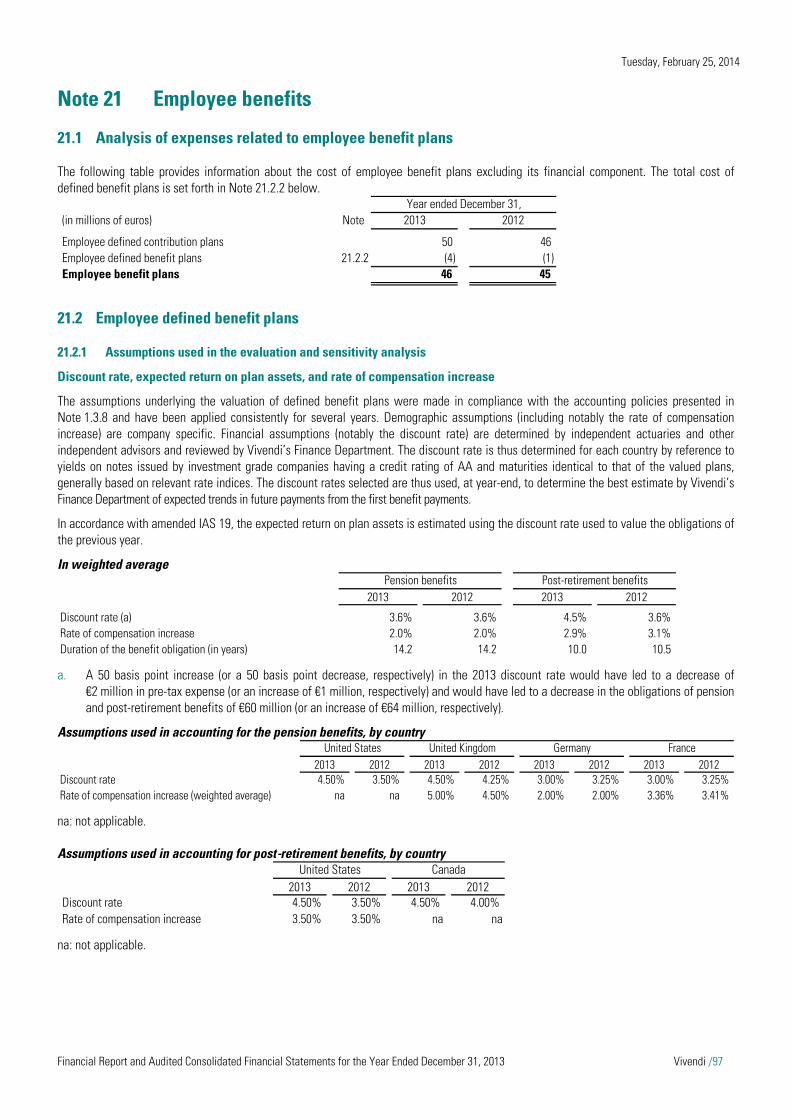
Tuesday, February 25, 2014
Financial Report and Audited Consolidated Financial Statements for the Year Ended December 31, 2013 Vivendi /97
Note 21 Employee benefits
21.1 Analysis of expenses related to employee benefit plans
The following table provides information about the cost of employee benefit plans excluding its financial component. The total cost of defined benefit plans is set forth in Note 21.2.2 below.
21.2 Employee defined benefit plans
21.2.1 Assumptions used in the evaluation and sensitivity analysis
Discount rate, expected return on plan assets, and rate of compensation increase
The assumptions underlying the valuation of defined benefit plans were made in compliance with the accounting policies presented in Note 1.3.8 and have been applied consistently for several years. Demographic assumptions (including notably the rate of compensation increase) are company specific. Financial assumptions (notably the discount rate) are determined by independent actuaries and other independent advisors and reviewed by Vivendi’s Finance Department. The discount rate is thus determined for each country by reference to yields on notes issued by investment grade companies having a credit rating of AA and maturities identical to that of the valued plans, generally based on relevant rate indices. The discount rates selected are thus used, at year-end, to determine the best estimate by Vivendi’s Finance Department of expected trends in future payments from the first benefit payments.
In accordance with amended IAS 19, the expected return on plan assets is estimated using the discount rate used to value the obligations of the previous year.
In weighted average
a. A 50 basis point increase (or a 50 basis point decrease, respectively) in the 2013 discount rate would have led to a decrease of €2 million in pre-tax expense (or an increase of €1 million, respectively) and would have led to a decrease in the obligations of pension and post-retirement benefits of €60 million (or an increase of €64 million, respectively).
Assumptions used in accounting for the pension benefits, by country
na: not applicable.
Assumptions used in accounting for post-retirement benefits, by country
na: not applicable.
Year ended December 31,(in millions of euros) Note 2013 2012
Employee defined contribution plans 50 46Employee defined benefit plans 21.2.2 (4) (1)Employee benefit plans 46 45
2013 2012 2013 2012
Discount rate (a) 3.6% 3.6% 4.5% 3.6%Rate of compensation increase 2.0% 2.0% 2.9% 3.1%Duration of the benefit obligation (in years) 14.2 14.2 10.0 10.5
Pension benefits Post-retirement benefits
2013 2012 2013 2012 2013 2012 2013 2012Discount rate 4.50% 3.50% 4.50% 4.25% 3.00% 3.25% 3.00% 3.25%Rate of compensation increase (weighted average) na na 5.00% 4.50% 2.00% 2.00% 3.36% 3.41%
United States United Kingdom Germany France
2013 2012 2013 2012Discount rate 4.50% 3.50% 4.50% 4.00%Rate of compensation increase 3.50% 3.50% na na
United States Canada

Tuesday, February 25, 2014
Financial Report and Audited Consolidated Financial Statements for the Year Ended December 31, 2013 Vivendi /98
Allocation of pension plan assets
a. Pension plan assets are mainly financial assets actively traded in organized financial markets.
Pension plan assets which were not transferred have a limited exposure to stock market fluctuations. These assets do not include occupied buildings or assets used by Vivendi nor shares or debt instruments of Vivendi.
Cost evolution of post-retirement benefits
For the purpose of measuring post-retirement benefits, Vivendi assumed the annual growth in the per capita cost of covered health care benefits would slow down from 7.3% for categories under 65 years old and 65 years old and over in 2013, to 4.5% in 2022 for these categories. In 2013, a one-percentage-point increase in the assumed cost evolution rates would have increased post-retirement benefit obligations by €10 million and the pre-tax expense by €1 million. Conversely, a one-percentage-point decrease in the assumed cost evolution rates would have decreased post-retirement benefit obligations by €8 million and the pre-tax expense by €1 million.
21.2.2 Analysis of the expense recorded and of the amount of benefits paid
a. The recorded past service cost mainly relates to the effect of decreases in relation to the restructuring at SFR (impact in 2013), as well as the change of part of the group’s management team since the end of June 2012.
In 2013, benefits paid amounted to (i) €35 million (compared to €29 million in 2012) with respect to pensions, of which €9 million (compared to €7 million in 2012) was paid by pension funds, and (ii) €10 million (compared to €12 million in 2012) was paid with respect to post-retirement benefits.
December 31, 2013 (a) December 31, 2012 (a) 4%
Equity securities 4% 6%Debt securities 48% 57%Diversified funds 28% 16%Insurance contracts 5% 5%Real estate 1% 1%Cash and other 14% 15%Total 100% 100%
Pension benefits Post-retirement benefits Total(in millions of euros) 2013 2012 2013 2012 2013 2012
Current service cost 19 18 - - 19 18 Past service cost (a) (17) (20) - - (17) (20)(Gains) / losses on settlements (7) - - - (7) - Other 1 1 - - 1 1 Impact on selling, administrative and general expenses (4) (1) - - (4) (1)Interest cost 27 29 6 7 33 36 Expected return on plan assets (13) (13) - - (13) (13)Impact on other financial charges and income 14 16 6 7 20 23 Net benefit cost recognized in profit and loss 10 15 6 7 16 22

Tuesday, February 25, 2014
Financial Report and Audited Consolidated Financial Statements for the Year Ended December 31, 2013 Vivendi /99
21.2.3 Analysis of net benefit obligations with respect to pensions and post-retirement benefits
Changes in value of benefit obligations, fair value of plan assets, and funded status
Benefit obligation Fair value of plan assets
Net (provisions)/assets
recorded in the Statement of
Financial Position(in millions of euros) Note (A) (B) (B)-(A)
Opening balance 1,020 367 (653)Current service cost 21 (21)Past service cost (18) 18(Gains)/losses on settlements (29) (22) 7Other 1 (1)
Impact on selling, administrative and general expenses 3Interest cost 35 (35)Expected return on plan assets 13 13
Impact on other financial charges and income (22)Net benefit cost recognized in profit and loss (19)
Experience gains/(losses) (a) 12 (1) (13)Actuarial gains/(losses) related to changes in demographic assumptions 2 (2)Actuarial gains/(losses) related to changes in financial assumptions 5 (5)Adjustment related to asset ceiling -
Actuarial gains/(losses) recognized in other comprehensive income (20)Contributions by plan participants 1 1 -Contributions by employers 46 46Benefits paid from the fund (9) (9) -Benefits paid by the employer (36) (36) -Business combinations (b) 12 9 (3)Divestitures of businesses -Transfers -Other (of which foreign currency translation adjustments) (20) (12) 8Reclassification to assets held for sale (31) 31Closing balance 966 356 (610)of which wholly or partly funded benefits 487
wholly unfunded benefits (c) 479of which assets related to employee benefit plans 9
provisions for employee benefit plans (d) 20 (619)
Employee defined benefit plansYear ended December 31, 2013
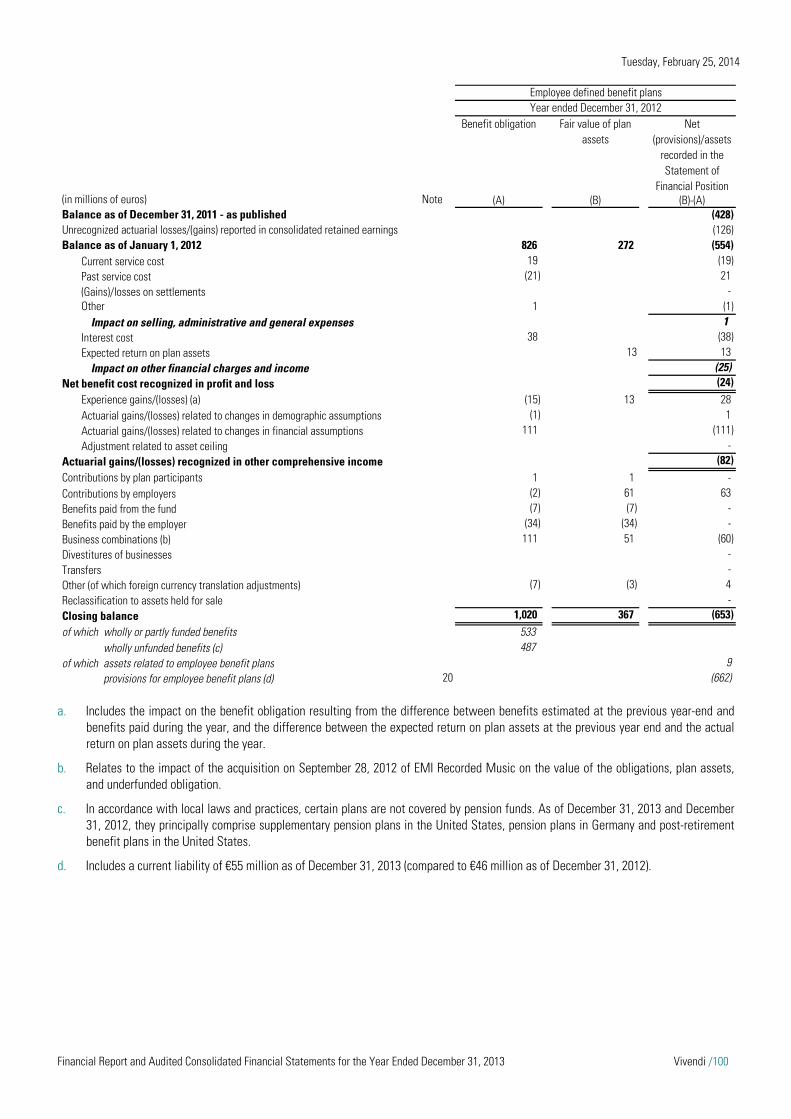
Tuesday, February 25, 2014
Financial Report and Audited Consolidated Financial Statements for the Year Ended December 31, 2013 Vivendi /100
a. Includes the impact on the benefit obligation resulting from the difference between benefits estimated at the previous year-end and benefits paid during the year, and the difference between the expected return on plan assets at the previous year end and the actual return on plan assets during the year.
b. Relates to the impact of the acquisition on September 28, 2012 of EMI Recorded Music on the value of the obligations, plan assets, and underfunded obligation.
c. In accordance with local laws and practices, certain plans are not covered by pension funds. As of December 31, 2013 and December 31, 2012, they principally comprise supplementary pension plans in the United States, pension plans in Germany and post-retirement benefit plans in the United States.
d. Includes a current liability of €55 million as of December 31, 2013 (compared to €46 million as of December 31, 2012).
Benefit obligation Fair value of plan assets
Net (provisions)/assets
recorded in the Statement of
Financial Position(in millions of euros) Note (A) (B) (B)-(A)Balance as of December 31, 2011 - as published (428)Unrecognized actuarial losses/(gains) reported in consolidated retained earnings (126)Balance as of January 1, 2012 826 272 (554)
Current service cost 19 (19)Past service cost (21) 21(Gains)/losses on settlements - -Other 1 (1)
Impact on selling, administrative and general expenses - 1Interest cost 38 (38)Expected return on plan assets 13 13
Impact on other financial charges and income (25)Net benefit cost recognized in profit and loss (24)
Experience gains/(losses) (a) (15) 13 28Actuarial gains/(losses) related to changes in demographic assumptions (1) 1Actuarial gains/(losses) related to changes in financial assumptions 111 (111)Adjustment related to asset ceiling -
Actuarial gains/(losses) recognized in other comprehensive income (82)Contributions by plan participants 1 1 -Contributions by employers (2) 61 63Benefits paid from the fund (7) (7) -Benefits paid by the employer (34) (34) -Business combinations (b) 111 51 (60)Divestitures of businesses - - -Transfers - - -Other (of which foreign currency translation adjustments) (7) (3) 4Reclassification to assets held for sale -Closing balance 1,020 367 (653)of which wholly or partly funded benefits 533
wholly unfunded benefits (c) 487of which assets related to employee benefit plans 9
provisions for employee benefit plans (d) 20 (662)
Employee defined benefit plansYear ended December 31, 2012
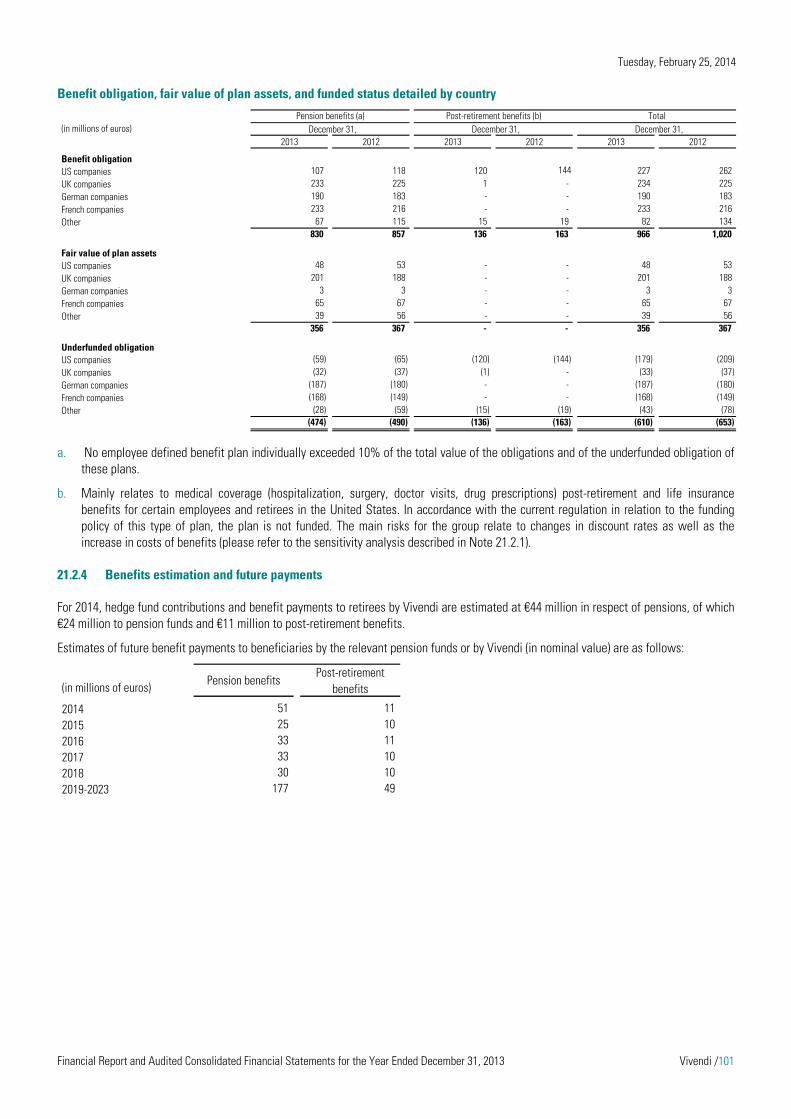
Tuesday, February 25, 2014
Financial Report and Audited Consolidated Financial Statements for the Year Ended December 31, 2013 Vivendi /101
Benefit obligation, fair value of plan assets, and funded status detailed by country
a. No employee defined benefit plan individually exceeded 10% of the total value of the obligations and of the underfunded obligation of these plans.
b. Mainly relates to medical coverage (hospitalization, surgery, doctor visits, drug prescriptions) post-retirement and life insurance benefits for certain employees and retirees in the United States. In accordance with the current regulation in relation to the funding policy of this type of plan, the plan is not funded. The main risks for the group relate to changes in discount rates as well as the increase in costs of benefits (please refer to the sensitivity analysis described in Note 21.2.1).
21.2.4 Benefits estimation and future payments
For 2014, hedge fund contributions and benefit payments to retirees by Vivendi are estimated at €44 million in respect of pensions, of which €24 million to pension funds and €11 million to post-retirement benefits.
Estimates of future benefit payments to beneficiaries by the relevant pension funds or by Vivendi (in nominal value) are as follows:
(in millions of euros) December 31, December 31, December 31,2013 2012 2013 2012 2013 2012
Benefit obligationUS companies 107 118 120 144 227 262UK companies 233 225 1 - 234 225German companies 190 183 - - 190 183French companies 233 216 - - 233 216Other 67 115 15 19 82 134
830 857 136 163 966 1,020
Fair value of plan assetsUS companies 48 53 - - 48 53UK companies 201 188 - - 201 188German companies 3 3 - - 3 3French companies 65 67 - - 65 67Other 39 56 - - 39 56
356 367 - - 356 367
Underfunded obligationUS companies (59) (65) (120) (144) (179) (209)UK companies (32) (37) (1) - (33) (37)German companies (187) (180) - - (187) (180)French companies (168) (149) - - (168) (149)Other (28) (59) (15) (19) (43) (78)
(474) (490) (136) (163) (610) (653)
Pension benefits (a) Post-retirement benefits (b) Total
(in millions of euros) Pension benefitsPost-retirement
benefits
2014 51 11 2015 25 10 2016 33 11 2017 33 10 2018 30 10 2019-2023 177 49

Tuesday, February 25, 2014
Financial Report and Audited Consolidated Financial Statements for the Year Ended December 31, 2013 Vivendi /102
Note 22 Share-based compensation plans
22.1 Impact on the Consolidated Statement of Earnings
22.2 Plans granted by Vivendi
22.2.1 Information on plans granted by Vivendi
Vivendi has granted several share-based compensation plans to employees of the group. During 2012, Vivendi granted stock option and performance share plans, wherever the fiscal residence of the beneficiaries and bonus share plan for employees of all the group’s French subsidiaries. In 2013, the Supervisory Board decided, upon the recommendation of the Management Board and General Management and the advice of the Human Resources Committee, that all grants would be made in the form of performance shares, wherever the fiscal residence of the beneficiaries. In addition, in 2013 and 2012, Vivendi granted stock purchase plans to its employees and retirees (employee stock purchase and leveraged plans).
The accounting methods applied to value and recognize these granted plans are described in Note 1.3.10. More specifically, the risk-free interest rate applied is the rate of French “Obligations Assimilables du Trésor” (OAT) with a maturity corresponding to the expected term of the instrument at the valuation date, and the expected dividend yield at grant date is based on Vivendi’s dividend distribution policy.
As a reminder, the volatility applied in valuing the stock option plans granted by Vivendi in 2012 was calculated as the weighted average of (a) 75% of the historical volatility of Vivendi shares computed on a 6.5-year period and (b) 25% of the implied volatility based on Vivendi put and call options traded on a liquid market with a maturity of 6 months or more.
Equity-settled instruments
The definitive grant of equity-settled instruments, excluding the 2012 bonus share plan, is subject to the satisfaction of performance conditions. Such performance conditions include an external indicator, thus following AFEP and MEDEF recommendations. The objectives underlying the performance conditions are determined by the Supervisory Board upon proposal by the Human Resources Committee.
The value of the equity-settled instruments is estimated and set at grant date. For the main 2013 and 2012 performance share, stock option and bonus share plans, the applied assumptions were as follows:
na: not applicable.
a. Vivendi granted 50 bonus shares to the employees of all the group’s French subsidiaries (see below).
(in millions of euros)Charge/(Income) Note 2013 2012
Stock options, performance shares and bonus shares 29 29Employee stock purchase plans 23 33Stock Appreciation Rights (SAR) 1 -
Vivendi stock instruments 22.2 53 62UMG equity unit plan 22.3 5 9Charge/(Income) related to share-based compensation plans 3 58 71
Equity-settled instruments 52 62Cash-settled instruments 6 9
Year ended December 31,
2013Grant date February 22, July 16, (a) April 17,Data at grant date:
Option strike price (in euros) (b) na na 13,63Share price (in euros) 14,91 15,75 12,53Expected volatility na na 27%Expected dividend yield 6,71% 6,35% 7,98%
Performance conditions achievement rate (c) 100% na 100%
2012

Tuesday, February 25, 2014
Financial Report and Audited Consolidated Financial Statements for the Year Ended December 31, 2013 Vivendi /103
b. In accordance with legal requirements, the number and strike price of stock options, as well as the number of performance shares in connection with outstanding plans, were adjusted to take into account the impact, for the beneficiaries of the following distributions (please refer to Note 19) by a withdrawal from reserves:
on May 9, 2012: grant to each shareowner of one bonus share per 30 shares held; and on May 17, 2013: dividend distribution with respect to fiscal year 2012.
These adjustments have no impact on share-based compensation expense related to the relevant stock option and performance share plans.
c. The objectives underlying the performance conditions are assessed on a two-year period. The definitive grant is effective upon the satisfaction of the following performance conditions:
internal indicators (70%): for corporate head office, group EBITA margin and for each subsidiary, its EBITA margin, as a function of the cumulative income from fiscal years 2013 and 2014 (compared to the EBITA margin in 2012 and 2013 for the whole group, including corporate head office and its subsidiaries related to plans granted in 2012); and
external indicators (30%): performance of Vivendi’s share price over two years, according to the Dow Jones Stoxx Telecom index (70%) and according to the Media index comprised of a pre-established panel (30%).
The definitive grant of stock options and performance shares of April 17, 2012 became effective as of December 31, 2013. The acquisition of these instruments is conditional upon active employment at the vesting date.
Performance share plans
Performance shares granted in 2013 and 2012 will vest at the end of a two-year period. The compensation cost is therefore recognized on a straight-line basis over the vesting period. Performance shares are available at the end of a four-year period from the date of grant. However, as the shares granted are ordinary shares of the same class as existing shares making up the share capital of Vivendi SA, employee shareholders are entitled to the dividends and voting rights attached to these shares from the end of the two-year vesting period. The recognized compensation cost corresponds to the value of the equity instruments received by the beneficiary, and is equal to the difference between the fair value of the shares to be received and the discounted value of dividends that were not received over the vesting period.
On February 22, 2013, 2,573 thousand performance shares were granted, compared to 1,818 thousand granted on April 17, 2012. After taking into account a discount for non-transferability of 8.3% of the share price on February 22, 2013 (7.1% on April 17, 2012), the fair value of each granted performance share was €11.79, compared to €9.80 per share on April 17, 2012 corresponding to a global fair value of €30 million (compared to €18 million in 2012).
Stock option plans
Stock options granted in 2012 will vest at the end of a three-year period and expire at the end of a ten-year period (with a 6.5 year expected term) and the compensation cost determined at grant date is recognized on a straight-line basis over the vesting period. In 2013, Vivendi did not grant any stock options. On April 17, 2012, 2,514 thousand stock options were granted. After taking into account a 2.35% risk-free interest rate, the fair value of each option granted was €0.96, corresponding to a global fair value of €2 million.
50 bonus share plan
On July 16, 2012, Vivendi granted a 50 bonus share plan per employee of all the group’s French subsidiaries. These shares will be issued at the end of a two-year period, i.e., July 17, 2014, subject to the employee being in active employment at this date and without any performance conditions. The compensation cost is therefore recognized on a straight-line basis over this period. The shares will only be available after another two-year period. However, as the shares granted are ordinary shares of the same class as existing shares making up the share capital of Vivendi SA, employee shareholders will be entitled to the dividend and voting rights relating to these shares from the end of the two year vesting period.
On July 16, 2012, 729 thousand bonus shares were granted. After taking into account a discount for non-transferability of 9.3% of the share price on July 16, 2012, the fair value of each granted bonus share was €12.40, a total of €9 million.
Employee stock purchase and leveraged plans
Vivendi also maintains share purchase plans (stock purchase and leveraged plans) that allow substantially all of its employees and retirees to purchase Vivendi shares through capital increases reserved to them. These shares, which are subject to certain sale or transfer restrictions, may be purchased by employees with a maximum discount of 20% on the average opening market price for Vivendi shares during the 20 trading days preceding the date of approval of the share capital increase by the Management Board (purchase date). The difference between the subscription price of the shares and the share price on the date of grant (corresponding to the subscription period closing date) represents the benefit granted to the beneficiaries. Furthermore, Vivendi applies a discount for non-transferability in respect of
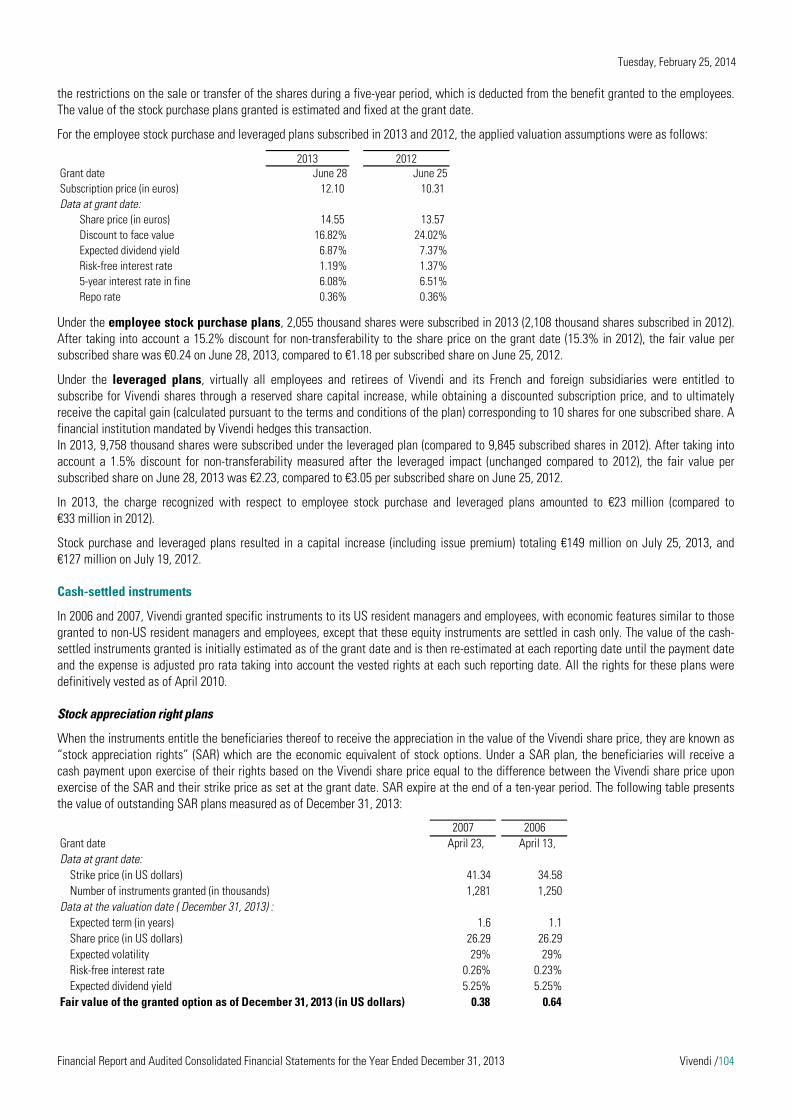
Tuesday, February 25, 2014
Financial Report and Audited Consolidated Financial Statements for the Year Ended December 31, 2013 Vivendi /104
the restrictions on the sale or transfer of the shares during a five-year period, which is deducted from the benefit granted to the employees. The value of the stock purchase plans granted is estimated and fixed at the grant date.
For the employee stock purchase and leveraged plans subscribed in 2013 and 2012, the applied valuation assumptions were as follows:
Under the employee stock purchase plans, 2,055 thousand shares were subscribed in 2013 (2,108 thousand shares subscribed in 2012). After taking into account a 15.2% discount for non-transferability to the share price on the grant date (15.3% in 2012), the fair value per subscribed share was €0.24 on June 28, 2013, compared to €1.18 per subscribed share on June 25, 2012.
Under the leveraged plans, virtually all employees and retirees of Vivendi and its French and foreign subsidiaries were entitled to subscribe for Vivendi shares through a reserved share capital increase, while obtaining a discounted subscription price, and to ultimately receive the capital gain (calculated pursuant to the terms and conditions of the plan) corresponding to 10 shares for one subscribed share. A financial institution mandated by Vivendi hedges this transaction. In 2013, 9,758 thousand shares were subscribed under the leveraged plan (compared to 9,845 subscribed shares in 2012). After taking into account a 1.5% discount for non-transferability measured after the leveraged impact (unchanged compared to 2012), the fair value per subscribed share on June 28, 2013 was €2.23, compared to €3.05 per subscribed share on June 25, 2012.
In 2013, the charge recognized with respect to employee stock purchase and leveraged plans amounted to €23 million (compared to €33 million in 2012).
Stock purchase and leveraged plans resulted in a capital increase (including issue premium) totaling €149 million on July 25, 2013, and €127 million on July 19, 2012.
Cash-settled instruments
In 2006 and 2007, Vivendi granted specific instruments to its US resident managers and employees, with economic features similar to those granted to non-US resident managers and employees, except that these equity instruments are settled in cash only. The value of the cash-settled instruments granted is initially estimated as of the grant date and is then re-estimated at each reporting date until the payment date and the expense is adjusted pro rata taking into account the vested rights at each such reporting date. All the rights for these plans were definitively vested as of April 2010.
Stock appreciation right plans
When the instruments entitle the beneficiaries thereof to receive the appreciation in the value of the Vivendi share price, they are known as “stock appreciation rights” (SAR) which are the economic equivalent of stock options. Under a SAR plan, the beneficiaries will receive a cash payment upon exercise of their rights based on the Vivendi share price equal to the difference between the Vivendi share price upon exercise of the SAR and their strike price as set at the grant date. SAR expire at the end of a ten-year period. The following table presents the value of outstanding SAR plans measured as of December 31, 2013:
2013 2012Grant date June 28 June 25Subscription price (in euros) 12.10 10.31Data at grant date:
Share price (in euros) 14.55 13.57Discount to face value 16.82% 24.02%Expected dividend yield 6.87% 7.37%Risk-free interest rate 1.19% 1.37%5-year interest rate in fine 6.08% 6.51%Repo rate 0.36% 0.36%
2007Grant date April 23, April 13,Data at grant date:
Strike price (in US dollars) 41.34 34.58Number of instruments granted (in thousands) 1,281 1,250
Data at the valuation date ( December 31, 2013) :Expected term (in years) 1.6 1.1Share price (in US dollars) 26.29 26.29Expected volatility 29% 29%Risk-free interest rate 0.26% 0.23%Expected dividend yield 5.25% 5.25%
Fair value of the granted option as of December 31, 2013 (in US dollars) 0.38 0.64
2006

Tuesday, February 25, 2014
Financial Report and Audited Consolidated Financial Statements for the Year Ended December 31, 2013 Vivendi /105
22.2.2 Information on outstanding Vivendi plans since January 1, 2012
Equity-settled instruments
na: not applicable.
a. The weighted average share price for Vivendi shares at the dates of exercise for the options was €16.21 (compared to €16.70 for stock options exercised in 2012).
b. The total intrinsic value of outstanding stock options was €64 million.
c. The weighted-average remaining period before issuing shares was 1.2 years.
Regarding the grant of 50 bonus shares in 2012, the remaining number of bonus shares was 663 thousand as of December 31, 2013 (697 thousand as of December 31, 2012). During 2013, 34 thousand shares were cancelled (32 thousand shares in 2012).
Please refer to Note 19 for the potential impact on the share capital of Vivendi SA of the outstanding stock options, the performance shares and bonus shares.
Information on stock options as of December 31, 2013 is as follows:
Cash-settled instruments
As of December 31, 2013, the remaining outstanding SAR amounted to 2,980 thousand (compared to 5,064 thousand as of December 31, 2012). Following the sale of Activision Blizzard on October 11, 2013, the payment obligations, incurred by Vivendi, with respect to the 1,925 thousand SAR have been transferred to Activision Blizzard. All rights related to SAR were vested and their total intrinsic value amounted to $2 million. As of December 31, 2013, the amount accrued for these instruments was €1 million (compared to €2 million as of December 31, 2012).
Performance shares
Number of outstanding stock options
Weighted average strike price of outstanding stock
options
Number of outstanding performance shares
(in thousands) (in euros) (in thousands)
Balance as of December 31, 2011 49,907 21.5 2,961Granted 2,650 13.7 1,918Exercised (479) 13.0 (981)Cancelled (411) 18.4 (138)Adjusted 1,739 20.4 124
Balance as of December 31, 2012 53,406 20.5 3,884Granted - na 2,782Exercised (3,362) (a) 13.3 (1,409)Forfeited (354) 12.9 -Cancelled (194) 15.9 (199)Adjusted 3,339 19.4 286
Balance as of December 31, 2013 52,835 (b) 19.7 5,344 (c)Exercisable as of December 31, 2013 47,393 20.2 -Acquired as of December 31, 2013 47,411 20.2 518
Stock options
Range of strike prices NumberWeighted average
strike price
Weighted average remaining
contractual lifeNumber
Weighted average strike price
(in thousands) (in euros) (in years) (in thousands) (in euros)
Under €15 2,792 12.5 8.3 8 12.4€15-€17 12,363 16.8 5.7 12,363 16.8€17-€19 10,787 17.6 2.1 8,147 17.5€19-€21 7,868 20.0 1.3 7,868 20.0€21-€23 6,699 21.3 4.3 6,699 21.3€23-€25 6,099 24.1 2.3 6,099 24.1€25-€27 6,227 26.1 3.3 6,227 26.1€27 and more - - - - -
52,835 19.7 3.6 47,411 20.2
Outstanding stock options Vested stock options

Tuesday, February 25, 2014
Financial Report and Audited Consolidated Financial Statements for the Year Ended December 31, 2013 Vivendi /106
22.3 UMG long-term incentive plan
Effective January 1, 2010, UMG implemented long-term incentive arrangements under which certain key executives of UMG are awarded phantom equity units and phantom stock appreciation rights whose value is intended to reflect the value of UMG. These units are simply units of account and do not represent an actual ownership interest in either UMG or Vivendi. The equity units are notional grants of equity that will be payable in cash upon settlement no later than 2015 or earlier under certain circumstances. The stock appreciation rights are essentially options on those notional shares that provide additional compensation tied to any increase in value of UMG over the term. The SAR’s are also settled in cash only no later than 2014 or earlier under certain circumstances. There is a guaranteed minimum payout of $25 million.
Payouts under the plan generally coincide with terms of employment, but can be accelerated or reduced under certain circumstances. The values for both payouts are based upon third party valuations. While the participants’ rights vest at the end of a fixed vesting period, compensation expense is recognized over the vesting period as services are rendered. At each closing date, the expense is recognized based on the portion of the vesting period that has elapsed and the fair value of the units calculated using an appropriate grant date model in accordance with IFRS 2.
As of December 31, 2013, the amount accrued under these arrangements was €26 million (€22 million as of December 31, 2012). There have been no payments made to date.
Note 23 Borrowings and other financial liabilities
23.1 Bonds
Note December 31, 2013 December 31, 2012(in millions of euros) Total Long-term Short-term Total Long-term Short-term
Bonds 23.1 7,827 6,633 1,194 10,888 10,188 700Bank credit facilities (drawn confirmed) 23.2 2,075 2,014 61 2,423 2,326 97Commercial paper issued 23.2 1,906 - 1,906 3,255 - 3,255Bank overdrafts 143 - 143 192 - 192Other bank borrowings - - - 625 34 591Accrued interest to be paid 186 - 186 205 - 205Other 73 53 20 126 86 40
Nominal value of borrowings 12,210 8,700 3,510 17,714 12,634 5,080Cumulative effect of amortized cost and reevaluation due to hedge accounting 8 8 - (1) 4 (5)Commitments to purchase non-controlling interests 22 22 - 8 8 -Derivative financial instruments 24 26 7 19 36 21 15
Borrowings and other financial liabilities 12,266 8,737 3,529 17,757 12,667 5,090
Maturing during the following periods
(in millions of euros)
€750 million (July 2013) 2.375% 2.51% Jan-19 750 (a) - - - - - 750 -€700 million (December 2012) 2.500% 2.65% Jan-20 700 - - - - - 700 700$550 million (April 2012) 2.400% 2.50% Apr-15 - (b) - - - - - - 420$650 million (April 2012) 3.450% 3.56% Jan-18 69 (c) - - - - 69 - 491$800 million (April 2012) 4.750% 4.91% Apr-22 189 (c) - - - - - 189 604€1,250 million (January 2012) 4.125% 4.31% Jul-17 1,250 - - - 1,250 - - 1,250€500 million (November 2011) 3.875% 4.04% Nov-15 - (d) - - - - - - 500€500 million (November 2011) 4.875% 5.00% Nov-18 500 - - - - 500 - 500€1,000 million (July 2011) 3.500% 3.68% Jul-15 - (d) - - - - - - 1,000€1,050 million (July 2011) 4.750% 4.67% Jul-21 1,050 - - - - - 1,050 1,050€750 million (March 2010) 4.000% 4.15% Mar-17 750 - - - 750 - - 750€700 million (December 2009) 4.875% 4.95% Dec-19 700 - - - - - 700 700€500 million (December 2009) 4.250% 4.39% Dec-16 500 - - 500 - - - 500€300 million - SFR (July 2009) 5.000% 5.05% Jul-14 300 300 - - - - - 300€1,120 million (January 2009) 7.750% 7.69% Jan-14 894 (a) 894 - - - - - 894$700 million (April 2008) 6.625% 6.85% Apr-18 175 (c) - - - - 175 - 529€700 million (October 2006) 4.500% 5.47% Oct-13 - (e) - - - - - - 700
Nominal value of bonds 7,827 1,194 - 500 2,000 744 3,389 10,888
2016 2017 2018
December31,
2012After2018
MaturityDecember
31,2013 2014 2015
nominal effective
Interest rate (%)

Tuesday, February 25, 2014
Financial Report and Audited Consolidated Financial Statements for the Year Ended December 31, 2013 Vivendi /107
a. On July 9, 2013, Vivendi issued a €750 million bond, maturing in January 2019. This transaction enabled the refinancing of the bond issued in January 2009, maturing in January 2014.
b. A USD/EUR foreign currency hedge (cross-currency swap) was set up to hedge this tranche denominated in US dollar with a 1.3082 EUR/USD rate, or a €420 million counter value at maturity. On November 15, 2013, Vivendi exercised the full make-whole call and early redeemed this bond.
c. On October 25, 2013, Vivendi early redeemed $1,555 million (€1,150 million) in bonds, through tender offers: - $555 million (€411 million) on the $650 million bond issued in April 2012, initially maturing in January 2018; - $541 million (€400 million) on the $800 million bond issued in April 2012, initially maturing in April 2022; and - $459 million (€339 million) on the $700 million bond issued in April 2008, initially maturing in April 2018.
d. On November 11, 2013, Vivendi early redeemed (make-whole) the full amount of these two bonds.
e. This bond was redeemed in October 2013 upon its contractual maturity date.
The bonds denominated in euro are listed on the Luxembourg Stock Exchange.
The bonds denominated in US dollar were converted into euro based on the closing rate, i.e., 1.3730 EUR/USD as of December 31, 2013 (compared to 1.3244 EUR/USD as of December 31, 2012).
Bonds issued by the group contain customary provisions related to events of default, negative pledge and, rights of payment (pari-passu ranking). In addition, bonds issued by Vivendi SA contain an early redemption clause in case of a change in control trigger if, as a result of any such event, the long-term rating of Vivendi SA is downgraded below investment grade status (Baa3/BBB-).
23.2 Bank credit facilities
a. On March 28, 2013, Vivendi completed the early refinancing of a €1.5 billion bank credit facility maturing in May 2014 by entering into a new bank credit facility for the same amount with a five-year maturity.
b. The €1.2 billion revolving facility of SFR was cancelled in October 2013.
c. The commercial paper is backed to confirmed bank credit facilities. It is recorded as short-term borrowing on the Consolidated Statement of Financial Position. On February 20, 2013, Vivendi increased the maximum amount authorized by the Banque de France regarding Vivendi SA’s commercial paper program from €4 to €5 billion.
Vivendi SA bank credit facilities, when drawn, bear interest at floating rates.
Vivendi SA’s syndicated bank credit facilities (€7.1 billion as of December 31, 2013) contain customary provisions related to events of default and covenants relating to negative pledge, divestiture and merger transactions. In addition, at the end of each half year, Vivendi SA is required to comply with a financial covenant of Proportionate Financial Net Debt1 to Proportionate EBITDA2 over a twelve-month rolling period not exceeding 3 for the duration of the loans. Non-compliance with this covenant could result in the early redemption of the facilities if they were drawn, or their cancellation. As of December 31, 2013, Vivendi SA was in compliance with these financial covenants.
1 As of December 31, 2013, defined as Vivendi’s Financial Net Debt adjusted for expected proceeds (according to the financial terms known to date) from the sale of Maroc Telecom group. 2 As of December 31, 2013, defined as Vivendi’s modified EBITDA as published at that date (please refer to Note 3), plus dividends received from unconsolidated companies.
Maturing during the following periods
(in million of euros)
€1.5 billion revolving facility (March 2013) Mar-18 1,500 (a) 205 - - - - 205 - -€1.5 billion revolving facility (May 2012) May-17 1,500 - - - - - - - -€1.1 billion revolving facility (January 2012) Jan-17 1,100 - - - - - - - -€40 million revolving facility (January 2012) Jan-15 40 - - - - - - - -€5.0 billion revolving facility (May 2011)
tranche B: €1.5 billion - - (a) - - - - - - - 725tranche C: €2.0 billion May-16 2,000 975 - - 975 - - - 819
€1.0 billion revolving facility (September 2010) Sep-15 1,000 475 - 475 - - - - 350€1.2 billion revolving facility - SFR (June 2010) - - (b) - - - - - - - -
GVT - BNDES - 452 391 43 77 77 60 51 83 406Maroc Telecom - MAD 3 billion loan Jul-14 - - - - - - - - 94Canal+ Group - VSTV - 37 29 18 11 - - - - 29
Drawn confirmed bank credit facilities 2,075 61 563 1,052 60 256 83 2,423
Undrawn confirmed bank credit facilities 5,554 11 575 1,035 2,611 1,306 16 6,616
Total of group's bank credit facilities 7,629 72 1,138 2,087 2,671 1,562 99 9,039
Commercial paper issued (c) 1,906 1,906 3,255
MaturityMaximumamount
December31,
2013
December31,
20122014 2015 2016 2017 2018After2018
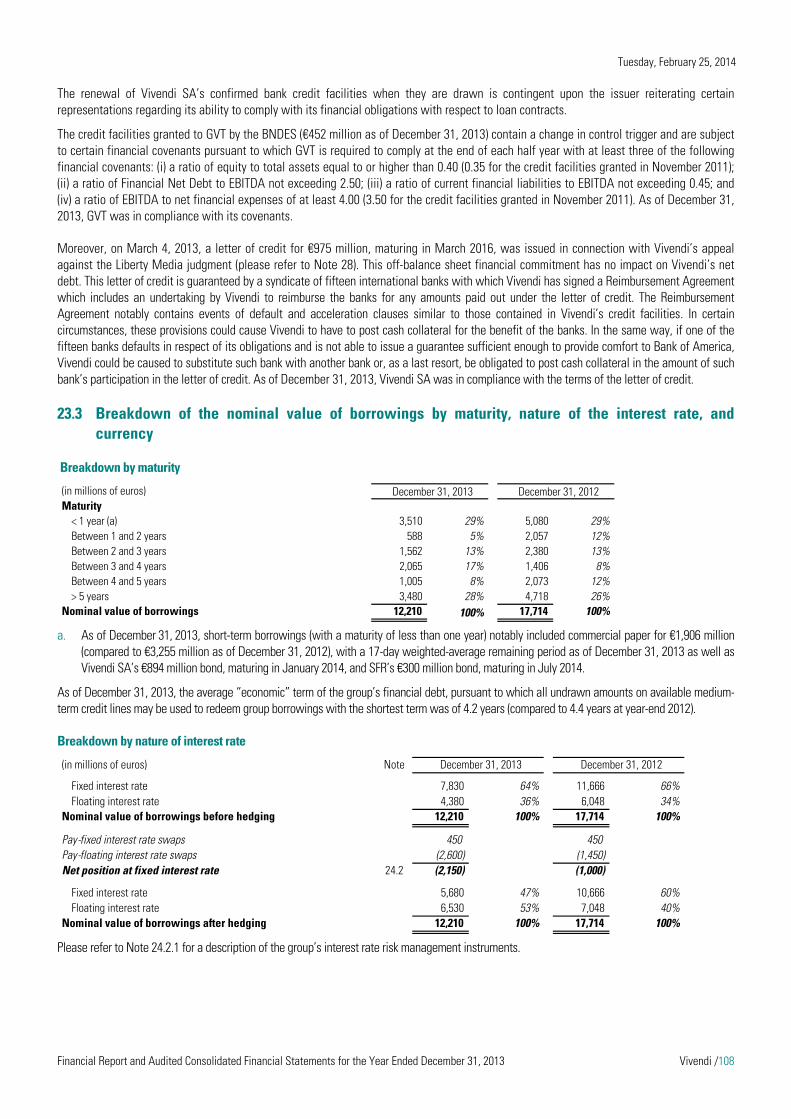
Tuesday, February 25, 2014
Financial Report and Audited Consolidated Financial Statements for the Year Ended December 31, 2013 Vivendi /108
The renewal of Vivendi SA’s confirmed bank credit facilities when they are drawn is contingent upon the issuer reiterating certain representations regarding its ability to comply with its financial obligations with respect to loan contracts.
The credit facilities granted to GVT by the BNDES (€452 million as of December 31, 2013) contain a change in control trigger and are subject to certain financial covenants pursuant to which GVT is required to comply at the end of each half year with at least three of the following financial covenants: (i) a ratio of equity to total assets equal to or higher than 0.40 (0.35 for the credit facilities granted in November 2011); (ii) a ratio of Financial Net Debt to EBITDA not exceeding 2.50; (iii) a ratio of current financial liabilities to EBITDA not exceeding 0.45; and (iv) a ratio of EBITDA to net financial expenses of at least 4.00 (3.50 for the credit facilities granted in November 2011). As of December 31, 2013, GVT was in compliance with its covenants.
Moreover, on March 4, 2013, a letter of credit for €975 million, maturing in March 2016, was issued in connection with Vivendi’s appeal against the Liberty Media judgment (please refer to Note 28). This off-balance sheet financial commitment has no impact on Vivendi’s net debt. This letter of credit is guaranteed by a syndicate of fifteen international banks with which Vivendi has signed a Reimbursement Agreement which includes an undertaking by Vivendi to reimburse the banks for any amounts paid out under the letter of credit. The Reimbursement Agreement notably contains events of default and acceleration clauses similar to those contained in Vivendi’s credit facilities. In certain circumstances, these provisions could cause Vivendi to have to post cash collateral for the benefit of the banks. In the same way, if one of the fifteen banks defaults in respect of its obligations and is not able to issue a guarantee sufficient enough to provide comfort to Bank of America, Vivendi could be caused to substitute such bank with another bank or, as a last resort, be obligated to post cash collateral in the amount of such bank’s participation in the letter of credit. As of December 31, 2013, Vivendi SA was in compliance with the terms of the letter of credit.
23.3 Breakdown of the nominal value of borrowings by maturity, nature of the interest rate, and currency
Breakdown by maturity
a. As of December 31, 2013, short-term borrowings (with a maturity of less than one year) notably included commercial paper for €1,906 million (compared to €3,255 million as of December 31, 2012), with a 17-day weighted-average remaining period as of December 31, 2013 as well as Vivendi SA’s €894 million bond, maturing in January 2014, and SFR’s €300 million bond, maturing in July 2014.
As of December 31, 2013, the average “economic” term of the group’s financial debt, pursuant to which all undrawn amounts on available medium-term credit lines may be used to redeem group borrowings with the shortest term was of 4.2 years (compared to 4.4 years at year-end 2012).
Breakdown by nature of interest rate
Please refer to Note 24.2.1 for a description of the group’s interest rate risk management instruments.
(in millions of euros) December 31, 2013 December 31, 2012Maturity
< 1 year (a) 3,510 29% 5,080 29%Between 1 and 2 years 588 5% 2,057 12%Between 2 and 3 years 1,562 13% 2,380 13%Between 3 and 4 years 2,065 17% 1,406 8%Between 4 and 5 years 1,005 8% 2,073 12%> 5 years 3,480 28% 4,718 26%
Nominal value of borrowings 12,210 100% 17,714 100%
(in millions of euros) Note
Fixed interest rate 7,830 64% 11,666 66%Floating interest rate 4,380 36% 6,048 34%
Nominal value of borrowings before hedging 12,210 100% 17,714 100%
Pay-fixed interest rate swaps 450 450Pay-floating interest rate swaps (2,600) (1,450)Net position at fixed interest rate 24.2 (2,150) (1,000)
Fixed interest rate 5,680 47% 10,666 60%Floating interest rate 6,530 53% 7,048 40%
Nominal value of borrowings after hedging 12,210 100% 17,714 100%
December 31, 2013 December 31, 2012
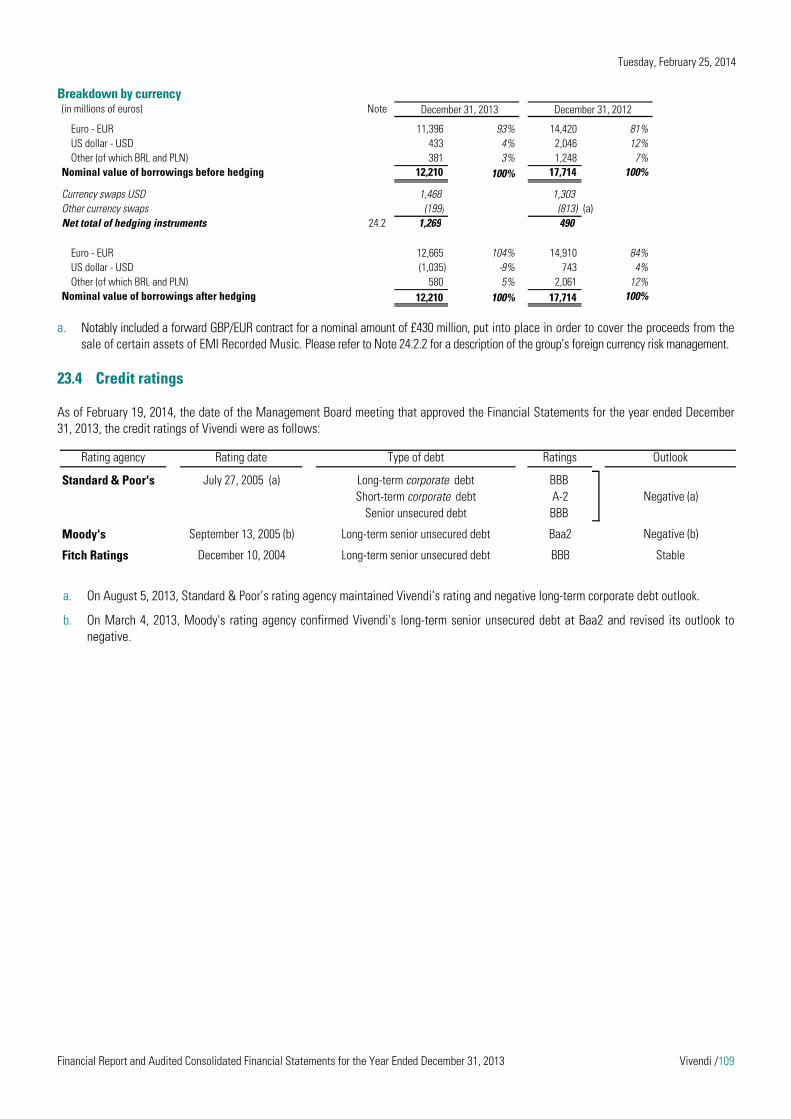
Tuesday, February 25, 2014
Financial Report and Audited Consolidated Financial Statements for the Year Ended December 31, 2013 Vivendi /109
Breakdown by currency
a. Notably included a forward GBP/EUR contract for a nominal amount of £430 million, put into place in order to cover the proceeds from the sale of certain assets of EMI Recorded Music. Please refer to Note 24.2.2 for a description of the group’s foreign currency risk management.
23.4 Credit ratings
As of February 19, 2014, the date of the Management Board meeting that approved the Financial Statements for the year ended December 31, 2013, the credit ratings of Vivendi were as follows:
a. On August 5, 2013, Standard & Poor’s rating agency maintained Vivendi’s rating and negative long-term corporate debt outlook.
b. On March 4, 2013, Moody's rating agency confirmed Vivendi's long-term senior unsecured debt at Baa2 and revised its outlook to negative.
(in millions of euros) Note December 31, 2013 December 31, 2012
Euro - EUR 11,396 93% 14,420 81%US dollar - USD 433 4% 2,046 12%Other (of which BRL and PLN) 381 3% 1,248 7%
Nominal value of borrowings before hedging 12,210 100% 17,714 100%
Currency swaps USD 1,468 1,303Other currency swaps (199) (813) (a)Net total of hedging instruments 24.2 1,269 490
Euro - EUR 12,665 104% 14,910 84%US dollar - USD (1,035) -9% 743 4%Other (of which BRL and PLN) 580 5% 2,061 12%
Nominal value of borrowings after hedging 12,210 100% 17,714 100%
Rating agency Rating date Type of debt Ratings Outlook
Standard & Poor's July 27, 2005 (a) Long-term corporate debt BBB Short-term corporate debt A-2 Negative (a)
Senior unsecured debt BBB
Moody's September 13, 2005 (b) Long-term senior unsecured debt Baa2 Negative (b)
Fitch Ratings December 10, 2004 Long-term senior unsecured debt BBB Stable

Tuesday, February 25, 2014
Financial Report and Audited Consolidated Financial Statements for the Year Ended December 31, 2013 Vivendi /110
Note 24 Financial instruments and management of financial risks
24.1 Fair value of financial instruments
Financial instruments classified as liabilities under Vivendi’s Statement of Financial Position include bonds and bank credit facilities, other financial liabilities (including commitments to purchase non-controlling interests), as well as trade accounts payable and other non-current liabilities. As assets under Vivendi’s Statement of Financial Position, they include financial assets measured at fair value and at historical cost, trade accounts receivable and other, as well as cash and cash equivalents. In addition, financial instruments include derivative instruments (assets or liabilities) and assets available for sale.
Accounting category and fair value of financial instruments
a. Vivendi applied from January 1, 2013, with retrospective effect from January 1, 2012, amended IAS 19 (Employee Benefits), whose application is mandatory in the European Union beginning on or after January 1, 2013 (please refer to Note 1). As a result, the 2012 Financial Statements were adjusted in accordance with the new standard (please refer to Note 33).
The carrying value of trade accounts receivable and other, cash and cash equivalents, and trade accounts payable is a reasonable approximation of fair value, due to the short maturity of these instruments.
Valuation method for financial instruments at fair value
The following tables show the fair value method of financial instruments according to the three following levels: - Level 1: fair value measurement based on quoted prices in active markets for identical assets or liabilities; - Level 2: fair value measurement based on observable market data (other than quoted prices included within Level 1); and - Level 3: fair value measurement based on valuation techniques that use inputs for the asset or liability that are not based on
observable market data.
As a reminder, the other financial instruments at amortized cost are not included in the following tables.
December 31, 2013 December 31, 2012 (a)
(in millions of euros) Note
AssetsCash management financial assets - - 301 301Available-for-sale securities 360 360 197 197Derivative financial instruments 126 126 137 137Other financial assets at fair value through profit or loss 5 5 15 15Financial assets at amortized cost 208 208 202 202
Financial assets 16 699 699 852 852Trade accounts receivable and other, at amortized cost 17 4,898 4,898 6,587 6,587Cash and cash equivalents 18 1,041 1,041 3,894 3,894
LiabilitiesBorrowings, at amortized cost 12,218 12,721 17,713 18,637Derivative financial instruments 26 26 36 36Commitments to purchase non-controlling interests 22 22 8 8
Borrowings and other financial liabilities 23 12,266 12,769 17,757 18,681Other non-current liabilities, at amortized cost 17 757 757 1,002 1,002Trade accounts payable and other, at amortized cost 17 10,416 10,416 14,196 14,196
Fair valueCarrying value
Fair value Carrying value

Tuesday, February 25, 2014
Financial Report and Audited Consolidated Financial Statements for the Year Ended December 31, 2013 Vivendi /111
Available-for-sale securities valued at their level 2 fair value included securities held by UMG in Beats and Spotify for €161 million and €143 million, respectively (€70 million and €84 million as of December 31, 2012). In 2013, the fair value of these securities was reassessed following the entry of new investors to their capital.
In 2013 and 2012, there was no transfer of financial instruments measured at fair value between level 1 and level 2. In addition, as of December 31, 2013 and December 31, 2012, financial instruments measured at level 3 fair value did not include any significant amount.
24.2 Management of financial risks and derivative financial instruments
As part of its business, Vivendi is exposed to several types of financial risks: market risk, credit (or counterparty) risk, as well as liquidity risk. Market risks are defined as the risks of fluctuation in future cash flows of financial instruments (receivables and payables, as described in Note 24.1 above) that depend on the changes in financial markets. For Vivendi, market risks may therefore primarily impact interest rates and foreign currency exchange positions, in the absence of significant investments in the markets for stocks and bonds. Vivendi’s Financing and Treasury Department centrally manages significant market risks, as well as its liquidity risk within the group, reporting directly to Vivendi’s Chief Financial Officer. The Department has the necessary expertise, resources (notably technical resources), and information systems for this purpose. However, the Maroc Telecom group’s cash and exposure to financial risks was managed independently. The Treasury Committee monitors the liquidity positions in all business units and the exposure to interest rate risk and foreign currency exchange rate risk on a bi-monthly basis. Short- and long-term financing activities are mainly performed at the group’s headquarters and are subject to the prior approval of the Management Board and Supervisory Board, in accordance with the Vivendi Internal Regulations. However, in terms of optimizing financing operations within the group's debt management framework within the limits already approved by the Supervisory Board, a simple notification is required.
Vivendi uses various derivative financial instruments to manage and reduce its exposure to fluctuations in interest rates and foreign currency exchange rates. All instruments are either listed on organized markets or traded over-the-counter with highly-rated counterparties. All derivative financial instruments are used for hedging purposes and speculative hedging is forbidden.
December 31, 2013(in millions of euros) Note Total Level 1 Level 2 Level 3
AssetsAvailable-for-sale securities 16 360 - 304 56Derivative financial instruments 24.2 126 - 126 -Other financial assets at fair value through profit or loss 5 5 - -
Cash and cash equivalents 18 1,041 1,041 - -
LiabilitiesCommitments to purchase non-controlling interests 22 - - 22Derivative financial instruments 24.2 26 - 26 -
December 31, 2012(in millions of euros) Note Total Level 1 Level 2 Level 3
AssetsCash management financial assets 16 301 301 - -Available-for-sale securities 16 197 - 154 43Derivative financial instruments 24.2 137 - 137 -Other financial assets at fair value through profit or loss 15 9 - 6
Cash and cash equivalents 18 3,894 3,894 - -
LiabilitiesCommitments to purchase non-controlling interests 8 - - 8Derivative financial instruments 24.2 36 - 36 -
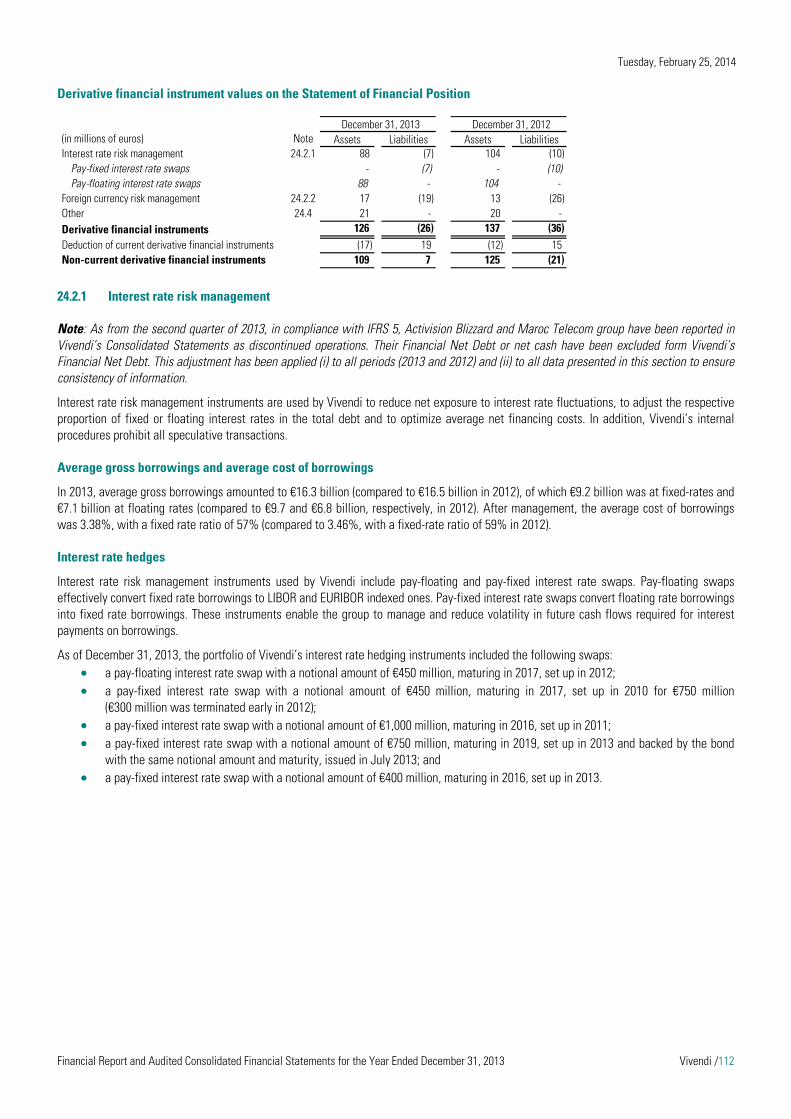
Tuesday, February 25, 2014
Financial Report and Audited Consolidated Financial Statements for the Year Ended December 31, 2013 Vivendi /112
Derivative financial instrument values on the Statement of Financial Position
24.2.1 Interest rate risk management
Note: As from the second quarter of 2013, in compliance with IFRS 5, Activision Blizzard and Maroc Telecom group have been reported in Vivendi’s Consolidated Statements as discontinued operations. Their Financial Net Debt or net cash have been excluded form Vivendi’s Financial Net Debt. This adjustment has been applied (i) to all periods (2013 and 2012) and (ii) to all data presented in this section to ensure consistency of information.
Interest rate risk management instruments are used by Vivendi to reduce net exposure to interest rate fluctuations, to adjust the respective proportion of fixed or floating interest rates in the total debt and to optimize average net financing costs. In addition, Vivendi’s internal procedures prohibit all speculative transactions.
Average gross borrowings and average cost of borrowings
In 2013, average gross borrowings amounted to €16.3 billion (compared to €16.5 billion in 2012), of which €9.2 billion was at fixed-rates and €7.1 billion at floating rates (compared to €9.7 and €6.8 billion, respectively, in 2012). After management, the average cost of borrowings was 3.38%, with a fixed rate ratio of 57% (compared to 3.46%, with a fixed-rate ratio of 59% in 2012).
Interest rate hedges
Interest rate risk management instruments used by Vivendi include pay-floating and pay-fixed interest rate swaps. Pay-floating swaps effectively convert fixed rate borrowings to LIBOR and EURIBOR indexed ones. Pay-fixed interest rate swaps convert floating rate borrowings into fixed rate borrowings. These instruments enable the group to manage and reduce volatility in future cash flows required for interest payments on borrowings.
As of December 31, 2013, the portfolio of Vivendi’s interest rate hedging instruments included the following swaps: a pay-floating interest rate swap with a notional amount of €450 million, maturing in 2017, set up in 2012; a pay-fixed interest rate swap with a notional amount of €450 million, maturing in 2017, set up in 2010 for €750 million
(€300 million was terminated early in 2012); a pay-fixed interest rate swap with a notional amount of €1,000 million, maturing in 2016, set up in 2011; a pay-fixed interest rate swap with a notional amount of €750 million, maturing in 2019, set up in 2013 and backed by the bond
with the same notional amount and maturity, issued in July 2013; and a pay-fixed interest rate swap with a notional amount of €400 million, maturing in 2016, set up in 2013.
December 31, 2013 December 31, 2012(in millions of euros) Note Assets Liabilities Assets LiabilitiesInterest rate risk management 24.2.1 88 (7) 104 (10)
Pay-fixed interest rate swaps - (7) - (10)Pay-floating interest rate swaps 88 - 104 -
Foreign currency risk management 24.2.2 17 (19) 13 (26)Other 24.4 21 - 20 -Derivative financial instruments 126 (26) 137 (36)Deduction of current derivative financial instruments (17) 19 (12) 15Non-current derivative financial instruments 109 7 125 (21)
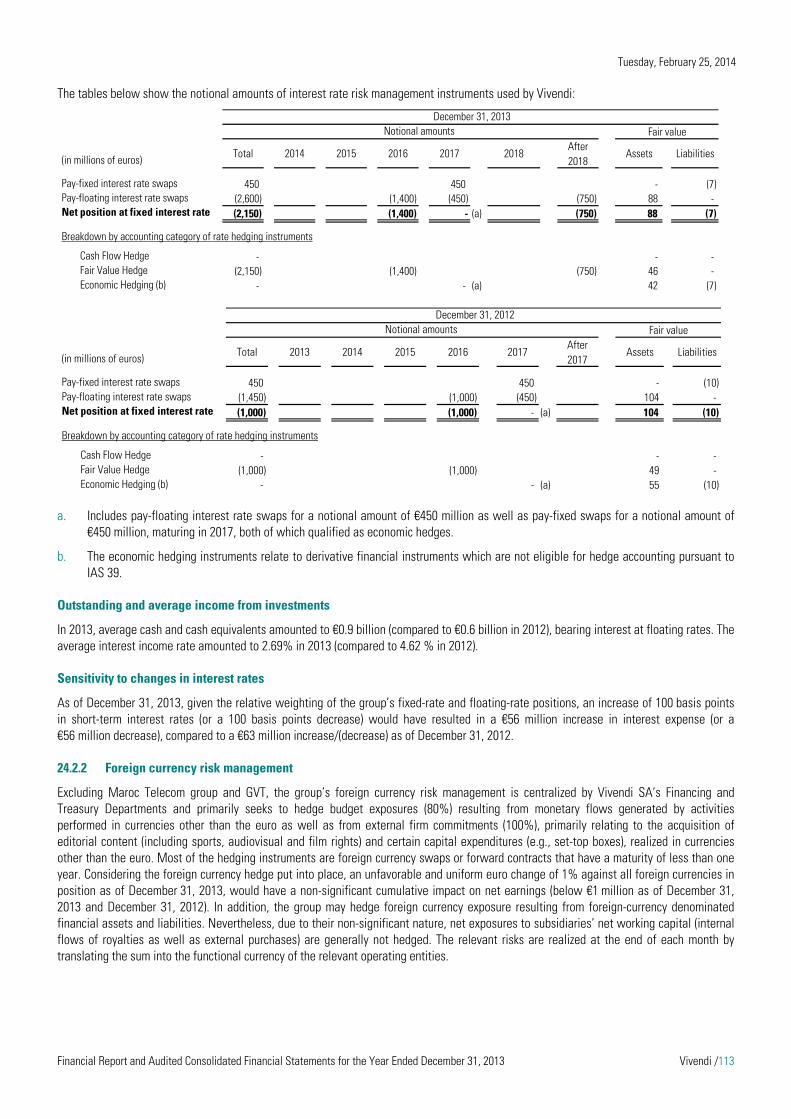
Tuesday, February 25, 2014
Financial Report and Audited Consolidated Financial Statements for the Year Ended December 31, 2013 Vivendi /113
The tables below show the notional amounts of interest rate risk management instruments used by Vivendi:
a. Includes pay-floating interest rate swaps for a notional amount of €450 million as well as pay-fixed swaps for a notional amount of €450 million, maturing in 2017, both of which qualified as economic hedges.
b. The economic hedging instruments relate to derivative financial instruments which are not eligible for hedge accounting pursuant to IAS 39.
Outstanding and average income from investments
In 2013, average cash and cash equivalents amounted to €0.9 billion (compared to €0.6 billion in 2012), bearing interest at floating rates. The average interest income rate amounted to 2.69% in 2013 (compared to 4.62 % in 2012).
Sensitivity to changes in interest rates
As of December 31, 2013, given the relative weighting of the group’s fixed-rate and floating-rate positions, an increase of 100 basis points in short-term interest rates (or a 100 basis points decrease) would have resulted in a €56 million increase in interest expense (or a €56 million decrease), compared to a €63 million increase/(decrease) as of December 31, 2012.
24.2.2 Foreign currency risk management
Excluding Maroc Telecom group and GVT, the group’s foreign currency risk management is centralized by Vivendi SA’s Financing and Treasury Departments and primarily seeks to hedge budget exposures (80%) resulting from monetary flows generated by activities performed in currencies other than the euro as well as from external firm commitments (100%), primarily relating to the acquisition of editorial content (including sports, audiovisual and film rights) and certain capital expenditures (e.g., set-top boxes), realized in currencies other than the euro. Most of the hedging instruments are foreign currency swaps or forward contracts that have a maturity of less than one year. Considering the foreign currency hedge put into place, an unfavorable and uniform euro change of 1% against all foreign currencies in position as of December 31, 2013, would have a non-significant cumulative impact on net earnings (below €1 million as of December 31, 2013 and December 31, 2012). In addition, the group may hedge foreign currency exposure resulting from foreign-currency denominated financial assets and liabilities. Nevertheless, due to their non-significant nature, net exposures to subsidiaries’ net working capital (internal flows of royalties as well as external purchases) are generally not hedged. The relevant risks are realized at the end of each month by translating the sum into the functional currency of the relevant operating entities.
Notional amounts Fair value
(in millions of euros) Total 2014 2015 2016 2017 2018After 2018
Assets Liabilities
Pay-fixed interest rate swaps 450 - - - 450 - - - (7)Pay-floating interest rate swaps (2,600) - (1,400) (450) (750) 88 -Net position at fixed interest rate (2,150) (1,400) - (a) - (750) 88 (7)
Breakdown by accounting category of rate hedging instruments
Cash Flow Hedge - - -Fair Value Hedge (2,150) (1,400) (750) 46 -Economic Hedging (b) - - (a) - 42 (7)
December 31, 2013
Notional amounts Fair value
(in millions of euros) Total 2013 2014 2015 2016 2017After 2017
Assets Liabilities
Pay-fixed interest rate swaps 450 450 - (10)Pay-floating interest rate swaps (1,450) ####### (1,000) (450) 104 -Net position at fixed interest rate (1,000) ####### (1,000) - (a) - 104 (10)
Breakdown by accounting category of rate hedging instruments
Cash Flow Hedge - - -Fair Value Hedge (1,000) (1,000) 49 -Economic Hedging (b) - - (a) 55 (10)
December 31, 2012

Tuesday, February 25, 2014
Financial Report and Audited Consolidated Financial Statements for the Year Ended December 31, 2013 Vivendi /114
The principal currencies hedged by the group are the US dollar (USD) and the British pound (GBP).
In particular, in 2012 and 2013, Vivendi converted into euros following US dollar transactions: ‐ the $550 million bond issued in April 2012, by setting up a USD-EUR foreign currency hedge (cross-currency swap) with a
1.3082 EUR/USD rate, or a €420 million counter value. From an accounting perspective, these USD purchases were considered as cash flow hedges. This hedge was unwound on November 15, 2013 with the early redemption of this bond;
‐ partial hedge of the income from the sale of 88% of Vivendi’s interest in Activision Blizzard through the purchase of a contingent forward contract, conditional on the effective sale for a notional amount of $2 billion, with a 1.3368 EUR/USD rate, or a counter value of €1,496 million. This hedge, considered as a cash flow hedge from an accounting perspective, was unwound on October 11, 2013 at the finalization of the sale, generating a realized foreign exchange gain of €23 million.
In 2012 and 2013, as part of the acquisition of EMI Recorded Music (please refer to Note 2.3), Vivendi hedged the GBP foreign exchange risk as follows: ‐ partial hedge of the acquisition price through forward purchase contracts denominated in GBP for a notional amount of
£600 million, with a 0.8144 EUR/GBP rate. From an accounting perspective, these GBP purchases were considered as cash flow hedges. On October 1, 2012, this hedge was unwound for €737 million at the completion of the acquisition, generating a realized foreign exchange gain of €19 million;
‐ partial hedge of the income from the sale of certain EMI Recorded Music assets, in accordance with commitments made by Vivendi to the European Commission, through forward sale contracts denominated in GBP for a notional amount of £530 million, with an average rate of 0.8060 EUR/GBP. From an accounting perspective, these GBP sales were considered as net investment hedges. This hedge was unwound for a counter value of €658 million, at the completion of the sale of Parlophone Label Group and other labels, generating a realized foreign exchange gain of €39 million.
Moreover, in 2013, to hedge against a possible depreciation of its net investment in certain subsidiaries in the United Kingdom due to an unfavorable change in GBP, Vivendi set up a hedge using put option instruments for a notional amount £692 million, or €823 million. From an accounting perspective, these hedge instruments were considered as net investment hedges.
Finally, the intercompany loan granted by Vivendi to GVT under market terms for a total amount of €1,000 million as of December 31, 2013 (fully drawn as of that date) was not subject to any foreign currency hedging in GVT’s Statement of Financial Position: foreign exchange losses incurred amounted to €186 million in 2013 and to €76 million in 2012. In January 2014, the amount of this loan was increased to €1,126 million. This intercompany loan is mainly aimed at financing the increase in GVT’s capital expenditures program related to the geographic expansion of its telecommunication network.

Tuesday, February 25, 2014
Financial Report and Audited Consolidated Financial Statements for the Year Ended December 31, 2013 Vivendi /115
The following tables present the notional amount of foreign currency risk management instruments used by the group; the positive amounts relate to currencies to be received, the negative amounts relate to currencies to be delivered:
a. Relates to the hedge of the net investment in certain subsidiaries in the United Kingdom for a notional amount of GBP 692 million.
December 31, 2013Notional amounts Fair value
(in millions of euros) Total USD PLN GBP Other Assets Liabilities
Sales against the euro (1,060) (49) (105) (834) (72) 2 (10)Purchases against the euro 2,329 1,330 21 888 90 11 (7)Other - 187 (81) (4) (102) 4 (2)
1,269 1,468 (165) 50 (84) 17 (19)
Breakdown by accounting category of foreign currency hedging instruments
Cash Flow HedgeSales against the euro (73) (11) (42) (7) (13) - -Purchases against the euro 85 85 - - - 1 (1)Other - 168 (75) - (93) 4 (2)
12 242 (117) (7) (106) 5 (3)Fair Value Hedge
Sales against the euro (93) (38) (51) (4) - 1 (2)Purchases against the euro 450 432 - 18 - - (6)Other - 8 (6) (4) 2 - -
357 402 (57) 10 2 1 (8)Net Investment Hedge
Sales against the euro (823) - - (823) (a) - - (8)Purchases against the euro - - - - - - -Other - - - - - - -
(823) - - (823) - - (8)Economic Hedging (b)
Sales against the euro (71) - (12) - (59) 1 -Purchases against the euro 1,794 813 21 870 90 10 -Other - 11 - - (11) - -
1,723 824 9 870 20 11 -
December 31, 2012Notional amounts Fair value
(in millions of euros) Total USD PLN GBP Other Assets Liabilities
Sales against the euro (931) (59) (162) (586) (124) 12 (3)Purchases against the euro 1,421 1,257 37 15 112 1 (20)Other - 105 (97) (8) - - (3)
490 1,303 (222) (579) (12) 13 (26)
Breakdown by accounting category of foreign currency hedging instruments
Cash Flow HedgeSales against the euro (87) (6) (58) (8) (15) 1 (1)Purchases against the euro 446 446 (c) - - - 1 (11)Other - 92 (92) - - - (3)
359 532 (150) (8) (15) 2 (15)Fair Value Hedge
Sales against the euro (154) (53) (98) (3) - 1 (2)Purchases against the euro 456 441 - 15 - - (6)Other - 20 (12) (8) - - -
302 408 (110) 4 - 1 (8)Net Investment Hedge
Sales against the euro (575) - - (575) (d) - 10 -Purchases against the euro - - - - - - -Other - - - - - - -
(575) - - (575) - 10 -Economic Hedging (b)
Sales against the euro (115) - (6) - (109) - -Purchases against the euro 519 370 37 - 112 - (3)Other - (7) 7 - - - -
404 363 38 - 3 - (3)
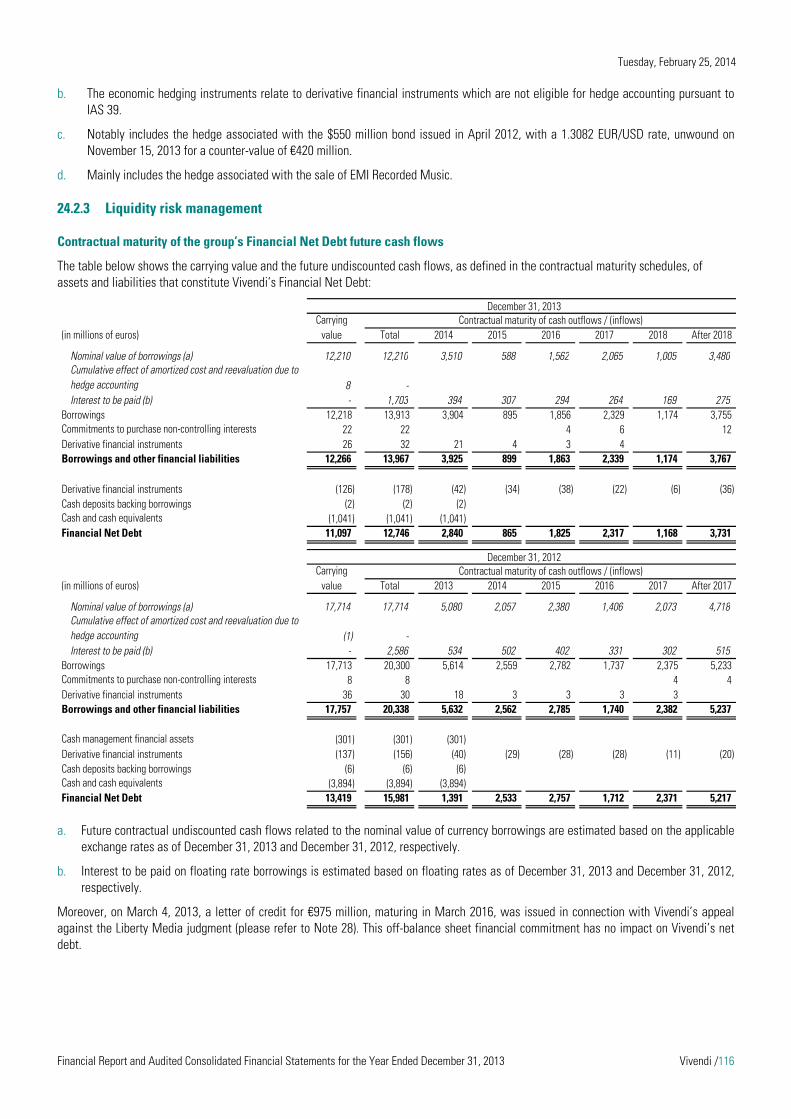
Tuesday, February 25, 2014
Financial Report and Audited Consolidated Financial Statements for the Year Ended December 31, 2013 Vivendi /116
b. The economic hedging instruments relate to derivative financial instruments which are not eligible for hedge accounting pursuant to IAS 39.
c. Notably includes the hedge associated with the $550 million bond issued in April 2012, with a 1.3082 EUR/USD rate, unwound on November 15, 2013 for a counter-value of €420 million.
d. Mainly includes the hedge associated with the sale of EMI Recorded Music.
24.2.3 Liquidity risk management
Contractual maturity of the group’s Financial Net Debt future cash flows
The table below shows the carrying value and the future undiscounted cash flows, as defined in the contractual maturity schedules, of assets and liabilities that constitute Vivendi’s Financial Net Debt:
a. Future contractual undiscounted cash flows related to the nominal value of currency borrowings are estimated based on the applicable exchange rates as of December 31, 2013 and December 31, 2012, respectively.
b. Interest to be paid on floating rate borrowings is estimated based on floating rates as of December 31, 2013 and December 31, 2012, respectively.
Moreover, on March 4, 2013, a letter of credit for €975 million, maturing in March 2016, was issued in connection with Vivendi’s appeal against the Liberty Media judgment (please refer to Note 28). This off-balance sheet financial commitment has no impact on Vivendi’s net debt.
December 31, 2013Contractual maturity of cash outflows / (inflows)
(in millions of euros) Total 2014 2015 2016 2017 2018 After 2018
Nominal value of borrowings (a) 12,210 12,210 3,510 588 1,562 2,065 1,005 3,480Cumulative effect of amortized cost and reevaluation due to hedge accounting 8 -Interest to be paid (b) - 1,703 394 307 294 264 169 275
Borrowings 12,218 13,913 3,904 895 1,856 2,329 1,174 3,755Commitments to purchase non-controlling interests 22 22 4 6 12Derivative financial instruments 26 32 21 4 3 4Borrowings and other financial liabilities 12,266 13,967 3,925 899 1,863 2,339 1,174 3,767
Derivative financial instruments (126) (178) (42) (34) (38) (22) (6) (36)Cash deposits backing borrowings (2) (2) (2) -Cash and cash equivalents (1,041) (1,041) (1,041)Financial Net Debt 11,097 12,746 2,840 865 1,825 2,317 1,168 3,731
Carrying value
December 31, 2012Contractual maturity of cash outflows / (inflows)
(in millions of euros) Total 2013 2014 2015 2016 2017 After 2017
Nominal value of borrowings (a) 17,714 17,714 5,080 2,057 2,380 1,406 2,073 4,718Cumulative effect of amortized cost and reevaluation due to hedge accounting (1) -Interest to be paid (b) - 2,586 534 502 402 331 302 515
Borrowings 17,713 20,300 5,614 2,559 2,782 1,737 2,375 5,233Commitments to purchase non-controlling interests 8 8 4 4Derivative financial instruments 36 30 18 3 3 3 3Borrowings and other financial liabilities 17,757 20,338 5,632 2,562 2,785 1,740 2,382 5,237
Cash management financial assets (301) (301) (301)Derivative financial instruments (137) (156) (40) (29) (28) (28) (11) (20)Cash deposits backing borrowings (6) (6) (6)Cash and cash equivalents (3,894) (3,894) (3,894)Financial Net Debt 13,419 15,981 1,391 2,533 2,757 1,712 2,371 5,217
Carrying value
Tuesday, February 25, 2014
Financial Report and Audited Consolidated Financial Statements for the Year Ended December 31, 2013 Vivendi /117
Group financing policy
As part of the strategic review undertaken by the Supervisory Board and Management Board, Vivendi announced in July 2013 its plans to sell its interests in Activision Blizzard and Maroc Telecom, and in November 2013, the group’s planned demerger to form two separate companies: (i) a media group and (ii) SFR, subject to information and consultation procedures with the relevant French employee representative bodies and approval by the relevant regulatory authorities, as well as, if appropriate, its approval by the General Shareholders' Meeting. In the meantime, Vivendi has pursued its financing policy in relation to expiring bank credit facilities or bonds. Thus, Vivendi early refinanced a €1.5 billion bank credit facility, maturing in May 2014 with a new bank credit facility for the same amount, maturing in March 2018, and issued a new €750 million bond, with a coupon of 2.375%, which early refinances the €894 million residual amount bond issued in January 2009 with a coupon of 7.75%, maturing in January 2014.
On October 11, 2013, Vivendi completed the sale of 88% of its interest in Activision Blizzard for $8.2 billion (€6 billion) in cash. Vivendi used cash on hand to early redeem most of its US dollar-denominated bonds, as well as a portion of its euro-denominated bonds, having the shortest maturity, for an aggregate amount of €3 billion (including $2.1 billion and €1.5 billion), either through a tender offer in October 2013 and a make-whole redemption in November 2013. In addition, Vivendi used the available balance to redeem drawn bank credit facilities. These transactions were as follows:
72% redemption of three US dollar-denominated bonds, following a tender offer: - $459 million redeemed on the $700 million bond, maturing in April 2018; - $541 million redeemed on the $800 million bond, maturing in April 2022; and - $555 million redeemed on the $650 million bond, maturing in January 2018;
early full redemption of one US dollar-denominated bond and two euro-denominated bonds: - $550 million, maturing in April 2015; - €500 million, maturing in November 2015; and - €1,000 million, maturing in July 2015.
In October 2013, Vivendi also redeemed, upon its contractual maturity date, a €700 million bond, refinanced in December 2012, by a bond for the same amount, maturing in January 2020, and cancelled SFR’s €1.2 billion bank credit facility.
Moreover, on November 5, 2013, Vivendi acquired the 20% non-controlling interest in Canal+ France held by Lagardère for €1,020 million, in cash.
Finally, on November 26, 2013, the Supervisory Board approved the group’s planned demerger to form two separate entities: (i) a media group and (ii) SFR. Subject to information and consultation procedures with the relevant French employee representative bodies and approvals by the relevant regulatory authorities, it could be submitted, if appropriate, to the General Shareholders' Meeting for approval on June 24, 2014. The potential impacts of this demerger on the group’s financing structure will become effective if and when a final decision to implement such a transaction is taken.
As of February 19, 2014, the date of the Management Board meeting that approved Vivendi’s Financial Statements for the year ended December 31, 2013:
Vivendi SA had available confirmed credit facilities in the aggregate amount of €7,140 million, of which €600 million was drawn. Given the amount of commercial paper issued at that date, and backed to bank credit facilities for €4,143 million, these facilities were available for an aggregate amount of €2,397 million; and
bonds amounted to €6.9 billion, following the redemption in January 2014 upon its contractual maturity, of the bond issued in January 2009, with a 7.75% coupon, for €894 million.
Moreover, on March 4, 2013, a letter of credit for €975 million was issued in connection with Vivendi’s appeal against the Liberty Media judgment. This off-balance sheet financial commitment has no impact on Vivendi’s net debt.
Contractual agreements in relation to credit facilities and letters of credit granted to Vivendi SA (notably the letter of credit issued in connection with the appeal against the Liberty Media judgment) do not include provisions that tie the conditions of the loan to its financial strength ratings from rating agencies. They contain customary provisions related to events of default and, at the end of each half-year, Vivendi SA is notably required to comply with a financial covenant (please refer to Note 23). The credit facilities granted to group companies other than Vivendi SA are intended to finance either the general needs of the borrowing subsidiary or a specific project.
Group financing organization
Excluding primarily Maroc Telecom group, Vivendi SA centralizes daily cash surpluses (cash pooling) of all controlled entities (a) that are not subject to local regulations restricting the transfer of financial assets or (b) that are not subject to other contractual agreements.
Taking into account the foregoing, Vivendi considers that the cash flows generated by its operating activities, its cash and cash equivalents, as well as the amounts available through its current bank credit facilities and the letter of credit issued in connection with Vivendi’s appeal against the Liberty Media judgment will be sufficient to cover its operating expenses and capital expenditure, service its debt (including the

Tuesday, February 25, 2014
Financial Report and Audited Consolidated Financial Statements for the Year Ended December 31, 2013 Vivendi /118
redemption of borrowings), pay its income taxes and dividends, as well as to fund its financial investment projects, if any, for the next twelve months, subject to potential transactions which may be implemented in connection with the group’s change in scope.
24.3 Credit and investment concentration risk and counterparty risk management
Vivendi’s risk management policy aims at minimizing the concentration of its credit (bank credit facilities, bonds, and derivatives) and investment risks as well as counterparty risk, as regards the setting-up of bank credit facilities, derivatives or investments, by entering into transactions with highly rated commercial banks only. Moreover, regarding bond issues, Vivendi distributes its transactions among selected financial investors. In addition, Vivendi’s trade receivables do not represent a significant concentration of credit risk due to its broad customer base, the broad variety of customers and markets, and the geographic diversity of its business operations.
24.4 Equity market risk management
As of December 31, 2013, Vivendi and its subsidiaries held shares in the following listed companies:
83 million Activision Blizzard common shares classified as "Assets held for sale" in the Consolidated Statement of Financial Position, the value of which is €1,078 million as of December 31, 2013; at constant EUR/USD rate, a 10% decrease (or a 10% increase) in Activision Blizzard’s share price would have a negative impact of €108 million (or a positive impact of €108 million) on Vivendi’s net income. These shares are subject to a 15-month lock-up period, during which Vivendi cannot sell, transfer, hedge or otherwise dispose of any Activision Blizzard shares directly or indirectly (please refer to Note 7); and
95 million TVN shares indirectly held by N-Vision, consolidated by Canal+ Group under the equity method (please refer to Note 15).
In addition, as of December 31, 2013, Vivendi holds call options and has granted put options on listed or unlisted shares. Vivendi is thus exposed to the risk of fluctuation in their values.
Note 25 Consolidated Cash Flow Statement
25.1 Adjustments
25.2 Investing and financing activities with no cash impact
In 2013, there was no significant investing or financing activity with no cash impact.
In 2012, investing and financing activities with no cash impact amounted to €596 million (of which €336 million due to the share capital increase (including premium) and €260 million due to the group’s retained earnings increase) and were mainly related to:
the grant of bonus shares to Vivendi SA shareowners by a €229 million withdrawal from additional paid-in capital (please refer to Note 19);
Vivendi SA’s share capital increase of 22,356 thousand shares, which it paid in consideration for the contribution made by Bolloré Media, (the free-to-air channels Direct 8 and Direct Star), representing an enterprise value of €336 million; and
the strategic partnership in Poland, finalized on November 30, 2012. This transaction generated an increase in consolidated retained earnings from equity of €260 million (€114 million related to the gain on the dilution of Cyfra+ and €131 million related to the recognition of ITI Neovision’s non-controlling interests at fair value).
Year ended December 31,(in millions of euros) Note 2013 2012
Items related to operating activities with no cash impactAmortization and depreciation of intangible and tangible assets 4 5,106 3,275Change in provision, net (168) 10Other non-cash items from EBIT (2) -
OtherItems related to investing and financing activitiesReserve accrual related to the Liberty Media Corporation litigation in the United States 28 - 945Other income from EBIT 4 (88) (19)Other charges from EBIT 4 57 236Proceeds from sales of property, plant, equipment and intangible assets 3 6 9
Adjustments 4,911 4,456
Tuesday, February 25, 2014
Financial Report and Audited Consolidated Financial Statements for the Year Ended December 31, 2013 Vivendi /119
Note 26 Transactions with related parties
26.1 Corporate officers
Situation of corporate officers
On June 28, 2012, the Supervisory Board terminated Mr. Jean-Bernard Lévy’s term of office as Chairman of the Management Board. The Supervisory Board also terminated the terms of office of the following members of the Management Board: Mr. Abdeslam Ahizoune, Mr. Amos Genish, Mr. Lucian Grainge, and Mr. Bertrand Meheut and appointed Mr. Jean-François Dubos as Chairman of the Management Board.
Until December 31, 2013, the Management Board was composed of Mr. Jean-François Dubos and Mr. Philippe Capron, who left his position as a member of the Management Board as of that date.
Since January 1, 2014, the Management Board is composed of Mr. Jean-François Dubos , Mr. Jean-Yves Charlier (Chairman and Chief Executive Officer of SFR), and Mr. Arnaud de Puyfontaine (Senior Executive Vice President, Media and Content activities).
Compensation of corporate officers
The gross compensation, including benefits in kind, that the group paid in 2013, to the members of the Management Board in office, amounted to €2.3 million. This amount included the fixed and variable compensation components paid to the members of the Management Board in office in 2013 for their 2012 mandate. Moreover, in 2013, the members in office until June 28, 2012 received the prorated variable compensation component with respect to 2012, as approved by the Supervisory Board on February 22, 2013, for a total amount of €4.6 million (excluding severance payment, if any; see below).
In 2012, the total gross compensation, including benefits in kind that the group paid to the members of the Management Board in office, amounted to €25 million. This amount included the fixed compensation component of the members of the Management Board for the duration of their mandate (€5 million), the variable compensation component paid for their 2011 mandate (€12 million), as well as the severance payments paid to Mr. Jean-Bernard Levy and Mr. Frank Esser (a member of Vivendi’s Management Board and as SFR’s Chief Executive Officer until March 26, 2012, i.e., termination date of his term of office).
In 2012, Mr. Jean-Bernard Lévy, received a severance payment of €3.9 million, approved by the General Shareholders’ Meeting held on April 30, 2013. In addition, Mr. Frank Esser’s received a severance payment, with respect to the termination of its employment contract, for €3.9 million (of which €1.7 million received in January 2013).
Mr. Philippe Capron, considering his resignation, is not entitled to benefit from the severance payment as included in the amendment to its employment contract which was approved by the General Shareholders’ Meeting held on April 30, 2013.
The Chairman of the Management Board do not benefit from any severance payment due to his position as a Corporate Officer.
The total charge recorded by the group with respect to share-based compensation plans (performance shares, stock options, and employee stock purchase) granted to the members of the Management Board, in office, amounted to €2 million in 2013 (compared to €6 million in 2012).
The amount of net pension plan obligations to the Management Board amounted to €7.8 million as of December 31, 2013 (compared to €4.6 million for the members of the Management Board, in office as of December 31, 2012). Mr. Philippe Capron lost his pension benefit rights with respect to the additional pension plan.
The fixed compensation paid to the Chairman of the Supervisory Board amounted to €700,000 (before taxes and withholdings) in 2013 (unchanged since 2011) and the total amount of fees paid to the other members of the Supervisory Board amounted to €1.2 million (before taxes and withholdings) with respect to 2013 (unchanged compared to 2012).
The Chapter 3 of the Annual Report contains a detailed description of the compensation policy and the compensation and benefits of corporate officers of the group, in accordance with the recommendations of the AFEP-MEDEF amended in June 2013.
Sale of Activision Blizzard
On October 11, 2013, Vivendi sold 88% of its interest in Activision Blizzard. Mr. Jean-François Dubos was a member of Activision Blizzard’s Board of Directors and of its Compensation Committee and Mr. Philippe Capron was Chairman of Activision Blizzard’s Board of Directors and of its Compensation Committee as well as a member of its Nominating and Corporate Governance Committee.

Tuesday, February 25, 2014
Financial Report and Audited Consolidated Financial Statements for the Year Ended December 31, 2013 Vivendi /120
26.2 Other related parties
Excluding corporate officers, Vivendi’s main related parties were those companies over which the group exercises an exclusive or joint control, and companies over which Vivendi exercises a significant influence (please refer to Note 29 for a list of its main subsidiaries, fully consolidated or accounted for under the equity method), and non-controlling interests that exercise significant influence on group affiliates i.e., the Kingdom of Morocco, which owns 30% of Maroc Telecom group, and since November 30, 2012, TVN, which owns 32% of Canal+ Cyfrowy (a subsidiary of Canal+ Group).
Moreover, on November 5, 2013, Vivendi acquired from Lagardère Group its 20% interest in Canal+ France (please refer to Note 2). The agreement entered into in 2006 with Lagardère Group which gave Canal+ France the right to broadcast their theme channels on its multi-channel offer, was extended once until June 30, 2013 and has been extended a second time until June 30, 2016.
Note 27 Contractual obligations and other commitments
Vivendi’s material contractual obligations and contingent assets and liabilities include:
contracts entered into, which relate to the group’s business operations, such as content commitments (please refer to Note 11.2), contractual obligations and commercial commitments recorded in the Statement of Financial Position, including finance leases (please refer to Note 13), off-balance sheet operating leases and subleases and off-balance sheet commercial commitments, such as long-term service contracts and purchase or investment commitments;
commitments related to the group’s scope contracted through acquisitions or divestitures such as share purchase or sale commitments, contingent assets and liabilities subsequent to given or received commitments related to the divestiture or acquisition of shares, commitments resulting from shareholders’ agreements and collateral and pledges granted to third parties over Vivendi’s assets;
commitments related to the group’s financing: borrowings issued and undrawn confirmed bank credit facilities as well as the management of interest rate, foreign currency and liquidity risks (please refer to Notes 23 and 24); and
contingent assets and liabilities related to litigation in which Vivendi and/or its subsidiaries are either plaintiff or defendant (please refer to Note 28).
27.1 Contractual obligations and commercial commitments
27.1.1 Off balance sheet commercial commitments
a. The decrease in off balance sheet commercial commitments was mainly related to Maroc Telecom group, whose sale by Vivendi is underway (€316 million as of December 31, 2012): please refer to Note 7.2.
(in millions of euros) Note 2014 2015-2018 After 2018Borrowings and other financial liabilities 24.2.3 13,967 3,925 6,275 3,767 20,338Content liabilities 11.2 2,335 2,245 88 2 2,283Future minimum payments related to the consolidated statement of financial position items 16,302 6,170 6,363 3,769 22,621Contractual content commitments 11.2 4,298 2,118 2,124 56 4,939Commercial commitments 27.1.1 2,209 1,057 806 346 2,697Operating leases and subleases 27.1.2 2,700 454 1,284 962 2,735Items not recorded in the consolidated statement of financial position 9,207 3,629 4,214 1,364 10,371Contractual obligations and commercial commitments 25,509 9,799 10,577 5,133 32,992
Total as of December 31,
2012Total
Payments due inAs of December 31, 2013
(in millions of euros) 2014 2015 - 2018 After 2018Satellite transponders 686 102 345 239 846 Investment commitments 1,078 802 154 122 1,273 Other 732 265 419 48 786 Given commitments 2,496 1,169 918 409 2,905 Satellite transponders (159) (97) (62) - (201)Other (128) (15) (50) (63) (7)Received commitments (287) (112) (112) (63) (208)Net total (a) 2,209 1,057 806 346 2,697
Minimum future payments as of December 31, 2013 Total minimum future payments as of
December 31, 2012Total
Due in

Tuesday, February 25, 2014
Financial Report and Audited Consolidated Financial Statements for the Year Ended December 31, 2013 Vivendi /121
27.1.2 Off balance sheet operating leases and subleases
a. Mainly relates to offices and technical premises.
27.2 Other commitments given or received relating to operations
a. On February 18, 2010, a group comprised of SFR, Vinci and AXA (30% each) and TDF (10%) entered into a contract with Réseau Ferré
de France regarding the public-private partnership GSM-R. This 15-year contract, valued at approximately €1 billion, covers the financing, building, operation and maintenance of the digital telecommunications network that enables conference mode communications (voice and data) between train drivers and teams on the ground. It will be rolled out gradually until 2015 over 14,000 km of conventional and high-speed railway lines in France.
b. Vivendi grants guarantees in various forms to financial institutions on behalf of its subsidiaries in the course of their operations.
c. Mainly relates to commitments received by UMG from third parties in connection with agreements subject to minimum guarantees on the digital distribution of music rights.
d. The decrease in other guarantees received was notably related to the plan to sell Maroc Telecom group (please refer to Note 7.2).
27.3 Share purchase and sale commitments
In connection with the purchase or sale of operations and financial assets, Vivendi has granted or received commitments to purchase or sell securities.
On November 4, 2013, Vivendi notably committed to sell its interest in Maroc Telecom group (please refer to Note 7.2).
In connection with the sale of a majority of Vivendi’s interest in Activision Blizzard, completed on October 11, 2013, Vivendi’s remaining interest in Activision Blizzard (83 million shares) is subject to lock-up provisions (please refer to Note 7.1).
The liquidity rights regarding the strategic partnership among Canal+ Group, ITI, and TVN are detailed in Note 27.5 below.
Furthermore, Vivendi and its subsidiaries have granted or received purchase or sale options related to shares in equity affiliates and unconsolidated investments.
(in millions of euros) 2014 2015 - 2018 After 2018Buildings (a) 2,695 427 1,282 986 2,633 Other 221 67 103 51 212 Leases 2,916 494 1,385 1,037 2,845 Buildings (a) (216) (40) (101) (75) (110)Subleases (216) (40) (101) (75) (110)Net total 2,700 454 1,284 962 2,735
Minimum future leases as of December 31, 2013 Total - minimum future leases as of December
31, 2012Total
Due in
Ref. Context Characteristics (nature and amount) ExpiryGiven commitmentsIndividual rights to training for French employees Approximately 1.6 million hours (unchanged compared to December 31, 2012). -
SFR’s network coverage commitments related to telecom licenses Please refer to Note 14. -
(a) GSM-R commitments Bank guarantee, joint and several guarantees with Synérail for a total amount of €105 million (compared to €92 million as of December 31, 2012).
-
Obligations in connection with pension plans and post-retirement benefits Please refer to Note 21. -
(b) Other guarantees given Cumulated amount of €156 million (compared to €190 million as of December 31, 2012).
-
Received commitments(c) Agreements on the digital distribution of music rights Minimum guarantees. -
(d) Other guarantees received Cumulated amount of €1 million (compared to €191 million as of December 31, 2012).
-
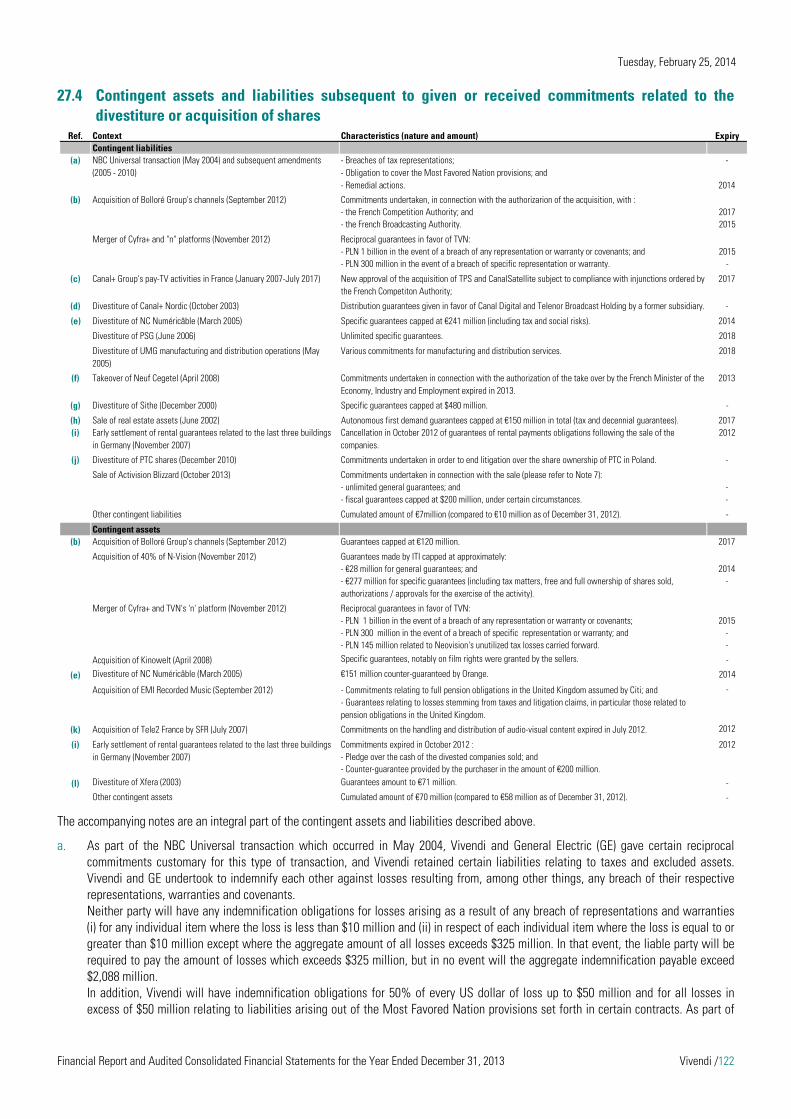
Tuesday, February 25, 2014
Financial Report and Audited Consolidated Financial Statements for the Year Ended December 31, 2013 Vivendi /122
27.4 Contingent assets and liabilities subsequent to given or received commitments related to the divestiture or acquisition of shares
The accompanying notes are an integral part of the contingent assets and liabilities described above.
a. As part of the NBC Universal transaction which occurred in May 2004, Vivendi and General Electric (GE) gave certain reciprocal commitments customary for this type of transaction, and Vivendi retained certain liabilities relating to taxes and excluded assets. Vivendi and GE undertook to indemnify each other against losses resulting from, among other things, any breach of their respective representations, warranties and covenants. Neither party will have any indemnification obligations for losses arising as a result of any breach of representations and warranties (i) for any individual item where the loss is less than $10 million and (ii) in respect of each individual item where the loss is equal to or greater than $10 million except where the aggregate amount of all losses exceeds $325 million. In that event, the liable party will be required to pay the amount of losses which exceeds $325 million, but in no event will the aggregate indemnification payable exceed $2,088 million. In addition, Vivendi will have indemnification obligations for 50% of every US dollar of loss up to $50 million and for all losses in excess of $50 million relating to liabilities arising out of the Most Favored Nation provisions set forth in certain contracts. As part of
Ref. Context Characteristics (nature and amount) ExpiryContingent liabilities
(a) NBC Universal transaction (May 2004) and subsequent amendments (2005 - 2010)
- Breaches of tax representations;- Obligation to cover the Most Favored Nation provisions; and- Remedial actions.
-
2014
(b) Acquisition of Bolloré Group's channels (September 2012) Commitments undertaken, in connection with the authorizarion of the acquisition, with :- the French Competition Authority; and 2017- the French Broadcasting Authority. 2015
Merger of Cyfra+ and "n" platforms (November 2012) Reciprocal guarantees in favor of TVN: - PLN 1 billion in the event of a breach of any representation or warranty or covenants; and 2015- PLN 300 million in the event of a breach of specific representation or warranty. -
(c) Canal+ Group's pay-TV activities in France (January 2007-July 2017) New approval of the acquisition of TPS and CanalSatellite subject to compliance with injunctions ordered by the French Competiton Authority;
2017
(d) Divestiture of Canal+ Nordic (October 2003) Distribution guarantees given in favor of Canal Digital and Telenor Broadcast Holding by a former subsidiary. -
(e) Divestiture of NC Numéricâble (March 2005) Specific guarantees capped at €241 million (including tax and social risks). 2014
Divestiture of PSG (June 2006) Unlimited specific guarantees. 2018
Divestiture of UMG manufacturing and distribution operations (May 2005)
Various commitments for manufacturing and distribution services. 2018
(f) Takeover of Neuf Cegetel (April 2008) Commitments undertaken in connection with the authorization of the take over by the French Minister of the Economy, Industry and Employment expired in 2013.
2013
(g) Divestiture of Sithe (December 2000) Specific guarantees capped at $480 million. -
(h) Sale of real estate assets (June 2002) Autonomous first demand guarantees capped at €150 million in total (tax and decennial guarantees). 2017(i) Early settlement of rental guarantees related to the last three buildings
in Germany (November 2007)Cancellation in October 2012 of guarantees of rental payments obligations following the sale of the companies.
2012
(j) Divestiture of PTC shares (December 2010) Commitments undertaken in order to end litigation over the share ownership of PTC in Poland. -
Sale of Activision Blizzard (October 2013) Commitments undertaken in connection with the sale (please refer to Note 7): - unlimited general guarantees; and -- fiscal guarantees capped at $200 million, under certain circumstances. -
Other contingent liabilities Cumulated amount of €7million (compared to €10 million as of December 31, 2012). -
Contingent assets(b) Acquisition of Bolloré Group's channels (September 2012) Guarantees capped at €120 million. 2017
Acquisition of 40% of N-Vision (November 2012) Guarantees made by ITI capped at approximately:- €28 million for general guarantees; and 2014- €277 million for specific guarantees (including tax matters, free and full ownership of shares sold, authorizations / approvals for the exercise of the activity).
-
Merger of Cyfra+ and TVN's 'n' platform (November 2012) Reciprocal guarantees in favor of TVN: - PLN 1 billion in the event of a breach of any representation or warranty or covenants; 2015- PLN 300 million in the event of a breach of specific representation or warranty; and -- PLN 145 million related to Neovision's unutilized tax losses carried forward. -
Acquisition of Kinowelt (April 2008) Specific guarantees, notably on film rights were granted by the sellers. -
(e) Divestiture of NC Numéricâble (March 2005) €151 million counter-guaranteed by Orange. 2014
Acquisition of EMI Recorded Music (September 2012) - Commitments relating to full pension obligations in the United Kingdom assumed by Citi; and -- Guarantees relating to losses stemming from taxes and litigation claims, in particular those related to pension obligations in the United Kingdom.
(k) Acquisition of Tele2 France by SFR (July 2007) Commitments on the handling and distribution of audio-visual content expired in July 2012. 2012
(i) Commitments expired in October 2012 : 2012- Pledge over the cash of the divested companies sold; and- Counter-guarantee provided by the purchaser in the amount of €200 million.
(l) Divestiture of Xfera (2003) Guarantees amount to €71 million. -
Other contingent assets Cumulated amount of €70 million (compared to €58 million as of December 31, 2012). -
Early settlement of rental guarantees related to the last three buildings in Germany (November 2007)

Tuesday, February 25, 2014
Financial Report and Audited Consolidated Financial Statements for the Year Ended December 31, 2013 Vivendi /123
the unwinding of IACI’s interest in VUE on June 7, 2005, Vivendi’s commitments with regard to environmental matters were amended and Vivendi’s liability is now subject to a de minimis exception of $10 million and a payment basket of $325 million. The representations and warranties given as part of the NBC Universal transaction other than those regarding authorization, capitalization and tax representations terminated on August 11, 2005. Notices of environmental claims related to remediation must be brought by May 11, 2014. Other claims, including those related to taxes, will be subject to applicable statutes of limitations. The sale of Vivendi’s interest in NBC Universal to GE completed on January 25, 2011 did not modify these commitments.
b. As part of the French Competition Authority’s approval of the acquisition of the Direct 8 and Direct Star channels (renamed D8 and D17, respectively) on July 23, 2012, Vivendi and Canal+ Group undertook certain commitments. These commitments provide for restrictions on the acquisition of rights for American movies and television series from certain American studios and for French movies, the separate negotiation of certain rights for pay-TV and free-to-air movies and television series, limitations on the acquisition by D8 and D17 of French catalog movies from Studiocanal, and the transfer of rights to broadcast major sports events on free-to-air channels through a competitive bidding process. These commitments are made for a 5-year period, renewable once if the French Competition Authority, after having performed a competitive analysis, deems it necessary. In addition, on September 18, 2012, the French Broadcasting Authority (Conseil Supérieur de l’Audiovisuel) approved the acquisition of these channels, subject to certain commitments relating to broadcasting, investment obligations, transfer rights, and the retention by Canal+ Group of the D8 shares for a minimum period of two and a half years. On December 23, 2013 the French Council of State annulled the decision of the French Competition Authority approving the acquisition of the D8 and D17 channels, with a postponed effect as from July 1, 2014. The French Council of State raised an issue regarding an error of judgment in relation to a specific commitment on the second and third windows for free-to-air French films. On January 15, 2014, Vivendi and Canal+ Group submitted a new notification to the French Competition Authority in respect of the acquisition of the free-to-air channels D8 and D17. However, the D8 and D17 channels continue to broadcast their programs as the decision of the French Council of State did not challenge the acquisition of these channels.
c. On August 30, 2006, the TPS/Canal+ Group merger was authorized, in accordance with the merger control regulations, pursuant to a decision of the French Minister of Economy, Finance and Industry, subject to Vivendi and Canal+ Group complying with certain undertakings for a maximum period of six years, with the exception of those commitments concerning the availability of channels and VOD, which could not exceed five years.
On October 28, 2009, the French Competition Authority opened an enquiry regarding the implementation of certain undertakings given by Canal+ Group in connection with the merger of CanalSatellite and TPS. On December 21, 2012, the French Council of State rejected Vivendi and Canal + Group’s filed motions requesting the annulment of the French Competition Authority’s decisions of September 20, 2011 and July 23, 2012. Under the first motion, the €30 million fine imposed on Canal+ Group was reduced to €27 million. Under the second motion, the transaction was cleared once again, subject to compliance with 33 injunctions. Canal+ Group has implemented a number of these injunctions, some of which since July 23, 2012 and others since October 23, 2012, mainly focusing on: Acquisition of movie rights
- by limiting the duration of output deals to three years, requiring separate agreements for different types of rights (1st pay-TV window, 2nd pay-TV window, series, etc) and prohibiting output deals for French films; and
- by divesting its interest in Orange Cinema Series – OCS SNC or by adopting measures limiting its influence on Orange Cinema Series – OCS SNC (please refer to Note 27.5 below).
Distribution of pay-TV channels - by the distribution of a minimum number of independent channels, the distribution of any channel holding premium rights, and
by drafting a model distribution deal relating to independent channels included in the CanalSat offer; - by the obligation to promote, in a transparent and separate manner, the distribution of exclusive independent channels on
each owned platform serving more than 500,000 subscribers; and - by making all its own movie channels distributed by Canal+ Group (Cine+ channels) available to third-party distributors
(unbundling). Video on demand (VOD) and subscription video on demand (SVOD)
- by separating contracts entered into for the purchase of VOD and SVOD rights on a non-exclusive basis, and not combining them with rights purchased for linear distribution on pay-TV;
- by offering Studiocanal's VOD and SVOD rights to any interested operator; and - by forbidding exclusive distribution deals for the benefit of Canal+ Group’s VOD and SVOD offers on Internet Service Providers
platforms. These injunctions are imposed for a period of five years, renewable once. At the end of the five-year period, the French Competition Authority will review the competition situation to determine whether the injunctions should be kept in place. If market conditions have changed significantly, Canal+ Group will be able to request that these injunctions be waived or partially or totally revised. An
Tuesday, February 25, 2014
Financial Report and Audited Consolidated Financial Statements for the Year Ended December 31, 2013 Vivendi /124
independent trustee, proposed by Canal+ Group and approved by the French Competition Authority on September 25, 2012, will be responsible for monitoring the injunctions implementation. Moreover, Vivendi granted a counter-guarantee, in favor of TF1 and M6 to assume commitments and guarantees made by TF1 and M6 in connection with some of the contractual content commitments and other long term obligations of TPS and other obligations recognized in the Statement of Financial Position of TPS. As of December 31, 2012, the remaining amount of these commitments was not significant and the counter-guarantee expired on January 4, 2013.
d. In connection with the divestiture of Canal+ Nordic in October 2003, Canal+ Group has retained distribution guarantees given in favor of Canal Digital and Telenor Broadcast Holding by a former subsidiary, which guarantees are covered by a counter-guarantee given by the buyers.
e. As part of the divestiture of NC Numéricâble on March 31, 2005, the Canal+ Group granted specific guarantees with a €241 million cap (including tax and social risks). Specific risks relating to cable networks used by NC Numéricâble are included in this maximum amount and are counter-guaranteed by Orange up to €151 million.
f. As part of the takeover of Neuf Cegetel, the approval from the Ministry of Economy, Industry and Employment, dated April 15, 2008, resulted in additional commitments from Vivendi and its subsidiaries. They address competitor access and new market entrants to wholesale markets on SFR’s fixed and mobile networks, acceptance on the fixed network of an independent television distributor if such a player appears, as well as the availability, on a non-exclusive basis, of ADSL on eight new channels which are leaders in their particular field (Paris Première, Teva, Jimmy, Ciné Cinéma Famiz, three M6 Music channels and Fun TV). All these commitments expired in April 2013.
g. In connection with the sale of its 49.9% interest in Sithe to Exelon in December 2000, Vivendi granted customary representations and guarantees. Claims, other than those made in relation to foreign subsidiary commitments, are capped at $480 million. In addition, claims must exceed $15 million, except if they relate to foreign subsidiaries or the divestiture of certain electrical stations to Reliant in February 2000. Some of these guarantees expired on December 18, 2005. Some environmental commitments still exist and any potential liabilities related to contamination risks will survive for an indefinite period of time.
h. In connection with the sale of real estate assets in June 2002 to Nexity, Vivendi granted two autonomous first demand guarantees, one for €40 million and one for €110 million, to several subsidiaries of Nexity (Nexim 1 to 6). The guarantees are effective until June 30, 2017.
i. After having sold the companies carrying credit lease commitments in relation to the Berlin buildings Lindencorso, Anthropolis and Dianapark (the ”Companies”), in November 2007, Vivendi continued to guarantee certain lease payment obligations. As a result of the early exercise by the Companies of their call options on the buildings, Vivendi’s guarantees were terminated on October 5, 2012. In return, the counter-guarantee provided by the acquirors of the Companies to Vivendi (€200 million) was cancelled, as well as the pledge over the cash of the divested companies to the benefit of Vivendi. Vivendi has retained tax guarantees given at the time of the disposal of the Companies.
j. On December 14, 2010, Vivendi, Deutsche Telekom, Mr. Solorz-Zak (Elektrim’s main shareholder) and Elektrim’s creditors, including the Polish State and Elektrim's bondholders, entered into various agreements to put an end to the litigation surrounding the share capital ownership of Polska Telefonia Cyfrowa (PTC), a mobile telecommunication operator. With respect to these agreements, Vivendi notably entered into the following commitments:
Vivendi granted to Deutsche Telekom a guarantee over Carcom that was capped at €600 million, which expired in August 2013;
Vivendi committed to compensate Elektrim SA (Elektrim) for the tax consequences of the transaction, with a cap at €20 million. This commitment expired in July 2011 and the claims were settled in June 2012;
Vivendi committed to compensate Law Debenture Trust Company (LDTC) against any recourse for damages that could be brought against LDTC in connection with the completed transaction, for an amount up to 18.4% for the first €125 million, 46% between €125 million and €288 million, and 50% thereafter; and
Vivendi committed to compensate Elektrim’s administrator for the consequences of any action for damages that may be taken against it, in connection with the decisions that were taken to end certain procedures.
k. The Share Purchase Agreement dated as of October 2, 2006 between Tele2 Europe SA and SFR contains representations and warranties which expired on January 20, 2009 and warranties relating to claims arising with respect to tax and social matters, which expired end of March 2012. On July 18, 2007, by way of implementation of the European Union antitrust regulation, the European Commission approved the purchase of the fixed and internet activities of Tele2 France by SFR, subject to commitments on the handling and distribution of audio-visual content for a five-year period. All these commitments expired on July 18, 2012.
l. Vivendi received guarantees in respect of the repayment of amounts paid in July 2007 (€71 million), in the event of a favourable decision of the Spanish Courts concerning Xfera’s tax litigation seeking to cancel the 2001, 2002 and 2003 radio spectrum fees. These guarantees include a first demand bank guarantee relating to 2001 fees for an amount of €57 million.
Tuesday, February 25, 2014
Financial Report and Audited Consolidated Financial Statements for the Year Ended December 31, 2013 Vivendi /125
Several guarantees given in 2013 and during prior years in connection with asset acquisitions or disposals have expired. However, the time periods or statute of limitations of certain guarantees relating, among other things, to employees, environment and tax liabilities, in consideration of share ownership, or given in connection with the dissolution or winding-up of certain businesses are still in effect. To the best of Vivendi’s knowledge, no material claims for indemnification against such liabilities have been made to date. In addition, Vivendi regularly delivers, at the settlement of disputes and litigations, commitments for damages to third parties, which are typical in such transactions.
27.5 Shareholders’ agreements
Under existing shareholders’ or investors’ agreements (primarily those relating to Maroc Telecom group, and ”nc+”), Vivendi holds certain rights (such as pre-emptive rights and priority rights) that give it control over the capital structure of consolidated companies partially owned by minority shareholders. Conversely, Vivendi has granted similar rights to these other shareholders in the event that it sells its interests to third parties.
In addition, pursuant to other shareholders’ agreements or the bylaws of consolidated entities, equity affiliates or unconsolidated interests, Vivendi and its subsidiaries have given or received certain rights (pre-emptive and other rights) entitling them to maintain their shareholder’s rights.
Strategic agreements among Vivendi, Canal+ Group, Lagardère, and Lagardère Holding TV
The rights granted to Lagardère following the strategic agreements entered into on January 4, 2007, were ended on November 5, 2013, following the acquisition by Vivendi of Lagardère Group’s 20% interest in Canal+ France (please refer to Note 2).
Strategic partnership among Canal+ Group, ITI, and TVN
The key liquidity rights provided under the strategic partnership formed in November 2012 concerning television in Poland are as follows:
‐ At the level of N-Vision: on December 18, 2013, ITI exercised its put option to sell a 9% interest in N-Vision to Canal+ Group, and on the basis of a
value equal to Canal+ Group’s initial investment in N-Vision, i.e., for a cash amount of €62 million, paid in February 2014; Canal+ Group has a call option to acquire ITI’s remaining N-Vision shares, exercisable at any time during the two 3-month
periods beginning February 29, 2016 and February 28, 2017, at the then-prevailing market value; conversely, in the event that Canal+ Group does not exercise its call option on ITI’s interest in N-Vision, ITI has a call option
to acquire Canal+ Group’s interest in N-Vision, exercisable at any time during the two 3-month periods beginning May 30, 2016 and May 29, 2017, and between November 1, 2017 and December 31, 2017 and between May 1, 2018 and June 30, 2018, at the then-prevailing market value; and
Canal+ Group and ITI each has the liquidity right, following the above call option periods, to sell its entire interest in N-Vision.
‐ �At the level of ”nc+”: Canal+ Group has a call option to acquire TVN’s 32% interest in ”nc+” at market value, which is exercisable during the two
3- month periods beginning November 30, 2015 and November 30, 2016; if Canal+ Group exercises its call option, Canal+ Group will be required to acquire ITI’s remaining interest in N-Vision; and in the event that Canal+ Group does not exercise its call option, TVN has liquidity rights in the form of an Initial Public
Offering of its interest in ”nc+”.
Shareholders’ agreement between Orange Cinema Series and Multithématiques
On February 4, 2013, the members of Orange Cinema Series - OCS SNC’ Board of Directors resigned from their positions at the request of Multithématiques and in order to comply with injunction 2(b) ordered by the French Competition Authority on July 23, 2012. As a result, Multithématiques appointed, by letter with an effective date of February 4, 2013, two independent representatives with no affiliation to Multithématiques to the Board of Directors of Orange Cinema Series - OCS SNC.
In addition, in compliance with Article L. 225-100-3 of the French Commercial Code, it is stated that some rights and obligations of Vivendi resulting from shareholders’ agreements (Maroc Telecom group, and Canal+ Cyfrowy) may be amended or terminated in the event of a change in control of Vivendi or a tender offer being made for Vivendi. These shareholders’ agreements are subject to confidentiality provisions.

Tuesday, February 25, 2014
Financial Report and Audited Consolidated Financial Statements for the Year Ended December 31, 2013 Vivendi /126
27.6 Collaterals and pledges
As of December 31, 2013, the amount of the group’s assets that were pledged or mortgaged for the benefit of third parties was €212 million (compared to €209 million as of December 31, 2012). This amount primarily includes GVT’s pledged assets with respect to judicial guarantees for various litigations.
Moreover, as of December 31, 2013 and 2012, Vivendi did not hold any third-party guarantees in respect of any of its outstanding receivables.
Note 28 Litigation
In the normal course of its business, Vivendi is subject to various lawsuits, arbitrations and governmental, administrative or other proceedings (collectively referred to herein as “Legal Proceedings”).
The costs which may result from these proceedings are only recognized as provisions when they are likely to be incurred and when the obligation can reasonably be quantified or estimated, in which case, the amount of the provision represents Vivendi’s best estimate of the risk, provided that Vivendi may, at any time, reassess such risk if events occur during such proceedings. As of December 31, 2013, provisions recorded by Vivendi for all claims and litigations amounted to €1,379 million, compared to €1,357 million at December 31, 2012 (please refer to Note 20).
To the company’s knowledge, there are no Legal Proceedings or any facts of an exceptional nature, including, to the company’s knowledge, any pending or threatened proceedings in which it is a defendant, which may have or have had in the previous twelve months a significant impact on the company’s and on its group’s financial position, profit, business and property, other than those described herein.
The status of proceedings disclosed hereunder is described as of February 19, 2014, the date of the Management Board meeting held to approve Vivendi’s Financial Statements for the year ended December 31, 2013.
Securities Class Action in the United States
Since July 18, 2002, sixteen claims have been filed against Vivendi, Messrs. Messier and Hannezo in the United States District Court for the Southern District of New York and in the United States District Court for the Central District of California. On September 30, 2002, the New York court decided to consolidate these claims under its jurisdiction into a single action entitled In re Vivendi Universal S.A. Securities Litigation.
The plaintiffs allege that, between October 30, 2000 and August 14, 2002, the defendants violated certain provisions of the US Securities Act of 1933 and US Securities Exchange Act of 1934, particularly with regard to financial communications. On January 7, 2003, the plaintiffs filed a consolidated class action suit that may benefit potential groups of shareholders.
On March 22, 2007, the Court decided, concerning the procedure for certification of the potential claimants as a class (“class certification”), that persons from the United States, France, England and the Netherlands who purchased or acquired shares or American Depositary Receipts (ADRs) of Vivendi (formerly Vivendi Universal SA) between October 30, 2000 and August 14, 2002, could be included in the class.
Following the class certification decision of March 22, 2007, a number of individual cases were filed against Vivendi on the same grounds as the class action. On December 14, 2007, the judge issued an order consolidating the individual actions with the securities class action for purposes of discovery. On March 2, 2009, the Court deconsolidated the Liberty Media action from the class action. On August 12, 2009, the Court issued an order deconsolidating the individual actions from the class action.
On January 29, 2010, the jury returned its verdict. It found that 57 statements made by Vivendi between October 30, 2000 and August 14, 2002, were materially false or misleading and were made in violation of Section 10(b) of the Securities Exchange Act of 1934. Plaintiffs had alleged that those statements were false and misleading because they failed to disclose the existence of an alleged “liquidity risk” which reached its peak in December 2001. However, the jury concluded that neither Mr. Jean-Marie Messier nor Mr. Guillaume Hannezo were liable for the alleged misstatements. As part of its verdict, the jury found that the price of Vivendi’s shares was artificially inflated on each day of the class period in an amount between €0.15 and €11.00 per ordinary share and $0.13 and $10.00 per ADR, depending on the date of purchase of each ordinary share or ADR. Those figures represent approximately half the amounts sought by the plaintiffs in the class action.
(in millions of euros) December 31, 2013 December 31, 2012
On intangible assets 4 8On tangible assets 23 47On financial assets 177 146On cash 8 8
Total 212 209
Tuesday, February 25, 2014
Financial Report and Audited Consolidated Financial Statements for the Year Ended December 31, 2013 Vivendi /127
The jury also concluded that the inflation of the Vivendi share price fell to zero in the three weeks following the September 11, 2001, tragedy, as well as on stock exchange holidays on the Paris or New York markets (12 days) during the class period.
On June 24, 2010, the US Supreme Court, in a very clear statement, ruled, in the Morrison v. National Australia Bank case, that American securities law only applies to “the purchase or sale of a security listed on an American stock exchange”, and to “the purchase or sale of any other security in the United States.”
In a decision dated February 17, 2011 and issued on February 22, 2011, the Court, in applying the “Morrison” decision, confirmed Vivendi’s position by dismissing the claims of all purchasers of Vivendi’s ordinary shares on the Paris stock exchange and limited the case to claims of French, American, British and Dutch purchasers of Vivendi’s ADRs on the New York Stock Exchange. The Court denied Vivendi’s post-trial motions challenging the jury’s verdict. The Court also declined to enter a final judgment, as had been requested by the plaintiffs, saying that to do so would be premature and that the process of examining individual shareholder claims must take place before a final judgment could be issued. On March 8, 2011, the plaintiffs filed a petition before the Second Circuit Court of Appeals seeking to appeal the decision rendered on February 17, 2011. On July 20, 2011, the Court of Appeals denied the petition and dismissed the claim of purchasers who acquired their shares on the Paris stock exchange.
In a decision dated January 27, 2012 and issued on February 1, 2012, the Court, in applying the Morrison decision, also dismissed the claims of the individual plaintiffs who purchased ordinary shares of the company on the Paris stock exchange.
On July 5, 2012, the Court denied a request by the plaintiffs to expand the class to nationalities other than those covered by the certification decision dated March 22, 2007.
The claims process commenced on December 10, 2012, with the sending of a notice to shareholders who may be part of the class. Recipients of the notice had until August 7, 2013 to file a claim form and submit documentation evidencing the validity of their claim. These claims are currently being processed and verified by an independent claims administrator and by the parties. Vivendi will then have the right to challenge the merits of these claims. At the end of this process, which should be completed during the first half of 2014, the judge will be able to determine the total amount of damages and enter a final judgment, thereby enabling Vivendi to commence its appeal.
Moreover, in connection with the Halliburton case under review by the Supreme Court of the United States, Vivendi filed an amicus curiae brief. This case addresses the conditions under which class actions are certified in the United States.
Vivendi believes that it has solid grounds for an appeal at the appropriate times. Vivendi intends to challenge, among other issues, the plaintiffs’ theories of causation and damages and, more generally, certain decisions made by the judge during the conduct of the trial. Several aspects of the verdict will also be challenged.
On the basis of the verdict rendered on January 29, 2010, and following an assessment of the matters set forth above, together with support from studies conducted by companies specializing in the calculation of class action damages and in accordance with the accounting principles described in Notes 1.3.1 (Use of Estimates) and 1.3.8 (Provisions). Vivendi made a provision on December 31, 2009, in an amount of €550 million in respect of the damages that Vivendi might have to pay to plaintiffs. Vivendi re-examined the amount of the reserve related to the Securities class action litigation in the United States, given the decision of the District Court for the Southern District of New York on February 17, 2011, which followed the US Supreme Court’s decision on June 24, 2010 in the Morrison case. Using the same methodology and the same valuation experts as in 2009, Vivendi re-examined the amount of the reserve and set it at €100 million as of December 31, 2010, in respect of the damages, if any, that Vivendi might have to pay solely to shareholders who have purchased ADRs in the United States. Consequently, as of December 31, 2010, Vivendi recognized a €450 million reversal of reserve.
Vivendi considers that this provision and the assumptions on which it is based may require further amendment as the proceedings progress and, consequently, the amount of damages that Vivendi might have to pay to the plaintiffs could differ from the current estimate. As is permitted by current accounting standards, no details are given of the assumptions on which this estimate is based, because their disclosure at this stage of the proceedings could be prejudicial to Vivendi.
Complaint of Liberty Media Corporation
On March 28, 2003, Liberty Media Corporation and certain of its affiliates filed suit against Vivendi and Jean-Marie Messier and Guillaume Hannezo in the District Court for the Southern District of New York for claims arising out of the agreement entered into by Vivendi and Liberty Media relating to the formation of Vivendi Universal Entertainment in May 2002. The plaintiffs allege that the defendants violated certain provisions of the US Exchange Act of 1934 and breached certain contractual representations and warranties. The case had been consolidated with the securities class action for pre-trial purposes but was subsequently deconsolidated on March 2, 2009. The judge granted Liberty Media’s request that they be permitted to avail themselves of the verdict rendered by the securities class action jury with respect to Vivendi’s liability (theory of “collateral estoppel”).
The Liberty Media jury returned its verdict on June 25, 2012. It found Vivendi liable to Liberty Media for making certain false or misleading statements and for breaching several representations and warranties contained in the parties’ agreement and awarded damages to Liberty Media in the amount of €765 million. Vivendi filed certain post-trial motions challenging the jury’s verdict, including motions requesting that the Court set aside the jury’s verdict for lack of evidence and order a new trial.

Tuesday, February 25, 2014
Financial Report and Audited Consolidated Financial Statements for the Year Ended December 31, 2013 Vivendi /128
On January 9, 2013, the Court confirmed the jury’s verdict. It also awarded Liberty Media pre-judgment interest accruing from December 16, 2001 until the date of the entry of judgment, using the average rate of return on one-year U.S. Treasury bills. On January 17, 2013, the Court entered a final judgment in the total amount of €945 million, including pre-judgment interest, but stayed its execution while it considered two pending post-trial motions, which were denied on February 12, 2013.
On February 15, 2013, Vivendi filed with the Court a Notice of Appeal against the judgment awarded, for which it believes it has strong arguments. On March 13, 2013, Vivendi filed a motion in the Second Circuit Court of Appeals requesting that the Court stay the Liberty Media appeal until the Class Action judgment is entered so that the two appeals can be heard simultaneously. On April 4, 2013, the Court of Appeals issued an Order granting Vivendi’s motion, agreeing to hear the Liberty Media case together with the Class Action. The appeal in the Liberty Media case is stayed until Vivendi can appeal from the Class Action final judgment.
On the basis of the verdict rendered on June 25, 2012, and the entry of the final judgment by the Court, Vivendi maintained as of December 31, 2013, the provision in the amount of €945 million recorded as of December 31, 2012.
Trial of Vivendi’s former officers in Paris
In October 2002, the financial department of the Paris Public Prosecutor’s office (Parquet de Paris) launched an investigation into the publication of allegedly false or misleading information regarding the financial situation and forecasts of the company and the publication of allegedly untrue or inaccurate financial statements for the fiscal years 2000 and 2001. Additional charges were brought in this investigation relating to purchases by the company of its own shares between September 1, 2001 and December 31, 2001. Vivendi joined the proceedings as a civil party.
The trial took place from June 2 to June 25, 2010, before the 11th Chamber of the Paris Tribunal of First Instance (Tribunal de Grande Instance de Paris), following which the Public Prosecutor asked the Court to drop the charges against the defendants. On January 21, 2011, the Court rendered its judgment, in which it confirmed the previous recognition of Vivendi as a civil party. Messrs. Jean Marie Messier, Guillaume Hannezo, Edgar Bronfman Jr. and Eric Licoys received suspended sentences and fines. Messrs. Jean Marie Messier and Guillaume Hannezo were also ordered to pay damages to shareholders who are entitled to reparation as civil parties. The former Vivendi officers as well as some civil parties appealed the decision. The appeal proceedings were held from October 28 to November 26, 2013, before the Paris Court of Appeal. The Public Prosecutor requested a 20-month suspended prison sentence and a fine of €150,000 for Mr. Jean-Marie Messier for misuse of corporate assets and dissemination of false or misleading information, a 10-month suspended prison sentence and a fine of €850,000 for Mr. Guillaume Hannezo for insider trading, and a 10-month suspended prison sentence and a fine of €5 million for Mr. Edgar Bronfman Jr. for insider trading. In the course of the trial, a number of civil parties have submitted an application to the Paris Court of Appeal for a priority preliminary ruling on constitutionality. The application concerned the impossibility, for a civil party, to appeal a decision by a first instance court to drop charges. Since the same question is currently pending before the Constitutional Council, the Court of Appeal has stayed the proceedings with regard to the issues relating to the dropped charges, and postponed pleadings on these issues until the hearing of April 8 and 9, 2014. The Court will rule on these and the other issues in a single judgment on April 29, 2014.
LBBW et al against Vivendi
On March 4, 2011, 26 institutional investors from Germany, Canada, Luxemburg, Ireland, Italy, Sweden, Belgium and Austria filed a complaint against Vivendi with the Paris Commercial Court seeking to obtain damages for losses they allegedly incurred as a result of four financial communications issued by Vivendi in October and December 2000, September 2001 and April 2002. Then on April 5 and on April 23, 2012, two similar complaints were filed against Vivendi: the first one by a US pension fund, the Public Employee Retirement System of Idaho and the other by six German and British institutional investors. Finally, on August 8, 2012, the British Columbia Investment Management Corporation also filed a complaint against Vivendi on the same basis. The cases are currently in the pretrial stage.
California State Teachers Retirement System et al against Vivendi and Jean-Marie Messier
On April 27, 2012, 67 institutional foreign investors filed a complaint against Vivendi and Jean-Marie Messier before the Paris Commercial Court seeking damages for losses they allegedly incurred as a result of the financial communications made by Vivendi and its former leader, between 2000 and 2002. On September 6, 2012, 24 new plaintiffs joined these proceedings; however, in November 2012, two plaintiffs withdrew from the proceedings. The case is currently in the pretrial stage.
Actions against Activision Blizzard, Inc., its Board of Directors, and Vivendi
In August 2013, a derivative action was initiated in Los Angeles Superior Court by an individual shareholder against Activision Blizzard, Inc. (“Activision Blizzard” or the “Company”), all of the members of its Board of Directors and against Vivendi. The plaintiff alleges that Activision Blizzard’s Board of Directors and Vivendi breached their fiduciary duties by approving the divestment of Vivendi’s share ownership in the Company. The plaintiff, Todd Miller, claims that the transaction would not only be disadvantageous to Activision Blizzard but that it would also confer a disproportionate advantage to a group of investors led by Robert Kotick and Brian Kelly, the Company’s Chief Executive Officer and Co-Chairman of the Board, respectively, and that those breaches of fiduciary duty were aided and abetted by Vivendi.

Tuesday, February 25, 2014
Financial Report and Audited Consolidated Financial Statements for the Year Ended December 31, 2013 Vivendi /129
On September 11, 2013, a second derivative action based on essentially the same allegations was initiated in the Delaware Court of Chancery by another minority shareholder of Activision Blizzard, Anthony Pacchia.
On the same day, another minority shareholder, Douglas Hayes, initiated a similar action and also requested that the closing of the sale transaction be enjoined pending approval of the transaction by Activision Blizzard’s shareholders. On September 18, 2013, the Delaware Court of Chancery granted the motion enjoining the closing of the transaction. However, on October 10, 2013, the Delaware Supreme Court overturned this decision, allowing for the completion of the transaction. The case will proceed on the merits.
On November 2, 2013, the Delaware Court of Chancery consolidated the Pacchia and Hayes actions into a single action entitled In Re Activision Blizzard Inc. Securities Litigation. A decision on whether the “Miller” case should also be consolidated into this action is expected soon.
Vivendi Deutschland against FIG
Further to a claim filed by CGIS BIM (a former subsidiary of Vivendi) against FIG to obtain the release of part of a payment remaining due pursuant to a buildings sale contract, FIG obtained, on May 29, 2008, the annulment of the sale following a judgment of the Berlin Court of Appeal, which overruled a judgment rendered by the Berlin High Court. CGIS BIM was ordered to repurchase the buildings and to pay damages. Vivendi delivered a guarantee so as to pursue settlement negotiations. As no settlement was reached, on September 3, 2008, CGIS BIM challenged the validity of the reasoning of the judgment. On April 23, 2009, the Regional Berlin Court issued a decision setting aside the judgment of the Berlin Court of Appeal dated May 29, 2008. On June 12, 2009, FIG appealed that decision. On December 16, 2010, the Berlin Court of Appeal rejected FIG’s appeal and confirmed the decision of the Regional Berlin Court in April 2009, which decided in CGIS BIM’s favor and confirmed the invalidity of the reasoning of the judgment and therefore overruled the order for CGIS BIM to repurchase the building and pay damages and interest. This decision is now final. In parallel, FIG filed a second claim for additional damages in the Berlin Regional Court which was served on CGIS BIM on March 3, 2009. On June 19, 2013, the Berlin Regional Court ordered CGIS BIM to pay FIG the sum of €3.9 million together with interest from February 27, 2009. CGIS BIM has appealed this decision.
Lagardère against Vivendi, Canal+ Group, and Canal+ France
On February 12, 2013, Lagardère Holding TV, a 20% shareholder of Canal+ France, and Mr. Dominique D’Hinnin and Mr. Philippe Robert, members of the Supervisory Board of Canal+ France, filed a complaint against Vivendi, Canal+ Group and Canal+ France with the Paris Commercial Court. The Lagardère group is seeking nullification of the cash management agreement entered into between Canal+ France and Canal+ Group on the grounds that it constitutes a related party agreement and hence, is seeking restitution, under penalty, from Canal+ Group, of the entire cash surplus given over by Canal+ France under the agreement. The parties have agreed to the appointment of a mediator to help find an amicable solution to the dispute between them. On June 10, 2013, the Paris Commercial Court appointed Mr. René Ricol as the mediator. Following the mediation process, which ended on October 14, 2013, the different parties entered into a settlement agreement dated November 5, 2013, which put an end to the disputes between them.
Compañía de Aguas de Aconquija and Vivendi against the Republic of Argentina
On August 20, 2007, the International Center for Settlement of Investment Disputes (“ICSID”) issued an arbitration award in favor of Vivendi and Compañia de Aguas de Aconquija (“CAA”), its Argentinian subsidiary, relating to a dispute that arose in 1996 regarding the water concession it held between 1995 and 1997, in the Argentinian Province of Tucuman. The arbitration award held that the actions of the provincial authorities had infringed the rights of Vivendi and its subsidiary, and were in breach of the provisions of the Franco-Argentine Bilateral Investment Protection Treaty. The arbitration tribunal awarded Vivendi and its subsidiary damages of US$105 million plus interest and costs.
On December 13, 2007, the Argentinian Government filed an application to vacate the arbitration award on the basis, among others, of an alleged conflict of interest regarding one of the arbitrators. The ICSID appointed an ad hoc committee to rule on this application.
On August 10, 2010, the ICSID rejected the Argentinian Government’s application and the award of August 20, 2007 became final.
On October 10, 2013, Vivendi and CAA entered into a settlement agreement with the Argentine government which terminated their dispute.
Claim by Centenary Holdings III Ltd.
Centenary Holdings III Ltd. (CH III), a former Seagram subsidiary, divested in January 2004, was placed into liquidation in July 2005. On January 9, 2009, the liquidator of CH III sued a number of its former directors, former auditors and Vivendi. The liquidator, acting on behalf of CH III’s creditors, alleges that the defendants breached their fiduciary duties.
On September 30, 2010, Vivendi and one of the former directors of CH III settled with the liquidator. This settlement put an end to the legal proceedings brought against them and assigned to Vivendi all claims filed on behalf of the creditors.

Tuesday, February 25, 2014
Financial Report and Audited Consolidated Financial Statements for the Year Ended December 31, 2013 Vivendi /130
Vivendi, based on the rights of CH III obtained in the settlement, sued Stephen Bloch, a former director of CH III, and Murray Richards, the purchaser of CH III. The trial took place from June 12 through June 27, 2013, and on October 9, 2013, the High Court in London ruled in favor of Vivendi. On October 25, 2013, Court entered a judgment requiring the defendants to pay the sum of £9,666,437.
Vivendi’s complaint against Orange before the European Commission for abuse of a dominant position
On March 2, 2009, Vivendi and Free jointly filed a complaint against Orange before the European Commission (the “Commission”), for abuse of a dominant position. Vivendi and Free allege that Orange imposes excessive tariffs on offers for access to its fixed network and on telephone subscriptions. In July 2009, Bouygues Telecom joined in this complaint. In a letter dated February 2, 2010, the Commission informed the parties of its intention to dismiss the complaint. On September 17, 2010, Vivendi filed an appeal before the Court of First Instance of the European Union in Luxemburg. On October 16, 2013, the Court denied Vivendi’s appeal.
Free against SFR
On May 21, 2012, Free filed a complaint against SFR with the Paris Commercial Court. Free is challenging SFR‘s model of subsidizing mobile phone purchases through what Free calls “concealed” consumer loans and claims this constitutes an unfair and deceptive trade practice. On January 15, 2013, the Court dismissed Free’s claims and ordered it to pay to SFR €300,000 in damages for defamation and €100,000 for costs. Free appealed this decision.
Orange against SFR
On August 10, 2011, Orange filed a claim against SFR before the Paris Commercial Court. Orange asked the Court to compel SFR to stop the overflow traffic at the point of interconnection of their respective networks. On December 10, 2013, SFR was ordered to pay €22,133,512 to Orange.On January 10, 2014, SFR appealed this decision.
Complaint against Orange before the French Competition Authority
On August 9, 2010, SFR filed a complaint before the French Competition Authority against Orange for anti-competitive practices on the professional mobile market. This case is under investigation.
SFR against Orange
On April 24, 2012, SFR filed a complaint against Orange before the Paris Commercial Court for practices constituting an abuse of its dominant position in the secondary residence market. On February 12, 2014, the Paris Commercial Court ordered Orange to pay €51 million in damages.
Complaint lodged with the French Competition Authority by Orange Réunion, Orange Mayotte, and Outremer Télécom against Société Réunionnaise du Radiotéléphone (SRR)
Orange Réunion, Orange Mayotte and Outremer Télécom notified the French Competition Authority about alleged unfair price discrimination practices implemented by SRR. On September 16, 2009, the French Competition Authority imposed protective measures on SRR, pending its decision on the merits.
SRR was required to end price differences that exceed the costs borne by SRR based on the network called (off-net/on-net). The French Competition Authority found that SRR had not fully complied with the order it had imposed and, on January 24, 2012, ordered SRR to pay a fine of €2 million. With regard to the proceedings on the merits, on July 31, 2013, SRR signed a statement of no contest to grievances and a letter of commitments. Accordingly, the Deputy Reporter General will propose to the College of the French Competition Authority that the fine incurred by SRR be reduced.
Following the French Competition Authority’s decision of September 16, 2009, Outremer Télécom sued SRR on June 17, 2013, before the Paris Commercial Court for damages it claims to have suffered as a result of SRR’s practices. On November 13, 2013, the Court stayed the proceedings until the French Competition Authority issues its decision on the merits of the case.
Complaint of Bouygues Telecom against SFR and Orange in connection with the call termination and mobile markets
Bouygues Telecom brought a claim before the French Competition Council against SFR and Orange for certain alleged unfair trading practices in the call termination and mobile markets (“price scissoring”). On May 15, 2009, the French Competition Authority (the “Authority”) resolved to postpone its decision on the issue and remanded the case for further investigation. On December 13, 2010, SFR was heard on these allegations by the instructing magistrate. On August 18, 2011, SFR received a notification of grievances in which the Authority noted the existence of abusive price discrimination practices. On December 13, 2012, the Authority fined SFR €66 million. SFR has appealed this decision. The case will be argued before the Paris Court of Appeal on February 20, 2014.

Tuesday, February 25, 2014
Financial Report and Audited Consolidated Financial Statements for the Year Ended December 31, 2013 Vivendi /131
Following the decision of the French Competition Authority on December 13, 2012, Bouygues Telecom, OMEA and El Telecom (NRJ Mobile) brought a claim before the Paris Commercial Court against SFR for damages suffered. They are seeking damages of €623.6 million, €67.9 million and €28.6 million, respectively. SFR strongly disputes the validity and the amount, which Vivendi believes cannot, in any case, exceed €250 million in total, of these claims. Pending the decision of the Paris Court of Appeal, the mediation process underway in the Paris Commercial Court between Bouygues Telecom and SFR has been suspended.
UFC against SFR
On June 7, 2012, the French Federal Union of Consumers (UFC) filed a complaint against Orange before the Paris Court of First Instance (Tribunal de Grande Instance de Paris). It alleges that the general conditions of use of SFR’s La Carte offering contain abusive clauses, which it is seeking to have removed.
CLCV against SFR and others
On January 7, 2013, the French consumer protection association, CLCV (consumption, housing and quality of life) sued several French telecom operators, including SFR, before the Paris Tribunal of First Instance. It is seeking the removal of certain clauses that it considers abusive from subscription contracts.
Employee litigation arising from the transfer of customer relations centers in Toulouse, Lyon, and Poitiers
Following the transfer of the customer relations centers located in Toulouse and Lyon to the company Infomobile, and the center in Poitiers to a subsidiary of the Bertelsmann Group, former employees of these sites filed complaints with the industrial tribunals (Conseils de Prud'hommes) of each of these cities, claiming unfair execution of their employment contracts and fraudulent breach of Article L.1224-1 of the French Labor Code and the legal provisions relating to dismissal on economic grounds. The findings of the courts on this issue in 2013 were not consistent; the Court of Appeal of Toulouse sanctioned the SFR and Teleperformance groups in half of the cases while the courts of Poitiers and Lyon rendered judgments which were favorable to SFR. The cases are at different stages of the appeal process.
Disputes with independent distributors
SFR, like other companies that use an indirect distribution model, faces complaints by its distributors and, almost systematically, by its former distributors. These recurring disputes concern the abrupt termination of the contractual relationship, the abuse of economic dependence and/or requests for reclassification of a distributor as a commercial agent, and, more recently, applications for reclassification of a manager as a branch manager and reclassification of the employment contracts of the employees working at these points of sale as employment contracts with SFR. The French Court of Cassation rendered three judgments against SFR on the status of branch managers but the various Courts of Appeal have decided in favor of SFR. On the issue of abrupt termination of contractual relationships and the request for reclassification of employees of the distributor as employees of SFR, apart from a few rare exceptions the various courts have ruled in favor of SFR.
Parabole Réunion
In July 2007, the group Parabole Réunion filed a legal action before the Paris Tribunal of First Instance following the termination of its rights to exclusively distribute the TPS channels in Reunion Island, Mayotte, Madagascar and Mauritius. Pursuant to a decision dated September 18, 2007, Canal+ Group was prohibited, under fine, from allowing the broadcast by third parties of these channels or those replacement channels that have substituted these channels. Canal+ Group appealed this decision. In a ruling dated June 19, 2008, the Paris Court of Appeal partially reversed the judgment and stated that these replacement channels were not to be granted exclusively if the channels were made available to third parties prior to the merger with TPS. Parabole Réunion was again unsuccessful in its claims concerning the content of the channels in question. On September 19, 2008, Parabole Réunion appealed to the French Supreme Court. On November 10, 2009, the French Supreme Court dismissed the appeal brought by Parabole Réunion. In the context of this dispute, various jurisdictions have taken the opportunity to recall that in the event of the loss of the TPS Foot channel, Canal+ Group must make available to Parabole Réunion a channel of similar attractiveness. Non-compliance with this order would result in a penalty. On September 24, 2012, Parabole Réunion filed a claim
against Canal+ France, Canal+ Group and Canal+ Distribution before the enforcement magistrate of the Court of First Instance of Nanterre (Tribunal de grande instance de Nanterre) seeking enforcement of this fine (a request for such enforcement having been previously rejected by the enforcement magistrate of Nanterre, the Paris Court of Appeal and the French Supreme Court). On November 6, 2012, Parabole Réunion expanded its claim to cover the TPS Star, Cinecinema Classic, Cult and Star channels. On April 9, 2013, the enforcement magistrate dismissed in part Parabole Réunion’s claim and declared the rest inadmissible. He took care to recall that Canal+ Group had no legal obligation with respect to the content or the maintaining of programming on channels made available to Parabole Réunion. Parabole Réunion filed an appeal against this judgment.
In parallel, on August 11, 2009, Parabole Réunion filed a complaint against Canal+ Group before the Paris Tribunal of First Instance, requesting that the Tribunal order Canal+ Group to make available a channel with a level of attractiveness similar to that of TPS Foot in 2006 and to pay damages.
Tuesday, February 25, 2014
Financial Report and Audited Consolidated Financial Statements for the Year Ended December 31, 2013 Vivendi /132
On April 26, 2012, Parabole Réunion filed a complaint against Canal+ France, Canal+ Group and Canal+ Distribution before the Paris Tribunal of First Instance asking the Tribunal to acknowledge the failure of the companies of the Group to fulfill their contractual obligations to Parabole Réunion and their commitments to the Ministry of Economy.
These two actions have been consolidated into a single action.
Action brought by the French Competition Authority regarding practices in the pay-TV sector
On January 9, 2009, further to its voluntary investigation and a complaint by Orange, the French Competition Authority sent Vivendi and Canal+ Group a notification of allegations. It alleges that Canal+ Group has abused its dominant position in certain Pay-TV markets and that Vivendi and Canal+ Group colluded with TF1 and M6, on the one hand, and with Lagardère, on the other. Vivendi and Canal+ Group have each denied these allegations.
On November 16, 2010, the French Competition Authority rendered a decision in which it dismissed the allegations of collusion, in respect of all parties, and certain other allegations, in respect of Canal+ Group. The French Competition Authority requested further investigation regarding fiber optic TV and catch-up TV, Canal+ Group’s exclusive distribution rights on channels broadcast by the group and by independent channels as well as the extension of exclusive rights on TF1, M6 and Lagardère channels to fiber optic and catch-up TV. On October 30, 2013, the French Competition Authority took over the investigation into these aspects of the case.
Annulment of the decision authorizing the acquisition of Direct 8, Direct Star, Direct Productions, Direct Digital, and Bolloré Intermedia
In November 2012 and January 2013, TF1 and M6 submitted to the French Council of State an action for annulment of the decisions taken by the French Competition Authority and the CSA (French authority for media networks) authorizing the acquisition by Canal+ Group of Direct 8, Direct Star, Direct Productions, Direct Digital and Bolloré Intermedia.
On December 23, 2013, the French Council of State annulled the French Competition Authority’s decision with effect from July 1, 2014, and partially annulled the decision of the CSA. On January 15, 2014, the transaction was re-notified to the French Competition Authority.
Canal+ Group against TF1, M6, and France Télévision
On December 9, 2013, Canal+ Group filed a complaint with the French Competition Authority against the practices of the TF1, M6 and France Télévision groups in the original French-language film market. Canal+ Group accused them of inserting pre-emption rights into co-production contracts, in such a way as to discourage competition.
Canal+ Group against TF1, and TMC Régie
On June 12, 2013, Group Canal+ SA and Canal+ Régie filed a complaint with the French Competition Authority against the practices of TF1 and TMC Régie in the television advertising market. Group Canal+ SA and Canal+ Régie accused them of cross-promotion, having a single advertising division and refusing to promote the D8 channel during its launch.
Complaints against music industry majors in the United States
Several complaints have been filed before the Federal Courts in New York and California against Universal Music Group and the other music industry majors for alleged anti-competitive practices in the context of sales of CDs and Internet music downloads. These complaints have been consolidated before the Federal Court in New York. The motion to dismiss filed by the defendants was granted by the Federal Court, on October 9, 2008, but this decision was reversed by the Second Circuit Court of Appeals on January 13, 2010. The defendants filed a motion for rehearing which was denied. They filed a petition with the US Supreme Court which was rejected on January 10, 2011. The discovery process is underway. The Court has decided that the proceedings on class certification will be completed in the second half of 2014.
Complaints against UMG regarding royalties for digital downloads
Since 2011, as has been the case with other music industry majors, several purported class action complaints have been filed against UMG by recording artists generally seeking additional royalties for on line sales of music downloads and master ringtones. UMG contests the merits of these actions.
Koninklijke Philips Electronics against UMG
On April 30, 2008, Koninklijke Philips Electronics filed suit against UMG in the District Court for the Southern District of New York claiming breach of contract and patent infringement in connection with a license to manufacture CDs. On March 1, 2013, a jury rendered an unfavorable verdict against UMG. On August 8, 2013, the parties entered into a settlement agreement that ended this dispute.

Tuesday, February 25, 2014
Financial Report and Audited Consolidated Financial Statements for the Year Ended December 31, 2013 Vivendi /133
Telefonica against Vivendi in Brazil
On May 2, 2011, TELESP, Telefonica’s Brazilian subsidiary, filed a claim against Vivendi before the Civil Court of São Paulo (3ª Vara Cível do Foro Central da Comarca da Capital do Estado de São Paulo). The company is seeking damages for having been blocked from acquiring control of GVT and damages in the amount of 15 million Brazilian reals (currently approximately 4.7 million euros) corresponding to the expenses incurred by TELESP in connection with its offer for GVT. At the beginning of September, 2011, Vivendi filed an objection to jurisdiction, challenging the jurisdiction of the courts of São Paulo to hear a case involving parties from Curitiba. This objection was dismissed on February 14, 2012, which was confirmed on April 4, 2012 by the Court of Appeals.
On April 30, 2013, the Court dismissed Telefonica’s claim for lack of sufficient and concrete evidence of Vivendi’s responsibility for Telefonica’s failing to acquire GVT. The Court notably highlighted the inherently risky nature of operations in the financial markets, of which Telefonica must have been aware. Moreover, the Court dismissed Vivendi’s counterclaim for compensation for the damage it suffered as a result of the defamatory campaign carried out against it by Telefonica. On May 28, 2013, Telefonica appealed the Court’s decision to the 5th Chamber of Private Law of the Court of Justice of the State of São Paulo.
Dynamo against Vivendi
On August 24, 2011, the Dynamo investment funds filed a complaint for damages against Vivendi before the Bovespa Arbitration Chamber (São Paulo stock exchange). According to Dynamo, a former shareholder of GVT that sold the vast majority of its stake in the company before November 13, 2009 (the date on which Vivendi took control of GVT), the provision in GVT’s bylaws providing for an increase in the per share purchase price when the 15% threshold is crossed (the “poison pill provision”) should allegedly have applied to the acquisition by Vivendi. Vivendi, noting that this poison pill provision was waived by a GVT General Shareholders’ Meeting in the event of an acquisition by Vivendi or Telefonica, denies all of Dynamo’s allegations. The arbitral tribunal has been constituted and a hearing before the Bovespa Arbitration Chamber should be scheduled shortly. In parallel, on February 6, 2013, Dynamo filed an application with the 21st Federal Court of the capital of the State of Rio de Janeiro to compel CVM and Bovespa to provide the arbitral tribunal with confidential information relating to the acquisition of GVT by Vivendi. This was rejected on November 7, 2013 as the Court found that only the arbitral tribunal could make such an application. In late December, Dynamo requested that the arbitral tribunal submit an application for the confidential information from the judge.
Hedging-Griffo against Vivendi
On September 4, 2012, the Hedging-Griffo funds filed a complaint against Vivendi before the Arbitration Chamber of the Bovespa (São Paulo Stock Exchange) seeking to obtain damages for losses they allegedly incurred due to the conditions under which Vivendi completed the acquisition of GVT in 2009. On December 16, 2013, the arbitral tribunal was constituted and the plaintiffs submitted their initial briefs. The Hedging-Griffo funds demanded compensation for the difference between the price at which they sold their GVT shares on the market and 125% of the price paid by Vivendi in connection with the tender offer for the GVT shares, pursuant to the “poison pill” provision in GVT’s bylaws. Vivendi believes that the decision taken by the Hedging-Griffo funds to sell their GVT shares before the end of the stock market battle that opposed Vivendi against Telefonica was their own decision made in the context of their management of these funds and can in no way be attributable to Vivendi. It also denies any application of the bylaw provision mentioned above, as it was waived by a GVT General Shareholders’ Meeting in the event of an acquisition by Vivendi or Telefonica.
Actions related to the ICMS tax
GVT, like all other telecommunications operators, is party in several Brazilian States to various proceedings concerning the application of the “ICMS” tax Impostors Sober Circulaçãos de Mercadorias e Prestaçãos de Serviços (ICMS) is a tax on operations relating to the circulation of goods and the supply of transport, communication and electricity services.
GVT is notably a party to litigation in various Brazilian States concerning the application of the ICMS tax on voice telecommunication services. GVT argues that the ICMS tax should not apply to monthly plans. Of the 21 proceedings initiated by GVT, 19 have resulted in decisions favorable to GVT and 12 are no longer subject to appeal.
Action related to the FUST and FUNTTEL taxes in Brazil
The Brazilian tax authorities argue that the assessment of the taxes known as “FUST” (Fundo da Universalizaçãos dos Serviços de Telecomunicaçõs), a federal tax to promote the supply of telecommunications services throughout the whole Brazilian territory, including in areas that are not economically viable, and “FUNTTEL” (Fundo para Desenvolvimento Tecnológioco das Telecomunicações), a federal tax to finance technological investments in Brazilian telecommunications services, should be based on the company’s gross revenue without deduction for price reductions or interconnection expenses and other taxes, which would lead to part of that sum being subject to double taxation. GVT is challenging this interpretation and has secured a suspension of payment of the sums claimed by the tax authority from the federal judge.
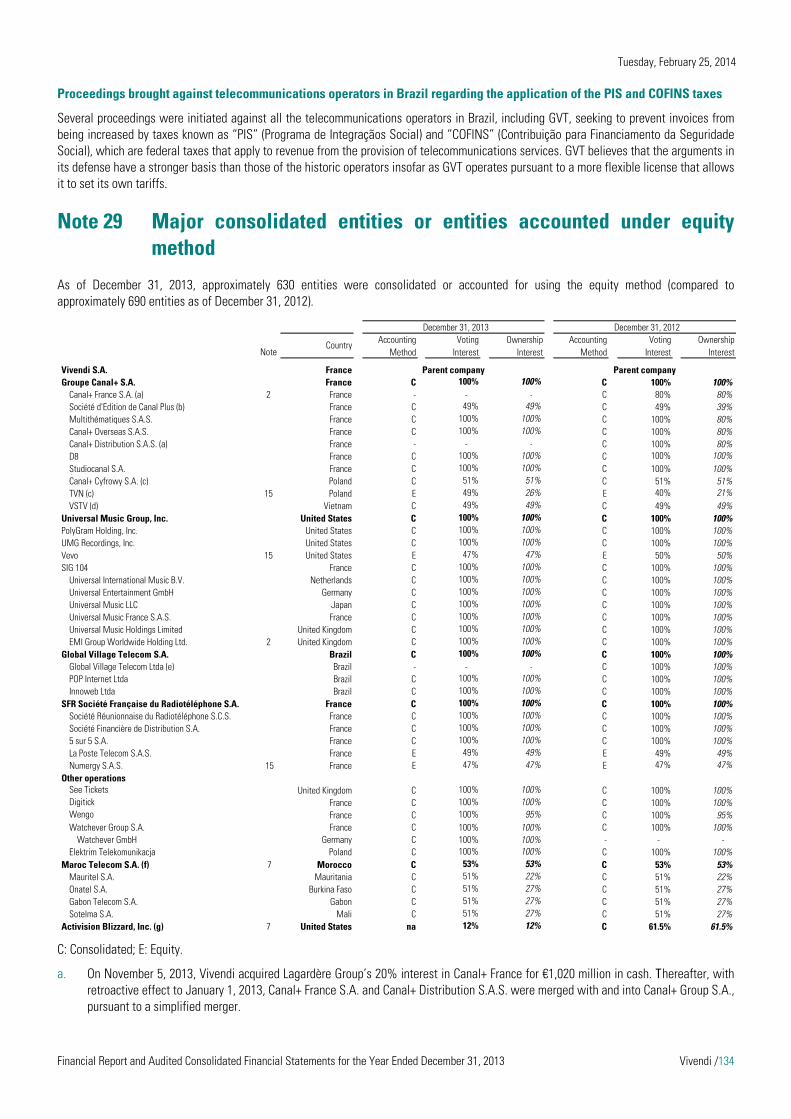
Tuesday, February 25, 2014
Financial Report and Audited Consolidated Financial Statements for the Year Ended December 31, 2013 Vivendi /134
Proceedings brought against telecommunications operators in Brazil regarding the application of the PIS and COFINS taxes
Several proceedings were initiated against all the telecommunications operators in Brazil, including GVT, seeking to prevent invoices from being increased by taxes known as “PIS” (Programa de Integraçãos Social) and “COFINS” (Contribuição para Financiamento da Seguridade Social), which are federal taxes that apply to revenue from the provision of telecommunications services. GVT believes that the arguments in its defense have a stronger basis than those of the historic operators insofar as GVT operates pursuant to a more flexible license that allows it to set its own tariffs.
Note 29 Major consolidated entities or entities accounted under equity method
As of December 31, 2013, approximately 630 entities were consolidated or accounted for using the equity method (compared to approximately 690 entities as of December 31, 2012).
C: Consolidated; E: Equity.
a. On November 5, 2013, Vivendi acquired Lagardère Group’s 20% interest in Canal+ France for €1,020 million in cash. Thereafter, with retroactive effect to January 1, 2013, Canal+ France S.A. and Canal+ Distribution S.A.S. were merged with and into Canal+ Group S.A., pursuant to a simplified merger.
December 31, 2013 December 31, 2012
Note
Vivendi S.A. FranceGroupe Canal+ S.A. France C 100% 100% C 100% 100%
Canal+ France S.A. (a) 2 France - - - C 80% 80%Société d'Edition de Canal Plus (b) France C 49% 49% C 49% 39%Multithématiques S.A.S. France C 100% 100% C 100% 80%Canal+ Overseas S.A.S. France C 100% 100% C 100% 80%Canal+ Distribution S.A.S. (a) France - - - C 100% 80%D8 France C 100% 100% C 100% 100%Studiocanal S.A. France C 100% 100% C 100% 100%Canal+ Cyfrowy S.A. (c) Poland C 51% 51% C 51% 51%TVN (c) 15 Poland E 49% 26% E 40% 21%VSTV (d) Vietnam C 49% 49% C 49% 49%
Universal Music Group, Inc. United States C 100% 100% C 100% 100%PolyGram Holding, Inc. United States C 100% 100% C 100% 100%UMG Recordings, Inc. United States C 100% 100% C 100% 100%Vevo 15 United States E 47% 47% E 50% 50%SIG 104 France C 100% 100% C 100% 100%
Universal International Music B.V. Netherlands C 100% 100% C 100% 100%Universal Entertainment GmbH Germany C 100% 100% C 100% 100%Universal Music LLC Japan C 100% 100% C 100% 100%Universal Music France S.A.S. France C 100% 100% C 100% 100%Universal Music Holdings Limited United Kingdom C 100% 100% C 100% 100%EMI Group Worldwide Holding Ltd. 2 United Kingdom C 100% 100% C 100% 100%
Global Village Telecom S.A. Brazil C 100% 100% C 100% 100%Global Village Telecom Ltda (e) Brazil - - - C 100% 100%POP Internet Ltda Brazil C 100% 100% C 100% 100%Innoweb Ltda Brazil C 100% 100% C 100% 100%
SFR Société Française du Radiotéléphone S.A. France C 100% 100% C 100% 100%Société Réunionnaise du Radiotéléphone S.C.S. France C 100% 100% C 100% 100%Société Financière de Distribution S.A. France C 100% 100% C 100% 100%5 sur 5 S.A. France C 100% 100% C 100% 100%La Poste Telecom S.A.S. France E 49% 49% E 49% 49%Numergy S.A.S. 15 France E 47% 47% E 47% 47%
Other operations 0% 0%See Tickets United Kingdom C 100% 100% C 100% 100%Digitick France C 100% 100% C 100% 100%Wengo France C 100% 95% C 100% 95%Watchever Group S.A. France C 100% 100% C 100% 100%
Watchever GmbH Germany C 100% 100% - - - Elektrim Telekomunikacja Poland C 100% 100% C 100% 100%
Maroc Telecom S.A. (f) 7 Morocco C 53% 53% C 53% 53%Mauritel S.A. Mauritania C 51% 22% C 51% 22%Onatel S.A. Burkina Faso C 51% 27% C 51% 27%Gabon Telecom S.A. Gabon C 51% 27% C 51% 27%Sotelma S.A. Mali C 51% 27% C 51% 27%
Activision Blizzard, Inc. (g) 7 United States na 12% 12% C 61.5% 61.5%
AccountingMethod
VotingInterest
Ownership Interest
Parent company
Country AccountingMethod
VotingInterest
Ownership Interest
Parent company

Tuesday, February 25, 2014
Financial Report and Audited Consolidated Financial Statements for the Year Ended December 31, 2013 Vivendi /135
b. Vivendi consolidated Société d’Edition de Canal Plus because (i) Vivendi has majority control over the board of directors, (ii) no other shareholder or shareholder group is in a position to exercise substantive participating rights that would allow them to veto or block decisions taken by Vivendi and (iii) Vivendi assumes the majority of risks and benefits pursuant to an agreement with this company via Canal+ Distribution S.A.S.. Indeed, Canal+ Distribution, wholly-owned by Vivendi, guarantees this company’s results in return for exclusive commercial rights to its subscriber base.
c. Following the merger of Canal+ Cyfrowy (Cyfra+’s platform) with ITI Neovision (TVN’s “n” platform) on November 30, 2012, Canal+ Group holds a 51% interest in Canal+ Cyfrowy, which owns 100% of ITI Neovision and formed the new group ”nc+”. As Canal+ Group has the majority on the Supervisory Board and the power to govern financial and operating policies of ”nc+”, the latter is consolidated by Canal+ Group. At the same time, Canal+ Group acquired a 40% interest in N-Vision, which indirectly holds a 52% interest in TVN. On December 18, 2013, ITI exercised its put option to sell a 9% interest in N-Vision to Canal+ Group: Canal+ Group’s ownership interest in N-Vision thus increased to 49% (please refer to Note 27).
d. VSTV (Vietnam Satellite Digital Television Company Limited) is 49% held by Canal+ Group and 51% by VCTV, a VTV subsidiary (the Vietnamese public television company). This company has been consolidated by Vivendi given that Canal+ Group has both operational and financial control over it due to a general delegation that was granted by the majority shareholder and to the company’s bylaws.
e. In 2013, Vivendi reorganized the legal chain of ownership of GVT’s shares and notably merged Global Village Telecom Ltda’s operational activities with GVT’s holding company Global Village Telecom SA.
f. On November 4, 2013, Vivendi and Etisalat entered into a definitive agreement for the sale of Vivendi’s 53% interest in Maroc Telecom group (please refer to Note 7).
g. On October 11, 2013, Vivendi deconsolidated Activision Blizzard pursuant to the sale of 88% of its interest. As of December 31, 2013, Vivendi retained 83 million Activision Blizzard shares, representing 12% of Activision Blizzard’s outstanding share capital. This interest was accounted for as an asset of discontinued business in Vivendi’s Consolidated Financial Statement Position (please refer to Note 7).
Note 30 Statutory auditors fees
Fees paid by Vivendi SA to its statutory auditors and members of their firms in 2013 and 2012 were as follows:
The 2012 fees included the non-recurring assignments undertaken by statutory auditors in relation to the transactions underway.
KPMG S.A. Ernst & Young et AutresAmount Percentage Amount Percentage
(in millions of euros) 2013 2012 2013 2012 2013 2012 2013 2012 2013 2012
Statutory audit, certification, consolidated and individual financial statements audit
Issuer 0.7 0.7 10% 7% 0.9 0.9 13% 12% 1.6 1.6Fully consolidated subsidiaries 4.2 4.1 60% 42% 5.6 5.1 80% 69% 9.8 9.2
Other work and services directly related to the statutory audit
Issuer 0.4 0.6 6% 6% - 0.1 - 1% 0.4 0.7Fully consolidated subsidiaries 0.7 2.7 10% 28% 0.1 0.4 1% 5% 0.8 3.1
Subtotal 6.0 8.1 86% 83% 6.6 6.5 94% 87% 12.6 14.6
Other services provided by the network to fully consolidated subsidiaries
Legal, tax and social matters 0.7 1.2 10% 12% 0.3 0.9 5% 12% 1.0 2.1Other 0.3 0.4 4% 5% 0.1 0.1 1% 1% 0.4 0.5
Subtotal 1.0 1.6 14% 17% 0.4 1.0 6% 13% 1.4 2.6
Total 7.0 9.7 100% 100% 7.0 7.5 100% 100% 14.0 17.2
Total

Tuesday, February 25, 2014
Financial Report and Audited Consolidated Financial Statements for the Year Ended December 31, 2013 Vivendi /136
Note 31 Audit exemptions for UMG subsidiaries in the United Kingdom
Vivendi S.A. has provided guarantees to the following UMG subsidiaries, incorporated in England and Wales, under the registered number indicated, in order for them to claim exemptions from audit, with respect to fiscal year 2013, under section 479A of the UK Companies Act 2006.
Name Company Number
BACKCITE LIMITED 2358972BOILER ROOM MANAGEMENT LIMITED 07908059CENTENARY UK LIMITED 03478918DALMATIAN SONGS LIMITED 03506757DECCA MUSIC GROUP LIMITED 718329DUB DUB PRODUCTIONS LIMITED 3034298EGW USD 8107589EMI OVERSEAS HOLDINGS LIMITED 403200EMI CATALOGUE INVESTMENTS HOLLAND LIMITED 3038313EMI GROUP AMERICA FINANCE LIMITED 2415597EMI GROUP DANISH INVESTMENTS LIMITED 2421891EMI GROUP ELECTRONICS LIMITED 461611EMI GROUP FINANCE DENMARK LIMITED 2422007EMI GROUP HOLDINGS (UK) 3158108EMI GROUP WORLDWIDE 3158106EMI INVESTMENTS HOLLAND LIMITED 3038307EMI RECORDED MUSIC (CHILE) LIMITED 07934340EMI RECORDED MUSIC HOLDINGS (ITALY) LIMITED 6420969EMI RECORDED MUSIC HOLDINGS (UK) LIMITED 6407212EMI RECORDS GERMANY HOLDCO LIMITED 6420927EMI RECORDS ITALY HOLDCO LIMITED 6420934EMI RECORDS UK HOLDCO LIMITED 6388809EMI UK HOLDINGS 255852EMIG 4 LIMITED 3038275F.L.U.M MANAGEMENT LIMITED 07908238 GLOBE PRODUCTIONS LIMITED 05489649 JAYDONE LIMITED 4631083 LOUDCLOTHING.COM LIMITED 06854812 MAWLAW 388 LIMITED 3590255 RELENTLESS 2006 LIMITED 3967906 UMGI (ATW) LIMITED 05103127UNIVERSAL MUSIC (UK) HOLDINGS LIMITED 3383881 UNIVERSAL MUSIC ARTS & ENTERTAINMENT LIMITED 859087UNIVERSAL MUSIC HOLDINGS (UK) LIMITED 337803UNIVERSAL MUSIC LEISURE LIMITED 3384487UNIVERSAL MUSIC PUBLISHING BL LIMITED 02037678UNIVERSAL MUSIC PUBLISHING INTERNATIONAL MGB LIMITED 02200287UNIVERSAL MUSIC PUBLISHING MGB HOLDING UK LIMITED 05092413UNIVERSAL MUSIC PUBLISHING PGM LIMITED 3771282UNIVERSAL SRG (UB40) LIMITED 05158521UNIVERSAL SRG (W.A.R.) LIMITED 05221402UNIVERSAL SRG ARTIST SERVICES LIMITED 01890289UNIVERSAL SRG GROUP LIMITED 00284340UNIVERSAL SRG MUSIC PUBLISHING LIMITED 02898402UNIVERSAL SRG STUDIOS LIMITED 03050388UNIVERSAL/ANXIOUS MUSIC LIMITED 01862328UNIVERSAL/DICK JAMES MUSIC LIMITED 698804UNIVERSAL/ISLAND MUSIC LIMITED 761597UNIVERSAL/MCA MUSIC LIMITED 410065UNIVERSAL/MOMENTUM MUSIC 2 LIMITED 2850484UNIVERSAL/MOMENTUM MUSIC LIMITED 1946456VIRGIN MUSIC GROUP 2259349VIRGIN RECORDS OVERSEAS LIMITED 335444V2 MUSIC GROUP LIMITED 03205625
Tuesday, February 25, 2014
Financial Report and Audited Consolidated Financial Statements for the Year Ended December 31, 2013 Vivendi /137
Note 32 Subsequent events
The main events that occurred between December 31, 2013 and February 19, 2014, the date of the Management Board meeting that approved the financial statements for fiscal year 2013 are as follows:
on January 14, 2014: Canal+ Group won the exclusive broadcasting rights to the national French Rugby Championship “TOP 14” for five seasons (2014-2015 to 2018-2019). These rights relate to all of the TOP 14 matches, across all media and all territories;
on January 31, 2014, SFR and Bouygues Telecom entered into a strategic agreement to share a portion of their mobile access networks; and
on February 13, 2014, Vivendi entered into exclusive negotiations with Belgacom to acquire 100% of its subsidiary Telindus France Group, a leader on the French markets of telecommunication integration and networks. Once signed, the transaction will be submitted to the French competition authority approval.
Note 33 Adjustment of comparative information
As from the second quarter of 2013, in compliance with IFRS 5, Activision Blizzard and Maroc Telecom group have been reported in Vivendi’s Consolidated Statement of Earnings, Statement of Cash Flows, and Statement of Financial Position as discontinued operations. In practice, these two businesses have been reported as follows:
their contribution to each line of Vivendi’s Consolidated Statement of Earnings (before non-controlling interests) has been grouped under the line “Earnings from discontinued operations”, until their effective sale. In accordance with IFRS 5, these adjustments have been applied to all periods presented to ensure consistency of information; and
their contribution to each line of Vivendi’s Consolidated Statement of Cash Flows has been grouped under the line “Cash flows from discontinued operations” until their effective sale. In accordance with IFRS 5, these adjustments have been applied to all periods presented to ensure consistency of information.
Moreover, data published with respect to fiscal year 2012 was adjusted following the application of amended IAS 19, whose application is mandatory in the European Union beginning on or after January 1, 2013 (please refer to Note 1).
As a result, the 2012 and first quarter of 2013 Financial Statements were adjusted, as applicable.

Tuesday, February 25, 2014
Financial Report and Audited Consolidated Financial Statements for the Year Ended December 31, 2013 Vivendi /138
33.1 Adjustments made to the main aggregates of the Consolidated Statement of Earnings
33.2 Adjustments related to charges and income directly recognized in equity
2012
(in millions of euros, except per share amounts)
Three months ended March 31,
Three months ended June 30,
Six months ended June 30,
Three months ended September
30,
Earnings before interest and income taxes (EBIT) (as previously published) 1,493 1,082 2,575 1,259Reclassifications related to the application of IFRS 5 for Activision Blizzard - 393 - 175 - 568 - 182Reclassifications related to the application of IFRS 5 for Maroc Telecom Group - 266 - 183 - 449 - 261Adjustments related to the application of amended IAS 19
Selling, general and administrative expenses + 2 + 2 + 4 + 2
Earnings before interest and income taxes (EBIT) (restated) 836 726 1,562 818
Earnings attributable to Vivendi SA shareowners (as previously published) 697 463 1,160 491Adjustments related to the application of amended IAS 19
Selling, general and administrative expenses + 2 + 2 + 4 + 2Other financial charges - + 1 + 1 -Provision for income taxes - - - -
Earnings attributable to Vivendi SA shareowners (restated) 699 466 1,165 493
Earnings attributable to Vivendi SA shareowners per share - basic (as previously published) 0.54 0.36 0.90 0.38Earnings attributable to Vivendi SA shareowners per share - basic (restated) 0.54 0.36 0.91 0.38
2012 2013
(in millions of euros, except per share amounts)
Nine months ended September
30,
Three months ended December
31,
Year ended December 31,
Three months ended March 31,
Earnings before interest and income taxes (EBIT) (as previously published) 3,834 (956) 2,878 1,178Reclassifications related to the application of IFRS 5 for Activision Blizzard - 750 - 378 - 1,128 - 440Reclassifications related to the application of IFRS 5 for Maroc Telecom Group - 710 - 252 - 962 - 266Adjustments related to the application of amended IAS 19
Selling, general and administrative expenses + 6 + 11 + 17 na
Earnings before interest and income taxes (EBIT) (restated) 2,380 (1,575) 805 472
Earnings attributable to Vivendi SA shareowners (as previously published) 1,651 (1,487) 164 534Adjustments related to the application of amended IAS 19
Selling, general and administrative expenses + 6 + 11 + 17 naOther financial charges + 1 - + 1 naProvision for income taxes - - 3 - 3 na
Earnings attributable to Vivendi SA shareowners (restated) 1,658 (1,479) 179 534
Earnings attributable to Vivendi SA shareowners per share - basic (as previously published) 1.28 (1.12) 0.13 0.40Earnings attributable to Vivendi SA shareowners per share - basic (restated) 1.28 (1.12) 0.14 0.40
Year ended December 31, 2012
(in millions of euros) Published
Application of amended
IAS 19 Restated
Earnings 949 + 15 964
Actuarial gains/(losses) related to employee defined benefit plans, net - - 61 (61)Items not reclassified to profit or loss - - 61 (61)
Foreign currency translation adjustments (605) - (605)Unrealized gains/(losses), net 103 - 103
of which Cash flow hedge instruments 22 - 22Net investment hedge instruments 17 - 17Tax 1 - 1
Hedging instruments, net 40 - 40Assets available for sale, net 63 - 63
Other impacts, net - - -Items to be subsequently reclassified to profit or loss (502) - (502)
Charges and income directly recognized in equity (502) - 61 (563)
Total comprehensive income 447 - 46 401
of whichTotal comprehensive income attributable to Vivendi SA shareowners (317) - 45 (362)Total comprehensive income attributable to non-controlling interests 764 - 1 763
Tuesday, February 25, 2014
Financial Report and Audited Consolidated Financial Statements for the Year Ended December 31, 2013 Vivendi /139
33.3 Adjustments made to the Statements of Financial Position
(in millions of euros) December 31, 2012 December 31, 2012 December 31, 2011 January 1st, 2012Published Restated Published Restated
ASSETSGoodwill 24,656 - 24,656 25,029 - 25,029Non-current content assets 3,327 - 3,327 2,485 - 2,485Other intangible assets 5,190 - 5,190 4,329 - 4,329Property, plant and equipment 9,926 - 9,926 9,001 - 9,001Investments in equity affiliates 388 - 388 135 - 135Non-current financial assets 514 - 26 488 394 - 15 379Deferred tax assets 1,400 + 45 1,445 1,421 + 26 1,447Non-current assets 45,401 + 19 45,420 42,794 + 11 42,805
Inventories 738 - 738 805 - 805Current tax receivables 819 - 819 542 - 542Current content assets 1,044 - 1,044 1,066 - 1,066Trade accounts receivable and other 6,587 - 6,587 6,730 - 6,730Current financial assets 364 - 364 478 - 478Cash and cash equivalents 3,894 - 3,894 3,304 - 3,304
13,446 - 13,446 12,925 - 12,925Assets held for sale 667 - 667 - - -Current assets 14,113 - 14,113 12,925 - 12,925
TOTAL ASSETS 59,514 + 19 59,533 55,719 + 11 55,730
EQUITY AND LIABILITIESShare capital 7,282 - 7,282 6,860 - 6,860Additional paid-in capital 8,271 - 8,271 8,225 - 8,225Treasury shares (25) - (25) (28) - (28)Retained earnings and other 2,937 - 140 2,797 4,390 - 95 4,295Vivendi SA shareowners' equity 18,465 - 140 18,325 19,447 - 95 19,352Non-controlling interests 2,971 - 5 2,966 2,623 - 4 2,619Total equity 21,436 - 145 21,291 22,070 - 99 21,971
Non-current provisions 3,094 + 164 3,258 1,569 + 110 1,679Long-term borrowings and other financial liabilities 12,667 - 12,667 12,409 - 12,409Deferred tax liabilities 991 - 991 728 - 728Other non-current liabilities 1,002 - 1,002 864 - 864Non-current liabilities 17,754 + 164 17,918 15,570 + 110 15,680
Current provisions 711 - 711 586 - 586Short-term borrowings and other financial liabilities 5,090 - 5,090 3,301 - 3,301Trade accounts payable and other 14,196 - 14,196 13,987 - 13,987Current tax payables 321 - 321 205 - 205
20,318 - 20,318 18,079 - 18,079Liabilities associated with assets held for sale 6 - 6 - - -Current liabilities 20,324 - 20,324 18,079 - 18,079
Total liabilities 38,078 + 164 38,242 33,649 + 110 33,759
TOTAL EQUITY AND LIABILITIES 59,514 + 19 59,533 55,719 + 11 55,730
Application of amended IAS 19
Application of amended IAS 19
Tuesday, February 25, 2014
Financial Report and Audited Consolidated Financial Statements for the Year Ended December 31, 2013 Vivendi /140
33.4 Adjustments made to the Statements of Cash Flows
a. Includes Activision Blizzard and Maroc Telecom group (please refer to Note 7).
Year ended December 31, 2012
(in millions of euros) Published
Reclassificationsrelated toIFRS 5 (a)
Application ofamended
IAS19 Restated
Operating activitiesEBIT 2,878 - 2,090 + 17 805Adjustments 5,199 - 726 - 17 4,456 Including amortization and depreciation of tangible and intangible assets 3,929 - 654 - 3,275 Including reserve accrual regarding the Liberty Media Corporation litigation in the United States 945 - - 945 Including other income from EBIT (22) + 3 - (19) Including other charges from EBIT 235 + 1 - 236Content investments, net (299) + 154 - (145)Gross cash provided by operating activities before income tax paid 7,778 - 2,662 - 5,116Other changes in net working capital 90 - 21 - 69Net cash provided by operating activities before income tax paid 7,868 - 2,683 - 5,185Income tax paid, net (762) + 409 - (353)Net cash provided by operating activities of continuing operations 7,106 - 2,274 - 4,832Net cash provided by operating activities of discontinued operations - + 2,274 - 2,274Net cash provided by operating activities 7,106 - - 7,106
Investing activitiesCapital expenditures (4,516) + 517 - (3,999)Purchases of consolidated companies, after acquired cash (1,374) - - (1,374)Investments in equity affiliates (322) - - (322)Increase in financial assets (99) + 64 - (35)Investments (6,311) + 581 - (5,730)Proceeds from sales of property, plant, equipment and intangible assets 26 - 3 - 23Proceeds from sales of consolidated companies, after divested cash 13 - - 13Disposal of equity affiliates 11 - - 11Decrease in financial assets 215 - 35 - 180Divestitures 265 - 38 - 227Dividends received from equity affiliates 3 - - 3Dividends received from unconsolidated companies 1 - - 1Net cash provided by/(used for) investing activities of continuing operations (6,042) + 543 - (5,499)Net cash provided by/(used for) investing activities of discontinued operations - - 543 - (543)Net cash provided by/(used for) investing activities (6,042) - - (6,042)
Financing activitiesNet proceeds from issuance of common shares in connection with Vivendi SA's share-based compensation plans 131 - - 131Sales/(purchases) of Vivendi SA's treasury shares (18) - - (18)Dividends paid by Vivendi SA to its shareowners (1,245) - - (1,245)Other transactions with shareowners (229) + 228 - (1)Dividends paid by consolidated companies to their non-controlling interests (483) + 450 - (33)Transactions with shareowners (1,844) + 678 - (1,166)Setting up of long-term borrowings and increase in other long-term financial liabilities 5,859 - 26 - 5,833Principal payment on long-term borrowings and decrease in other long-term financial liabilities (4,217) + 6 - (4,211)Principal payment on short-term borrowings (2,615) + 121 - (2,494)
Other changes in short-term borrowings and other financial liabilities 3,056 - 248 - 2,808Interest paid, net (568) + 24 - (544)Other cash items related to financial activities (98) + 2 - (96)Transactions on borrowings and other financial liabilities 1,417 - 121 - 1,296Net cash provided by/(used for) financing activities of continuing operations (427) + 557 - 130Net cash provided by/(used for) financing activities of discontinued operations - - 557 - (557)Net cash provided by/(used for) financing activities (427) - - (427)
Foreign currency translation adjustments of continuing operations (47) + 18 - (29)Foreign currency translation adjustments of discontinued operations - - 18 - (18)
Change in cash and cash equivalents 590 - - 590
Reclassification of cash and cash equivalents from discontinued operations - - - -
Cash and cash equivalentsAt beginning of the period 3,304 - - 3,304
At end of the period 3,894 - - 3,894