Financial Report 2019 - Yamada Denki...Financial Report 2019 Fiscal year ended March 31, 2019 YAMADA...
83
Financial Report 2019 Fiscal year ended March 31, 2019 YAMADA DENKI CO., LTD. 1-1, Sakae-cho, Takasaki-shi, Gunma 370-0841 Japan
Transcript of Financial Report 2019 - Yamada Denki...Financial Report 2019 Fiscal year ended March 31, 2019 YAMADA...

Financial Report 2019 Fiscal year ended March 31, 2019
YAMADA DENKI CO., LTD. 1-1, Sakae-cho, Takasaki-shi, Gunma 370-0841 Japan
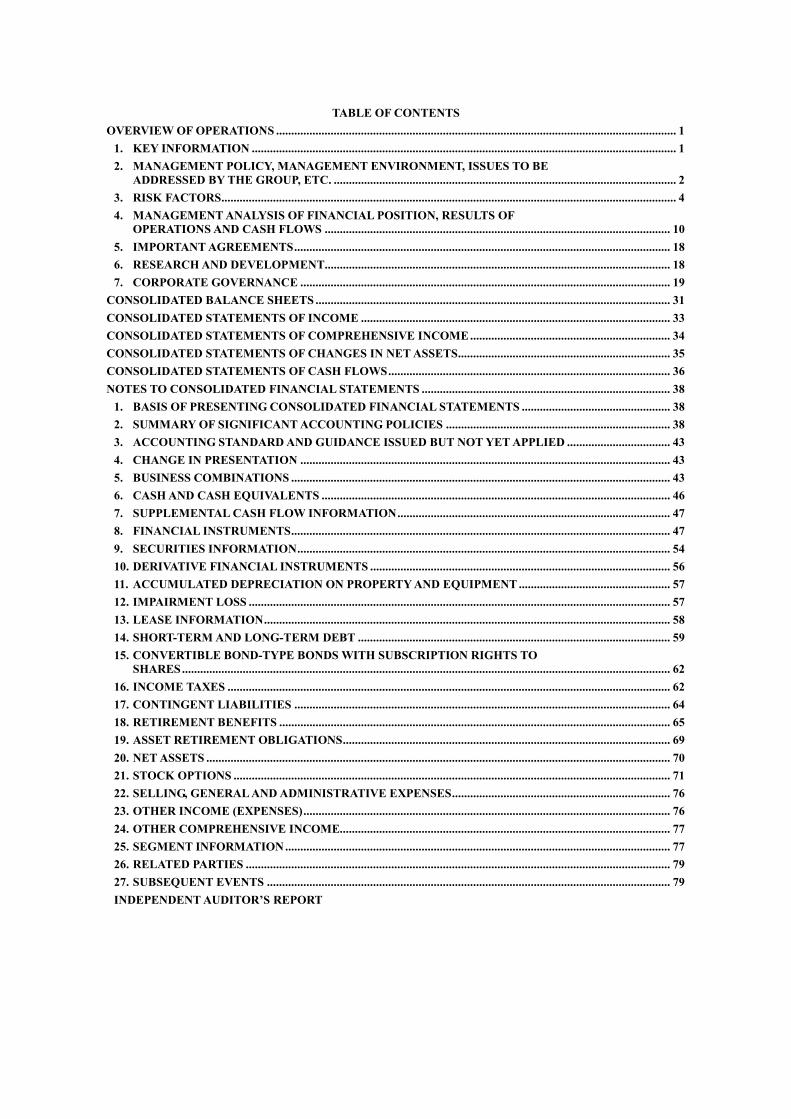
TABLE OF CONTENTS OVERVIEW OF OPERATIONS .................................................................................................................................... 1
1. KEY INFORMATION ............................................................................................................................................ 1 2. MANAGEMENT POLICY, MANAGEMENT ENVIRONMENT, ISSUES TO BE
ADDRESSED BY THE GROUP, ETC. ................................................................................................................. 2 3. RISK FACTORS ...................................................................................................................................................... 4 4. MANAGEMENT ANALYSIS OF FINANCIAL POSITION, RESULTS OF
OPERATIONS AND CASH FLOWS .................................................................................................................. 10 5. IMPORTANT AGREEMENTS ............................................................................................................................ 18 6. RESEARCH AND DEVELOPMENT .................................................................................................................. 18 7. CORPORATE GOVERNANCE .......................................................................................................................... 19
CONSOLIDATED BALANCE SHEETS ..................................................................................................................... 31 CONSOLIDATED STATEMENTS OF INCOME ...................................................................................................... 33 CONSOLIDATED STATEMENTS OF COMPREHENSIVE INCOME .................................................................. 34 CONSOLIDATED STATEMENTS OF CHANGES IN NET ASSETS ...................................................................... 35 CONSOLIDATED STATEMENTS OF CASH FLOWS ............................................................................................. 36 NOTES TO CONSOLIDATED FINANCIAL STATEMENTS .................................................................................. 38
1. BASIS OF PRESENTING CONSOLIDATED FINANCIAL STATEMENTS ................................................. 38 2. SUMMARY OF SIGNIFICANT ACCOUNTING POLICIES .......................................................................... 38 3. ACCOUNTING STANDARD AND GUIDANCE ISSUED BUT NOT YET APPLIED .................................. 43 4. CHANGE IN PRESENTATION .......................................................................................................................... 43 5. BUSINESS COMBINATIONS ............................................................................................................................. 43 6. CASH AND CASH EQUIVALENTS ................................................................................................................... 46 7. SUPPLEMENTAL CASH FLOW INFORMATION .......................................................................................... 47 8. FINANCIAL INSTRUMENTS ............................................................................................................................. 47 9. SECURITIES INFORMATION ........................................................................................................................... 54 10. DERIVATIVE FINANCIAL INSTRUMENTS ................................................................................................... 56 11. ACCUMULATED DEPRECIATION ON PROPERTY AND EQUIPMENT .................................................. 57 12. IMPAIRMENT LOSS ........................................................................................................................................... 57 13. LEASE INFORMATION ...................................................................................................................................... 58 14. SHORT-TERM AND LONG-TERM DEBT ....................................................................................................... 59 15. CONVERTIBLE BOND-TYPE BONDS WITH SUBSCRIPTION RIGHTS TO
SHARES ................................................................................................................................................................. 62 16. INCOME TAXES .................................................................................................................................................. 62 17. CONTINGENT LIABILITIES ............................................................................................................................ 64 18. RETIREMENT BENEFITS ................................................................................................................................. 65 19. ASSET RETIREMENT OBLIGATIONS ............................................................................................................ 69 20. NET ASSETS ......................................................................................................................................................... 70 21. STOCK OPTIONS ................................................................................................................................................ 71 22. SELLING, GENERAL AND ADMINISTRATIVE EXPENSES ........................................................................ 76 23. OTHER INCOME (EXPENSES) ......................................................................................................................... 76 24. OTHER COMPREHENSIVE INCOME............................................................................................................. 77 25. SEGMENT INFORMATION ............................................................................................................................... 77 26. RELATED PARTIES ............................................................................................................................................ 79 27. SUBSEQUENT EVENTS ..................................................................................................................................... 79 INDEPENDENT AUDITOR’S REPORT

1
OVERVIEW OF OPERATIONS Yamada Denki Co., Ltd. and Consolidated Subsidiaries
March 31, 2019 1. KEY INFORMATION
Millions of yen, unless otherwise noted
Thousands of
U.S. dollars, unless
otherwise noted
(Note 2) As of and year ended March 31 2015 2016 2017 2018 2019 2019
Net sales (Note 1) ············ 1,664,371 1,612,736 1,563,056 1,573,873 1,600,583 14,418,371
Ordinary profit ·············· 35,538 62,734 66,040 47,336 36,889 332,306
Profit attributable to owners of parent ········ 9,341 30,396 34,528 29,780 14,692 132,354
Comprehensive income ···· 10,409 32,556 39,373 29,263 13,674 123,184
Net assets····················· 509,398 557,722 585,548 588,740 591,593 5,329,188
Total assets ··················· 1,122,408 1,146,723 1,159,457 1,175,568 1,184,042 10,666,085
Net assets per share (yen) ······················ 643.04 666.03 697.47 731.57 723.56 6.52
(dollars)
Basic earnings per share (yen) ······················ 11.74 38.22 43.00 36.78 18.19 0.16
(dollars)
Diluted earnings per share (yen) ······················ 11.72 38.16 42.89 36.66 18.08 0.16
(dollars)
Equity ratio (%) ············· 43.2 46.6 48.4 49.8 49.7
Return on equity (%) ······· 1.8 6.0 6.3 5.2 2.5
Price earnings ratio (times) ···················· 42.18 13.92 12.91 17.35 30.02
Cash flows from operating activities ······
22,983
(23)
43,856
61,689
36,023
324,507
Cash flows from investing activities ······
(20,233)
(13,437)
(15,279)
(12,668)
(8,469)
(76,293)
Cash flows from financing activities ······
(41,488)
4,733
(24,382)
(32,920)
(27,461)
(247,375)
Cash and cash equivalents at end of year ·············
39,692
30,665
34,982
51,327
51,176
460,997
Employees (persons) ········[Average number of temporary employees not included in the above number (persons)] ··········
20,405
[10,704]
19,183
[10,219]
19,238
[9,670]
19,752
[9,577]
18,853
[9,520]
Notes: 1. Net sales do not include consumption tax.
2. For the convenience of readers outside Japan, U.S. dollar amounts have been converted from yen using the prevailing exchange rate at March 31, 2019, which was ¥111.01 to U.S. $1.
2
2. MANAGEMENT POLICY, MANAGEMENT ENVIRONMENT, ISSUES TO BE ADDRESSED BY THE GROUP, ETC.
Items in the text below that concern the future were determined by Yamada Denki Group (the “Group”) as of the end of the fiscal year under review.
(1) Basic Policy of Corporate Management
With sustainable corporate growth as its basic policy, the Group believes in the basic principle of rapidly responding to increasingly sophisticated and diversified consumer needs, and it aims to increase corporate value through practicing its management philosophy of “Creation and Challenge” and “Appreciation and Trust,” by constantly sticking to the “Principle of Customer (Market) First.” In addition, the Group strives for low-cost management with importance placed on cash flow while it aims to be a “Strong Company” that can contribute to society by actively promoting CSR-oriented operations as a leading company in the consumer electrical appliance retail industry.
(2) Management Indicator Used as Target
The Group sets its targets using an ordinary profit to net sales ratio of 5% or higher as a target management indicator.
(3) Medium- to Long-Term Management Strategy
The Group possesses a network unlike any other in the world, capable of meeting every need of our customers through various store formats nationwide from those in urban centers to those in suburbs and community-based retail areas. While utilizing this strength, the Group, as an industry-leading company, proactively engages in flexible approaches to address issues faced not just by the electrical appliance retail industry but by the entire retail and distribution industry, such as the future effects of declining birthrate and aging of the population, population decline, and the Internet-based society. The Group will continue to take on various challenges such as these with the aim of achieving sustainable growth and development in the future.
Centering on the retail sale of electric appliances, in addition to working to amplify our proposals encompassing homes in their entirety, entailing residences, renovations, housing equipment, and furniture and accessories with respect to living spaces designed to be coordinated with electrical appliances, the Group is strengthening and promoting online sales leveraging strengths of its online and retail store network, and its distribution network, and combining stores. Furthermore, the Company will promote a shift to a new “house lifestyles IoT network solutions business,” from its previous business exclusively involving electrical appliances, based on its long-term vision of acting as “one of Japan’s largest network and services Internet of Things (IoT) companies.”
The Group expects the future will bring more tremendous change to the retail and distribution industry. In order to respond flexibly to these changes with the appropriate sense of urgency, the Group is improving the efficiency of business resources by optimizing and maximizing the people (human resources), things (products), money, services, logistics, information systems, etc. existing among the companies of the Group to improve the profit margin, reduce various costs, enhance inventory efficiency, and generate cash flows, thereby reinforcing the Group’s financial standing and strengthening the foundation for business resources.
(4) Management Environment and Issues to Be Addressed
Looking ahead to the fiscal year ending March 31, 2020, the outlook for the economy continues to be uncertain despite a likely scenario of continued moderate recovery amid ongoing improvement in the jobs and income environment, due to factors that include prolonged trade friction brought about by trade policy in the U.S., negotiations over the United Kingdom’s withdrawal from the European Union, economic slowdown in China, and effects of volatility in financial and capital markets.

3
In the retail industry overall, prudent buying behavior and a tendency toward frugality are likely to persist amid increasingly defensive spending patterns stemming from price increases and real wage erosion due to exchange rate volatility. Moreover, persistently challenging conditions are likely to endure amid factors that include cost increases largely due to rising personnel expenses and logistics costs caused by the labor shortage along with escalating electricity rates, in conjunction with Japan’s declining birthrate, aging demographic and population decline, changing lifestyles among consumers and intensifying competition that extends across industries and business categories.
The consumer electrical appliance retail market, to which the Group belongs, shows signs of maintaining slight gains amid a scenario of demand prevailing ahead of Japan’s consumption tax hike slated for October 2019, followed by a corresponding pullback in demand in that regard. By product type, video equipment is expected to be firm due to the 4K and 8K satellite broadcasts and the market expansion for OLED TVs. Refrigerators, washing machines and other white goods are expected to be strong supported by replacement demand. Sales of seasonal products including air conditioning units are likely to decrease year on year given that weather forecasts indicate average temperatures this summer (June to August) typical for the season, in comparison with a scenario where the number of air conditioning units shipped in the summer of 2018 hit an all-time high because of extreme heat that year. Meanwhile, computers and other products in the digital realm are likely to maintain strong sales due to anticipated demand particularly from the corporate sector with support for the Windows 7 operating system slated to end in January 2020. Demand for mobile phones is expected to be affected by the complete separation of the payment for communication fees and the payment for phone purchase in compliance with the revision to the Telecommunications Business Act.
Under this market environment, and with “generating profits through continuous reform and innovation” as its management slogan for fiscal 2019, the Group will engage in renovations of approximately 100 stores annually to change the store format and development of new stores, thereby focusing on developing and extending the Kaden Sumairu-kan, which aligns with the basic format for Kaden Sumairu-kan established in the previous fiscal year. Moreover, the Company will take steps to amplify its proposals encompassing homes in their entirety, above and beyond its existing electrical appliances and renovations offerings. This will involve enhancing development of SPA (Specialty store retailer of Private label Apparel) merchandise related to furniture and interiors, extending the “Iemamori Station” services of Iemamori Holdings Co., Ltd., and handling “Yamada Smart Home” residential IoT-based services. In addition, the Company will persist with its initiatives taken thus far. This will involve continuing reforms geared to achieving a new earnings model that doesn’t hinge solely on electrical appliance sales, strengthening and promoting online sales leveraging strengths of its online and retail store network, and its distribution network, and combining stores. Furthermore, the Company will promote a shift to a new “house lifestyles IoT network solutions business,” from its previous business exclusively involving electrical appliances, based on its long-term vision of acting as “one of Japan’s largest network and services Internet of Things (IoT) companies.”
As a leading company in the consumer electrical appliance retail industry, we aim to gain trust of various stakeholders. We will also continue to promote CSR-oriented operations in which we leverage Group synergies, increase our social value and contribute to the development of society.
4
3. RISK FACTORS
Of the items relating to the status of the business and accounting as described in the Annual Securities Report, those that may materially affect the decisions of investors are provided below.
Items in the text below that concern the future were determined by the Group as of the end of the fiscal year under review.
(1) Store Openings and Development
The Group currently has stores in all 47 prefectures of Japan as well as overseas. The Group continues to plan retail store openings both in Japan and overseas. In Japan, the Group aims to streamline its store network and maintain and improve its market share by implementing a scrap-and-build policy appropriate to the size of the Japanese market in urban centers, suburbs, small-scale trading areas, community-based retail areas and others through the development of a nationwide chain of stores, as well as by selective store openings in areas with potential. However, the Group will have to secure for itself adequately priced land in favorable locations, which will make it susceptible to competition from competitor companies. The Group expects labor outlays and equipment costs to increase mostly in connection with opening new stores, implementing a scrap-and-build policy, or changing operations of some existing stores centered on Kaden Sumairu-kan. The Group also expects competition from competitors in areas where its stores have been already established to be fierce. It is also possible that the profitability of existing stores will be affected by new store openings depending on the region, due to saturated markets and conditions of the area in which such consumer electrical appliance retail stores are opened. With regard to stores that are closed due to our revised nationwide store network strategy we decided for the purpose of improving store efficiency in light of the market environment including competitions among our own stores and with other companies, loss on disposal of or contract cancellation of the closed stores may be incurred or the closed stores may not be subleased or sold off. The Group will generally weigh conditions such as rent expenses and guarantee deposits for store openings, as well as competition, trading area population and various laws and regulations in order to make carefully thought-out decisions. However, there is always the possibility that changes or delays could occur in the planning due to issues relating to real property. Conditions such as those described above may obstruct effective store development and management efforts and ultimately have a negative impact on the Group’s performance and financial position. Another consideration is the large amounts of capital necessary for store development including new store openings, scrap-and-build and operational changes of existing stores centered on Kaden Sumairu-kan. At present, it is covered by retained earnings and loans. However, any circumstance that thwarts capital procurement efforts could block the execution of business plans in the future.
(2) Competition
The consumer electrical appliance retail industry is intensely competitive where the societal needs continue to change reflecting development such as the anticipated declining birth rate and aging of the population, population decline, and the transition to the Internet-based society. It’s retail channels also vary, ranging from large-scale consumer electronics retailers, supermarkets, and home centers, to interior stores, furniture stores, miscellaneous goods stores and online shopping sites. In fact, all businesses that offer electrical appliances or products similar to those of the Group are our competitors. Although the Group has a leading position in the industry, it constantly faces various forms of competition such as pricing, new store openings and customer and human resource acquisition. The Group carries out store openings to meet the needs of a wide range of customers in urban centers, suburbs, small-scale trading areas and community-based retail areas; however, owing to an unexpected fluctuation in demand for higher unit-priced durable consumer goods, the consumer electrical appliance retail industry cannot be said to be stable, and the Group is likely to continue to face competition from rival companies in all regional areas. Furthermore, as the Group is the only mass retailer of electrical appliances with a nationwide store network, if competition among its own stores occurs and profitability per store falls due to developments such as changes in the economy and consumption environment and in the market environment, the Group’s performance and investment efficiency, and its financial position may be

5
affected. The Group believes that there is a possibility of aggravated competition due to the entry of new companies, as well as intensified competition among stores and in the area of purchasing as a result of M&As and alliances between companies vying to compete against the Group. Inability to successfully adapt to such situations would adversely affect the Group’s performance and financial position. In addition, the slashing of sale prices to remain competitive would lower profits.
(3) Risks Related to M&As and Alliances
The Company may execute organizational restructurings, M&As, alliances and sales of business in order to strengthen its business foundation. The Company will carefully study and examine the conditions before acting in order to alleviate risk. However, unforeseeable issues including contingency liabilities may arise after such actions take place. The Company also believes that initial expectations may not materialize or that investments may not be recovered. Depending on the circumstances, extraordinary loss or extraordinary income may occur, detrimentally affecting the performance and financial position of the Group.
(4) Regulations
Similar to other retailers, the Group is subject to laws and regulations such as the “Act on the Measures by Large-Scale Retail Stores for Preservation of Living Environment,” the “Designation of Specific Unfair Trade Practices by Large-Scale Retailers Relating to Trade with Suppliers” based on the “Act on Prohibition of Private Monopolization and Maintenance of Fair Trade” (Antimonopoly Act), the “Act against Unjustifiable Premiums and Misleading Representations” (Premiums Law), the “Act against Delay in Payment of Subcontract Proceeds, Etc. to Subcontractors” (Subcontract Act) and, as an operator engaged in the business of recycling and reuse with the aim of reducing the environmental load and creating a recycling-oriented society, the “Act on Recycling of Specified Kinds of Home Appliances” (Home Appliance Recycling Act), as applicable. Newly established laws and/or regulations, revisions to existing rules or stricter interpretations of laws and regulations by the regulatory authorities may lead to a decrease in demand for the products and services offered by the Group or an increase in the cost of doing business, thus, negatively affecting the performance and financial position of the Group.
In relation to the opening of new stores with store area exceeding 1,000 square meters, or the expansion of existing stores beyond such size, local governments enact and enforce regulations in accordance with the provisions on store openings under the Act on the Measures by Large-Scale Retail Stores for Preservation of Living Environment so as to preserve the living environment of the surrounding region. The Group is aware that its new store openings and expansion of existing stores are subject to regulations based on such Act and will observe such Act for the consideration of the living environment of the surrounding region and the like. Depending on the time required for surveys under such Act, delays or the like in the opening of new stores or the expansion planning for existing stores may affect the store opening policy of the Group.
Transactions between large-scale retailers and suppliers are subject to regulations based on the Designation of Specific Unfair Trade Practices by Large-Scale Retailers Relating to Trade with Suppliers, and being a large-scale retailer, the Group is subject to such regulations. The Group will observe such regulations. It is noted that the Group’s operating results may be affected if such regulations are tightened in the future.
Increased restrictions under the Construction Business Act, the Building Standards Act, the Building Lots and Buildings Transaction Business Act and/or the Insurance Business act applying to the insurance business, as well as other related laws and regulations applicable to the Group’s housing-related business may negatively affect its performance and financial position. Furthermore, centering on the retail sale of electric appliances, the Group has been working to amplify our proposals encompassing homes in their entirety. In operating our various services and businesses, we have conducted the required procedures, such as acquisition of the proper approvals and licenses from regulatory agencies, lawfully and appropriately, and at present, no serious issues have occurred. However, in the future, if these approvals and licenses are cancelled, or if their renewal is not recognized, or, if we do not receive the approvals and

6
licenses to further expand services or launch new businesses, or, if there are delays in the acquisition of these approvals and licenses, it may negatively affect the Group’s performance and financial position.
(5) Economic Trends
The Group depends on the Japanese market for most of its sales, and domestic consumer trends impact its performance. Various revisions in laws and regulations or changes in domestic and/or overseas economic factors, such as fluctuations in interest rates, fuel prices, the number of housing projects started, unemployment figures, increases in tax rates, changes in demographics, changes in exchange rates or stock prices, changes in consumption tax, a slowdown in the global economy or materializing risk of an economic slowdown in emerging markets, may not only push up the cost of sales and business expenses but also reduce disposable incomes and drive down the demands for the Group’s products. Furthermore, we must respond to distribution market changes as a result of the future challenges in Japan, such as the declining birth rate and aging of the population, population decline, and the transition to the Internet-based society. The weakening of disposable income and consumer spending in Japan may negatively impact sales of the Group’s products, resulting in a decline in net sales. The Group’s performance may also be affected when, due to an impact of the economic trends on its recruiting activities, it is not able to acquire human resources as required. There are also many causes for concern in the global economy such as materializing risk of an economic slowdown in newly emerging economies and political instability in Europe. As a result, the situation remains unpredictable. Under the current conditions, with overseas political and economic instability continuing, economic prospects are clouded with uncertainty, particularly in the financial markets. In view of these factors, there is absolutely no guarantee that the Japanese economy will continue growing or stop receding. The Group’s business, performance and financial position may be affected by the decrease in domestic consumer spending. In addition, as most of the interior, furniture, accessories and other products are imported from Asian countries, factors such as the Asian countries’ political situation or economy may also have a negative effect. Furthermore, the Group’s housing business is strongly affected by trends in personal consumption driven by employment conditions, trends in land prices and interest rates, policies relating to housing and the housing tax system, and the increase in consumption tax. Depending on such conditions or trends, the Group’s performance may be affected, particularly if there is a substantial decline in orders for houses resulting from an unforeseen deterioration in the market climate.
(6) Demand Associated with Seasonal and Weather Factors or Events, etc.
As with other retailers, sales and revenue fluctuate monthly. Generally, the Group sees increases during the bonus season, at the end of the fiscal year and during months with many holidays. There are also increases when sales of seasonal products fare well. Meanwhile, sales of seasonal products such as air conditioners, heaters, refrigerators, electric fans and drying machines fluctuate greatly with the weather. Sales are known to drop during cool summers, warm winters and dry rainy seasons. Also, there are products, such as televisions, recorders, and the like, that tend to go up whenever there is a special event such as the Olympics or the World Cup. Sadly, it is difficult to accurately predict irregular demands springing up due to seasonal changes, weather conditions or other events, not to mention demand for the Group’s products in general. Any significant deviation from such predictions may impact the Group’s business, performance and financial position.
(7) Changes in Consumer Wants and Preferences
In order to maintain and increase the Group’s net sales and income, it is necessary to predict which products consumers will want or prefer and make sure that sufficient quantities of such products are in stock to meet consumer needs. It is considered important to spur demand by regularly introducing new products and technologies to consumers. If these activities fail to bear fruit, the Group’s performance and financial position may be affected. Such failure can be caused by a lack of certain products due to competition from other retailers, change in the Group’s relationship with manufacturers or new product or technology on which a manufacturer is focusing being inconsistent with consumer needs. Also, the introduction of a new product may result in a decrease in the sales of existing equivalent products.
7
(8) Product Purchasing and Inventories
To ensure favorable performance, the Group should have in place a system under which the necessary products are purchased in necessary quantities at appropriate prices. Unfortunately, if product supplies become unstable due to such factors as a change in the relationship with business partners and global shortages of resources and materials, or maintaining regular product supplies becomes difficult due to, among other matters, fragmentation in the distribution network caused by a natural disaster or traffic accident, product purchasing according to a preconceived plan may become unfeasible. Furthermore, if the content of inventories is changed or the absolute amount of purchasing is greatly reduced by adjusting the optimum balance of inventories among different departments as a consequence of structural reform, or if there is a strategic disposal of inventories, the Group would find it difficult to secure the level of net sales and profit initially forecasted. Such factors may affect the Group’s performance and financial position.
(9) Risks Regarding Quality Assurance for Housing
The Group thoroughly manages the quality of housing as producer of housing. Even so, the performance and financial position of the Group may be negatively affected if a serious issue with quality arises due to unforeseen circumstances.
(10) Impairment on Long-Lived Assets
The Group possesses a large number of long-lived assets, including property and equipment and goodwill, and carries out impairment accounting regarding these assets. However, further recognition of impairment losses may become necessary if there is deterioration in the profitability of the Group’s stores, a dramatic fall in the market price of the assets possessed by the Group or the like. Such circumstances may negatively affect the Group’s performance and financial position.
(11) Managing Franchises
The Group is increasing the number of franchises managed as small, community-based retail stores. However, it cannot guarantee that it will be able to continually open franchises in favorable locations or renew existing franchise agreements. If the number of franchises does not increase as planned or decreases, royalties may decline, which will negatively affect the Group’s performance and financial position. Also, because franchises are not completely under the control of the Group, they may be managed in a manner that is inconsistent with the Group standards. In addition, with regard to franchise claims, despite the claims preservation contract concluded for each contract and our monthly claims status management, there may be uncollectable claims including payments receivable for goods in the event of business failure of any franchisee due to a decline in business results. This may not only negatively affect the Group’s performance and financial position, but also its reputation.
(12) Handling Personal and Other Secret Information
The Group handles point card certificates, registrations for the Group’s service for 24-hour shopping through mobile phones, the processing of credit card applications, paid service subscription of several long-term product warranties and other services, customer information related to various support services, customer information related to distribution, construction or repairs, customer information associated with online shopping and a significant amount of customers’ personal information. Such information is handled by an internal control system under which awareness with respect to information management is heightened and ample caution is taken to prevent infections by computer viruses, manipulation through malicious access, and information leaks. Any such unpredictable natural disasters, infections by computer viruses, manipulation through malicious access, or information leaks may damage the reputation of the Group and affect its performance and financial position.

8
(13) Natural Disasters
In cases where the Group’s operations are interrupted by damages to its store facilities or blackouts as a result of natural disasters from typhoons, earthquakes or localized torrential rain, products cannot be procured due to an obstruction, the Group is required to close its stores in accordance with evacuation advice due to the effects of radioactive materials from an accident at a nuclear power station, operations at the Group’s stores are partially impeded due to the occurrence of a disaster from the spread of an infectious disease such as a new strain of influenza or the like, or if it becomes difficult to enter the affected area due to delays in recovery and restoration, there may be a significant decrease in the Group’s sales, which may in turn have a significant impact on the Group’s performance.
(14) Risks Pertaining to the Housing Equipment Business
The Group works to check the status of its quality control for housing equipment and strives to maintain the quality of such equipment, but in the unlikely event of a problem with product quality occurring or a failure of equipment in the production facility occurring, this may negatively affect the Group’s performance and financial position.
(15) Overseas Operations
The Group operates an overseas store network centered in Asia, mainly in China, Singapore and Malaysia. Although the Group carries out careful advance studies prior to starting operations overseas, there may be differences in business customs, revisions to laws, tightening of environmental regulations, dramatic economic changes or unanticipated changes in foreign exchange rates in any of the relevant countries after the start of operations, and it may become difficult to secure local human resources in any such countries. Such circumstances may make it difficult for the Group to conduct business operations or secure business revenue as initially expected. Other than the above, it is conceivable that damage caused by deterioration in orders or deliberate damage to store facilities resulting from changes in the internal political situations of the relevant countries, the occurrence of national disputes, or the occurrence of terrorism or demonstrations in the areas surrounding the stores caused by political or economic problems between Japan and the relevant countries may necessitate suspensions of store operations or make it difficult to continue operations in the relevant areas depending on the circumstances. These factors may negatively affect the Group’s performance and financial position.
(16) The Company’s Original Brand Products
The Group designs original products under brand names such as “YAMADA SELECT,” and outsources their manufacturing thereof and sells the finished products. The Group works to check the status of its quality control for these original products and strives to maintain the quality of such products; however, in case a problem with product quality occurs, it may result in a shortage of supplies or excess of inventories due to a gap between supply and demand, which may negatively affect the Group’s performance and financial position.
(17) Guarantee Deposits
Guarantee deposits under leasing agreements of land and buildings, etc. lodged at the time of opening directly-managed stores of the Group are protected with collaterals pledged and other means. They may cause, however, a negative impact to business results and financial position of the Group as such guarantee deposits may become uncollectable in whole or in part in the event of a business failure of a lessee or due to an early termination of the agreement.
(18) Risk relating to Money Lending Business Act
Due to impacts from Money Lending Business Act, which came into effect in 2007, we anticipate a loss on returning overpaid interest payments in the credit business of the Group. Though the estimated loss to be incurred in the future is accounted for, this may cause a negative impact to business results and

9
financial position of the Group in the event that the economic environment worsens against the backdrop of concerns over financial stability and employment conditions.
(19) Exchange Rate Volatility
The Group has established subsidiaries in China, engaged mainly in the retail sale of electric appliances, which are covered by consolidation. As such, fluctuations in the forex market can affect the conversions to Japanese yen of prices for assets and liabilities occurring in foreign-currency-based transactions. Moreover, the Group also makes foreign-currency-based loans, and fluctuations in the forex market can affect the amount of provisions held for these loans, which may negatively affect the Group’s performance and financial position.
(20) Lawsuits
At present, the Group has no instances of having received demands for compensation for damages nor lawsuits filed against it which could seriously affect its future performance. However, the Group conducts various business activities mainly in the retail sale of electric appliances, and we cannot rule out the possibility of lawsuits or disputes occurring in these business activities. Where they do occur, they may negatively affect the Group’s performance and financial position.

10
4. MANAGEMENT ANALYSIS OF FINANCIAL POSITION, RESULTS OF OPERATIONS AND CASH FLOWS
(1) Overview of Operating Results
1) Performance
[On background of economies at home and abroad] In the fiscal year ended March 31, 2019 (April 1, 2018 to March 31, 2019), the Japanese economy
remained on a path of gradual recovery amid ongoing improvements in corporate earnings as well as the jobs and income environment, underpinned by various economic measures being taken by the government. However, the outlook for the economy internationally has remained unclear amid factors that include effects on the global economy associated with prolonged trade friction brought about by protectionist trade policy in the U.S., instability with respect to political developments in Europe, effects of volatility in financial and capital markets, economic slowdown in China, and surging crude oil prices stemming from substantial turmoil in the Middle East.
In the retail industry overall, operating costs have been following an upward trend largely due to rising personnel expenses caused by the labor shortage and increasing logistics costs, while medium- to long-term challenges have begun to emerge with respect to Japan’s declining birthrate, aging demographic and population decline. In addition, the situation increasingly calls for innovative management looking toward the future in a manner not bound by preconceptions amid a scenario of mounting uncertainties marked by a rapidly changing environment. For instance, whereas some business categories have been experiencing growth with respect to high-priced merchandise, in other business categories short-term demand for replacement has been slowing due to there being a remarkable range of choices and options amid circumstances where trends of consumption are being affected by changing lifestyles among consumers and diversifying purchasing behavior.
[On the consumer electrical appliance retail industry]
In the consumer electrical appliance retail industry, to which the Group belongs, sales and profits were substantially affected over the summer months by nationwide disasters and record-setting extreme heat, in conjunction with chronic labor shortages particularly accompanying efforts to recover from the respective disasters. However, sales appear to have remained strong underpinned by firm demand for replacement centered on core products.
From a product perspective, results were favorable particularly for high per-unit price products such as 4K and OLED televisions due to the new 4K/8K satellite broadcasting that commenced on December 1, 2018, amid signs that downward momentum seems to have bottomed out with respect to sales of televisions which had continually endured prolonged stagnation of the market due to a pullback in special demand which had been associated with the Japanese government’s “ecopoints” program for electrical appliances and digitization of terrestrial television. Refrigerators and washing machines also generated favorable results underpinned by demand for replacement. Sales of air conditioners and other seasonal products were favorable resulting from air conditioner demand spurred by extreme heat during the summer months as well as demand throughout the year, and despite effects of the mild winter. Mobile phones generated favorable results driven by high per-unit price products, despite adverse effects of government requirements calling for rectification of sales practices and signs of sluggishness with respect to new models launched in the fall of 2018. However, sales of computers and other products in the digital realm have long remained lackluster due to shifting patterns of use (use objectives and applications) and patterns of purchasing. The broadband market has been shrinking largely due to the spread of high-capacity data telecommunications plans offered by respective telecommunications carriers.
[On the Company’s efforts]
Against this backdrop in the consumer electrical appliance market, the Company has continued to take on various challenges geared to achieving sustainable growth and development by creating new services utilizing its Japan-wide store network and the analysis and application of big data encompassing its membership roster in excess of 60 million consumers.
As a part of these efforts, the Company classified the various services provided by the Yamada Denki Group so far as the Housing Equipment Business Department, Financial Services Business Department,

11
Support Service Business Department, Environmental Solutions Business Department, Online Shopping Mall Services Business Department, Mobile Business Department, Electrical Appliance Retail Business Department, Affiliate and Subsidiary Electrical Appliance Business Department, and Corporate Business Department. The Company strengthened and implemented separate administration for each of these business departments.
Amid these business departments, the Housing Equipment Business Department continues to develop its new retail store format, Kaden Sumairu-kan, started in 2017, and has opened 74 renovated retail stores as of March 31, 2019 (54 retail stores this fiscal year). We have renovated facilities to the Kaden Sumairu-kan, which features a different business format geared to various commercial zones, and then repeatedly conducting trial runs and results verification of the business format. It took one-and-a-half years from the opening of store number one, and as a result of these efforts, the basic format aligned with the Kaden Sumairu-kan concept is in order.
We have also been taking steps to maximize profits through efforts that involve redoubling efforts to develop housing products and streamlining operations by combining and closing stores nationwide in order to consolidate our network. To such ends, we carried out an absorption-type merger of NAKAYAMA CO., LTD. as of April 1, 2018 (expansion of the renovation business), and carried out a merger encompassing four companies with the Company’s consolidated subsidiary YAMADA SXL HOME CO., LTD. (currently YAMADA HOMES Co., LTD.) becoming the surviving company, on the effective date of October 1, 2018. Moreover, we have been working to amplify our proposals encompassing homes in their entirety, above and beyond electrical appliances and renovations. This has involved promoting development of SPA (Specialty store retailer of Private label Apparel) merchandise related to furniture and interiors in conjunction with our development of Kaden Sumairu-kan, arranging a business alliance with Otsuka Kagu, Ltd. (February 2019), and arranging a capital and business alliance with Iemamori Holdings Co., Ltd. (February 2019).
With respect to other initiatives, we have been taking steps to strengthen and promote online sales leveraging our online and retail store network and our distribution network, and have been combining stores. In addition to the Company’s directly-managed online store YAMADA WEB COM, these efforts have involved opening stores on the Yahoo! Japan Shopping platform in August 2017, and opening stores during this fiscal year on the Rakuten Market platform (July 2018) and the Wowma! platform (October 2018). Moreover, we have been sowing seeds for future opportunities that will help bring about new business models, while attempting to heighten convenience and improve customer service. To such ends, we have expanded our operations in the financial business by acquiring shares of Personal SSI Co., Ltd. (currently Yamada SSI Co., Ltd.; August 2018) and establishing Yamada Life Insurance Co., Ltd. (August 2018). This has also involved establishment of the joint venture company Social Mobility, Inc. with 3DOM Inc. (December 2018), while promoting nation-wide expansion of WeChat Pay payment services for inbound tourists and diversification of the PayPay and LINE Pay cashless payment services.
In addition, during the first six months of the fiscal year ended March 31, 2019 (April 1, 2018 to September 30, 2018), we carried out reforms geared to achieving a new earnings model that will strengthen the electrical appliance business (see below).
(i) Reforms that involve shifting to a “sell-out” approach aiming to improve GMROI (gross margin return on inventory investment) by fusing virtual and physical business operations.
(ii) Refurbishment and further renovations to achieve a new business format that optimizes and maximizes operations, upon having verified various results attained by our current Kaden Sumairu-kan stores.
During the third quarter and fourth quarter of the fiscal year ended March 31, 2019 (October 1, 2018 to March 31, 2019), our earnings results recovered according to plan backed by success of the reforms listed above. Accordingly, gross profit improved dramatically and ordinary profit to net sales also gained substantially to 3.3%, from 1.3% in the first six months of the fiscal year ended March 31, 2019.
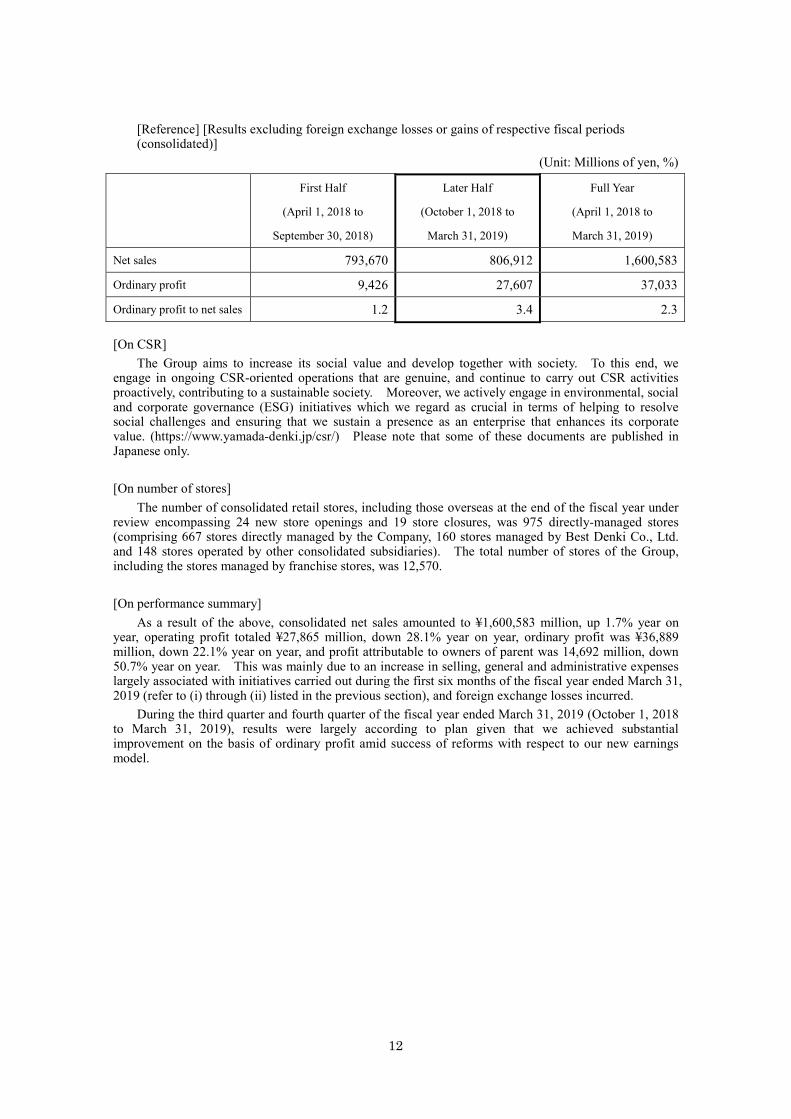
We incurred foreign exchange losses associated with rapid forex volatility ensuing since mid-December 2018. For further details on the effects thereof, refer to the section, “[Reference] [Results excluding foreign exchange losses or gains of respective fiscal periods (consolidated)],” below.
12
[Reference] [Results excluding foreign exchange losses or gains of respective fiscal periods (consolidated)]
(Unit: Millions of yen, %)
First Half
(April 1, 2018 to
September 30, 2018)
Later Half
(October 1, 2018 to
March 31, 2019)
Full Year
(April 1, 2018 to
March 31, 2019)
Net sales 793,670 806,912 1,600,583
Ordinary profit 9,426 27,607 37,033
Ordinary profit to net sales 1.2 3.4 2.3
[On CSR] The Group aims to increase its social value and develop together with society. To this end, we
engage in ongoing CSR-oriented operations that are genuine, and continue to carry out CSR activities proactively, contributing to a sustainable society. Moreover, we actively engage in environmental, social and corporate governance (ESG) initiatives which we regard as crucial in terms of helping to resolve social challenges and ensuring that we sustain a presence as an enterprise that enhances its corporate value. (https://www.yamada-denki.jp/csr/) Please note that some of these documents are published in Japanese only.
[On number of stores]
The number of consolidated retail stores, including those overseas at the end of the fiscal year under review encompassing 24 new store openings and 19 store closures, was 975 directly-managed stores (comprising 667 stores directly managed by the Company, 160 stores managed by Best Denki Co., Ltd. and 148 stores operated by other consolidated subsidiaries). The total number of stores of the Group, including the stores managed by franchise stores, was 12,570.
[On performance summary]
As a result of the above, consolidated net sales amounted to ¥1,600,583 million, up 1.7% year on year, operating profit totaled ¥27,865 million, down 28.1% year on year, ordinary profit was ¥36,889 million, down 22.1% year on year, and profit attributable to owners of parent was 14,692 million, down 50.7% year on year. This was mainly due to an increase in selling, general and administrative expenses largely associated with initiatives carried out during the first six months of the fiscal year ended March 31, 2019 (refer to (i) through (ii) listed in the previous section), and foreign exchange losses incurred.
During the third quarter and fourth quarter of the fiscal year ended March 31, 2019 (October 1, 2018 to March 31, 2019), results were largely according to plan given that we achieved substantial improvement on the basis of ordinary profit amid success of reforms with respect to our new earnings model.

13
[Reference] The following section provides an overview of results achieved by Yamada Denki Co., Ltd. (non-consolidated). [Results of respective fiscal periods (non-consolidated) (*net sales adjusted to exclude wholesale sales, etc.)]
(Unit: Millions of yen, %)
First Half
(April 1, 2018 to
September 30, 2018)
Later Half
(October 1, 2018 to
March 31, 2019)
Full Year
(April 1, 2018 to
March 31, 2019)
Net sales 593,790 608,733 1,202,523
Ordinary profit 4,760 21,266 26,027
Ordinary profit to net sales 0.8 3.5 2.2
[Results excluding foreign exchange losses or gains of respective fiscal periods (non-consolidated) (*net sales adjusted to exclude wholesale sales, etc.)]
(Unit: Millions of yen, %)
First Half
(April 1, 2018 to
September 30, 2018)
Later Half
(October 1, 2018 to
March 31, 2019)
Full Year
(April 1, 2018 to
March 31, 2019)
Net sales 593,790 608,733 1,202,523
Ordinary profit 3,770 21,653 25,424
Ordinary profit to net sales 0.6 3.6 2.1
2) Financial position
[Overview] The total assets at the end of the fiscal year under review amounted to ¥1,184,042 million, up ¥8,474
million (0.7%) compared to the end of the previous fiscal year. This was mainly due to an increase in notes and accounts receivable.
The total liabilities amounted to ¥592,449 million, up ¥5,621 million (1.0%) compared to the end of the previous fiscal year. This was mainly due to an increase in notes and accounts payable.
Net assets amounted to ¥591,593 million, up ¥2,853 million (0.5%) compared to the end of the previous fiscal year, mainly reflecting an increase in retained earnings. As a result, the equity ratio was 49.7% (down 0.1 point from the end of the previous fiscal year).
3) Cash flows
As of the end of the fiscal year under review, cash and cash equivalents on a consolidated basis stood at ¥51,176 million, down ¥152 million (0.3%) compared with the end of the previous fiscal year.
Cash flows during the fiscal year under review were as follows.
Cash flows from operating activities
Net cash provided by operating activities amounted to ¥36,023 million (¥61,689 million provided in the previous fiscal year).

14
This was mainly due to profit before income taxes falling below the amount for the previous fiscal year and an increase in notes and accounts receivable.
Cash flows from investing activities
Net cash used in investing activities amounted to ¥8,469 million (¥12,668 million used in the previous fiscal year).
This was mainly due to purchase of property and equipment associated with renovations of stores, etc.
Cash flows from financing activities
Net cash used in financing activities amounted to ¥27,461 million (¥32,920 million used in the previous fiscal year).
This was mainly due to repayments of long-term loans payable.
(Reference) Trends in company cash flow indicators
Fiscal year
ended March 31, 2015
Fiscal year ended March 31,
2016
Fiscal year ended March 31,
2017
Fiscal year ended March 31,
2018
Fiscal year ended March 31,
2019
Equity ratio (%) 43.2 46.6 48.4 49.8 49.7
Market value-based equity ratio (%) 33.3 37.2 38.5 43.4 37.5
Interest-bearing debt to cash flows (year) 10.5 – 5.4 3.7 6.0
Interest coverage ratio (factor) 14.1 – 30.0 46.3 28.8
Equity ratio: equity / total assets Market value-based equity ratio: market capitalization / total assets Interest-bearing debt to cash flows: interest-bearing debt / operating cash flows Interest coverage ratio: operating cash flows / paid interest * All indicators are calculated using consolidated-based financial figures. * Market capitalization is calculated based on the number of issued shares as of the end of the year
(excluding treasury stock). * The figure used for operating cash flows is “net cash provided by (used in) operating activities”
on the consolidated statements of cash flows. * Interest-bearing debt includes all liabilities recorded on the consolidated balance sheets on which
we paid interest. * The interest-bearing debt to cash flows and the interest coverage ratio are not presented for the
fiscal year ended March 31, 2016 because cash flows from operating activities was a minus value.
4) Sales results
a. Sales results
The Group’s operating segments are “home electrical appliances and home information appliances sales business” and “other businesses.” However, as “home electrical appliances and home information appliances sales business” accounts for a large portion of the Group’s overall segments, the segment information for said business is immaterial as disclosure information. Therefore, the table below shows the sales amount by item.

15
Year ended March 31, 2019
Items Amount (Millions of yen) %
Year-on-year comparison
(%) Home electrical appliances/ home information appliances 1,341,511 83.8 1.4
Other products 259,072 16.2 3.1 1,600,583 100.0 1.7
Note: The figures shown above do not include consumption tax. b. Sales per unit
Year ended March 31, 2019 Amount Year-on-year
comparison (%) Net sales - millions of yen 1,600,583 1.7 Sales floor space (average) - m² 2,644,078 1.2 Sales per square meter - thousands of yen 605 0.5 Employees (average) - persons 28,850 (0.9) Sales per employee - millions of yen 55 2.6
Notes: 1. “Sales floor space” is the store area based on the Act on the Measures by Large-Scale Retail
Stores for Preservation of Living Environment (or, depending on when the data was submitted, the same law prior to its revision).
2. The figures shown above do not include consumption tax. 3. “Employees” include temporary employees.
(2) Analysis and Discussion regarding Status of Operating Results, etc. from a Management
Perspective
Items in the text below that concern the future were determined as of the end of the fiscal year under review.
1) Important accounting policies and estimates
The consolidated financial statements of the Group have been prepared based on generally accepted accounting standards of Japan.
In their preparation, important accounting policies that were applied are as stated in Note 2 to the consolidated financial statements, entitled the “SUMMARY OF SIGNIFICANT ACCOUNTING POLICIES.”
When calculating provisions and valuating assets or the like, the Group makes estimates and judgments based on various factors considered reasonable given the past results and conditions of applicable transactions, and results of such estimates/judgments are reflected in the preparation of the consolidated financial statements.

16
2) Recognition, analysis and discussion regarding status of operating results, etc. for the fiscal year under review
a. Operating results
Net sales and gross profit
Net sales during the fiscal year under review were favorable, as the new 4K/8K satellite broadcasting commenced on December 1, 2018 and interest further increased in products such as 4K and OLED televisions, leading to an increase in the ratio of high per-unit price products to total sales and an increase in the overall number of televisions sold. Refrigerator and washing machines also generated favorable results due to strong interest in high-performance and high per-unit price products and replacement demand. Sales of air conditioners and other seasonal products were favorable resulting from extreme heat during the summer months as well as demand for air-conditioners available throughout the year, even in cold regions. Mobile phones generated favorable results driven by high-performance and high per-unit price products, despite signs of sluggishness with respect to new models launched in fall. However, sales of computers and other products in the digital realm, mainly to individuals, have long remained lackluster due to changing lifestyles and the shift from computers to smartphones. The broadband market has been shrinking largely due to the spread of high-capacity data telecommunications plans offered by respective telecommunications carriers. As a result, net sales during the fiscal year under review was 1,600,583 million yen, up 1.7% year on year. In terms of gross profit, during the first six months of the fiscal year ended March 31, 2019 (April 1, 2018 to September 30, 2018), we carried out reforms geared toward achieving a new earnings model that will strengthen the electrical appliance business (please see “3. MANAGEMENT ANALYSIS OF FINANCIAL POSITION, RESULTS OF OPERATIONS AND CASH FLOWS (1) Overview of Operating Results [On the Company’s efforts]”). The results of these reforms appeared during the third quarter and fourth quarter of the fiscal year ended March 31, 2019 (October 1, 2018 to March 31, 2019), and with performance proceeding according to plan, gross profit margin improved significantly from a 4.9% decline year on year in the first six months of the fiscal year ended March 31, 2019 to a 6.4% increase. As a result, gross profit for the fiscal year under review was ¥440,991 million (up 0.7% year on year).
Selling, general and administrative expenses, other income (expenses) and profit before income taxes
In selling, general and administrative expenses for the fiscal year under review, the Group carried out continuous cost reductions and controls, but the extreme heat and rising personnel expenses and logistics costs caused by the nationwide labor shortage, the increase in point expenses due to the difference in strategy from last year to this year, and the increase in commissions due to the opening of stores on the Yahoo! Japan Shopping platform (August 2017), Rakuten Market platform (July 2018) and the Wowma! platform (October 2018) led expenses to rise. As a result, selling, general and administrative expenses amounted to ¥413,126 million, up 3.4% year on year, and operating profit amounted to ¥27,865 million, down 28.1% year on year.
Other expenses for the fiscal year under review was ¥2,767 million. Losses from natural disasters including torrential rain, typhoons, and earthquakes, impairment losses on retail stores, etc., and impairment losses on the showrooms of affiliates were recorded.
As a result, profit before income taxes decreased by ¥14,918 million to ¥25,097 million (down 37.3%) compared with the previous fiscal year.
Total income taxes, profit, loss attributable to non-controlling interests and profit attributable to
owners of parent
During the fiscal year under review, income taxes stood at ¥10,303 million, profit was ¥14,794 million and profit attributable to non-controlling interests amounted to ¥102 million.
17
As a result, profit attributable to owners of parent decreased by ¥15,088 million to ¥14,692 million (down 50.7%) compared with the previous fiscal year.
b. Capital resources and liquidity of funds
Cash flows
An overview of cash flows for the fiscal year under review is presented in “3) Cash flows” of “(1) Overview of Operating Results.”
Funding requirements
The Group’s main funding requirements are working capital and capital investments.
Working capital comprises funds used to purchase merchandise for selling as well as expenses such as selling, general and administrative expenses. Capital investments are investments carried out for new store openings, store renovations and so forth.
Financial policy
It is the Group’s basic policy to allocate funds for working capital and capital investments through cash flows from operating activities, and when necessary, to take out loans from financial institutions or issue corporate bonds, and so forth.
To ensure that funds can be procured stably and efficiently, the Company has established suitably large lines of credit from financial institutions. It has entered into a ¥50 billion commitment line agreement and has established a reserve for funding requirements.
The Group generates cash flow from operating activities while further enhancing capital efficiency and improving its financial position.
c. Objective target indicators, etc. for assessing achievement of management goals
Achievement of management goals
The Company had established an ordinary profit to net sales ratio of 5% or higher as a target management indicator, but due to the above factors, this number was 2.3% in the fiscal year under review. In terms of the fiscal year ending March 31, 2020, the demand prevailing ahead of Japan’s consumption tax hike slated for October 2019, followed by a corresponding pullback in demand, has led us to forecast a slight increase in net sales. However, as we expect rising costs including rising personnel expenses, shipping, and logistics costs caused by labor shortages, we have set an ordinary profit to net sales ratio of 3% or higher as our target.
18
5. IMPORTANT AGREEMENTS
(1) Credit Sales Franchise Agreements
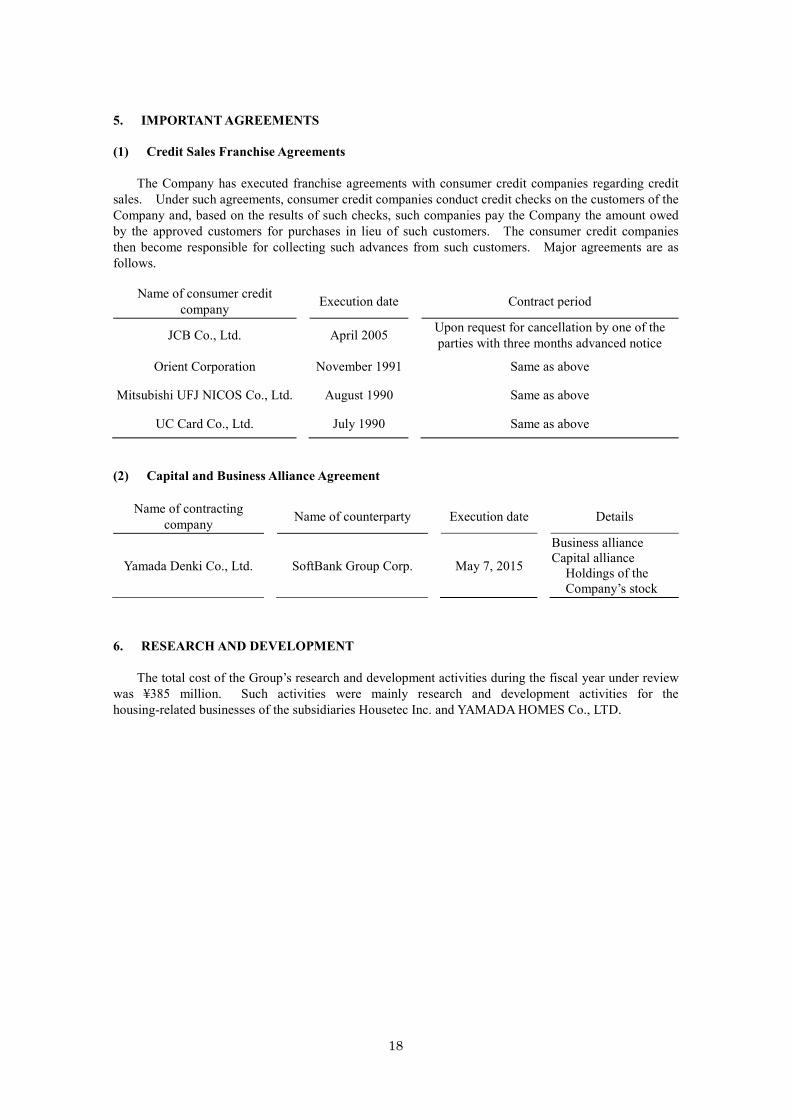
The Company has executed franchise agreements with consumer credit companies regarding credit sales. Under such agreements, consumer credit companies conduct credit checks on the customers of the Company and, based on the results of such checks, such companies pay the Company the amount owed by the approved customers for purchases in lieu of such customers. The consumer credit companies then become responsible for collecting such advances from such customers. Major agreements are as follows.
Name of consumer credit company
Execution date Contract period
JCB Co., Ltd. April 2005 Upon request for cancellation by one of the parties with three months advanced notice
Orient Corporation November 1991 Same as above
Mitsubishi UFJ NICOS Co., Ltd. August 1990 Same as above
UC Card Co., Ltd. July 1990 Same as above
(2) Capital and Business Alliance Agreement
Name of contracting company
Name of counterparty Execution date Details
Yamada Denki Co., Ltd.
SoftBank Group Corp.
May 7, 2015
Business alliance Capital alliance
Holdings of the Company’s stock
6. RESEARCH AND DEVELOPMENT
The total cost of the Group’s research and development activities during the fiscal year under review was ¥385 million. Such activities were mainly research and development activities for the housing-related businesses of the subsidiaries Housetec Inc. and YAMADA HOMES Co., LTD.
19
7. CORPORATE GOVERNANCE
1) Overview of Corporate Governance
(1) Basic Ideals on Corporate Governance
The Company’s basic ideals of corporate governance is to improve management transparency, conduct fair corporate activities and continue to maintain and increase corporate and shareholder value.
(2) Overview of Corporate Governance Structures and Reasons for Adopting Such Structures
The Company has adopted the Audit & Supervisory Board system, and it conducts supervision and monitoring of the execution of operations through its Board of Directors and the Audit & Supervisory Board. Also, as part of the efforts to facilitate rapid responses to changes in the business environment, the Company has adopted a system under which the execution of operations is carried out by several executive officers, which establishes a clear separation between the execution of operations and the business decision-making and management oversight functions. The senior executives who serve for business departments and on management committees and sectional meetings are the Chairman of the Board, the Vice Chairman & CEO, and the President & COO (all of them with representative authority). Operating under these senior executives, the executive officers concentrate on their execution of operations and assume responsibility for the management of specified functions. The Company has established a CSR Committee, in addition to the existing Compliance Committee, Internal Audit Office and Risk Management Committee, to oversee the formulation of specific CSR-related policies and standards covering areas such as business ethics and the like. The CSR Committee conducts ongoing activities aimed at enhancing internal and external awareness of CSR-related issues.
The Company adopted the above-described structures in order to implement concrete corporate governance structures that would lead to the realization of the basic ideals of “improving management transparency, conducting fair corporate activities and continuing to maintain and increase corporate and shareholder value.”
The corporate governance structures of the Company are as follows.
(i) General Meeting of Shareholders
The General Meeting of Shareholders, the Company’s top decision-making body chaired by the Representative Director, provides an important forum for shareholders, as owners of the Company, to obtain and exchange information as well as to exercise their rights. The Company has an active IR program, and it is intent on disclosing information in a timely manner to ensure its shareholders the opportunity to exercise their rights appropriately. Because foreigners make up a large percentage of the shareholders, the Company strives to figure out ways to meet their needs, in addition to preparing and delivering notices regarding the General Meeting of Shareholders in English in a timely manner.
(ii) Board of Directors
The Company’s Board of Directors, chaired by the Representative Director, convenes meetings once a month. Extraordinary Board meetings are also convened when necessary. The Company’s Board of Directors reviews any important issues related to the Company’s business, discusses the status of the Company’s performance and takes prompt action as required.
(iii) Audit & Supervisory Board
The Company’s Audit & Supervisory Board system relies on one standing Audit & Supervisory Board member and two non-standing (external) Audit & Supervisory Board members. The status of audits by the Audit & Supervisory Board members is described in “3) Status of Audit (1) Audits by Audit & Supervisory Board Members.”

20
(iv) Management Meetings
Management meetings are as a rule convened weekly except on weeks when meetings of the Board of Directors are held. At the meetings, participants report on management issues and progress of execution of operations by executive officers, and take prompt action as required.
(v) Business Plan Progress Management Meetings
The Company provides a framework for addressing the drastically changing market environment through holding weekly business plan progress management meetings at which relevant directors and managers in the position of executive officer or above attend. These meetings are held to check the progress of business plans created by each business department, including performing weekly progress checks, looking at revenues and expenses and identifying problems, and reporting on problem countermeasures and the effectiveness of executed countermeasures.
(vi) Internal Audit Office
The Company has established the Internal Audit Office to strengthen its internal auditing functions. Reporting directly to the President and employing seven full-time staff, such office engages in internal auditing. The status of internal auditing is described in “(3) Status of Audit (2) Internal Auditing.”
(vii) Others
The Company contracts with a law firm for legal advice, as needed.
21
(3) Other Items Related to Corporate Governance
The Company has developed a system of internal control for ensuring the proper operation of its business, in accordance with the basic policy below, pursuant to the Companies Act of Japan and the Regulation for Enforcement of the Companies Act.
(i) System for ensuring that directors and employees perform their duties in compliance with the applicable laws and regulations and the Articles of Incorporation
(a) Compliance Committee
Directors in charge of compliance shall organize the Compliance Committee, which is involved in formulating corporate ethics policies and basic policy and standards on compliance with laws and regulations (compliance provisions), and establish codes of conduct on that basis requiring that directors and employees act in accordance with laws and regulations, the Articles of Incorporation and the Company’s employment rules and other internal rules.
Education to directors and employees shall be provided to ensure thorough implementation in this regard led by the Compliance Committee. These initiatives are reported on a regular basis to the Board of Directors and the Audit & Supervisory Board.
(b) Establishment of the CSR Committee
The Company shall establish the CSR Committee, in full recognition of the significance of corporate social responsibility, as a means of putting CSR-focused management into practice as part of the management policy. The CSR Committee shall pursue initiatives based on the Code of CSR Ethics in areas that include compliance, labor, customer satisfaction, local communities, and environmental issues and the progress status shall be confirmed at each sectional meeting.
(c) Whistle-blowing system
Upon becoming aware of incidents involving the performance of duties by the Company’s directors and employees that are questionable in terms of laws and regulations, individuals regardless of their position shall report such matters directly to the organizational contact set up to receive internal reports, pursuant to the Regulations on Operation of Whistle-Blowing System. The Compliance Committee shall endeavor to make the existence of the whistle-blowing system known.
(d) Internal Audit Office
The Internal Audit Office shall operate independently of the Company’s operating divisions. It shall perform internal audits on legal compliance of individual sectors and audits encompassing areas such as, information security management systems (ISMS), information systems, information security and personal information protection. It shall also audit work processes and other operations of individual sectors, and take steps to uncover and prevent improprieties and to improve processes.
(ii) System for storage and management of information concerning the directors’ performance of duties
(a) Manager in charge of information storage and management
With respect to the storage and management of information pertaining to the directors’ performance of duties, the Company shall store the documents set forth below (including electro and magnetic records thereof) along with related materials under the responsibility of the director in charge of general affairs and in accordance with the Company’s Regulations on Document Management and Handling.

22
a. Minutes of General Meetings of Shareholders b. Minutes of meetings of the Board of Directors c. Financial statements d. Internal circulars for managerial decision (ringi-sho) e. Minutes of meetings of respective committees f. Documents otherwise designated in the Company’s Regulations on Document Management
and Handling
(b) Amendments to Regulations on Document Management and Handling
Approval of the Board of Directors shall be obtained when amending the Regulations on Document Management and Handling.
(c) The Company shall develop regulations related to protection of personal information and management of trade secrets, and store and manage personal information and important trade secrets in an appropriate and safe manner.
(iii) Regulations on management of risk of loss and other systems
(a) Risk Management Basic Regulations
The director in charge of risk management shall organize the Risk Management Committee and formulate the Risk Management Basic Regulations. Accordingly, the committee shall categorize risks in the regulations and establish specific risk management systems.
(b) Crisis management system in the event of disaster
The director in charge of risk management shall prepare a disaster response measures manual and develop crisis management system in accordance with the manual. The director in charge of risk management shall endeavor to make details of the manual known and provide education regarding disaster response.
(iv) System for ensuring that directors perform their duties efficiently
When making decisions on allocating duties of directors and conferring segregations of duties and authority of individual sectors, the Board of Directors (or the representative directors) shall be careful not to make decisions that would result in bloated back-office operations, overlapping administrative sectors, intertwined areas of authority or would otherwise significantly impede efficiency.
(v) System for ensuring the properness of business operations of the Group consisting of the Company, its parent company and its subsidiaries
(a) The Company shall establish an Office of Affiliate Support, and accordingly create a system for overseeing the management and performance of subsidiaries and ensuring the properness of such business operations.
(b) The Company’s subsidiaries shall execute their business operations in accordance with basic affiliation agreements and internal regulations of the respective companies, and such agreements and regulations shall be reviewed as needed.
(c) To achieve optimal performance and budget management of its subsidiaries, the Company shall hold monthly Group company review committee meetings for managing subsidiaries’ overall performance and budgets on the basis of medium-term business plans and annual budgets, and furthermore hold weekly Group company meetings with its principal subsidiaries.
(d) When deemed necessary, the Internal Audit Office may conduct internal audits related to business operations of subsidiaries.

23
(vi) System for reporting to the Company on matters pertaining to performance of duties by subsidiaries’ directors, etc.
(a) The Company shall stipulate the procedures and content of reporting to the Company from subsidiaries in basic affiliation agreements and provide appropriate guidance and advice on matters reported, while respecting the autonomy of subsidiary management.
(b) The Company shall hold monthly Group company briefing sessions where it receives reports on the status of subsidiary management and financial position to ensure the properness of subsidiary business operations.
(vii) Regulations on management of risk of loss of subsidiaries and other systems
(a) The Company shall make its Risk Management Basic Regulations thoroughly known to its subsidiaries in accordance with the basic affiliation agreements.
(b) The Company shall receive weekly risk management status reports from all of its subsidiaries, by receiving checklists for monitoring compliance.
(c) Each subsidiary of the Company shall establish basic policies on risk management.
(d) In the event that the Office of Affiliate Support receives a report on risk of loss from a subsidiary, it shall investigate the relevant facts in the case and report the matter to the director in charge of risk management.
(viii) System for ensuring that subsidiaries’ directors, etc. perform their duties efficiently
(a) The Company’s Board of Directors shall formulate medium-term business plans and medium- to long-term management strategies in which subsidiaries are involved, and coordinate with subsidiaries in establishing key management goals based on such plans and strategies, and making progress in that regard.
(b) The Company shall stipulate procedures in its basic affiliation agreements with respect to individual matters for approval involving its subsidiaries, and take steps to streamline decision-making in that regard.
(ix) System for ensuring that subsidiaries’ directors, etc. and employees perform their duties in compliance with the applicable laws and regulations and the Articles of Incorporation
(a) The Company shall verify the status of subsidiaries’ operations using weekly checklists for monitoring compliance, and report such outcomes to the Compliance Committee as necessary.
(b) The Company’s whistle-blowing system shall also be used by its subsidiaries to prevent violations of laws and regulations and the Articles of Incorporation. The Company shall receive reports regarding the status of any disciplinary action taken on the basis of violations of laws and regulations or the Articles of Incorporation.
(c) The Company may assign its directors, Audit & Supervisory Board members and employees to concurrently serve as audit & supervisory board members of a subsidiary, thereby coordinating with audit & supervisory board members of the subsidiary in performing legal compliance audits of duties performed by the subsidiary’s directors and employees.
(x) System regarding employees to assist duties of Audit & Supervisory Board members when the Audit & Supervisory Board members request to assign such employees, and matters regarding the independence of such employees from the directors
(a) Assigning an employee to act as an audit assistant
24
When an Audit & Supervisory Board member requests directors that an employee be assigned as an audit assistant to assist in his or her duties, the directors shall make the necessary organizational changes and personnel rotations upon consulting with the Audit & Supervisory Board member.
(b) Duties of an audit assistant
Audit assistants shall be formally posted as assistant to Audit & Supervisory Board member and assist with duties of Audit & Supervisory Board members and Audit & Supervisory Board operations as instructed and ordered.
(c) Independence of an audit assistant
a. An audit assistant shall work under the instructions and orders of an Audit & Supervisory Board member, and as such is not subject to the instructions or orders of directors or any person positioned as his or her superior or the like in the organization unit to which the audit assistant belongs.
b. In performing their tasks, audit assistants may gather all information necessary for the audit.
c. Consent of the relevant Audit & Supervisory Board member must be obtained for matters involving personnel changes (this includes consent for the transfer destination in case of personnel transfer), personnel evaluation and disciplinary action of an audit assistant.
(xi) Matters regarding ensuring effectiveness of Audit & Supervisory Board members’ instructions to employees to assist them in their duties
(a) Supervisory authority
Audit & Supervisory Board members may instruct employees as necessary for conducting audit work so that the employees will assist their duties.
(b) Cooperative framework
When such an employee concurrently serves as an employee of another department, priority must be given to the employee’s duties pertaining to the Audit & Supervisory Board member. Moreover, superiors of the other department with which the employee concurrently serves, and directors, must provide support as necessary upon request with respect to performance of such duties.
(xii) System for directors and employees to report to Audit & Supervisory Board members and the system concerning other reports to Audit & Supervisory Board members
(a) Directors’ obligation to report
A director must promptly report to an Audit & Supervisory Board member with respect to any discovery of an incident where work performed by another director or an employee is in violation of laws and regulations, or threatens to cause significant damage to the Company.
(b) Employees’ right to report
An employee may report to an Audit & Supervisory Board member with respect to any discovery of an incident where work performed by a director or another employee is in violation of laws and regulations, or threatens to cause significant damage to the Company.
(c) Internal reporting
The organizational contact set up to receive internal reports shall report matters involving the status of internal reporting to an Audit & Supervisory Board member, pursuant to the Regulations
25
on Operation of Whistle-Blowing System.
(xiii) System for reporting to Audit & Supervisory Board members by the following in subsidiaries: directors, accounting advisors, audit & supervisory board members, executive officers, executive members, persons executing duties set forth in Article 598, Paragraph 1 of the Companies Act, persons equivalent to such persons, and employees, or persons who receive reports from the foregoing persons
(a) Directors and employees of a subsidiary shall immediately report the Company’s Office of Affiliate Support if they discover an incident that significantly damages the subsidiary or threatens to do so, or otherwise if they discover a material incident involving violation of laws and regulations, the articles of incorporation or internal regulations within the subsidiary.
(b) With respect to matters involving reports received from directors of subsidiaries, any matters that the Company’s Office of Affiliate Support is to report to Audit & Supervisory Board members of the Company shall be those determined through mutual consultation between the Company’s officers in charge of subsidiaries and Audit & Supervisory Board members.
(xiv) System for ensuring that persons who have reported matters are not treated disadvantageously on the grounds of their reporting
(a) Persons who have reported matters to an Audit & Supervisory Board member shall not be treated disadvantageously in any way on the grounds of their reporting as set forth in the preceding paragraphs.
(b) When making decisions regarding the whistleblower with respect to personnel rotation, performance evaluation and disciplinary action, the fact of whistleblowing must not be a consideration, and the whistleblower may request an Audit & Supervisory Board member to conduct an inquiry into the reason for personnel rotation, performance evaluation and disciplinary action.
(xv) Matters regarding policies pertaining to procedures for prepayment or reimbursement of expenses arising with respect to performance of an Audit & Supervisory Board member’s duties, or otherwise processing of expenses or debt obligations arising with respect to performance of such duties
(a) Presentation of budget
The Audit & Supervisory Board shall present a preliminary budget to the Company with respect to expenses deemed necessary in performing duties.
(b) Claims for expenses, etc.
Directors may not reject the hereinafter listed claims made by an Audit & Supervisory Board member, etc. with respect to performance of his or her duties, unless it has been demonstrated that an expense or debt obligation pertaining to the claim is unnecessary with respect to performance of the Audit & Supervisory Board member’s duties.
a. Claim for prepayment of expenses
b. Claim for reimbursement of expenses already paid and interest on such amounts accrued after the date of payment
c. Claim for making repayment to a person to whom a debt obligation is owed (or provision of reasonable guarantee of such amount in cases where the repayment due date of the obligation has not yet arrived).
26
(xvi) System for ensuring that Audit & Supervisory Board members perform audits effectively
Audit & Supervisory Board members are provided preliminary explanations with respect to annual plans to be implemented by the Internal Audit Office, and may ask for revisions to such plans and make other such requests. Moreover, Audit & Supervisory Board members may be appropriately provided reports regarding the status of internal audit implementation, and may call for performance of additional audits, improvement of business operations and other such requests, when deemed necessary.
(4) Number of Directors and Election Rules
The Company’s Articles of Incorporation limit the maximum number of directors to 17. An approval of resolution to elect directors requires a simple majority vote in favor at a General Meeting of Shareholders attended by shareholders representing at least one-third of the total voting rights. Directors may not be elected by cumulative voting.
(5) Requirements for Special Resolutions by the General Meeting of Shareholders
For requirements for special resolutions by the General meeting of Shareholders as set forth in Article 309, Paragraph 2 of the Companies Act, the Company’s Articles of Incorporation stipulate that shareholders holding one third or more of the voting rights of the shareholders who are entitled to exercise their voting rights must attend, and that special resolutions will be passed with two third or more of those voting rights cast in favor. The goal of this policy is to ensure the smooth operations of the General Meeting of Shareholders by lowering the quorum required for special resolutions at the General Meeting of Shareholders.
(6) Acquisition of Treasury Stock
As set forth in Article 165, Paragraph 2 of the Companies Act, the Company’s Articles of Incorporation stipulate that the Company can acquire treasury stock through a resolution by its Board of Directors. The goal of this policy is to allow the flexible execution of capital policy in response to changes in the management environment by acquiring treasury stock through market trading, etc.
(7) Interim Dividends
As set forth in Article 454, Paragraph 5 of the Companies Act, the Company’s Articles of Incorporation stipulate that the Company can pay interim dividends to shareholders and registered stock pledgees listed or registered in the final shareholder registry as of September 30 of each year. The goal of this policy is to allow the flexible execution of capital policy in response to changes in the management environment.

27
2) Status of Officers
(1) Status of External Directors and External Audit & Supervisory Board Members
The Company has two external directors. External Director Mr. Tsukasa Tokuhira provides valuable opinions and suggestions to management of the Company as an external director based on his abundant experience as a long-standing leader in the distribution industry. Mr. Tsukasa Tokuhira concurrently serves as Representative Director of Cross Co., Ltd. and Representative Director of Fic Limited, and the Company has outsourcing and other transactions with Cross Co., Ltd. However, because the scale of this relationship is insubstantial and accounts for less than 0.00003% of the Company’s consolidated net sales, the Company believes that it is not significant enough to cause a conflict of interests. The Company does not have a personal relationship, capital relationship, trading relationship or share any other interests with Fic Limited. External Director Mr. Hiroyuki Fukuyama has a wealth of experience and wide knowledge as a company executive, and provides valuable opinions and suggestions to management of the Company as an external director, including from the perspective of CSR, such as environmental responses centered on manufacturing and regional contribution measures. Mr. Hiroyuki Fukuyama concurrently serves as Representative of Hiroyuki Fukuyama Professional Engineer Office. The Company does not have a personal relationship, capital relationship, trading relationship or share any other interests with Hiroyuki Fukuyama Professional Engineer Office.
The Company has two external Audit & Supervisory Board members. External Audit & Supervisory Board Member Mr. Masamitsu Takahashi concurrently serves as Representative Partner of Hikari Certified Public Tax Accountants Corporation and Representative Director of Takahashi Tax & Management Co., Ltd. The Company does not have a personal relationship, capital relationship, trading relationship or share any other interests with Hikari Certified Public Tax Accountants Corporation or Takahashi Tax & Management Co., Ltd. In addition, Mr. Masamitsu Takahashi has been elected as external Audit & Supervisory Board member as the Company believes that he will provide the Company with advice and suggestions primarily from a perspective as a tax accountant to serve ensuring adequacy and appropriateness in decision-making by the Board of Directors, and that he will also provide opinions and suggestions with regard to the accounting system and internal audit of the Company. External Audit & Supervisory Board Member Mr. Somuku Iimura concurrently serves as Partner at the law firm Nishimura & Asahi LPC and the Company is receiving legal and other advice from him when necessary. However, because the scale of annual transactions between the Company and the aforementioned law firm is insubstantial and accounts for less than 0.003% of the Company’s consolidated net sales, the Company believes that it is not significant enough to cause a conflict of interests. Mr. Somuku Iimura also serves as an outside Director at Maruha Nichiro Corporation and an outside Corporate Auditor at NACHI-FUJIKOSHI CORP. However, there is no special relationship between the Company and the entities at which he holds the significant concurrent positions. The Company also believes that Mr. Somuku Iimura will contribute to the corporate governance and management of the Company by providing his opinion relating to management from a different viewpoint based on his abundant experience and outstanding knowledge from a fair and neutral position as an Attorney. Although the Company has not established its own criteria or policies regarding the independence of external directors and external Audit & Supervisory Board members to be applied when appointing such persons, the Company refers to criteria established by other institutions, such as of the securities exchange and the like, in assessing the independence of independent director/auditor considered for appointment.
(2) Coordination between supervision by External Directors or auditing by External Audit & Supervisory Board Members and Internal Auditing, Audits by Audit & Supervisory Board Members and by Accounting Auditor, and Relationship with Internal Control Divisions
Based on their expert knowledge and abundant experience, external directors supervise the business execution of directors, provide valuable opinions and suggestion on the Company’s management policy and management plan, etc., and supervise transactions that conflict with the interests of the directors and major shareholders, etc.

28
External Audit & Supervisory Board members may be present at meetings of the Board of Directors and/or Audit & Supervisory Board and may work with the Internal Audit Office and the accounting auditor in carrying out audits, during which such members may state their opinions or demand explanations.

29
3) Status of Audit
(1) Audits by Audit & Supervisory Board Members
The Company’s Audit & Supervisory Board system relies on one standing Audit & Supervisory Board member and two non-standing (external) Audit & Supervisory Board members. These auditors participate in the Board of Directors meetings and other important business meetings to monitor the directors’ performance of their duties. The Audit & Supervisory Board can work together with the Internal Audit Office and the auditing firm in carrying out audits such as by exchanging information as necessary and the like. The standing Audit & Supervisory Board member, or his or her designee, can be present at meetings of the Board of Directors and other meeting where the execution of operations is discussed, at which such person may state his/her opinions or demand explanations.
(2) Internal Auditing
The Company has established the Internal Audit Office to strengthen its internal auditing functions. Reporting directly to the President and employing seven full-time staff, such office engages in the auditing of daily business activities, observation of inventory count or the like, internal checks and internal auditing. Functioning in cooperation with the Audit & Supervisory Board members and the auditing firm, such as by exchanging information as necessary and the like, such office provides an audit perspective to ensure that the Company’s business activities are conducted properly and efficiently.
(3) Status of Accounting Audits
(i) Auditing Firm
KPMG AZSA LLC
(ii) Certified Public Accountants Who Performed the Audit
Designated limited liability partners Engagement partners: Junshi Ono, Kentaro Mikuriya, Tsutomu Fukushima
(iii) Composition of Assistants in Auditing Operations
17 certified public accountants, 11 other members
(iv) Policy and Reasons for Selection of Auditing Firm
Where the accounting auditor is unable to execute their duties and the Audit & Supervisory Board deems necessary, it will decide on the contents of an agenda item for the dismissal or non-reappointment of the accounting auditor to be submitted to the General Meeting of Shareholders.
Furthermore, where the accounting auditor is recognized to fall under the items stipulated in Article 340, Paragraph 1 of the Companies Act, the accounting auditor will be dismissed base on the unanimous agreement of the Audit & Supervisory Board. In this case, at the first General Meeting of Shareholders convened after the dismissal, an Audit & Supervisory Board member selected by the Audit & Supervisory Board will report that the accounting auditor has been dismissed and provide the reasons for such.
As there were no incidents corresponding to the dismissal or non-reappointment of KPMG AZSA LLC, the Audit & Supervisory Board has reappointed it as the Company’s auditing firm.

30
(v) Evaluation of the Auditing Firm by the Audit & Supervisory Board Members and Audit &
Supervisory Board
The Audit & Supervisory Board performs evaluations of the auditing firm. In these evaluations, the Audit & Supervisory Board monitors and evaluates whether the accounting auditor maintains an independent position and whether he/she is properly implementing audits, receives reports on the status of the execution of duties from the accounting auditor, and requests explanations where necessary. Furthermore, the Audit & Supervisory Board receives notifications from the accounting auditor stating that “systems for ensuring that the performance of the duties of Financial Auditor(s) is being carried out correctly” (items listed in Article 131 of the Regulation on Corporate Accounting) are in place according to “Quality Control Standards concerning Audit” (October 28, 2005, Business Accounting Council), and requests explanations where necessary. As a result of this process, the evaluation of the Audit & Supervisory discovered no problems in the execution of duties by the accounting auditor.
(vi) Auditing Firm Transfers
No items to report

31
CONSOLIDATED BALANCE SHEETS Yamada Denki Co., Ltd. and Consolidated Subsidiaries
As of March 31, 2019 and 2018
Millions of yen
Thousands of U.S. dollars
(Note 1) 2019 2018 2019 ASSETS Current assets:
Cash and time deposits (Notes 6 and 8) ·························· ¥ 51,681 ¥ 52,041 $ 465,556 Notes and accounts receivable (Notes 8 and 17): - Trade ······························································· 62,794 45,904 565,664 - Non-consolidated subsidiaries and affiliated companies ··· 54 65 486
Sub-total ······················································· 62,848 45,969 566,150 Inventories ··························································· 387,459 383,463 3,490,307 Other current assets (Notes 8 and 26) ···························· 58,016 49,868 522,618 Allowance for doubtful accounts ································· (1,541) (1,841) (13,881)
Total current assets ··········································· 558,463 529,500 5,030,750 Property and equipment:
Buildings and structures, net (Notes 11, 12 and 19) ············ 210,307 216,556 1,894,489 Land (Notes 12 and 14) ············································ 189,002 187,827 1,702,570 Lease assets, net (Notes 11, 12 and 13) ·························· 8,818 9,559 79,431 Others, net (Notes 11 and 12) ····································· 12,496 14,126 112,569
Total property and equipment, net ························· 420,623 428,068 3,789,059 Intangible assets (Note 12) ·············································· 34,902 40,288 314,400 Investments and other assets (Note 12):
Investment securities (Notes 8 and 9) ···························· 9,398 9,183 84,659 Long-term loans receivable ········································ 3,113 3,511 28,041 Guarantee deposits (Notes 8 and 26) ····························· 95,220 102,080 857,760 Net defined benefit asset (Note 18) ······························· 1,558 1,846 14,039 Deferred tax assets (Note 16) ······································ 30,534 27,166 275,052 Other assets ·························································· 32,212 36,222 290,171 Allowance for doubtful accounts ································· (1,981) (2,296) (17,846)
Total investments and other assets ························· 170,054 177,712 1,531,876
Total assets ································································ ¥ 1,184,042 ¥ 1,175,568 $ 10,666,085

32
CONSOLIDATED BALANCE SHEETS Yamada Denki Co., Ltd. and Consolidated Subsidiaries
As of March 31, 2019 and 2018
Millions of yen
Thousands of U.S. dollars
(Note 1) 2019 2018 2019 LIABILITIES AND NET ASSETS Current liabilities:
Notes and accounts payable (Note 8) ···························· ¥ 114,006 ¥ 98,551 $ 1,026,989 Short-term loans payable (Notes 8 and 14) ····················· 95,930 84,581 864,157 Current portion of bonds (Notes 8 and 15) ····················· 100,017 - 900,970 Current portion of long-term loans payable (Notes 8 and 14) ·······························································
41,151 45,215 370,693
Lease obligations (Notes 13 and 14) ···························· 2,695 2,542 24,277 Income taxes payable (Note 16) ·································· 10,701 4,758 96,401 Provision for bonuses ·············································· 8,275 8,456 74,539 Provision for directors’ bonuses ·································· 117 118 1,053 Provision for point card certificates ····························· 12,172 7,835 109,652 Provision for warranties for completed construction ·········· 667 593 6,011 Provision for losses on liquidation of subsidiaries ··········· 282 303 2,544 Other current liabilities (Notes 14, 18 and 26) ················· 50,502 54,269 454,929
Total current liabilities ······································ 436,515 307,221 3,932,215 Long-term liabilities:
Bonds (Notes 8 and 15) ··········································· - 100,117 - Long-term loans payable (Notes 8 and 14) ····················· 66,429 88,594 598,402 Lease obligations (Notes 13 and 14) ···························· 9,024 10,232 81,293 Asset retirement obligations (Note 19) ·························· 32,803 31,685 295,497 Provision for directors’ retirement benefits ····················· 477 465 4,294 Provision for product warranties ································· 7,974 9,638 71,831 Provision for losses on interest repayments ···················· 50 98 447 Provision for gift certificates, etc. ······························· 155 206 1,401 Net defined benefit liability (Note 18) ·························· 28,114 26,288 253,257 Other long-term liabilities (Notes 14 and 16) ·················· 10,908 12,284 98,260
Total long-term liabilities ·································· 155,934 279,607 1,404,682 Total liabilities ··························································· 592,449 586,828 5,336,897 Contingent liabilities (Note 17) Net assets (Note 20):
Common stock: authorized – 2,000,000,000 shares issued – 966,489,740 shares in 2019 and 2018 ············
71,059 71,059 640,112 Capital surplus ······················································ 79,404 84,608 715,283 Retained earnings ·················································· 503,701 500,164 4,537,435 Treasury stock, at cost – 153,169,159 shares in 2019
and 166,136,138 shares in 2018 ······························
(67,953) (73,704) (612,130) Accumulated other comprehensive income (loss):
Valuation difference on available-for-sale securities, net of taxes (Note 9) ············································
540 1,854 4,862 Foreign currency translation adjustments ······················· 313 (815) 2,819 Remeasurements of defined benefit plans (Note 18) ·········· 1,420 2,352 12,795
Subscription rights to shares (Note 21) ······························· 1,493 1,153 13,453 Non-controlling interests ··············································· 1,616 2,069 14,559 Total net assets ··························································· 591,593 588,740 5,329,188 Total liabilities and net assets ·········································· ¥ 1,184,042 ¥ 1,175,568 $ 10,666,085
The accompanying notes are an integral part of these financial statements.

33
CONSOLIDATED STATEMENTS OF INCOME Yamada Denki Co., Ltd. and Consolidated Subsidiaries
Years ended March 31, 2019 and 2018
Millions of yen
Thousands of U.S. dollars
(Note 1) 2019 2018 2019 Net sales (Note 25):
- Trade ·································································· ¥ 1,600,484 ¥ 1,571,987 $ 14,417,479 - Non-consolidated subsidiaries and affiliated companies ······ 99 1,886 892
Sub-total ························································ 1,600,583 1,573,873 14,418,371 Cost of sales (Note 26) ··················································· 1,159,592 1,135,758 10,445,839 Gross profit ································································· 440,991 438,115 3,972,532 Selling, general and administrative expenses (Notes 22 and 26) ··· 413,126 399,352 3,721,524 Operating profit ···························································· 27,865 38,763 251,008 Other income (expenses):
Interest income ······················································· 899 970 8,102 Interest expenses ······················································ (1,243) (1,319) (11,194) Purchase discounts ··················································· 4,501 4,312 40,549 Impairment loss (Note 12) ··········································· (9,966) (5,515) (89,771) Others, net (Note 23) ················································· 3,041 2,804 27,386
Total other expenses ·········································· (2,768) 1,252 (24,928) Profit before income taxes ··············································· 25,097 40,015 226,080 Income taxes (Note 16):
Current ································································· 14,342 12,103 129,193 Deferred ································································ (4,039) (1,019) (36,382)
Total income taxes ············································ 10,303 11,084 92,811 Profit ········································································ 14,794 28,931 133,269 Profit attributable to non-controlling interests ························· 102 (849) 915
Profit attributable to owners of parent ·································· ¥ 14,692 ¥ 29,780 $ 132,354
Yen U.S. dollars
(Note 1) Amounts per share of common stock:
Basic earnings per share ············································· ¥ 18.19 ¥ 36.78 $ 0.16 Diluted earnings per share ·········································· 18.08 36.66 0.16 Cash dividends applicable to the year ····························· 13.00 13.00 0.12
The accompanying notes are an integral part of these financial statements.
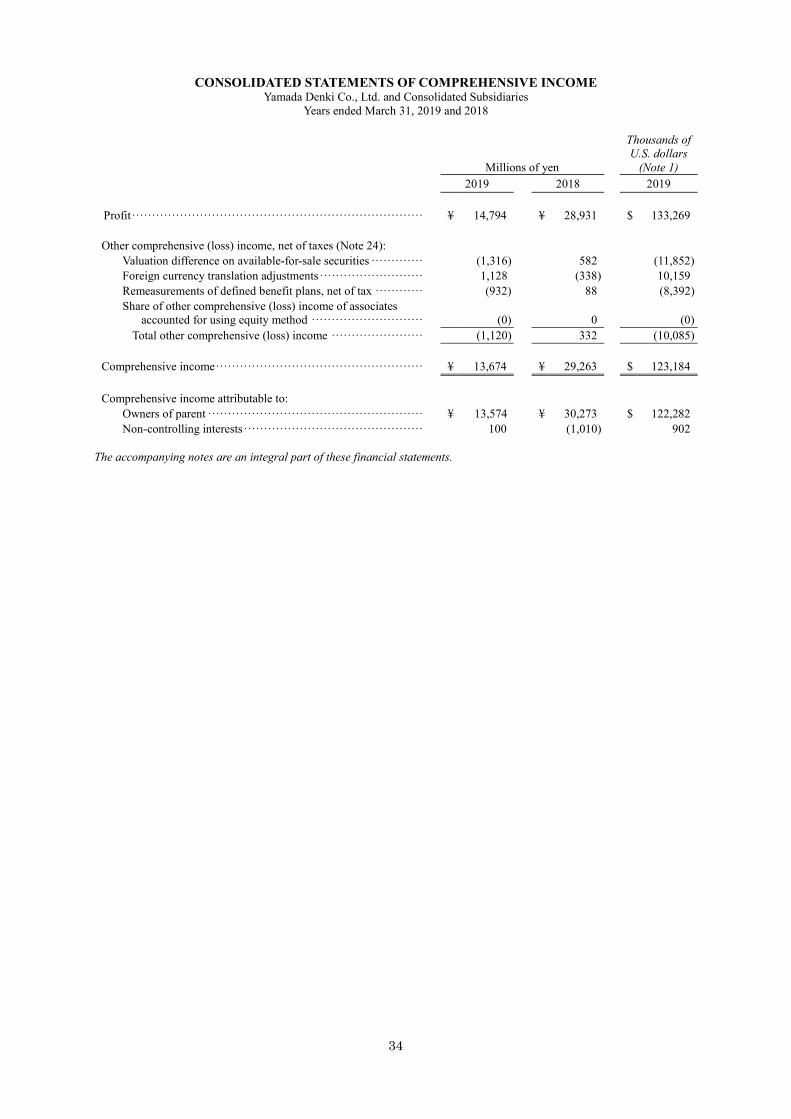
34
CONSOLIDATED STATEMENTS OF COMPREHENSIVE INCOME Yamada Denki Co., Ltd. and Consolidated Subsidiaries
Years ended March 31, 2019 and 2018
Millions of yen
Thousands of U.S. dollars
(Note 1) 2019 2018 2019
Profit ········································································· ¥ 14,794 ¥ 28,931 $ 133,269 Other comprehensive (loss) income, net of taxes (Note 24):
Valuation difference on available-for-sale securities ············· (1,316) 582 (11,852) Foreign currency translation adjustments ·························· 1,128 (338) 10,159 Remeasurements of defined benefit plans, net of tax ············ (932) 88 (8,392) Share of other comprehensive (loss) income of associates
accounted for using equity method ····························
(0) 0 (0) Total other comprehensive (loss) income ······················· (1,120) 332 (10,085)
Comprehensive income ···················································· ¥ 13,674 ¥ 29,263 $ 123,184 Comprehensive income attributable to:
Owners of parent ······················································ ¥ 13,574 ¥ 30,273 $ 122,282 Non-controlling interests ············································· 100 (1,010) 902
The accompanying notes are an integral part of these financial statements.

35
CONSOLIDATED STATEMENTS OF CHANGES IN NET ASSETS Yamada Denki Co., Ltd. and Consolidated Subsidiaries
Years ended March 31, 2019 and 2018
Millions of yen
Shareholders’ equity Accumulated other comprehensive income (loss)
Number of shares of common
stock (Thousands)
Common stock
Capital surplus
Retained earnings
Treasury stock, at cost
Valuation difference on
available-for-sale securities,
net of taxes (Note 9)
Foreign currency
translation adjustments
Remeasurements of defined benefit
plans (Note 18)
Subscription
rights to shares (Note 21)
Non-
controlling interests Total net assets
Balance at April 1, 2017 ··········· 966,490 ¥ 71,059 ¥ 73,734 ¥ 480,847 ¥ (67,214) ¥ 1,222 ¥ (486) ¥ 2,162 ¥ 843 ¥ 23,381 ¥ 585,548
Cash dividends ··················· (10,463) (10,463)
Profit attributable to owners of parent······················· 29,780
29,780
Purchase of treasury stock ······ (15,997) (15,997)
Disposal of treasury stock ······· (2) 15 13
Purchase of shares of consolidated subsidiaries ·· 10,876 9,492 20,368
Other changes in the year, net ·· 632 (329) 190 310 (21,312) (20,509)
Balance at March 31, 2018 ········ 966,490 71,059 84,608 500,164 (73,704) 1,854 (815) 2,352 1,153 2,069 588,740
Cash dividends ··················· (10,404) (10,404)
Profit attributable to owners of parent······················· 14,692 14,692
Purchase of treasury stock ······ (4) (4)
Disposal of treasury stock ······· 0 0 0
Decrease by merger ·············· (751) (751)
Purchase of shares of consolidated subsidiaries ·· (5,205) 5,755 551
Other changes in the year, net ·· (1,314) 1,128 (932) 340 (453) (1,231)
Balance at March 31, 2019 ········ 966,490 ¥ 71,059 ¥ 79,404 ¥ 503,701 ¥ (67,953) ¥ 540 ¥ 313 ¥ 1,420 ¥ 1,493 ¥ 1,616 ¥ 591,593
Thousands of U.S. dollars (Note 1)
Shareholders’ equity Accumulated other comprehensive income (loss)
Common stock
Capital surplus
Retained earnings
Treasury stock, at cost
Valuation difference on
available- for-sale securities,
net of taxes (Note 9)
Foreign currency
translation adjustments
Remeasurements of defined benefit
plans (Note 18)
Subscription rights to shares
(Note 21)
Non- controlling
interests Total net
assets
Balance at April 1, 2018 ························· $ 640,112 $ 762,171 $ 4,505,579 $ (663,945) $ 16,705 $ (7,340) $ 21,183 $ 10,390 $ 18,636 $ 5,303,492
Cash dividends ································· (93,727) (93,727)
Profit attributable to owners of parent ······ 132,354 132,354
Purchase of treasury stock ···················· (34) (34)
Disposal of treasury stock ···················· 1 5 6
Decrease by merger ··························· (6,771) (6,771)
Purchase of shares of consolidated subsidiaries ·······························
(46,889) 51,844
4,954
Other changes in the year, net ················ (11,843) 10,159 (8,388) 3,063 (4,077) (11,086)
Balance at March 31, 2019 ····················· $ 640,112 $ 715,283 $ 4,537,435 $ (612,130) $ 4,862 $ 2,819 $ 12,795 $ 13,453 $ 14,559 $ 5,329,188
The accompanying notes are an integral part of these financial statements.

36
CONSOLIDATED STATEMENTS OF CASH FLOWS Yamada Denki Co., Ltd. and Consolidated Subsidiaries
Years ended March 31, 2019 and 2018
Millions of yen
Thousands of U.S. dollars
(Note 1) 2019 2018 2019 Cash flows from operating activities:
Profit before income taxes··········································· ¥ 25,097 ¥ 40,015 $ 226,080 Depreciation ··························································· 18,926 19,622 170,488 Amortization of goodwill ············································ 516 86 4,651 Increase (decrease) in provision for point card certificates ····· 4,337 (2,956) 39,072 Decrease in provision for product warranties ····················· (1,664) (2,046) (14,986) Decrease in allowance for doubtful accounts ····················· (536) (2,982) (4,830) Increase in net defined benefit liability ···························· 1,182 1,715 10,654 Interest and dividend income ······································· (1,100) (1,088) (9,913) Interest expenses ······················································ 1,243 1,319 11,194 Foreign exchange losses (gain) ····································· 324 (597) 2,922 Gain on sale of investment securities ······························ (556) (1) (5,012) Loss on sale and disposal of property and equipment, net ······ 129 553 1,161 Impairment loss ······················································· 9,966 5,515 89,771 (Increase) decrease in notes and accounts receivable ············ (16,951) 11,198 (152,699) (Decrease) increase in advances received ························· (2,731) 687 (24,601) Increase in inventories ··············································· (4,198) (3,156) (37,815) Increase in notes and accounts payable ···························· 15,730 13,484 141,697 Increase in accounts receivable ····································· (2,110) (2,698) (19,006) (Decrease) increase in consumption taxes payable ·············· (3,063) 372 (27,594) (Increase) decrease in other current assets ························ (432) 426 (3,890) Increase in other current liabilities ································· 1,668 19 15,028 Other, net ······························································ (495) 2,509 (4,463)
Sub-total ··························································· 45,282 81,996 407,909 Interest and dividend income received ···························· 400 303 3,608 Interest expenses paid ················································ (1,250) (1,332) (11,256) Income taxes paid ···················································· (8,409) (19,278) (75,754)
Net cash provided by operating activities ···················· ¥ 36,023 ¥ 61,689 $ 324,507
(Continued)
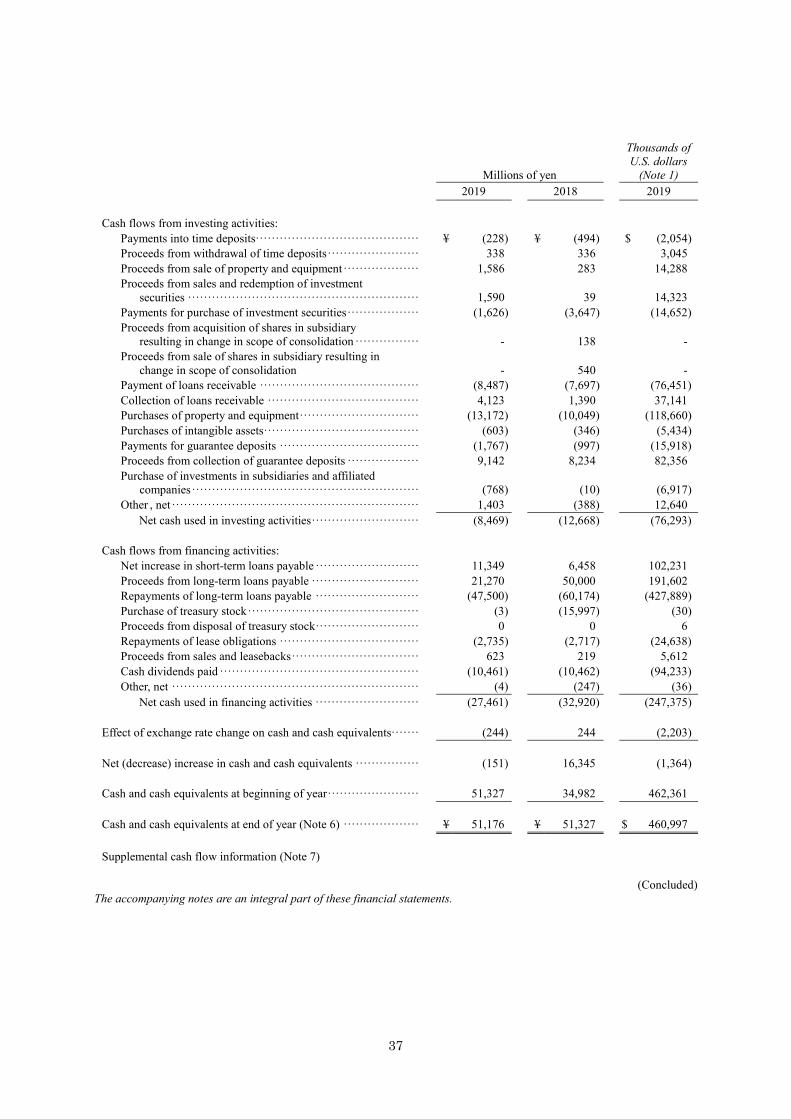
37
Millions of yen
Thousands of U.S. dollars
(Note 1) 2019 2018 2019 Cash flows from investing activities:
Payments into time deposits·········································· ¥ (228) ¥ (494) $ (2,054) Proceeds from withdrawal of time deposits ························ 338 336 3,045 Proceeds from sale of property and equipment ···················· 1,586 283 14,288 Proceeds from sales and redemption of investment
securities ···························································
1,590 39 14,323 Payments for purchase of investment securities ··················· (1,626) (3,647) (14,652) Proceeds from acquisition of shares in subsidiary
resulting in change in scope of consolidation ·················
- 138 - Proceeds from sale of shares in subsidiary resulting in
change in scope of consolidation
- 540 - Payment of loans receivable ········································· (8,487) (7,697) (76,451) Collection of loans receivable ······································· 4,123 1,390 37,141 Purchases of property and equipment ······························· (13,172) (10,049) (118,660) Purchases of intangible assets········································ (603) (346) (5,434) Payments for guarantee deposits ···································· (1,767) (997) (15,918) Proceeds from collection of guarantee deposits ··················· 9,142 8,234 82,356 Purchase of investments in subsidiaries and affiliated
companies ··························································
(768) (10) (6,917) Other , net ······························································· 1,403 (388) 12,640
Net cash used in investing activities ···························· (8,469) (12,668) (76,293) Cash flows from financing activities:
Net increase in short-term loans payable ··························· 11,349 6,458 102,231 Proceeds from long-term loans payable ···························· 21,270 50,000 191,602 Repayments of long-term loans payable ··························· (47,500) (60,174) (427,889) Purchase of treasury stock ············································ (3) (15,997) (30) Proceeds from disposal of treasury stock··························· 0 0 6 Repayments of lease obligations ···································· (2,735) (2,717) (24,638) Proceeds from sales and leasebacks ································· 623 219 5,612 Cash dividends paid ··················································· (10,461) (10,462) (94,233) Other, net ······························································· (4) (247) (36)
Net cash used in financing activities ··························· (27,461) (32,920) (247,375) Effect of exchange rate change on cash and cash equivalents········ (244) 244 (2,203) Net (decrease) increase in cash and cash equivalents ················· (151) 16,345 (1,364) Cash and cash equivalents at beginning of year ························ 51,327 34,982 462,361 Cash and cash equivalents at end of year (Note 6) ···················· ¥ 51,176 ¥ 51,327 $ 460,997 Supplemental cash flow information (Note 7)
(Concluded)
The accompanying notes are an integral part of these financial statements.
38
NOTES TO CONSOLIDATED FINANCIAL STATEMENTS Yamada Denki Co., Ltd. and Consolidated Subsidiaries
Years ended March 31, 2019 and 2018
1. BASIS OF PRESENTING CONSOLIDATED FINANCIAL STATEMENTS
The accompanying consolidated financial statements of Yamada Denki Co., Ltd. (the “Company”), and its consolidated subsidiaries, have been prepared in accordance with the provisions set forth in the Japanese Financial Instruments and Exchange Act and its related accounting regulations, and in conformity with accounting principles generally accepted in Japan (“Japanese GAAP”), which are different in certain respects as to application and disclosure requirements of the International Financial Reporting Standards.
The accompanying consolidated financial statements have been restructured and translated into English with some expanded descriptions from the consolidated financial statements of the Company prepared in accordance with Japanese GAAP and filed with the appropriate Local Finance Bureau of the Ministry of Finance as required by the Japanese Financial Instruments and Exchange Act. Some supplementary information included in the statutory Japanese language consolidated financial statements, but not required for fair presentation, is not presented in the accompanying consolidated financial statements.
The translations of the Japanese yen amounts into U.S. dollars are included solely for the convenience of readers outside Japan, using the prevailing exchange rate at March 31, 2019, which was ¥111.01 to U.S. $1. Such translations should not be construed as representations that the Japanese yen amounts have been, could have been, or could in the future be converted into U.S. dollars at this or any other rate of exchange.
2. SUMMARY OF SIGNIFICANT ACCOUNTING POLICIES
(a) Principles of Consolidation
The consolidated financial statements include the accounts of the Company and its 29 significant subsidiaries (together, the “Group”). NAKAYAMA CO., LTD. has been excluded from the scope of consolidation due to an absorption-type merger with the Company as the surviving company on April 1, 2018. Four consolidated subsidiaries of the Company— YAMADA SXL HOME CO., LTD., Yamada Wood House Co., Ltd., Housing Works Co., Ltd. and SxL Juko Co., Ltd.— conducted a merger of the four companies, with YAMADA SXL HOME CO., LTD. as the surviving company, on the effective date of October 1, 2018. The company name of the surviving company was changed to YAMADA HOMES Co., LTD. after the merger. Conglo Engineering Co., Ltd. was renamed Conglo Co., Ltd. as of February 1, 2019. NAKAYAMA TECHNOLOGY CORPORATION was renamed YAMADA TECHNOLOGY CORPORATION as of December 13, 2018.
All significant inter-company accounts, transactions and unrealized profits have been eliminated in
consolidation.
All of the Company’s non-consolidated subsidiaries have been insignificant in terms of the aggregated amount of their assets, net sales, profit and retained earnings and, thus, their impact on the consolidated financial statements has been immaterial.
Investments in two affiliated companies have been accounted for using the equity method.
Investments in non-consolidated subsidiaries and the remaining affiliated companies were not accounted for using the equity method, but instead carried at cost, because their impact on the consolidated financial statements has been immaterial.
In the elimination of investments in subsidiaries, the assets and liabilities of the subsidiaries, including the portion attributable to non-controlling shareholders, have been recorded based on the fair value at the time the Company acquired control of the respective subsidiaries. Goodwill (including negative goodwill recognized before April 1, 2010) is amortized using the straight-line method over 5 to 15 years.

39
The fiscal year-end of six foreign consolidated subsidiaries is at the end of December. That of other 23 consolidated subsidiaries is at the end of February. The financial statements of these subsidiaries as of and for the years ended December 31, 2018 and 2017 or February 28, 2019 and 2018, as applicable, were used in preparing the consolidated financial statements. All material transactions which occurred during the periods from their respective fiscal year-ends to March 31 have been accounted for in the consolidation process.
(b) Cash and Cash Equivalents
In preparing the consolidated statements of cash flows, cash and cash equivalents include cash on hand, readily-available bank deposits and short-term highly liquid investments with minimum risk of value fluctuation and maturities not exceeding three months at the time of purchase.
(c) Securities
Under Japanese GAAP, companies are required to examine their intent for holding each security and to classify their securities as (i) securities held for trading purposes (“Trading Securities”), (ii) debt securities intended to be held to maturity (“Held-to-maturity Debt Securities”), (iii) equity securities issued by non-consolidated subsidiaries and affiliated companies, or (iv) available-for-sale securities for all other securities that are not classified in any of the above categories (“Available-for-sale Securities”).
Equity securities issued by non-consolidated subsidiaries and affiliated companies are stated at moving-average cost. Available-for-sale Securities with fair market value are stated at fair market value. Unrealized gains and losses on such securities are reported, net of applicable income taxes, as a separate component of net assets. Realized gain and loss on sale of such securities is computed using the moving-average cost. Other Available-for-sale Securities with no fair market values are stated principally at the moving-average cost. The Company and its consolidated subsidiaries had no Trading Securities or Held-to-maturity Debt Securities.
Investments in limited partnerships (“LPS”) and/or similar ventures (considered as securities under the Japanese Financial Instruments and Exchange Act) are stated at the amounts of the corresponding equity portions using the most recent financials available based on the reporting date stipulated in the contracts relating to such LPS and/or similar ventures.
(d) Derivative Transactions and Hedge Accounting
Derivative financial instruments are stated at fair value and changes in fair value are recognized as gains or losses unless derivative transactions are used for hedging purposes.
If derivative financial instruments are used as hedges and meet certain hedging criteria, recognition of gains or losses resulting from changes in their fair value is deferred until the related losses or gains on the hedged items are recognized.
Also, if an interest rate swap contract is used as a hedge and meets certain hedging criteria, the net amount to be paid or received under such interest rate swap contract is added to or deducted from the interest on the assets or liabilities for which such swap contact was executed.
The Company utilizes interest rate swaps to hedge its exposure to adverse fluctuation in exchange rates. These contracts are used for its long-term borrowings. The Company and these consolidated subsidiaries do not enter into such transactions for speculative trading purposes.
The effectiveness of hedges is assessed by the ratio of accumulated fluctuations in market value or cash flows of hedging instruments to those in market value or cash flows of hedged items. Under Japanese GAAP, however, such assessment is not required for certain derivatives which meet specific criteria.
40
(e) Inventories
Inventories are primarily stated at the lower of moving-average cost or market value.
(f) Property and Equipment (except for lease assets)
Property and equipment are stated at cost. Depreciation is mainly computed using the straight-line method.
The estimated useful lives of significant assets are as follows.
Buildings and structures ··························································· 2 - 47 years
(g) Intangible Assets (except for lease assets)
Intangible assets are amortized using the straight-line method. Software for internal use is amortized using the straight-line method over an estimated useful life of five years.
(h) Impairment
The Company and its consolidated subsidiaries review their property and equipment for impairment whenever events or changes in circumstances indicate that the carrying amount of an asset or asset group may not be recoverable. An impairment loss is recognized if the carrying amount of an asset or asset group exceeds the sum of the undiscounted future cash flows expected to result from continued use and eventual disposition of such asset or asset group. The impairment loss is measured as the amount by which the carrying amount of an asset exceeds its recoverable amount, which should be the higher of the discounted cash flows from continued use and eventual disposition of the asset or the net selling price at disposition.
(i) Long-term Prepaid Expenses
Long-term prepaid expenses are amortized using the straight-line method.
(j) Allowance for Doubtful Accounts
An allowance for doubtful accounts is provided at an amount sufficient to cover possible losses on collection. It consists of the estimated uncollectible amount with respect to certain identified doubtful receivables and the amount calculated based on historical loss experience for other doubtful receivables.
(k) Provision for Bonuses
A provision for bonuses is provided at the estimated amount accrued during the current fiscal year to cover future bonus payments to employees.
(l) Provision for Directors’ Bonuses
A provision for bonuses to directors and Audit & Supervisory Board members is provided at the estimated amount accrued during the current fiscal year to cover future bonus payments to directors and Audit & Supervisory Board members.
(m) Provision for Point Card Certificates
The Company and its consolidated subsidiaries which conduct similar businesses provide their customers with credit points when they make purchases at their stores. Thus, the Company and some of its consolidated subsidiaries set aside a provision for the estimated future costs of credit points.

41
(n) Provision for Warranties for Completed Construction
Some of the consolidated subsidiaries provide for losses on guarantees and after-service expenses due to defects found after completed construction. The amount of such provision is calculated by multiplying related sales by the historical rate of such expenses.
(o) Provision for Losses on Interest Repayments
Some of the consolidated subsidiaries provide for losses on interest repayments at the estimated amount of future customer claims for a refund on the portion of the loan interest in excess of the maximum rate prescribed under the Interest Rate Restriction Act.
(p) Provision for Directors’ Retirement Benefits
Some of the consolidated subsidiaries each set aside a provision for directors’ and Audit & Supervisory Board members’ retirement benefits based on internal rules. Such provision is calculated at the estimated payable amount if all officers were to retire at the balance sheet date. The payment of such retirement benefits is subject to approval at a shareholders’ meeting.
(q) Provision for Product Warranties
The Company and its consolidated subsidiaries which conduct similar businesses each set aside a provision for warranty for future repair expenses at the estimated amount calculated based on historical repair expense.
(r) Provision for Losses on Liquidation of Subsidiaries
Some of the consolidated subsidiaries provide for losses on liquidation of its subsidiaries at the estimated amount of such losses.
(s) Provision for Gift Certificates, etc.
Certain consolidated subsidiaries provide for losses on late collection of gift certificates, etc. already having accounted for as a gain after passing a defined period of time, at the estimated amount for future collection calculated based on historical experience.
(t) Leases
Assets of finance leases are depreciated over the lease term using the straight-line method with zero residual value.
In March 2007, the Accounting Standards Board of Japan (“ASBJ”) issued ASBJ Statement No. 13, “Accounting Standard for Lease Transactions,” which revised the previous accounting standard for lease transactions.
Under the previous accounting standard, finance leases that were deemed to transfer ownership of the leased property to the lessee were capitalized. However, other finance leases were permitted to be accounted for as operating lease transactions if certain “as if capitalized” information was disclosed in a note to the lessee’s financial statements. The revised accounting standard requires that all finance lease transactions be capitalized by recognizing leased assets and lease obligations in the consolidated balance sheet. In addition, the revised accounting standard permits leases which existed at the transition date and do not transfer ownership of the leased property to the lessee to continue to be accounted for as operating lease transactions.
The Group applied the revised accounting standard effective September 1, 2008. In addition, some of the consolidated subsidiaries accounted for leases which existed at the transition date and do not transfer ownership of the leased property to the lessee as operating lease transactions.
42
(u) Calculation Method of Retirement Benefits
In determining the retirement benefit liability, the benefit formula basis is adopted as the attribution method of the projected retirement benefit.
Prior service costs are amortized from the fiscal year in which such costs are incurred using the straight-line method over a certain period of time (mainly five years) not exceeding the average remaining service period of the eligible employees.
Actuarial gains or losses incurred during the year are amortized from the succeeding fiscal year using the straight-line method over a certain period of time (mainly five years) not exceeding the average remaining service period of the eligible employees.
Certain consolidated subsidiaries apply the simplified method in calculating the defined benefit liability and retirement benefit costs, which assumes the benefit obligation to be equal to the benefits payable assuming the voluntary retirement of all employees at fiscal year-end.
(v) Recognition of Revenues and Costs
The methods used to recognize revenues and costs under construction contracts are as follows:
i) Construction contracts under which the portion of construction to be completed by the end of the current fiscal year may be estimated reliably: Percentage-of-completion method (The percentage of completion is measured as the ratio of the cost incurred to the estimated total cost); and,
ii) Other construction contracts: Completed-contract method.
(w) Income Taxes
A provision for income taxes is computed based on the profit before income taxes included in the statements of income for the Company and each of its consolidated subsidiaries. The assets and liabilities approach is used to recognize deferred tax assets and liabilities for the expected future tax consequences of temporary differences between the financial statements’ carrying amounts and the tax bases of assets and liabilities.
(x) Per Share Information
Basic earnings per share of common stock is computed based upon the weighted-average number of shares outstanding during each year. For diluted earnings per share, both profit and shares outstanding are adjusted based on the assumptions that convertible bonds would be converted and stock options (subscription rights to shares) exercised. However, the dilutive effect of euro yen convertible bonds due in 2019 was not reflected for the fiscal year ended March 31, 2018 because they were anti-dilutive.
Cash dividends per share represent interim dividends declared by the Board of Directors in each fiscal year and year-end dividends approved by the shareholders at an annual meeting held subsequent to the end of each fiscal year.
43
3. ACCOUNTING STANDARD AND GUIDANCE ISSUED BUT NOT YET APPLIED
• “Accounting Standard for Revenue Recognition” (ASBJ Statement No. 29, March 30, 2018) • “Implementation Guidance on Accounting Standard for Revenue Recognition” (ASBJ Guidance No. 30, March 30, 2018)
a) Outline:
The International Accounting Standards Board (IASB) and the U.S. Financial Accounting Standards Board (FASB) jointly developed comprehensive accounting standards for revenue recognition and published the “Revenue from Contracts with Customers” (IFRS 15 for the IASB and Topic 606 for the FASB) in May 2014. IFRS 15 is effective for fiscal years beginning on or after January 1, 2018 and Topic 606 is effective for fiscal years beginning after December 15, 2017. Given these circumstances, the ASBJ has developed comprehensive accounting standards for revenue recognition and published them with the implementation guidance thereon. The basic policy of the ASBJ in developing accounting standards for revenue recognition is thought to set such accounting standards by adopting the basic principles of IFRS 15 as a starting point, from the viewpoint of comparability among financial statements, which is one of benefits of ensuring consistency with IFRS 15, and to additionally provide for alternative accounting treatment to the extent that it would not impair comparability, if there is an item to be taken into consideration in practices that have been conducted in Japan.
b) Planned date of application:
To be applied from the beginning of the fiscal year ending March 31, 2022.
c) Impact of application of the accounting standards: The impact of the application of the “Accounting Standard for Revenue Recognition” and the “Implementation Guidance on Accounting Standard for Revenue Recognition” on the Company’s consolidated financial statements is currently being evaluated.
4. CHANGE IN PRESENTATION
Changes due to application of “Partial Amendments to Accounting Standard for Tax Effect Accounting” The Company and its domestic subsidiaries have applied “Partial Amendments to Accounting Standard
for Tax Effect Accounting” (ASBJ Statement No. 28, February 16, 2018; the “Partial Amendments”) from the beginning of the fiscal year ended March 31, 2019. Accordingly, deferred tax assets are classified as investments and other assets and deferred tax liabilities are classified as long-term liabilities.
As a result, ¥9,175 million of “deferred tax assets” classified as “current assets” in the consolidated balance sheet as of March 31, 2018 has been included in ¥27,166 million of “deferred tax assets” under “investments and other assets.”
Moreover, matters in note 8 (except for total amount of valuation allowances) and note 9 of explanatory notes to “Accounting Standard for Tax Effect Accounting” specified in Paragraphs 3 through 5 of the Partial Amendments were added to the notes on income taxes. These matters related to the fiscal year ended March 31, 2018, however, are not presented in accordance with the transitional provisions in Paragraph 7 of the Partial Amendments.
5. BUSINESS COMBINATIONS
Transactions under common control
1) Absorption-type merger with a wholly owned consolidated subsidiary
The Company conducted an absorption-type merger with NAKAYAMA CO., LTD. (“NAKAYAMA”), a wholly owned consolidated subsidiary, with effective date of April 1, 2018, based on a resolution at its Board of Directors meeting held on February 25, 2018.
44
1. Summary of transaction
a) Name and business lines of the combined company Name of the combined company: NAKAYAMA CO., LTD. Business lines: Home renovation, architectural design management, housing
materials manufacturing, equipment manufacturing, and CG/CAD services
b) Date of business combination: April 1, 2018 c) Legal form of business combination
Absorption-type merger, with the Company as the surviving company and NAKAYAMA, as the dissolving company
d) Name of the company after business combination: Yamada Denki Co., Ltd. e) Other
The Group promotes the development of a network of stores incorporating new concepts, in consideration of the changes in social needs, including the declining birth rate, the aging of society, decreasing population and the transition to an internet society, to continue to grow and develop in the future, with home electrical appliances as the core of the life infrastructure offering, “Total package of housing,” a pillar of new business. NAKAYAMA, as a renovation manufacturer, offers development and manufacture of products, sales, operation and after-sales services, comprehensively. This merger is aimed at, after the acquisition of shares of NAKAYAMA on November 30, 2017, further improving group management efficiency and strengthening our business foundation and sales strategies, by combining NAKAYAMA with new business style stores and integrating headquarters functions and various infrastructures.
2. Summary of accounting applied
The transaction was accounted for as a transaction under common control in accordance with “Accounting Standard for Business Combinations” (ASBJ Statement No. 21) and “Implementation Guidance on Accounting Standard for Business Combinations and Accounting Standard for Business Divestitures” (ASBJ Guidance No. 10).
2) Conversion of YAMADA SXL HOME CO., LTD. into a wholly owned subsidiary through share exchange
The Company resolved at its Board of Directors meeting held on June 15, 2018 to conduct a share exchange with YAMADA SXL HOME CO., LTD. (“SxL”), whereby the Company became a wholly owning parent company and SxL became a wholly owned subsidiary. The share exchange was conducted on September 1, 2018.
1. Summary of transaction
a) Name and business lines of the target company Name of the company: YAMADA SXL HOME CO., LTD. Business lines: Housing, renovation, real estate rental and other businesses
b) Date of the business combination: September 1, 2018 c) Legal form of business combination
Share exchange d) Name of the company after business combination
No change to the company name e) Other
The aim of this transaction was optimization and maximization of the value chain through the consolidation of business resources and the realization of greater synergistic effects through unified operation of the Group.
2. Summary of accounting applied
The transaction was accounted for as a transaction with non-controlling shareholders in the category of transactions under common control in accordance with “Accounting Standard for Business Combinations” (ASBJ Statement No. 21) and “Implementation Guidance on Accounting Standard for Business Combinations and Accounting Standard for Business Divestitures” (ASBJ Guidance No. 10).

45
3. Matters concerning the acquisition of additional shares in subsidiary
a) Acquisition cost and breakdown by type of consideration
Consideration for the acquisition: The Company’s common stock ¥7,148 million ($64,390 thousand)
Acquisition cost ¥7,148 million ($64,390 thousand)
b) Stock type, exchange ratio and number of shares delivered
The Company (wholly owning parent company)
SxL (wholly owned subsidiary)
Share exchange ratio 1 0.132 Number of shares delivered through the share exchange Common stock: 12,972,642 shares
The share allocation by the share exchange was not performed on 105,650,000 shares of SxL that
the Company owns. In addition, the Company fully appropriated the treasury stock it owned for the shares delivered through the share exchange.
c) Calculation method for the share exchange ratio
It was decided that the Company and SxL would request their own independent third-party valuation institution to calculate the share exchange ratio to ensure fairness and appropriateness of the share exchange such as the share exchange ratio stated above in b) Stock type, exchange ratio and number of shares delivered. The Company selected Nomura Securities Co., Ltd. and SxL selected Mizuho Securities Co., Ltd. as their respective third-party valuation institutions.
By giving careful examination based on the results of due diligence, etc. that each party respectively carried out with respect to the counterparty by reference to the calculation result of the share exchange ratio submitted to them by the respective third-party valuation institution, and by giving comprehensive consideration to other factors such as the financial and asset conditions, and future outlooks of both parties, the two parties have conducted negotiations and discussions concerning the share exchange ratio. As a result, the Company and SxL reached a judgment that the share exchange ratio is appropriate for the respective shareholders. At the respective Board of Directors’ meetings of both parties held on June 15, 2018, the decision was made to conduct the share exchange by the share exchange ratio.
4. Matters concerning the change in the Group’s equity interest associated with the transaction with
non-controlling shareholders a) Main reason for change in capital surplus: Acquisition of additional shares in subsidiary b) The amount of decrease in capital surplus due to the transactions with non-controlling shareholders:
¥5,369 million ($48,366 thousand) 3) Merger between consolidated subsidiaries
Four consolidated subsidiaries of the Company— SxL, Yamada Wood House Co., Ltd., Housing Works Co., Ltd. and SxL Juko Co., Ltd.—reached a resolution at each company’s Board of Directors meeting held on August 28, 2018 on the merger of the four companies, with SxL as the surviving company, and conducted an absorption-type merger on October 1, 2018. After the merger, the company name of the surviving company was changed to YAMADA HOMES Co., LTD.

46
1. Summary of the business combination a) Name and business lines of the combined companies
Name of the company SxL Yamada Wood
House Co., Ltd. Housing Works
Co., Ltd. SxL Juko Co.,
Ltd. Business lines Housing (focus
on panel construction), renovation, real estate leasing, etc.
Housing (focus on conventional construction), etc.
Contract construction, design, construction and supervision
Manufacturing, processing and selling of industrial housing parts
b) Date of business combination: October 1, 2018 c) Legal form of business combination:
An absorption-type merger with SxL as the surviving company and Yamada Wood House Co., Ltd., Housing Works Co., Ltd. and SxL Juko Co, Ltd. as the dissolved companies
d) Name of the company after business combination YAMADA HOMES Co., LTD.
e) Other The Company decided to conduct this merger with the aim to further expand the housing business and strengthen the management foundation of the Group through integrating the technology and know-how of the four consolidated subsidiaries and aggregating its management resources, based on the concept to “brighten your future with smart housing.”
2. Summary of accounting applied
The transaction was accounted for as a transaction under common control in accordance with “Accounting Standard for Business Combinations” (ASBJ Statement No. 21) and “Implementation Guidance on Accounting Standard for Business Combinations and Accounting Standard for Business Divestitures” (ASBJ Guidance No. 10).
6. CASH AND CASH EQUIVALENTS
Cash and cash equivalents as of March 31, 2019 and 2018 in the consolidated statements of cash flows consisted of the following:
Millions of yen
Thousands of U.S. dollars
(Note 1) 2019 2018 2019 Cash and time deposits ········································ ¥ 51,681 ¥ 52,041 $ 465,556 Time deposits with maturities exceeding three months ··· (505) (714) (4,558) Cash and cash equivalents ···································· ¥ 51,176 ¥ 51,327 $ 460,998
47
7. SUPPLEMENTAL CASH FLOW INFORMATION
Assets and liabilities acquired through finance leases for the year ended March 31, 2019 were ¥1,560 million ($14,049 thousand) and ¥1,709 million ($15,391 thousand), respectively. Assets and liabilities acquired through finance leases for the year ended March 31, 2018 were ¥1,605 million and ¥1,756 million, respectively.
Assets retirement obligations for the years ended March 31, 2019 and 2018 were ¥1,356 million ($12,211 thousand) and ¥7,083 million, respectively.
Acquisition of shares in newly consolidated subsidiary with change in scope of consolidation
As a result of the acquisition of shares of NAKAYAMA, during the year ended March 31, 2018, NAKAYAMA was included in the scope of consolidation. The breakdown of the assets and liabilities at the initial consolidation and the acquisition price and proceeds from the acquisition are as follows:
Millions of yen Current assets ·············································· ¥ 2,994 Non-current assets ········································ 3,759 Goodwill 6,951 Current liabilities ·········································· (9,020) Non-current liabilities ···································· (4,239) Non-controlling interests ································· (445) Acquisition price of the shares ······················ 0 Cash and cash equivalents ······························· (138) Difference: Proceeds from acquisition of the shares ¥ 138
Sale of shares in subsidiary with change in scope of consolidation
As a result of the sale of shares in the subsidiary, Yamada Eco Solution, during the year ended March 31, 2018, Yamada Eco Solution was excluded from the scope of consolidation. The breakdown of the assets and liabilities at the time of sale and the selling price and proceeds from the sale are as follows:
Millions of yen Current assets ·············································· ¥ 1,472 Non-current assets ········································ 1,727 Current liabilities ·········································· (1,528) Non-current liabilities ···································· (748) Non-controlling interests ································· (276) Valuation difference on available-for-sale securities · (1) Loss on sale of the shares ································ (2) Selling price of the shares ··························· 644 Cash and cash equivalents ······························· (104) Difference: Proceeds from sale of the shares ····· ¥ 540
8. FINANCIAL INSTRUMENTS
I. Qualitative Information on Financial Instruments
(a) Policies for Using Financial Instruments
The Group raises necessary funds based on capital budgeting, mainly through loans from banks and issuance of bonds. Temporary surplus funds are invested in highly liquid instruments, and working capital is financed through bank loans. The Group utilizes derivative financial instruments only to manage risks described below and does not enter into such transactions for speculative trading purposes.

48
(b) Details of Financial Instruments and Related Risk
Trade notes and accounts receivable are exposed to credit risk of customers.
Investment securities, which mainly comprise equity securities issued by those who have business relationships with the Company and/or its consolidated subsidiaries, are exposed to market risk.
Guarantee deposits, which are mostly related to rental of stores, are exposed to credit risk of lessors.
Most notes and accounts payable are due within two months.
Bank loans and bonds are obtained mainly for capital expenditures. The redemption dates of bonds were within a maximum period of three months after the balance sheet date.
For certain loans payable, the Company utilizes interest rate (floating for fixed rate) swaps in order to manage interest rate risk. Some of its consolidated subsidiaries utilize currency swaps and currency options in order to reduce the foreign currency risk of foreign-currency-denominated monetary assets and liabilities. The Company also uses derivatives as hedging instruments, which is described in “Derivative Transactions and Hedge Accounting” under Note 2, entitled “SUMMARY OF SIGNIFICANT ACCOUNTING POLICIES.” Interest rate swap transactions entered into by the Company involve interest rate risk and currency swap and currency option transactions entered into by some of its consolidated subsidiaries involve foreign currency risk. Since the counterparties of derivative transactions are limited to highly credible domestic banks, credit risk that arises from contractual default by counterparties is considered to be fairly low.

49
(c) Policies and Process of Risk Management
- Credit risk management
Credit risk refers to the risk that the counterparty will default on its contractual obligation. In accordance with the Company’s sales management policy, each operating department of the Company periodically monitors the Company’s counterparties and manages the due dates and balances of trade notes and accounts receivable in order to reduce credit risk by early identification of a possible default due to financial trouble of any counterparty. The Company’s consolidated subsidiaries also manage their credit risk in the above manner.
The Company believes that the credit risk under derivative transactions is fairly low because counterparties of derivative transactions are limited to financial institutions with high credit ratings.
- Market risk management
Market risk is the risk that movements in market variables, such as foreign currency exchange rates, interest rates and market prices, result in financial loss to the Company and/or its consolidated subsidiaries. For certain loans payable, the Company utilizes interest rate (floating for fixed rate) swaps in order to manage interest rate risk. Moreover, some of its consolidated subsidiaries utilize currency swaps and currency options in order to reduce the foreign currency risk of foreign-currency-denominated monetary assets and liabilities.
The Company continuously reviews portfolios of securities by periodically monitoring fair values of each security and the financial condition of the issuer as well as market condition and the relationship with the issuer.
The basic policy, authority and maximum amount of derivative transactions are determined at a Board of Directors’ meeting, and the execution and management of derivative transactions are performed by the Financial Division. The results of transactions are reported at the Board of Directors’ meeting on a regular basis.
- Management of liquidity risk related to fund raising
Liquidity risk is the risk of being unable to meet obligations as they become due. The Company manages liquidity risk by having liquidity on hand and by formulating and renewing the fund management plan based on reports from each department.
(d) Supplemental Information on Fair Value
The fair values of financial instruments are estimated based on quoted market prices, if available, or management estimates and assumptions. Changes in estimates and assumptions used could result in different values. Additionally, notional amounts of derivative transactions, which are presented in Note 10, entitled “DERIVATIVE FINANCIAL INSTRUMENTS,” do not indicate market risk of derivative transactions.
50
II. Fair Value of Financial Instruments
The following is a summary of book values and estimated fair values of financial instruments as of March 31, 2019 and 2018:
Millions of yen 2019
Book value Fair value Valuation
gains/(losses) Financial assets:
(1) Cash and time deposits ··························· ¥ 51,681 ¥ 51,681 ¥ - (2) Notes and accounts receivable··················· 62,848
Allowance for doubtful accounts (*1) ········ (139) 62,709 62,709 - (3) Investment securities (*2) ························ 6,379 6,601 222 (4) Guarantee deposits (*3)
(including current portion) ····················· 83,014 Allowance for doubtful accounts (*1) ········ (34) 82,980 85,934 2,954
¥ 203,749 ¥ 206,925 ¥ 3,176 Financial liabilities:
(1) Notes and accounts payable ····················· ¥ 114,006 ¥ 114,006 ¥ - (2) Short-term loans payable ························· 95,930 95,930 - (3) Current portion of bonds ························· 100,017 99,858 (159) (4) Long-term loans payable
(including current portion) ····················· 107,579 107,425 (154) ¥ 417,532 ¥ 417,219 ¥ (313)
Derivative transactions (*4) ····························· ¥ 10 ¥ 10 ¥ - Thousands of U.S. dollars (Note 1) 2019
Book value Fair value Valuation
gains/(losses) Financial assets:
(1) Cash and time deposits ··························· $ 465,556 $ 465,556 $ - (2) Notes and accounts receivable··················· 566,150
Allowance for doubtful accounts (*1) ········ (1,256) 564,894 564,894 - (3) Investment securities (*2) ························ 57,462 59,458 1,996 (4) Guarantee deposits (*3)
(including current portion) ····················· 747,803 Allowance for doubtful accounts (*1) ········ (306) 747,497 774,109 26,612
$ 1,835,409 $ 1,864,017 $ 28,608 Financial liabilities:
(1) Notes and accounts payable ····················· $ 1,026,989 $ 1,026,989 $ - (2) Short-term loans payable ························· 864,156 864,156 - (3) Current portion of bonds ························· 900,970 899,544 (1,426) (4) Long-term loans payable
(including current portion) ····················· 969,096 967,704 (1,392) $ 3,761,211 $ 3,758,393 $ (2,818)
Derivative transactions (*4) ····························· $ 91 $ 91 $ -
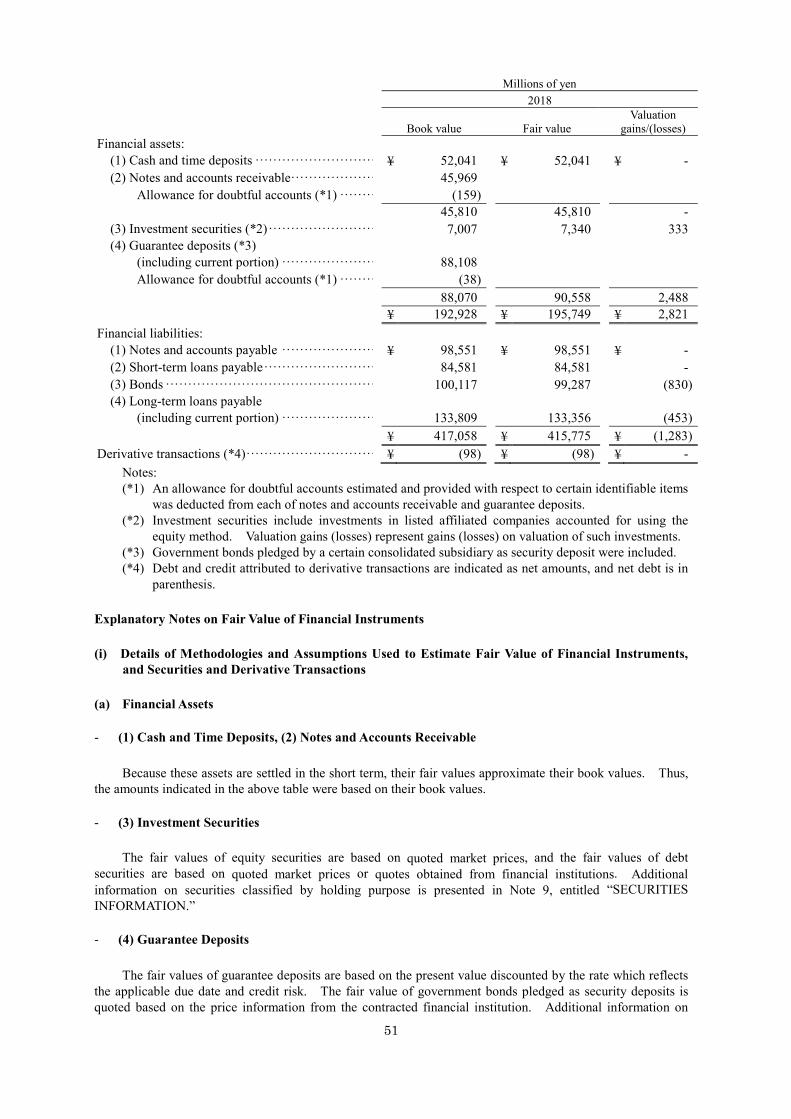
51
Millions of yen 2018
Book value Fair value
Valuation gains/(losses)
Financial assets: (1) Cash and time deposits ··························· ¥ 52,041 ¥ 52,041 ¥ - (2) Notes and accounts receivable··················· 45,969
Allowance for doubtful accounts (*1) ········ (159) 45,810 45,810 - (3) Investment securities (*2) ························ 7,007 7,340 333 (4) Guarantee deposits (*3)
(including current portion) ····················· 88,108 Allowance for doubtful accounts (*1) ········ (38) 88,070 90,558 2,488
¥ 192,928 ¥ 195,749 ¥ 2,821 Financial liabilities:
(1) Notes and accounts payable ····················· ¥ 98,551 ¥ 98,551 ¥ - (2) Short-term loans payable ························· 84,581 84,581 - (3) Bonds ··············································· 100,117 99,287 (830) (4) Long-term loans payable
(including current portion) ····················· 133,809 133,356 (453) ¥ 417,058 ¥ 415,775 ¥ (1,283)
Derivative transactions (*4) ····························· ¥ (98) ¥ (98) ¥ - Notes: (*1) An allowance for doubtful accounts estimated and provided with respect to certain identifiable items
was deducted from each of notes and accounts receivable and guarantee deposits. (*2) Investment securities include investments in listed affiliated companies accounted for using the
equity method. Valuation gains (losses) represent gains (losses) on valuation of such investments. (*3) Government bonds pledged by a certain consolidated subsidiary as security deposit were included. (*4) Debt and credit attributed to derivative transactions are indicated as net amounts, and net debt is in
parenthesis.
Explanatory Notes on Fair Value of Financial Instruments
(i) Details of Methodologies and Assumptions Used to Estimate Fair Value of Financial Instruments, and Securities and Derivative Transactions
(a) Financial Assets
- (1) Cash and Time Deposits, (2) Notes and Accounts Receivable
Because these assets are settled in the short term, their fair values approximate their book values. Thus, the amounts indicated in the above table were based on their book values.
- (3) Investment Securities
The fair values of equity securities are based on quoted market prices, and the fair values of debt securities are based on quoted market prices or quotes obtained from financial institutions. Additional information on securities classified by holding purpose is presented in Note 9, entitled “SECURITIES INFORMATION.”
- (4) Guarantee Deposits
The fair values of guarantee deposits are based on the present value discounted by the rate which reflects the applicable due date and credit risk. The fair value of government bonds pledged as security deposits is quoted based on the price information from the contracted financial institution. Additional information on

52
securities classified by holding purpose is presented in Note 9, entitled “SECURITIES INFORMATION.”
(b) Financial Liabilities
- (1) Notes and Accounts Payable, (2) Short-term Loans Payable
Since these liabilities are payable in the short term, their fair values approximate their book values. Thus, the amounts indicated in the above table were based on their book values.
- (3) Current Portion of Bonds
The fair values of current portion of bonds are each based on the present value of principal discounted by the rate which reflects the remaining maturity period and credit risk.
- (4) Long-term Loans Payable
The fair values of long-term loans payable are each based on the present value of the total of principal and interest discounted by the rate applicable to similar new loans.
For long-term loans payable with floating interest rates and hedged by interest rate swaps which meet certain criteria, their fair values are each based on the present value of the total of principal and interest, as adjusted and described in “Derivative Transactions and Hedge Accounting” under Note 2, entitled “SUMMARY OF SIGNIFICANT ACCOUNTING POLICIES,” and discounted by the rate applicable to similar new loans.
(c) Derivative Transactions
Details of derivative transactions are described in Note 10, entitled “DERIVATIVE FINANCIAL INSTRUMENTS.”
(ii) Financial Instruments of which Fair Value is Virtually Impossible to Estimate
The following financial instruments were excluded from the above table because management of the Group concludes that their fair values are virtually impossible to estimate:
Millions of yen
Thousands of U.S. dollars
(Note 1) 2019 2018 2019 Book value Investment securities (*1)
(1) Equity securities of subsidiaries and affiliated companies
Subsidiaries ································ ¥ 1,562 ¥ 805 $ 14,071 Affiliated companies ····················· 132 61 1,190
(2) Available-for-sale securities Unlisted equity securities ················ 1,325 1,310 11,935 Investments in LPS (*2) ················ 0 0 1
Guarantee deposits (*3) ························· 17,938 19,638 161,591 Notes: (*1) Unlisted equity securities were excluded from “(3) Investment Securities” because they are not
traded in a market and their fair values are virtually impossible to estimate. (*2) Investments in LPS were excluded from disclosures of fair values because the fair value of LPS’s
assets, such as unlisted equity securities and the like, are virtually impossible to estimate. (*3) Guarantee deposits whose redemption schedule cannot be reasonably estimated and whose fair
values are virtually impossible to estimate were excluded from “(4) Guarantee Deposits.”

53
(iii) Contractual Maturity of Financial Instruments
The redemption schedule of monetary claims and securities with fixed maturities were as follows:
Millions of yen 2019
Within one year
Over one year within five
years
Over five years within ten
years Over ten years Cash and time deposits ··················· ¥ 51,681 ¥ - ¥ - ¥ - Notes and accounts receivable ··········· 62,848 - - - Investment securities
Available-for-sale securities with fixed maturities
(1) Debt securities (Corporate bonds) ···············
- - - -
(2) Others ······························ 0 - - - Guarantee deposits (*) ···················· 5,732 21,700 24,114 31,467 Total ········································· ¥ 120,261 ¥ 21,700 ¥ 24,114 ¥ 31,467
Thousands of U.S. dollars (Note 1) 2019
Within one year
Over one year within five
years
Over five years within ten
years Over
ten years Cash and time deposits ··················· $ 465,556 $ - $ - $ - Notes and accounts receivable ··········· 566,150 - - - Investment securities
Available-for-sale securities with fixed maturities
(1) Debt securities (Corporate bonds) ···············
- - - -
(2) Others ······························ 0 - - - Guarantee deposits (*) ···················· 51,635 195,482 217,223 283,464 Total ·· ······································ $ 1,083,341 $ 195,482 $ 217,223 $ 283,464
Millions of yen 2018
Within one year
Over one year within five
years
Over five years within ten
years Over ten years Cash and time deposits ··················· ¥ 52,041 ¥ - ¥ - ¥ - Notes and accounts receivable ··········· 45,969 - - - Investment securities
Available-for-sale securities with fixed maturities
(1) Debt securities (Corporate bonds) ···············
- - - -
(2) Others ······························ - - - - Guarantee deposits (*) ···················· 5,666 23,422 20,390 38,630 Total ········································· ¥ 103,676 ¥ 23,422 ¥ 20,390 ¥ 38,630
Note: (*) Government bonds pledged by a certain consolidated subsidiary as security deposits were included.

54
Contractual maturities of short-term and long-term loans payable and bonds are described in Note 14, entitled “SHORT-TERM AND LONG-TERM DEBT,” and Note 15, entitled “CONVERTIBLE BOND-TYPE BONDS WITH SUBSCRIPTION RIGHTS TO SHARES,” respectively.
9. SECURITIES INFORMATION
The acquisition costs and book values of Available-for-sale Securities with available fair values as of March 31, 2019 and 2018 were as follows:
Millions of yen 2019
Book value
Acquisition cost Difference Securities with book values (fair values)
exceeding acquisition costs:
Equity securities ··································· ¥ 1,789 ¥ 762 ¥ 1,027 Debt securities:
Government bonds and others (*) ············ 488 474 14 Sub-total ············································ 2,277 1,236 1,041
Securities with book values (fair values) not exceeding acquisition costs:
Equity securities ··································· 4,307 4,503 (196) Sub-total ············································ 4,307 4,503 (196) Total ················································· ¥ 6,584 ¥ 5,739 ¥ 845
Thousands of U.S. dollars (Note 1) 2019
Book value
Acquisition cost Difference Securities with book values (fair values)
exceeding acquisition costs:
Equity securities ··································· $ 16,121 $ 6,866 $ 9,255 Debt securities:
Government bonds and others (*) ············ 4,394 4,270 124 Sub-total ············································ 20,515 11,136 9,379
Securities with book values (fair values) not exceeding acquisition costs:
Equity securities ··································· 38,799 40,567 (1,768) Sub-total ············································ 38,799 40,567 (1,768) Total ················································· $ 59,314 $ 51,703 $ 7,611
Note: (*) Government bonds pledged by a certain subsidiary as security deposits were included in guarantee
deposits in the consolidated balance sheets. Unlisted equity securities of ¥1,325 million ($11,935 thousand) and investments in LPS of ¥0 million ($1
thousand) were excluded from the above table because they do not have readily determinable market values and their fair values are virtually impossible to estimate.

55
Millions of yen 2018
Book value
Acquisition cost Difference Securities with book values (fair values)
exceeding acquisition costs:
Equity securities ··································· ¥ 5,763 ¥ 3,230 ¥ 2,533 Debt securities:
Government bonds and others (*) ············ 487 474 13 Sub-total ············································ 6,250 3,704 2,546
Securities with book values (fair values) not exceeding acquisition costs:
Equity securities ··································· 921 975 (54) Sub-total ············································ 921 975 (54) Total ················································· ¥ 7,171 ¥ 4,679 ¥ 2,492
Note: (*) Government bonds pledged by a certain subsidiary as security deposits were included in guarantee
deposits in the consolidated balance sheets. Unlisted equity securities of ¥1,310 million and investments in LPS of ¥0 million were excluded from the
above table because they do not have readily determinable market values and their fair values are virtually impossible to estimate.
Securities sold during the years ended March 31, 2019 and 2018 were as follow:
Millions of yen 2019
Sales amounts Gain on sale Loss on sale
Equity securities ·································· ¥ 1,039 ¥ 557 ¥ (0) Other ··············································· - - - Total ·························· ¥ 1,039 ¥ 557 ¥ (0)
Thousands of U.S. dollars (Note 1) 2019
Sales amounts Gain on sale Loss on sale
Equity securities ·································· $ 9,358 $ 5,014 $ (0) Other ··············································· - - - Total ·························· $ 9,358 $ 5,014 $ (0)
Millions of yen 2018
Sales amounts Gain on sale Loss on sale
Equity securities ·································· ¥ 648 ¥ 1 ¥ (2) Other ··············································· - - - Total ·························· ¥ 648 ¥ 1 ¥ (2)
If the market value of a security as of the fiscal year-end declines more than 50% compared with the acquisition cost of such security, the difference between such security’s fair market value and carrying amount is recognized as loss on valuation in the period of such decline.

56
In addition, if the market value of a security as of the fiscal year-end declines 30% to 50% compared with the acquisition cost of such security, and such decline is considered to be material and unrecoverable, the difference between such security’s fair market value and carrying amount is recognized as loss on valuation in the period of such decline.
For investments in non-consolidated subsidiaries and affiliated companies, recoverability is considered in conjunction with the financial condition of the issuer and the portion regarded as unrecoverable is recognized as loss on valuation.
Loss on valuation of marketable Available-for-sale Securities and investments in non-consolidated subsidiaries and affiliated companies were ¥70 million ($627 thousand) and ¥80 million ($717 thousand), respectively, for the year ended March 31, 2019, and nil and ¥449 million, respectively, for the year ended March 31, 2018.
10. DERIVATIVE FINANCIAL INSTRUMENTS
The aggregate amounts contracted to be paid or received under, and the fair values and unrealized gains (losses) of, currency-related derivative transactions, other than market trades (and excluding hedging transactions) as of March 31, 2019 and 2018 were as follows:
Millions of yen Millions of yen Thousands of U.S. dollars
(Note 1)
Notional
Amount
Due after
one year Fair
value Unrealized
losses Fair value Unrealized
losses Total At March 31, 2019: Foreign currency forward contracts:
Buy, call ··················· ¥ 821 ¥ - ¥ 10 ¥ 10 $ 91 $ 91 Total ·························· ¥ 10 ¥ 10 $ 91 $ 91
Millions of yen Millions of yen
Notional
Amount
Due after
one year Fair
value Unrealized
losses Total At March 31, 2018: Foreign currency forward contracts:
Buy, call ··················· ¥ 2,955 ¥ - ¥ (98) ¥ (98) Total ·························· ¥ (98) ¥ (98)
The fair value has been quoted based on the price information from the contracted financial institution.
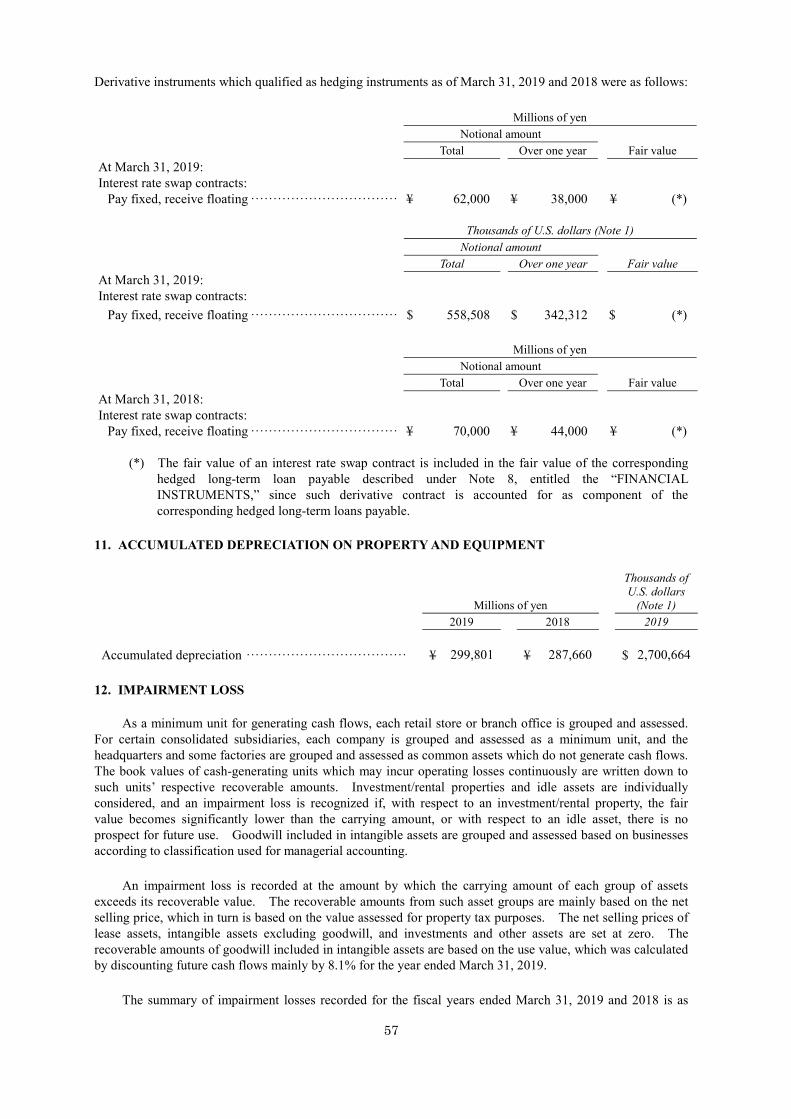
57
Derivative instruments which qualified as hedging instruments as of March 31, 2019 and 2018 were as follows:
Millions of yen Notional amount
Fair value Total Over one year At March 31, 2019: Interest rate swap contracts:
Pay fixed, receive floating ································· ¥ 62,000 ¥ 38,000 ¥ (*) Thousands of U.S. dollars (Note 1) Notional amount
Fair value Total Over one year At March 31, 2019: Interest rate swap contracts:
Pay fixed, receive floating ································· $ 558,508 $ 342,312 $ (*) Millions of yen Notional amount
Fair value Total Over one year At March 31, 2018: Interest rate swap contracts:
Pay fixed, receive floating ································· ¥ 70,000 ¥ 44,000 ¥ (*)
(*) The fair value of an interest rate swap contract is included in the fair value of the corresponding hedged long-term loan payable described under Note 8, entitled the “FINANCIAL INSTRUMENTS,” since such derivative contract is accounted for as component of the corresponding hedged long-term loans payable.
11. ACCUMULATED DEPRECIATION ON PROPERTY AND EQUIPMENT
Millions of yen
Thousands of U.S. dollars
(Note 1) 2019 2018 2019 Accumulated depreciation ···································· ¥ 299,801 ¥ 287,660 $ 2,700,664
12. IMPAIRMENT LOSS
As a minimum unit for generating cash flows, each retail store or branch office is grouped and assessed. For certain consolidated subsidiaries, each company is grouped and assessed as a minimum unit, and the headquarters and some factories are grouped and assessed as common assets which do not generate cash flows. The book values of cash-generating units which may incur operating losses continuously are written down to such units’ respective recoverable amounts. Investment/rental properties and idle assets are individually considered, and an impairment loss is recognized if, with respect to an investment/rental property, the fair value becomes significantly lower than the carrying amount, or with respect to an idle asset, there is no prospect for future use. Goodwill included in intangible assets are grouped and assessed based on businesses according to classification used for managerial accounting.
An impairment loss is recorded at the amount by which the carrying amount of each group of assets exceeds its recoverable value. The recoverable amounts from such asset groups are mainly based on the net selling price, which in turn is based on the value assessed for property tax purposes. The net selling prices of lease assets, intangible assets excluding goodwill, and investments and other assets are set at zero. The recoverable amounts of goodwill included in intangible assets are based on the use value, which was calculated by discounting future cash flows mainly by 8.1% for the year ended March 31, 2019.
The summary of impairment losses recorded for the fiscal years ended March 31, 2019 and 2018 is as

58
follows:
Millions of yen
Thousands of U.S. dollars
(Note 1) 2019 2018 2019
Buildings and structures ···································· ¥ 3,124 ¥ 3,918 $ 28,144 Land ··························································· 63 - 564 Lease assets ·················································· 650 262 5,851 Other tangible assets ········································ 600 779 5,403 Intangible assets ············································· 5,209 230 46,922 Investments and other assets ······························· 320 326 2,887 Total ··························································· ¥ 9,966 ¥ 5,515 $ 89,771
Impairment losses for the year ended March 31, 2019 mainly relate to retail stores and a property for the Group’s own business use located in Aichi Prefecture, stores and a property for rent located in Nara Prefecture and others. Impairment losses for the year ended March 31, 2018 mainly relate to retail stores and a property for the Group’s own business use located in Tokyo, and stores and a property for rent located in Oita Prefecture.
13. LEASE INFORMATION
As Lessee
(i) Finance lease transactions without title transfer
The Group leases mainly retail buildings and equipment and a set of computer equipment.
(ii) Operating lease transactions
Future minimum lease payments under non-cancelable operating leases as of March 31, 2019 and 2018 were as follows:
Millions of yen
Thousands of U.S. dollars
(Note 1) 2019 2018 2019 Due within one year ·········································· ¥ 14,209 ¥ 12,762 $ 127,994 Due after one year ··········································· 85,431 83,435 769,582 Total ························································· ¥ 99,640 ¥ 96,197 $ 897,576
As Lessor
(i) Operating lease transactions
Future minimum lease receivables under non-cancelable operating leases as of March 31, 2019 and 2018 were as follows:
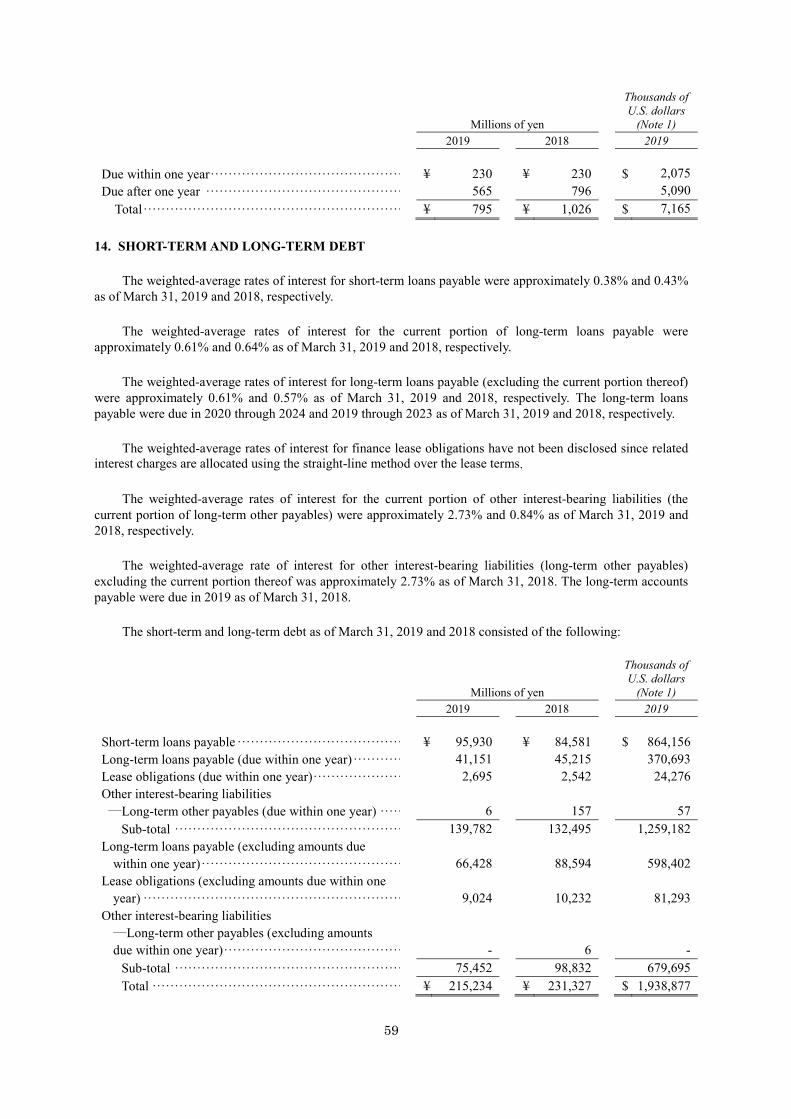
59
Millions of yen
Thousands of U.S. dollars
(Note 1) 2019 2018 2019 Due within one year ··········································· ¥ 230 ¥ 230 $ 2,075 Due after one year ············································ 565 796 5,090 Total ·························································· ¥ 795 ¥ 1,026 $ 7,165
14. SHORT-TERM AND LONG-TERM DEBT
The weighted-average rates of interest for short-term loans payable were approximately 0.38% and 0.43% as of March 31, 2019 and 2018, respectively.
The weighted-average rates of interest for the current portion of long-term loans payable were approximately 0.61% and 0.64% as of March 31, 2019 and 2018, respectively.
The weighted-average rates of interest for long-term loans payable (excluding the current portion thereof) were approximately 0.61% and 0.57% as of March 31, 2019 and 2018, respectively. The long-term loans payable were due in 2020 through 2024 and 2019 through 2023 as of March 31, 2019 and 2018, respectively.
The weighted-average rates of interest for finance lease obligations have not been disclosed since related interest charges are allocated using the straight-line method over the lease terms.
The weighted-average rates of interest for the current portion of other interest-bearing liabilities (the current portion of long-term other payables) were approximately 2.73% and 0.84% as of March 31, 2019 and 2018, respectively.
The weighted-average rate of interest for other interest-bearing liabilities (long-term other payables) excluding the current portion thereof was approximately 2.73% as of March 31, 2018. The long-term accounts payable were due in 2019 as of March 31, 2018.
The short-term and long-term debt as of March 31, 2019 and 2018 consisted of the following:
Millions of yen
Thousands of U.S. dollars
(Note 1) 2019 2018 2019 Short-term loans payable ····································· ¥ 95,930 ¥ 84,581 $ 864,156 Long-term loans payable (due within one year) ··········· 41,151 45,215 370,693 Lease obligations (due within one year) ···················· 2,695 2,542 24,276 Other interest-bearing liabilities ―Long-term other payables (due within one year) ·····
6 157 57
Sub-total ··················································· 139,782 132,495 1,259,182 Long-term loans payable (excluding amounts due
within one year) ·············································
66,428 88,594 598,402 Lease obligations (excluding amounts due within one
year) ··························································
9,024 10,232 81,293 Other interest-bearing liabilities ―Long-term other payables (excluding amounts due within one year) ········································
- 6 - Sub-total ··················································· 75,452 98,832 679,695 Total ························································ ¥ 215,234 ¥ 231,327 $ 1,938,877

60
The following assets were pledged as collateral for the below listed liabilities as of March 31, 2019 and 2018:
Millions of yen
Thousands of U.S. dollars
(Note 1) 2019 2018 2019 Cash and bank deposits ······································· ¥ - ¥ 220 $ - Materials and supplies ········································ - 625 - Buildings and structures, net (*2) ··························· - 1,414 - Land (*1) (*2) ················································· 57 781 516 Investment securities ·········································· - 5 - Guarantee deposits ············································ - 11 - Total ¥ 57 ¥ 3,056 $ 516
(*1) Land of ¥57 million ($516 thousand) was pledged as collateral for customers’ housing loans of ¥29
million ($263 thousand) as of March 31, 2019. Land of ¥86 million was pledged as collateral for customers’ housing loans of ¥35 million as of March 31, 2018.
(*2) Land of ¥107 million and buildings and structures, net of ¥23 million was pledged as a revolving mortgage with the maximum amount of ¥1,200 million as of March 31, 2018.
Millions of yen
Thousands of U.S. dollars
(Note 1) 2019 2018 2019 Short-term loans payable ····································· ¥ - ¥ 1,866 $ - Current portion of long-term loans payable ················ - 235 - Long-term loans payable ····································· - 260 -
Total ¥ - ¥ 2,361 $ -
The aggregate annual maturities of long-term loans payable as of March 31, 2019 were as follows:
Fiscal year ending March 31,
Millions of yen
Thousands of U.S. dollars
(Note 1) 2020 ·········································································· ¥ 41,151 $ 370,693 2021 ·········································································· 32,171 289,800 2022 ·········································································· 20,038 180,507 2023 ·········································································· 12,155 109,503 Thereafter ···································································· 2,064 18,592 Total ···································································· ¥ 107,579 $ 969,095
The aggregate annual maturities of finance lease obligations as of March 31, 2019 were as follows:
Fiscal year ending March 31,
Millions of yen
Thousands of U.S. dollars
(Note 1) 2020 ·········································································· ¥ 2,695 $ 24,276 2021 ·········································································· 2,350 21,170 2022 ·········································································· 1,873 16,875 2023 ·········································································· 1,632 14,703 Thereafter ···································································· 3,169 28,545 Total ···································································· ¥ 11,719 $ 105,569

61
The aggregate annual maturities of long-term other payable as of March 31, 2019 were as follows:
Fiscal year ending March 31,
Millions of yen
Thousands of U.S. dollars
(Note 1) 2020 ·········································································· ¥ 6 $ 57 2021 ·········································································· - - 2022 ·········································································· - - 2023 ·········································································· - - Thereafter ···································································· - - Total ···································································· ¥ 6 $ 57
The Company has entered into loan commitment agreements amounting to ¥50,000 million ($450,410 thousand) with seven financial institutions. Under these credit facilities, no amount has been executed as of March 31, 2019 and 2018.
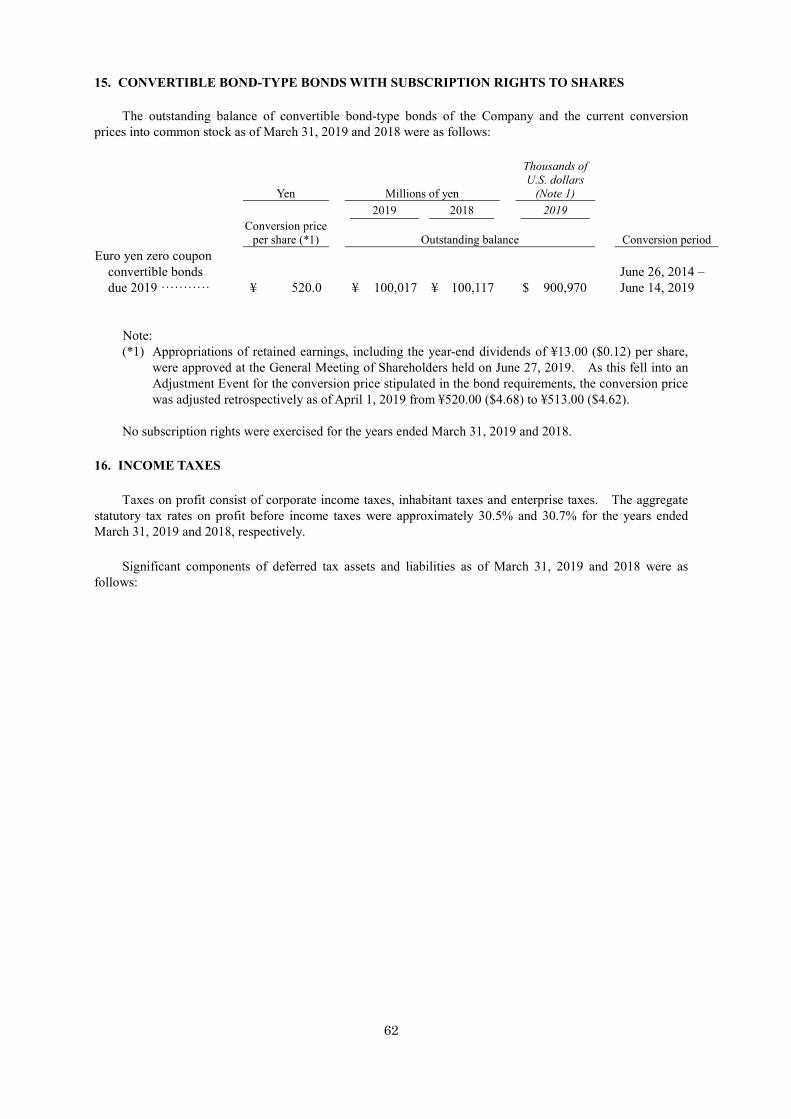
62
15. CONVERTIBLE BOND-TYPE BONDS WITH SUBSCRIPTION RIGHTS TO SHARES
The outstanding balance of convertible bond-type bonds of the Company and the current conversion prices into common stock as of March 31, 2019 and 2018 were as follows:
Yen
Millions of yen
Thousands of U.S. dollars
(Note 1)
2019 2018 2019 Conversion price
per share (*1)
Outstanding balance
Conversion period Euro yen zero coupon
convertible bonds due 2019 ···········
¥ 520.0 ¥ 100,017 ¥ 100,117
$ 900,970 June 26, 2014 – June 14, 2019
Note: (*1) Appropriations of retained earnings, including the year-end dividends of ¥13.00 ($0.12) per share,
were approved at the General Meeting of Shareholders held on June 27, 2019. As this fell into an Adjustment Event for the conversion price stipulated in the bond requirements, the conversion price was adjusted retrospectively as of April 1, 2019 from ¥520.00 ($4.68) to ¥513.00 ($4.62).
No subscription rights were exercised for the years ended March 31, 2019 and 2018.
16. INCOME TAXES
Taxes on profit consist of corporate income taxes, inhabitant taxes and enterprise taxes. The aggregate statutory tax rates on profit before income taxes were approximately 30.5% and 30.7% for the years ended March 31, 2019 and 2018, respectively.
Significant components of deferred tax assets and liabilities as of March 31, 2019 and 2018 were as follows:

63
Millions of yen
Thousands of U.S. dollars
(Note 1) 2019 2018 2019 Deferred tax assets: Loss on valuation of inventories ···························· ¥ 1,179 ¥ 1,075 $ 10,619 Impairment loss ················································ 11,629 11,407 104,753 Loss on valuation of investment securities ················· 392 370 3,528 Loss on valuation of stock of subsidiaries ················· 1,263 1,260 11,377 Provision for bonuses ········································· 2,561 2,605 23,068 Provision for point card certificates ························· 3,736 2,404 33,651 Net defined benefit liability ·································· 7,963 7,509 71,729 Provision for directors’ retirement benefits ················ 158 154 1,424 Provision for product warranties ···························· 2,430 2,958 21,890 Asset retirement obligations ································· 9,892 9,501 89,123 Consolidated subsidiaries’ tax loss carry-forward········· 14,782 21,339 133,163 Others ··························································· 8,430 7,338 75,940 Sub-total ························································ 64,415 67,920 580,265 Valuation allowance for tax loss carry-forward
(Note 2) ······················································
(14,249)
-
(128,355)
Valuation allowance for total of deductible temporary differences ···················································
(11,671)
-
(105,134)
Valuation allowance (Note 1) ································ (25,920) (33,092) (233,489) Total deferred tax assets ······································ 38,495 34,828 346,776 Deferred tax liabilities: Unrealized gains on valuation of land ······················ (941) (116) (8,476) Loss recognized corresponding to asset retirement
obligations ···················································
(6,487) (6,712) (58,440) Others ··························································· (1,125) (2,710) (10,135) Total deferred tax liabilities ·································· (8,553) (9,538) (77,051) Net deferred tax assets (Note 3) ····························· ¥ 29,942 ¥ 25,290 $ 269,725
Notes: 1. Valuation allowance decreased by ¥7,172 million ($64,611 thousand). The decrease is mainly due to elimination of valuation allowance for deferred tax assets on tax loss carry-forward of ¥5,340 million ($48,103 thousand) at consolidated subsidiaries (Best Denki Co., Ltd. and Housetec Inc.).
2. The expiration of tax loss carry-forward and the resulting deferred tax assets as of March 31, 2019 were as follows:
Millions of yen
Within one year
Over one year
within two years
Over two years within three years
Over three years within
four years
Over four years within
five years Over five
years Total
Tax loss carry-forward (*1) ¥ 11,785 ¥ 44,499 ¥ 22,921 ¥ 8823 ¥ 11,047 ¥ 33,708 ¥ 114,782 Valuation allowance
((1,265) ((4,486) ((2,921) ((823) ((1,047) ((3,708) ((14,249)
Deferred tax assets 520 13 - - 0 - (*2) 533

64
Thousands of U.S. dollars (Note 1)
Within one year
Over one year
within two years
Over two years within three years
Over three years within
four years
Over four years within
five years Over five
years Total
Tax loss carry-forward (*1) $ 116,083 $ 440,526 $ 226,311 $ 77,412 $ 99,434 $ 333,398 $ 1133,163 Valuation allowance
((11,395) ((40,409) ((26,311) ((7,412) ((9,430) ((33,398) ((128,355)
Deferred tax assets 44,688 1117 - - 4 00 ( (*2)44,808 (*1) Tax loss carry-forward was determined by multiplying the statutory income tax rate. (*2) Deferred tax assets of ¥533 million ($4,808 thousand) were recorded for tax loss carry-forward of
¥14,782 million ($133,163 thousand) (multiplied by the statutory income tax rate). This amount of deferred tax assets was recognized mainly for part of the balance of tax loss carry-forward of ¥9,040 million ($81,438 thousand) at consolidated subsidiary Best Denki Co., Ltd. The tax loss carry-forward for which deferred tax assets were recorded mainly resulted from an impairment loss of ¥13,646 million ($122,923 thousand) and the provision for business restructuring of ¥8,637 million ($77,808 thousand) recorded in the fiscal year ended February 28, 2010 which became deductible in and after the next fiscal year for tax purposes. Valuation allowance has not been recognized since the deferred tax assets for tax loss carry-forward are determined to be recoverable due to the expected future taxable income.
3. Net deferred tax assets (liabilities) were included in the following accounts in the consolidated
balance sheets as of March 31, 2019 and 2018:
Millions of yen
Thousands of U.S. dollars
(Note 1) 2019 2018 2019 Investments and other assets – Deferred tax assets ······· ¥ 30,533 ¥ 27,165 $ 275,052 Long-term liabilities – Other long-term liabilities ········ (591) (1,877) (5,327)
Reconciliations between the statutory income tax rate and the actual effective income tax rate, as percentage of profit before income taxes, for the years ended March 31, 2019 and 2018 were as follows:
2019 2018 Statutory income tax rate 30.5% 30.7% Per capita inhabitants taxes 4.1 2.4 Change in valuation allowance (3.0) (5.8) Tax rate differences for net loss subsidiaries 5.3 0.4 Tax rate differences for consolidated subsidiaries 1.0 0.4 Effect of merger of subsidiaries (4.8) - Impairment loss on goodwill 6.1 - Entertainment and other non-deductible expenses 1.3 0.5 Others, net 0.6 (0.9) Effective income tax rate 41.1% 27.7%
17. CONTINGENT LIABILITIES
The Group was contingently liable for transferred accounts receivable of ¥1,951 million ($17,577 thousand) and ¥13,843 million to credit card companies as of March 31, 2019 and 2018, respectively.
The Group was contingently liable for the following guarantees of debt as of March 31, 2019 and 2018:

65
Millions of yen
Thousands of U.S. dollars
(Note 1) 2019 2018 2019 Guarantees of debt made to home buyers and the like ··· ¥ 4,111 ¥ 3,007 $ 37,032 Joint and several guarantees of payables to suppliers ···· 322 249 2,897 Guarantees of debt made to employees ····················· 10 14 93 Joint and several guarantees of debt made to the lease
contract of Azuma Metal Co., Ltd. ·······················
0 1 2
The discounted trade notes receivable were ¥711 million ($6,401 thousand) and ¥862 million, as of March 31, 2019 and 2018, respectively.
18. RETIREMENT BENEFITS
The Company and its certain consolidated subsidiaries maintain funded contributory and unfunded defined benefit plans, as well as defined contribution plans, for their employees’ retirement benefits. Under the defined benefit corporate pension plans, retirement benefits are paid out in the form of a lump-sum payment or annuity payments based on the accumulated number of points that are granted according to eligibility and position, etc. of employees. Under a lump-sum retirement payment plan, retirement benefits are paid out in the form of a lump-sum payment based on the accumulated number of points that are granted according to eligibility and position, etc. of employees.
The simplified method is applied by certain consolidated subsidiaries in calculating the defined benefit liability and retirement benefit costs under lump-sum retirement payment plans.
A certain consolidated subsidiary (YAMADA HOMES Co., LTD.) participates in a multi-employer plan. For such plan, as the portion of pension assets belonging to the multi-employer pension plan could not be reasonably calculated, the required contribution amount is recognized as retirement benefit expenses.
The Osaka Kenchiku pension fund, in which a certain consolidated subsidiary participates, obtained approval for dissolution from the Minister of Health, Labor and Welfare and dissolved as of May 31, 2017.
Defined benefit plans
(1) The changes in retirement benefit obligations for the years ended March 31, 2019 and 2018
Millions of yen
Thousands of U.S. dollars
(Note 1) 2019 2018 2019 Beginning balance ··································· ¥ 47,858 ¥ 45,089 $ 431,120 Service costs ········································· 4,345 4,623 39,142 Interest cost ·········································· 200 249 1,801 Actuarial gains and losses ·························· 48 (568) 429 Payment of benefit obligations ···················· (1,619) (1,593) (14,586) Prior service costs (125) - (1,129) Increase by new consolidation ····················· - 59 - Effect of change from the simplified method
to the principle method due to merger
11
-
103 Ending balance ······································ ¥ 50,718 ¥ 47,859 $ 456,880
Note: The simplified method has been applied by certain consolidated subsidiaries.

66
(2) Changes in pension assets for the years ended March 31, 2019 and 2018
Millions of yen
Thousands of U.S. dollars
(Note 1) 2019 2018 2019 Beginning balance ·································· ¥ 23,416 ¥ 22,335 $ 210,936 Expected return on pension assets ··············· 489 446 4,403 Actuarial gains and losses ························· (338) 295 (3,049) Contributions paid by the employer ············· 1,471 1,304 13,253 Retirement benefits paid ··························· (875) (964) (7,882) Ending balance ····································· ¥ 24,163 ¥ 23,416 $ 217,661

67
(3) Reconciliation of retirement benefit obligations and pension assets and net defined benefit liability (asset)
for the years ended March 31, 2019 and 2018
Millions of yen
Thousands of U.S. dollars
(Note 1) 2019 2018 2019 Funded retirement benefit obligations ········· ¥ 27,020 ¥ 25,999 $ 243,402 Amount of pension assets ······················· (24,162) (23,416) (217,661) 2,858 2,583 25,741 Unfunded retirement benefit obligations ······ 23,698 21,860 213,477 Total net defined benefit liability ··············· ¥ 26,556 ¥ 24,443 $ 239,218 Net defined benefit liability ····················· 28,114 26,288 253,257 Net defined benefit asset ························ (1,558) (1,845) (14,039) Total net defined benefit liability ··············· ¥ 26,556 ¥ 24,443 $ 239,218
Note: The above table includes plans for which the simplified method has been applied.
(4) Components of retirement benefit costs for the years ended March 31, 2019 and 2018
Millions of yen
Thousands of U.S. dollars
(Note 1) 2019 2018 2019 Service costs (*) ····································· ¥ 4,345 ¥ 4,623 $ 39,142 Interest cost ·········································· 200 249 1,801 Expected return on pension assets ················ (489) (446) (4,403) Amortization of actuarial differences ············· (8) (61) (77) Amortization of prior service costs ··············· (941) (930) (8,479) Total net periodic retirement benefit costs ······· ¥ 3,107 ¥ 3,435 $ 27,984
Note: (*) Retirement benefit costs of certain consolidated subsidiaries calculated under the simplified
method are recorded in service costs.
(5) Remeasurements of defined benefit plans for the years ended March 31, 2019 and 2018
Millions of yen
Thousands of U.S. dollars
(Note 1) 2019 2018 2019 Prior service costs ··································· ¥ (816) ¥ (931) $ (7,351) Actuarial gains and losses ·························· (395) 803 (3,554) Total ··················································· ¥ (1,211) ¥ (128) $ (10,905)

68
(6) Accumulated remeasurements of defined benefit plans for the years ended March 31, 2019 and 2018
Millions of yen
Thousands of U.S. dollars
(Note 1) 2019 2018 2019 Unrealized prior service costs ····················· ¥ (1,788) ¥ (2,605) $ (16,112) Unrealized actuarial gains and losses ············· (510) (904) (4,593) Total ··················································· ¥ (2,298) ¥ (3,509) $ (20,705)
(7) Pension assets as of March 31, 2019 and 2018
(i) The percentages for each classification of total pension assets as of March 31, 2019 and 2018 were as follows:
2019 2018 Bonds ························································ 18.6 % 27.6 % Stocks ························································ 31.9 29.4 Cash and time deposits ···································· 7.1 8.6 General accounts ··········································· 24.5 25.4 Others ························································ 17.9 9.0 Total 100.0 100.0
Note: Total pension assets include retirement benefit trusts established for the corporate pension plans in a
percentage of 0.4% and 1.3%, as of March 31, 2019 and 2018, respectively.
(ii) Method of determining the long-term expected rate of return on plan assets
The long-term expected rate of return is determined based on the present and projected future allocation of plan assets and the present and expected future rate of return on various components of plan assets.
(8) Basis of actuarial calculation for the years ended March 31, 2019 and 2018
2019 2018 Principal discount rate ····································· 0.56 % 0.56 % Long-term expected rate of return on plan assets ····· 1.46 1.46
Note: Estimated rate of salary increase is not presented because the Company and its consolidated
subsidiaries have adopted a point system.
Defined contribution plans
The required contribution amount to the defined contribution plans of the Company and certain consolidated subsidiaries was ¥951 million ($8,566 thousand) and ¥622 million for the years ended March 31, 2019 and 2018, respectively.
69
Multi-employer plans
The required contribution amount to such multi-employer plans, which is expensed when incurred, was nil and ¥29 million for the years ended March 31, 2019 and 2018, respectively.
A certain consolidated subsidiary participates in the Osaka Kenchiku pension fund. As the fund obtained approval for dissolution from the Minister of Health, Labor and Welfare and dissolved as of May 31, 2017, the description of the pension fund, shares of contribution to the pension plan made by the subsidiary and supplemental explanation are not disclosed. No additional contribution was incurred upon the dissolution of the fund.
19. ASSET RETIREMENT OBLIGATIONS
Asset Retirement Obligations Included in the Consolidated Balance Sheets
Asset retirement obligations included in the consolidated balance sheets primarily represent contractual obligations for restoration related to term leasehold interests in retail stores and the like.
The Group mainly estimates asset retirement obligations by using discount rates ranging from 0.00% to 2.30% with a term of 1–47 years.

70
Changes in asset retirement obligations for the years ended March 31, 2019 and 2018 were as follows:
Millions of yen
Thousands of U.S. dollars
(Note 1) 2019 2018 2019 Beginning balance ········································· ¥ 31,701 ¥ 24,786 $ 285,570 Increase due to purchase of property and
equipment ················································
934 183 8,414 Increase due to change in estimates ····················· - 6,537 - Adjustments due to passage of time ···················· 422 364 3,797 Decrease due to implementation of asset retirement
obligations ···············································
(106) (195) (959) Increase (decrease) due to exchange translation of
asset retirement obligations denominated in foreign currencies ·······································
(9) 10 (77) Increase due to new consolidation ······················ - 16 - Ending balance ············································ ¥ 32,942 ¥ 31,701 $ 296,745
Asset Retirement Obligations Not Included in the Consolidated Balance Sheets
Certain other asset retirement obligations for leasehold contracts, for which the related amount could not be reasonably estimated due to uncertainty regarding the disbursement schedule and/or the incurrence of expense, have not been included in the consolidated balance sheets.
20. NET ASSETS
Net assets comprise three subsections, which are shareholders’ equity, accumulated other comprehensive income and non-controlling interests.
Japanese companies are subject to the Companies Act of Japan (the “Companies Act”) and related regulations.
Under Japanese laws and regulations, the entire amount paid for new shares is required to be designated as common stock. However, a company may, by a resolution of the Board of Directors, designate an amount not exceeding one-half of the prices of the new shares as additional paid-in capital, which is included in capital surplus.
On October 1, 2013, the Company conducted a 10-for-1 stock split by way of a free share distribution.
Under the Companies Act, in cases where a dividend distribution of surplus is made, the smaller of an amount equal to 10% of the dividend or the excess, if any, of 25% of common stock over the total of the additional paid-in-capital and legal earnings reserve must be set aside as additional paid-in-capital or legal earnings reserve. The legal earnings reserve has been included in retained earnings in the accompanying consolidated balance sheets.
Under the Companies Act, the legal earnings reserve and additional paid-in capital can be used to eliminate or reduce a deficit or capitalized by a resolution at the shareholders’ meeting. Under the Companies Act, all paid-in capital and legal earnings reserve may be transferred to other capital surplus and retained earnings, respectively, which may become available for distribution as dividends.
The maximum amount that the Company can distribute as dividends is calculated based on the non-consolidated financial statements of the Company in accordance with Japanese laws and regulations.
At the Ordinary General Meeting of Shareholders held on June 27, 2019, the shareholders approved cash

71
dividends amounting to ¥10,573 million ($95,245 thousand). Such appropriations have not been accrued in the consolidated financial statements as of March 31, 2019 as they are to be recognized in the period in which they are approved by the shareholders.
21. STOCK OPTIONS
Stock option expenses recognized for the years ended March 31, 2019 and 2018 were ¥340 million ($3,063 thousand) and ¥322 million, respectively.
The stock options existing during the years ended March 31, 2019 and 2018 were as follows:
2013 Stock Option 2014 Stock Option 2015 Stock Option Date of resolution ·················· June 27, 2013 June 27, 2014 June 26, 2015 Persons granted ···················· 16 directors 15 directors 14 directors Number of options granted
expressed in the number of shares by class of stock (*1)(*2) ···························
Common stock 483,100 shares
Common stock 460,700 shares
Common stock 628,900 shares
Date of grant ························ July 12, 2013 July 14, 2014 July 13, 2015 Vesting condition (*3) ··········· Not set Not set Not set Service period covered ············ Not prescribed Not prescribed Not prescribed Exercise period* ··················· From July 13, 2013 to
July 12, 2043 From July 15, 2014 to July 14, 2044
From July 14, 2015 to July 13, 2045
Number of subscription rights to shares*
4,595 units 4,417 units 6,160 units
Class, description and number of shares of stock to be allotted upon exercise of the subscription rights to shares (*3)*
Common stock 459,500 shares
Common stock 441,700 shares
Common stock 616,000 shares
Subscription price to be paid upon exercise of each subscription right to shares*
¥1 ¥1 ¥1
Issue price and amount of capital to be increased due to the issuance of shares upon exercise of the subscription rights to shares*
Issue price: ¥41,190 per 100 shares (*4)
Issue price: ¥292 (*4)
Issue price: ¥405 (*4)
Exercise conditions* (*5) (*5) (*5) Matters concerning the transfer of subscription rights to shares*
(*6) (*6) (*6)
Matters concerning the allotment of subscription rights to shares in the event of reorganization*
(*7) (*7) (*7)

72
2016 Stock Option 2017 Stock Option 2018 Stock Option Date of resolution ·················· June 29, 2016 June 29, 2017 June 28, 2018 Persons granted ···················· 15 directors 12 directors 13 directors Number of options granted
expressed in the number of shares by class of stock (*1)(*2) ···························
Common stock 784,200 shares
Common stock 707,700 shares
Common stock 774,100 shares
Date of grant ························ July 14, 2016 July 14, 2017 July 13, 2018 Vesting condition (*3) ············· Not set Not set Not set Service period covered ············ Not prescribed Not prescribed Not prescribed Exercise period* ··················· From July 15, 2016 to
July 14, 2046 From July 15, 2017 to July 14, 2047
From July 14, 2018 to July 13, 2048
Number of subscription rights to shares*
7,800 units 7,077 units 5,810 (7,102) units
Class, description and number of shares of stock to be allotted upon exercise of the subscription rights to shares (*3)*
Common stock 780,000 shares
Common stock 707,700 shares
Common stock 581,000 (710,200) shares
Subscription price to be paid upon exercise of each subscription right to shares*
¥1 ¥1 ¥1
Issue price and amount of capital to be increased due to the issuance of shares upon exercise of the subscription rights to shares*
Issue price: ¥453 (*4)
Issue price: ¥443 (*4)
Issue price: ¥452 (*4)
Exercise conditions* (*5) (*5) (*5) Matters concerning the transfer of subscription rights to shares*
(*6) (*6) (*6)
Matters concerning the allotment of subscription rights to shares in the event of reorganization*
(*7) (*7) (*7)
* Information as of March 31, 2019. Figures as of May 31, 2019 are also presented in parentheses in case of any changes to the date. Otherwise, no change has occurred between the two dates.
Notes: (*1) Number of options granted is expressed in the number of shares of common stock granted. (*2) Number of shares of common stock granted reflects 10-for-1 stock split executed by the Company
on October 1, 2013. (*3) Number of shares to be allotted (the “Number of Shares to be Allotted”) upon exercise of the
subscription rights to shares (the “Subscription Rights to Shares”) is 100 shares for 1 Subscription Right to Shares. In case the Company conducts a share split or a consolidation of shares of its common stock, after the date of the allocation of subscription rights to shares (the “Day of Allotment”), the Number of Shares to be Allotted will be adjusted according to the formula below. Such adjustment shall be made only to the Subscription Rights to Shares which have not yet been exercised at the time of the adjustment. Number of Shares to be Allotted after adjustment = Number of Shares to be Allotted before adjustment × Ratio of share split or consolidation of shares Other than the above, in the event it becomes necessary to adjust the Number of Shares to be Allotted, it may be adjusted by the Company as deemed necessary by its Board of Directors. Any amount less than one share arising from the adjustment shall be rounded down.

73
(*4) Issue price is the sum of the subscription price to be paid upon exercise of each Subscription Right to Shares and the fair value of the Subscription Right to Shares at the grant date. The amount of capital to be increased due to the issuance of shares upon exercise of the Subscription Rights to Shares shall be one half (1/2) of the maximum amount of increases in the capital, etc. to be calculated according to Article 17, Paragraph 1 of the Corporate Accounting Regulations, with any amount less than one yen arising from such calculation to be rounded up. The amount of capital reserve to be increased due to the issuance of shares upon exercise of the Subscription Rights to Shares shall be the amount obtained by deducting the amount of capital to be increased set forth in above, from the maximum amount of increases in the capital, etc. set forth in above.
(*5) (a) A holder of the Subscription Rights to Shares (the “Right Holder”) can exercise the Subscription Rights to Shares only in a single lump-sum transaction during the 10-day period from the day after leaving its position as director, corporate auditor, executive officer or employee of the Company or its subsidiaries within the exercise period stated above.
(b) In case the Right Holder dies, heirs of the Right Holder may exercise the Subscription Rights to Shares only in a single lump-sum transaction.
(*6) Any acquisition of the Subscription Rights to Shares through transfer shall require the approval by resolution of the Company’s Board of Directors.
(*7) In case the Company conducts a merger (limited to the case where the Company is to be extinguished as a result of the merger), an absorption-type company split, an incorporation-type company split, a share exchange or a share transfer (hereafter collectively referred to as the “reorganization”), Subscription Rights to Shares of the companies listed in (a) to (e) of Article 236, Paragraph 1, Item 8, of the Companies Act (the “Reorganized Company”) shall be delivered, in each of the above cases, to the Right Holder holding the Subscription Rights to Shares remaining just before the effective date of the reorganization (the “Remaining Subscription Rights to Shares”) according to the conditions (a) to (i) described below. Provided, however, that the foregoing shall be on the condition that the delivery of Subscription Rights to Shares of the Reorganized Company in accordance with the following conditions is stipulated in an absorption-type merger agreement, a consolidation-type merger agreement, an absorption-type company split agreement, an incorporation-type company split plan, a stock change agreement, or a stock transfer plan. (a) Number of Subscription Rights to Shares of the Reorganized Company to be delivered
The identical number of Subscription Rights to Shares to the number of the Remaining Subscription Rights to Shares held by a Right Holder shall be delivered to said Right Holder.
(b) Class of shares of the Reorganized Company to be allotted upon exercise of Subscription Rights to Shares Common stock of the Reorganized Company.
(c) Number of shares of the Reorganized Company to be allotted upon exercise of Subscription Rights to Shares It shall be determined in accordance with (*3) above, based on the consideration of conditions for the reorganization and other factors.
(d) Amount of assets to be contributed upon exercise of Subscription Rights to Shares The amount of assets to be contributed upon exercise of each of the Subscription Rights to Shares to be delivered shall be an amount obtained by multiplying the exercise price after reorganization, as specified below, by the number of shares of the Reorganized Company to be allotted, as determined in accordance with (c) above. The exercise price after reorganization shall be ¥1 yen per share of the Reorganized Company to be delivered upon exercise of Subscription Rights to Shares.
(e) Period during which Subscription Rights to Shares are exercisable From commencing date of the exercise period shown in the table above, or the effective date of the reorganization, whichever is later, to expiry date of the exercise period shown in the table above.
(f) The amount of capital to be increased due to the issuance of shares upon exercise of the Subscription Rights to Shares i) The amount of capital to be increased due to the issuance of shares upon exercise of the
Subscription Rights to Shares shall be one half (1/2) of the maximum amount of increases in the capital, etc. to be calculated according to Article 17, Paragraph 1 of the Corporate Accounting Regulations, with any amount less than one yen arising from such calculation to be rounded up.
ii) The amount of capital reserve to be increased due to the issuance of shares upon exercise of the Subscription Rights to Shares shall be the amount obtained by deducting the amount of

74
capital to be increased set forth in i) above, from the maximum amount of increases in the capital, etc. set forth in i) above.
(g) Restriction on the acquisition of Subscription Rights to Shares through transfer Any acquisition of the Subscription Rights to Shares through transfer shall require the approval by resolution of the Board of Directors of the Reorganized Company.
(h) Conditions for exercise of Subscription Rights to Shares It shall be determined in accordance with (*5) above.
(i) Conditions for acquisition of the Subscription Rights to Shares i) The Company may acquire the Subscription Rights to Shares without compensation at the
arrival of the day prescribed by its Board of Directors, in case the Right Holder comes to be unable to exercise all or part of the Subscription Rights to Shares in accordance with (*5) above or the allotment agreement for the Subscription Rights to Shares.
ii) The Company may acquire the Subscription Rights to Shares without compensation at the arrival of the day prescribed by its Board of Directors, in case an agenda for approval of one of the following 1, 2, 3, 4, or 5, is approved at the General Meeting of Shareholders of the Company (or, if approval of the General Meeting of Shareholders is not required, is resolved at the Board of Directors of the Company). 1. A Merger agreement, under which the Company shall be extinguished 2. An absorption-type company split agreement or an incorporation-type company split
plan, under which the Company shall be split. 3. A share exchange agreement or a share transfer plan, under which the Company shall
be a wholly owned subsidiary. 4. An amendment to the articles of incorporation to establish new provisions by which
any proposed transfer of shares issued by the Company shall require the approval of the Company.
5. An amendment to the articles of incorporation to establish new provisions by which any proposed transfer of any class shares to be issued upon exercise of the Subscription Rights to Shares shall require the approval of the Company or by which the Company may acquire all of the class shares to be issued upon exercise of the Subscription Rights to Shares by the General Meeting of Shareholders.
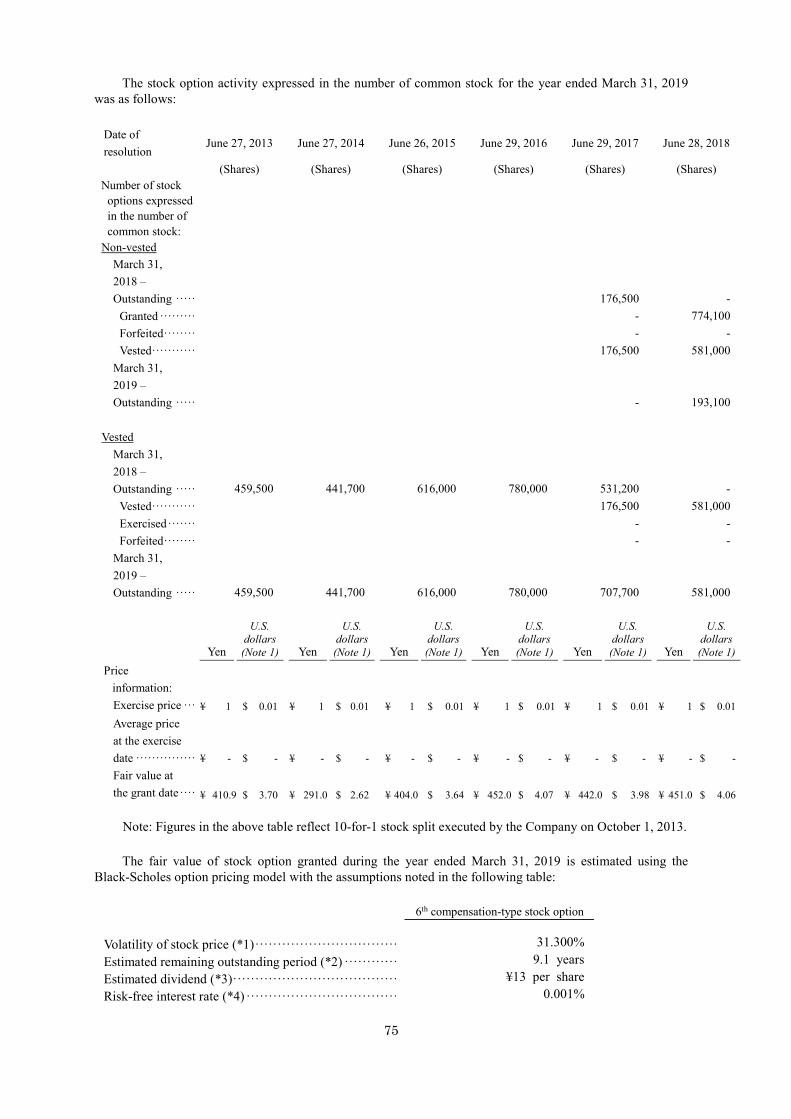
75
The stock option activity expressed in the number of common stock for the year ended March 31, 2019 was as follows:
Date of resolution
June 27, 2013 June 27, 2014 June 26, 2015 June 29, 2016 June 29, 2017 June 28, 2018
(Shares) (Shares) (Shares) (Shares) (Shares) (Shares) Number of stock
options expressed in the number of common stock:
Non-vested March 31, 2018 – Outstanding ····· 176,500 -
Granted ········· - 774,100 Forfeited ········ - - Vested ··········· 176,500 581,000
March 31, 2019 – Outstanding ····· - 193,100
Vested
March 31, 2018 – Outstanding ····· 459,500 441,700 616,000 780,000 531,200 -
Vested ··········· 176,500 581,000 Exercised ······· - - Forfeited ········ - -
March 31, 2019 – Outstanding ····· 459,500 441,700 616,000 780,000 707,700 581,000
Yen
U.S. dollars (Note 1) Yen
U.S. dollars (Note 1) Yen
U.S. dollars (Note 1) Yen
U.S. dollars (Note 1) Yen
U.S. dollars (Note 1) Yen
U.S. dollars (Note 1)
Price information:
Exercise price ··· ¥ 1 $ 0.01 ¥ 1 $ 0.01 ¥ 1 $ 0.01 ¥ 1 $ 0.01 ¥ 1 $ 0.01 ¥ 1 $ 0.01 Average price at the exercise date ··············· ¥ - $ - ¥ - $ - ¥ - $ - ¥ - $ - ¥ - $ - ¥ - $ - Fair value at the grant date ···· ¥ 410.9 $ 3.70 ¥ 291.0 $ 2.62 ¥ 404.0 $ 3.64 ¥ 452.0 $ 4.07 ¥ 442.0 $ 3.98 ¥ 451.0 $ 4.06
Note: Figures in the above table reflect 10-for-1 stock split executed by the Company on October 1, 2013.
The fair value of stock option granted during the year ended March 31, 2019 is estimated using the Black-Scholes option pricing model with the assumptions noted in the following table:
6th compensation-type stock option
Volatility of stock price (*1) ································ 31.300% Estimated remaining outstanding period (*2) ············ 9.1 years Estimated dividend (*3) ····································· ¥13 per share Risk-free interest rate (*4) ·································· 0.001%

76
Notes: (*1) The volatility of stock price is based on the historical weekly volatility of the Company’s stock for
the period equal to the option’s estimated remaining outstanding period from the grant date. (*2) The estimated remaining outstanding period is calculated by weighted averaging the estimated term
period of each director with the number of options granted. (*3) The estimated dividend is based on the actual per share dividend distributed in the preceding year
for the year ended March 31, 2018. (*4) The risk-free interest rate is based on the yield of government bonds having a remaining life equal
to the option’s estimated remaining outstanding period.
The actual numbers of forfeited options are used to measure the number of vested options, considering the difficulty to reasonably estimate future forfeitures.
22. SELLING, GENERAL AND ADMINISTRATIVE EXPENSES
The major components of “selling, general and administrative expenses” for the years ended March 31, 2019 and 2018 were as follows:
Millions of yen
Thousands of U.S. dollars
(Note 1) 2019 2018 2019
Advertising ··················································· ¥ 26,665 ¥ 27,884 $ 240,206 Salaries ······················································· 107,341 106,152 966,952 Rent expenses ················································ 72,341 73,064 651,657 Depreciation ·················································· 16,976 18,185 152,923 Point card-related promotion······························· 45,901 36,790 413,487 Others ························································· 143,902 137,276 1,296,299 Total ··························································· ¥ 413,126 ¥ 399,351 $ 3,721,524
23. OTHER INCOME (EXPENSES)
“Others, net” in “other income (expenses)” in the consolidated statements of income for the years ended March 31, 2019 and 2018 included the following:
Millions of yen
Thousands of U.S. dollars
(Note 1) 2019 2018 2019
Foreign exchange (losses) gains, net ······················ ¥ (145) ¥ 649 $ (1,302) Rent income ·················································· 3,936 4,217 35,453 Rent expenses ················································ (3,081) (3,514) (27,758) Rental expenses ·············································· (205) (476) (1,850) Sales of electric power ······································ 2,002 2,006 18,038 Cost of sales of electric power ····························· (823) (785) (7,412) Gain on sale of non-current assets ························ 454 - 4,091 Loss on disposal of non-current assets···················· (583) (553) (5,251) Gain on sale of investment securities ····················· 557 1 5,012 Others, net ···················································· 929 1,259 8,365 Total ··························································· ¥ 3,041 ¥ 2,804 $ 27,386
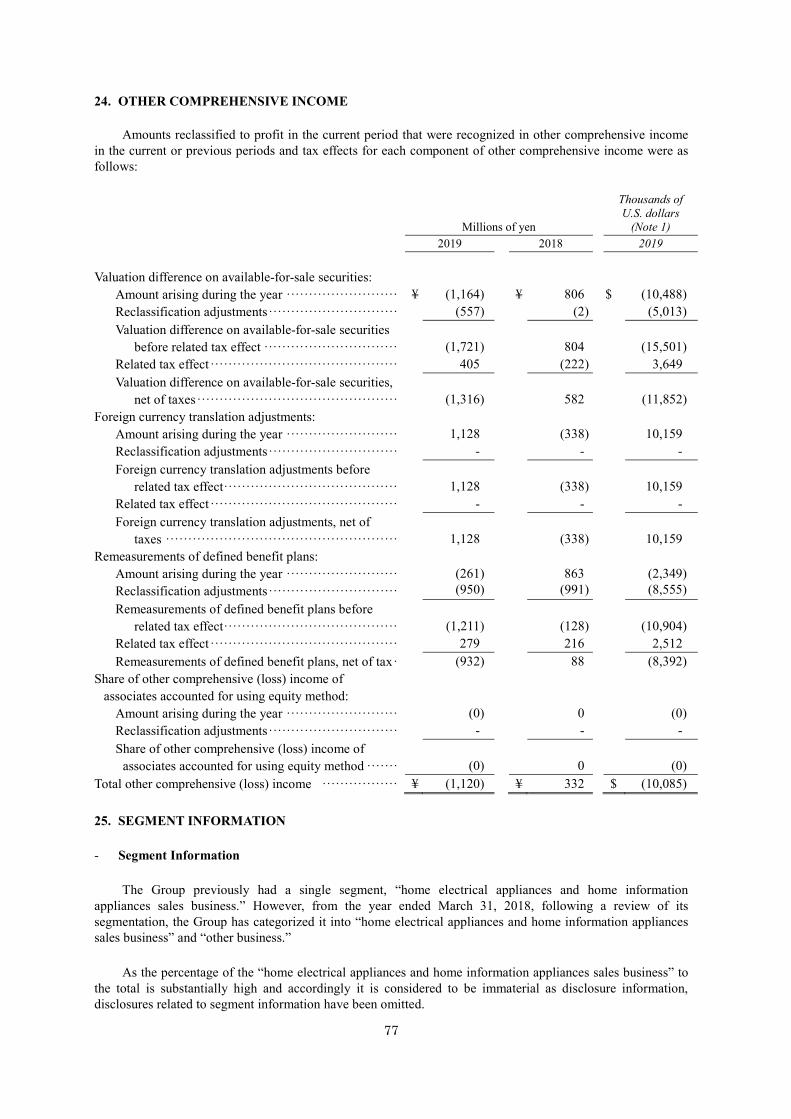
77
24. OTHER COMPREHENSIVE INCOME
Amounts reclassified to profit in the current period that were recognized in other comprehensive income in the current or previous periods and tax effects for each component of other comprehensive income were as follows:
Millions of yen
Thousands of U.S. dollars
(Note 1) 2019 2018 2019
Valuation difference on available-for-sale securities: Amount arising during the year ························· ¥ (1,164) ¥ 806 $ (10,488) Reclassification adjustments ····························· (557) (2) (5,013) Valuation difference on available-for-sale securities
before related tax effect ······························ (1,721) 804 (15,501) Related tax effect ·········································· 405 (222) 3,649 Valuation difference on available-for-sale securities,
net of taxes ············································· (1,316) 582 (11,852) Foreign currency translation adjustments:
Amount arising during the year ························· 1,128 (338) 10,159 Reclassification adjustments ····························· - - - Foreign currency translation adjustments before
related tax effect ······································· 1,128 (338) 10,159 Related tax effect ·········································· - - - Foreign currency translation adjustments, net of
taxes ···················································· 1,128 (338) 10,159 Remeasurements of defined benefit plans:
Amount arising during the year ························· (261) 863 (2,349) Reclassification adjustments ····························· (950) (991) (8,555) Remeasurements of defined benefit plans before
related tax effect ······································· (1,211) (128) (10,904) Related tax effect ·········································· 279 216 2,512 Remeasurements of defined benefit plans, net of tax · (932) 88 (8,392)
Share of other comprehensive (loss) income of associates accounted for using equity method:
Amount arising during the year ························· (0) 0 (0) Reclassification adjustments ····························· - - - Share of other comprehensive (loss) income of
associates accounted for using equity method ······· (0) 0 (0) Total other comprehensive (loss) income ················· ¥ (1,120) ¥ 332 $ (10,085)
25. SEGMENT INFORMATION
- Segment Information
The Group previously had a single segment, “home electrical appliances and home information appliances sales business.” However, from the year ended March 31, 2018, following a review of its segmentation, the Group has categorized it into “home electrical appliances and home information appliances sales business” and “other business.”
As the percentage of the “home electrical appliances and home information appliances sales business” to the total is substantially high and accordingly it is considered to be immaterial as disclosure information, disclosures related to segment information have been omitted.

78
- Supplemental Information on Reportable Segment
Information about products and services for the years ended March 31, 2019 and 2018 is as follows:
Millions of yen 2019 Home electrical appliances
& Home information appliances
Non-home electrical
appliances Total
Sales to external customers ············
¥ 1,341,511 ¥ 259,072 ¥ 1,600,583 Thousands of U.S. dollars (Note 1) 2019 Home electrical appliances
& Home information appliances
Non-home electrical
appliances Total
Sales to external customers ············
$ 12,084,601 $ 2,333,770 $ 14,418,371 Millions of yen 2018 Home electrical appliances
& Home information appliances
Non-home electrical
appliances Total
Sales to external customers ············
¥ 1,322,611 ¥ 251,262 ¥ 1,573,873
Information about geographic area for the years ended March 31, 2019 and 2018 has not been disclosed because sales to domestic customers and total property and equipment located in Japan accounted for more than 90% of consolidated sales and total property and equipment, respectively.
Information about major customers for the years ended March 31, 2019 and 2018 has not been disclosed since no single customer accounted for more than 10% of consolidated sales.
- Information about Impairment Loss on Long-Lived Assets in Reportable Segment
The Group has two business segments — “home electrical appliances and home information appliances sales business” and “other business.” As the percentage of “home electrical appliances and home information appliances sales business” to the total is substantially high and accordingly it is considered to be immaterial as disclosure information, disclosures related to segment information have been omitted.
- Information about Amortization and Unamortized Balances of Goodwill by Reportable Segment
The Group has two business segments — “home electrical appliances and home information appliances sales business” and “other business.” As the percentage of “home electrical appliances and home information appliances sales business” to the total is substantially high and accordingly it is considered to be immaterial as disclosure information, disclosures related to segment information have been omitted.
- Information about Gain on Negative Goodwill
Information about gain on negative goodwill has not been disclosed since there was no gain on negative goodwill.
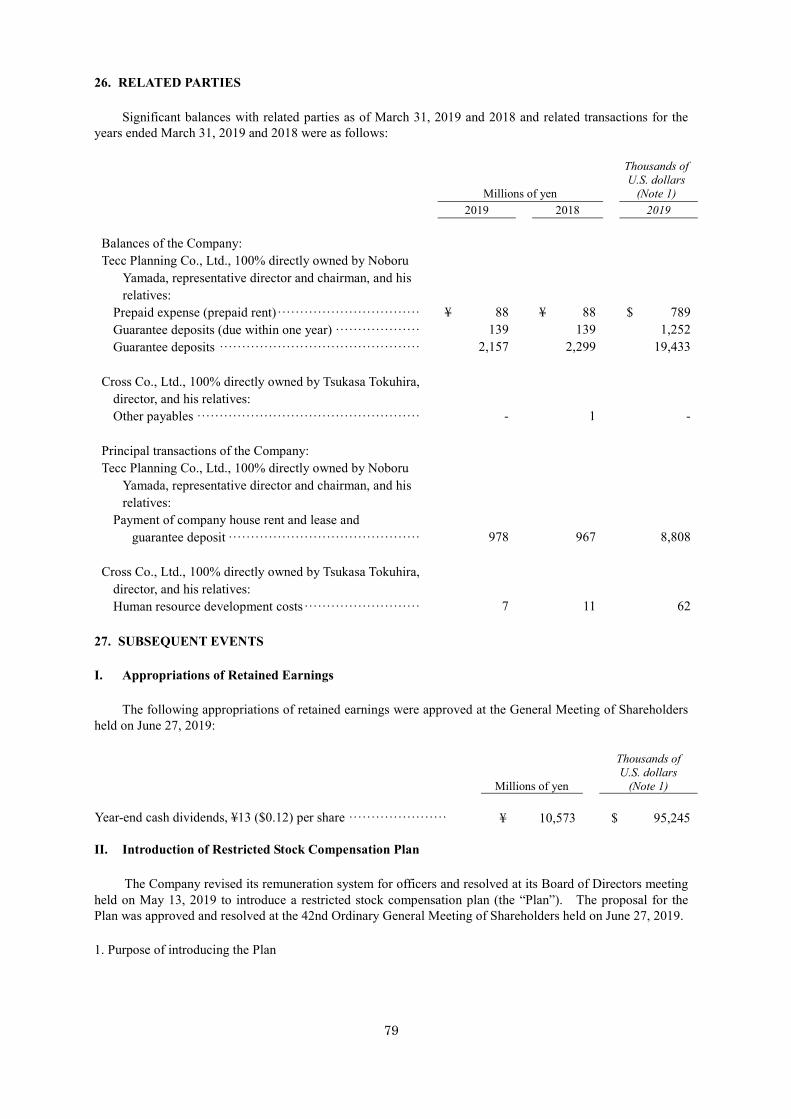
79
26. RELATED PARTIES
Significant balances with related parties as of March 31, 2019 and 2018 and related transactions for the years ended March 31, 2019 and 2018 were as follows:
Millions of yen
Thousands of U.S. dollars
(Note 1) 2019 2018 2019 Balances of the Company: Tecc Planning Co., Ltd., 100% directly owned by Noboru
Yamada, representative director and chairman, and his relatives:
Prepaid expense (prepaid rent) ································ ¥ 88 ¥ 88 $ 789 Guarantee deposits (due within one year) ··················· 139 139 1,252 Guarantee deposits ············································· 2,157 2,299 19,433
Cross Co., Ltd., 100% directly owned by Tsukasa Tokuhira,
director, and his relatives:
Other payables ·················································· - 1 -
Principal transactions of the Company: Tecc Planning Co., Ltd., 100% directly owned by Noboru
Yamada, representative director and chairman, and his relatives:
Payment of company house rent and lease and
guarantee deposit ···········································
978 967 8,808 Cross Co., Ltd., 100% directly owned by Tsukasa Tokuhira,
director, and his relatives:
Human resource development costs ·························· 7 11 62
27. SUBSEQUENT EVENTS
I. Appropriations of Retained Earnings
The following appropriations of retained earnings were approved at the General Meeting of Shareholders held on June 27, 2019:
Millions of yen
Thousands of U.S. dollars
(Note 1) Year-end cash dividends, ¥13 ($0.12) per share ······················ ¥ 10,573 $ 95,245 II. Introduction of Restricted Stock Compensation Plan
The Company revised its remuneration system for officers and resolved at its Board of Directors meeting held on May 13, 2019 to introduce a restricted stock compensation plan (the “Plan”). The proposal for the Plan was approved and resolved at the 42nd Ordinary General Meeting of Shareholders held on June 27, 2019.
1. Purpose of introducing the Plan

80
The Plan was introduced for the purpose of providing an incentive for Directors excluding External Directors (“Eligible Directors”) to sustainably increase the Company’s corporate value and further promoting shared value with shareholders.
After the introduction of the Plan, the Company’s remuneration system for officers will comprise three incentive plans: 1) medium-term incentives in the form of restricted stock compensation, in addition to 2) short-term incentives in the form of basic remuneration and bonus, and 3) long-term incentives in the form of stock compensation-type stock options. As such, the Company will have thereby established a remuneration system even more geared to enhancing corporate value of the Company.
2. Overview of the Plan
The Eligible Directors shall pay in all of the monetary remuneration claims to be provided by the Company based on the Plan in the form of property contributed in kind and shall receive shares of the Company’s common stock that will be issued or disposed of by the Company.
The total amount of monetary remuneration claims to be paid to the Eligible Directors based on the Plan shall be ¥450 million ($4,054 thousand) or less per annum (not including employee salaries of Directors who concurrently serve as employees). The specific timing and allotment of the payment for each Eligible Director shall be decided by the Board of Directors.
The total number of shares of the Company’s common stock to be issued or disposed of under the Plan shall be 1,000,000 shares or less per annum (however, if there is a share split (including an allotment without contribution) or a consolidation of shares of the Company’s common stock with the effective date on or after the date of resolution at the General Meeting of Shareholders, such total number of shares may be adjusted as necessary within the reasonable extent according to the share split/consolidation ratio). The amount to be paid in per share shall be determined at the Board of Directors based on the closing share price of the Company’s common stock on Tokyo Stock Exchange, Inc. on the business day immediately before each date of resolution by the Board of Directors (if there is no closing price on such date, the closing price of the closest preceding trading day) that will be within the range not specially advantageous to the Eligible Directors who are to subscribe to the shares of common stock.
For the issuance or disposal of shares of the Company’s common stock under the Plan (the “Common Stock under the Plan), an agreement on allotment of restricted shares shall be entered into between the Company and each Eligible Director. This agreement shall include the following terms: (1) The Common Stock under the Plan cannot be sold to a third party, used as collateral or transferred to another owner in any way during a designated period (the “Transfer Restriction Period”); and (2) The Company may acquire the Common Stock under the Plan at no cost in certain specified events. The Common Stock under the Plan will be managed in an account at Nomura Securities Co., Ltd. established by the Eligible Directors solely for this purpose during the Transfer Restriction Period in order to prevent the sale, use as collateral or transfer to another owner in any way.
* * * * * *