Financial Report 2016 PEOPLE PASSION PACKAGING · pharmaceutical market. May 2016 Folding carton...
128
Financial Report 2016 PEOPLE PASSION PACKAGING
Transcript of Financial Report 2016 PEOPLE PASSION PACKAGING · pharmaceutical market. May 2016 Folding carton...

Financial Report 2016
PEOPLEPASSION
PACKAGING
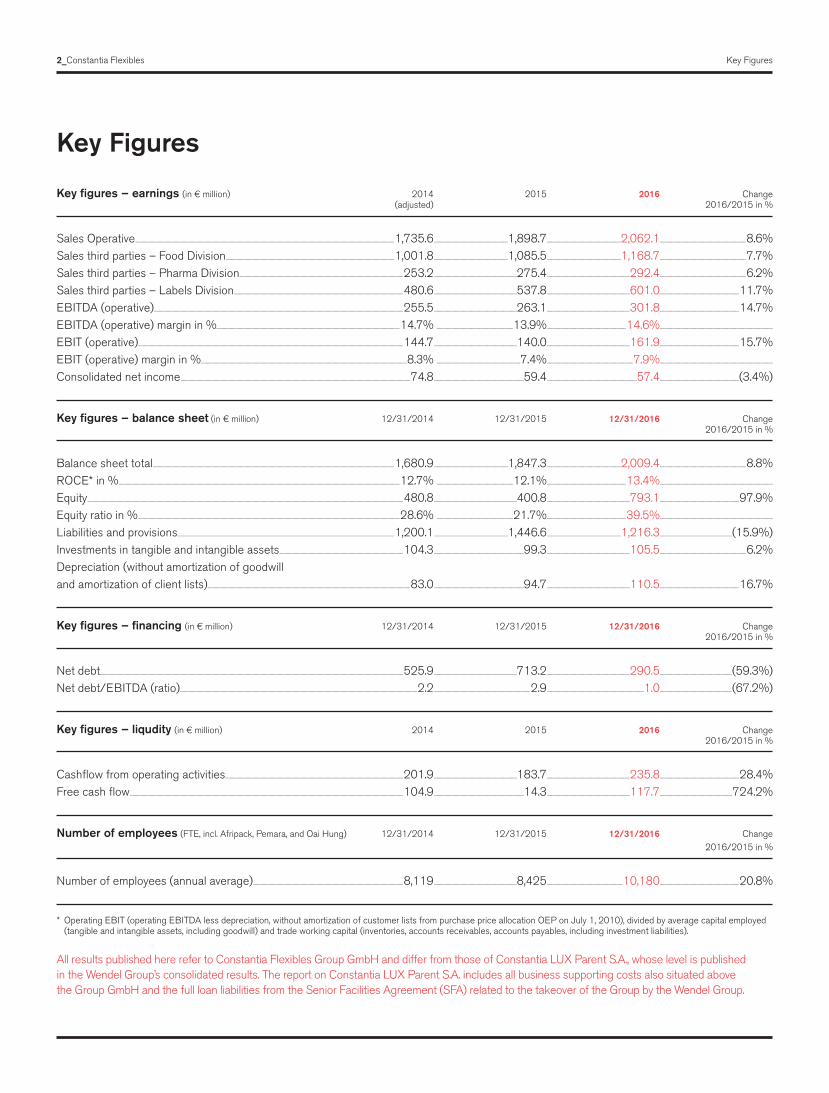
Key figures – earnings (in € million) 2014 2015 2016 Change (adjusted) 2016/2015 in %
Sales Operative ...................................................................................................................................................................................................................................................................................................1,735.6 ...................................................................................1,898.7 ...................................................................................2,062.1 .................................................................................................8.6%Sales third parties – Food Division .............................................................................................................................................................................................1,001.8 ...................................................................................1,085.5 ...................................................................................1,168.7 .................................................................................................7.7%Sales third parties – Pharma Division ........................................................................................................................................................................................253.2 .............................................................................................275.4 .............................................................................................292.4 .................................................................................................6.2%Sales third parties – Labels Division ..............................................................................................................................................................................................480.6 .............................................................................................537.8 .............................................................................................601.0 .........................................................................................11.7%EBITDA (operative) ........................................................................................................................................................................................................................................................................................255.5 .............................................................................................263.1 .............................................................................................301.8 .........................................................................................14.7%EBITDA (operative) margin in %..............................................................................................................................................................................................................14.7% ......................................................................................13.9% .........................................................................................14.6% ...............................................................................................................................
EBIT (operative) ..........................................................................................................................................................................................................................................................................................................144.7 .............................................................................................140.0 .............................................................................................161.9 .........................................................................................15.7%EBIT (operative) margin in % .......................................................................................................................................................................................................................................8.3% ..............................................................................................7.4% .................................................................................................7.9% ...............................................................................................................................
Consolidated net income ..................................................................................................................................................................................................................................................................74.8 .....................................................................................................59.4 .....................................................................................................57.4 .........................................................................................(3.4%)
Key figures – balance sheet (in € million) 12/31/2014 12/31/2015 12/31/2016 Change 2016/2015 in %
Balance sheet total ...............................................................................................................................................................................................................................................................................1,680.9 ...................................................................................1,847.3 ...................................................................................2,009.4 .................................................................................................8.8%ROCE* in % ............................................................................................................................................................................................................................................................................................................................12.7% ......................................................................................12.1% .........................................................................................13.4% ...............................................................................................................................
Equity ...................................................................................................................................................................................................................................................................................................................................................................480.8 .............................................................................................400.8 .............................................................................................793.1 .........................................................................................97.9%Equity ratio in % ......................................................................................................................................................................................................................................................................................................28.6% ......................................................................................21.7% .........................................................................................39.5% ...............................................................................................................................
Liabilities and provisions....................................................................................................................................................................................................................................................1,200.1 ...................................................................................1,446.6 ...................................................................................1,216.3 .................................................................................(15.9%)Investments in tangible and intangible assets ...........................................................................................................................................104.3 .....................................................................................................99.3 .............................................................................................105.5 .................................................................................................6.2%Depreciation (without amortization of goodwilland amortization of client lists) ....................................................................................................................................................................................................................................83.0 .....................................................................................................94.7 .............................................................................................110.5 .........................................................................................16.7%
Key figures – financing (in € million) 12/31/2014 12/31/2015 12/31/2016 Change 2016/2015 in %
Net debt .....................................................................................................................................................................................................................................................................................................................................................525.9 .............................................................................................713.2 .............................................................................................290.5 .................................................................................(59.3%)Net debt/EBITDA (ratio) ...........................................................................................................................................................................................................................................................................2.2 ............................................................................................................2.9 .............................................................................................................1.0 .................................................................................(67.2%)
Key figures – liqudity (in € million) 2014 2015 2016 Change 2016/2015 in %
Cashflow from operating activities ........................................................................................................................................................................................................201.9 .............................................................................................183.7 .............................................................................................235.8 .........................................................................................28.4%Free cash flow ...................................................................................................................................................................................................................................................................................................................104.9 .....................................................................................................14.3 .............................................................................................117.7 .................................................................................724.2%
Number of employees (FTE, incl. Afripack, Pemara, and Oai Hung) 12/31/2014 12/31/2015 12/31/2016 Change 2016/2015 in %
Number of employees (annual average).........................................................................................................................................................................8,119 .............................................................................................8,425 .....................................................................................10,180 .........................................................................................20.8%
* Operating EBIT (operating EBITDA less depreciation, without amortization of customer lists from purchase price allocation OEP on July 1, 2010), divided by average capital employed (tangible and intangible assets, including goodwill) and trade working capital (inventories, accounts receivables, accounts payables, including investment liabilities).
Key Figures
2_Constantia Flexibles Key Figures
All results published here refer to Constantia Flexibles Group GmbH and differ from those of Constantia LUX Parent S.A., whose level is published in the Wendel Group’s consolidated results. The report on Constantia LUX Parent S.A. includes all business supporting costs also situated above the Group GmbH and the full loan liabilities from the Senior Facilities Agreement (SFA) related to the takeover of the Group by the Wendel Group.

P. 2–5 Key Figures ............................................................................................................................................................................................................................................................................................................................................................................................................................2 Highlights 2016 ...................................................................................................................................................................................................................................................................................................................................................................................................4 Report of the Supervisory Board ...........................................................................................................................................................................................................................................................................................................5 P. 7–32 Management Report ...................................................................................................................................................................................................................................................................................................................................................................7 1. Overview of Constantia Flexibles............................................................................................................................................................................................................................................................................................8 2. Economic Development .............................................................................................................................................................................................................................................................................................................................................8 2.1 General Conditions ..............................................................................................................................................................................................................................................................................................................................................8 2.2 Energy and Commodities Market ..................................................................................................................................................................................................................................................................8 2.3 Development of the Market for Flexible Packaging .................................................................................................................................................................8 3. Business Performance ...........................................................................................................................................................................................................................................................................................................................................10 3.1 Basis of Consolidation ........................................................................................................................................................................................................................................................................................................................10 3.2 Financial Performance........................................................................................................................................................................................................................................................................................................................11 3.3 Purchasing.......................................................................................................................................................................................................................................................................................................................................................................................14 3.4 Net Assets and Financial Position .........................................................................................................................................................................................................................................................15 4. Investments ......................................................................................................................................................................................................................................................................................................................................................................................................18 5. Human Resources .................................................................................................................................................................................................................................................................................................................................................................19 6. Sustainability ................................................................................................................................................................................................................................................................................................................................................................................................22 7. Report on Risks and Opportunities .........................................................................................................................................................................................................................................................................25 7.1 Internal Control System ..................................................................................................................................................................................................................................................................................................................25 7.2 Business Risks ................................................................................................................................................................................................................................................................................................................................................................26 7.3 Business Opportunities ...................................................................................................................................................................................................................................................................................................................29 8. Research and Development ...............................................................................................................................................................................................................................................................................................................29 9. Events after the Reporting Period ...............................................................................................................................................................................................................................................................................31 10. Outlook for 2017 ................................................................................................................................................................................................................................................................................................................................................................32
P. 33–125 Consolidated Financial Statements ..................................................................................................................................................................................................................................................................33 Consolidated Balance Sheet as of December 31, 2016...................................................................................................................................................................34 Consolidated Income Statement for Fiscal Year 2016 ..............................................................................................................................................................................35 Consolidated Statement of Comprehensive Income for Fiscal Year 2016 ....................................................................36 Consolidated Cash Flow Statement for Fiscal Year 2016 ............................................................................................................................................................37 Consolidated Statement of Changes in Equity for Fiscal Year 2016 ...................................................................................................38 Notes to the Consolidated Financial Statements............................................................................................................................................................................................................40 A. General.............................................................................................................................................................................................................................................................................................................................................................................................................................40 B. Reporting currency and currency translation ....................................................................................................................................................................................................................40 C. Consolidation methods ........................................................................................................................................................................................................................................................................................................................................42 D. Acquisitions and other changes to the Scope of consolidation ..................................................................................................................43 E. Accounting policies ............................................................................................................................................................................................................................................................................................................................................................49 F. Application of new and revised International Financial Reporting Standards ...........................................60 G. Management Judgment and Use of Estimates.......................................................................................................................................................................................................63 H. Operating segments ......................................................................................................................................................................................................................................................................................................................................................64 I. Notes to the Consolidated Balance Sheet ......................................................................................................................................................................................................................................68 J. Notes to the Consolidated Income Statement ..............................................................................................................................................................................................................94 K. Notes to the Consolidated Cash Flow Statement ..................................................................................................................................................................................100 L. Financial instruments ...........................................................................................................................................................................................................................................................................................................................................101 M. Contingent Liabilities/Receivables and Commitments .....................................................................................................................................................117 N. Related party disclosures ...................................................................................................................................................................................................................................................................................................................118 O. Auditors’ fees ...................................................................................................................................................................................................................................................................................................................................................................................120 P. Group entities....................................................................................................................................................................................................................................................................................................................................................................................121 Q. Other disclosures ..............................................................................................................................................................................................................................................................................................................................................................123 Statement of the Management Board ..............................................................................................................................................................................................................................................................124 Auditor’s Report ......................................................................................................................................................................................................................................................................................................................................................................................125
Table of Contents Constantia Flexibles_3
Table of Contents

Highlights 2016
February 2016Investing in new capacity in SpainConstantia Flexibles invests in new capacity at its manufacturing site in Burgos, Spain. The installation of a new narrow web printer and narrow web adhesive lamination machine will be completed by the middle of 2017. The investment will serve growing demand from the home and personal care (HPC) industry for high-quality packaging used especially in cosmetics.
March 2016Constantia Flexibles increases sales and earnings in 2015Strong sales growth resulted from all business divisions and was achieved primarily by strong volume increases in all regions.
April 2016Constantia Flexibles awarded three Alufoil TrophiesConstantia Flexibles receives three Alufoil Trophies in the categories ConsumerConvenience, Product Safety and Resource Efficiency.
Investing in new capacity in GermanyConstantia Flexibles invests in new capacity at its manufacturing site in Weiden, Germany. The new 10-color rotogravure printingmachine will start production in the second quarter of 2017.
Constantia Flexibles strengthens its global presence in AsiaConstantia Flexibles buys pharmaceutical packaging manufacturer Oai Hung Co., Ltd. in Vietnam. Its main products are aluminum blister foil and rigid film for the growing local pharmaceutical market.
May 2016Folding carton business in Mexico soldThe Constantia Flexibles Group agrees to sell its non-core folding carton activities in Mexico, Aluprint Plegadizos, to Mexican company Grupo Gondi.
Stephan Kühne appointed as CFOConstantia Flexibles appoints Stephan Kühne (52) as Chief Financial Officer and Member of the Management Board. He joins the flexible packaging and labels group on August 22, 2016.
August 2016Pemara – 50 years in printPemara Labels celebrates its 50th anni- versary. Pemara Press was founded by Peter McNamara in Australia and grew quickly into a leading innovative printing company. The labels division was added in the late 70s. Constantia Flexibles acquired the labels specialist in 2015.
Constantia Flexibles winner of German Packaging AwardConstantia Flexibles is once again one of the winners of the prestigious annual German Packaging Award. The Company’s Christmas Bow Label Coca-Cola packaging innovation won in the category Designing & Processing for 2016.
September 2016Constantia Flexibles continues on growth pathConstantia Flexibles significantly improves sales and earnings in the first half of 2016 compared with the previous year as part of its global growth strategy.
Constantia Flexibles successfully reprices Term LoanThe Constantia Flexibles Group successfully accomplishes the repricing, amendment, andupsizing of its covenant-lite cross-border Term Loan B facility.
October 2016Constantia Flexibles strengthens position in European pharmaceutical packagingThe Constantia Flexibles Group buys the flexible packaging business owned by the Italian company Lamp San Prospero SPA in an asset deal. The company produces printed alu minum blister foil and cold-form slitting for major pharmaceutical companies in southern Europe.
Global in-mold labels leader Verstraete IML opens first production site in USABelgium-based Verstraete IML, the in-mold labels company, starts preparing the con-struction work for the new production site in Clarksville, Tennessee (US). The site will begin production in the second half of 2017.
November 2016Constantia Flexibles rated B in CDP climate scoreConstantia Flexibles is recognized with a strong CDP climate score rating for itshighly transparent climate reporting andclimate protection efforts. Constantia Flexibles is listed for the third time by CDP.
People Passion PackagingConstantia Flexibles establishes “People Passion Packaging” as its official global claim.
4_Constantia Flexibles Highlights 2016

Report of the Supervisory Board Constantia Flexibles_5
A Supervisory Board was constituted for Constantia Flexibles Group GmbH by a shareholder resolution of October 20, 2016. This took place in accordance with the new statutory provisions pursuant to the EU Directive & Regulation on the Auditing of Public Interest Entities and § 29 GmbHG. The company is directly affected by this due to a bond listed on the Vienna Stock Exchange.
This report therefore extends solely to the activity of the Supervisory Board for the period commencing October 20, 2016.
Working method of the Supervisory Board The Supervisory Board completes its tasks under the law and articles of association. Its activities mainly focus on regularly advising the Management Board on the manage-ment of the company and on monitoring the management of Constantia Flexibles Group GmbH.
The Management Board informs the Supervisory Board verbally and in writing, regularly (at least monthly), promptly and comprehensively, on all major developments of the com-pany, its business policy, profit situation, financial situation, investments, key indicators on health, safety, security and environment (‘HSSE’) and other crucial issues relating to corporate governance and budgeting. Transactions of considerable importance, planned acquisitions, and the group strategy and risk situation of the group are dealt with in detail.
Between meetings, the Management Board keeps the Supervisory Board apprised of important events. In cases of particular urgency, circular resolutions are passed or teleconferences held. The functioning and effectiveness of the Internal Control and Risk Management System are routinely discussed and the current investment projects as well as the budget for the year audited.
Focus of the workNo meetings were held in 2016 because a Supervisory Board was only established in Q4. The activities of the Supervisory Board during these few weeks were limited to controlling ongoing business activity on the basis of the comprehensive monthly reports presented by the Management Board. The sole meeting of the Audit Com-mittee dealt primarily with the procedural planning and provisional auditor’s management letter for the financial statement for 2016.
Committees of the Supervisory BoardThe Supervisory Board has formed an Audit Committee from among its members as the sole standing committee. For reasons of simplicity, all Supervisory Board members also belong to the Audit Committee as this means the Audit Committee of the group parent Constantia Flexibles Hold-ing GmbH has the same members, and topics of exten-sively the same content can be discussed in one meeting.
Supervisory Board meetingsIn 2016, no Supervisory Board meetings were convened apart from the constituting meeting, and one meeting of the Audit Committee was held.
Term of office of the Supervisory BoardThe term of office of all members ends at the general meeting that decides on the formal approval of the actions of the Management Board for fiscal year 2016.
Audit and approval of the financial statements for 2016The financial statements and the management report as well as the consolidated financial statements and group management report of Constantia Flexibles Group GmbH prepared by the Management Board were audited and given an unqualified audit opinion by PWC Wirtschafts-prüfung GmbH as auditor appointed pursuant to § 270 UGB (Austrian Business Code). These consolidated financial statements are published in addition to those of the group parent Constantia Flexibles Holding GmbH because of a bond listed on the Vienna Stock Exchange.
The Supervisory Board analyzed the annual financial state-ments, including management report, the consolidated financial statements, including group management report, the recommendation for distribution of the profits of Constantia Flexibles Group GmbH and the auditor’s man-agement letter in the presence of the auditor, reviewed them in accordance with § 30k of the GmbHG and ap-proved them on April 28, 2017. The regularly submitted activity reports of the group’s internal audit department showed that no risks had been identified that might have a significant impact on the existence or financial per-formance of the company. Overall, there were no grounds for the Supervisory Board to raise any objections.
Vienna, April 28, 2017
Roland LienauThe chairman of the Supervisory Board
Report of the Supervisory Boardaccording to § 30k GmbHG (Austrian Limited Liability Companies Act) for fiscal year 2016


MANAGEMENTREPORT
2016

8_Constantia Flexibles Management Report / Overview of Constantia Flexibles
1. Overview of Constantia Flexibles
2. Economic Development
The Group and its business segmentsWith more than 3,000 customers and roughly 10,000 employees, Constantia Flexibles is a leading provider in the field of flexible packaging. Production takes place in 24 countries at 55 locations. In the future, we will offer even more support in terms of our customers’ growth in the international markets – thereby evolving from a lead-ing European provider to a strong global supplier in the sector of flexible packaging. One of our special strengths lies in the area of in-house aluminum foil packaging, which offers considerable added value.
Due to consistent integration of the corporate acquisitions in recent years, Constantia Flexibles has also been able to establish itself globally as a leading packaging manu-facturer in the plastics sector. Our large global customers confirm that the plastics sector will be one of the main growth factors in the coming years, especially in the Emerging Markets. Constantia Flexibles thus covers all the bases in terms of a complete range of flexible packaging solutions.
The business model of Constantia Flexibles combines stability and growth. With flexible packaging solutions for the food, pharmaceutical, and beverage industries, the business closely complies with the daily needs of con-sumers and is therefore largely independent of economic cycles. Constantia Flexibles offers its customers a com-prehensive portfolio of high-quality, innovative, and flexible packaging made of aluminum, paper, and plastic in the Food, Pharma, and Labels Divisions.
2.1 General Conditions
Global On a global scale, 2016 can be summarized as a year of surprises, including an equity market correction in Q1/2016, followed by Brexit, the outcome of the US election, and an increase in commodity prices. Nevertheless, the global economy ended 2016 on a positive note, exemplified by the global manufacturing PMI, which reached a 34-month
The Food Division of Constantia Flexibles is a global market leader in a number of product lines, such as confectionery packaging, die-cut lids, and aluminum packaging systems. The Pharma Division is in second position globally in the area of blister-lid foils and cold-form foils. The Labels Division is the global market leader for beer labels and in-mold labels. In the past years, Constantia Flexibles has thus evolved from a European provider to a globally active Group that is growing together with its key accounts.
In 2016, the management developed a new strategy for the Company under the name Focus21. Constantia Flexibles is targeting profitable and sustainable sales and EBITDA growth in the mid-term by focusing on selective end-markets in attractive regions with its customers.The three pillars of Focus21 are: defending and extending the Company’s leading positions in the flexible packaging industry; focusing more strongly on growing businesses in which the Company is not yet a leader, and lastly making targeted acquisitions in all divisions.
The strategy is supported by a Value Creation Program that focuses on nurturing talented employees, creating an effective organizational structure, promoting commercial excellence such as innovation and global key account management, and optimizing cost leadership.
high in December 2016. Global growth in 2016 was expected to be 3.1%, slightly below the 2015 figure of 3.3%. The outlook for 2017 is for growth of 3.3%. Key risks to growth in 2017 include potential protectionist policies in the US, global monetary policy tightening, and a number of geopolitical events, including the out-come of upcoming elections in Germany and France.Source: Deutsche Bank, BNP Paribas, Unicredit

Economic Development / Management Report Constantia Flexibles_9
EuropeEurozone GDP increased by 1.7% compared with 1.6% in 2015. The key drivers of growth in 2016 were robust domestic demand on the back of accommodative mone-tary conditions, an expansionary fiscal stance, and real in-come gains due to lower energy prices. Germany, as the biggest economy, performed better in 2016 and grew by 1.9% compared with 1.7% in the previous year. Eurozone and German GDP is expected to grow by 1.4% in 2017, based on the forecast Brexit-related uncertainty, expecta-tions of slightly less loose fiscal policy, and higher inflation and energy prices.
Growth in Russia was expected to equal (0.6%) in 2016, compared with (3.7%) in 2015. Economic activity picked up in the second half of 2016, supported by rising oil prices, a strong improvement in the manufacturing PMI figure, and a return of foreign capital flows. It is probable that the Turkish economy slipped into recession in the second half of 2016 and ended the year at 2.1%, versus 4.0% seenin 2015. Major items impacting the Turkish economy in-cluded large imbalances, misplaced policies, and political events. In 2017, growth will likely return to 1.2% in Russia, while the forecast for Turkey is 2.8%. Source: Deutsche Bank, BNP Paribas, Unicredit
North AmericaClear signs that economic activity in the US gained momentum even before the election results included an improvement in household and corporate sentiment, per-haps in anticipation of future tax cuts. GDP increased by 1.6% in 2016. The growth of the Mexican economy likely slowed to 2.1% in 2016. It was impacted by the US elec-tion outcome, lower oil output, and rising inflation. The US economy is predicted to expand by 2.4% in 2017, while Mexico is set to record growth of 0.7% and is expected to implement a tighter monetary policy to minimize inflation risk. Source: Deutsche Bank, BNP Paribas, Unicredit
Emerging MarketsChina’s GDP probably increased by 6.7% in 2016 on the back of improved leading indicators and inflation perfor-mance in the industrial sector. The Indian economy was impacted by the currency demonetization announcement in the fourth quarter of 2016. However, a good monsoon season, a pickup in rural activity, and low oil prices
supported estimated GDP growth of 7.3% in 2016. Eco-nomic growth in South Africa in 2016 was the slowest in seven years. GDP was expected to have expanded by 0.4% due to softer industrial production, private consumption, and exports, while the rand depreciated significantly and inflation increased. In 2017, much Emerging Market growth will depend on how US growth, inflation, and the Fed respond to what looks like a more aggressive fiscal policy in the US. The outlook for China is 6.3% growth, while India and South Africa will likely grow by 7.6%and 1.4%, respectively. Source: Deutsche Bank,BNP Paribas, Unicredit
2.2 Energy and Commodities Market At a price of 57 US dollars per barrel at the end of 2016, the price of oil increased by 46% (39 US dollars per barrel of Brent) compared with 2015. At the end of 2016, the price of aluminum (3-month LME Officials) stood at 1,627 US dollars per ton, which represents an increase of 19% compared with the same period last year. The annual LME forecast for 2016 is 1,650 US dollars per ton. The forecasted value for oil is 59 US dollars per barrel for 2017. Source: Deutsche Bank, Unicredit, Harbor
2.3 Development of the Market for Flexible Packaging In 2016, the global flexible packaging market grew by 4%. Developed markets grew by 1–2% in Europe and 3–4% in North America. Emerging Market growth continued to be significantly higher, reaching as much as 6–8% in Southeast Asia and 10–12% in India. The market volume was diversified, with about 20% in Europe, approximately 30% in North America, and the remainder in the rest of the world, with a significant proportion coming from emerging Asia.
At present, the market is still highly fragmented with global and regional competitors. The five largest suppliers have a combined market share of about 20% worldwide. A clear trend towards market consolidation can be seen in both the markets of developed countries in Europe and in the United States, as well as in Emerging Markets. Digital printing is gaining ground, although its use is still small compared with conventional packaging. During 2016, greater importance was placed on sustainable packaging, specifically on material structures, bio-degradability, and compostability. Source: PCI Films Consulting, Management Estimate
10_Constantia Flexibles Management Report / Business Performance
3. Business Performance
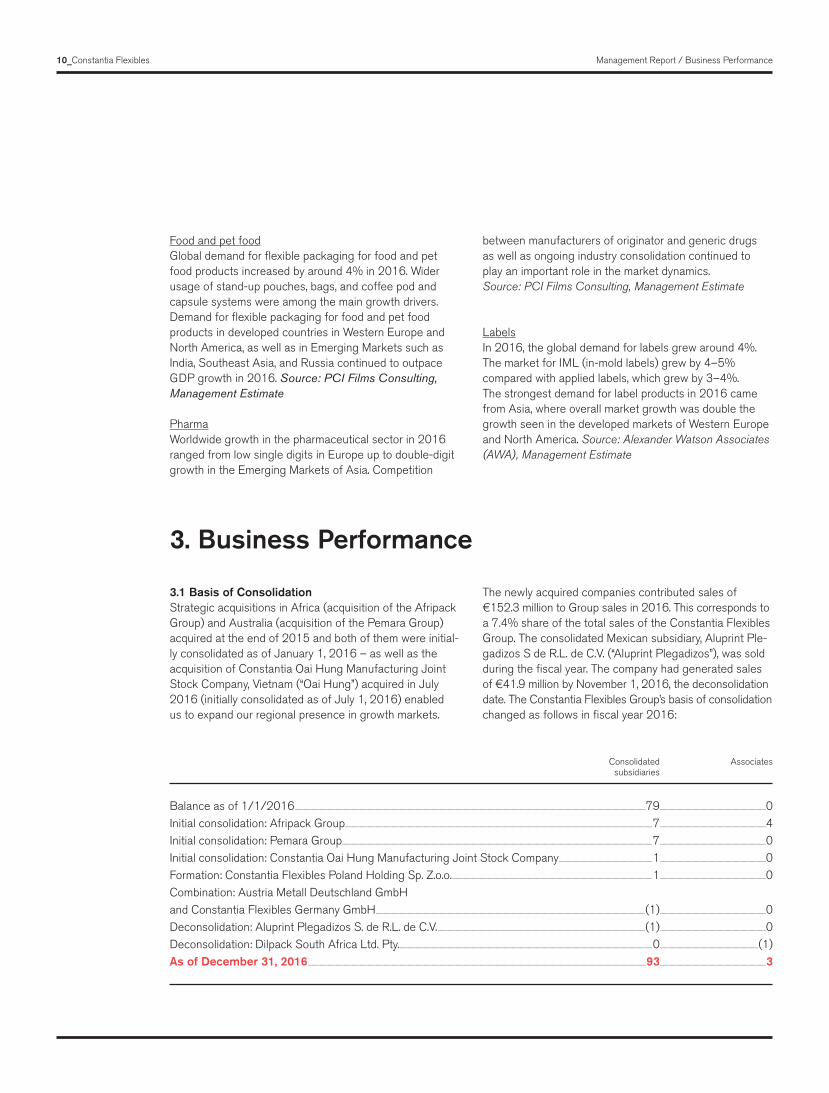
Consolidated Associates subsidiaries
Balance as of 1/1/2016 ...........................................................................................................................................................................................................................................................................................................................................................................................................79 .......................................................................................................................0Initial consolidation: Afripack Group .........................................................................................................................................................................................................................................................................................................................................................7 .......................................................................................................................4Initial consolidation: Pemara Group.............................................................................................................................................................................................................................................................................................................................................................7 .......................................................................................................................0Initial consolidation: Constantia Oai Hung Manufacturing Joint Stock Company .........................................................................................................1 .......................................................................................................................0Formation: Constantia Flexibles Poland Holding Sp. Z.o.o. .................................................................................................................................................................................................................................1 .......................................................................................................................0Combination: Austria Metall Deutschland GmbHand Constantia Flexibles Germany GmbH ...............................................................................................................................................................................................................................................................................................................(1) .......................................................................................................................0Deconsolidation: Aluprint Plegadizos S. de R.L. de C.V. .........................................................................................................................................................................................................................................(1) .......................................................................................................................0Deconsolidation: Dilpack South Africa Ltd. Pty. ............................................................................................................................................................................................................................................................................................0 ..............................................................................................................(1) As of December 31, 2016 ............................................................................................................................................................................................................................................................................................................................................................................................93 .......................................................................................................................3
3.1 Basis of ConsolidationStrategic acquisitions in Africa (acquisition of the Afripack Group) and Australia (acquisition of the Pemara Group) acquired at the end of 2015 and both of them were initial-ly consolidated as of January 1, 2016 – as well as theacquisition of Constantia Oai Hung Manufacturing Joint Stock Company, Vietnam (“Oai Hung”) acquired in July 2016 (initially consolidated as of July 1, 2016) enabled us to expand our regional presence in growth markets.
The newly acquired companies contributed sales of €152.3 million to Group sales in 2016. This corresponds to a 7.4% share of the total sales of the Constantia Flexibles Group. The consolidated Mexican subsidiary, Aluprint Ple-gadizos S de R.L. de C.V. (“Aluprint Plegadizos”), was sold during the fiscal year. The company had generated sales of €41.9 million by November 1, 2016, the deconsolidation date. The Constantia Flexibles Group’s basis of consolidation changed as follows in fiscal year 2016:
Food and pet foodGlobal demand for flexible packaging for food and pet food products increased by around 4% in 2016. Wider usage of stand-up pouches, bags, and coffee pod and capsule systems were among the main growth drivers. Demand for flexible packaging for food and pet food products in developed countries in Western Europe and North America, as well as in Emerging Markets such as India, Southeast Asia, and Russia continued to outpace GDP growth in 2016. Source: PCI Films Consulting, Management Estimate
PharmaWorldwide growth in the pharmaceutical sector in 2016 ranged from low single digits in Europe up to double-digit growth in the Emerging Markets of Asia. Competition
between manufacturers of originator and generic drugs as well as ongoing industry consolidation continued to play an important role in the market dynamics. Source: PCI Films Consulting, Management Estimate
LabelsIn 2016, the global demand for labels grew around 4%. The market for IML (in-mold labels) grew by 4–5% compared with applied labels, which grew by 3–4%. The strongest demand for label products in 2016 came from Asia, where overall market growth was double the growth seen in the developed markets of Western Europe and North America. Source: Alexander Watson Associates (AWA), Management Estimate

Business Performance / Management Report Constantia Flexibles_11
(in € million) 2015 2016 Change adjusted Group* adjusted Group**
Sales .............................................................................................................................................................................................................................................................................................................................................................1,898.7 ...................................................................................2,062.1 .................................................................................................8.6%EBITDA operating ...........................................................................................................................................................................................................................................................................................263.1 .............................................................................................301.8 .........................................................................................14.7%EBITDA margin .........................................................................................................................................................................................................................................................................................................13.9% .........................................................................................14.6% ...............................................................................................................................
EBIT operating .............................................................................................................................................................................................................................................................................................................140.0 .............................................................................................161.9 .........................................................................................15.6%EBIT margin ...................................................................................................................................................................................................................................................................................................................................7.4% .................................................................................................7.9% ...............................................................................................................................
* Results for fiscal year 2015 adjusted for €17.6 million in non-recurring effects (net effect of non-recurring income and expenses) comprising €3.6 million in M&A and post-merger costs, €7.9 million in IPO costs, €2.6 million in reorganization costs, and €3.5 million in other one-time effects. / ** Results for fiscal year 2016, adjusted for (€2.9) million in non-recurring effects (net effect from non-recurring income and expenses), mainly M&A costs, reorganization and restructuring costs, and the gain on deconsolidation from the disposal of Aluprint Plegadizos.
The Constantia Flexibles Group generated Group salesof €2,062.1 million in 2016 (2015: €1,898.7 million). This corresponds to nominal sales growth of €163.4 millionor 8.6% compared with the previous year.
Adjusted for foreign exchange differences and changes in the basis of consolidation, organic sales growth in the fiscal year in all of the Constantia Flexibles Group’s markets was €26.9 million or 1.5%; it was generated by both volume increases and improvements in the price/product mix.
In addition to the growth in sales, we also improved our operating performance, especially through targeted cost- savings projects and productivity gains, by focusing further on optimizing materials usage and production processes. Improvements in earnings continue to arise from reorgani-zation measures within the Group and from the increased focus on targeted product applications and a customer- focused sales organization.
In fiscal year 2016, the Polish zloty, the South African rand, the US dollar, the British pound, and the ruble were the Constantia Flexibles Group’s main currencies. The impact on sales growth from the appreciation of USD against EUR was offset by the depreciation of the other currencies listed above.
As the initial consolidation date of both the Pemara Group and the Afripack Group was January 1, 2016, and that of Oai Hung was July 1, 2016, none of them are included in net income for 2015. They contributed €152.3 million to Group sales in fiscal year 2016.
In fiscal year 2016, the Constantia Flexibles Group gener-ated positive cross-region growth rates in the markets that are relevant to it – Europe, America, and Emerging Markets, with Europe and especially Emerging Markets achieving the strongest growth. The main growth drivers in this respect are the acquisitions in fiscal year 2013 of the Globalpack Group, the Spear Group, and Parikh Packaging Pvt. Ltd. (“Parikh”).
The Food Division remained stable globally in 2016, but there were regional differences in the growth rates.Adjusted for foreign currency effects, growth in the Europe region was slightly negative in 2016 due to low commodities prices. In terms of volume, growth was positive and driven mainly by innovations and new lines of business involving plastic-based products (e.g. coffee and teabag packaging as well as confectionery packag-ing) for global and regional customers.
3.2 Financial Performance

12_Constantia Flexibles Management Report / Business Development
The Emerging Markets region posted negative growth in the fiscal year due to the political unrest that continues unabated (particularly in Turkey, a region that is important to us) and due to the difficulties of exporting into the neighboring countries.
Compared with the previous year, the America region performed well in 2016. This growth stems from the sus-tained expansion of business with plastic-based snack packaging, a focus on products in the higher price seg-ment, and the successful export of European innovations.
The Pharma Division was a stable growth driver in 2016, as before. Its core product, cold-form foils, generated sig-nificant growth rates in all important markets. This was supported by innovative products in the Home & Personal Care Packaging segment, which created new business relationships and opened up new regional markets.
Food Division sales (including Group sales) rose by €76.7 million in fiscal year 2016 (including the Afripack Group’s share attributable to the Food Division). This corresponds to a nominal increase of 6.8% to €1,204.3 million. The Food Division’s share in the Constantia Flexibles Group’s consolidated total sales thus was 56.7%.
Sales growth in the Labels Division results from the posi-tive business performance in all technologies. Thanks to new innovative projects, the Spear Group, which was ac-quired in fiscal year 2013 and specializes in pressure- sensitive labels technology, was key to the increase in sales especially with our global customers. The opening up of new markets, especially in the high-growth Asia region, also boosted business with conventional wet-glue labels.
Operating EBITDA at the Group level rose by €38.7 million or 14.7% to €301.8 million in 2016, including the earnings contribution from the acquisitions of the Pemara Group, the Afripack Group, and Oai Hung. Including the acquisi-tions, this corresponds to an operating EBITDA margin of 14.6% (2015: 13.9%), which represents an improvement of 70 basis points. Excluding the three acquisitions, the EBITDA margin of the Constantia Flexibles Group would be 15.0%.
Organic sales growth, adjusted for foreign exchange differences and changes in the basis of consolidation, were (€4.6) million or (0.4%), due above all to the difficult market conditions in some of the Emerging Markets.
(in € million) 2015 2016 Change
Sales .............................................................................................................................................................................................................................................................................................................................................................1,127.6 ...................................................................................1,204.3 .................................................................................................6.8%EBITDA operating ...............................................................................................................................................................................................................................................................................................154.2 .............................................................................................161.3 .................................................................................................4.6%EBITDA margin .........................................................................................................................................................................................................................................................................................................13.7% .........................................................................................13.4% ...............................................................................................................................
EBIT operating .....................................................................................................................................................................................................................................................................................................................87.5 .....................................................................................................84.4 .........................................................................................(3.5%)EBIT margin ...................................................................................................................................................................................................................................................................................................................................7.8% .................................................................................................7.0% ...............................................................................................................................
3.2.1 Food Division
Business Performance / Management Report Constantia Flexibles_13
In contrast, the Food Division’s growth in America (excluding the earnings contributions from the disposal of Aluprint Plegadizos) was particularly pleasing. Sales growth in the plastic-based snack packaging business was substantial.
Sales in Europe declined slightly, primarily due to low commodities prices. In terms of volume, sales of plas-tic-based packaging for confectionery and ready-made meals increased yet again. Additional innovation drivers – e.g., coffee and tea portion packs – also enabled us to roll out new product developments and gain market share.
EBITDA in the Food Division (including the Afripack Group’s share attributable to the Food Division) improved
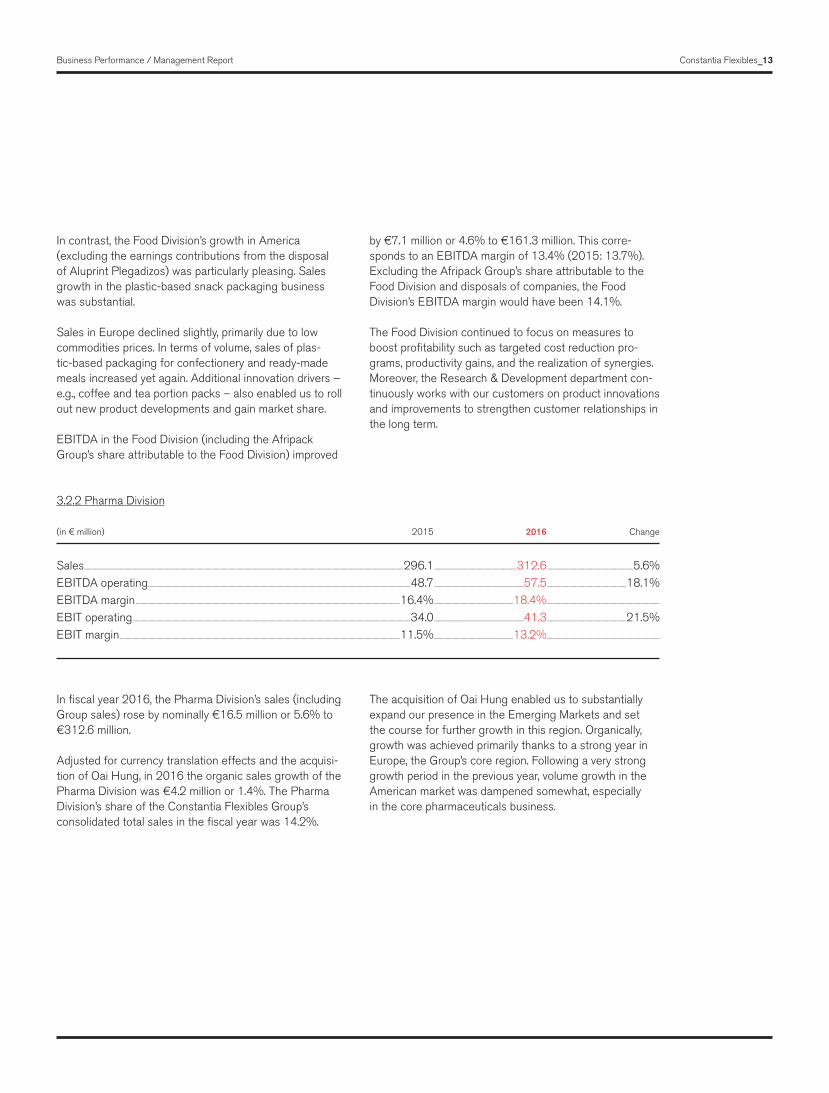
In fiscal year 2016, the Pharma Division’s sales (including Group sales) rose by nominally €16.5 million or 5.6% to €312.6 million.
Adjusted for currency translation effects and the acquisi-tion of Oai Hung, in 2016 the organic sales growth of the Pharma Division was €4.2 million or 1.4%. The Pharma Division’s share of the Constantia Flexibles Group’s consolidated total sales in the fiscal year was 14.2%.
The acquisition of Oai Hung enabled us to substantially expand our presence in the Emerging Markets and set the course for further growth in this region. Organically, growth was achieved primarily thanks to a strong year in Europe, the Group’s core region. Following a very strong growth period in the previous year, volume growth in the American market was dampened somewhat, especially in the core pharmaceuticals business.
by €7.1 million or 4.6% to €161.3 million. This corre-sponds to an EBITDA margin of 13.4% (2015: 13.7%). Excluding the Afripack Group’s share attributable to the Food Division and disposals of companies, the Food Division’s EBITDA margin would have been 14.1%.
The Food Division continued to focus on measures to boost profitability such as targeted cost reduction pro-grams, productivity gains, and the realization of synergies. Moreover, the Research & Development department con-tinuously works with our customers on product innovations and improvements to strengthen customer relationships in the long term.
(in € million) 2015 2016 Change
Sales .......................................................................................................................................................................................................................................................................................................................................................................296.1 .............................................................................................312.6 .................................................................................................5.6%EBITDA operating .......................................................................................................................................................................................................................................................................................................48.7 .....................................................................................................57.5 .........................................................................................18.1%EBITDA margin .........................................................................................................................................................................................................................................................................................................16.4% .........................................................................................18.4% ...............................................................................................................................
EBIT operating ........................................................................................................................................................................................................................................................................................................................34.0 .....................................................................................................41.3 .........................................................................................21.5%EBIT margin ...........................................................................................................................................................................................................................................................................................................................11.5% .........................................................................................13.2% ...............................................................................................................................
3.2.2 Pharma Division

In fiscal year 2016, the Pharma Division’s EBITDA im-proved by €8.8 million or 18.1% to €57.5 million. There was a sharp increase in the EBITDA margin to 18.4% (2015: 16.4%). Excluding the effects from the acquisition
In fiscal year 2016, sales of the Labels Division (including the Afripack Group’s share attributable to the Labels Division and all of the Pemara Group) rose by €63.9 million to €604.7 million. This corresponds to a nominal increase in sales of 11.8%. The share of the Labels Division in the Constantia Flexibles Group’s total sales in 2016 is 29.1%.
Adjusted for currency effects, organic sales growth at the Labels Division was €21.0 million or 3.9% in 2016. As previously, market growth in 2016, particularly in the global beer market, was driven by the rising demand for higher-value labels (especially pressure-sensitive labels). The 2013 acquisition of the Spear Group, the market leader in pressure-sensitive labels, enabled us to track this market trend. The rising worldwide demand for plastic labels also drove the growth in sales, which was supported by both the ongoing expansion of existing business rela-tionships and the acquisition of new customers in Asia.
The Labels Division’s EBITDA (including the Afripack Group’s share attributable to the Labels Division and all of the Pemara Group) rose in 2016 by €7.2 million or 7.7% to €100.8 million, which corresponds to a margin of 16.7% (2015: 17.3%). Excluding the Afripack Group’s share attributable to the Labels Division and all of the Pemara Group, the EBITDA margin of the Labels Division would be 17.1%.
of Oai Hung, the EBITDA margin of the Pharma Division would be 17.5%. Sustainable sales growth supported by targeted productivity gains largely drove the positive growth in EBITDA.
3.3 PurchasingThe purchasing organization of Constantia Flexibles con-tinued to be an important player within the Group in 2016. All of its activities were focused primarily on ensuring stable supplies of materials and services, taking cost targets and quality requirements into account. To achieve these goals and implement them across the board, Constantia Flexibles has strengthened its relationships with select strategic suppliers and launched a multitude of new projects.
The specific focus was on improving the Company’s work-ing capital. We entered into supply chain finance contracts with key suppliers in 2016. Our work to optimize payment terms continued apace and the use of consignment ware-houses was expanded.
Upon completion of a successful pilot phase, the purchasing organization also initiated the groupwide implementation of the online catalog for C-materials (e.g., office supplies, tools, etc.). This e-procurement tool streamlines adminis-trative processes, enhances transparency, and boosts efficiency.
(in € million) 2015 2016 Change
Sales .......................................................................................................................................................................................................................................................................................................................................................................540.8 .............................................................................................604.7 .........................................................................................11.8%EBITDA operating .......................................................................................................................................................................................................................................................................................................93.6 .............................................................................................100.8 .................................................................................................7.7%EBITDA margin .........................................................................................................................................................................................................................................................................................................17.3% .........................................................................................16.7% ...............................................................................................................................
EBIT operating ........................................................................................................................................................................................................................................................................................................................54.2 .....................................................................................................56.8 .................................................................................................4.8%EBIT margin ...........................................................................................................................................................................................................................................................................................................................10.0% .................................................................................................9.4% ...............................................................................................................................
3.1.3 Labels Division
14_Constantia Flexibles Management Report / Business Development
In light of the Constantia Group’s rapid growth and the resulting increase in data volumes, the purchasing or-ganization also pays close attention to the continuous improvement of data quality. The acquired entities in Asia and Africa were successfully integrated into the procurement database by the end of 2016.
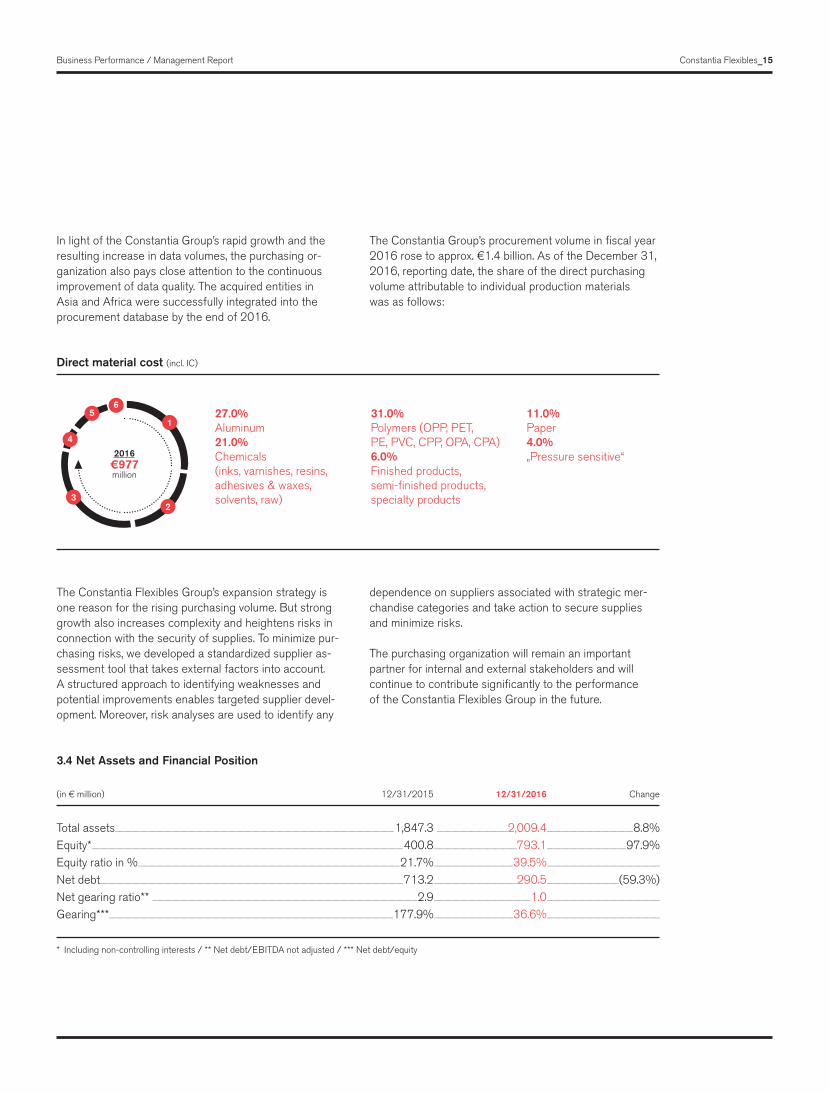
The Constantia Group’s procurement volume in fiscal year 2016 rose to approx. €1.4 billion. As of the December 31, 2016, reporting date, the share of the direct purchasing volume attributable to individual production materials was as follows:
The Constantia Flexibles Group’s expansion strategy is one reason for the rising purchasing volume. But strong growth also increases complexity and heightens risks in connection with the security of supplies. To minimize pur-chasing risks, we developed a standardized supplier as-sessment tool that takes external factors into account. A structured approach to identifying weaknesses and potential improvements enables targeted supplier devel-opment. Moreover, risk analyses are used to identify any
dependence on suppliers associated with strategic mer-chandise categories and take action to secure supplies and minimize risks.
The purchasing organization will remain an important partner for internal and external stakeholders and will continue to contribute significantly to the performance of the Constantia Flexibles Group in the future.
27.0%Aluminum21.0%Chemicals(inks, varnishes, resins, adhesives & waxes, solvents, raw)
31.0%Polymers (OPP, PET,PE, PVC, CPP, OPA, CPA)6.0%Finished products,semi-finished products,specialty products
11.0%Paper4.0%„Pressure sensitive“
Direct material cost (incl. IC)
1
23
4
56
2016€977million
(in € million) 12/31/2015 12/31/2016 Change
Total assets ..........................................................................................................................................................................................................................................................................................................................1,847.3 ................................................................................2,009.4 .................................................................................................8.8%Equity* ..............................................................................................................................................................................................................................................................................................................................................................400.8 .............................................................................................793.1 .........................................................................................97.9%Equity ratio in % ......................................................................................................................................................................................................................................................................................................21.7% .........................................................................................39.5% ...............................................................................................................................
Net debt .....................................................................................................................................................................................................................................................................................................................................................713.2 .............................................................................................290.5 .................................................................................(59.3%)Net gearing ratio** ..........................................................................................................................................................................................................................................................................................................2.9 ............................................................................................................1.0 ...............................................................................................................................
Gearing***................................................................................................................................................................................................................................................................................................................................177.9% .........................................................................................36.6% ...............................................................................................................................
* Including non-controlling interests / ** Net debt/EBITDA not adjusted / *** Net debt/equity
3.4 Net Assets and Financial Position
Business Performance / Management Report Constantia Flexibles_15
Changes in total assetsThe increase in total assets by €162.1 million to €2,009.4 million is mainly due to the change in the basis of consoli-dation (initial consolidation of the Afripack Group, the Pemara Group, and Oai Hung as well as deconsolidation of Aluprint Plegadizos).
Goodwill rose by €62.2 million. This includes €51.8 million from the initial consolidation of Afripack, Pemara, and Oai Hung as well as €1.5 million from the deconsolidation of Aluprint Plegadizos. Goodwill is subject to additional fluctuations due to foreign exchange differences.
The decrease in intangible assets due to the amortization losses of €35.2 million as well as €18.5 million of dis-posals from the deconsolidation of Aluprint Plegadizos contrasts with additions of €55.8 million that stem mainly from the new acquisitions (Afripack, Pemara, and Oai Hung).
The increase in property, plant, and equipment was due primarily to the new acquisitions. Depreciation and im-pairment losses of €104.6 million exceeded capital expenditures of €98.7 million.
Initial consolidation reduced other non-current assets and financial assets by €72.9 million, because the carrying amounts of both the Afripack Group and the Pemara Group were reported in this item in the previous year. The change in the basis of consolidation substantially accounts for the increase in inventories (€22.6 million), trade receivables (€44.0 million), and trade payables (€63.5 million).
In fiscal year 2016, certain Constantia Flexibles Group companies sold receivables to financial institutions (true factoring transactions). Selling the receivables to financial institutions also transferred the default risk to them. The transferred receivables of €134.8 million (December 31, 2015: €135.7 million) were derecognized accordingly.
Cash and cash equivalents rose by €61.5 million to €122.6 million. This includes the proceeds from the disposal of Aluprint Plegadizos.
The conversion of €416.0 million in loans of Constantia Flexibles Group GmbH into profit participation rights (for details see Chapter I.7 of the Notes to the Consolidated Financial Statements) as well as the reclassification of the bond due in May 2017 (€129.1 million) from non-current to current interest-bearing financial liabilities changed financial liabilities.
A put option was agreed as part of the acquisition ofOai Hung and recognized in other non-current liabilities (value as of the reporting date: €39.0 million); the current portion of the put option regarding the acquisition of the non-controlling interests in Parikh was reclassified to other current liabilities.
As of January 1, 2016, Constantia Flexibles Holding GmbH, which is not consolidated, took over the function of theultimate group parent of the Austrian tax group fromConstantia Flexibles Group GmbH. This increases not just the deferred tax liabilities due to the partial reversal of capitalized loss carryforwards that had been offset the previous year against deferred tax liabilities in the then Austrian tax group, but also the liabilities from current taxes, because the Austrian companies have €16.9 million in tax liabilities to Constantia Flexibles Holding GmbH.
The liabilities from current taxes in 2016 also contain provisions of €9.0 million in connection with the pending proceedings concerning the continuation or new formation of the Austrian tax group for 2010.
In the first half of 2016, the €35.9 million payment (earn-out) to the then owner of the Spear Group, which had been acquired in fiscal year 2013, lowered the other current liabilities. In the second half of 2016, both the €13.5 million earn-out obligation stipulated in connection with the acquisition of Oai Hung and the reclassification of the Parikh put option (€5.7 million) from non-current liabilities increased current liabilities.
16_Constantia Flexibles Management Report / Business Development

Changes in equityThe Company was authorized – by a resolution dated March 1, 2016, of the shareholders of Constantia Flexibles Beteiligungs GmbH as the sole shareholder of Constantia Flexibles GmbH – to issue a profit and loss participation right classified as equity for tax purposes (Substanzgenussrecht) with a nominal value of €416.0 million. When the profit and loss participation right agreement dated March 1, 2016, was entered into, previously received share-holder loans were converted into a profit or loss participation right in Constantia Flexibles Group GmbH in the same amount. This reduces the non-current financial liabilities of Constantia Flexibles Group GmbH by €416.0 million and increases retained earnings by the same amount.
The profit participation rights outstanding are presented in equity in accordance with IAS 32.16. Constantia Flexibles Holding GmbH is the sole owner of the profit participation right; by subscribing to the profit participation right it ac-quired an interest in the profit and assets of Constantia Flexibles Group GmbH. The owner of the profit participation right does not have an ordinary or extraordinary redemption right and has furnished the capital to the issuer for an in-definite period of time. A redemption right was granted to the issuer for the sole purpose of being able to freely dis-pose of the capital made available. The profit participation right must be allocated to the most subordinate class.
Cash and cash equivalents as of December 31, 2016, were €122.6 million.
The €52.1 million increase in cash flow from operating activities is largely due to an increase in reported EBIT-DA from €245.5 million to €304.8 million. Adjusted for the net income from the disposal of property, plant, and equipment as well as intangible assets, the actual increase is €33.9 million. The reduction in working capital had a
When the equity interests in the Afripack Group and Oai Hung were acquired, the non-controlling shareholders were granted the right to sell the remaining shares to the Constantia Flexibles Group. The present value of the put option as of the initial consolidation date was determined to be €12.8 million and €35.9 million, respectively.
The remaining non-controlling interests in Constantia Aloform GmbH, Germany, were acquired in 2016 for €2.6 million. Constantia CM Labels SDN BHD’s remaining non-controlling interests were acquired for €2.5 million in 2016. An additional 15% of the shares of Parikh Packaging Pvt. Ltd. were acquired for €4.7 million.
A dividend of €62.0 million was distributed to the share-holder in 2016.
Changes in net debtAs shown in detail above, the decrease in net debt by €420.7 million from €713.2 million to €290.5 million stems largely from the reclassification of the financial liabilities into a profit or loss participation right classified as equity for tax purposes, and thus as equity for accounting purposes.
The gearing ratio thus drops from 177.9% to 36.6%. The ratio of net debt to reported EBITDA for the past 12 months is 1.0.
positive effect of €27.0 million, which more than offset the negative effect of €11.8 million from the change in provi-sions that stems mainly from bonus payments.
Cash flow from investing activities includes a €35.9 million payment of contingent consideration in connection with the acquisition of the Spear Group, the €15.1 million payment for the acquisition of Oai Hung, and the €6.8 mil-lion payment for the acquisition of the assets of Constantia
Cash flows
(in € million) 2015 2016 Change
Cash flow from operating activities ....................................................................................................................................................................................................183.7 ..........................................................................................235.8 .....................................................................................28.4%Cash flow from investing activities ................................................................................................................................................................................................(169.4) ....................................................................................(118.2) .................................................................................(30.2%)Cash flow from financing activities ..............................................................................................................................................................................................................32.2 ............................................................................................(57.9) .........................................................................(279.8%)
Business Performance / Management Report Constantia Flexibles_17

San Prospero S.r.l., Italy. Positive effects resulted from the receipt of the proceeds (€50.6 million) of the disposal of Aluprint Plegadizos, net of that company’s cash and cash equivalents disposed (€9.9 million), and from the acquisi-tion of the cash and cash equivalents (€7.6 million) of the Afripack Group, the Pemara Group, and Oai Hung in con-nection with their initial consolidation. Also included are expenditures of €109.0 million for investments in property, plant, and equipment as well as intangible assets (2015: €105.3 million). The previous year’s figure mainly included the purchase price payments of €52.4 million for the acquisition of the Afripack Group and the Pemara Group.
Cash flow from financing activities in the amount of (€57.9 million) contains borrowings that were used to fund the contingent consideration and the acquisition of Oai Hung. Loans were taken out the previous year to fund the acquisitions of the Afripack Group and the Pemara Group. The cash outflows concern dividend payments of €62.0 million to the shareholders and €5.6 million to non-controlling interest shareholders (2015: €9.7 million). Expenditures of €7.7 million (2015: €4.2 million) were incurred to acquire non-controlling interests.
Additions to property, plant, and equipment as well as intangible assets during the reporting period were €105.5 million or 5.1% of sales (compared with €99.3 million or 5.2% of sales in 2015). The investments include about €3.0 million for reconstruction work following fires in African and German plants as well as work in connec-tion with flood damage. Excluding these extraordinary capital expenditures associated with the damage to these three plants, the additions to property, plant, and equip-ment as well as intangible assets would be €102.4 million or 5.0% of sales. The most important projects during the reporting period were:
• Offset printing presses and buildings in Belgium;• Gravure press in Mexico;• Narrow web press in the UK; and• SB Triplex Laminator in Russia
More than 30% of the investments are associated with growth and productivity gains. All other investments served maintenance and replacement purposes and/or were necessary under regulatory requirements (e.g., environmental regulations). The capital spending ratio in 2016 was 35% of EBITDA.
Depreciation, amortization, and impairment losses in 2016 were €139.9 million (2015: €123.1 million). Property, plant, and equipment accounted for €104.6 million(2015: €89.9 million) of this amount and intangible assets accounted for €35.3 million (2015: €33.2 million).
4. Investments
18_Constantia Flexibles Management Report / Investments

Human Resources / Management Report Constantia Flexibles_19
5. Human Resources
Thanks to their skills and performance, the employees of Constantia Flexibles are at the heart of the Company’s success. Besides actively supporting organizational and change processes, the main task of our Human Resources department is to recruit personnel strategically and to foster our employees’ development. Selecting the right personnel and supporting the advancement of each and every employee are the key to the long-term financial success of Constantia Flexibles.
The Constantia Flexibles Group is a leading manufacturer of flexible packaging worldwide. In fiscal year 2016, it again enhanced its attractiveness as an employer. A cor-porate culture focused on employee development, a performance-based compensation system, and attractive benefits are the Company’s bedrock.
The annual average number of employees (FTE) was 10,180* in fiscal year 2016. This corresponds to an increase of 1,755 employees compared with fiscal year 2015.
Development of organizational structureUnder the strategic Focus21 initiative, effective January 1, 2017, some elements of the organizational structure were adjusted to match the Company’s strategic goals.
• While the basic divisional structure comprising three divisions turned out to be the right approach for assuring both customer proximity and rapid decision-making and thus was retained, both the sales and the technical organizations were changed.
• A key account organization was defined for select global customers to further improve the Company’s ability to address the needs of global key accounts. This new or-ganizational structure enables even better management of major customer interfaces. Both the quality standards and the regional proximity remain in place, because the divisional structures will continue to provide production services for global customers.
• The technical organization was restructured. Constantia Flexibles expects synergy effects and the strength of its knowledge base in Europe to generate even greater customer benefits, especially due to the joint manage-ment of the Technical function and the Food Division, Europe region, the Company’s largest division.
• Both the Health, Safety, Security & Environment (HSSE) and the Sustainability areas were spun off from the Tech-nical function (in its original form) and placed under the CEO’s direct responsibility. The sustainability of our prod-ucts and production processes, the protection of our en-vironment, and the safety of our personnel and our cus-tomers as well as their end customers are fundamental to Constantia Flexibles. Integrating these departments into the CEO’s sphere of responsibility also enshrines these fundamentals in organizational terms.
• The same principle was central to the decision to create a separate Innovation & Marketing function within the CEO’s sphere of responsibility. It will coordinate and drive the innovation activities of the Constantia Flexibles Group to an even greater extent than before. Constantia Flexibles is committed to being its customers’ innovative partner, now and in the future. By establishing a separate func-tion, the Company is also investing in the future of its innovative solutions and products.
Development of organizational structure and human resources Aside from personnel development, in the second half of 2016 the Group focused on refining its organizational structure with the aim of setting the stage organizationally for Constantia Flexibles’s growth trajectory and interna-tionalization.
52.6%Europe20.4%America (USA/Mexico)7.5%Asia19.5%Middle East/Africa
Employees by region/country* (in %)
* incl. Afripack, Pemara, and Oai Hung
1
2
3
4
Total FTE10,180

20_Constantia Flexibles Management Report / Human Resources
• Organizationally, the fact that the Executive Director HR was appointed to the Executive Committee – the Senior Governance Forum – clearly demonstrates the signifi-cance of and focus on People and Personnel. Constantia Flexibles is thus putting in place the right framework for fostering the personal development of its employees so that they can meet the Company’s requirements to the greatest extent possible.
Human resources development • In the second half of 2016, employee development
activities were again focused on the design of a global learning platform. This new learning environment aims to enable communication between learners and instructors worldwide – at any time and at any place – and to pro-vide standardized content. It will create a centralized space that transcends the function of a mere training database and enables interactive employee development. Following a test phase using several pilot groups, the HR development tool will be rolled out incrementally at all locations in the first half of 2017.
• Based on the Group’s strategic corporate goals, in 2016 the Constantia Flexibles competency model was expand-ed by five competencies at the “professionals” level. The introduction of the expanded competency model was put into practice in special training sessions. The whole model, which now comprises 23 competencies, maps out the skills, attitudes, and characteristics that Constantia Flexibles employees should utilize in order to contribute optimally to the Company’s success. This approach is rooted in the Company’s three core competencies:
• Driving Customer Value • Fostering Collaboration • Passion for Results
These principles guide all activities associated with organizational and human resources development.
• Constantia Flexibles’s training program – the Training Tool-box – was redesigned for 2017. To support competency- based employee development, the selection of the training modules was fully aligned with the competency model to ensure that a separate training module was designed for each competency. Purely online training courses that our employees can access via WebEx or video conference will provide greater flexibility in 2017. International training partners will expand the organization of training sessions locally. In 2016, more than 350 employees from more than 15 countries participated globally in training sessions.
• The Constantia Flexibles On-Boarding Process was fur-ther streamlined and standardized. Worldwide, a uniform welcome package gives employees a homogeneous first impression of Constantia Flexibles as a Group. They are also given key documents by their local companies and get to know Constantia Flexibles’s values. The focus of this project, too, is on establishing a uniform process for all locations. The on-boarding packages have already been distributed to all locations and handed out to all new employees.
Development of the compensation systemsand the IT environment in Human ResourcesAdjustments to the short and long-term incentives for the top management and the sales organization were prepared and introduced to support both the organizational changes and the strategic alignment in connection with the Focus21 initiative.
Besides introducing a long-term management equity plan for select executives, we also adjusted the bonus structure for the top 200 executives. Starting with fiscal year 2017, the main focus will be on strengthening individual aspects of performance target achievement and switching the Key Performance Indicators (KPIs) from EBITDA and Trade Working Capital (TWC) to EBIT und Free Cash Flow (FCF).

Human Resources / Management Report Constantia Flexibles_21
Constantia Flexibles expects the introduction of harmonized compensation plans for sales personnel at the divisional level to make the Company even more attractive for its employees and to facilitate goal-driven management that is aligned with the strategic aims of its shareholders.
The systematic expansion of the IT system structure in HR based on SAP’s online Success Factors HR platform supports the global management of compensation and employee development systems and represents another step in the digitization of the HR environment at Constantia Flexibles.
OutlookAlso in 2017, our activities in Human Resources will contribute to the core elements of Constantia Flexibles’s HR strategy:
• Development of our employees at all levels;• Diversity and equal opportunities;• A value-driven performance culture; and• Ongoing development of a global corporate culture
The planned 2017 launch of Constantia University, which will include a Leadership and Sales Academy, is a signifi-cant step in the ongoing development of our employees for the benefit of our customers. The introduction of a grading system, the realignment of the compensation systems, and the expansion of the HR IT platforms all serve to further the ongoing and targeted development of Constantia Flexibles’s Human Resources.
Equal opportunities are as important to Constantia Flexibles’s Human Resources strategy as is employee development. People of various origins, cultures, religious affiliations, genders, and ages make up the Constantia Flexibles Group. This results in different mentalities, perspectives, competencies, and experiences — all of which contribute to our Company’s competitiveness in the long term.

22_Constantia Flexibles Management Report / Sustainability
6. Sustainability
We have consciously made responsibility for the environment an integral part of our entrepreneurial activity, based on the following principles:
• The need to be aware of and to minimize potential environmental risks in connection with the selection of production technologies;
• The need to utilize environmentally friendly commodities and input materials in our product portfolio;
• The need to use every opportunity to reduce air, soil, and water pollution as well as greenhouse gas emissions and waste through suitable measures; and
• The need to make maximum use of resource- and environmentally friendly technologies together with the continuous optimization of the materials used.
Continuous improvements in the consumption of raw materials – primarily aluminum, polymers, paper, varnishes, and inks – are a major concern for us. Given both the steady increase over time in the consumption of energy and the growing scarcity of water worldwide, measures aimed at optimizing the consumption of electricity, natural gas, and water are key to our success – including in economic terms.
We also continuously monitor not just the data on our consumption of energy and solvents, for example, but also our emissions data. Both the prevention and the disposal of waste are subject to constant monitoring. The Company has been measuring its direct and indirect emissions in accordance with the Greenhouse Gas Protocol since 2005.
According to a detailed analysis, the efforts not just of Constantia Flexibles as a Group but also of individual plants in the respective divisions show a steady improve-ment in the key performance indicators (KPIs) for the products generated. Further reductions have occurred despite the recent acquisitions and the resulting increase in some of the KPIs in recent fiscal years. The following charts show that we succeeded in achieving improvements of between 10% and 30% during the observation period.
Compared with 2005, total savings in energy consumption have surpassed 20% per output unit.
Annual energy consumption per output (MWh/per million m2)
200
160
120
80
40
2005 20092006 20102007 20112008 2012 2014 2015 20162013
Total energy consumption Power consumption Consumption of fossil fuels

Sustainability / Management Report Constantia Flexibles_23
We are particularly encouraged that the percentage of fossil fuels continues to decline – in spite of the acquisi-tions made. Aside from reducing the use of energy per output, in fiscal year 2016 we also succeeded in lowering the use of organic solvents by just over 23% year-on-year.
The outcome of both the direct and the indirect effects of these efforts to boost efficiency is reflected in the car-bon footprint of the Group. The goal of achieving a 40% reduction in total Scope 1 and 2 emissions (per output) by 2023 has not changed despite the acquisitions made. The individual (new) sites have been integrated into the calculations underlying the groupwide findings shown here. While this has caused an increase in the Scope 2 emissions due to growth in the use of electricity, it is ap-parent that the downward trend per output is continuing or that the output remains unchanged. The following chart shows the development of individual direct and indirect emissions.
100
120
80
60
2005 20092006 20102007 20112008 2012 2014 201620152013
Development of energy consumption per output (base year 2005 = 100%) (in %)
Total energy consumption Power consumption Consumption of fossil fuels
Change in annual solvent consumption per output(base year 2005 = 100 %) (in %)
120
80
40
02005 2016
23.7%Total reduction
Group

In addition to the measurements of the direct and indirect emissions that are generated by the activities of the Constantia Flexibles Group, the table also shows the indirect emissions (Scope 3) that are generated by the upstream value chains. This method has been in place groupwide since 2014. In order to bring about improvements in this respect, we will intensify our focus
As far as the publication of the aforementioned consump-tion and emissions data is concerned, Constantia Flexibles has decided to stick to its open communications strategy. CDP2 gave Constantia Flexibles a high climate score rat-ing in fiscal year 2016 for its highly transparent climate reporting as well as for its performance in connection with
particularly on those raw materials that have a substantial ecological impact.
Naturally, this has led to initiatives such as the Aluminium Stewardship Initiative1, which aims to improve the perfor-mance of raw materials at all levels of sustainability.
climate change activities. As a result, Constantia Flexibles is among the top 12 percent of the companies that CDP evaluated. This reflects our emissions reduction strategy, which goes hand in hand with our commitment to the highest standards of transparency in reporting.
Change in annual CO2emissions (Base year 2005 = 100%) (in %)
Total CO2 emissions per output Scope 1 emissions per output
120
100
80
60
40
2005 20092006 20102007 20112008 2012 2013 201620152014
Scope 2 emissions per annual sales
Total CO2 emissions per annual sales Scope 2 emissions per output Scope 1 emissions per annual sales
Overview of emissions – Constantia Flexibles
Unitt CO2-Equiv.
Scope 1
2015160,981.73
2015177,158.69
20151,684,835.03
2016161,843.52
2016201,701.93
20161,709,078.86
Change0.54%
Change13.85%
Change1.44%
Scope 2 Scope 3
1 www.aluminium-stewardship.org2 CDP (Carbon Disclosure Project: www.cdp.net)
24_Constantia Flexibles Management Report / Sustainability

Report on Risks and Opportunities / Management Report Constantia Flexibles_25
7. Report on Risks and Opportunities
A systematic risk management system that serves toidentify and assess risks and opportunities for Constantia Flexibles and to manage them in ways that keep them in balance is integral to the Company’s business activities.
Constantia Flexibles’s risk management entails identifying strategic and going-concern risks and analyzing those groupwide factors that are necessary for the Group’ssuccess in the long term.
Internal management systems and communications channels ensure that the risk management system is effective and efficient in handling individual identified risks. The Group’s aggregate risk position is extrapolated and assessed based on material individual risks. It has not changed fundamentally since the previous year. From today’s vantage point, the Group as a going concern is not at risk, nor do we see any developments that might pose a threat to it as a going concern in the future.
Internal Group Audit is part of the internal monitoring system which, in turn, is part of the three-lines-of-defense model. It supports both the Management and the Super-visory Boards of Constantia Flexibles by ensuring the ap-propriate management of risks and opportunities. The annual internal audit program ensures the regular analysis and assessment of the risk profiles of the Group’s opera-tional workflows and organizational structure. Moreover, Management is also free to call upon Internal Group Audit as necessary in connection with sudden events. Regular audits of all business units based on risk profiles safeguard the Group’s assets and support its ability to create value.
7.1 Internal Control SystemThe Constantia Flexibles Group has incrementally revised and broadened its internal control system in order to facili-tate early detection, monitoring, and proactive prevention of risks. This system is based on the standards of the internationally proven Internal Control – Integrated Frame-work (COSO I) of the Committee of Sponsoring Organiza-tions of the Treadway Commission for internal control systems. It links the internal control system to the risk management system in line with the Enterprise Risk Management – Integrated Framework (COSO II) for groupwide risk management systems.
These are the main characteristics of the internal control and risk management system relevant to the financial reporting process (disclosures pursuant to Section 243a (2) Austrian Commercial Code [Unternehmensgesetz buch (UGB)]:
Management is responsible for establishing a suitable internal control and risk management system relevant to the financial reporting process. To this end, Management has adopted regulations and policies that must be applied groupwide with respect to both material business risks and the financial reporting process.
The entire process model is subject to strict rules and regulations that manage the risks associated with the respective processes and define control activities. Among other things, these measures and rules include segregation of functions, signature authority matrices, collective signing authority for payments that is restricted to a small number of individuals, and IT-supported checks based on the software in use (e.g., SAP or Microsoft Dynamics AX). Management is kept informed of all relevant issues by means of a standardized, groupwide financial reporting system as well as ad hoc reporting on significant events. Internal Group Audit monitors compliance with the internal controls through its audits based on the internal audit plan that is coordinated with Group Management. The areas to be audited are selected such that business units with significant risk profiles are regularly audited. Any weak-nesses identified in the audits are analyzed in detail and improvements are developed; their implementation is monitored and assured. The internal control system is evaluated on a continuous basis to ensure its relevance and adapted as necessary. The audit findings are reported to local management, division heads, and Group Management.

26_Constantia Flexibles Management Report / Report on Risks and Opportunities
In addition to the audits by Internal Group Audit, a Control Self-Assessment (CSA) has also been introduced in the Group to enable self-assessments of the internal control and risk management system. The CSA covers all of the Group’s production companies and is carried out by the local administrative heads in coordination with local man-agement. Internal Group Audit uses random checks to re-view the CSA findings. Steps aimed at counteracting iden-tified weaknesses are coordinated, and their implementa-tion is tracked.
Material risks and uncertainties The international business activities of the Constantia Flexibles Group expose its assets, liabilities, and forecast-ed transactions to risks and opportunities from changes in foreign exchange rates, interest rates, and stock market prices.
Groupwide management of these risks is governed by policies and processes that have not been modified since the close of the previous year. Financial risk management serves to limit and manage market risks through ongoing operational and financial activities. Derivative financial instruments are used solely as hedging instruments.
7.2 Business Risks
Natural hazard risksPreventive structural, technical, and organizational measures (e.g., protection against flood and fire as well as occupa-tional accidents) are taken on an ongoing basis to protect against natural hazard risks and are refined incrementally for individual plants as necessary. All such actions are monitored and tested as to their viability. Furthermore, the Group’s insurance management is controlled at the Group level and adapted as necessary on an ongoing basis.
Regulatory risks The increase in legal requirements regarding packaging materials and production processes is a challenge to the flexible packaging industry, including with respect to con-tinuously improving testing methods. Constantia Flexibles responds to changing parameters through continuous research and development, close coordination with inter-national research institutes, ongoing analyses of the latest
scientific findings, as well as continual assessments of legal initiatives and requirements at the national and international level. As a member of various industry committees, the Group also plays an active role in the development of the flexible packaging industry.
Research and development risksResearch and development of products and processes are key to our success in a globally competitive environment. However, there is always the risk that R&D activities may not be timely or geared to market requirements. Constantia Flexibles counteracts R&D risks by commissioning recog-nized experts, by entering into partnerships, and especially by maintaining close proximity to both markets and cus-tomers. The rapid increase in the number of patent appli-cations aimed at safeguarding intangible assets and know-how also constitutes a risk. Patents may limit re-search and development activities. As a result, Constantia Flexibles actively monitors the status of its own patents and its own R&D work so that it can decide whether it needs to take action and whether its work must be protected.
Production risksThe production sites of the Constantia Flexibles Group are exposed to the risk of operational interruptions in the value chain due to machine failures or potential product defects. The Group is expanding its emergency and crisis management to handle business interruption risks and uses regular maintenance and employee training to coun-teract machine failure risk. It also invests in new state-of-the-art machinery in line with internal policies and proce-dures. Business interruptions are also covered by insurance.
Production processes are continuously monitored and enhanced to reduce the risk of product defects. Risks are mitigated even further through the implementation of ISO 9001 compliant procedures and processes as well as through compliance with Good Manufacturing Practices (GMP). The Group’s production processes are also subject to frequent audits and reviews by quality management, customers, as well as external audit and certification companies.

Report on Risks and Opportunities / Management Report Constantia Flexibles_27
Information processing risksTo ensure adequate information security and the availability of the Group’s information technology, groupwide processes require all Group companies to perform basic IT controls with respect to IT security, IT operations, and IT backup. Significant IT systems are operated in IT shared services centers with redundant data centers. Moreover, Internal Group Audit considers IT to be an important element and thus performs regular IT audits in connection with the Group’s annual internal audit program.
The employees of both Constantia Flexibles and our business partners entrust their data to us daily. It would be impossible to protect this data absent the effective implementation of data protection and IT security policies. Data loss can lead to large financial losses as well as to reputational damage. The IT shared services centers work hard every day to protect each of us from any loss of data. Personnel risksSuccession planning that is adjusted on a regular basis is in place for the most important corporate areas. Deputies have been appointed for all key functions. Targeted talent development in all units ensures that our know-how is continuously enhanced. The Group’s Human Resources department maintains a specialized employee training and development team. This specialized team helps to identify young talent in the Group and supports young talent, sales staff, and executives through professional development programs.
Procurement risksMaster agreements on raw materials such as aluminum, plastic foils, paper, and chemical products are in place to minimize procurement risks. This serves to avoid delivery bottlenecks as far as possible, given the ongoing need to license new materials, optimize the supplier portfolio, en-gage in R&D, and perform market research. Developments in the procurement and sales markets are regularly dis-cussed across all divisions, and actions are initiated as necessary.
Sales risksSales risks are integral to ordinary business activities. Such risks can rise significantly during an economic crisis. Our strategically broad range of products as well as our excellent market and production know-how ensure that we remain independent in our markets. Our ten largest customers only account for about 30.0% of Group sales. This means that the Constantia Flexibles Group supplies a wide range of customers worldwide. Master agreements with key customers support our policy of minimizing sales risks. We also expand our product range and markets into attractive niches where innovative solutions and premium quality are a must. The continued high volatility of com-modity and energy prices often leads to difficult negotia-tions and pricing discussions with customers. Constantia Flexibles counteracts this trend by focusing on innovative products, technologies, and manufacturing processes that are tailored to customers’ needs and by entering into long-term master agreements. Most of our products are delivered to customers in relatively non-cyclical sectors such as the food, pet food, beverage, and pharmaceutical industries.
Legal, antitrust, and competition law risksWe monitor all applicable legal requirements and develop-ments, because the activities of Constantia Flexibles take place in different jurisdictions. A comprehensive quality assurance program minimizes product liability risks. Product liability insurance and contractual arrangements counteract any remaining product liability risks.
Constantia Flexibles is also committed to fair competition. All employees of the Constantia Flexibles Group must comply with fair competition principles and rules pursuant to EU requirements as well as local antitrust and compe-tition laws. Constantia Flexibles has adopted appropriate policies regarding antitrust and competition laws to this end and monitors compliance with them. Employees are also regularly trained with respect to the relevant Group regulations and policies.

M&A and integration risksMerger & Acquisition activities are integral to the Constantia Flexibles Group’s growth strategy. They require significant investments and pose different risks. Constantia Flexibles carries out a structured due diligence process with the help of internal and external experts prior to every acquisi-tion. The Group’s post-merger integration process begins as soon as the decision to pursue an acquisition has been made. Acquisitions in new markets also require focusing on cultural differences; the Group’s M&A process takes this into account as necessary. Constantia Flexibles’s inte-gration process follows a defined procedure that is based on standardized tools and clearly delineated responsibilities.
Country risksConstantia Flexibles operates and maintains production sites in over 20 countries. Requirements, business envi-ronments, cultural norms, and consumption trends can differ substantially in individual countries that form a part of the Company’s portfolio at present or may do so in the future. The business prospects, earnings, and financial performance of the Constantia Flexibles Group could be materially adversely affected if economic and political country risks were to materialize. Constantia Flexibles proactively monitors all countries and associated regions in which it operates. Furthermore, local management teams are put in place in all countries to ensure proximity to each country’s regulatory environment. An internatio n-ally renowned service provider has been commissioned to protect our employees. It consults on medical and security issues and maintains a 24/7 emergency service for all employees.
Financial risksForeign exchange risk: The Group enters into forward currency transactions to minimize the foreign exchange risk associated with cash flows from operating and finan-cing activities. Foreign exchange risks are managed and measured using the value-at-risk approach.
The EUR/USD risk could have a currency translation effect of €7.2 million on the consolidated income statement as of December 31, 2016. Given the uncertainty and high volatility of the ZAR, the risk from the EUR/ZAR exchange rate is €2.3 million.
The risk that all 50 currency pairs will experience a nega-tive development simultaneously amounts to €15.1 million. Current foreign currency hedges will mature in 2019.
Liquidity risk: Liquidity risk denotes the risk of being unable to raise funds at all times in order to settle financial liabilities. Hence the Group ensures that sufficient liquidity is available and/or that the necessary funding is secured through ad-equate credit facilities. Committed credit facilities of €40.0 million are available to the Constantia Flexibles Group as of December 31, 2016, to minimize liquidity risk, all of which were undrawn as of the reporting date. The Group also has access to €110.0 million from Constantia Flexibles Holding GmbH which, as the ultimate parent, is not consolidated.
Interest rate risk: The average interest rate on borrowings is 4.06%. Significant funding includes a listed €129.1 million bond (ISIN AT0000A0V7Q0) and a total of €216.6 million in loans from Constantia Flexibles Holding GmbH.
Sensitivity analysis: A 1.0% increase in eurozone interest rates would incur an additional interest expense of €0.6 million for floating rate financial liabilities. A 1.0% increase in USD interest rates would increase the net interest in-come from floating rate financial instruments denominated in USD by €1.7 million. If the interest rates in all currency areas were to rise by 1.0%, the interest expense of the floating rate financial liabilities would rise by €2.5 million.
28_Constantia Flexibles Management Report / Report on Risks and Opportunities

Interest rate risks are managed at the level of Constantia Flexibles Holding GmbH which, as the ultimate parent, is not consolidated. If Constantia Flexibles Holding GmbH were included, the effect of a simultaneous increase in interest rates by 1.0% in all currency areas would be €2.7 million.
7.3 Business OpportunitiesBoth internal and external growth in recent years have created many opportunities for the Group on the whole as well as with respect to the optimization and diversity of our production sites. Constantia Flexibles will increasingly exploit these opportunities by creating centers of excel-lence – not just at the production level but also at the administrative level. Establishing these shared services centers will enable all European Group companies to benefit from the cumulated expertise of shared services experts in finance, controlling, and IT from the start.
The large number of acquisitions in recent years has given Constantia Flexibles a wealth of experience with respect to the implementation process. This increases the chances that the integration of future acquisitions into the Constantia Flexibles Group will be even faster and even more success-ful. It also makes us more attractive to successful com-panies interested in being acquired and increases the likelihood that they will join the Group.
Opportunities from business growth driversThe development of new middle classes in emerging countries with rising living standards and the associated increase in the demand for our solutions – especially in the beverage, pet food, food, and pharmaceuticals indus-tries – offers new opportunities for the Constantia Flexibles Group. Additional opportunities arise from demographic trends such as smaller households and longer life expec-tancy, and hence the steadily rising demand for even greater product variety and quality.
Strategic business opportunitiesThe fact that individual plants focus on certain product lines under the dedicated plant concept offers certain opportunities. At the same time, the Group is using inno-vative technologies and production processes to diversify into strategic markets and products. This will offer excel-lent opportunities in the long term, particularly in the growth regions of Asia, Middle East/North Africa, Latin America, as well as Central and Eastern Europe. The ex-pansion of the portfolio and work on common specifica-tions with suppliers will create yet more opportunities.
Research and Development / Management Report Constantia Flexibles_29
8. Research and Development
Awards confirm our spirit of innovationBesides special achievements in social commitment and outstanding new initiatives, the internal Constantia Global Awards also recognize the Company’s best innovations. In April 2016, the Innovation Award was presented in three categories: “internal developments” (where two winners were honored), “increasing efficiency,” and “customer-specific innovations.”
The two internal development awards both went to the Food Division, specifically, the “CompresSeal” technology of the Competence Center for Polymer Films and Film Laminates, and the “Waxfree TopFold” technology of the Competence Center for Aluminum Foil and Foil Laminates. CompresSeal solves a well-known problem in the industry: It makes it possible for the very first time to process poly-ethylene (PE) laminates on our customers’ packaging

systems regardless of the ambient conditions. The solution is sustainable, too, because it enables polyethylene savings of up to 30%. Waxfree TopFold makes it possible to pro-duce laminates that have standard good folding character-istics, e.g., butter wrappers, without using wax. This con-tributes substantially to the reduction of mineral oils in foodstuffs. Shortly after the internal awards presentation, both of these developments were also recognized exter-nally: Major confectionery industry customers refitted their processes to the Waxfree TopFold product to a significant extent and the CompresSeal successfully passed several customer tests.
In addition to the two internal awards, the Food Division also won Alufoil Trophies for two other new developments. The Alufoil Trophy for Consumer Convenience went to the foil tray and lid system named “Ofen-Fleischkäs – ready for baking@home.” This system contains precooked meat dishes that can be cooked directly in the packaging. The second Alufoil Trophy was awarded in the Product Safety category for the “Sustainer” technology, which is a packag-ing solution for the pet food segment. It concerns the spe-cial development of containers that are free of Bisphenol A (BPA) but possess the same outstanding characteristics of the applications used to date such as high barrier, heat resistance, and sterilizability.
Aside from supporting the development of the award- winning aluminum-based products, the Competence Center for Aluminum Foil and Foil Laminates also produced an idea that won a special prize in the Global Awards cate-gory. This concerns a special foil for packaging seasonal chocolates such as Easter eggs. It simplifies opening such confections in a revolutionary way and is likely to cause quite a stir in the future. The success stories of the Com-petence Center for Aluminum Foil and Foil Laminates are also rooted in continuous investments in analytic devices. For instance, a scanning electron microscope that is equipped with energy-dispersive X-ray spectroscopy (SEM-EDS) was put into operation this year. This micro-scope can magnify surfaces up to 130,000 times, and the attached spectroscopy unit provides information on the sample’s elemental composition.
The Competence Center for Polymer Films and Film Lami-nates achieved a number of successes right after it was established in the fall of 2015. The Center now provides expertise in plastics through product analyses, materials recommendations, and laboratory prototype production not just to Food and Pharma Division sites in Europe, but also to our new Group locations in India, Mexico, and Africa as well as within the Labels Division. In particular, this con-cerns the standardization of our PE sealing film formulas and the development of new approaches for aluminum- free barrier laminates. The pilot prototypes of our own developments – such as CompresSeal, recycling-friendly laminates made from pure PE, and laminates that have the appearance of textiles – were also produced to support sales and marketing.
Both a new PE blown-film testing system and the Group’s first blown-film production facility in Europe have been commissioned. In the spring of 2017, the two five-layer machines for films with a net width of 800 mm and 1,600 mm will be started up at the Hueck site so that we can pursue new developments more efficiently, produce test quantities up to final customer approval, and manu-facture some of the PE that we currently buy in Europe ourselves. The new “micro-embossing” production techno-logy for plastic films that is required for the CompresSeal innovation will also be realized in-house starting in mid-2017 once the refitting of an existent embossing calendar machine has been completed. These measures will further boost the internal value chain and efficiently protect the acquired know-how.
The two awards that were presented for Constantia Haendler & Natermann’s Coca-Cola bow label were a highlight in the Labels Division. This exciting development won both the Innovation Award for customer-specific developments and the DuPont Silver Award. The bow label creates an entirely new and unique interactive user experience. The ability to change the flat label into a bow using a simple flap gives the soft drink a festive appearance and a surprising aspect.
30_Constantia Flexibles Management Report / Research and Development

Significant events after the end of the reporting periodTalks concerning the potential sale of the Labels Division took place in the first quarter of 2017. A substantiation of the sales process is currently still not foreseeable, which is why it is not possible to provide any details about the financial dimension of a potential sale. There is currently a project to support a potential transaction, as well as a structuring of the planned sales process. A sale could be realized within the next 12 months – as of the publication date of these consolidated accounts. The business intend-ed for a potential sale achieved sales of 604.7 million euro and EBITDA of 100.8 million euro in 2016.
On March 1, 2017, the Constantia Flexibles Group agreed to acquire TR Alucap S.r.l., Italy’s leading dairy lidding man-ufacturer. The transaction was made with immediate effect.TR Alucap has over 50 employees and is domiciled in Borgo Valsugana near Trento, the region that is home to the largest number of yogurt manufacturers in Italy. Until the acquisition, the plant was owned by two private equity firms and had annual sales of just under €20.0 million. The company specializes in manufacturing aluminum die-cut lids and plastic films for local dairies and inter-national food manufacturers.
9. Events after the Reporting Period
Another innovation developed by Spear concerns the field of recycling. SpearRC® is a pressure-sensitive label that is compatible with the PET recycling process and solves the problem of contamination from conventional pressure- sensitive labels in the recycling process with minimal add-ed costs. The Association of Plastic Recyclers recognized this technology, too, which was developed in collaboration with the Coca-Cola Company, as one of the top 5 innova-tions in 2016.
The Center for Research and Development that Verstraete IML launched in 2015 was expanded yet again to help promote new development work in collaboration with customers. Among other things, it is now much easier to predict how in-mold labels (IML) behave during the down-stream process in complex environments and applications. Above all, this generates innovations in the fields of steri-lizable, machine-washable packaging and highly resistant packaging.
Constantia Flexibles has also turned its attention to a joint project with Thinfilm in order to develop smart packaging solutions for the beverage market. This collaboration aims to deliver pressure-sensitive labels using OpenSenseTM
technology, which will enable consumers to check whether the original seal is still in place or whether it has been broken. This technology can easily be read using a smart-phone’s Near Field Communication (NFC) function.
The Pharma Division has won several external awards. The Alufoil Trophy for Resource Efficiency went to the “CONSTANTIA Blister Eco,” which consists of paper made from renewable raw materials that has been laminated using thin aluminum foil. The resulting material is 23% lighter and has an aluminum content of only 40% – a significant reduction compared to conventional materials, where the aluminum content is 90%. The Innovation Award for increasing efficiency went to the Pharma Division’s Constantia Tobepal site for the development of “cylinder engraving with a 140° diamond.”
Expenditures for research and development during the reporting period were €11.2 million (2015: €9.6 million). Of this amount, €8.8 million was recognized in the income statement. €2.4 million was capitalized in the statement of financial position for the reporting period. At the close of fiscal year 2016, R&D had 107 employees.
Events after the Reporting Period / Outlook for 2016 / Management Report Constantia Flexibles_31

Market outlookConstantia Flexibles is active in the flexible packagingand labels markets, which are largely independent ofcyclical fluctuations and have been able to record above-average growth in recent years. The largest long-term growth factors arise from global megatrends, which generally promote the substitution of rigid packaging through flexible packaging solutions.
The packaging industry is expected to experience further growth in 2017, with strong growth rates expected in the Emerging Markets:
• Europe: 1–2%• North America: 3–4%• South America 3–5%• India: 10–12%• Africa: 4–6%• Southeast Asia: 6–8%Source: PCI, internal management forecasts
Company outlook2017 will see us proceed with our integration of the recent pharmaceutical packaging acquisitions Oai Hung in Vietnam and Constantia San Prospero in Italy. Constantia San Prospero is an excellent addition to our satellite produc-tion concept, while Oai Hung gives us exposure to the fast-growing Southeast Asian region. In our Food division we also expect the positive turnaround of the acquired Afripack Group in South Africa to continue.
Targeted acquisitions will continue to represent an im-portant element in the global expansion strategy of Constantia Flexibles.
The Management of Constantia FlexiblesVienna, March 31, 2017
Alexander BaumgartnerChief Executive Officer
Stephan KühneChief Financial Officer
10. Outlook for 2017
32_Constantia Flexibles Management Report / Outlook for 2017

IFRSCONSOLIDATED
FINANCIALSTATEMENTS
2016

34_Constantia Flexibles xxxxxxxxx
AS OF DECEMBER 31, 2016Assets (in € thousand) Note 12/31/2016 12/31/2015
Goodwill .......................................................................................................................................................................................................................................................................................................................................................I1 .............................................................................342,793 .............................................................................280,553 Intangible assets .........................................................................................................................................................................................................................................................................................................I1 .............................................................................127,096 .............................................................................124,038 Tangible assets .................................................................................................................................................................................................................................................................................................................I1 .............................................................................784,306 .............................................................................758,349 Investments in associates ........................................................................................................................................................................................................................................................I2 .............................................................................................1,232 .......................................................................................................................0 Other non-current and financial assets .................................................................................................................................................................................I3 .....................................................................................42,151 .............................................................................101,676 Deferred tax assets ......................................................................................................................................................................................................................................................................................J8 .............................................................................................7,423 .............................................................................................9,193Non-current assets .......................................................................................................................................................................................................................................................................................................................................................................................1,305,000 ....................................................................1,273,809 Inventories...........................................................................................................................................................................................................................................................................................................................................I4 .............................................................................275,846 .............................................................................253,199 Trade receivables ......................................................................................................................................................................................................................................................................................................I5 .............................................................................248,637 .............................................................................204,605 Tax receivables....................................................................................................................................................................................................................................................................................................................................................................................................................10,280 .............................................................................................8,376 Other receivables .....................................................................................................................................................................................................................................................................................................I6 .....................................................................................47,008 .....................................................................................46,226 Cash and cash equivalents ...........................................................................................................................................................................................................................................................................................................................................122,622 .....................................................................................61,133Current assets .............................................................................................................................................................................................................................................................................................................................................................................................................................704,394 ..............................................................................573,539 Total assets ...................................................................................................................................................................................................................................................................................................................................................................................................................................2,009,394 ....................................................................1,847,348
Equity and liabilities (in € thousand) Note 12/31/2016 12/31/2015
Share capital .........................................................................................................................................................................................................................................................................................................................................................................................................................................................35 ...............................................................................................................35 Reserves ............................................................................................................................................................................................................................................................................................................................................................................................................................................792,032 .............................................................................402,376Equity attributable to shareholders ..................................................................................................................................................................................................................................................................................................792,067 ..............................................................................402,411 Non-controlling interests ......................................................................................................................................................................................................................................................................................................................................................................1,018 .....................................................................................(1,615)Total equity.......................................................................................................................................................................................................................................................................................................................................................I7 ..............................................................................793,085 ..............................................................................400,796 Provisions ..............................................................................................................................................................................................................................................................................................................................................I8 .....................................................................................62,961 .....................................................................................63,722 Interest-bearing financial liabilities .........................................................................................................................................................................................................I9 .............................................................................228,437 .............................................................................727,047 Other non-current liabilities................................................................................................................................................................................................................................................I9 .............................................................................139,446 .....................................................................................91,409 Deferred tax liabilities ..........................................................................................................................................................................................................................................................................J8 .....................................................................................73,181 .....................................................................................65,687 Non-current liabilities ...................................................................................................................................................................................................................................................................................................................................................................................504,025 ..............................................................................947,864 Provisions ..............................................................................................................................................................................................................................................................................................................................................I8 .....................................................................................58,302 .....................................................................................59,043 Interest-bearing financial liabilities .........................................................................................................................................................................................................I9 .............................................................................203,891 .....................................................................................65,615 Trade payables ....................................................................................................................................................................................................................................................................................................................I9 .............................................................................300,849 .............................................................................237,378 Tax liabilities ..................................................................................................................................................................................................................................................................................................................................I9 .....................................................................................43,594 .....................................................................................17,426 Other current liabilities .................................................................................................................................................................................................................................................I9, I10 .............................................................................105,648 .............................................................................119,225Current liabilities ...............................................................................................................................................................................................................................................................................................................................................................................................................712,284 ..............................................................................498,688 Total equity and liabilities ..................................................................................................................................................................................................................................................................................................................................................2,009,394 ....................................................................1,847,348
Consolidated Balance Sheet
34_Constantia Flexibles IFRS Consolidated Financial Statements 2016 / Consolidated Balance Sheet

xxxxxxxxxxxxxx Constantia Flexibles_35
FOR FISCAL YEAR 2016(in € thousand) Note 2016 2015
Sales ......................................................................................................................................................................................................................................................................................................................................................................................J1 ....................................................................2,062,130 ....................................................................1,898,661 Cost of sales .................................................................................................................................................................................................................................................................................................................................................................................................... (1,705,900) ...........................................................(1,570,373)Gross profit ..............................................................................................................................................................................................................................................................................................................................................................................................................................................356,229 ..............................................................................328,287 Selling expenses ..........................................................................................................................................................................................................................................................................................................................................................................................(107,741) .....................................................................(101,472) Research and development expenses ......................................................................................................................................................................................................................................................................................(8,817) .....................................................................................(7,139) Administration expenses ...................................................................................................................................................................................................................................................................................................................................................... (98,347) .....................................................................(105,082) Other operating income ...............................................................................................................................................................................................................................................................J2 .....................................................................................28,383 .....................................................................................11,325 Other operating expenses ...............................................................................................................................................................................................................................................J5 ....................................................................................(4,873) .....................................................................................(3,488)Earnings before interest and tax (EBIT) .......................................................................................................................................................................................................................................................................164,834 ..............................................................................122,431 Interest income ..........................................................................................................................................................................................................................................................................................................................................................................................................................1,596 .............................................................................................3,933 Interest expense .................................................................................................................................................................................................................................................................................................................................................................................................. (35,343) .............................................................................(40,250) Other financial income and expense....................................................................................................................................................................................................................................................................................... (13,594) .............................................................................(11,422)Net financial income and expense .........................................................................................................................................................................................................J6 .............................................................................(47,341) .............................................................................(47,739) Income from associates .............................................................................................................................................................................................................................................................................................................................................................................................68 .......................................................................................................................0Earnings before tax (EBT) ........................................................................................................................................................................................................................................................................................................................................................117,561 ......................................................................................74,692 Current taxes........................................................................................................................................................................................................................................................................................................................J7 ............................................................................ (54,919) .............................................................................(26,146) Deferred taxes ................................................................................................................................................................................................................................................................................................................J8 ....................................................................................(5,250) .....................................................................................10,863Income tax..................................................................................................................................................................................................................................................................................................................................................................................................................................................(60,170) .............................................................................(15,284)Net income after tax ..................................................................................................................................................................................................................................................................................................................................................................................................57,391 ......................................................................................59,409 Thereof attributable to: Equity holders of the parent..............................................................................................................................................................................................................................................................................................................................................48,496 .....................................................................................50,203 Non-controlling interests ......................................................................................................................................................................................................................................................................................................................................................................8,895 .............................................................................................9,206
As a company with limited liability according to Austrian law, Constantia Flexibles Group GmbH did not issue any shares. Consequently no earnings per sharedisclosures, as required by IAS 33 ‘Earnings per Share’ have been presented.
Consolidated Income Statement
Consolidated Income Statement / IFRS Consolidated Financial Statements 2016 Constantia Flexibles_35

36_Constantia Flexibles xxxxxxxxx
Consolidated Statementof Comprehensive Income
FOR FISCAL YEAR 2016(in € thousand) Note 2016 2015
Net income after tax ..................................................................................................................................................................................................................................................................................................................................................................................................57,391 ......................................................................................59,409 Items that will be reclassified subsequently to profit or loss under given circumstances ....................................................................................................................................................................................................................................................24,564 ......................................................................................18,079 Effective portion of changes in fair value of cash flow hedges .....................................................L .............................................................................................4,631 .......................................................................................................721 Gain/(loss) through changes in fair value ...............................................................................................................................................................................................................................................................3,631 .....................................................................................(5,287) Transfer to profit and loss account .....................................................................................................................................................................................................................................................................................................1,001 .............................................................................................6,008 Currency translation differences .....................................................................................................................................................................................................................................................................................................................21,506 .....................................................................................17,275 Changes in exchange differences recognized on translation of foreign subsidiaries ..................................................................................................................................................................................................................................................................................................13,079 .....................................................................................17,275 Transfer to profit and loss account .....................................................................................................................................................................................................................................................................................................8,427 .......................................................................................................................0Apportioned deferred taxes ...................................................................................................................................................................................................................................................................................................................................................................(1,573) ...............................................................................................................83Items that will not be reclassified to profit or loss ................................................................................................................................................................................................................(1,489) ..............................................................................................1,466 Change in employee benefits reserve .......................................................................................................................................................................................I8 ..............................................................................................................................................................................................................................................................
Actuarial gains/(losses)......................................................................................................................................................................................................................................................................................................................................................(2,745) .............................................................................................1,917 Apportioned deferred taxes ..........................................................................................................................................................................................................................................................................................................................................1,256 ...............................................................................................(452)Other comprehensive income for the period..................................................................................................................................................................................................................................................23,075 ......................................................................................19,544Total comprehensive income for the period .......................................................................................................................................................................................................................................................80,466 ......................................................................................78,953Thereof attributable to: Equity holders of the parent..............................................................................................................................................................................................................................................................................................................................................69,880 .....................................................................................70,404 Non-controlling interests ..............................................................................................................................................................................................................................................................................................................................................................10,586 .............................................................................................8,548
36_Constantia Flexibles IFRS Consolidated Financial Statements 2016 / Consolidated Statement of Comprehensive Income

xxxxxxxxxxxxxx Constantia Flexibles_37
Consolidated Cash Flow Statement
FOR FISCAL YEAR 2016(in € thousand) Note 2016 2015
Earnings before tax (EBT) ........................................................................................................................................................................................................................................................................................................................................................117,561 ......................................................................................74,692+/(–) Net interest .................................................................................................................................................................................................................................................................................................................................................................................................................33,747 .....................................................................................36,317 +/(–) Profit or loss from associates..................................................................................................................................................................................................................................................................................................................................(68) .......................................................................................................................0+/(–) Depreciation and amortization/(reversal) of tangible and intangible assets ........................................................................................................................................................................................................................................................J4 .............................................................................139,849 .............................................................................123,088 +/(–) Gain/(loss) upon disposal of tangible and intangible assets ............................................................................................................................................................................................................................................................................................................................................................(7,733) .............................................................................................1,266+/(–) Other non-cash (income)/expenses....................................................................................................................................................................................................................................................................................2,655 .....................................................................................14,171Cashflow from the result ...............................................................................................................................................................................................................................................................................................................................................................286,011 ..............................................................................249,535+/(–) Inventory ........................................................................................................................................................................................................................................................................................................................................................................................................................................1,052 .............................................................................(19,727)+/(–) Trade receivables ......................................................................................................................................................................................................................................................................................................................................................................... (16,638) .....................................................................................21,417 +/(–) Trade payables ...............................................................................................................................................................................................................................................................................................................................................................................................35,108 .....................................................................................(9,188)+/(–) Other receivables ................................................................................................................................................................................................................................................................................................................................................................................(6,225) .............................................................................................3,196+/(–) Provisions .........................................................................................................................................................................................................................................................................................................................................................................................................................(9,226) .............................................................................................2,564+/(–) Other liabilities ........................................................................................................................................................................................................................................................................................................................................................................................................4,143 .....................................................................................(2,621)(–) Tax payments .............................................................................................................................................................................................................................................................................................................................................................................................. (35,094) .............................................................................(28,985)+ Interest received ..............................................................................................................................................................................................................................................................................................................................................................................................1,521 .......................................................................................................977 (–) Interest paid ..................................................................................................................................................................................................................................................................................................................................................................................................... (24,807) .............................................................................(33,469)Cash flow from operating activities..................................................................................................................................................................................................................................................................................................235,847 ..............................................................................183,699 + Sales of tangible and intangible assets ....................................................................................................................................................................................................................................................................2,696 .............................................................................................1,534(–) Investments in tangible and intangible assets.........................................................................................................................................................................................................(109,043) .....................................................................(105,294)+ Disposal of subsidiaries, less cash transferred .....................................................................................................................K .....................................................................................40,647 .......................................................................................................................0(–) Acquisition of subsidiaries, less cash transferred ........................................................................................................K ............................................................................ (44,256) .......................................................................................................................0+/(–) Proceeds/(payments) other financial investments .................................................................................................K ....................................................................................(8,218) .............................................................................(65,663)Cash flow from investing activities ............................................................................................................................................................................................................................................................................................(118,173) ......................................................................(169,423)+ Increase of financial liabilities................................................................................................................................................................................................................................................................................................................89,284 .............................................................................595,260(–) Redemption of financial liabilities ..................................................................................................................................................................................................................................................................................(71,956) .....................................................................(390,433)(–) Repayments hybrid capital ...............................................................................................................................................................................................................................I7 ......................................................................................................................0 .....................................................................(150,000)(–) Payments to non-controlling interests .................................................................................................................................................................I7 ....................................................................................(7,684) .....................................................................................(4,247)(–) Dividends paid to company owners ................................................................................................................................................................................I7 ............................................................................ (61,974) .......................................................................................................................0(–) Dividends paid to hybrid capital holders ........................................................................................................................................................I7 ......................................................................................................................0 .....................................................................................(8,651)(–) Dividends paid to non-controlling interests .......................................................................................................................................I7 ....................................................................................(5,577) .....................................................................................(9,691)Cash flow from financing activities ...................................................................................................................................................................................................................................................................................................(57,907) ......................................................................................32,238 Change in cash and cash equivalents due toexchange rate differences ....................................................................................................................................................................................................................................................................................................................................................................................1,723 .............................................................................................1,504Change in cash and cash equivalents .........................................................................................................................................................................................................................................................................................61,489 ......................................................................................48,019 Cash and cash equivalents at the beginning of the period ...............................................................................................................................................................................................61,133 .....................................................................................13,114Cash and cash equivalents at the end of the period .............................................................................................................................................................................................122,622 ......................................................................................61,133
Consolidated Cash Flow Statement / IFRS Consolidated Financial Statements 2016 Constantia Flexibles_37

38_Constantia Flexibles xxxxxxxxx
Consolidated Statement of Changes in Equity
FOR FISCAL YEAR 2016 ATTRIBUTABLE TO EQUITY HOLDERS OF THE PARENT(in € thousand)
Share Capital Hedging Available- capital reserve reserve for-sale- reserve
Balance as of January 1, 2016 ................................................................................................................................................................................................35 ........................................................48,207.......................................................(1,977) .....................................................................................4Other comprehensive income ...................................................................................................................................................................................................................................................................................................................................................................................................3,584 .............................................................................................
Net income after tax ....................................................................................................................................................................................................................................................................................................................................................................................................................................................................................................................................................................................
Business combinations .......................................................................................................................................................................................................................................................................................................................................................................................................................................................................................................................................................
Change in consolidated group .........................................................................................................................................................................................................................................................................................................................................................................................................................................................................................................
Transactions with equity holders of the parent ..............................................................................................................................................................................................................................................................................................................................................................................................................
Recognition of participation rights ..................................................................................................................................................................................................................................................................................................................................................................................................................................................................................... Acquisition of non-controlling interests ....................................................................................................................................................................................................................................................................................................................................(38) ............................................................................................. Call-/Put Options .............................................................................................................................................................................................................................................................................................................................................................................................................................................................................................................................................................................. Reclassification Verstraete in mould labels N.V. ............................................................................................................................................................................................................................................................................................................................................................................................................. Deconsolidation Aluprint Plegadizos ........................................................................................................................................................................................................................................................................................................................................................................................................................................................................
Dividends ...........................................................................................................................................................................................................................................................................................................................................................................................................................................................................................................................................................................................................................
Subtotal ...............................................................................................................................................................................................................................................................................................................................................0 .........................................................................................0.........................................................................(38) .....................................................................................0Balance as of December 31, 2016........................................................................................................................................................................35 ........................................................48,207................................................................1,569 .................................................................................4
Balance as of January 1, 2015 ................................................................................................................................................................................................35 ........................................................45,809.......................................................(2,456) .....................................................................................4Other comprehensive income .............................................................................................................................................................................................................................................................................................................................................................................................................479 .............................................................................................
Net income after tax ....................................................................................................................................................................................................................................................................................................................................................................................................................................................................................................................................................................................
Transactions with equity holders of the parent ..............................................................................................................................................................................................................................................................................................................................................................................................................
Recognition of share-based payments ............................................................................................................................................................................................................................2,398 ...........................................................................................................................................................................................
Acquisition of non-controlling interests ..........................................................................................................................................................................................................................................................................................................................................................................................................................................................
Repayment of hybrid capital...................................................................................................................................................................................................................................................................................................................................................................................................................................................................................................................... Reclassification transaction cost hybrid capital................................................................................................................................................................................................................................................................................................................................................................................................................ Payments to hybrid capital holders..................................................................................................................................................................................................................................................................................................................................................................................................................................................................................
Dividends ...........................................................................................................................................................................................................................................................................................................................................................................................................................................................................................................................................................................................................................
Subtotal ...............................................................................................................................................................................................................................................................................................................................................0 ...............................................................2,398 .....................................................................................0 .....................................................................................0Balance as of December 31, 2015........................................................................................................................................................................35 ........................................................48,207.......................................................(1,977) .....................................................................................4
38_Constantia Flexibles IFRS Consolidated Financial Statements 2016 / Consolidated Statement of Changes in Equity

xxxxxxxxxxxxxx Constantia Flexibles_39
ATTRIBUTABLE TO EQUITY HOLDERS OF THE PARENT HYBRID NON- EQUITY CAPITAL CONTROLLING INTERESTS (NCI)
Foreign Employee Retained Total currency benefits earnings translation reserve reserve
.........................................................23,650 ...............................................(14,188) ................................................346,681 .................................................402,411 .........................................................................................0.......................................................(1,615) ............................................400,796
........................................................19,288 .......................................................(1,489) .........................................................................................................................................................21,384 .................................................................................................................................................................1,691 ....................................................23,075
...........................................................................................................................................................................................................................................................48,496 ........................................................48,496 .................................................................................................................................................................8,895 ....................................................57,391
.......................................................................................................................................................................................................................................................................................................................................................................................................................................................................................................................................................................................................................................................................................................
..............................................................................................................................................................................................................................................................................................................................................................................................0 .........................................................................................................................................................17,151 ....................................................17,151
.......................................................................................................................................................................................................................................................................................................................................................................................................................................................................................................................................................................................................................................................................................................
...................................................................................................................................................................................................................................................416,000 .................................................416,000 ...............................................................................................................................................................................................................................................416,000
.........................................................................(22) .........................................................................(45) ...................................................... (1,196) .......................................................(1,302) ........................................................................................................................................................(3,748) ...................................................(5,050)
...................................................................................................................................................................................................................................................(31,850) ................................................(31,850) ................................................................................................................................................(16,878) ...........................................(48,728)
..........................................................................................................................................................................................................................................................(1,099) .......................................................(1,099) .................................................................................................................................................................1,099 .....................................................................................0
...................................................................................................................................................................(102) .........................................................................102 .........................................................................................0 ........................................................................................................................................................................................................................................................................................0
...................................................................................................................................................................................................................................................(61,974) ................................................(61,974) ........................................................................................................................................................(5,577) ...........................................(67,551)
.........................................................................(22) .................................................................(147) ...............................................319,983 ................................................319,776 .........................................................................................0...............................................(25,104) ...........................................294,672
.........................................................42,916 ...............................................(15,824) ................................................715,161 .................................................792,067 .........................................................................................0................................................................1,018 ............................................793,085
................................................................5,560 ...............................................(15,559) ................................................300,096 .................................................333,488 ................................................148,163..................................................................(836) ............................................480,815
........................................................18,269 ...............................................................1,454 .........................................................................................................................................................20,201 ..................................................................................................................................................................(658) ...................................................19,544
...........................................................................................................................................................................................................................................................50,203 ........................................................50,203 .................................................................................................................................................................9,206 ...................................................59,409
.......................................................................................................................................................................................................................................................................................................................................................................................................................................................................................................................................................................................................................................................................................................
....................................................................................................................................................................................................................................................................................................................................................................2,398 ..............................................................................................................................................................................................................................................................2,398
.................................................................(179) .........................................................................(83) .................................................................................24 .................................................................(238) ...........................................................................................................................................................................364 .....................................................................127
..............................................................................................................................................................................................................................................................................................................................................................................................0 .......................................(150,000).....................................................................................................................................(150,000)
..........................................................................................................................................................................................................................................................(1,837) .......................................................(1,837) ...............................................................1,837.......................................................................................................................................................................................0
..........................................................................................................................................................................................................................................................(1,805) .......................................................(1,805) ......................................................................................................................................................................................................................................................(1,805)
..............................................................................................................................................................................................................................................................................................................................................................................................0 ........................................................................................................................................................(9,691) ...................................................(9,691)
.................................................................(179) .........................................................................(83) ...................................................... (3,618) .......................................................(1,481) .......................................(148,163).......................................................(9,326) ...................................(158,971)
.........................................................23,650 ...............................................(14,188) ................................................346,681 .................................................402,411 .........................................................................................0.......................................................(1,615) ............................................400,796
Consolidated Statement of Changes in Equity / IFRS Consolidated Financial Statements 2016 Constantia Flexibles_39

Notes to the Consolidated Financial Statements
A. General
Reporting entityConstantia Flexibles Group GmbH (“Constantia Flexibles,” the “parent company,” or the “Company”) is a company domiciled in Austria. The address of the registered head-quarters of the Company is 1200 Vienna, Rivergate, Handelskai 92. The Company is registered at the Vienna Commercial Court under the commercial register number FN 332189 p. The Company’s consolidated financial statements for the fiscal year ended December 31, 2016, include the Company and its subsidiaries (referred to jointly as the “Constantia Flexibles Group” and individually as “Group entities”). The Group is one of the world’s leading manufacturers of flexible packaging, and supplies numer-ous multinational corporations and local market leaders in the food, pet food, pharmaceutical, and beverage indus-tries. In recent years, the Group has evolved from a provid-er with a regional focus in Europe into a global company with a presence in the most attractive and fastest growing international markets for flexible packaging. Constantia Flexibles represents premium positioning, technology leadership, a customer focus, and highly efficient pro-duction facilities. The Austrian holding company and par-ent company makes strategic investments in companies within this business sector.
The shareholders of Constantia Flexibles GmbH, the fund advised by One Equity Partners (OEP), and the H. Turnauer Foundation sold their majority stake in the Constantia Flexibles Group to Wendel in a deal that closed on March 26, 2015. Because of this acquisition, the new ultimate Austrian group parent is Constantia Flexibles Holding GmbH. The immediate parent company of Constantia Flexibles Group GmbH is Constantia Flexibles Beteiligung GmbH.
The consolidated financial statements of Constantia Flexibles Group GmbH are primarily prepared for those individuals who hold shares of the bond with a notional value of €129,121 thousand. The bond has been trading on the secondary market of the Vienna Stock Exchange since May 25, 2012. It has a five-year term and will be redeemed on May 25, 2017.
Basis of preparationThe consolidated financial statements for the fiscal year from January 1 to December 31, 2016, were prepared in accordance with the International Financial Reporting Standards (IFRSs) and the interpretations of the Inter-national Financial Reporting Standards Interpretations
Committee (IFRS IC) issued by the International Accounting Standards Board (IASB), as adopted by the European Union, that were required to be applied in 2016, and in accordance with Section 245a UGB (Austrian Commercial Code).
The consolidated financial statements of Constantia Flexibles Group GmbH were prepared on a going concern basis. Details of the accounting policies, including the changes made to those policies, can be found in Sections E, I, J, and K.
The consolidated income statement was prepared using the cost of sales (function of expense) method in accord-ance with IAS 1.
B. Reporting Currency and Currency Translation
Functional currency and presentation currencyThese consolidated financial statements are presented in euros, the presentation currency of the parent company. The consolidated financial statements have been drawn up in thousands of euros. Numerous amounts and per-centages reported in the consolidated financial state-ments have been rounded, so totals may differ from the amounts presented.
Foreign currency transactionsForeign currency transactions were translated into the relevant functional currency of the Group entities at the transaction date using the exchange rate prevailing at that time. Monetary assets and liabilities denominated in a foreign currency at the closing date were translated into the functional currency at the closing rate. Non-monetary assets and liabilities measured in a foreign currency at fair value were translated at the exchange rate prevailing at the date when fair value was determined. Currency trans-lation differences from the translation of transactions are generally recognized in profit or loss for the period.
In the reporting period, expenses from exchange rate differences (operating result and net financial income and expense) in the amount of €4,342 thousand were recognized in the income statement (2015: expenses of €6,440 thousand).
Foreign operationsAssets and liabilities of Group entities whose functional currency is not the euro, including goodwill and fair value adjustments arising on acquisition, are translated into
40_Constantia Flexibles IFRS Consolidated Financial Statements 2016 / Notes to the Consolidated Financial Statements

euros at the closing rate at the reporting date. The income and expenses of foreign operations are translated on a monthly basis using the monthly average exchange rate. Currency translation differences are recognized in other comprehensive income and presented in the currency translation reserve in equity, to the extent that the currency translation difference is not attributable to non-controlling interests.
Upon the disposal of a foreign operation, the correspond-ing cumulative amount in the currency translation reserve is reclassified to the income statement as part of the dis-posal gain/loss. In the case of only partial disposal without
loss of control of the subsidiary, the corresponding portion of the cumulative amount of the currency translation dif-ference is allocated to non-controlling interests. If the set-tlement of monetary items in the form of receivables or liabilities from or to a foreign operation is neither planned nor likely to occur in the foreseeable future, the resulting foreign exchange gains and losses are recognized as part of the net investment in the foreign operation.
Currencies relevant to the GroupThe exchange rates of the currencies relevant to Constantia Flexibles Group GmbH are as follows:
Notes to the Consolidated Financial Statements / IFRS Consolidated Financial Statements 2016 Constantia Flexibles_41
Reference rate at Annual average the balance sheet date rate 2016 12/31/2016
United Arab Emirates Dirham.........................................................................................................................................................................................................................................AED .............................................................................3.86240 .............................................................................4.06427Australian Dollar ...............................................................................................................................................................................................................................................................................................................AUD .............................................................................1.45960 .............................................................................1.48773Canadian Dollar ...................................................................................................................................................................................................................................................................................................................CAD .............................................................................1.41880 .............................................................................1.46665Chinese Yuan/Renminbi....................................................................................................................................................................................................................................................................CNY .............................................................................7.32020 .............................................................................7.31989Czech Koruna ..............................................................................................................................................................................................................................................................................................................................CZK .....................................................................27.02100 .............................................................................27.0425Danish Krone ...............................................................................................................................................................................................................................................................................................................................DKK .............................................................................7.43440 .............................................................................7.44743British Pound ................................................................................................................................................................................................................................................................................................................................GBP .............................................................................0.85618 .............................................................................0.81251Indonesian Rupiah ..........................................................................................................................................................................................................................................................................................................IDR ...........................................14,167.68000 ............................................14,775.34667Indian Rupee ........................................................................................................................................................................................................................................................................................................................................INR .....................................................................71.59350 .....................................................................74.23577Malaysian Ringgit .........................................................................................................................................................................................................................................................................................................MYR .............................................................................4.72870 .............................................................................4.56103Polish Zloty .............................................................................................................................................................................................................................................................................................................................................PLN .............................................................................4.41030 .............................................................................4.36220New Romanian Leu .............................................................................................................................................................................................................................................................................................RON .............................................................................4.53900 .............................................................................4.49205Russian Ruble ...........................................................................................................................................................................................................................................................................................................................RUB .............................................................................64.3000 .....................................................................74.67359Swedish Krona .........................................................................................................................................................................................................................................................................................................................SEK .............................................................................9.55250 .............................................................................9.44101Singapore Dollar ..............................................................................................................................................................................................................................................................................................................SGD .............................................................................1.52340 .............................................................................1.52577Turkish Lira ...............................................................................................................................................................................................................................................................................................................................................TRY .............................................................................3.70720 .............................................................................3.29841US Dollar .......................................................................................................................................................................................................................................................................................................................................................USD .............................................................................1.05410 .............................................................................1.10605Vietnamese Dong .........................................................................................................................................................................................................................................................................................................VND ...........................................23,945.99000 ............................................24,728.34583South African Rand .................................................................................................................................................................................................................................................................................................ZAR .....................................................................14.45700 .....................................................................16.33687

C. Consolidation Methods
Basis of consolidationThe consolidated financial statements incorporate Constantia Flexibles Group GmbH and the subsidiaries it controls. The Group controls a company in accordance with IFRS 10 if all of the following criteria are met:
• it has power over the investee;• it is exposed, or has rights, to variable returns from the
Group’s involvement in the investee;• it has the ability to use its power over the investee to
affect the amount of the Group’s returns.
The financial statements of subsidiaries are included in the consolidated financial statements from the date on which control begins and until the date on which control ceases.
If the Group loses control of a subsidiary, it disposes of the assets and liabilities of the subsidiary and any related non-controlling interests and other components of equity. Any gain or loss is recognized in the income statement. Any retained interest in the former subsidiary is measured at fair value at the date on which control was lost.
The Group treats transactions with non-controlling inter-ests that do not result in a loss of control as transactions with owners of the Group in their capacity as owners. Any difference between the fair value of the consideration paid and the acquired interest in the carrying amount of the net assets of the subsidiary resulting from the acquisition of a non-controlling interest is recognized in equity. Gains and losses arising on the disposal to non-controlling interest shareholders are also recognized in equity.
The annual financial statements of the consolidated entities included in the consolidated financial statements are based on uniform accounting policies. The reporting date for the majority of consolidated companies is Decem-ber 31, 2016. Parikh Packaging Pvt. Ltd. and entities of the Pemara Group have different reporting dates. Addi-tional financial information as of December 31, 2016, has been prepared for consolidation purposes.
Business combinationsThe Group accounts for business acquisitions using the acquisition method, which is the only method permitted by IFRS 3, on the date when the Group obtains control. The consideration transferred for the acquisition and the iden-tifiable net assets acquired are generally measured at fair value. Any resulting goodwill is tested annually for impair-ment in accordance with IAS 36. A bargain purchase is recognized immediately in profit or loss. Costs related to acquisitions are recognized as expenses in the periods in which they are incurred.
Non-controlling interestsNon-controlling interests are measured at their proportionate share of the net identifiable assets of the acquiree at the acquisition date.
Changes in the Group’s investment in a subsidiary thatdo not result in a loss of control are accounted for as an equity transaction.
Associates and joint venturesAssociates are entities over which the Group has a signi f-icant influence, but not control or joint control, in respect of their financial and operating policies. Associates are accounted for using the equity method. The carrying amount of associates is increased or reduced each year to reflect changes in the share of their equity attributable to Constantia Flexibles. First consolidation differences arising on the initial inclusion of equity method invest-ments are accounted using the same principles applied to consolidation. Changes in the Group’s proportionate equity interest affecting profit or loss, including any impairment losses on goodwill, are recognized in the share of profits or losses of equity method investments.
A joint venture is an arrangement of which the Group has joint control, whereby it has rights to the net assets of the arrangement instead of rights to its assets and obligations for its liabilities. The Group does not hold interests in any joint ventures at this time.
42_Constantia Flexibles IFRS Consolidated Financial Statements 2016 / Notes to the Consolidated Financial Statements

Transactions eliminated on consolidationIntercompany balances and transactions and any unreal-ized income and expenses arising from intercompany transactions are eliminated when preparing the consoli-dated financial statements. As part of the consolidation of intercompany balances, intercompany trade receivables and other receivables are offset against the corresponding intercompany liabilities.
The material effects of first consolidation and decon-solidation are explained in the following.
1. Acquisitions
2016 reporting periodFirst consolidation of Afripack Group, South Africa, on January 1, 2016The Constantia Flexibles Group signed a purchase agree-ment for 95% of the shares of the Afripack Group on July 9, 2015. Regulatory approval was granted on December 10, 2015. The equity investment was recognized as of December 31, 2015, as an “other financial instrument”; the entity was first consolidated on January 1, 2016.
D. Acquisitions and Other Changes to theScope of Consolidation The scope of consolidation of the Constantia Flexibles Group (including the parent) changed as follows infiscal year 2016:
Afripack, which is based in Durban, is the second largest company for flexible packaging in South Africa and sub- Saharan Africa. The company produces flexible food pack-aging and labels for the local market and for selected African export countries. Afripack operates six plants in South Africa, one in Kenya, and one in Mauritius. With the acqui-sition of the Afripack Group, Constantia Flexibles continues to expand its position in the African growth market.
A purchase price of €31,138 thousand and a call/put option of €12,775 thousand (carrying amount as of the date of first consolidation) were agreed. The following table shows an overview of the assets and liabilities as of the date of first consolidation.
Fully consolidated companies Associated companies
Balance as of January 1, 2016 ..........................................................................................................................................................................................................................................................................................................................................................................79 .......................................................................................................................0 First consolidation Afripack Group.................................................................................................................................................................................................................................................................................................................................................................7 .......................................................................................................................4First consolidation Pemara Group ....................................................................................................................................................................................................................................................................................................................................................................7 .......................................................................................................................0 First consolidation Constantia Oai Hung Manufacturing Joint Stock Company ................................................................................................................1 .......................................................................................................................0 Formation Constantia Flexibles Poland Holding Sp. Z.o.o. ....................................................................................................................................................................................................................................1 .......................................................................................................................0 Merger Metall Deutschland GmbH and Constantia Flexibles Germany GmbH............................................................................................................(1) .......................................................................................................................0 Deconsolidation Aluprint Plegadizos S de R.L. de C.V................................................................................................................................................................................................................................................(1) .......................................................................................................................0 Deconsolidation Dilpack SA Ltd. Pty. ....................................................................................................................................................................................................................................................................................................................................................0 ..............................................................................................................(1)Balance as of December 31, 2016.........................................................................................................................................................................................................................................................................................................................................93 .......................................................................................................................3
Notes to the Consolidated Financial Statements / IFRS Consolidated Financial Statements 2016 Constantia Flexibles_43

(in € thousand) Fair value Adjustment during Fair value including measurement as of adjustments period 1/1/2016
Intangible assets (incl. customer base) .........................................................................................................................................................................................4,611 ..................................................................................................0 ........................................................................4,611 Tangible assets .................................................................................................................................................................................................................................................................................................................23,979 ..................................................................................712 ................................................................23,267 Financial assets .....................................................................................................................................................................................................................................................................................................................1,148 ..................................................................................................0 ........................................................................1,148 Deferred tax assets .................................................................................................................................................................................................................................................................................................1,699 ................................................................(2,672) ........................................................................4,371 Other non-current assets ....................................................................................................................................................................................................................................................................................43 ..................................................................................................0 ..........................................................................................43 Non-current assets ...............................................................................................................................................................................................................................................................................................31,480 ................................................................(1,960) .................................................................33,440 Inventories ..........................................................................................................................................................................................................................................................................................................................................14,137 ..........................................................................(202) ................................................................14,339 Trade receivables .....................................................................................................................................................................................................................................................................................................17,337 ..................................................................................................0 ................................................................17,337 Tax receivables ............................................................................................................................................................................................................................................................................................................................................17 ..................................................................................................0 ..........................................................................................17 Other receivables.............................................................................................................................................................................................................................................................................................................2,243 ..................................................................................................0 ........................................................................2,243 Cash and cash equivalents .........................................................................................................................................................................................................................................................4,814 ..................................................................................................0 ........................................................................4,814 Current assets...........................................................................................................................................................................................................................................................................................................................38,548 ..........................................................................(202) .................................................................38,750Current assets ................................................................................................................................................................................................................................................................................................................................................70,028 ................................................................(2,161) .................................................................72,189 Provisions (non-current) ..................................................................................................................................................................................................................................................................................719 ..................................................................................................0 ..................................................................................719 Interest-bearing financial liabilities (non-current) ...........................................................................................................................11,284 ..................................................................................899 ................................................................10,386 Deferred tax liabilities .....................................................................................................................................................................................................................................................................................2,197 ...................................................................... (341) ........................................................................2,538 Other non-current liabilities .......................................................................................................................................................................................................................................................3,357 ........................................................................3,286 ..........................................................................................71 Non-current liabilities .................................................................................................................................................................................................................................................................................17,557 ........................................................................3,843 .................................................................13,714 Provisions (current) ..................................................................................................................................................................................................................................................................................................1,719 .............................................................................................. 0 ........................................................................1,719 Interest-bearing financial liabilities (current).....................................................................................................................................................15,664 ..................................................................................498 ................................................................15,166 Trade payables ...................................................................................................................................................................................................................................................................................................................20,352 ..................................................................................................0 ................................................................20,352 Tax liabilities ...........................................................................................................................................................................................................................................................................................................................................................70 ..........................................................................................26 ..........................................................................................44 Other current liabilities ................................................................................................................................................................................................................................................................................2,629 ..........................................................................................12 ........................................................................2,617 Current liabilities.............................................................................................................................................................................................................................................................................................................40,434 ...................................................................................536 .................................................................39,898Total liabilities ..................................................................................................................................................................................................................................................................................................................................................57,991 ........................................................................4,379 .................................................................53,612Non-controlling interests ......................................................................................................................................................................................................................................................................................................2,965 ................................................................(2,033) ........................................................................4,998Acquired net assets .......................................................................................................................................................................................................................................................................................................................9,072 ................................................................(4,507) .................................................................13,579
44_Constantia Flexibles IFRS Consolidated Financial Statements 2016 / Notes to the Consolidated Financial Statements

The fair value of the trade receivables was €17,337 thou-sand. The gross amount of the trade receivables acquired was €18,354 thousand.
Goodwill: The goodwill from the acquisition amounts to €22,066 thousand. The amount of goodwill changed to €25,876 thousand between the date of initial measure-ment and the reporting date due to the measurement of foreign currency.
The non-controlling shareholders were granted the right to sell all of the remaining shares to the Constantia Flexibles Group in 2020. The present value of the call/put option as of the date of first consolidation was determined to be €12,775 thousand. This call/put option is presented as a non-current liability in the consolidated balance sheet. The present value of the liability from the call/put option was deducted from the non-controlling interests – measured at €2,692 thousand based on the proportionate share of net assets – and the remaining amount was recognized as equity.
The Constantia Flexibles Group recognizes the non- controlling interests in the amount of the pro-rata carrying amounts of the identified assets and liabilities.
The Constantia Flexibles Group primarily expects synergies from the acquisition of the Afripack Group that can be generated for improvements in global product delivery for multinational customers of the Constantia Flexibles Group and collaboration between Afripack and Constantia Flexibles Group entities. The goodwill was allocated to the Food Division. The goodwill is not expected to be tax deductible.
Contribution to the net result: The Afripack Group contributed sales of €103,007 thousand, earnings before interest, taxes, depreciation, and amortization (EBITDA) of €7,177 thousand, and earnings of (€1,482) thousand to the net result in fiscal year 2016.
First consolidation of Pemara Labels Group, Australia, on January 1, 2016Constantia Flexibles acquired 100% of the shares of the Pemara Group, Australia, on November 9, 2015. The equity investment was recognized as of December 31, 2015, as an “other financial instrument”; the entity was first con-solidated on January 1, 2016.
The Melbourne-based company was founded in 1966 and produces pressure-sensitive labels, in-mold labels, and Fix-a-Form™ folding labels. Pemara operates four plants in Australia, Malaysia, Vietnam, and Indonesia and has distribution offices in Sydney, Australia, and Manila, Philippines. With the purchase of the Pemara Group, Constantia Flexibles is responding to the needs of its globally expanding clients and strengthening its regional presence in Australia and Asia.
A purchase price of €22,127 thousand and contingent consideration at the acquisition date amounting to €7,613 thousand (present value at the reporting date: €8,318 thousand) were agreed.
Contingent consideration: The Constantia Flexibles Group has contractually agreed to grant the seller an additional future purchase price based on earnings (earn-out agree-ment). The contingent component of the purchase price is measured based on Level 3 inputs in the fair value hierarchy. For more information, see Section L Financial Instruments.
The following table shows an overview of the assets and liabilities as of the date of first consolidation.
Notes to the Consolidated Financial Statements / IFRS Consolidated Financial Statements 2016 Constantia Flexibles_45

(in € thousand) Fair value as of 1/1/2016
Intangible assets ....................................................................................................................................................................................................................................................................................................................................................................................................................................................................................................................................6,077 Tangible assets .....................................................................................................................................................................................................................................................................................................................................................................................................................................................................................................................................10,512 Deferred tax assets .......................................................................................................................................................................................................................................................................................................................................................................................................................................................................................................................................20 Other non-current assets ........................................................................................................................................................................................................................................................................................................................................................................................................................................................................................................38 Non-current assets ...................................................................................................................................................................................................................................................................................................................................................................................................................................................................................................................16,647 Inventories ......................................................................................................................................................................................................................................................................................................................................................................................................................................................................................................................................................................3,123 Trade receivables .................................................................................................................................................................................................................................................................................................................................................................................................................................................................................................................................5,738 Tax receivables ................................................................................................................................................................................................................................................................................................................................................................................................................................................................................................................................................................21 Other receivables.................................................................................................................................................................................................................................................................................................................................................................................................................................................................................................................................1,110 Cash and cash equivalents .............................................................................................................................................................................................................................................................................................................................................................................................................................................................................2,686 Current assets...............................................................................................................................................................................................................................................................................................................................................................................................................................................................................................................................................12,679Total assets ....................................................................................................................................................................................................................................................................................................................................................................................................................................................................................................................................................................................29,326 Provisions (non-current) ......................................................................................................................................................................................................................................................................................................................................................................................................................................................................................................143 Interest-bearing financial liabilities (non-current) .......................................................................................................................................................................................................................................................................................................................................................2,807 Deferred tax liabilities .........................................................................................................................................................................................................................................................................................................................................................................................................................................................................................................2,446 Non-current liabilities .............................................................................................................................................................................................................................................................................................................................................................................................................................................................................................................5,396 Interest-bearing financial liabilities (current).................................................................................................................................................................................................................................................................................................................................................................................3,130 Trade payables ...............................................................................................................................................................................................................................................................................................................................................................................................................................................................................................................................................6,274 Tax liabilities .......................................................................................................................................................................................................................................................................................................................................................................................................................................................................................................................................................................117 Other current liabilities ....................................................................................................................................................................................................................................................................................................................................................................................................................................................................................................1,021 Current liabilities.................................................................................................................................................................................................................................................................................................................................................................................................................................................................................................................................10,542Total liabilities ......................................................................................................................................................................................................................................................................................................................................................................................................................................................................................................................................................................15,938Acquired net assets ....................................................................................................................................................................................................................................................................................................................................................................................................................................................................................................................................13,387
The fair value of the trade receivables was €5,738 thou-sand. The gross amount of the trade receivables acquired was €5,873 thousand.
Goodwill: The goodwill from the acquisition amounts to €16,352 thousand. The amount of goodwill changed to €16,689 thousand between the date of initial measure-ment and the reporting date due to the measurement of foreign currency.
The goodwill is essentially attributable to the expertise of the Pemara Group’s employees and the expected synergy effects from the integration of the company into the Labels Division. The goodwill is not expected to be tax deductible.
Contribution to the net result: The Pemara Group con-tributed sales of €34,571 thousand, EBITDA of €3,260
thousand, and earnings of €621 thousand to the net result in fiscal year 2016.
First consolidation of Oai Hung, Vietnam,on July 1, 2016The Constantia Flexibles Group signed a purchaseagreement for 51% of the shares of Constantia Oai Hung Manufacturing Joint Stock Company (“Oai Hung”) onApril 27, 2016. The transaction closed on July 7, 2016, following receipt of official approvals. The company was first consolidated on July 1, 2016.
Oai Hung, a family-run company headquartered in HoChi Minh City, was founded in 1988. In 2015, it generated sales of €25 million and currently has 240 employees.Its major products are blister foils from aluminum and cold-form foils for the growing regional pharmaceuticals market. In addition, the company already has a significant
46_Constantia Flexibles IFRS Consolidated Financial Statements 2016 / Notes to the Consolidated Financial Statements

(in € thousand) Fair value as of 7/1/2016
Intangible assets (incl. customer base) .....................................................................................................................................................................................................................................................................................................................................................................................................38,412 Tangible assets .............................................................................................................................................................................................................................................................................................................................................................................................................................................................................................................................................7,158 Non-current assets ...................................................................................................................................................................................................................................................................................................................................................................................................................................................................................................................45,570 Inventories ......................................................................................................................................................................................................................................................................................................................................................................................................................................................................................................................................................................2,764 Trade receivables .................................................................................................................................................................................................................................................................................................................................................................................................................................................................................................................................5,428 Other receivables.................................................................................................................................................................................................................................................................................................................................................................................................................................................................................................................................2,715 Cash and cash equivalents .......................................................................................................................................................................................................................................................................................................................................................................................................................................................................................121 Current assets...............................................................................................................................................................................................................................................................................................................................................................................................................................................................................................................................................11,027Total assets ....................................................................................................................................................................................................................................................................................................................................................................................................................................................................................................................................................................................56,597 Interest-bearing financial liabilities (non-current) .......................................................................................................................................................................................................................................................................................................................................................1,600 Deferred tax liabilities .........................................................................................................................................................................................................................................................................................................................................................................................................................................................................................................6,904 Non-current liabilities .............................................................................................................................................................................................................................................................................................................................................................................................................................................................................................................8,504 Interest-bearing financial liabilities (current).........................................................................................................................................................................................................................................................................................................................................................................11,767 Trade payables ...............................................................................................................................................................................................................................................................................................................................................................................................................................................................................................................................................3,946 Tax liabilities .............................................................................................................................................................................................................................................................................................................................................................................................................................................................................................................................................................2,319 Other current liabilities ....................................................................................................................................................................................................................................................................................................................................................................................................................................................................................................1,111 Current liabilities.................................................................................................................................................................................................................................................................................................................................................................................................................................................................................................................................19,143Total liabilities ......................................................................................................................................................................................................................................................................................................................................................................................................................................................................................................................................................................27,646Non-controlling interests ..................................................................................................................................................................................................................................................................................................................................................................................................................................................................................................................14,186Acquired net assets ....................................................................................................................................................................................................................................................................................................................................................................................................................................................................................................................................14,764
presence in the sector for lids for dairy products. The state-of-the art production plant has a clean room that meets high international standards. The acquisition of Oai Hung gives Constantia Flexibles its first pharmaceutical production plant in Asia and entry to the fast-growing Southeast Asian market.
A purchase price of €15,066 thousand was agreed, to-gether with contingent consideration at the acquisition date of €13,128 thousand (present value at the reporting date: €14,232 thousand), and a call/put option amounting to €35,953 thousand (present value at the reporting date: €38,980 thousand).
Contingent consideration: The Constantia Flexibles Group has contractually agreed to grant the seller an additional future purchase price based on earnings (earn-out agree-ment). The contingent component of the purchase price
is measured based on Level 3 inputs in the fair value hierarchy. For more information, see Section L Financial Instruments.
The non-controlling interest shareholders were granted the right to sell all of the remaining shares to the Constantia Flexibles Group until 2019. The present value of the call/put option as of the date of first consolidation was deter-mined to be €35,953 thousand. This call/put option is presented as a non-current liability in the consolidated balance sheet. The present value of the liability from the call/put option was deducted from the non-controlling interests – measured at €14,186 thousand based on the proportionate share of net assets – and the remaining amount was recognized as equity.
The following table shows an overview of the assets and liabilities as of the date of first consolidation.
Notes to the Consolidated Financial Statements / IFRS Consolidated Financial Statements 2016 Constantia Flexibles_47

The fair value of the trade receivables was €5,428 thousand. The gross amount of the trade receivables acquired was €5,431 thousand.
Goodwill: The goodwill from the acquisition amounts to €13,430 thousand and is attributable to the Pharma Division. The amount of goodwill changed to €13,892 thousand between the date of initial measurement and the reporting date due to the measurement of foreign cur-rency. The acquisition of Oai Hung gives the Constantia Flexibles Group its first pharmaceutical production plant in Asia and hence entry to the fast-growing Southeast Asian market.
The goodwill is not expected to be tax deductible. In accordance with IFRS 3.45, the provisional amounts rec-ognized at the acquisition date for a business combi nation may be adjusted retrospectively during a period of one year to reflect new information about facts and circum-stances that existed as of the acquisition date. Due to the
comparatively short period since the acquisition, purchase price allocation and the calculation of goodwill as of December 31, 2016, must still be regarded as provisional.
Contribution to the net result: In the second half of fiscal year 2016, Oai Hung contributed sales in the amount of €14,761 thousand, EBITDA of €5,688 thousand, and earnings of €1,447 thousand to the net result in fiscal year 2016.
2. Deconsolidation The Constantia Flexibles Group sold all shares of Aluprint Plegadizos S de R.L. de C.V. (“Aluprint Plegadizos”), Mexico, to Mexican company Grupo Gondi on May 25, 2016. The company was allocated to the Food Division until the date of deconsolidation. The transaction was approved by the authorities on November 4, 2016, and November 1, 2016, was chosen as the date of deconsolidation.
The closing balance sheet was as follows:
Zahlen hier rot, weil 2016?
48_Constantia Flexibles IFRS Consolidated Financial Statements 2016 / Notes to the Consolidated Financial Statements
(in € thousand) Closing balance sheet
Goodwill ...............................................................................................................................................................................................................................................................................................................................................................................................................................................................................................................................................................................................1,526 Intangible assets (incl. customer base) ..................................................................................................................................................................................................................................................................................................................................................................................................................18,485 Tangible assets .................................................................................................................................................................................................................................................................................................................................................................................................................................................................................................................................................14,626 Other non-current assets .....................................................................................................................................................................................................................................................................................................................................................................................................................................................................................................................80 Deferred tax assets ............................................................................................................................................................................................................................................................................................................................................................................................................................................................................................................................................455 Inventories...................................................................................................................................................................................................................................................................................................................................................................................................................................................................................................................................................................................3,584 Trade receivables ..............................................................................................................................................................................................................................................................................................................................................................................................................................................................................................................................................8,332 Other receivables (incl. loan receivables) ...............................................................................................................................................................................................................................................................................................................................................................................................................2,406 Tax receivables...........................................................................................................................................................................................................................................................................................................................................................................................................................................................................................................................................................1,282 Cash and cash equivalents ..........................................................................................................................................................................................................................................................................................................................................................................................................................................................................................9,936Total assets ....................................................................................................................................................................................................................................................................................................................................................................................................................................................................................................................................................................................60,712 Provisions (non-current) ...................................................................................................................................................................................................................................................................................................................................................................................................................................................................................................................511 Deferred tax liabilities ......................................................................................................................................................................................................................................................................................................................................................................................................................................................................................................................6,696 Trade payables ............................................................................................................................................................................................................................................................................................................................................................................................................................................................................................................................................................7,817 Other current liabilities (incl. loan payables) ................................................................................................................................................................................................................................................................................................................................................................................................3,340 Tax liabilities ..........................................................................................................................................................................................................................................................................................................................................................................................................................................................................................................................................................................1,619Total liabilities ......................................................................................................................................................................................................................................................................................................................................................................................................................................................................................................................................................................19,983Net assets disposed of ................................................................................................................................................................................................................................................................................................................................................................................................................................................................................................................40,729

The deconsolidation result is calculated as follows:
Contingent consideration: An earnings-based purchase price (earn-out agreement) was agreed in addition to the purchase price. The value of the agreement was €7,000 thousand at the date of deconsolidation. The contingent consideration receivable is classified as available for sale.It is measured based on Level 3 inputs in the fair value hierarchy. For more information, see Section L Financial Instruments.
Contribution to the net resultThe company contributed sales in the amount of €41,868 thousand, EBITDA of €5,363 thousand, and earnings of €2,805 thousand to the net result for the fiscal year in the period up to the date of deconsolidation on November 1, 2016.
3. Other changes in the scope of consolidation
2016 reporting periodConstantia Flexibles Poland Holding Sp. z o.o. was formed on its entry in the official court registry (Poland) on December 23, 2015.
Constantia Flexibles Germany GmbH was merged with Austria Metall Deutschland GmbH as the acquiring company by virtue of the merger agreement dated August 2, 2016, and the resolutions of the shareholder meetings on the same date. Austria Metall Deutschland GmbH was then renamed Constantia Flexibles Germany GmbH by a shareholder resolution dated October 6, 2016.
Acquisition of Constantia San Prospero, ItalyThe Constantia Flexibles Group acquired Italian company Constantia San Prospero S.r.l. on November 7, 2016. A purchase price of €6,772 thousand was agreed. Theacquisition of Constantia San Prospero S.r.l. gives the Constantia Flexibles Group better access to the southern European pharma market, extending its industry-leading service close to the customer.
Because the financial statement data was not availableat the date of preparation of these consolidated financial statements, and the first consolidation of the company would have an immaterial effect on the consolidated in-come statement, the investment was recognized as an “other financial instrument” as of December 31, 2016. Purchase price allocation for the company had not been completed by the date of preparation of the consolidated financial statements of Constantia Flexibles. The company will be first consolidated as of January 1, 2017, and purchase price allocation will be performed as ofDecember 31, 2017.
E. Accounting Policies
The following main accounting policies were applied tothe preparation of the consolidated financial statementsof Constantia Flexibles Group GmbH.
Notes to the Consolidated Financial Statements / IFRS Consolidated Financial Statements 2016 Constantia Flexibles_49
(in € thousand)
Sales price ............................................................................................................................................................................................................................................................................................................................................................................................................................................................................................................................................................................................ 50,581 Contingent consideration ........................................................................................................................................................................................................................................................................................................................................................................................................................................................................................................................7,000 Total sales price ..........................................................................................................................................................................................................................................................................................................................................................................................................................................................................................................................................................57,581 Net assets disposed of ....................................................................................................................................................................................................................................................................................................................................................................................................................................................................................................................(40,729)Cumulative exchange loss in respect of the net assets of the subsidiary................................................................................................................................................................................................................................................(8,427)Gain on disposal ..............................................................................................................................................................................................................................................................................................................................................................................................................................................................................................................................................................8,425Net cash inflow on disposal .............................................................................................................................................................................................................................................................................................................................................................................................................................................................................................................................................
Consideration received ............................................................................................................................................................................................................................................................................................................................................................................................................................................................................................................................50,581Less: cash and cash equivalent balances disposed of .....................................................................................................................................................................................................................................................................................................................................................(9,936)Net cash inflows........................................................................................................................................................................................................................................................................................................................................................................................................................................................................................................................................................40,645

Current and non-current assets and liabilitiesAssets and liabilities with a residual term of up to one year were classified as current, those with a residual term of more than a year as non current. Residual terms are always determined on the basis of the reporting date.
Intangible assets and goodwill
GoodwillGoodwill arising from business combinations is recognized as an asset at cost less accumulated impairment losses in accordance with IFRS 3.
It is tested for impairment each year and whenever there are indications of impairment. Any impairment loss isimmediately recognized in the consolidated incomestatement. Goodwill impairment losses are not reversed.
Other intangible assetsOther intangible assets relate to purchased intellectual property rights, licenses, patents, concessions, trademarks, and capitalized development costs.
Other intangible assets acquired by the ConstantiaFlexibles Group and that have finite useful lives aremeasured at cost less accumulated amortization andimpairment losses.
Research and developmentExpenditure on research activities is recognized in theincome statement as incurred. Development costs are capitalized only if the following can be demonstrated in accordance with IAS 38.57:
• The technical feasibility of completing the intangible asset so that it will be available for use or sale
• Constantia Flexibles intends to complete the intangible asset and to use or sell it
• Constantia Flexibles is able to use or sell the intangible asset
• The intangible asset will probably generate future economic benefits
• Adequate technical, financial, and other resources to complete the development and to use or sell the intangible asset
• Constantia Flexibles is able to reliably measure the expenditure attributable to the intangible asset during its development.
Other development expenditures are recognized as ex-penses for the period. Capitalized development expen-diture is measured at acquisition cost less accumulated amortization and accumulated impairment losses.
Overall, expenditure on research and development activities in the amount of €8,817 thousand (2015: €7,139 thousand) was expensed in the fiscal year 2016. Development costs of €2,352 thousand (2015: €2,448 thousand) were capi-talized in the reporting period.
Separate acquisitions (additional acquisition costs)In accordance with IAS 38, separate acquisitions are recognized only when they increase the future economic benefits embodied in the asset to which they relate and they can be reliably measured. All other expenses, in-cluding expenses for an internally generated brand name, are recognized in the income statement for the period.
Amortization of intangible assetsIntangible assets are amortized on a straight-line basis over their estimated useful lives. Amortization is recog-nized in the income statement. Goodwill is not amortized. The estimated useful lives are as follows:
• Patents, brands, software, capitalized development costs, and other assets: 1 to 10 years
• Customer relationships: 7 to 15 years
The amortization methods, useful lives, and residual values are reviewed at each reporting date and adjusted as necessary.
Tangible assets
Recognition and measurementIn accordance with IAS 36, tangible assets are measured at cost less accumulated depreciation and impairment losses.
If parts of a tangible asset have different useful lives, they are recognized as separate items (major components) of tangible assets.
50_Constantia Flexibles IFRS Consolidated Financial Statements 2016 / Notes to the Consolidated Financial Statements
Any gain or loss on the disposal of an tangible asset is recognized in profit or loss.
Subsequent costsSubsequent expenditures are capitalized only when it is probable that future economic benefits associated with the expenditures will flow to the Group.
In accordance with IAS 16.14, costs for regular major maintenance that are a condition for continuing to operate a tangible asset are recognized as a replacement in the carrying amount of the asset if the recognition criteria are met. Any remaining carrying amount of the cost of the previous inspection is derecognized.
DepreciationDepreciation is calculated in order to write off the cost of tangible assets, less their estimated residual values, by the straight-line method over their estimated useful lives. Depreciation is recognized in the income statement. Leased assets are depreciated over the shorter of the term of the lease or the useful life of the asset unless it is reasonably certain that title will pass to the Group by the end of the lease. The value of land does not depreciate.
For the current fiscal year and comparative years, the estimated useful lives of significant items of tangible assets are as follows:
• Offices, factories, and other buildings: 25 to 50 years
• Technical plant and machinery: 6 to 50 years
• Other equipment, operating, and office equipment: 4 to 12 years
The depreciation methods, useful lives, and residual values are reviewed at each reporting date and adjusted as necessary.
Financial instrumentsThe Group classifies primary financial assets into the following categories in accordance with IAS 39:
• Measured at fair value through profit or loss • Held-to-maturity investments• Loans and receivables • Available-for-sale financial assets
Recognition and derecognition of primary financial assets and liabilitiesRecognition: The Group recognizes both loans and receivables and issued debt securities as of the date on which they arise. All other financial assets and liabilities are initially recognized at the trade date.
Derecognition: The Group derecognizes a financial asset when the contractual rights to the cash flows from an asset expire or it transfers the rights to receive the cash flows in a transaction in which substantially all the risks and rewards of ownership of the financial asset. Derecog-nition also takes place when the Group transfers substan-tially all the risks and rewards of ownership and does not retain control of the transferred asset.
Financial liabilities are derecognized when the contractual obligations are discharged or canceled, or expire.
Financial assets and liabilities are offset and reported net in the balance sheet if the Group has a legally enforceable right to set off the recognized amounts and intends either to settle on a net basis or to realize the asset and settle the liability simultaneously.
Measurement of primary financial assetsFinancial assets measured at fair value through profit or loss: A financial asset is measured at fair value through profit or loss if it is held for trading or designated as such at initial recognition. Attributable transaction costs are recognized in the income statement as incurred. Financial assets that are measured at fair value through profit or loss are measured at fair value. Any remeasurement gain or loss is recognized in profit or loss. The recognized net gain or loss includes any dividend or interest earned on the financial asset and is reported in the income statement.
Notes to the Consolidated Financial Statements / IFRS Consolidated Financial Statements 2016 Constantia Flexibles_51

Held-to-maturity investments: These assets are initially measured at their fair value plus directly attributable trans-action costs. In the course of subsequent measurement, they are measured at amortized cost using the effective interest method.
Loans and receivables: Upon initial recognition, these assets are measured at their fair value plus directly attributable transaction costs. In the course of subsequent measurement, they are measured at amortized cost using the effective interest method.
Trade receivables: These are classified as “loans and receivables” and are carried at amortized cost. If collect-ability is doubtful, customer receivables are measured at the lower present value of the estimated future cash flows. In addition to the required individual valuation allowances, identified risks from the general credit risk are taken into account by recognizing general valuation allowances.
Cash and cash equivalents: Cash and bank deposits are measured at cost. They include cash on hand, bank call deposits, and other short-term, highly liquid invest-ments with a maximum term of three months at the date of acquisition.
Available-for-sale financial assets: These assets are ini-tially measured at their fair value plus directly attributable transaction costs. In the course of subsequent measure-ment, available-for-sale financial assets are measured at fair value, and corresponding changes in value (with the exception of impairment losses) are recognized in other comprehensive income and presented in the “available- for-sale” reserve in equity. If an asset is derecognized, the accumulated other comprehensive income is reclassified to the income statement. Shares in other companies for which no quoted price in an active market is available and whose fair value cannot be determined reliably are measured at cost.
Measurement of primary financial liabilitiesPrimary financial liabilities are initially recognized at fair value less directly attributable transaction costs. In the course of subsequent measurement, these financial lia-bilities are measured at amortized cost using the effective interest method.
EquityThe costs directly attributable to capital issuances arerecognized as a deduction from equity.
In accordance with Austrian law, additional capital con-tributions by the shareholders are included in the capital reserve.
Hybrid capital: Perpetual bonds
• whose repayment is basically at the discretion of the issuer,
• that exclude the right of the bondholders to regular termination,
• that are subordinate to all other creditors of the Constantia Flexibles Group, and
• whose ongoing compensation payments are at the discretion of the issuer,
are recognized in equity.
Derivative financial instruments and hedge accountingThe Group holds derivative financial instruments to hedge against price, currency, and interest rate risks. Undercertain conditions, embedded derivatives are separated from the host contract and recognized separately.
Derivatives are initially recognized at fair value. Attributable transaction costs are recognized in the income statement when incurred. Derivatives are subsequently measured at fair value. Any resulting changes are generally recognized in the income statement.
Cash flow hedges: For derivatives that are designated as hedges against the risk of variability in cash flows, the effective portion of the derivative’s fair value change is recognized in other comprehensive income and shown in the hedging reserve in equity. The ineffective portion of fair value changes is recognized in the income statement for the period.
52_Constantia Flexibles IFRS Consolidated Financial Statements 2016 / Notes to the Consolidated Financial Statements

The cumulative amount recognized in equity initially remains in other comprehensive income and is reclassified to the income statement in the same period or periods in which the hedged item affects profit or loss.
Hedge accounting is discontinued insofar as the hedging instrument no longer meets the criteria for hedge ac-counting, expires or is sold, terminated, exercised, or no longer designated as a hedging instrument. If a forecast transaction is no longer expected to occur, the cumulative amount previously recognized in equity is reclassified to the income statement.
Physical aluminum stocks are hedged by means offorward sales on the London Metal Exchange (LME).They are subsequently measured at fair value.
Fair value hedges: In fair value hedges, both the hedged exposure of the hedged item and the derivative hedging instrument are measured at fair value through profit or loss.
Hedge accounting is discontinued if the Group terminates the hedging relationship, the hedging instrument expires or is sold, terminated, or exercised, or no longer qualifies for the purpose of hedging. At this time, the adjustmentto the carrying amount of the hedged item attributable to the hedged risk starts being reversed to profit and loss.
Put optionsThe Constantia Flexibles Group has entered into obligations in respect of non-controlling interest shareholders of its subsidiaries. As a result of these agreements, the non- controlling interest shareholders have the right to tender their shares for sale at previously established conditions. At the time the agreements were entered into, none of them resulted in the transfer of material opportunities and risks to the Constantia Flexibles Group. A liability is recog-nized in the amount of the present value of the probable future exercise price. This amount is reclassified from a
separate item within non-controlling interests and reported separately as a liability. Reclassification occurs independently of the probability of exercise. Any difference between the amount of liabilities and non-controlling interests is recog-nized directly in equity. The unwinding of the discount on the liability is recognized in interest expense, and changes in value are recognized in other net financial income and expense.
Impairment
Non-financial assetsApart from inventories and deferred tax assets, the carrying amounts of non-financial assets are reviewed at eachreporting date in order to determine whether there is evi-dence of impairment. If this is the case, the recoverable amount of the asset is estimated. Goodwill and intangible assets with an indefinite useful life are tested for impair-ment annually.
To determine whether impairment exists, the assets are combined into the smallest group of assets that generates cash inflows from continuing use and that are largelyindependent of the cash inflows from other assets or cash-generating units (CGUs). Goodwill acquired in a business combination is allocated to CGUs or groups of CGUs that are expected to benefit from the synergies of the merger. As a rule, the lowest level at the Constantia Flexibles Group corresponds to individual operatingcompanies or groups of operating companies.
The recoverable amount of an asset or CGU is the higher value of its value in use and fair value less cost to sell. In assessing value in use, the estimated future cash flows are discounted to their present value, using a pre-tax discount rate that reflects current market movements of the time value of money and the risks specific to the asset or CGU.
An impairment loss is recognized if the carrying amount of an asset or CGU exceeds its recoverable amount.
Notes to the Consolidated Financial Statements / IFRS Consolidated Financial Statements 2016 Constantia Flexibles_53

Impairment losses are recognized in the income state-ment. Impairment losses that are recognized in respectof CGUs are allocated first to the goodwill attributed to the CGU and subsequently to the carrying amount of the other assets of the CGU on a pro rata basis.
Goodwill impairment losses are not reversed. For otherassets, an impairment loss is reversed only to the extent that the carrying amount of the asset does not exceedthe carrying amount that would have been determined,net of depreciation or amortization, if no impairment loss had been recognized.
Primary financial assetsA financial asset that is not classified at fair value through profit or loss is reviewed at each reporting date in orderto determine whether there is objective evidence ofimpairment. Objective indications that impairment losses haveoccurred in financial assets are:
• The failure or default of a debtor• The restructuring of an amount owed to the Group on
terms that the Group otherwise would not take into consideration
• Notification that a debtor or issuer will enter bankruptcy• Adverse changes in the payment status of borrowers
or issuers• The disappearance of an active market for a security • Observable data pointing to a substantial reduction of
expected payments by a group of financial assets
For an equity instrument held, a significant or prolonged decline in the fair value below its historical cost is con-sidered an objective indication of impairment.
Financial assets measured at amortized costThe Group considers evidence of impairment for these financial assets both at the level of the individual asset and at the collective level. All assets that are of signifi-cance individually are assessed for specific impairment. Those assets that turn out not to be specifically impaired are then collectively assessed for any impairment that has occurred but has not yet been identified. Assets that are not significant on their own are collectively assessed for impairment by grouping together assets with similar risk characteristics.
In assessing collective impairment, the Group useshistorical information about the timing of revenue and the amount of losses incurred, adjusted for the exercise of judgment by the Executive Board as to whether the cur-rent economic and credit conditions are such that the ac-tual losses are likely to be greater or less than the losses that would be expected, based on historical trends.
An impairment loss is calculated as the difference between the carrying amount and the present value of estimated future cash flows, discounted at the original effective in-terest rate of the asset. Losses are recognized in the in-come statement and in other operating expenses. If the corporation has no realistic prospects of collectability of the asset, the amounts are derecognized. If an event that occurs after the recognition of the impairment loss results in a reduction of the amount of the impairment loss, the reduction of the impairment loss is recorded in the income statement.
Available-for-sale financial assetsThe impairment of available-for-sale financial assets is recognized in the income statement by reclassification of the accumulated losses in the “available-for-sale” reserve in equity. The cumulative loss reclassified from equity to the income statement is the difference between the ac-quisition cost, less any principal repayment and amortiza-tion, and the current fair value, less any impairment losses previously recognized in the income statement. If the fair
54_Constantia Flexibles IFRS Consolidated Financial Statements 2016 / Notes to the Consolidated Financial Statements

value of an impaired available-for-sale debt instrument increases in a subsequent period and the increase can be objectively traced back to an outcome occurring after im-pairment was recognized, the impairment loss is reversed and the amount of the reversal is recorded in the income statement. In other cases, a reversal is recognized in other comprehensive income. An impairment loss recognized for shares in companies that are measured at cost because fair value cannot be reliably determined may not be reversed.
InventoriesIn accordance with IAS 2, inventories are measured at the lower of cost and net realizable value. The cost of raw ma-terials, consumables, and supplies is based on the moving average price method. In the case of manufactured prod-ucts (unfinished and finished products), cost includes an appropriate share of the production overheads based on normal operating capacity (pro-rated material and production overheads). General administration and selling expenses are not capitalized.
Net realizable value is the selling price attainable in the nor-mal course of business less the estimated costs required to complete the product and the necessary costs to make the sale. Inventory risks arising from the storage period and from reduced marketability are covered by appropriate valuation allowances.
Capital managementThe aim of Constantia Flexibles is to keep a strong capital base so as to maintain investor, creditor, and market con-fidence and to ensure the sustainable development of the Company. Management regularly monitors the return on capital and seeks a balance between the increase in the rate of return that could be achieved with a higher debt ratio and the advantages of a stable capital base. Formore information see Section L Financial Instruments.
Employee benefits (IAS 19)
Short-term employee benefitsObligations under short-term employee benefits arerecognized as an expense when the employees renderthe related service. A liability is recognized for the amount expected to be paid when the Group has a present legal or constructive obligation to pay this amount as a resultof service rendered by the employee, and the obligation can be estimated reliably.
Defined contribution plansObligations for contributions to defined contribution plans are recognized as an expense as soon as the related ser-vice is rendered. Prepaid amounts are recognized as anasset to the extent that a claim arises for a refund orreduction of future payments.
Defined benefit plansThe net obligation of the Group regarding defined benefit plans (pension plans, termination benefits) is calculated separately for each plan by estimating future benefitsthat employees have earned in the current period and in previous periods. This amount is discounted, and the fair value of any plan assets is subtracted from this.
The calculation of the defined benefit obligations isperformed annually by accredited actuaries using theprojected unit credit method.
Revaluations of the net liability for defined benefit plans are recognized immediately in other comprehensive in-come. The revaluation includes the actuarial gains and losses, the return on plan assets (to the extent they are not included in the net interest expense), and the impact of any asset ceiling (to the extent that it is not included in the net interest expense). The Group determines the net interest expense (income) in respect of the net liability (asset) for defined benefit plans for the reporting period by applying the discount rate used for the measurement of the defined benefit obligation at the beginning of the
Notes to the Consolidated Financial Statements / IFRS Consolidated Financial Statements 2016 Constantia Flexibles_55

annual reporting period. This discount rate is applied to the net defined benefit liability (asset) at this time. In this case, any changes in the net defined benefit liability (as-set) that arise due to the contribution and benefit pay-ments during the reporting period are considered. Net in-terest expense is recognized in net financial income and expense, and other expenses for defined benefit plansare recognized in personnel expenses.
When the benefits of a plan are changed or reduced, the resulting change concerning past service benefits or the gain or loss in terms of reduction is immediately recognized in the profit and loss account. The Group recognizes gains and losses resulting from the settlement of a definedbenefit plan at the time of settlement.
Other long-term employee benefitsThe Group’s net obligation regarding long-term employee benefits comprises future benefits that employees have earned in return for work performed in the current period or in previous periods. These benefits are discounted to determine their present value. Revaluations are recognized in the income statement for the period. The net interest expense and the impact of an interest rate change onrevaluation are recognized in net financial income andexpense.
Benefits upon termination of contractBenefits upon termination of contract are recognized as expenses at the earlier of the following dates: if the Group cannot withdraw the offer of such benefits or if the Group recognizes costs for restructuring. If benefits are notexpected to be completely settled within twelve months after the reporting date, they are discounted.
Share-based paymentsThe Group has cash-settled share-based payment plans for which the Company receives services from employees of the Constantia Flexibles Group as consideration.
The services and the liability arising are recognized atthe fair value of the liability. The services do not qualifyfor recognition as assets and are therefore recognizedas expenses. Details on share-based payments can be found in the “Personnel Expenses” section.
Other provisionsIn accordance with IAS 37, other provisions are recog-nized where present legal or constructive obligations to third parties arise from past transactions or events that are expected to result in an outflow of assets, the amount of which can be reliably measured.
The actual amount of non-current provisions is determined by discounting the expected future cash flows using a pre-tax rate that reflects current market conditions with regard to the time value of money and the risks specific to the liability. The unwinding of the discount is presented in net financial income and expense.
LeasesAssets that are held by the Constantia Flexibles Group under a lease in which all the risks and rewards of ownership are transferred to the Group are classified as finance leases according to IAS 17. Upon initial recognition, the leased asset is recognized in the amount of the lower of its fair value and the present value of the minimum lease pay-ments. After initial recognition, the asset is measured in accordance with the applicable accounting method forthis asset.
Minimum lease payments under finance leases are appor-tioned between the finance expense and the reductionof outstanding liability. The finance expense is distributed over the term of the lease in such a way as to achieve a constant rate of interest on the remaining debt over the periods.
56_Constantia Flexibles IFRS Consolidated Financial Statements 2016 / Notes to the Consolidated Financial Statements
Assets from other leases are classified as operating leases and are not recognized in the Group’s balance sheet.
Payments made under operating leases are recognizedin the income statement on a straight-line basis over the term of the lease.
Revenue recognitionRevenue is recognized when the significant risks andrewards of ownership have been transferred to the buyer, receipt of the consideration is probable, the associated costs and possible returns can be estimated reliably, there is no continuing managerial involvement in the goods, and the amount of revenue can be measured reliably. Revenue is recorded net of returns, discounts, and rebates.
Government grants compensating the Constantia Flexibles Group for expenses incurred are generally recorded in the income statement in the periods in which the expenses are recognized. In fiscal year 2016, government grantsof €1,330 thousand (2015: €991 thousand) wererecognized in profit or loss.
Government grants for assets are recognized at fair value if there is reasonable certainty that they will be received and the conditions attached to the grant are met. Govern-ment grants do not reduce the cost of the assets for which they were granted, but are recognized as deferred income and recognized in other operating income overthe expected useful life of the related asset.
Interest income is recognized in the income statementusing the effective interest method.
Borrowing costsIn determining production costs, borrowing costs are only included if they relate to a qualifying asset in accordance with IAS 23 (Borrowing Costs). A qualifying asset is a non-financial asset that necessarily takes a substantialperiod of time to get ready for its intended state for useor sale. All other borrowing costs are recognized in theincome statement in the period in which they occur.
In accordance with IAS 23, Constantia Flexibles has rec-ognized borrowing costs in the income statement since the recognition criteria for a qualifying asset were not met.
Income taxes (IAS 12)The tax expense comprises current and deferred taxes. Current and deferred taxes are recognized in profit or loss, except to the extent to which they are associated with a business combination or an item recognized directly inequity or in other comprehensive income.
Current taxesCurrent taxes are the expected tax liability or tax receivable on the taxable income for the fiscal year or the tax loss on the basis of the tax rates applicable or substantively applicable at the reporting date, and any adjustment to taxes payable with respect to previous years.
Deferred taxesDeferred taxes are recognized in respect of temporary differences between the carrying amounts of assets and liabilities for consolidated financial reporting purposes and the amounts used for tax purposes. Deferred taxes are not recognized for:
• temporary differences on the initial recognition of assets or liabilities in a transaction that is not a business combination and affects neither accounting profit nor taxable profit,
• temporary differences in respect of investments in sub-sidiaries, associates, and jointly controlled entities, if the Group is able to control the timing of the reversal of the temporary differences and it is probable that they will not be reversed in the foreseeable future, and
• taxable temporary differences on the initial recognition of goodwill.
Notes to the Consolidated Financial Statements / IFRS Consolidated Financial Statements 2016 Constantia Flexibles_57
A deferred tax asset is recognized for unused tax losses, unused tax credits, and deductible temporary differences to the extent that it is probable that future taxable profits will be available for which they can be used. Deferred tax assets are reviewed at each reporting date and reduced to the extent to which it is no longer probable that the related tax benefit can be realized.
Deferred taxes are measured on the basis of the tax rates that are expected to be applied to temporary differences when they reverse, using the tax rates that have beenenacted or substantively enacted at the reporting date.
The measurement of deferred taxes reflects the tax con-sequences that result from the expectations of the Group with regard to the manner of realization of the carrying amounts of its assets and the fulfillment of its liabilities at the reporting date.
Deferred tax assets and deferred tax liabilities are offset if there is a legally enforceable right to set off the recog-nized amounts in respect of the same tax authority, and the offset of deferred tax assets and liabilities is permitted as part of a corporate tax group.
Assets held for saleNon-current assets or disposal groups comprised of assets and liabilities are classified as held for sale or held for distribution if it is highly likely that they will be recovered primarily through sale or distribution rather than through continued use.
In general, these assets and the disposal group are recog-nized at the lower of their carrying amount and fair value less costs to sell. Any impairment expense of a disposal group is first allocated to goodwill and then to the remaining assets and liabilities on a pro rata basis. The following are excluded: inventories, financial assets, deferred tax assets, and assets in connection with employee benefits thatcontinue to be measured in accordance with the otheraccounting policies of the Group. Impairment losses on initial classification as held for sale or distribution andsubsequent gains and losses on revaluation are recog-nized in the income statement. Intangible and tangible assets are no longer amortized or depreciated.
58_Constantia Flexibles IFRS Consolidated Financial Statements 2016 / Notes to the Consolidated Financial Statements
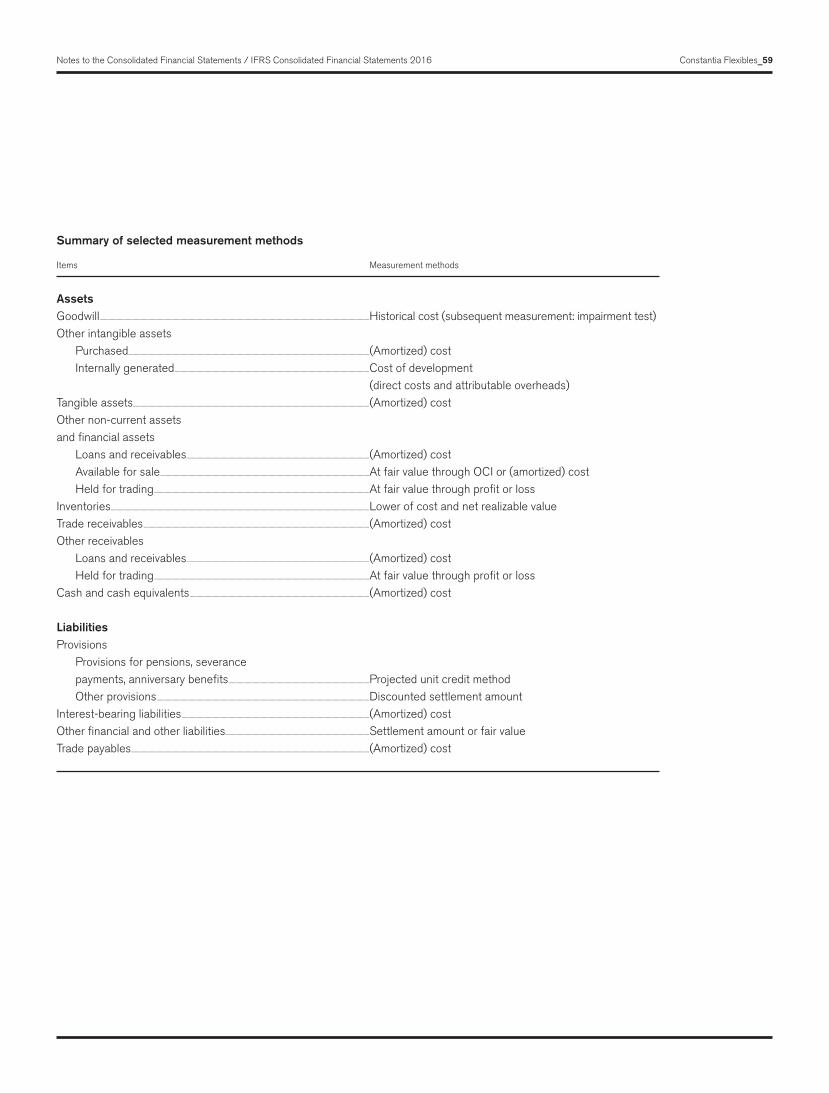
Items Measurement methods
AssetsGoodwill ...............................................................................................................................................................................................................................................................................................................Historical cost (subsequent measurement: impairment test)Other intangible assets Purchased ...............................................................................................................................................................................................................................................................................(Amortized) cost Internally generated ...........................................................................................................................................................................................................................Cost of development (direct costs and attributable overheads)Tangible assets..........................................................................................................................................................................................................................................................................(Amortized) costOther non-current assetsand financial assets Loans and receivables..............................................................................................................................................................................................................(Amortized) cost Available for sale ...........................................................................................................................................................................................................................................At fair value through OCI or (amortized) cost Held for trading ..................................................................................................................................................................................................................................................At fair value through profit or lossInventories ...................................................................................................................................................................................................................................................................................................Lower of cost and net realizable valueTrade receivables ..............................................................................................................................................................................................................................................................(Amortized) costOther receivables Loans and receivables..............................................................................................................................................................................................................(Amortized) cost Held for trading ..................................................................................................................................................................................................................................................At fair value through profit or lossCash and cash equivalents ..........................................................................................................................................................................................................(Amortized) cost Liabilities Provisions Provisions for pensions, severance payments, anniversary benefits ..............................................................................................................................................................Projected unit credit method Other provisions ...............................................................................................................................................................................................................................................Discounted settlement amount Interest-bearing liabilities ...................................................................................................................................................................................................................(Amortized) costOther financial and other liabilities ..................................................................................................................................................................Settlement amount or fair valueTrade payables ............................................................................................................................................................................................................................................................................(Amortized) cost
Summary of selected measurement methods
Notes to the Consolidated Financial Statements / IFRS Consolidated Financial Statements 2016 Constantia Flexibles_59

F. Application of New and Revised International Financial Reporting Standards
Accounting pronouncements that were appliedfor the first time in fiscal year 2016The following accounting standards and interpretations that were revised, supplemented, or newly issued by the IASB were applied for the first time in the accompanying consolidated financial statements:
• IAS 27: Separate Financial Statements (Equity Method)• IAS 1: Disclosure Initiative• Various: Improvements to IFRSs 2012–2014 (2014)• IAS 16 and IAS 38: Clarification of Acceptable Methods
of Depreciation and Amortization• IFRS 11: Acquisition of Interests in Joint Operations• IAS 16 and IAS 41: Agriculture: Bearer Plants
• IFRS 10, IFRS 12, and IAS 28: Investment Entities: Applying the Consolidation Exception
The new, revised, or adapted accounting standards and interpretations that were effective in fiscal year 2016have no material impact on the net assets, financialposition, and results of operations presented in theseconsolidated financial statements.
Accounting standards issued but not yet applied in fiscal year 2016The IASB has recently adopted or revised a number of other accounting standards and interpretations that were not implemented by the Constantia Flexibles Group infiscal year 2016, as their application was either not yet mandatory or they had not yet been endorsed by theEuropean Commission.
Standard Title Effective date Application at Endorsed by Interpretation pursuant to IFRS1 Constantia Flexibles2 the EU3
IFRS 16 ...............................................................................Leases ....................................................................................................................................................................................................1/1/2019 ..................................................................1/1/2019 ..............................................................................................................No IFRS 10 ...............................................................................Sale or Contribution .............................................................................................................................Postponed ..................................................................Postponed ..............................................................................................................Noand IAS 28 of Assets between indefinitley indefinitely an Investor and its Associate or Joint Venture (Amendment)
IAS 12 ........................................................................................Recognition of Deferred .....................................................................................................1/1/2017 ..................................................................1/1/2017 ..............................................................................................................No Tax Assets for Unrealized Losses (Amendment)
IAS 7 ................................................................................................Disclosure Initiative (Amendment) ................................................1/1/2017 ..................................................................1/1/2017 ..............................................................................................................No IFRS 15 ...............................................................................Revenue from Contracts ................................................................................................1/1/2018 ..................................................................1/1/2018 ..............................................................................................................No with Customers (Clarification)
IFRS 2 .......................................................................................Classification and Measurement .....................................................1/1/2018 ..................................................................1/1/2018 ..............................................................................................................No of Share-Based Payment Transactions (Amendment)
60_Constantia Flexibles IFRS Consolidated Financial Statements 2016 / Notes to the Consolidated Financial Statements

Standard Title Effective date Application at Endorsed by Interpretation pursuant to IFRS1 Constantia Flexibles2 the EU3
IFRS 4 .......................................................................................Insurance Contracts............................................................................................................................1/1/2018 ..................................................................1/1/2018 ..............................................................................................................No (Amendment)
Various......................................................................................Improvements to IFRSs ...............................................................................................1/1/2017/ ............................................................1/1/2017/ ..............................................................................................................No 2014–2016 1/1/2018 1/1/2018
IFRIC..............................................................................................Foreign Currency Transactions ..................................................................1/1/2018 ..................................................................1/1/2018 ..............................................................................................................NoInterpretation 22 and Advance Consideration
IAS 40 ........................................................................................Investment Property ............................................................................................................................1/1/2018 ..................................................................1/1/2018 ..............................................................................................................No (Amendment)
IFRS 9 .......................................................................................Financial Instruments .....................................................................................................................1/1/2018 ..................................................................1/1/2018 ...........................................................................................................Yes
IFRS 15 ...............................................................................Revenue from Contracts ....................................................................................................1/1/2018 ..................................................................1/1/2018 ...........................................................................................................Yes with Customers
1 Without early application2 Requirement: Endorsed by the EU3 As of December 31, 2016
IFRS 9 (Financial Instruments)IFRS 9, issued in July 2014, contains revised guidancefor the classification and measurement of financial instru-ments, including a new expected credit loss model to calculate the impairment of financial assets as well as new general accounting requirements for hedging trans-actions, and replaces the existing guidance under IAS 39 (Financial Instruments: Recognition and Measurement).
According to IFRS 9, all financial assets are divided into three classification categories – at amortized cost, at fair value through profit or loss (FVTPL), and at fair value through other comprehensive income (FVOCI), depending on the contractual cash flow characteristics (SPPI) and the business model.
Most of the Group’s financial assets are classified as “held to maturity” and consequently measured at amortized cost. It can be assumed that this classification and measurement will be retained under IFRS 9. There are also likely to be no more than immaterial changes in the case of the finan-cial liabilities, since only an insignificant portion of them were designated as FVTPL. Additionally, the derecognition principles in IAS 39 will be retained in IFRS 9, with theresult that no effects are expected here either.
IFRS 9 requires the Group to ensure that hedge account-ing complies with the objectives and strategies of the Group’s risk management, and that hedge effectiveness is assessed to a greater extent based on a qualitative and forward-looking approach. Under the new model, it is
Notes to the Consolidated Financial Statements / IFRS Consolidated Financial Statements 2016 Constantia Flexibles_61

probable that more risk management strategies will meet the criteria for hedge accounting, in particular those that contain a risk hedging component (except for foreign currency risk) of a non-financial item. Under IFRS 9, derivatives that are embedded in host contracts in which the underlying is a financial asset within the scope of the standard are never accounted for separately. Instead, the hybrid financial instrument is assessed in its entirety with regard to its classification.
Hedging transactions are entered into in the Group in order to hedge against risks such as volatile aluminum prices, interest rates, and exchange rates. The Group will perform a more comprehensive analysis, but it can be assumed that the existing hedging relationships will also meet the IFRS 9 hedge accounting requirements. As a result, the Group does not expect any material effects on its hedge accounting.
IFRS 9 replaces the old incurred loss model according to IAS 39 with an expected credit loss model based on a three-tiered classification system (“buckets”) that affects the underlying measurement horizon and interest reco g-nition. This model must be applied to financial assets that are measured at amortized cost or at FVOCI – with the exception of dividend-bearing instruments – and to contractual assets under IFRS 15.
The Group has not yet performed any more comprehensive analysis of the extent to which the expected loss credit model will impact the future recognition of impairment losses. It can be generally assumed that credit losses will be recognized at an earlier stage. The Group’s history indicates a high level of collectability of trade receivables, so the Group does not expect any material impact from the application of the expected loss credit model in this respect.
The new standard entails comprehensive new disclosures and changes in presentation, which will be implemented in the reporting period in which the standard is applied for the first time.
The Group will not apply IFRS 9 prior to the effective date, and hence will apply it for the first time as of the beginning of fiscal year 2018.
IFRS 15 (Revenue from Contracts with Customers)The objective of IFRS 15 is to establish principles to be followed by an entity in reporting decision-useful infor-mation about the nature, amount, timing, and uncertainty of revenue and cash flows arising from a contract with a customer.
The new standard uses a five-step model to identify the revenue to be recognized. These five steps are: (1) Iden -tify the contract(s) with a customer, (2) Identify separate performance obligations, (3) Determine the transaction price, (4) Allocate the transaction price (to the perfor-mance obligations), and (5) Determine the point in time or time period when revenue is recognized. IFRS 15 also governs the accounting for the incremental costs to obtain a contract, which must be recognized as an asset and am-ortized over the term if they are incurred solely because of the contract and it can be presumed that they can be recovered. Costs to fulfil a contract can also be recognized as an asset under IFRS 15 if certain criteria are met, to the extent that they are not already within the scope of another IFRS.
In some cases, customers are supplied by more than one Group subsidiary. The Group is currently examining the extent to which it might be necessary to combine separate contracts into a single contract within the meaning of IFRS 15. However, we do not currently presume that this will be the case.
IFRS 15 describes certain indicators that must be con-sidered when determining separate performance obliga-tions. The separate accounting for performance obliga-tions may result in revenue being recognized at different points in time. In light of this, in particular the terms and conditions of supply (INCOTERMS) will be analyzed in detail in a further stage of the project in order to establish when transportation services must be identified as aseparate performance obligation.
There is a range of different bonus and discount agree-ments in the Group that are currently being analyzed. Itis not possible to make any concrete statement at present about any potential impacts on revenue recognition be-cause the ongoing implementation project here is notyet in a quantitative assessment phase.
62_Constantia Flexibles IFRS Consolidated Financial Statements 2016 / Notes to the Consolidated Financial Statements

The Group will not exercise the option to apply IFRS 15 before the effective date at the beginning of fiscal year 2018. The Group will apply the new revenue recognition standard for the first time using the modified retrospective method.
As things stand today, it is not possible to make any quan-titative assessment about the extent to which the new re-quirements of IFRS 15 will impact the net assets, financial position, and results of operations, because the project is not yet in the quantitative assessment phase.
IFRS 16 (Leases)IAS 17 will be superseded when IFRS 16 takes effect. The new standard abolishes the recognition of operating leases, with certain exceptions. From January 1, 2019, when entering into a lease, the lessee must recognizethe right-of-use asset and a lease liability.
The standard primarily affects the presentation of oper-ating leases. Future minimum lease payments under operating leases amounted to €49,972 thousand (2015: €46,097 thousand) at the reporting date. Further details on leases are contained in Section I Notes to the Con-solidated Balance Sheet, Note 1, Consolidated asset table.
The impact on assets, financial liabilities, and the income statement is currently being examined. However, the project is still in its early stages and no more far-reaching statements can be made at present.
The Constantia Flexibles Group does not expect anymaterial effects on the net assets, financial position, and results of operations from the future initial appli-cation of the other standards and interpretations.
The effects of amended standards and interpretationson the Group’s consolidated financial statements and the disclosures in the consolidated financial statements are continually monitored and analyzed.
G. Management Judgment andUse of Estimates
Preparation of the consolidated financial statementsrequires certain estimates and assumptions to be made that affect the reported amount of assets (includinggoodwill), provisions, and liabilities, the disclosure of other obligations at the reporting date, and the presentationof income and expenses during the reporting period.Actual future results may differ from those estimates, which can lead to significant differences in theconsolidated financial statements.
The Management of Constantia Flexibles Group GmbH is convinced that the assumptions it has made are reasonable, such that the consolidated financial statements give atrue and fair view of the net assets, financial position,and results of operations in all material respects.
The estimates and underlying assumptions are subjectto considerable uncertainty and their validity is therefore constantly reviewed. Changes to the estimates are recog-nized in the period in which they are made. The principle assumptions relating to the estimates are described in the disclosures on the corresponding items.
For the measurement of existing provisions for pensions and similar obligations, severance payment obligations, and anniversary benefits, assumptions were made with re-spect to the discount rate, retirement age, life expectancy, and future salary and pension increases. Any changes in these assumptions will affect the carrying amount of pen-sion obligations. Sensitivity calculations in connection with provisions for employees are shown in Section H Notes to the Consolidated Financial Statements, Note 8, Provisions.
The Management of Constantia Flexibles Group GmbH is required to make judgments relating to the calculation of deferred taxes. Deferred tax assets are recognized to the extent to which a future use is probable. The amount of
Notes to the Consolidated Financial Statements / IFRS Consolidated Financial Statements 2016 Constantia Flexibles_63

64_Constantia Flexibles IFRS Consolidated Financial Statements 2016 / Notes to the Consolidated Financial Statements
provisions is based on estimates of whether and to what extent expected income taxes will be due. When calculat-ing taxes, local tax regulations and budgeted financial ra-tios must be considered. Deviations in these assumptions have an effect on the carrying amount of deferred taxes. Changes are recognized in other comprehensive income or in profit or loss, corresponding to the initial recognition.
Risk-related assumptions and estimates are made in busi-ness combinations. Related to this, significant adjustments (earn-out arrangements) may happen in future periods. The initial recognition of identified customer lists uses the multi-period excess earnings method, which considers planning data, company-specific WACC rates, and histori-cally documented movement levels. Production machines are recognized on the basis of replacement cost and de-preciated over the remaining economic useful life. Real estate is valued by experts who usually apply the replace-ment cost approach. The initial recognition of items in connection with acquisitions is disclosed in Section D, Acquisitions and Other Changes in the Scope of Consolidation.
Goodwill generated in the context of business combinations is tested for impairment regularly, and at least annually. When testing for impairment, the sum of the carrying amount is compared with the recoverable amount of a cash-generating unit. Recoverable amount is calculated by reference to value in use. The calculation is based on
company-specific growth rates, discount rates, and WACC rates. Changes to these inputs have a significant impact on the calculated value in use. The related sensitivities are presented in Section I, Notes to the Consolidated Balance Sheet, Note 1, Consolidated asset table. Contingent liabilities, which are not recognized in the balance sheet, are assessed regularly with regard to their likelihood of occurrence. If an outflow of resources em-bodying economic benefits is neither probable, such that a provision would have to be recognized, nor remote, the relevant obligations are disclosed as contingent liabilities. If estimates cannot be made by the relevant departments or on the basis of market data, external expert opinions are used.
H. Operating Segments
Basis of segmentationAs described below, the Constantia Flexibles Group has three reportable operating segments. The three reportable operating segments – Food, Labels, and Pharma –correspond to the operating divisions. The membersof the Management Board are the chief operatingdecision maker.
The following summary describes the operations in each of the Group’s reportable operating segments:

Notes to the Consolidated Financial Statements / IFRS Consolidated Financial Statements 2016 Constantia Flexibles_65
The accounting policies of the reportable divisions/ operating segments generally correspond to the Group’s accounting policies described in these notes. The division results presented have been adjusted with respect to the following:
• The Group’s management and financing activities are summarized in the Holding segment.
• The effects of consolidation between the segments and the holding company are also presented.
• Furthermore, non-operating one-time effects (net position from non-recurring income and expenses) from the other segments, as well as the holding company itself, are allo-cated to the Holding segment. In fiscal year 2016, these included expenses for planned acquisitions and post- merger integration, reorganization costs, deconsolidation effects, and other non-operating one-time effects. These non-operating expenses are offset by income from in-surance payments (primarily from the compensation for the fires at plants in South Africa and Germany). The division/segment result determined in this manner is reported to the chief operating decision makers of the
Group to enable them to take decisions regarding the allocation of resources to each division/segment and to assess their performance.
Information regarding reportable divisions (segments)Information regarding the results of each reportable division (segment) is given below. EBITDA and EBIT are used to assess performance, because Management is of the opin-ion that these two measures offer the most relevant infor-mation for the assessment of the results of certain divisions relative to other companies operating within this industry.
Revenues, expenses, and results of the various divisions include intercompany transactions between divisions.Assets, working capital, and liabilities do not contain any intercompany transactions.
The Constantia Flexibles Group does not have any cus-tomers that account for more than 10% of consolidated sales. The largest customer’s share of total sales amounts to 5.4%.
Divisions and their operations
FoodThe Food Division mainly produces cup-sealing systems for the dairy sector; butter and cheese foils; wrap-around labels for dairies; confectio-nery packaging; sachets for soups, sauces, and ready-made meals, and lightweight aluminum packaging systems for the food and pet food industries.
LabelsThe Labels Division produces labels from aluminum, polymers, paper, and IMLs (in-mold labels) of different materials. In-mold labels are plastic labels that mold with the packaging material in the course of the manufacturing of product packaging. The Labels Division focuses on customers in the beverage industry (beer, carbonated soft drinks, water) and on the sale of in-mold labels.
PharmaThe products of the Pharma Division include packaging materials made from an aluminum base, such as child-resistant blister foils, cold-form foils, and plastic products including covers and sachet compounds with a protective barrier for the pharmaceutical, medical technology/ healthcare, and cosmetics market segments.

2016 Food Pharma Labels Holding Constantia(in € thousand) Division Division Division consolidation Flexibles
1-12/2016Third-party sales ......................................................................................................1,168,729 ........................................................292,420 ........................................................600,981 ..................................................................................................0 ..............................................2,062,130Group sales .................................................................................................................................................35,561 ................................................................20,225 ........................................................................3,679 ........................................................(59,466) ..................................................................................................0Total sales ..................................................................................................................................1,204,291 .........................................................312,645 .........................................................604,660 ........................................................(59,466) ...............................................2,062,130EBITDA ..............................................................................................................................................................161,319 ................................................................57,542 ........................................................100,826 ........................................................(15,004) ........................................................304,683EBIT ........................................................................................................................................................................................84,392 ................................................................41,250 ................................................................56,817 ........................................................(17,626) ........................................................164,834Income from associates ..........................................................................................................68 ..................................................................................................0 ..................................................................................................0 ..................................................................................................0 ..........................................................................................68EBT ............................................................................................................................................................................................................................................................................................................................................................................................................................................................................................................................................................................................................................117,561Net income after tax ..........................................................................................................................................................................................................................................................................................................................................................................................................................................................................................................................................57,391Investments .................................................................................................................................................58,013 ........................................................................8,526 ................................................................35,516 ........................................................................3,406 ........................................................105,460Depreciation and amortization ..............................................76,927 ................................................................16,292 ................................................................44,010 ........................................................................2,621 ........................................................139,84912/31/2016Assets ............................................................................................................................................................1,035,578 ........................................................238,899 ........................................................616,826 ........................................................118,091 ..............................................2,009,394 thereof Goodwill ...........................................................................................171,973 ................................................................21,362 ........................................................149,457 ..................................................................................................0 ........................................................342,793 thereof Associates ..............................................................................................1,232 ..................................................................................................0 ..................................................................................................0 ..................................................................................................0 ........................................................................1,232Working capital ......................................................................................................................107,756 ................................................................15,099 ................................................................94,420 ................................................................14,309 ........................................................231,583Liabilities ........................................................................................................................................................402,014 ........................................................145,641 ........................................................227,803 ........................................................440,851 ..............................................1,216,309
2015 Food Pharma Labels Holding Constantia(in € thousand) Division Division Division consolidation Flexibles
1-12/2015Third-party sales ..................................................................................................1,085,440 ........................................................275,361 ........................................................537,859 ..................................................................................................0 ..............................................1,898,661Group sales .................................................................................................................................................42,094 ................................................................20,743 ........................................................................2,978 ........................................................(65,815) ..................................................................................................0Total sales ..............................................................................................................................1,127,534 .........................................................296,104 .........................................................540,837 ........................................................(65,815) ...............................................1,898,661EBITDA ..............................................................................................................................................................154,178 ................................................................48,697 ................................................................93,600 ........................................................(50,956) ........................................................245,520EBIT ........................................................................................................................................................................................87,508 ................................................................33,990 ................................................................54,203 ........................................................(53,270) ........................................................122,431Income from associates .................................................................................................................0 ..................................................................................................0 ..................................................................................................0 ..................................................................................................0 ..................................................................................................0EBT ....................................................................................................................................................................................................................................................................................................................................................................................................................................................................................................................................................................................................................................74,692Net income after tax ..........................................................................................................................................................................................................................................................................................................................................................................................................................................................................................................................................59,409Investments .................................................................................................................................................58,487 ........................................................................5,733 ................................................................31,928 ........................................................................3,177 ................................................................99,325Depreciation and amortization ..............................................66,669 ................................................................14,707 ................................................................39,398 ........................................................................2,314 ........................................................123,08912/31/2015Assets ......................................................................................................................................................................968,028 ........................................................172,393 ........................................................565,456 ........................................................141,471 ..............................................1,847,348 thereof Goodwill ...........................................................................................144,224 ........................................................................7,471 ........................................................128,858 ..................................................................................................0 ........................................................280,553 thereof Associates .......................................................................................................................0 ..................................................................................................0 ..................................................................................................0 ..................................................................................................0 ..................................................................................................0Working capital ......................................................................................................................124,205 ................................................................14,113 ................................................................82,900 ........................................................................8,125 ........................................................229,342Liabilities ........................................................................................................................................................335,989 ................................................................66,441 ........................................................211,030 ........................................................833,092 ..............................................1,446,552
66_Constantia Flexibles IFRS Consolidated Financial Statements 2016 / Notes to the Consolidated Financial Statements

Notes to the Consolidated Financial Statements / IFRS Consolidated Financial Statements 2016 Constantia Flexibles_67
2016 Austria Germany Rest of Central- und North and Africa, Constantia(in € thousand) Western Europe Eastern Europe South America Australia, Flexibles Asia, Oceania
1-12/2016: Sales by countries
................................................................................................................................36,900 ...................................296,181 ...................................738,483 ...................................178,019 ...................................492,287 ..................................320,260.........................2,062,13012/31/2016: Intangible and tangible assets
........................................................................................................................224,188 ...................................149,296 ...................................207,832 ..........................................42,443 ...................................166,327 ..................................121,314...................................911,401
2015 Austria Germany Rest of Central- und North and Africa, Constantia(in € thousand) Western Europe Eastern Europe South America Australia, Flexibles Asia, Oceania
1-12/2015: Sales by countries
................................................................................................................................30,199 ...................................309,900 ...................................715,019 ...................................182,136 ...................................500,461 ..................................160,946.........................1,898,66112/31/2015: Intangible and tangible assets
........................................................................................................................238,758 ...................................154,569 ...................................213,467 ..........................................47,221 ...................................201,799 ..........................................26,573...................................882,387
Reconciliation of information regarding reportable divisions to the consolidated values
(in € thousand) 2016 2015
Inventories .....................................................................................................................................................................................................................................................................................................................................................................................................................................................275,846 .............................................................................253,199 Trade receivables .................................................................................................................................................................................................................................................................................................................................................................................................................248,637 .............................................................................204,605Trade payables ......................................................................................................................................................................................................................................................................................................................................................................................................................(300,849) .....................................................................(237,378)Plus investment liabilities ......................................................................................................................................................................................................................................................................................................................................................................................7,949 .............................................................................................8,917Working capital ........................................................................................................................................................................................................................................................................................................................................................................................................................231,583 ..............................................................................229,342Thereof relating to: Food Division .....................................................................................................................................................................................................................................................................................................................................................................................................................107,756 .............................................................................124,205 Pharma Division ..............................................................................................................................................................................................................................................................................................................................................................................................................15,099 .....................................................................................14,113 Labels Division ....................................................................................................................................................................................................................................................................................................................................................................................................................94,420 .....................................................................................82,900 Holding Division ..............................................................................................................................................................................................................................................................................................................................................................................................................14,309 .............................................................................................8,125
Geographical informationA regional breakdown of sales by country (customer’s domicile) and of tangible and intangible assets (domicile of the company) is presented in the following tables.

I. Notes to the Consolidated Balance Sheet
1. Consolidated asset table
Change in acquisition cost
2016 As of Currency Additions Disposals Change in Change in Transfers As of(in € thousand) 1/1/2016 trans- the scope of the scope of 12/31/2016 lation consolidation consolidation difference Disposals Goodwill .............................................................................................280,553 ..................................11,919 ...........................51,848 ...........................................................0 ...........................................................0 .........................(1,528) ...........................................................0...................342,793 Customer lists ...........................................245,608 .........................................1,384 ............................................................0 ...........................................................0 .........................44,408 .................(24,829) ...........................................................0..................266,572 Software.................................................................................15,085 ...................................................(30) ..................................2,193 .........................(1,423) ...................................................54 ...........................................................0 .................................3,289..........................19,169 Own work capitalized .................................................................................5,257 ...........................................................47 ..................................2,352 ...........................................................0 ...........................................................0 ...........................................................0 ...........................................209..................................7,865 Other intangible assets .......................................................................................................6,000 ...................................................213 ..................................2,155 ...................................................(8) .................................4,637 ...........................................(54) .........................(2,993)..................................9,949Intangibleassets ..........................................................................................................271,949 ..........................................1,615 ...................................6,700 .........................(1,431) ..........................49,099 .................(24,883) ............................................505...................303,554 Land value ......................................................................41,968 ...........................................(393) .............................................174 ...................................................(1) ...........................................264 ...................................(951) ...................................(535)..........................40,526 Building value .............................................281,332 .........................................1,460 ..................................3,989 .........................(1,642) .................................6,489 .........................(1,974) .................................3,182..................292,836 Undeveloped land.......................................3,461 ...........................................................61 ............................................................0 ...........................................................0 ...........................................................0 ...........................................................0 ...........................................645..................................4,168 Technical plant and machinery ..........................................700,037 .........................................7,590 ...........................43,592 .................(13,416) .........................33,409 .................(12,859) .........................18,121..................776,473 Other equipment, fixtures and furnitures ..............................................................................74,680 ...................................................947 ..................................7,161 .........................(3,085) .................................1,462 ...................................(476) .................................2,850..........................83,539 Construction in progress .....................................................................15,004 ...................................................801 ...........................43,845 ...........................................................0 ...................................................26 .........................(3,432) .................(24,767)..........................31,476Tangible assets ........................................1,116,482 ..................................10,466 ...........................98,761 ..................(18,143) ..........................41,649 .................(19,691) ...................................(505).........1,229,019
68_Constantia Flexibles IFRS Consolidated Financial Statements 2016 / Notes to the Consolidated Financial Statements

Notes to the Consolidated Financial Statements / IFRS Consolidated Financial Statements 2016 Constantia Flexibles_69
2015 As of Currency Additions Disposals Change in Change in Transfers As of(in € thousand) 1/1/2015 trans- the scope of the scope of 12/31/2015 lation consolidation consolidation difference Disposals Goodwill .............................................................................................256,802 ..................................23,751 .............................................................0 ...........................................................0 ...........................................................0 ...........................................................0 ...........................................................0...................280,553 Customer lists ...........................................242,755 .........................................2,853 ............................................................0 ...........................................................0 ...........................................................0 ...........................................................0 ...........................................................0..................245,608 Software.................................................................................12,247 ...........................................................96 ..................................1,574 .........................(1,150) ...........................................................0 ...........................................................0 .................................2,319..........................15,085 Own work capitalized .................................................................................2,516 ...........................................................92 ..................................2,629 ...........................................................0 ...........................................................0 ...........................................................0 ...................................................20..................................5,257 Other intangible assets .......................................................................................................3,557 ...........................................................31 ..................................2,100 ...........................................(70) ...........................................................0 ...........................................................0 ...........................................382..................................6,000 Intangibleassets ..........................................................................................................261,075 ..........................................3,072 ...................................6,302 .........................(1,220) ...........................................................0 ...........................................................0 ..................................2,721...................271,949 Land value ......................................................................41,109 ...................................................858 ............................................................0 ...........................................................0 ...........................................................0 ...........................................................0 ...........................................................0..........................41,968 Building value .............................................260,508 .........................................4,069 ..................................5,818 ...................................(378) ...........................................................0 ...........................................................0 .........................11,315..................281,332 Undeveloped land.......................................3,330 ...................................................131 ............................................................0 ...........................................................0 ...........................................................0 ...........................................................0 ...........................................................0..................................3,461 Technical plant and machinery ..........................................626,509 .........................................7,440 ...........................30,654 .........................(5,477) ...........................................................0 ...........................................................0 .........................40,910..................700,037 Other equipment, fixtures and furnitures ..............................................................................63,609 .........................................1,171 ..................................9,718 .........................(2,728) ...........................................................0 ...........................................................0 .................................2,909..........................74,680 Construction in progress .....................................................................25,567 .........................................1,161 ...........................46,833 ...................................(701) ...........................................................0 ...........................................................0 .................(57,856)..........................15,004Tangible assets ........................................1,020,633 ..................................14,830 ...........................93,023 .........................(9,284) ...........................................................0 ...........................................................0 .........................(2,721).........1,116,482

Accumulated depreciation and amortization
2016 As of Currency Additions Disposals Change in Transfers As of(in € thousand) 1/1/2016 trans- the scope of 12/31/2016 lation consolidation difference Disposals Goodwill ..................................................................................................................................................................................................................0 ............................................................0 ...........................................................0 ...........................................................0 ...........................................................0 ...........................................................0............................................................0 Customer lists ........................................................................................................................135,233 ............................................422 ..........................29,393 ...........................................................0 .........................(6,345) ...........................................................0..................158,704 Software......................................................................................................................................................................8,828 ...................................................28 .................................3,328 ...................................(779) ...........................................................0 ...........................................692..........................12,097 Own work capitalized ..................................................................................................1,071 ...................................................30 .................................1,648 ...........................................................0 ...........................................................0 ...........................................................0..................................2,748 Other intangible assets .......................................................................................2,779 ...........................................................7 ...........................................876 ...................................................(7) ...........................................(53) ...................................(692)..................................2,909Intangible assets ......................................................................................................................147,911 ............................................486 ..........................35,244 ...................................(785) .........................(6,398) ...........................................................0...................176,459 Land value ....................................................................................................................................................................................0 ...........................................................0 ...........................................................0 ...........................................................0 ...........................................................0 ...........................................................0............................................................0 Building value ..................................................................................................................................54,586 ............................................140 ..........................15,150 .........................(1,347) ...................................(521) ...................................................(1)..........................68,008 Undeveloped land.............................................................................................................................................0 ...........................................................0 ...........................................................0 ...........................................................0 ...........................................................0 ...........................................................0............................................................0 Technical plant and machinery .......................................................................................................................263,340 .................................2,019 ..........................78,359 .................(11,206) .........................(4,321) ...........................................331..................328,522 Other equipment, fixtures and furnitures......................................................................................40,206 ............................................317 ..........................11,096 .........................(2,884) ...................................(223) ...................................(330)..........................48,182 Construction in progress ........................................................................................................0 ...........................................................0 ...........................................................0 ...........................................................0 ...........................................................0 ...........................................................0............................................................0Tangible assets ...............................................................................................................................358,133 ..................................2,477 ...................104,605 .................(15,436) .........................(5,065) ...........................................................0...................444,713
70_Constantia Flexibles IFRS Consolidated Financial Statements 2016 / Notes to the Consolidated Financial Statements

2015 As of Currency Additions Disposals Change in Transfers As of(in € thousand) 1/1/2015 trans- the scope of 12/31/2015 lation consolidation difference Disposals Goodwill ..................................................................................................................................................................................................................0 ............................................................0 ...........................................................0 ...........................................................0 ...........................................................0 ...........................................................0............................................................0 Customer lists ........................................................................................................................106,409 ............................................292 ..........................28,532 ...........................................................0 ...........................................................0 ...........................................................0..................135,233 Software......................................................................................................................................................................6,431 ...................................................18 .................................2,582 ...................................(183) ...........................................................0 ...........................................(21)..................................8,828 Own work capitalized ............................................................................................................216 ...........................................................2 ...........................................853 ...........................................................0 ...........................................................0 ...........................................................0..................................1,071 Other intangible assets .......................................................................................1,591 ...................................................13 .................................1,258 ...........................................(70) ...........................................................0 ...........................................(13)..................................2,779Intangible assets ......................................................................................................................114,648 ............................................326 ..........................33,225 ...................................(253) ...........................................................0 ...........................................(34)...................147,911 Land value ....................................................................................................................................................................................0 ...........................................................0 ...........................................................0 ...........................................................0 ...........................................................0 ...........................................................0............................................................0 Building value ..................................................................................................................................41,532 ............................................515 ..........................12,823 ...................................(278) ...........................................................0 ...................................................(6)..........................54,586 Undeveloped land.............................................................................................................................................0 ...........................................................0 ...........................................................0 ...........................................................0 ...........................................................0 ...........................................................0............................................................0 Technical plant and machinery .......................................................................................................................200,534 .................................1,227 ..........................66,699 .........................(5,005) ...........................................................0 ...................................(115)..................263,340 Other equipment, fixtures and furnitures......................................................................................31,932 ............................................407 ..........................10,342 .........................(2,630) ...........................................................0 ...........................................154..........................40,206 Construction in progress ........................................................................................................0 ...........................................................0 ...........................................................0 ...........................................................0 ...........................................................0 ...........................................................0............................................................0Tangible assets ...............................................................................................................................273,998 ..................................2,150 ..........................89,864 .........................(7,913) ...........................................................0 ....................................................34...................358,133
Notes to the Consolidated Financial Statements / IFRS Consolidated Financial Statements 2016 Constantia Flexibles_71

The following table shows the carrying amounts:
(in € thousand) Historical Accumulated Carrying Carrying cost depreciation value value and amortization 12/31/2016 12/31/2015 12/31/2016 12/31/2016 Goodwill ...........................................................................................................................................................................................................................................................................................................................................................342,793 ....................................................................0 ...........................342,793 ...........................280,553 Customer lists ..........................................................................................................................................................................................................................................................................................................266,572 ..........................158,704 ..........................107,868 ..........................110,374 Software................................................................................................................................................................................................................................................................................................................................................19,169 ..................................12,097 ..........................................7,072 ..........................................6,258 Own work capitalized ....................................................................................................................................................................................................................................................................................7,865 ..........................................2,748 ..........................................5,116 ..........................................4,186 Other intangible assets .........................................................................................................................................................................................................................................................................9,949 ..........................................2,909 ..........................................7,040 ..........................................3,220Intangible assets ........................................................................................................................................................................................................................................................................................................303,554 ............................176,459 ...........................127,096 ...........................124,038 Land value .....................................................................................................................................................................................................................................................................................................................................40,526 ....................................................................0 ..................................40,526 ..................................41,968 Building value ............................................................................................................................................................................................................................................................................................................292,836 ..................................68,008 ..........................224,828 ..........................226,746 Undeveloped land......................................................................................................................................................................................................................................................................................................4,168 ....................................................................0 ..........................................4,168 ..........................................3,461 Technical plant and machinery ...................................................................................................................................................................................................................776,473 ..........................328,522 ..........................447,951 ..........................436,697 Other equipment, fixtures and furnitures.....................................................................................................................................................................................................................................................................................................................83,539 ..................................48,182 ..................................35,357 ..................................34,474 Construction in progress .........................................................................................................................................................................................................................................................31,476 ....................................................................0 ..................................31,476 ..................................15,004Tangible assets .......................................................................................................................................................................................................................................................................................................1,229,019 ............................444,713 ...........................784,306 ...........................758,349
Finance leasesThe Group leases equipment under various finance lease agreements. Lease agreements do not contain restrictions on the Group’s activities concerning dividends, additional debt, or other lease agreements. Individual leases have renewal and bargain purchase options. Specifically, this involves the production buildings of Verstraete in mould labels N.V., Spear Europe Ltd., Spear USA Inc., Precision and Packaging Inc., Afripack Group, and the production
machinery of Spear Europe Ltd. and Constantia Oai Hung Manufacturing Joint Stock Company.
The underlying interest rate for finance leases is deter-mined for the entire term when the lease is entered into.
The carrying amounts of assets recognized as finance leases are as follows:
(in € thousand) 12/31/2016 12/31/2015
Land value..................................................................................................................................................................................................................................................................................................................................................................................................................................................................................................0 ...............................................................................................................97Building value ...............................................................................................................................................................................................................................................................................................................................................................................................................................................23,423 .....................................................................................19,454Technical plant and machinery ..............................................................................................................................................................................................................................................................................................................................................................4,845 .............................................................................................4,684Other equipment, fixtures and fittings ........................................................................................................................................................................................................................................................................................................................................18 .......................................................................................................................0...............................................................................................................................................................................................................................................................................................................................................................................................................................................................................................................................28,286 ......................................................................................24,235
72_Constantia Flexibles IFRS Consolidated Financial Statements 2016 / Notes to the Consolidated Financial Statements

Outstanding minimum lease payments at the reporting date were as follows:
(in € thousand) Minimum Present value Minimum Present value lease of minimum lease of minimum payment lease payment lease 2016 payment 2015 payment 2016 2015 Up to one year .............................................................................................................................................................................................................................................................................................................................................5,856 ..........................................3,445 ..........................................3,682 ..........................................1,985Over one and up to five years ....................................................................................................................................................................................................................................................18,403 ..................................10,361 ..................................11,594 ..........................................6,455Over five years.....................................................................................................................................................................................................................................................................................................................................29,613 ..................................23,756 ..................................25,746 ..................................20,171.........................................................................................................................................................................................................................................................................................................................................................................................................................53,872 ...................................37,562 ...................................41,022 ...................................28,611Less future finance costs ..................................................................................................................................................................................................................................................................(16,310) ......................................................................................................(12,411) ............................................................................
Less future finance costs ...............................................................................................................................................................................................................................................................37,562 ................................................................................................................28,611 ............................................................................
Operating leasesThe Group has entered into various operating lease agree-ments as the lessee for buildings, machinery, and office premises. Lease agreements do not contain restrictions
The operating lease obligations relate primarily to rent for buildings and offices.
Commitments related to capital expenditureObligations in the amount of €9,955 thousand (2015: €3,522 thousand) related to contracts already awarded for commenced or planned investment projects (purchase commitments).
on the Group’s activities concerning dividends, additional debt, or other lease agreements. Individual leases haverenewal options. The future minimum lease obligationsunder operating leases are as follows:
Restrictions on right of disposalOn December 31, 2016, tangible assets with a carrying amount of €10,489 thousand (2015: €4,254 thousand) were pledged to secure loans.
(in € thousand) 2016 2015
Up to one year ...........................................................................................................................................................................................................................................................................................................................................................................................................................................15,392 .....................................................................................12,836Over one and up to five years ..........................................................................................................................................................................................................................................................................................................................................................29,282 .....................................................................................29,147Over five years...................................................................................................................................................................................................................................................................................................................................................................................................................................................5,298 .............................................................................................4,114...............................................................................................................................................................................................................................................................................................................................................................................................................................................................................................................................49,972 ......................................................................................46,097
Notes to the Consolidated Financial Statements / IFRS Consolidated Financial Statements 2016 Constantia Flexibles_73

GoodwillGoodwill is allocated to the divisions as follows:
(in € thousand) 12/31/2016 12/31/2015
Food Division...........................................................................................................................................................................................................................................................................................................................................................................................................................................171,973 .............................................................................144,224Pharma Division ...................................................................................................................................................................................................................................................................................................................................................................................................................................21,362 .............................................................................................7,471Labels Division .................................................................................................................................................................................................................................................................................................................................................................................................................................149,457 .............................................................................128,858.......................................................................................................................................................................................................................................................................................................................................................................................................................................................................................................................342,793 ..............................................................................280,553
(in € thousand) 12/31/2016 12/31/2015
Balance at the beginning of period ....................................................................................................................................................................................................................................................................................................................280,553 .............................................................................256,802Foreign currency translation..................................................................................................................................................................................................................................................................................................................................................................11,919 .....................................................................................23,751Acquisition through business combinations ..............................................................................................................................................................................................................................................................................50,321 .......................................................................................................................0Balance at the end of period ........................................................................................................................................................................................................................................................................................................................................342,793 ..............................................................................280,553
Food Pharma Labels
Pre-tax discount rates ......................................................................................................................................................................................................................................................................13.2% .........................................................................................10.5% .........................................................................................11.8%
An annual goodwill impairment test is performed basedon the requirements of IFRS 3 in conjunction with IAS 36. This is done at the level of a group of cash-generating units (CGUs). In terms of goodwill, this group is basically the division. When testing for impairment, the total carrying amounts of the group of cash-generating units are com-pared with the recoverable amount. Recoverable amount is calculated by reference to value in use.
The expected cash flows are based on both a qualified planning process that considers internal corporate experi-ence and on economic data collected outside of theCompany. The detailed planning period covers one year.
Planning assumptions for two more years are considered in the medium-term plan at a high level. Following the de-tailed planning period, a growth rate of 1.5% is generally assumed. The discount rate is derived as the weightedaverage cost of capital (WACC), using the capital asset pricing model. The discount rates are determined assum-ing a base interest rate of 1.4% and a market risk premi-um of 6.5%. Country-specific risk premiums are applied on the basis of ratings for each country to both the costof equity and the cost of debt. The individual pre-tax discount rates determined for each group of CGUs are as follows:
74_Constantia Flexibles IFRS Consolidated Financial Statements 2016 / Notes to the Consolidated Financial Statements

The mandatory annual impairment test confirmed the re-coverability of all recognized goodwill as of December 31, 2016.
In addition to the impairment test for each group of cash- generating units, three sensitivity analyses were conduct-ed. In the first sensitivity analysis, a growth rate reduced by 1.5 percentage points was assumed. In the second sensitivity analysis, the discount rate was increased by 2.0 percentage points for each group of cash-generating
There is no quoted price for the shares because the com-panies are not listed on a stock exchange. There were no
units. In the third sensitivity analysis, a discount of 2.0 percentage points on the EBITDA assumed in the perpet-ual annuity was charged. These changes in the underlying assumptions would not result in the impairment of any of the groups of cash-generating units.
2. Investments in associatesThe following associates were acquired in connection with the acquisition of the Afripack Group and included in the scope of consolidation using the equity method:
contingent liabilities with respect to associates as of the end of the reporting period.
Name Registered Direct Nature of relationship office ownership interest1
Dilpack Kenya Ltd. ...........................................................................................................Nairobi, Kenya .............................................50.0%...............................................Dilpack Kenya produces and supplies flexible packaging for the African market. Dilpack offers solutions for marketing African flower products on the European market. Mapflex International Ltd. ......................................................................Port Louis, ...................................................................33.3%...............................................Mapflex produces and trades flexible Mauritius packaging for fresh vegetables.Mapflex SA Pty. Ltd.....................................................................................................Muizenberg, .......................................................35.0%...............................................Mapflex offers innovative packaging materials South Africa and methods for improving the standard packaging of wholesalers.
1 The ownership interest corresponds to the voting rights.
(in € thousand) 2016
Carrying value 1/1/2016 ...............................................................................................................................................................................................................................................................................................................................................................................................................................................................................................................................................0 Additions ...........................................................................................................................................................................................................................................................................................................................................................................................................................................................................................................................................................................................1,148 Foreign currency translation .............................................................................................................................................................................................................................................................................................................................................................................................................................................................................................139 Proportional result ...........................................................................................................................................................................................................................................................................................................................................................................................................................................................................................................................................................68 Disposals ...........................................................................................................................................................................................................................................................................................................................................................................................................................................................................................................................................................................................(123)Carrying value 12/31/2016 ................................................................................................................................................................................................................................................................................................................................................................................................................................................................................................1,232
Notes to the Consolidated Financial Statements / IFRS Consolidated Financial Statements 2016 Constantia Flexibles_75

The securities mainly comprise shares in the CEE Stock Exchange Group (CEESEG) amounting to €2,257 thousand (2015: €2,257 thousand).
The loans mainly refer to a deposit at a bank.
The items reported as investments relate to the non- consolidated investment in Constantia San Prospero S.r.l., Italy (€6,772 thousand) (2015: the non-consolidated investments in the Afripack Group of €44,038 thousand and the Pemara Group of €28,869 thousand). Details of acquisitions are described in Section D, Acquisitions and Other Changes in the Scope of Consolidation.
The miscellaneous other assets mainly comprise insurance assets of €1,096 thousand (2015: €1,052 thousand) for pensions that do not meet the criteria to be offset as plan assets against pension provisions in accordance with IAS 19, and contingent consideration from the sale of Aluprint Plegadizos S de R.L. de C.V. amounting to €6,878 thou-sand (see Section D). The capitalized surrender valuesof pension liability insurances disclosed in the previous year (2015: €2,715 thousand) were reclassified toother receivables.
3. Other non-current assets and financial assets
(in € thousand) 12/31/2016 12/31/2015
Securities ..............................................................................................................................................................................................................................................................................................................................................................................................................................................................................3,711 .............................................................................................3,711Non-current derivative financial instruments ............................................................................................................................................................................................................................................................................................675 ...............................................................................................................73Loans ...........................................................................................................................................................................................................................................................................................................................................................................................................................................................................................13,352 .....................................................................................14,352Investments ..................................................................................................................................................................................................................................................................................................................................................................................................................................................................6,924 .....................................................................................73,057Non-current loan and lease receivables ...........................................................................................................................................................................................................................................................................................................1,077 .............................................................................................1,245Prepayments on intangible and tangible assets.................................................................................................................................................................................................................................................................7,752 .............................................................................................5,036Miscellaneous other assets..............................................................................................................................................................................................................................................................................................................................................................................8,660 .............................................................................................4,202...............................................................................................................................................................................................................................................................................................................................................................................................................................................................................................................................42,151 ..............................................................................101,676
The investment in Dilpack SA Ltd. Pty. was sold in the reporting period. The loss on deconsolidation is calculatedas follows:
(in € thousand) 2016
Sale proceeds.......................................................................................................................................................................................................................................................................................................................................................................................................................................................................................................................................................................................................48Investment book value .........................................................................................................................................................................................................................................................................................................................................................................................................................................................................................................................................(123)Loss from disposals of associated companies ......................................................................................................................................................................................................................................................................................................................................................................................(75)
76_Constantia Flexibles IFRS Consolidated Financial Statements 2016 / Notes to the Consolidated Financial Statements

4. Inventories
(in € thousand) 12/31/2016 12/31/2015
Raw materials and supplies .....................................................................................................................................................................................................................................................................................................................................................................88,414 .....................................................................................78,931Semi-finished products ............................................................................................................................................................................................................................................................................................................................................................................................84,853 .....................................................................................77,913Finished goods, merchandise ...................................................................................................................................................................................................................................................................................................................................................102,579 .....................................................................................96,355Net realizable value (reduced by allowances) .....................................................................................................................................................................................................................................275,846 ..............................................................................253,199
Allowance inventories ...................................................................................................................................................................................................................................................................................................................................................................................................(6,453) .....................................................................................(5,549)
5. Trade receivables
(in € thousand) 12/31/2016 12/31/2015
Receivables not due ..........................................................................................................................................................................................................................................................................................................................................................................................208,500 ..............................................................................166,151Overdue receivablesDue less than 30 days ................................................................................................................................................................................................................................................................................................................................................................................................23,662 .....................................................................................19,500Due more than 30 days but less than 60 days ......................................................................................................................................................................................................................................................................8,539 .............................................................................................6,858Due more than 60 days but less than 90 days ......................................................................................................................................................................................................................................................................3,048 .............................................................................................3,655Due more than 90 days but less than 180 days ..............................................................................................................................................................................................................................................................3,060 .............................................................................................4,900Due more than 180 days ..........................................................................................................................................................................................................................................................................................................................................................................................6,718 .....................................................................................10,289Allowance for doubtful debt ..................................................................................................................................................................................................................................................................................................................................................................(4,890) .....................................................................................(6,747)Total .........................................................................................................................................................................................................................................................................................................................................................................................................................................................................................248,637 ..............................................................................204,605
(in € thousand) 12/31/2016 12/31/2016 12/31/2015 12/31/2015 Non-impaired Impaired Non-impaired Impaired
Receivables not due ...........................................................................................................................................................................................................................................................208,472 .....................................................................28 ....................................166,081.....................................................................70Overdue receivablesDue less than 30 days ................................................................................................................................................................................................................................................................23,602 ....................................................................60 ..........................................19,479.....................................................................21Due more than 30 days but less than 60 days ......................................................................................................................................8,373 ............................................................166 ..................................................6,808.....................................................................50Due more than 60 days but less than 90 days ......................................................................................................................................2,766 ............................................................282 ..................................................3,541.............................................................113Due more than 90 days but less than 180 days ..............................................................................................................................2,404 ............................................................657 ..................................................3,613...................................................1,287Due more than 180 days ..........................................................................................................................................................................................................................................................3,020 ..................................................3,697 ..................................................5,084...................................................5,205Total ..........................................................................................................................................................................................................................................................................................................................................................248,637 ...................................................4,890 ....................................204,605....................................................6,747
Notes to the Consolidated Financial Statements / IFRS Consolidated Financial Statements 2016 Constantia Flexibles_77

6. Other receivables
(in € thousand) 12/31/2016 12/31/2015
Derivative financial instruments .......................................................................................................................................................................................................................................................................................................................................................5,043 .............................................................................................1,380Accruals .....................................................................................................................................................................................................................................................................................................................................................................................................................................................................................3,882 .............................................................................................3,210Other tax receivables .......................................................................................................................................................................................................................................................................................................................................................................................................16,756 .....................................................................................13,132Prepayments ............................................................................................................................................................................................................................................................................................................................................................................................................................................................1,799 .............................................................................................1,164Current loan receivables ..............................................................................................................................................................................................................................................................................................................................................................................................2,754 .............................................................................................2,753Miscellaneous receivables............................................................................................................................................................................................................................................................................................................................................................................16,774 .....................................................................................24,587...............................................................................................................................................................................................................................................................................................................................................................................................................................................................................................................................47,008 ......................................................................................46,226
In fiscal year 2016, receivables were sold to a financialinstitution by certain German, Austrian, Spanish, French, American, Polish, and Malaysian companies of the Constantia Flexibles Group. The sale also transferred the default risk from the Constantia Flexibles Group to the financial institution. The balance of transferred receivables at the reporting date was €134,810 thousand (2015: €135,684). The transferred receivables were recognized in accordance with IAS 39. The Constantia Flexibles Group has no further involvement in the trade receivables transferred to the financial institution.
The assessment of credit quality is based on the internal rating guidelines of Constantia Flexibles Group GmbH. Credit insurances were taken out with various insurance companies for a significant part of trade receivables. These insurance policies provide for a deductible in the event of a claim. For such receivables, the deductible is the maximum value adjusted, depending on the assess-ment of local management.
Derivatives used to hedge commodity prices amount to €4,395 thousand (2015: €188 thousand). Derivatives used to hedge currencies amount to €648 thousand (2015: €1,192 thousand).
The miscellaneous receivables relate mainly to receivables from CP Group Holding BV, Netherlands, amounting to €1,048 thousand (2015: €3,548 thousand), financialreceivables from Constantia San Prospero S.r.l. (€1,528 thousand), capitalized surrender values of pension liability
insurances of €2,812 thousand (presented in “Other non-current assets and financial assets” in the previous year), an investment of €2,000 thousand (2015: non- consolidated financial receivables from the Afripack and Pemara Groups of €13,433 thousand), receivables arising from the energy tax rebate amounting to €893 thousand (2015: €1,145 thousand), receivables from employees of €1,217 thousand (2015: €924 thousand), and receivables from insurers of €2,490 thousand in the Afripack Group.
78_Constantia Flexibles IFRS Consolidated Financial Statements 2016 / Notes to the Consolidated Financial Statements

7. EquityChanges in equity are presented in a separate statement (Consolidated Statement of Changes in Equity).
Share capitalConstantia Flexibles Group GmbH has share capital amounting to €35 thousand.
Capital reserveThe increase in the capital reserve by €2,398 thousand in fiscal year 2015 resulted from the recognition of share-based payment transactions. A description of the under-lying long-term incentive plan (Company Value Growth Plan) can be found under Note 3 in Section J, Notes to the Consolidated Income Statement.
Hedging reserveThe hedging reserve comprises the effective portion of the cumulative net changes in the fair value of hedging instruments used to hedge cash flows until the subse-quent realization of the hedged cash flows in profit or loss.
Available-for-sale reserveThe reserve for changes in fair value includes the cumu-lative net change in the fair value of available-for-sale financial assets until the derecognition or impairment of the assets.
Currency translation reservesThe currency translation reserve in the amount of €42,916 thousand (2015: €23,650 thousand) comprises the ex-change rate differences (translation effect) arising from the translation of the financial statements of foreign operations amounting to €44,739 thousand (2015: €34,501 thousand) and translation differences from monetary items of (€1,823) thousand (2015: (€10,851) thousand) that are part of a net investment in a foreign operation.
Retained earningsRetained earnings include the accumulated results within the Group.
By way of a shareholder resolution of Constantia Flexibles Beteiligungs GmbH, as the sole shareholder of Constantia Flexibles Group GmbH, dated March 1, 2016, the Com- pany was authorized to issue a capital participation right (Substanzgenussrecht) in the nominal amount of €416,000 thousand. With the signing of the participation
right agreement dated March 1, 2016, previously received shareholder loans were converted into a participation right in Constantia Flexibles Group GmbH in the same amount. That reduced the amount of non-current financial liabilities of Constantia Flexibles Group GmbH by €416,000 thou-sand and increased retained earnings in the same amount.
The participation rights outstanding are presented in equi-ty in accordance with the requirements of IAS 32.16. The sole holder of the participation right is Constantia Flexibles Holding GmbH, which acquired interests in the profit and assets of Constantia Flexibles Group GmbH when it sub-scribed to the participation right. The holders of partici-pation rights have no ordinary or extraordinary redemption right and have provided the capital to the issuer for an indefinite period. A redemption right was granted to the issuer only so that the issuer has disposal rights over the capital provided. Moreover, the participation right must be allocated to the most subordinate class.
During the course of the acquisition of the shares in the Afripack Group and Oai Hung Manufacturing Joint Stock Company, the non-controlling interest shareholders were granted the right to sell the remaining shares to the Con-stantia Flexibles Group. The present values of the call/put options were determined at the date of first consolidation (Afripack €12,775 thousand, Oai Hung €35,953 thousand) and reported in non-current liabilities in the consolidated balance sheet. The present value of the liabilities from the call/put options was deducted from the non-controlling interests (Afripack €2,692 thousand, Oai Hung €14,186 thousand) – measured based on the proportionate share of net assets – and the remaining amounts were recog-nized as a reduction in equity (Afripack €10,083 thousand, Oai Hung €21,767 thousand).
The remaining non-controlling interest (30%) in Constantia Aloform GmbH, Germany, was acquired in April 2016 for €2,600 thousand. The €529 thousand difference between the purchase price and the carrying amount of the non-controlling interest as of the acquisition date was recognized as a decrease in retained earnings.
The remaining non-controlling interest (30%) in Constantia CM Labels SDN, BHD, Malaysia, was acquired in Septem-ber 2016 for €2,450 thousand. The €1,303 thousand difference between the purchase price and the carrying amount of the non-controlling interest as of the acquisition date was recognized as a decrease in retained earnings.
Notes to the Consolidated Financial Statements / IFRS Consolidated Financial Statements 2016 Constantia Flexibles_79

NON-CONTROLLING INTERESTS % % Result T€ Result T€ Balance T€ Balance T€ 2016 2015 2016 2015 2016 2015
Verstraete in mould labels N.V. (Belgium) ...........................................49.0..................................................49.0 ..........................................8,506 ..........................................8,644 ..........................................5,014 ....................................................878 Parikh Packaging Pvt. Ltd. (India) ....................................................25.0–40.0..................................................40.0 ....................................................225 ....................................................555 ....................................................764 ..........................................1,109 Spearsystem Packaging (Africa)(Pty) Ltd. (South Africa) ..........................................................................................................................................25.1..................................................25.1 ................................. (1,372) ............................................(340) .................................(7,132) ..................................(6,793)Afripack Group (South Africa) .................................................................................5.0-49.0..........................................................0.0 ............................................................16 ....................................................................0 ....................................................451 ....................................................................0Constantia Oai Hung Manufacturing Joint Stock (Vietnam) ..................................................................49.0..........................................................0.0 ..........................................1,390 ....................................................................0 ..........................................1,920 ....................................................................0Constantia CM Labels SDN BHD (Malaysia) ..............................0.0..................................................30.0 ....................................................146 ....................................................252 ...................................................................0 ..........................................1,094Constantia Aloform GmbH (Germany)....................................................................0.0..................................................30.0 ...................................................(15) ....................................................282 ...................................................................0 ..........................................2,094Other .................................................................................................................................................................................................................................................................................................................................................................................................................(1) ............................................(187) ...................................................................2 ....................................................................2................................................................................................................................................................................................................................................................................................................................................................................................................................8,895 ...........................................9,206 ..........................................1,018 ..................................(1,615)
A further 15% of the shares in Parikh Packaging Pvt. Ltd. were acquired in October 2016 for €4,734 thousand. The put option liability was revalued at the date of acquisition. This resulted in an expense of €4,734 thousand, which was recognized in other financial income and expense. The reclassification of the non-controlling interests ac-quired increased Group equity by €530 thousand.
The reclassification to Group equity of non-controlling interests that had become negative due to a dividend payment by Verstraete in mould labels N.V. resulted in a decrease in retained earnings of €1,099 thousand.
The decrease in hybrid capital in the previous year re-sulted from the voluntary repayment of a hybrid bond in the amount of €150,000 thousand that was issued by Constantia Flexibles Group GmbH in 2013. Deferred transaction costs from the issuance of the bond in the amount of €1,837 thousand were reclassified to retained earnings.
Non-controlling interestThe table below shows the summarized financial infor-mation before intercompany eliminations for those Group entities with significant non-controlling interests.
80_Constantia Flexibles IFRS Consolidated Financial Statements 2016 / Notes to the Consolidated Financial Statements

2016 Verstraete in Parikh Spearsystem Afripack Constantia(in € thousand) mould labels N.V. Packaging Packaging Group Oai Hung Pvt. Ltd. (Pty) Ltd. Manufac- (Africa) turing Joint Stock Company
Non-current assets ..............................................................................................................................................................................................52,679 ..........................................21,039 ..................................................4,465 ..........................................36,441...........................................46,042 Current assets........................................................................................................................................................................................................................31,259 ..........................................11,527 ..........................................15,139 ..........................................49,323...................................................8,096 Non-current liabilities ..................................................................................................................................................................................15,810 ..................................................5,780 ............................................................................0 ..........................................25,214...................................................8,028 Current liabilities ............................................................................................................................................................................................................12,722 ..........................................12,287 ..........................................48,019 ..........................................59,185...........................................13,242 Equity attributableto owners of the company ........................................................................................................................................................28,269 ..........................................10,875 ..................................(21,283) ..........................................(1,778)...........................................16,763 Non-controlling interests ...............................................................................................................................................................27,137 ..................................................3,625 ..........................................(7,132) ..................................................3,143...........................................16,105 Effect of initial recognitionof put options liabilities ................................................................................................................................................................(22,123) ..........................................(2,861) ...............................................................................................................................(2,692)...................................(14,186)Non-controlling interestsincluding put options ................................................................................................................................................................................5,014 .............................................................764 ..........................................(7,132) .............................................................451....................................................1,920
Income .........................................................................................................................................................................................................................................................120,763 ..........................................33,751 ..........................................22,907 ..................................109,203...........................................15,043 Expenses ..................................................................................................................................................................................................................................(103,395) ..................................(33,580) ..................................(28,371) ..........................(110,669)...................................(12,206)Net income after tax .............................................................................................................................................................................17,367 .............................................................171 ..........................................(5,465) ..........................................(1,466)....................................................2,837
Attributable to equity holders of the parent ....................................................................8,861 ............................................................(54) ..........................................(4,093) ..........................................(1,482)...................................................1,447 Attributable to non-controlling interests ......................................................................................8,506 ............................................................225 ..........................................(1,372) ....................................................................16...................................................1,390 Net income after tax .............................................................................................................................................................................17,367 .............................................................171 ..........................................(5,465) ..........................................(1,466)....................................................2,837
Other comprehensive income,attributable to shareholders .................................................................................................................................................................(24) ............................................................213 ..................................................3,081 ....................................................(655).............................................................551 Other comprehensive income,non-controlling interests ...................................................................................................................................................................................(23) ....................................................(103) ..................................................1,033 ............................................................162.............................................................529 Other comprehensive income .....................................................................................................................................(47) .............................................................110 ...................................................4,114 ....................................................(493)....................................................1,080 Total comprehensive income,attributable to shareholders .......................................................................................................................................................8,837 ............................................................159 ..........................................(1,012) ..........................................(2,137)...................................................1,998 Total comprehensive income,non-controlling interests .........................................................................................................................................................................8,483 ............................................................122 ....................................................(339) ............................................................178...................................................1,920 Total comprehensive income..........................................................................................................................17,320 .............................................................281 ..........................................(1,351) ..........................................(1,959)....................................................3,917
Dividend payments to non-controlling interests .............................................5,446 ............................................................................0 ............................................................................0 ............................................................................0.............................................................................0
Cash flow from operating activities ........................................................................................................27,623 ............................................................926 ..................................................2,463 ............................................................197...................................................4,675 Cash flow from investing activities ...................................................................................................(12,148) ..........................................(2,810) ....................................................(559) ..........................................(4,722).....................................................(306)Cash flow from financing activities .........................................................................................................(6,852) ..................................................1,916 ..........................................(1,339) ..................................................3,885...........................................(4,267)Changes in cash and cash equivalents .....................................................................8,623 .....................................................................33 .............................................................565 ....................................................(641)..............................................................102
Notes to the Consolidated Financial Statements / IFRS Consolidated Financial Statements 2016 Constantia Flexibles_81

2015 Verstraete in Parikh Packaging Spearsystem(in € thousand) mould labels N.V. Pvt. Ltd. Packaging (Africa) (Pty) Ltd.
Non-current assets .............................................................................................................................................................................................................................................................................................................................53,540 ................................................................20,058 ........................................................................4,281Current assets.......................................................................................................................................................................................................................................................................................................................................................24,788 ................................................................11,068 ................................................................10,628 Non-current liabilities .................................................................................................................................................................................................................................................................................................................16,686 ........................................................................6,988 ..................................................................................................0Current liabilities ...........................................................................................................................................................................................................................................................................................................................................12,437 ........................................................................9,921 ................................................................41,973 Equity attributable to owners of the company ...............................................................................................................................................................................25,104 ........................................................................8,531 ........................................................(20,271)Non-controlling interests ..............................................................................................................................................................................................................................................................................................24,101 ........................................................................5,687 ................................................................(6,793)Effect of initial recognitionof put options liabilities ................................................................................................................................................................................................................................................................................................(23,221) ................................................................(4,578) ..................................................................................................0Non-controlling interestsincluding put options ..........................................................................................................................................................................................................................................................................................................................879 ........................................................................1,109 ................................................................(6,793)
Income ........................................................................................................................................................................................................................................................................................................................................................................................117,322 ................................................................36,151 ................................................................16,595Expenses ..........................................................................................................................................................................................................................................................................................................................................................................(99,674) ........................................................(34,763) ........................................................(17,950)Net income after tax .............................................................................................................................................................................................................................................................................................................17,648 ........................................................................1,388 ................................................................(1,355)
Attributable to equity holders of the parent ....................................................................................................................................................................................................9,004 ..................................................................................833 ................................................................(1,015)Attributable to non-controlling interests ......................................................................................................................................................................................................................8,644 ..................................................................................555 ..........................................................................(340)Net income after tax .............................................................................................................................................................................................................................................................................................................17,648 ........................................................................1,388 ................................................................(1,355)
Other comprehensive income, attributable to shareholders .........................................................................................................................................................................................................................................................................................................40 ..................................................................................463 ................................................................(2,724)Other comprehensive income,non-controlling interests ...........................................................................................................................................................................................................................................................................................................................39 ..................................................................................309 ..........................................................................(913)Other comprehensive income .............................................................................................................................................................................................................................................................................79 ...................................................................................771 ................................................................(3,636) Total comprehensive income,attributable to shareholders .......................................................................................................................................................................................................................................................................................9,044 ........................................................................1,296 ................................................................(3,738)Total comprehensive income,non-controlling interests .........................................................................................................................................................................................................................................................................................................8,683 ..................................................................................864 ................................................................(1,253)Total comprehensive income..........................................................................................................................................................................................................................................................17,727 ........................................................................2,159 ................................................................(4,991)
Dividend payments to non-controlling interests .............................................................................................................................................................................9,355 ..................................................................................................0 ..................................................................................................0
Cash flow from operating activities .......................................................................................................................................................................................................................................32,735 ........................................................................2,836 ........................................................................6,396Cash flow from investing activities ...................................................................................................................................................................................................................................(13,013) ................................................................(3,470) ..........................................................................(974)Cash flow from financing activities .................................................................................................................................................................................................................................(18,462) ..................................................................................126 ................................................................(5,101)Changes in cash and cash equivalents ....................................................................................................................................................................................................1,260 ..........................................................................(507) ...................................................................................321
82_Constantia Flexibles IFRS Consolidated Financial Statements 2016 / Notes to the Consolidated Financial Statements

8. Provisions
In fiscal year 2016, the breakdown of maturities (longand short term) was performed for IAS 19 provisions(severance pay, pensions, and anniversary bonuses).
Non-current provisions1. Provision for severance payments: The provision for severance compensation mainly relates to provisions for termination benefits in Austria (93%) and Turkey (5%).
Austria: Based on Austrian labor law obligations, employ-ees whose employment began before December 31, 2002, receive one-time severance compensation in the case of termination by their employer or when they reach pensionable age. The amount of this payment depends on the number of years of service and earnings at the time of severance. Among other things, the severance payment obligations in Austria are subject to final com-
pensation and are therefore mainly dependent on com-pensation changes and fluctuation (with or without claim).
There is no direct claim for a statutory severance payment against the employer for any employment relationships in Austria that began after December 31, 2002. For these employment contracts, the employer pays 1.53% of the gross salary into an employee pension fund monthly. Con-tributions are invested in the employee’s account. In the case of this severance model, the employer is only obliged to make regular contributions, which are recognized in the income statement for the period.
Turkey: According to Turkish labor law, employees are entitled to severance payment in the case of termination by the employer or upon retirement.
Notes to the Consolidated Financial Statements / IFRS Consolidated Financial Statements 2016 Constantia Flexibles_83
(in € thousand) 12/31/2016 12/31/2016 12/31/2016 12/31/2015 12/31/2015 12/31/2015 Non-current Non-current Total Non-current Current Total
Severance payments ..........................................................................................................................................35,967.....................................................283 ...................................36,250 ..................................35,630 ....................................................386 ...................................36,016
Pensions............................................................................................................................................................................................................18,420.....................................................774 ...................................19,194 ..................................16,892 ....................................................760 ...................................17,652Anniversary bonuses ..................................................................................................................................................7,457.....................................................519 ..........................................7,976 ..........................................6,947 ....................................................537 ...........................................7,484Warranty provisions....................................................................................................................................................................................0..........................................2,040 ..........................................2,040 ....................................................................0 ..........................................1,288 ...........................................1,288
Other provisions............................................................................................................................................................................1,117...................................54,686 ...................................55,803 ..........................................4,253 ..................................56,072 ...................................60,325................................................................................................................................................................................................................................................................62,961...................................58,302 ...........................121,263 ...................................63,722 ...................................59,043 ...........................122,765

In fiscal year 2017, the Constantia Flexibles Group expects severance payments of €946 thousand (previous year: €1,377 thousand).
Adjustments for salary increases and discount rates are effected by country.
Salary increase 2016:• 3.50% (Constantia Patz)• 3.00% (EU, except Constantia Patz)• 5.50% (Mexico)• 6.00% (Turkey)
The most important actuarial assumptions applied at the reporting date are as follows:
Discount rate 2016:• 1.10% (Austria)• 1.60% (Italy)• 6.75% (Mexico)• 9.80% (Turkey)
In terms of the biometric parameters, mortality probabili-ties in accordance with AVÖ 2008 by Pagler & Pagler
The amount due under the Company’s commitment, as reported in the consolidated balance sheet, is as follows:
2016 2015
Salary increase ...............................................................................................................................................................................................................................................................................................................................................................................................3.00%–7.00% ............................................3.00%–6.50%Discount rates ...................................................................................................................................................................................................................................................................................................................................................................................................1.10%–9.80% ....................................2.10%–10.10%
84_Constantia Flexibles IFRS Consolidated Financial Statements 2016 / Notes to the Consolidated Financial Statements
(in € thousand) 2016 2015
Present value of obligations as of January 1 ........................................................................................................................................................................................................................................................................36,016 .....................................................................................36,836Adjustments previous year ...........................................................................................................................................................................................................................................................................................................................................................................................................0 ...............................................................................................(355)Reclassification ...............................................................................................................................................................................................................................................................................................................................................................................................................................................(181) ...............................................................................................(142)Change in the scope of consolidation...............................................................................................................................................................................................................................................................................................................................................0 .......................................................................................................386...............................................................................................................................................................................................................................................................................................................................................................................................................................................................................................................................35,835 ......................................................................................36,725(Gain)/loss from currency translation differences ......................................................................................................................................................................................................................................................................(4) ...............................................................................................(228)Current service cost ...............................................................................................................................................................................................................................................................................................................................................................................................................................966 .............................................................................................1,044Interest expense...................................................................................................................................................................................................................................................................................................................................................................................................................................................721 .......................................................................................................858Use of provision for severance payments made ......................................................................................................................................................................................................................................................(2,428) .....................................................................................(1,208)Past service cost, (Gains)/losses from compensation .................................................................................................................................................................................................................................................11 ...............................................................................................................24Actuarial (gains)/losses (demographic assumption) .................................................................................................................................................................................................................................................................0 .......................................................................................................................0Actuarial (gains)/losses (financial assumption) ..................................................................................................................................................................................................................................................................3,465 .....................................................................................(1,002)Actuarial (gains)/losses (experience adjustments).......................................................................................................................................................................................................................................(2,316) ...............................................................................................(198)Present value of obligations as of December 31 ...........................................................................................................................................................................................................................36,250 ......................................................................................36,016
Number of employees (for severance obligation) ........................................................................................................................................................................................................................................................1,676 .............................................................................................2,160

“Salaried employees” (Austria) or EVK 00 (Turkey) are used. Phased employee turnover probabilities (Austria, Turkey) that are dependent on the years of service are used. The weighted average remaining duration for termination benefits is 11.1 years.
Duration was determined using probabilities of exit (death, disability, fluctuation), weighted by the amount of cash flows.
Sensitivity analysis: Provided that the other assumptions are constant, the possible changes that can be reasonably anticipated in one of the significant actuarial assumptions at the reporting date would have affected the defined benefit obligation by the following amounts: change of +/– 0.25 percentage points in each case:
2. Provisions for pensions: Based on works agreements and contracts, there are commitments to pay pensions to (former) employees after their retirement. These defined benefit obligations are partially offset by qualifying insur-ance policies.
The pension obligations of the Austrian companies(Constantia Teich GmbH, Constantia Flexibles Group GmbH) are defined benefit plans. The pension payments of all beneficiaries are insured.
There is a general pension plan at Constantia HueckFolien GmbH & Co. KG (Germany) (15-year waiting period, depending on years of service, independent of salary)for old age, disability, and widows’ pensions. There arealso individual commitments with fixed monthly pension amounts for retirement, disability, and survivors’ pensions, and pension plans for executives (old age and survivors’ pensions; generally defined contribution plans, but withannual calculation of the pension entitlement under the
pension liability insurance policy; capital preservationduring the benefit phase).
Pension obligations were partially covered by pension lia-bility insurances with insurance companies (risk transfer). The plan assets are dependent on the proceeds from the insurance, but there is a minimum guaranteed interest rate (limited investment risk). The pension liability insurances have matching maturities.
The counterparty risk for the companies is estimatedas low (Group), with the risk being insignificant for theinsurance companies in Austria and Germany.
Net interest expenses from the unwinding of the discount on non-current employee benefits and the return on plan assets are recognized in net financial income and expense.
The calculation of pension obligations is based on actuarial reports for the December 31, 2016, reporting date.
Notes to the Consolidated Financial Statements / IFRS Consolidated Financial Statements 2016 Constantia Flexibles_85
(in € thousand) Increase Decrease Discount rate Discount rate
Impact on actuarial (gains)/losses ...............................................................................................................................................................................................................................................................................................(971) .................................................................................................................................................923Impact on the defined benefit obligation ..............................................................................................................................................................................................................................................................(971) .................................................................................................................................................923
(in € thousand) Increase Decrease Discount rate Discount rate
Impact on actuarial (gains)/losses .......................................................................................................................................................................................................................................................................................................863 .........................................................................................................................................(919)Impact on the defined benefit obligation ......................................................................................................................................................................................................................................................................863 .........................................................................................................................................(919)

The amount stated in the consolidated balance sheet is calculated as follows:
86_Constantia Flexibles IFRS Consolidated Financial Statements 2016 / Notes to the Consolidated Financial Statements
2016 (in € thousand) Funded Unfunded Total
Present value of obligations as of January 1 ...........................................................................................................................................................................................6,296 ................................................................16,809 ................................................................23,105Change in the scope of consolidation...................................................................................................................................................................................................................................(249) ..................................................................................................0 ..........................................................................(249).................................................................................................................................................................................................................................................................................................................................................................................................................................................6,047 .................................................................16,809 .................................................................22,856(Gain)/loss on currency translation differences ......................................................................................................................................................................................................0 ..................................................................................189 ..................................................................................189Current service cost (employer and employees) ...................................................................................................................................................................................101 ..................................................................................176 ..................................................................................277Interest expense..............................................................................................................................................................................................................................................................................................................................................................138 ..................................................................................446 ..................................................................................584Use of provision for pension payments made..........................................................................................................................................................................................(434) ..........................................................................(526) ..........................................................................(960)Past service cost, (gains)/losses from compensations Actuarial (gains)/losses (financial assumption) ...............................................................................................................................................................................(311) ..........................................................................(235) ..........................................................................(546)Actuarial (gains)/losses (financial assumption) .......................................................................................................................................................................................816 ........................................................................2,839 ........................................................................3,655Actuarial (gains)/losses (experience adjustments).....................................................................................................................................................................284 ................................................................(1,247) ..........................................................................(963)Present value of obligations as of December 31 .............................................................................................................................................6,641 .................................................................18,451 .................................................................25,092 2016 (in € thousand) Funded Unfunded Total
Fair value of plan assets as of January 1 ...............................................................................................................................................................................................................5,453 ..................................................................................................0 ........................................................................5,453Adjustment previous year .............................................................................................................................................................................................................................................................................................................190 ..................................................................................................0 ..................................................................................190.................................................................................................................................................................................................................................................................................................................................................................................................................................................5,643 ..................................................................................................0 .........................................................................5,643Gain/(loss) on currency translation differences ......................................................................................................................................................................................109 ..................................................................................................0 ..................................................................................109Expected return on plan assets .............................................................................................................................................................................................................................................................................124 ..................................................................................................0 ..................................................................................124Contributions to plan assets (employer) .......................................................................................................................................................................................................................................93 ..................................................................................................0 ..........................................................................................93Contributions to plan assets (employee) ....................................................................................................................................................................................................................................15 ..................................................................................................0 ..........................................................................................15Payments from the plan assets (other than compensations) ........................................................................................................(434) ..................................................................................................0 ..........................................................................(434)Actuarial gains/(losses)......................................................................................................................................................................................................................................................................................................................348 ..................................................................................................0 ..................................................................................348Fair value of plan assets as of December 31 ...................................................................................................................................................................5,898 ..................................................................................................0 .........................................................................5,898 Net obligation of pension provisions 2016 (in € thousand) ............................................................................................................................................................................................................................................................................................19,194

Notes to the Consolidated Financial Statements / IFRS Consolidated Financial Statements 2016 Constantia Flexibles_87
2015 (in € thousand) Funded Unfunded Total
Present value of obligations as of January 1 ...........................................................................................................................................................................................6,898 ................................................................17,758 ................................................................24,657Adjustment previous year .....................................................................................................................................................................................................................................................................................................(261) ................................................................................. (39) ..........................................................................(300)Change in the scope of consolidation...........................................................................................................................................................................................................................................321 ................................................................................. (55) ..................................................................................266.................................................................................................................................................................................................................................................................................................................................................................................................................................................6,958 .................................................................17,664 .................................................................24,622(Gain)/loss on currency translation differences ......................................................................................................................................................................................................0 ................................................................................. (78) ..................................................................................(78)Current service cost (employer and employees) ...........................................................................................................................................................................................60 ..................................................................................286 ..................................................................................346Interest expense..............................................................................................................................................................................................................................................................................................................................................................138 ..................................................................................405 ..................................................................................543Use of provision for pension payments made..........................................................................................................................................................................................(289) ..........................................................................(814) ................................................................(1,104)Past service cost, (gains)/losses from compensations ................................................................................................................................................................0 ..................................................................................................8 ..................................................................................................8Actuarial (gains)/losses (financial assumption) ...............................................................................................................................................................................(215) ..........................................................................(940) ................................................................(1,154)Actuarial (gains)/losses (experience adjustments).............................................................................................................................................................(355) ..................................................................................276 ..................................................................................(78)Present value of obligations as of December 31 .............................................................................................................................................6,296 .................................................................16,809 .................................................................23,105 2015 (in € thousand) Funded Unfunded Total
Fair value of plan assets as of January 1 ...............................................................................................................................................................................................................5,986 ..................................................................................................6 ........................................................................5,992Adjustment previous year .............................................................................................................................................................................................................................................................................................................................6 .........................................................................................(6) .........................................................................................(0).................................................................................................................................................................................................................................................................................................................................................................................................................................................5,992 ..................................................................................................0 .........................................................................5,992Expected return on plan assets .............................................................................................................................................................................................................................................................................120 ..................................................................................................0 ..................................................................................120Contributions to plan assets (employer) ...............................................................................................................................................................................................................................146 ..................................................................................................0 ..................................................................................146Payments from the plan assets (other than compensations) ........................................................................................................(289) ..................................................................................................0 ..........................................................................(289)Actuarial gains/(losses)..............................................................................................................................................................................................................................................................................................................(515) ..................................................................................................0 ..........................................................................(515)Fair value of plan assets as of December 31 ...................................................................................................................................................................5,453 ..................................................................................................0 .........................................................................5,453 Net obligation of pension provisions 2015 (in € thousand) ............................................................................................................................................................................................................................................................................................17,652

The provisions for pensions primarily relate to funded or unfunded provisions for pensions in Austria, Germany,and Mexico.
The key country-specific assumptions for the actuarial valuation were:
The assumptions regarding future mortality refer to the mortalities according to AVÖ 2008 by Pagler & Pagler “Salaried employees” (Austria) or Heubeck 2005G (Germany). The following current life expectancies
are based on the values of the defined benefit obligations (severance, anniversary bonus, pension) at the reporting date:
2017 (in € thousand) Funded Unfunded Total
Expected contributions by the employer .....................................................................................................................................................................................................................................78 ..................................................................................................0 ..........................................................................................78
Austria, Germany, Russian Federation, Mexico, Poland 2016 2015
Salary increase ...............................................................................................................................................................................................................................................................................................................................................................................................1.00%–5.60% ............................................1.00%–5.50%Pension increase .....................................................................................................................................................................................................................................................................................................................................................................................1.50%–4.60% ............................................1.00%–4.00%Discount rates ...................................................................................................................................................................................................................................................................................................................................................................................................0.90%–8.50% ....................................2.10%–10.00%Expected return on plan assets .......................................................................................................................................................................................................................................................................................................0.90%–8.50% ....................................2.10%–10.00%
Accounting principles Heubeck Heubeck AVÖ 2008-P AVÖ 2008-P 2005G 2005G for employees for employees Male Female Male Female
Remaining life expectancy from amongthe current 65-years-old (in years) ..............................................................................................................................................................................................................19.3 ..........................................................23.4 ..........................................................20.9...........................................................24.5Remaining life expectancy at age 65 from among the current 45-year-old (in years) .............................................................................................................................................22.0 ..........................................................25.9 ..........................................................23.4...........................................................26.6
Average number of employees (FTE) 2016 2015
For pension obligations ....................................................................................................................................................................................................................................................................................................................................................................................................2,873 .............................................................................................3,613
88_Constantia Flexibles IFRS Consolidated Financial Statements 2016 / Notes to the Consolidated Financial Statements

The weighted average remaining duration of the pensions is 16.6 years.
Duration was determined using probabilities of exit(death, disability, fluctuation), weighted by the amountof cash flows.
The impact of salary/benefit increases on pension obliga-tions is marginal, since there are no salary increases for pensioners and benefit increases are only relevant if there
Sensitivity analysis: Provided that the other assumptions are constant, the possible changes that can be reasonably anticipated in one of the significant actuarial assumptions at the reporting date would have affected the defined benefit obligation by the following amounts: change of +/– 0.25 percentage points in each case:
are value adjustments (such as commitments linked toa consumer price index).
(in € thousand) Increase Decrease Discount rate Discount rate
Impact on actuarial (gains)/losses ...............................................................................................................................................................................................................................................................................................(964) .......................................................................................................................................1,029Impact on the defined benefit obligation ..............................................................................................................................................................................................................................................................(964) .......................................................................................................................................1,029
(in € thousand) Increase Decrease Salary increase Salary increase
Impact on actuarial (gains)/losses .......................................................................................................................................................................................................................................................................................................101 .................................................................................................................................................(97)Impact on the defined benefit obligation ......................................................................................................................................................................................................................................................................101 .................................................................................................................................................(97)
Notes to the Consolidated Financial Statements / IFRS Consolidated Financial Statements 2016 Constantia Flexibles_89

3. Provision for anniversary bonuses: The amount due under the Company’s commitment, as reported in the consolidated balance sheet, is as follows:
In fiscal year 2017, Constantia Flexibles expects €261 thousand (2016: €469 thousand) in anniversary bonuses.The key assumptions for the actuarial valuation were:
Average number of employees (FTE) 2016 2015
For anniversary bonus ..........................................................................................................................................................................................................................................................................................................................................................................................................3,222 .............................................................................................3,209
2016 2015
Salary increase ...............................................................................................................................................................................................................................................................................................................................................................................................3.00%–3.50% ............................................2.50%–3.50%Discount rates ...................................................................................................................................................................................................................................................................................................................................................................................................0.90%–2.00% ............................................2.10%–2.60%
90_Constantia Flexibles IFRS Consolidated Financial Statements 2016 / Notes to the Consolidated Financial Statements
(in € thousand) 2016 2015
Present value of obligations as of January 1 ................................................................................................................................................................................................................................................................................7,484 .............................................................................................7,610Reclassification .......................................................................................................................................................................................................................................................................................................................................................................................................................................................................0 .......................................................................................................(74)Change in the scope of consolidation...............................................................................................................................................................................................................................................................................................................................................0 .......................................................................................................(29)......................................................................................................................................................................................................................................................................................................................................................................................................................................................................................................................................7,484 ..............................................................................................7,508(Gain)/loss from currency translation differences ..............................................................................................................................................................................................................................................................................0 .......................................................................................................................0Current service cost ...............................................................................................................................................................................................................................................................................................................................................................................................................................382 .......................................................................................................455Past service cost ................................................................................................................................................................................................................................................................................................................................................................................................................................................................0 .......................................................................................................................0Interest expense...................................................................................................................................................................................................................................................................................................................................................................................................................................................494 ...............................................................................................................51Use of provision for anniversary bonus payments made ....................................................................................................................................................................................................................(600) ...............................................................................................(642)Actuarial (gains)/losses (demographic assumption) .................................................................................................................................................................................................................................................................0 .......................................................................................................................0Actuarial (gains)/losses (financial assumption) ............................................................................................................................................................................................................................................................................747 ...............................................................................................(114)Actuarial (gains)/losses (experience adjustments).................................................................................................................................................................................................................................................(531) .......................................................................................................226Present value of obligations as of December 31 ..................................................................................................................................................................................................................................7,976 ..............................................................................................7,484
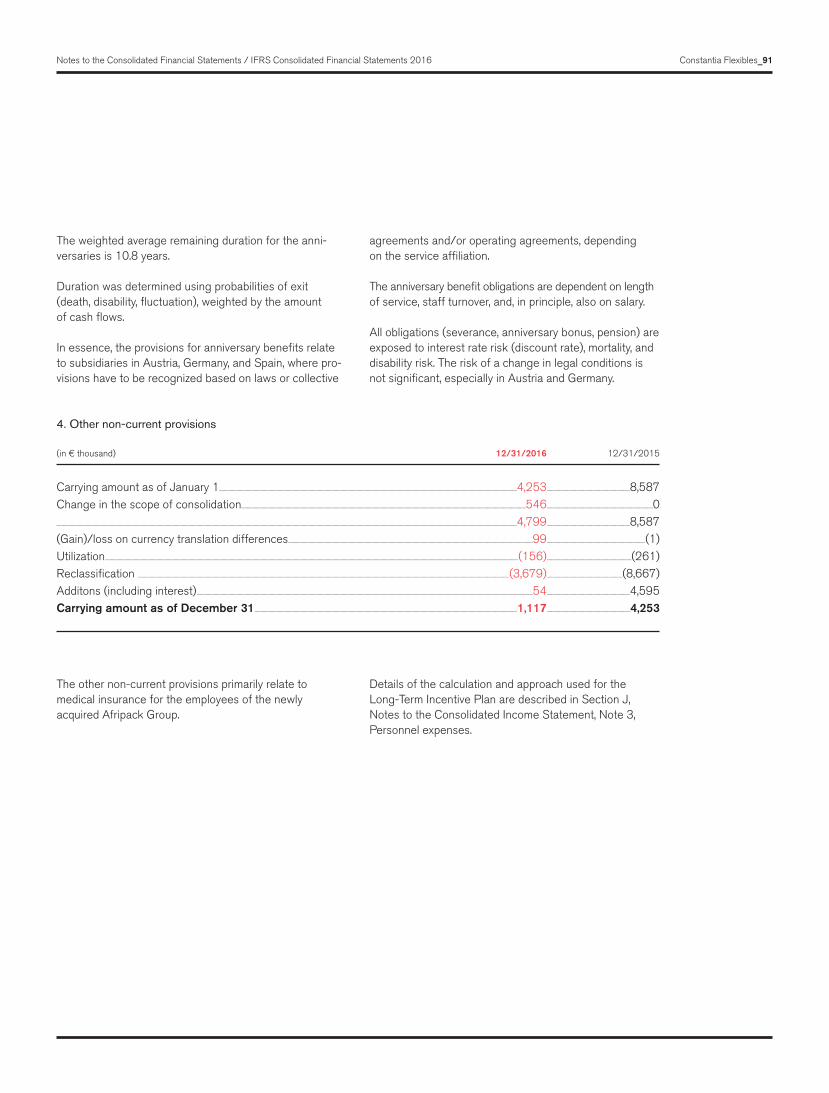
The weighted average remaining duration for the anni-versaries is 10.8 years.
Duration was determined using probabilities of exit(death, disability, fluctuation), weighted by the amountof cash flows.
In essence, the provisions for anniversary benefits relate to subsidiaries in Austria, Germany, and Spain, where pro-visions have to be recognized based on laws or collective
The other non-current provisions primarily relate tomedical insurance for the employees of the newlyacquired Afripack Group.
agreements and/or operating agreements, dependingon the service affiliation.
The anniversary benefit obligations are dependent on length of service, staff turnover, and, in principle, also on salary.
All obligations (severance, anniversary bonus, pension) are exposed to interest rate risk (discount rate), mortality, and disability risk. The risk of a change in legal conditions is not significant, especially in Austria and Germany.
Details of the calculation and approach used for theLong-Term Incentive Plan are described in Section J, Notes to the Consolidated Income Statement, Note 3,Personnel expenses.
4. Other non-current provisions
(in € thousand) 12/31/2016 12/31/2015
Carrying amount as of January 1...............................................................................................................................................................................................................................................................................................................................................4,253 .............................................................................................8,587Change in the scope of consolidation................................................................................................................................................................................................................................................................................................................................546 .......................................................................................................................0......................................................................................................................................................................................................................................................................................................................................................................................................................................................................................................................................4,799 .............................................................................................8,587(Gain)/loss on currency translation differences ...................................................................................................................................................................................................................................................................................99 ..............................................................................................................(1)Utilization ................................................................................................................................................................................................................................................................................................................................................................................................................................................................................(156) ...............................................................................................(261)Reclassification .................................................................................................................................................................................................................................................................................................................................................................................................................................(3,679) .....................................................................................(8,667)Additons (including interest) ..........................................................................................................................................................................................................................................................................................................................................................................................54 .............................................................................................4,595Carrying amount as of December 31 .......................................................................................................................................................................................................................................................................................................1,117 ..............................................................................................4,253
Notes to the Consolidated Financial Statements / IFRS Consolidated Financial Statements 2016 Constantia Flexibles_91

The current provisions mainly include provisions for pending litigation in the amount of €48,000 thousand (2015: €47,479 thousand) and provisions for contract risks and ventures, legal and consulting costs, bonuses, other
accruals, and warranty provisions. Details of material litigation in the Constantia Flexibles Group are described in Section 11, Material Litigation.
5. Current provisions
(in € thousand) 12/31/2016 12/31/2015
Carrying amount as of January 1.......................................................................................................................................................................................................................................................................................................................................59,043 .....................................................................................50,285Change in the scope of consolidation......................................................................................................................................................................................................................................................................................................................1,719 .......................................................................................................................0...............................................................................................................................................................................................................................................................................................................................................................................................................................................................................................................................60,762 ......................................................................................50,285(Gain)/loss on currency translation differences ...........................................................................................................................................................................................................................................................................192 .......................................................................................................................6Utilization ..............................................................................................................................................................................................................................................................................................................................................................................................................................................................(11,420) .....................................................................................(3,943)Reversal ......................................................................................................................................................................................................................................................................................................................................................................................................................................................................................(354) .......................................................................................................(38)Transfer/Revaluation ................................................................................................................................................................................................................................................................................................................................................................................................................3,679 .............................................................................................7,232Additions .................................................................................................................................................................................................................................................................................................................................................................................................................................................................................5,443 .............................................................................................5,501Carrying amount as of December 31 ................................................................................................................................................................................................................................................................................................58,302 ......................................................................................59,043
9. Liabilities
92_Constantia Flexibles IFRS Consolidated Financial Statements 2016 / Notes to the Consolidated Financial Statements
REMAINING TERM 12/31/2016 Total Less than 1–5 years Over(in € thousand) 1 year 5 years
Interest-bearing financial liabilities .................................................................................................................................................................................................................432,328 ..........................203,891 ..........................201,083 ..................................27,354Other non-current liabilities ........................................................................................................................................................................................................................................................139,446 ....................................................................0 ..........................136,494 ..........................................2,951Trade payables ............................................................................................................................................................................................................................................................................................................................300,849 ..........................300,849 ...................................................................0 ....................................................................0Tax liabilities ..................................................................................................................................................................................................................................................................................................................................................43,594 ..................................43,594 ...................................................................0 ....................................................................0Other liabilities .............................................................................................................................................................................................................................................................................................................................105,648 ..........................105,648 ...................................................................0 ....................................................................0.......................................................................................................................................................................................................................................................................................................................................................................................................1,021,865 ............................653,982 ...........................337,577 ...................................30,305

REMAINING TERM 12/31/2015 Total Less than 1–5 years Over(in € thousand) 1 year 5 years
Interest-bearing financial liabilities .................................................................................................................................................................................................................792,662 ..................................65,615 ..........................164,284 ..........................562,763Other non-current liabilities ................................................................................................................................................................................................................................................................91,409 ....................................................................0 ..................................87,464 ..........................................3,945Trade payables ............................................................................................................................................................................................................................................................................................................................237,378 ..........................237,378 ...................................................................0 ....................................................................0Tax liabilities ..................................................................................................................................................................................................................................................................................................................................................17,426 ..................................17,426 ...................................................................0 ....................................................................0Other liabilities .............................................................................................................................................................................................................................................................................................................................119,225 ..........................119,225 ...................................................................0 ....................................................................0.......................................................................................................................................................................................................................................................................................................................................................................................................1,258,100 ............................439,644 ...........................251,748 ...........................566,707
Loan repayments reduced interest-bearing financial liabili-ties by €416,000 thousand. Please see Section I.7, Equity, for more detailed explanations. Due to the redemption of the bond in May 2017, with a volume of €129,121 thousand, this amount was reclassified to current interest- bearing financial liabilities.
Interest-bearing financial liabilities also include lease liabil-ities of €37,562 thousand (2015: €28,612 thousand).
Collateralized interest-bearing financial liabilities amount-ed to €7,606 thousand in the reporting period (2015: €3,000 thousand).
The other non-current liabilities include the liability arising from the measurement of put options for the purchase of the remaining shares of Verstraete in mould labels N.V.,
Parikh Packaging Pvt. Ltd., Oai Hung, and the Afripack Group in the total amount of €119,698 thousand (2015: €75,512 thousand), as well as the contingent purchase price liability for the Pemara Group (see Section L, Financial Instruments, Level 3 fair values) amounting to €9,056 thousand (2015: €7,944 thousand). They also includethe deferred government grants received amounting to €4,752 thousand (2015: €5,567 thousand).
Other non-current liabilities include cash flow hedgederivatives amounting to €684 thousand (2015: €574 thousand) with maturities of one to five years.
€7,949 thousand (2015: €8,917 thousand) of thetrade payables is attributable to liabilities from capitalexpenditures.
Notes to the Consolidated Financial Statements / IFRS Consolidated Financial Statements 2016 Constantia Flexibles_93
10. Other current liabilities
(in € thousand) 12/31/2016 12/31/2015
Derivative financial instruments .......................................................................................................................................................................................................................................................................................................................................................4,739 .............................................................................................3,052Liabilities to employees ...........................................................................................................................................................................................................................................................................................................................................................................................31,143 .....................................................................................31,224Accrued unused vacations ..........................................................................................................................................................................................................................................................................................................................................................................13,841 .....................................................................................11,265Other tax liabilities ..............................................................................................................................................................................................................................................................................................................................................................................................................................8,634 .....................................................................................12,522Liabilities to medical insurance funds .......................................................................................................................................................................................................................................................................................................................5,771 .............................................................................................5,170Deferrals ..................................................................................................................................................................................................................................................................................................................................................................................................................................................................................2,979 .............................................................................................1,438Other liabilities ...........................................................................................................................................................................................................................................................................................................................................................................................................................................38,541 .....................................................................................54,554.......................................................................................................................................................................................................................................................................................................................................................................................................................................................................................................................105,648 ..............................................................................119,225

Liabilities to employees essentially comprise bonusesand overtime credits in the amount of €17,081 thousand (2015: €18,342 thousand) and €7,465 thousand(2015: €5,866 thousand), respectively.
Other current liabilities also include derivatives for fairvalue hedges of €2,202 thousand (2015: €14 thousand) and cash flow hedge derivatives in the amount of€2,508 thousand (2015: €3,038 thousand).
The decline in other liabilities is essentially attributableto a progress payment on the contingent purchase price liability from the acquisition of the Spear Group, as ofDecember 31, 2016, after USD foreign currency measure-ment: €2,385 thousand (2015: €39,026 thousand;payments: €35,939 thousand), which is offset by thecontingent purchase price liability from the acquisitionof Constantia Oai Hung Manufacturing Joint Stock Company (see Section D) amounting to €13,494 thousand (2015: €0 thousand).
Additionally, other liabilities mainly include deferred interest for the corporate bond in the amount of €3,612 thousand (2015: €3,376 thousand), a current purchase price liability for the non-controlling interests of Constantia Aloform GmbH in the amount of €2,100 thousand (2015: €0 thousand),a current put option liability for the non-controlling interests of Parikh Packaging Pvt. Ltd. in the amount of €5,695 thousand (2015: €0 thousand), and a liability of €2,739 thousand for real estate transfer taxes in Germany(2015: €2,738 thousand).
11. Material litigation
Constantia Packaging AG – Squeeze-outIn fiscal year 2010, Sulipo Beteiligungsverwaltungs GmbH (“Sulipo”) acquired 91.49% of the shares in the listed com-pany, Constantia Packaging AG. At the Annual General Meeting of Constantia Packaging AG on August 24, 2010, it was resolved to transfer the shares of all other shareholders to Sulipo as the principal shareholder pur-suant to Section 1 (1) Austrian Shareholder Squeeze- Out Act [GesellschafterAusschlussgesetz, GesAusG] in exchange for payment of a cash settlement of €47.0 per share. This was followed by a delisting from the Vienna Stock Exchange. Due to individual applications by exclud-ed minority shareholders, a review procedure concerning the amount of cash compensation was initiated. In this procedure, the expert Dr. Klaus Rabel was commissioned
to prepare an independent business valuation report. He completed his initial task with the release of the document “Opinion regarding the enterprise value of Constantia Packaging AG as of August 24, 2010” on September 19, 2013. The expert derived a settlement price of between €68.08 and €71.82 per share from the calculated value of the Company at the assessment date. This price range was also essentially confirmed in the supplementaryopinion of May 29, 2015, which was also prepared byDr. Klaus Rabel; he made small adjustments to his opinion of September 19, 2013, and calculated a range of €67.55to €71.29 per share. In March 2016, the body responsible for assessing the cash settlement price sent its estimate of the reasonable amount of the cash compensation to the Vienna Commercial Court. In this estimate, the body confirmed the range determined by Dr. Klaus Rabel and resolved the value at €69.42 per share.
The timing of a final court settlement or any agreementon a final settlement price cannot be predicted at this time. Based on the result of this opinion, Managementestimated a possible additional payment and recognized a provision for this. The unwinding of the discount on the provision at 4% per annum is recognized through profit and loss under borrowing costs pursuant to IAS 37.60.
J. Notes to the Consolidated Income Statement
1. Sales and cost of materialsNet expenses from derivatives that are designated in a hedging relationship in accordance with IAS 39 wereincluded in sales in the amount of (€347) thousand (2015: €363 thousand).
Cost of materials of €1,165,884 thousand (2015: €1,098,481 thousand) includes material expensesof €1,032,649 thousand (2015: €968,296 thousand),expenditure on energy costs for production of €38,485 thousand (2015: €40,177 thousand), expenditure oncylinders in the amount of €25,502 thousand (2015: €25,392 thousand), and expenses for packagingmaterials in the amount of €24,303 thousand (2015: €22,752 thousand).
Cost of materials also includes net expenses from deri-vatives that are designated in a hedging relationship in accordance with IAS 39 in the amount of €811 thousand (2015: €5,192 thousand).
94_Constantia Flexibles IFRS Consolidated Financial Statements 2016 / Notes to the Consolidated Financial Statements

2. Other operating income
(in € thousand) 2016 2015
Proceeds from disposal of tangible assets............................................................................................................................................................................................................................................................................................1,704 .......................................................................................................398Gains from currency translation differences ....................................................................................................................................................................................................................................................................................1,942 .............................................................................................2,872Subsidies and government grants ..........................................................................................................................................................................................................................................................................................................................................1,330 .......................................................................................................991Insurance proceeds .......................................................................................................................................................................................................................................................................................................................................................................................................................8,453 .............................................................................................3,405Income from disposal of subsidiaries ..........................................................................................................................................................................................................................................................................................................................8,425 .......................................................................................................................0Miscellaneous ......................................................................................................................................................................................................................................................................................................................................................................................................................................................6,529 .............................................................................................3,659...............................................................................................................................................................................................................................................................................................................................................................................................................................................................................................................................28,383 ......................................................................................11,325
The subsidies and government grants are linked mainlyto conditions such as job guarantees or sales target achievements. The insurance proceeds are mainly due to fire damage at Haendler & Natermann GmbH amounting to €1,213 thousand (2015: €1,784 thousand), Afripack Consumable Flexibles Pty. Ltd. amounting to €5,806 thou-sand (2015: €0 thousand), and Spearsystem Packaging (Africa) (Pty) Ltd. amounting to €294 thousand (2015: €772 thousand).
Gains on deconsolidation are explained in more detail in Section D.2.
Miscellaneous other income includes income from thereversal of public investment grants amounting to €1,330 thousand (2015: €969 thousand) and rental income amounting to €459 thousand (2015: €504 thousand).
Notes to the Consolidated Financial Statements / IFRS Consolidated Financial Statements 2016 Constantia Flexibles_95
(in € thousand) 2016 2015
Wages & salaries .............................................................................................................................................................................................................................................................................................................................................................................................................(331,696) .....................................................................(307,342)Expenses for severance payments andpayments to company employee pension funds ......................................................................................................................................................................................................................................................(4,403) .....................................................................................(2,950)Employee pension funds ...................................................................................................................................................................................................................................................................................................................................................................................(2,633) .....................................................................................(2,690)Expenses for mandatory social security contributions, pay-related charges, and compulsory contributions............................................................................................................................................................................................................................ (65,647) .............................................................................(65,512)Other social expenses.........................................................................................................................................................................................................................................................................................................................................................................................(15,962) .............................................................................(14,422)..............................................................................................................................................................................................................................................................................................................................................................................................................................................................................................................(420,341) ......................................................................(392,917)
3. Personnel expenses

Contributions to employee benefit funds in the amount of €638 thousand (2015: €675 thousand) are included in the expenses for severance payments and contributions to employee benefit funds.
Total number of employees as of December 31 (FTE) 2016 2015
Employees ........................................................................................................................................................................................................................................................................................................................................................................................................................................................................9,835 .............................................................................................8,564
In fiscal year 2016, the number of employees of theConstantia Flexibles Group increased by 1,271 FTEat year-end.
IFRS 2 disclosures1. Long-Term Incentive Plan (LTIP): A “Long-Term Incen-tive Plan” was introduced in May 2013. It includes about 60 employees worldwide. The value of the LTIP is cal-culated based on the Wendel trade sale equity value.
In fiscal year 2013, the LTIP was accounted for under IAS 19, because the calculation was based on an internal valuation model. Due to the completed trade sale to Wendel, the LTIP is accounted for in accordance with IFRS 2 as of December 31, 2016.
The LTIP was accounted for under IFRS 2 in fiscal year 2016.
Each of these employees initially makes an investment (zero bond) in the Group and receives it back at final maturity with interest. This zero bond has a fixed interest rate of 5% per annum and is the prerequisite for parti-cipation in the LTIP. The term ended in 2015 – with a one or two-year vesting period, depending on the model.
The basis of the LTIP is a “fictitious participation certificate,” which corresponds to a theoretical share in the company of 0.006939% per €10.000 zero bond component.
The LTIP payout at the time of the sale of the company (trade sale) was determined by means of the following for-mula: Transaction value x fictitious share in the company.
The payment is made exclusively in cash at the end of the vesting period. Each participating employee receives a payment after a vesting period of one year. Participants with an investment of greater than €20 thousand receive only 50% after one year and the remaining 50% after two years. The vesting period begins at the closing of the sale of the Company.
The LTIP is included in the salaries in the amount of €1,943 thousand (2015: €3,878 thousand). In 2016, ad-ditions to the provisions for the LTIP amounted to €2,006 thousand (2015: additions of €4,022 thousand), €63 thousand (2015: €144 thousand) of which is interest that is included in the interest expense. A payment of €9,030 thousand (2015: €222 thousand) was made in 2016. The total amount of the provisions in fiscal year 2016 thus amounts to €5,102 thousand (2015: €12,126 thousand).
A Management Equity Program (MEP) was launched at the level of the shareholder, Constantia Lux Parent S.A., Luxembourg, in December 2015. This also covers senior executives at Constantia Flexibles. The value of the MEP is calculated on the basis of the Constantia Lux Parent S.A. equity value. In fiscal year 2016, the MEP was ac-counted for as equity-settled under IFRS 2. The fair value calculation at the grant date indicated that no recognition as a personnel expense was necessary.
96_Constantia Flexibles IFRS Consolidated Financial Statements 2016 / Notes to the Consolidated Financial Statements

4. Depreciation, amortization, and impairment losses
(in € thousand) 2016 2015
Ordinary depreciation ......................................................................................................................................................................................................................................................................................................................................................................................(139,849) .....................................................................(123,088)Impairment ................................................................................................................................................................................................................................................................................................................................................................................................................................................................................................0 .......................................................................................................................0..............................................................................................................................................................................................................................................................................................................................................................................................................................................................................................................(139,849) ......................................................................(123,088) thereof amortization customer list (IFRS 3) ................................................................................................................................................................................................................................................. (29,393) .............................................................................(28,532)
5. Other operating expenses
(in € thousand) 2016 2015
Losses from currency translation differences ...................................................................................................................................................................................................................................................................(2,612) .....................................................................................(1,557)Losses from disposal of tangible and intangible assets..............................................................................................................................................................................................................(2,335) .....................................................................................(1,921)Miscellaneous other expenses ..............................................................................................................................................................................................................................................................................................................................................................................74 .......................................................................................................(10).............................................................................................................................................................................................................................................................................................................................................................................................................................................................................................................................(4,873) .....................................................................................(3,488)
6. Net financial income and expense
(in € thousand) 2016 2015
Interest income ...............................................................................................................................................................................................................................................................................................................................................................................................................................................1,596 .............................................................................................3,933Interest expense........................................................................................................................................................................................................................................................................................................................................................................................................................(25,620) .............................................................................(33,467)Net interest expense for pension provisions ..........................................................................................................................................................................................................................................................................(1,674) .....................................................................................(1,325)Compounding of other non-current liabilities and provisions ...................................................................................................................................................................................(8,049) .....................................................................................(5,458)Net interest income and expenses ....................................................................................................................................................................................................................................................................................................(33,747) .............................................................................(36,317) (Gains)/losses from currency translation difference ...............................................................................................................................................................................................................................(3,672) .....................................................................................(7,172)Derivatives – held for trading.......................................................................................................................................................................................................................................................................................................................................................................................73 ...............................................................................................(729)Other .............................................................................................................................................................................................................................................................................................................................................................................................................................................................................................(9,995) .....................................................................................(3,521)Other financial income and expense.........................................................................................................................................................................................................................................................................................(13,594) .............................................................................(11,422)
Notes to the Consolidated Financial Statements / IFRS Consolidated Financial Statements 2016 Constantia Flexibles_97
Interest income in fiscal year 2015 included a gain of €2,880 thousand from the reversal of an accrued liability for interest on tax risks. The interest expense includesfinance lease expenses in the amount of €2,022 thou-sand (2015: €1,752 thousand) and factoring fees of €984 thousand (2015: €1,117 thousand). The com-pounding on other non-current liabilities and provisions
contains expenses of €6,396 thousand (2015: €3,199 thousand) for the compounding on the discounted liabili-ties from put options and €834 thousand (2015: €1,106 thousand) for the contingent purchase price liability from the acquisition of the Pemara Group and Oai Hung.

(in € thousand) 2016 2015
Current tax ...................................................................................................................................................................................................................................................................................................................................................................................................................................................... (54,919) .............................................................................(26,146)Deferred tax.......................................................................................................................................................................................................................................................................................................................................................................................................................................................(5,250) .....................................................................................10,863......................................................................................................................................................................................................................................................................................................................................................................................................................................................................................................................(60,170) .............................................................................(15,283)
(in € thousand) 2016 2015
Earnings before tax (EBT) ...................................................................................................................................................................................................................................................................................................................................................................117,561 .....................................................................................74,692Tax expense of 25.0% ........................................................................................................................................................................................................................................................................................................................................................................................(29,390) .............................................................................(18,673)Other non-deductible expenses .............................................................................................................................................................................................................................................................................................................................................(3,519) .....................................................................................(7,794)Tax-exempt income .........................................................................................................................................................................................................................................................................................................................................................................................................................5,543 .............................................................................................1,796Other tax rates ..................................................................................................................................................................................................................................................................................................................................................................................................................................................1,414 .....................................................................................(2,143)Changes in tax rates .........................................................................................................................................................................................................................................................................................................................................................................................................(1,723) .......................................................................................................241Tax benefits ..................................................................................................................................................................................................................................................................................................................................................................................................................................................................1,052 .............................................................................................1,068Correction of tax loss carryforwards from previous years ............................................................................................................................................................................................ (22,604) .............................................................................................8,499Tax for prior years .........................................................................................................................................................................................................................................................................................................................................................................................................................(5,517) .......................................................................................................................0Other .............................................................................................................................................................................................................................................................................................................................................................................................................................................................................................(5,427) .............................................................................................1,723Total tax expense ..........................................................................................................................................................................................................................................................................................................................................................................................................(60,170) .............................................................................(15,283)Effective tax rate ...........................................................................................................................................................................................................................................................................................................................................................................................................................51.18% .................................................................................20.46%
Tax reconciliation
98_Constantia Flexibles IFRS Consolidated Financial Statements 2016 / Notes to the Consolidated Financial Statements
Other financial income and expense include expenses from the revaluation of the options for the acquisition of the remaining shares in Verstraete in mould labels N.V.in the amount of €2,680 thousand and Parikh Packaging Pvt. Ltd. amounting to €6,164 thousand (2015: ASAS Ambalaj A.S. amounting to €2,039 thousand). This item also includes an expense of €5,012 thousand from a compensation payment to settle a claim for damages asserted by Pinnacle Packaging Company Inc. and Polo Road Leasing, LLC, as the former owners of Oracle Flexible Packaging Inc. Further components of other financial income and expense include income from guarantees issued to secure the bank loans of Constantia Flexibles Holding GmbH amounting to €5,211 thousand and loan arrange-ment fees of €180 thousand (2015: €628 thousand).
Foreign currency gains/(losses) originated from financing activities and were primarily due to the changes in US dollar and Vietnamese dong exchange rates.
7. Income tax In the context of group taxation, the Austrian companies were combined to form a tax group within the meaningof Section 9 of the Austrian Corporate Income Tax Act (KStG). The taxable income of the members of the tax group is offset against the taxable income of the tax group parent Constantia Flexibles Holding GmbH, which does not form part of the scope of consolidation. Theresults of Constantia Flexibles Group GmbH are offset against its own sub-group losses. To compensate for the transfer of taxable income, a tax allocation was agreedin the group and tax compensation contract, which iscalculated according to the stand-alone method.

(in € thousand) 2016 2015
Tax positions recognized in equity Tax income due to hybrid capital ......................................................................................................................................................................................................................................................................................................................................................0 .......................................................................................................602
(in € thousand) 2016 2015
Total tax expense....................................................................................................................................................................................................................................................................................................................................................................................................................(60,170) .............................................................................(14,682)“Adjusted” effective tax rate ................................................................................................................................................................................................................................................................................................................................................................51.18% .................................................................................19.66%
The “Other” item mainly contains the reconciliation effects of the theoretical tax expenses of the Austrian tax group members in respect of the group parent. Because the
group parent Constantia Flexibles Holding GmbH is not part of the scope of consolidation, the offsetting effects of the tax group parent cannot be shown here.
8. Deferred tax
(in € thousand) 2016 2016 2015 2015 Deferred tax Deferred tax Deferred tax Deferred tax assets liabilities assets liabilities
Intangible assets ...........................................................................................................................................................................................................................................................................................................................................642 ..................................25,954 ..........................................2,115 ..................................27,374Tangible assets..........................................................................................................................................................................................................................................................................................................................................1,931 ..................................81,314 ..........................................1,728 ..................................81,064Financial and non-current assets .................................................................................................................................................................................................................................15,178 ..........................................5,929 ..........................................3,195 ..........................................6,318Inventories .............................................................................................................................................................................................................................................................................................................................................................................444 ..........................................1,661 ..........................................2,747 ..........................................2,136Receivables ............................................................................................................................................................................................................................................................................................................................................................1,546 ..........................................2,798 ..........................................1,829 ..........................................1,720Securities, cash and cash equivalents .........................................................................................................................................................................................................................................0 ....................................................373 ...................................................................0 ....................................................241Loss carryforward ...................................................................................................................................................................................................................................................................................................................13,072 ....................................................................0 ..................................32,146 ....................................................................0Untaxed reserves........................................................................................................................................................................................................................................................................................................................................................0 ..........................................2,470 ...................................................................0 ..........................................3,471Provisions ...............................................................................................................................................................................................................................................................................................................................................................10,770 ..........................................1,405 ..........................................8,947 ....................................................652Liabilities ...................................................................................................................................................................................................................................................................................................................................................................14,288 ..........................................1,726 ..................................15,094 ..........................................1,319.........................................................................................................................................................................................................................................................................................................................................................................................................................57,872 ............................123,630 ...................................67,801 ...........................124,295
Tax credits with the same tax authority ..........................................................................................................................................................................................(50,449) ..........................(50,449) .........................(58,608) ..........................(58,608)Net deferred tax assets and liabilites....................................................................................................................................................................................................................7,423 ...................................73,181 ..........................................9,193 ...................................65,687
Notes to the Consolidated Financial Statements / IFRS Consolidated Financial Statements 2016 Constantia Flexibles_99
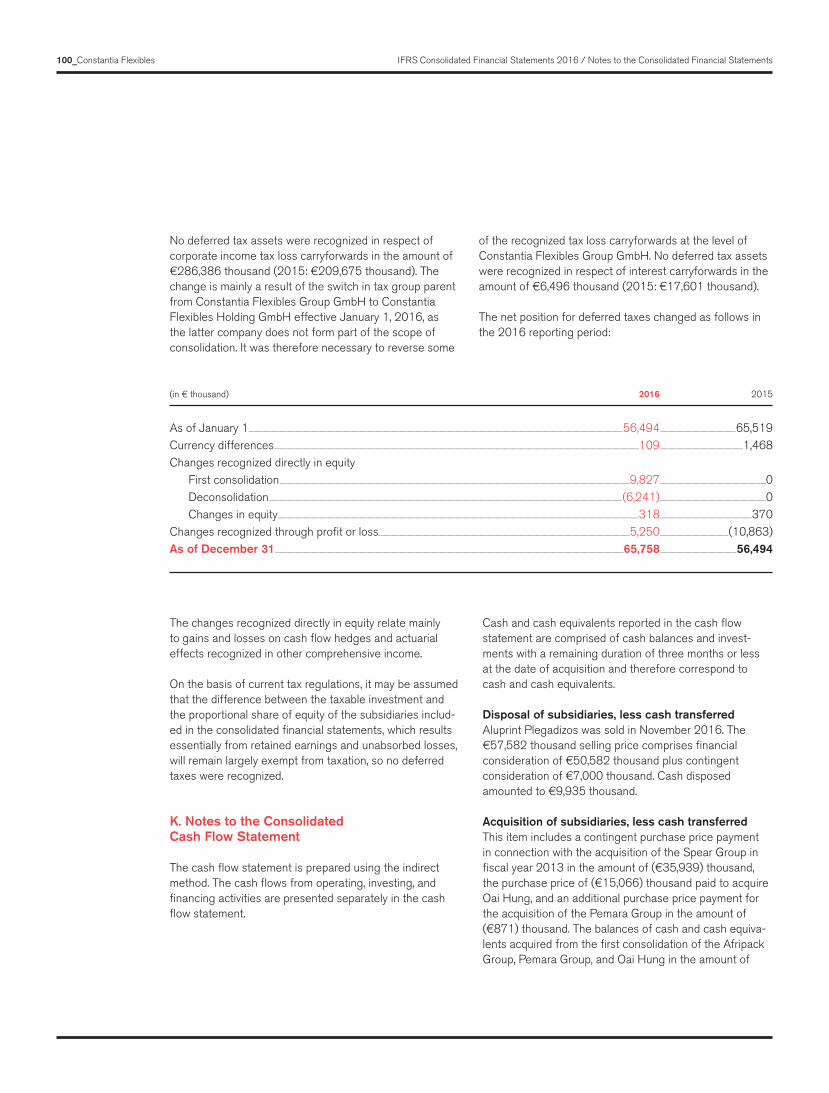
(in € thousand) 2016 2015
As of January 1 .....................................................................................................................................................................................................................................................................................................................................................................................................................................56,494 .....................................................................................65,519Currency differences ..........................................................................................................................................................................................................................................................................................................................................................................................................................109 .............................................................................................1,468Changes recognized directly in equity First consolidation ..........................................................................................................................................................................................................................................................................................................................................................................................................9,827 .......................................................................................................................0 Deconsolidation .............................................................................................................................................................................................................................................................................................................................................................................................................(6,241) .......................................................................................................................0 Changes in equity ......................................................................................................................................................................................................................................................................................................................................................................................................................318 .......................................................................................................370Changes recognized through profit or loss ...........................................................................................................................................................................................................................................................................................5,250 .............................................................................(10,863)As of December 31 ........................................................................................................................................................................................................................................................................................................................................................................................................65,758 ......................................................................................56,494
No deferred tax assets were recognized in respect of corporate income tax loss carryforwards in the amount of €286,386 thousand (2015: €209,675 thousand). The change is mainly a result of the switch in tax group parent from Constantia Flexibles Group GmbH to Constantia Flexibles Holding GmbH effective January 1, 2016, as the latter company does not form part of the scope of consolidation. It was therefore necessary to reverse some
of the recognized tax loss carryforwards at the level of Constantia Flexibles Group GmbH. No deferred tax assets were recognized in respect of interest carryforwards in the amount of €6,496 thousand (2015: €17,601 thousand).
The net position for deferred taxes changed as follows in the 2016 reporting period:
The changes recognized directly in equity relate mainlyto gains and losses on cash flow hedges and actuarialeffects recognized in other comprehensive income.
On the basis of current tax regulations, it may be assumed that the difference between the taxable investment and the proportional share of equity of the subsidiaries includ-ed in the consolidated financial statements, which results essentially from retained earnings and unabsorbed losses, will remain largely exempt from taxation, so no deferred taxes were recognized.
K. Notes to the ConsolidatedCash Flow Statement
The cash flow statement is prepared using the indirect method. The cash flows from operating, investing, and financing activities are presented separately in the cash flow statement.
Cash and cash equivalents reported in the cash flow statement are comprised of cash balances and invest-ments with a remaining duration of three months or less at the date of acquisition and therefore correspond to cash and cash equivalents.
Disposal of subsidiaries, less cash transferredAluprint Plegadizos was sold in November 2016. The €57,582 thousand selling price comprises financial consideration of €50,582 thousand plus contingent consideration of €7,000 thousand. Cash disposed amounted to €9,935 thousand.
Acquisition of subsidiaries, less cash transferredThis item includes a contingent purchase price paymentin connection with the acquisition of the Spear Group in fiscal year 2013 in the amount of (€35,939) thousand, the purchase price of (€15,066) thousand paid to acquire Oai Hung, and an additional purchase price payment for the acquisition of the Pemara Group in the amount of (€871) thousand. The balances of cash and cash equiva-lents acquired from the first consolidation of the Afripack Group, Pemara Group, and Oai Hung in the amount of
100_Constantia Flexibles IFRS Consolidated Financial Statements 2016 / Notes to the Consolidated Financial Statements

€7,621 thousand are also presented there. The break-down of the acquired assets and liabilities is shown in Section D, Acquisitions and Other Changes in the Scope of Consolidation. The purchase prices for the Afripackand Pemara Groups were already paid at the time of their acquisition in November and December 2015.
Payments for other financial investmentsThe payments for other financial investments relateprimarily to the payment of €6,772 thousand to acquire the assets of Constantia San Prospero S.r.l. and a loanreceivable from the same company. In the previous year, this item mainly included the purchase price paymentsfor the acquisition of the Afripack and Pemara Groups and loans granted to entities of these groups.
Other cash flow disclosuresInvestments in tangible and intangible assets presentedin the cash flow statement correspond to the investments reported in the consolidated asset table, adjusted for the change in liabilities arising from the acquisition of tangible and intangible assets, changes in prepayments on fixed assets which are included in non-current assets, as wellas non-cash additions for finance leases.
The “Other non-cash income/expenses” item mainlycomprises gains and losses from changes in exchange rates and expenses from the fair value measurementof put option liabilities.
L. Financial Instruments
Risk management strategiesConstantia Flexibles is exposed to risks with respect toits assets, liabilities, and forecast transactions arising from changes in exchange rates, interest rates, and quoted market prices. Management of these risks is regulatedby policies that apply throughout the Group. The aim of financial risk management is to mitigate these market risks through ongoing operational and finance-relatedactivities. Derivative financial instruments are only usedas hedging instruments.
Financial concentration riskThe financial concentration or cluster risk describes the risk to the Group emanating from a dependency upon banks or other financial counterparties. Constantia Flexibles fol-lows the principle of financial independence, which is also regulated in Group-wide policies. The financial independ-ence of the Group is guaranteed by actively managing the allocation of business. The Constantia Flexibles Group is not exposed to any concentration risks.
Capital risk managementThe Group manages its capital with the objective of ensuring that all Group entities can operate under the going-concern assumption, while concurrently maximizing the income from its equity investments by optimizing the debt-to- equity ratio.
The net debt at year end was as follows:
(in € thousand) 12/31/2016 12/31/2015
Non-current financial assets .......................................................................................................................................................................................................................................................................................................................................................(14,430) .............................................................................(15,597)Current financial assets ........................................................................................................................................................................................................................................................................................................................................................................................(4,754) .....................................................................................(2,753)Interest-bearing non-current financial liabilities ..................................................................................................................................................................................................................................................228,437 .............................................................................727,047Interest-bearing current financial liabilities ............................................................................................................................................................................................................................................................................203,891 .....................................................................................65,615Debt .........................................................................................................................................................................................................................................................................................................................................................................................................................................................................................413,144 ..............................................................................774,312 Cash and cash equivalents ........................................................................................................................................................................................................................................................................................................................................................(122,622) .............................................................................(61,133) Net debt of the Group ................................................................................................................................................................................................................................................................................................................................................................................290,522 ..............................................................................713,179
Notes to the Consolidated Financial Statements / IFRS Consolidated Financial Statements 2016 Constantia Flexibles_101

Foreign currency riskForeign currency risk arises from the fact that the valueof a financial instrument can change due to exchange rate fluctuations. The Group enters into foreign currency deriv-atives in order to hedge both the foreign exchange risk related to cash flow from operating activities (cash flow hedges) and the risk of fair value changes of assets and liabilities reported in the balance sheet (fair value hedges). No derivatives are used for speculative purposes, and the principle applies that only instruments that can be clearly measured and recognized are used.
The transaction risk is calculated for each individual foreign currency. Both foreign currency receivables and liabilities arising from transactions are recognized in the balance sheet at the time the contract is entered into, as are certain off-balance-sheet items, which above all include recurring operating transactions (forecast material purchases and sales).
Foreign currency risks for the Constantia Flexibles Group result from the fact that it operates worldwide in a number of countries where it owns production sites and sells its goods and services. Owing to the Constantia Flexibles Group’s decentralized organizational structure, material purchasing generally takes place in the respective national currencies of the local companies. Similarly, the resulting invoices of the foreign companies are largely billed in the local currency. This results in a closed currency position and a significant reduction in the identifiable currency risk. In the case of positions that cannot be closed through a matching transaction (natural hedge), overhangs are hedged via currency forwards or options that correspond to the risk exposure and horizon.
Primary financial instruments, which include trade receiv-ables and payables, financial receivables and liabilities, and securities, are allocated to the following currency positions at the reporting date:
102_Constantia Flexibles IFRS Consolidated Financial Statements 2016 / Notes to the Consolidated Financial Statements
12/31/2016 12/31/2015 Currency in € thousand In % Currency in € thousand In %
Primary financial instrument assets .........................................................................EUR...........................191,756 ......................................46.1% .................................................EUR ..........................123,552 ......................................39.1%..............................................................................................................................................................................................................................................................................USD...................................87,655 ......................................21.1% .................................................USD ..................................81,878 ......................................25.9%...........................................................................................................................................................................................................................................................................MXN...................................39,974 ..............................................9.6% ..............................................MXN ..................................38,960 ......................................12.3%...............................................................................................................................................................................................................................................................................ZAR...................................34,606 ..............................................8.3% ...................................................ZAR ..........................................5,278 ..............................................1.7%.............................................................................................................................................................................................................................................................................GBP...................................19,679 ..............................................4.7% ................................................GBP ..................................32,326 ......................................10.2%.................................................................................................................................................................................................................................................................................TRY...................................13,693 ..............................................3.3% ....................................................TRY .............................. 18,359 ..............................................5.8%.............................................................................................................................................................................................................................................................................VND..........................................6,034 ..............................................1.4% ................................................VND ...................................................................0 ..............................................0.0%.............................................................................................................................................................................................................................................................................AUD..........................................4,691 ..............................................1.1% ................................................AUD ...................................................................0 ..............................................0.0%..................................................................................................................................................................................................................................................................................INR..........................................4,291 ..............................................1.0% ..................................................... INR ..........................................6,967 ..............................................2.2%.............................................................................................................................................................................................................................................................................RUB..........................................3,063 ..............................................0.7% ................................................RUB ..........................................2,516 ..............................................0.8%.............................................................................................................................................................................................................................................................................DKK..........................................1,842 ..............................................0.4% ................................................DKK ..........................................2,063 ..............................................0.7%...............................................................................................................................................................................................................................................................................PLN..........................................1,777 ..............................................0.4% ..................................................PLN ....................................................896 ..............................................0.3%............................................................................................................................................................................................................................................................................RON..........................................1,645 ..............................................0.4% ................................................RON ..........................................1,940 ..............................................0.6%...................................................................................................................................................................................................................................................................................IDR..........................................1,393 ..............................................0.3% ......................................................IDR ...................................................................0 ..............................................0.0%.........................................................................................................................................................................................................................................................................Other..........................................4,117 ..............................................1.0% ............................................Other ..........................................1,042 ..............................................0.3%Total .......................................................................................................................................................................................................................................................................................................416,216 ....................................................................................................................................................................................315,776 ............................................................................

Liquidity riskLiquidity risk is the risk of not having funds available at all times that can be used to settle financial liabilities that are incurred. Accordingly, the Group ensures that sufficient cash and cash equivalents are available or that necessary funding is secured through corresponding credit lines.
Liquidity risk is determined by the currency-specific liquidity planning carried out across the Group. Capitalization measures are planned for all Group entities based onthe results.
In order to minimize liquidity risk, Constantia Flexibleshas committed lines available in the amount of €40 million (2015: €45 million), €40 million (2015: €45 million) of which were free at the reporting date. In addition, the Group has available €110 million from Constantia FlexiblesHolding GmbH, which as the ultimate parent does not form part of the scope of consolidation.
Interest rate riskInterest rate risk occurs in the form of net interest orpresent value risks. Interest rate risk cannot be eliminated, since an interaction between present value and net inter-est risk exists. Present value risk adversely impacts the Group in the fair value of interest-bearing financial instru-ments and investments, while net interest risk impactsinterest expense or interest income.
Liquidity and interest rate risk tablesThe average interest rate on borrowings is 4.06%.
Existing debt was restructured in the course of the acqui-sition by the Wendel Group. Consequently, there has been a shift between financial instruments with fixed and vari-able rates of interest. Significant sources of funding in-clude a listed bond (ISIN AT0000A0V7Q0) in the principal amount of €129.1 million and loans from ConstantiaFlexibles Holding GmbH amounting to a total of€216.6 million.
Notes to the Consolidated Financial Statements / IFRS Consolidated Financial Statements 2016 Constantia Flexibles_103
12/31/2016 12/31/2015 Currency in € thousand In % Currency in € thousand In %
Primary financial instrument liabilities ..............................................................EUR...........................493,979 ......................................55.3% .................................................EUR ..........................967,044 ....................................82.9%..............................................................................................................................................................................................................................................................................USD...........................250,419 ......................................28.0% .................................................USD ..........................123,258 ......................................10.6%.............................................................................................................................................................................................................................................................................VND...................................61,596 ..............................................6.9% ................................................VND ...................................................................0 ..............................................0.0%...............................................................................................................................................................................................................................................................................ZAR...................................29,966 ..............................................3.3% ...................................................ZAR ..................................13,631 ..............................................1.2%..................................................................................................................................................................................................................................................................................INR...................................12,336 ..............................................1.4% ..................................................... INR ..........................................8,647 ..............................................1.3%.................................................................................................................................................................................................................................................................................TRY..........................................8,660 ..............................................1.0% ....................................................TRY ..........................................7,136 ..............................................0.6%...........................................................................................................................................................................................................................................................................MXN..........................................8,262 ..............................................0.9% ..............................................MXN ..........................................7,094 ..............................................0.6%.............................................................................................................................................................................................................................................................................GBP..........................................6,630 ..............................................0.7% ................................................GBP ..........................................8,595 ..............................................0.7%.............................................................................................................................................................................................................................................................................AUD..........................................4,175 ..............................................0.5% ................................................AUD ..........................................7,944 ..............................................0.7%.............................................................................................................................................................................................................................................................................RUB..........................................4,073 ..............................................0.5% ................................................RUB ..........................................3,555 ..............................................0.3%.............................................................................................................................................................................................................................................................................CNY..........................................3,467 ..............................................0.4% .................................................CNY ..........................................3,550 ..............................................0.3%............................................................................................................................................................................................................................................................................RON..........................................2,398 ..............................................0.3% ................................................RON ..........................................1,541 ..............................................0.1%...............................................................................................................................................................................................................................................................................PLN..........................................1,697 ..............................................0.2% ..................................................PLN ..........................................1,782 ..............................................0.2%.............................................................................................................................................................................................................................................................................MYR..........................................1,654 ..............................................0.2% ................................................MYR ...................................................................0 ..............................................0.0%...................................................................................................................................................................................................................................................................................IDR..........................................1,115 ..............................................0.1% ......................................................IDR ...................................................................0 ..............................................0.0%.........................................................................................................................................................................................................................................................................Other..........................................3,039 ..............................................0.3% ............................................Other ..................................12,163 ..............................................0.5%Total .......................................................................................................................................................................................................................................................................................................893,466 ..........................................................................................................................................................................1,165,940 ............................................................................

(in € thousand) CARRYING AMOUNT UNDISCOUNTED CASH FLOWS Total Weighted Less than 1–5 years Over Total average 1 year 5 years effective interest rate
12/31/2016Non-financial liabilities .................................................................................................................................96,236...............................................................................................................86,979 ..........................................9,256 ...................................................................0 ..................................96,236Non-interest bearingfinancial instruments ...................................................................................................................................461,138.......................................................................................................332,285 ..........................154,751 ...................................................................0 ..........................487,037Finance lease liability ........................................................................................................................................37,562......................................4.96% ..........................................5,856 ..................................18,403 ..................................29,613 ..................................53,872Variable interest rate instruments ..............................................................219,348......................................3.53% ..................................69,142 ..................................20,973 ..........................149,000 ..........................239,116Fixed interest rate instruments ............................................................................175,418......................................4.88% ..........................137,562 ..................................30,241 ..................................17,179 ..........................184,982........................................................................................................................................................................................................................................................989,701........................................................................................................631,825 ............................233,624 ...........................195,792 .................1,061,242
12/31/2015Non-financial liabilities .................................................................................................................................72,788...............................................................................................................65,880 ..........................................6,908 ...................................................................0 ..................................72,788Non-interest bearingfinancial instruments ...................................................................................................................................371,599.......................................................................................................287,672 ..........................100,343 ..........................................3,899 ..........................391,914Finance lease liability ........................................................................................................................................28,612......................................4.93% ..........................................3,717 ..................................11,594 ..................................25,746 ..................................41,058Variable interest rate instruments ..............................................................619,221......................................3.41% ..................................83,016 ..................................86,275 ..........................573,569 ..........................742,860Fixed interest rate instruments ............................................................................144,829......................................4.58% ..................................10,378 ..........................151,155 ..........................................2,963 ..........................164,496..............................................................................................................................................................................................................................................1,237,049........................................................................................................450,664 ............................356,275 ...........................606,177 .................1,413,116
The “Non-financial liabilities” item consists of prepaid expenses, prepayments, liabilities to employees and for social security benefits, liabilities to tax authorities, and VAT liabilities.
Non-interest bearing financial instruments include trade payables, call/put option liabilities, contingent considera-tion liabilities (earn-out), and other liabilities.
The following table describes the expected maturities of the Group’s primary financial assets. The table below was prepared on the basis of undiscounted contractual maturities of financial assets including interest thereon. The inclusion of information on primary financial assets is necessary in order to understand the liquidity risk man-agement of the Group, since this is done on a net basis.
The following tables show the remaining contractual maturities of the Group’s primary financial liabilities. The tables are based on the undiscounted cash flows from financial liabilities and are based on the earliest date at which the Group can be forced to pay. The table includes both interest and principal payments. If interest
payments are based on variable parameters, the undis-counted amount is determined based on the interest rates at the reporting date. The contractual maturities are based on the earliest date at which the Group can be forced to make payments.
104_Constantia Flexibles IFRS Consolidated Financial Statements 2016 / Notes to the Consolidated Financial Statements

The item “Non-financial assets” consists of deferredincome, prepayments, and advances to employees andsocial benefit receivables, receivables from tax authorities, and VAT receivables.
Non-interest-bearing financial instruments include trade and other receivables.
Variable-rate financial instruments comprise loans recei v-ables, sub-lease receivables, reimbursement claims, and other claims.
Credit riskCredit risk or the risk of delayed payment or non-payment by a counterparty is managed by using credit checks, credit limits, and routine audit procedures. Where possible, the Group obtains state export guarantees or guarantees from private credit insurers in order to reduce the risk of payment default. The Group also limits credit risk by only working with financial partners with excellent credit ratings.
On the assets side, the reported amounts of primary finan-cial instruments represent both the maximum credit and the maximum default risks.
Valuation allowances are recognized for all identified risks, with the result that Management is of the opinion that no other credit risks will arise.
Commodity price riskIn its business activities, Constantia Flexibles is exposed to commodity price risks associated with aluminum. The aluminum risks of the Group are due to the fact that the Constantia Flexibles Group processes aluminum.
The price risks of the commodity listed on the London Metal Exchange (LME) are hedged by standard commo dity futures. Hedges of future cash flows from the acquisition of aluminum are classified as cash flow hedges if the cri-teria for using hedge accounting are met. In other cases, derivatives used to hedge commodity price risks are clas-sified as held for trading. In the area of commodity price hedging, the principle also applies that only derivatives that can be clearly measured and recognized are used.
Risk analysisExchange rate risk: The risk analysis for foreign currencies is carried out based on the net financial position and cash flows in foreign currency operating activities. On average,
Notes to the Consolidated Financial Statements / IFRS Consolidated Financial Statements 2016 Constantia Flexibles_105
(in € thousand) CARRYING AMOUNT UNDISCOUNTED CASH FLOWS Total Weighted Less than 1–5 years Over Total average 1 year 5 years effective interest rate
12/31/2016Non-financial assets ............................................................................................................................................38,486...............................................................................................................30,733 ..........................................7,752 ...................................................................0 ..................................38,486Non-interest bearingfinancial instruments ...................................................................................................................................268,509.......................................................................................................257,529 ..................................11,379 ...................................................................0 ..........................268,908Variable interest rate instruments ......................................................................25,085......................................2.34% ..........................................9,601 ..................................11,966 ..........................................5,380 ..................................26,947Variable interest rate deposits .................................................................................122,622......................................0.38% ..........................122,857 ....................................................................0 ...................................................................0 ..........................122,857........................................................................................................................................................................................................................................................454,701........................................................................................................420,720 ...................................31,097 ..........................................5,380 ...........................457,198
12/31/2015Non-financial assets ............................................................................................................................................28,618...............................................................................................................23,582 ..........................................5,036 ...................................................................0 ..................................28,618Non-interest bearingfinancial instruments ...................................................................................................................................207,683.......................................................................................................207,683 ....................................................................0 ...................................................................0 ..........................207,683Variable interest rate instruments ......................................................................37,985......................................3.48% ..................................18,980 ..................................14,873 ..........................................6,544 ..................................40,397Variable interest rate deposits .........................................................................................61,133......................................0.31% ..................................61,323 ....................................................................0 ...................................................................0 ..................................61,323........................................................................................................................................................................................................................................................335,419........................................................................................................311,568 ...................................19,909 ..........................................6,544 ...........................338,021

the risk horizon for this analysis is about six months, since prices can be adjusted after this period. However, some business activities may have longer maturities.
The risk is calculated based on the net positions per cur-rency existing at the reporting date using the “value at risk” approach. At the reporting date, an effect of €7.1 million for the Group’s income statement may arise from the EUR/ USD exposure. Due to the uncertainty of the EUR/ZAR exchange rate and the high volatility of this currency, the risk amounts to €2.3 million.
The risk of a simultaneous negative development of all 50 currency pairs amounts to €15.1 million. The current foreign currency hedging transactions have maturities until 2019.
Foreign currency management takes place at the level of Constantia Flexibles Holding GmbH, which as the ultimate parent does not form part of the scope of consolidation. Including Constantia Flexibles Holding GmbH, the risk of a simultaneous negative development of all 50 currency pairs amounts to €8.6 million.
Interest rate risk: A rise in interest rates in the eurozone by 1.0% would result in additional interest expense for the variable-rate financial liabilities of €0.6 million. If USD rates were to rise by 1.0%, the net interest expense of the variable-rate USD financial instruments would increase by €1.7 million. If interest rates in all currency areas were to increase by 1.0%, the interest expense of the variable-rate financial liabilities would increase by €2.5 million.
Interest rate risk is managed at the level of Constantia Flexibles Holding GmbH, which as the ultimate parent does not form part of the scope of consolidation. Including Constantia Flexibles Holding GmbH, the effect of a simultaneous rise in interest rates in all currency areas by 1.0% amounts to €2.7 million.
Commodity price risk: If the LME aluminum price were to fall by 10%, the carrying amount of inventories would decrease by €3,188 thousand. The calculation of the sensitivity is based on the aluminum stocks recorded at the closing inventories, in metric tons.
Sensitivity analyses as of December 31, 2016(in € thousand) Change EUR USD Other Total
Exchange rate risksP&L impact of negative developmentof all currencies accordingto market volatility (cash flow at risk) ..................................................................................market volatility ....................................................................0 ..................................(7,188) .................................(7,953) ..........................(15,142) Interest rate risksChange in net interest result dueto a change in interest rates of......................................................................................................................................................................................1% ............................................(615) ..................................(1,713) ...........................................(186) ..................................(2,514) Change AL
Commodity price risksChange in inventory valuation due to an LME aluminum price cut of ...................................................................................................................................................................10% .......................................................................................................................................................................................................................................................................(3,188)
106_Constantia Flexibles IFRS Consolidated Financial Statements 2016 / Notes to the Consolidated Financial Statements

Sensitivity analyses as of December 31, 2015(in € thousand) Change EUR USD Other Total
Exchange rate risksP&L impact of negative developmentof all currencies accordingto market volatility (cash flow at risk) ..................................................................................market volatility ....................................................................0 ............................................(584) .................................(4,648) ..................................(5,232) Interest rate risksChange in net interest result dueto a change in interest rates of......................................................................................................................................................................................1% ............................................(454) ..................................(1,267) ...................................................(61) ..................................(1,782) Change AL
Commodity price risksChange in inventory valuation due to an LME aluminum price cut of ...................................................................................................................................................................10% .......................................................................................................................................................................................................................................................................(3,104)
Primary financial instrumentsThe holdings of primary financial instruments can be seen directly from the balance sheet and the accompanyingdisclosures.
Cash and cash equivalentsThe carrying amounts can be regarded as reasonableestimates of fair value.
Securities included in non-current and current assetsThe fair value of publicly traded securities is based on their current market prices. All securities held by the
Group are classified as available-for-sale assets. Securities that are listed in an active market and for which a quoted price is available are measured at the current market price at the reporting date. If the fair value of equity instruments cannot be reliably determined due to lack of an active market and a quoted price, they are measured at cost plus transaction costs, net of impairment losses.
The breakdown of the long-term securities held at the reporting date is as follows:
(in € thousand) 12/31/2016 12/31/2015
Fund shares ................................................................................................................................................................................................................................................................................................................................................................................................................................................................1,083 .............................................................................................1,084Shares ..............................................................................................................................................................................................................................................................................................................................................................................................................................................................................................2,627 .............................................................................................2,627......................................................................................................................................................................................................................................................................................................................................................................................................................................................................................................................................3,710 ..............................................................................................3,711
Notes to the Consolidated Financial Statements / IFRS Consolidated Financial Statements 2016 Constantia Flexibles_107

Derivative financial instrumentsOnly standard market instruments with sufficient liquidity are used for hedging purposes.
Cash flow hedgesCurrency derivatives are used to hedge future cashflows on uncompleted and forecast foreign currency transactions.
Commodity derivatives are also used to hedge commodity price risks (aluminum) as well as duty premium paid (DPP) on highly probable forecast transactions.
Fair value hedgesForeign exchange forward contracts were entered into and classified as fair value hedges in order to hedge the
financial portfolio. Changes in the fair value of these foreign currency derivatives are reported in net financial income and expense.
Held for tradingForeign currency and commodity derivatives (aluminum, DPP) that do not meet the requirements for hedge ac-counting under IAS 39 with regard to documentation and effectiveness are classified as held for trading. Changes in the fair value of these derivative financial instruments are recognized in profit or loss in the consolidated income statement.
Derivative financial instruments classified as cash flow hedges and recognized in the hedging reserve:
Cash flow hedge 12/31/2016 12/31/2016 12/31/2015 12/31/2015(in € thousand) Currency or Nominal Market value Nominal Market value commodity value1 in € thousand value1 in € thousand
Currency derivativesForwards ..........................................................................................................................................................................................................................USD...................................................Sale ..................................28,167 ..................................(1,727) ..................................19,167 ............................................(859)...............................................................................................................................................................................................................................................................................................................................................................Buy ..........................................6,179 ....................................................172 ..................................................N/A ..................................................N/A.............................................................................................................................................................................................................................................................................GBP...................................................Sale ..........................................1,465 ....................................................(36) ....................................................150 ....................................................................1...............................................................................................................................................................................................................................................................................................................................................................Buy ....................................................................2 ............................................................(0) ..................................................N/A ..................................................N/A.............................................................................................................................................................................................................................................................................EUR......................................................Buy ..........................................9,145 ............................................(574) ..................................................N/A ..................................................N/A...............................................................................................................................................................................................................................................................................SEK......................................................Buy ....................................................262 ............................................................(0) ..................................................N/A ..................................................N/A...............................................................................................................................................................................................................................................................................ZAR...................................................Sale ..................................70,600 ............................................(313) ..................................55,800 ....................................................736 ...............................................................................................................................................................................................................................................................................................................................................................Buy ....................................................568 ............................................................(0) ..................................................N/A ..................................................N/A.............................................................................................................................................................................................................................................................................AUD...................................................Sale ..........................................1,900 ....................................................(24) ..................................................N/A ..................................................N/A...........................................................................................................................................................................................................................................................................MXN...................................................Sale ..........................................3,000 ....................................................................4 ..................................................N/A ..................................................N/A.................................................................................................................................................................................................................................................................................TRY...................................................Sale ..........................................2,000 ............................................................11 ..................................................N/A ..................................................N/A.................................................................................................................................................................................................................................................................................JPY......................................................Buy ..................................25,300 ....................................................................5 ..................................................N/A ..................................................N/A Commodity derivativesLME forward contracts .......................................................................................................................................................AL...................................................Sale ..........................................3,250 ....................................................(89) ..........................................3,875 ....................................................(29)........................................................................................................................................................................................................................................................................................AL......................................................Buy ..................................44,500 ..........................................4,666 ..................................50,575 ..................................(2,496)DPP forward contracts .............................................................................................................................................DPP...................................................Sale ..........................................2,000 ............................................................(1) ..................................................N/A ..................................................N/A..............................................................................................................................................................................................................................................................................DPP......................................................Buy ..........................................6,475 ....................................................(97) ..................................................N/A ..................................................N/A.............................................................................................................................................................................................................................................................................................................................................................................................................................................................................................................1,998 ...........................................................................................................(2,647)
1 Nominal values for currencies reported in thousands, commodities in metric tons of aluminum (AL)
108_Constantia Flexibles IFRS Consolidated Financial Statements 2016 / Notes to the Consolidated Financial Statements

Derivative financial instruments included in fair value hedges or classified as held for trading and recognized in theconsolidated income statement:
Fair value hedge 12/31/2016 12/31/2016 12/31/2015 12/31/2015(in € thousand) Currency or Nominal Market value Nominal Market value commodity value1 in € thousand value1 in € thousand
Forwards...........................................................................................................................................................................................................................................................................MXN...................................................Sale ..................................................N/A ...................................................N/A ..................................80,000 ....................................................310............................................................................................................................................................................................................................................................................RON...................................................Sale ..................................42,200 ............................................................42 ..................................28,000 ....................................................100.............................................................................................................................................................................................................................................................................AUD...................................................Sale ..................................10,100 ....................................................132 ..........................................1,900 ............................................................40...............................................................................................................................................................................................................................................................................................................................................................Buy ....................................................700 ............................................................(7) ..................................................N/A ..................................................N/A.................................................................................................................................................................................................................................................................................TRY...................................................Sale ..................................10,000 ............................................................28 ...............................24,900 ...........................................................(3)...............................................................................................................................................................................................................................................................................................................................................................Buy ..........................................6,000 ....................................................(17) ..................................10,600 ...........................................................(6)..............................................................................................................................................................................................................................................................................USD...................................................Sale ..................................40,300 ............................................(942) ..................................................N/A ..................................................N/A...............................................................................................................................................................................................................................................................................................................................................................Buy ..........................................1,159 ....................................................(41) ..................................................N/A ..................................................N/A.............................................................................................................................................................................................................................................................................EUR......................................................Buy ..........................................4,641 ............................................(701) ..................................................N/A ..................................................N/A.............................................................................................................................................................................................................................................................................GBP......................................................Buy ..........................................3,201 ....................................................(29) ..................................................N/A ..................................................N/A............................................................................................................................................................................................................................................................................................................................................................Sale ..........................................6,400 ............................................................57 ..................................................N/A ..................................................N/A.............................................................................................................................................................................................................................................................................RUB...................................................Sale ....................................................................0 ............................................................21 ..................................................N/A ..................................................N/A...............................................................................................................................................................................................................................................................................SEK......................................................Buy ....................................................149 ............................................................(1) ..................................................N/A ..................................................N/A...............................................................................................................................................................................................................................................................................ZAR...................................................Sale ..................................72,270 ............................................(345) ..................................................N/A ..................................................N/A....................................................................................................................................................................................................................................................................................................................................................................................................................................................................................................(1,802) .................................................................................................................................442
Held for trading 12/31/2016 12/31/2016 12/31/2015 12/31/2015(in € thousand) Currency or Nominal Market value Nominal Market value commodity value1 in € thousand value1 in € thousand
Commodity derivativesForward contracts ...................................................................................................................................................................................AL......................................................Buy ..........................................1,625 ................................................111 ..........................................3,325 ............................................................32........................................................................................................................................................................................................................................................................................AL...................................................Sale ....................................................600 ....................................................(12) ..................................................N/A ..................................................N/A...............................................................................................................................................................................................................................................................................................................................................................................................................................................................................................................................99 ........................................................................................................................................32
1 Nominal values for currencies reported in thousands of Euros, commodities in metric tons of aluminum (AL)
Derivatives classified as held for trading do not meet the hedge accounting requirements under IAS 39. However, they are used to safeguard the business operations and are not held for speculative purposes.
The hedging periods are all based on the maturity of the hedged item. The terms of the currency derivatives extend
to 2019 and commodity derivatives to 2019. The hedged cash flows will be due between 2016 and 2019. Where hedge accounting has been applied, fair value changes that were previously recognized in other comprehensive income are reclassified to the income statement.
Notes to the Consolidated Financial Statements / IFRS Consolidated Financial Statements 2016 Constantia Flexibles_109

Foreign currency hedges realized within the next year amount to (€1,223) thousand and expected long-termrealizations amount to (€649) thousand.
LME hedges realized within the next year amount to €4,016 thousand and expected long-term realizations amount to €661 thousand.
DPP hedges realized within the next year amount to (€77) thousand and expected long-term realizations amount to (€20) thousand.
The notional values are derived from the aggregate gross amount of all purchase and sale amounts of derivative
financial transactions, and commodity derivatives arerecorded in metric tons in the transaction currency.The fair values are derived from the amounts at whichthe financial transactions in question are traded on thereporting date. The fair values of commodity derivatives are based on official aluminum prices on the LME at the reporting date. The fair values of currency forward deriva-tives and interest rate derivatives are determined on the basis of market data at the reporting date.
Additional disclosures on financial instrumentspursuant to IFRS 7Carrying amounts, amounts recognized, and fair valuesby valuation category:
110_Constantia Flexibles IFRS Consolidated Financial Statements 2016 / Notes to the Consolidated Financial Statements
(in € thousand) Carrying value Fair value Cash flow Held for Available Loans and Cash and Other 12/31/2016 hedge hedge trading for sale receivables cash receivables equivalents
AssetsOther non-currentand financial assets .......................................................42,151.......................................................0 ............................................651 ...................................................24 .........................10,741 .........................16,212 ...........................................................0..........................14,524Trade accountsreceivable .....................................................................................................248,637.......................................................0 ...........................................................0 ...........................................................0 ...........................................................0 .................248,637 ...........................................................0............................................................0Other receivables....................................................................47,008........................................400 .................................4,539 ...........................................104 ...........................................................0 .........................18,004 ...........................................................0..........................23,961Cash, cash equivalents,and securities ................................................................................122,622.......................................................0 ...........................................................0 ...........................................................0 ...........................................................0 ...........................................................0 .................122,622............................................................0Total assets ......................................................................................460,418.........................................400 ..................................5,189 ............................................128 ..........................10,741 ...................282,853 ...................122,622...........................38,486
Total per Fair value Cashf low Held for Available level hedge hedge trading for sale
Fair value hierarchyIFRS 13Level 1.....................................................................................................................................1,083.......................................................0 ...........................................................0 ...........................................................0 .................................1,083 ...........................................................................................................................................................................................................
Level 2.....................................................................................................................................5,718........................................400 .................................5,189 ...........................................128 ...........................................................0 ...........................................................................................................................................................................................................
Level 3.....................................................................................................................................6,878.......................................................0 ...........................................................0 ...........................................................0 .................................6,878 ...........................................................................................................................................................................................................
Total .........................................................................................................................................13,680.........................................400 ..................................5,189 ............................................128 ..................................7,962 ...........................................................................................................................................................................................................

(in € thousand) Carrying value Fair value Cash flow At FV Other Accrued 12/31/2016 hedge hedge through financial and other P&L liabilities¹ liabilities
LiabilitiesNon-current liabilities ..........................................................................................................................................................................367,883 ...........................................................0 ...........................................684 .................................9,055 .................348,887..................................9,256Current liabilities ....................................................................................................................................................................................................309,539 .................................2,202 .................................2,508 .........................15,908 .................218,794..........................70,127Trade accounts payable ..............................................................................................................................................................300,849 ...........................................................0 ...........................................................0 ...........................................................0 .................300,849............................................................0Total liabilities ...........................................................................................................................................................................................................978,271 ..................................2,202 ..................................3,192 ..........................24,963 ...................868,530...........................79,384
Totel per Fair value Cash flow At FV level hedge hedge through P&L
Fair value hierarchyIFRS 13Level 1..................................................................................................................................................................................................................................................................................................0 ...........................................................0 ...........................................................0 ...........................................................0 .......................................................................................................................................
Level 2........................................................................................................................................................................................................................................................................5,423 .................................2,202 .................................3,192 ...................................................29 .......................................................................................................................................
Level 3.................................................................................................................................................................................................................................................................24,934 ...........................................................0 ...........................................................0 .........................24,934 .......................................................................................................................................
Total ............................................................................................................................................................................................................................................................................30,357 ..................................2,202 ..................................3,192 ..........................24,963 .......................................................................................................................................
1 The fair value of other financial liabilities is discussed below.
Loans and receivables are measured at amortized cost.
Notes to the Consolidated Financial Statements / IFRS Consolidated Financial Statements 2016 Constantia Flexibles_111
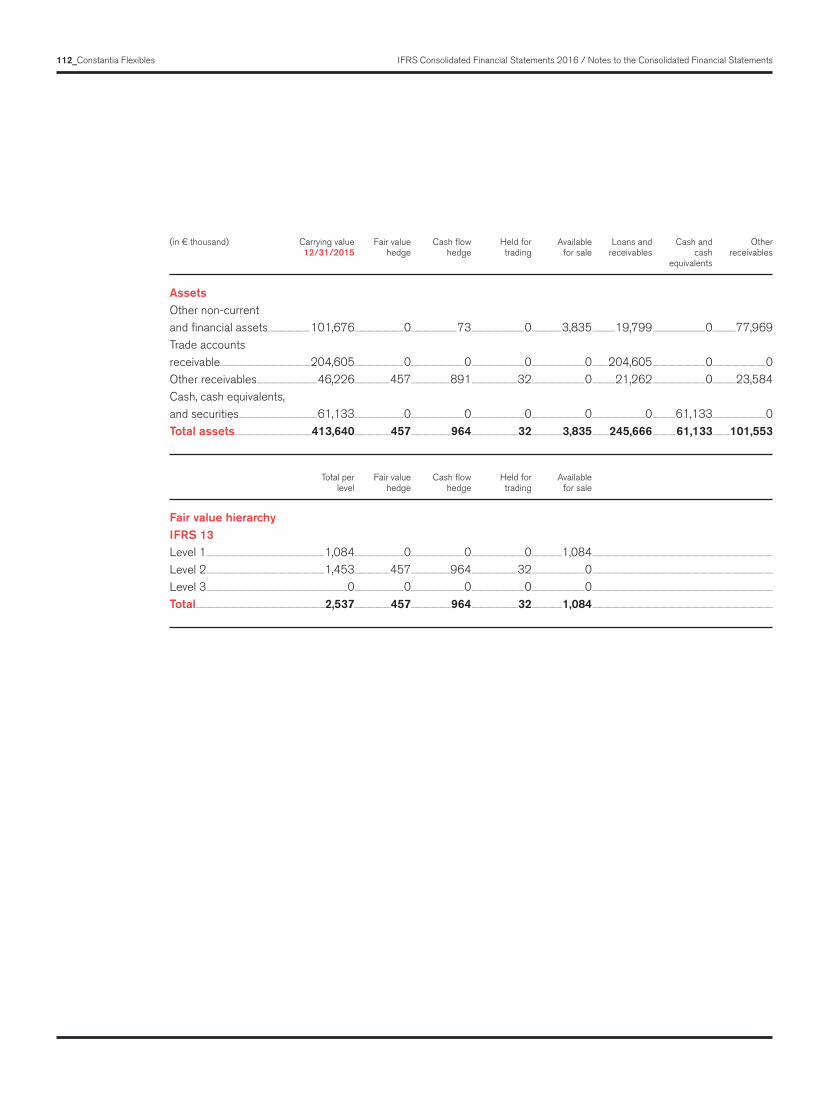
(in € thousand) Carrying value Fair value Cash flow Held for Available Loans and Cash and Other 12/31/2015 hedge hedge trading for sale receivables cash receivables equivalents
AssetsOther non-currentand financial assets ...............................................101,676.......................................................0 ...................................................73 ...........................................................0 .................................3,835 .........................19,799 ...........................................................0..........................77,969Trade accountsreceivable .....................................................................................................204,605.......................................................0 ...........................................................0 ...........................................................0 ...........................................................0 .................204,605 ...........................................................0............................................................0Other receivables....................................................................46,226........................................457 ............................................891 ...................................................32 ...........................................................0 .........................21,262 ...........................................................0..........................23,584Cash, cash equivalents,and securities ........................................................................................61,133.......................................................0 ...........................................................0 ...........................................................0 ...........................................................0 ...........................................................0 .........................61,133............................................................0Total assets ......................................................................................413,640.........................................457 ............................................964 ....................................................32 ..................................3,835 ...................245,666 ..........................61,133...................101,553
Total per Fair value Cash flow Held for Available level hedge hedge trading for sale
Fair value hierarchyIFRS 13Level 1.....................................................................................................................................1,084.......................................................0 ...........................................................0 ...........................................................0 .................................1,084 ...........................................................................................................................................................................................................
Level 2.....................................................................................................................................1,453........................................457 ............................................964 ...................................................32 ...........................................................0 ...........................................................................................................................................................................................................
Level 3...............................................................................................................................................................0.......................................................0 ...........................................................0 ...........................................................0 ...........................................................0 ...........................................................................................................................................................................................................
Total .................................................................................................................................................2,537.........................................457 ............................................964 ....................................................32 ..................................1,084 ...........................................................................................................................................................................................................
112_Constantia Flexibles IFRS Consolidated Financial Statements 2016 / Notes to the Consolidated Financial Statements

(in € thousand) Carrying value Fair value Cash flow At FV Other Accrued 12/31/2015 hedge hedge through financial and other P&L liabilities¹ liabilities
LiabilitiesNon-current liabilities ..........................................................................................................................................................................818,455 ...........................................................0 ...........................................574 .................................7,944 .................802,925..................................7,012Current liabilities ....................................................................................................................................................................................................184,840 ...................................................14 .................................3,038 .........................39,026 .........................73,507..........................69,256Trade accounts payable ..............................................................................................................................................................237,378 ...........................................................0 ...........................................................0 ...........................................................0 .................237,378............................................................0Total liabilities .................................................................................................................................................................................................1,240,674 ....................................................14 ..................................3,612 ..........................46,970 ........1,113,810...........................76,268
Totel per Fair value Cash flow At FV level hedge hedge through P&L
Fair value hierarchyIFRS 13Level 1..................................................................................................................................................................................................................................................................................................0 ...........................................................0 ...........................................................0 ...........................................................0 .......................................................................................................................................
Level 2........................................................................................................................................................................................................................................................................3,626 ...................................................14 .................................3,612 ...........................................................0 .......................................................................................................................................
Level 3.................................................................................................................................................................................................................................................................46,970 ...........................................................0 ...........................................................0 .........................46,970 .......................................................................................................................................
Total ............................................................................................................................................................................................................................................................................50,595 ....................................................14 ..................................3,612 ..........................46,970 ................................................................... ..................................................................
1 The fair value of other financial liabilities is discussed below.
Other receivables and liabilities are not financial instru-ments under IFRS 7. In order to ensure comparabilitywith the balance sheet, they were included in the tables.
Other available-for-sale equity instruments for which there is no listed market price in an active market and whose fair value cannot be reliably determined are initially recog-nized at cost plus transaction costs and are reported at the reporting date, net of any impairment losses. For trade receivables, other receivables, cash and cash equivalents, securities, and trade payables, as well as accrued and other liabilities, the carrying amounts arereasonable approximations of their fair values.
The carrying amount of other current and non-current fi-nancial liabilities is €576,681 thousand (2015: €876,432 thousand). The corresponding fair value (excluding finance leases, put options, and other liabilities) is calculated using
the discounted cash flow method. The discount rate used is 4.06% (2015: 3.66%)
The carrying amount of the liabilities (loans) is a reason-able approximation of the fair value and is €264,581 thousand (2015: €633,785 thousand). It includes a current portion of €71,338 thousand (2015: €63,454 thousand). The discount rate corresponds to the relevant country-specific interest rates for a corresponding credit rating and maturity. The fair values correspond to Level 2 of the fair value hierarchy.
In addition to the loans described above, the “Current lia-bilities” item (“Other financial liabilities” category) includes the fair value of the bond (ISIN AT0000A0V7Q0). The no-tional value of the security is €129,121 thousand (2015: €129,121). In line with its maturity on May 25, 2017, the carrying amount of €128,941 thousand is presented as a current liability (in 2015: non-current liability of €128,843 thousand). The fair value corresponds to the market value
Notes to the Consolidated Financial Statements / IFRS Consolidated Financial Statements 2016 Constantia Flexibles_113
according to the Vienna Stock Exchange on December 31, 2016, and corresponds to Level 1 of the fair value hierarchy. The fair value of the bond is €130,580 thousand (2015: €131,251 thousand).
Fair value hedges, cash flow hedges, and financial instru-ments held for trading are classified as Level 2 because the fair values of these financial instruments are based on market-derived inputs.
Disclosures on the “Loans and receivables/payables” measurement categoryThe fair values of other non-current assets and financial assets and non-current liabilities represent the present value of payments associated with the assets or liabilities in consideration of the current interest rate inputs that re-flect market- and counterparty-related changes in condi-tions and expectations. The measurement categories of the fair value hierarchy are as follows:
Level 1: Fair values are determined based on publicly quoted market prices. Level 2: Fair values are estimated based on the results of a valuation technique that uses the data from the market and is based as little as possible on company- specific data. Level 3: Fair value measurements are those that arise from models, using inputs that are not based on obser v-able market data (unobservable inputs, assumptions) to measure assets or liabilities.
The fair values for Level 2 measurement of simple over- the-counter derivative financial instruments, available- for-sale financial assets, and liabilities held for trading are determined by reference to prices quoted by brokers. These quotations are tested for plausibility by discounting the expected future cash flows using market interest rates for similar instruments relevant at the measurement date. The fair value reflects the credit risk of the instrument and includes adjustments to adequately consider the credit risk of the Group entity and the counterparty where appropriate.
The Group recognizes transfers between measurement levels at the end of the reporting period in which a reclas-sification occurs. In the twelve months of fiscal year 2016, there were no reclassifications between Level 1, Level 2, and Level 3.
Level 3 fair valuesThe Group has established a control system related to the measurement of fair value. In line with the control system, a measurement team has been nominated that reports directly to the Chief Financial Officer, and which has over-all responsibility for all significant fair value measurements, including Level 3 measurements.
The measurement team regularly reviews significant unobservable inputs and measurement adjustments. If third-party data such as broker quotes is used to measure fair value, the measurement team evaluates and docu-ments the evidence obtained from third parties and as-sesses whether these measurements are consistent with the IFRS requirements. This assessment includes the proper classification in the hierarchy.
Financial instruments at fair value through profit or loss include contingent purchase prices. Contingent selling prices are classified as “available for sale.” Details on the measurement of Level 3 fair values in the twelve months of fiscal year 2016 are shown in the following table.
114_Constantia Flexibles IFRS Consolidated Financial Statements 2016 / Notes to the Consolidated Financial Statements

(in € thousand) Contingent consideration Contingent consideration (selling price) (purchase price)
Balance at January 1, 2016 ..................................................................................................................................................................................................................................................................................................................................................................................................0 ......................................................................................46,970Addition through acquisition ........................................................................................................................................................................................................................................................................................................................................................................7,000 ......................................................................................13,128Disposal through payment ............................................................................................................................................................................................................................................................................................................................................................................................................0 ..............................................................................(35,939)Total gains and losses for the periodincluded in other comprehensive income: Fair value adjustment ..................................................................................................................................................................................................................................................................................................................................................................................................................0 ...........................................................................................................................-Total gains and losses for the periodincluded in profit or loss: Fair value adjustment .....................................................................................................................................................................................................................................................................................................................................................................................................................- ..............................................................................................1,159 Net finance income and expense .........................................................................................................................................................................................................................................................................................................................................54 ........................................................................................................869 Currency translation differences ..............................................................................................................................................................................................................................................................................................................................(176) ......................................................................................(1,251)Balance as of December 31, 2016......................................................................................................................................................................................................................................................................................................................6,878 .......................................................................................24,936
(in € thousand) Contingent consideration Contingent consideration Aluprint Plegadizos Pemara Group
Base currency ........................................................................................................................................................................................................................................................................................................................................................................................................................................................MXN ....................................................................................................AUDAnnual sales growth .....................................................................................................................................................................................................................................................................................................................................................................................................................................................................................................................................................................................
Unobservable input parameter used ....................................................................................................................................................................................................................................................................................................14.2% ..................................................................................................5.8% Effect from +0.5% points adjustment ........................................................................................................................................................................................................................................................................................................108 ........................................................................................................(43) Effect from -0.5% points adjustment......................................................................................................................................................................................................................................................................................................(108) ................................................................................................................43EBITDA margin ..............................................................................................................................................................................................................................................................................................................................................................................................................................................................................................................................................................................................................
Unobservable input parameter used ....................................................................................................................................................................................................................................................................................................14.3% ..........................................................................................15.3% Effect from +0.5% points adjustment ........................................................................................................................................................................................................................................................................................................865 ................................................................................................(300) Effect from -0.5% points adjustment......................................................................................................................................................................................................................................................................................................(865) ........................................................................................................300Risk adjusted interest rate ....................................................................................................................................................................................................................................................................................................................................................................................................................................................................................................................................................
Unobservable input parameter used ............................................................................................................................................................................................................................................................................................................5.8% ..................................................................................................2.4% Effect from +0.5% points adjustment ....................................................................................................................................................................................................................................................................................................... (64) ........................................................................................................200 Effect from -0.5% points adjustment......................................................................................................................................................................................................................................................................................................................66 ................................................................................................(207)
Contingent purchase price and contingent selling priceContingent purchase prices result from the acquisitionsof the Spear Group, the Pemara Group, and Oai Hung, and from the sale of Aluprint Plegadizos.
The disposal through payment concerns a progresspayment in connection with the acquisition of the Spear Group. The amount remaining after deducting the pay-ment already made is not subject to additional adjustment
with respect to sales, EBITDA, or the interest rate.A sensitivity analysis is not conducted.
Sensitivity analysisThe fair values correspond to the expected paymentsdiscounted to present value using a risk-adjusted interest rate. The inputs used and the sensitivities of the individual contingent purchase prices are as follows:
Notes to the Consolidated Financial Statements / IFRS Consolidated Financial Statements 2016 Constantia Flexibles_115

The change in the “held for trading” category is mainlyattributable to ineffectively hedged and traded financial instruments.
The “cash flow hedge” category includes income andexpenses from derivatives that serve to hedge operating risks. Further details on the income and expenses arecontained in Section J, Notes to the Consolidated Income Statement, Note 1, Sales and cost of materials.
The effective fair value hedge of forward currencytransactions in the amount of (€2,120) thousand
The expected payment from the sale of Aluprint Plegadizos was calculated based on the forecast EBITDA and fore-cast net debt. Management is responsible for the exercise date, which will be based on the 2017 figures.
The expected payment by the Pemara Group was calcu-lated based on the forecast EBITDA and forecast net debt. Management is responsible for the exercise date, which was set between 2019 and 2020.
The purchase price for Oai Hung comprises a payment that has already been made and two subsequent contin-gent purchase price payments (in 2017 and 2018). The purchase price is limited by a contractually agreed cap: As things stand today, this cap will be largely (>90%) utilized within the next six months. The remaining amount
(2015: €11,713 thousand) is partly offset by foreign exchange gains on loans.
The change in the “amortized cost” category is mainly due to the realized and unrealized currency gains and losses of (€2,379) thousand (2015: (€17,304) thousand), the gain or loss on the disposal of associates amounting to (€75) thousand (2015: €0 thousand), and the change in the al-lowance for doubtful accounts in the amount of €41 thou-sand (2015: €710 thousand).
will be used in 2018. Based on these inputs, the variability in the residual liability, which is not disclosed for reasons of materiality, will be minimal.
If one or more of the significant unobservable inputs were to be replaced by reasonable possible alternatives, this would have the effects presented on the fair value of the contingent consideration. These effects were calculated by replacing the underlying assumptions with alternative estimates of unobservable inputs that might reasonably have been applied by market participants when measuring the contingent consideration. It is assumed that interac-tions between the individual unobservable inputs have no significant impact on the range of reasonably possible alternative assumptions.
(in € thousand) 2016 2015
Held for trading................................................................................................................................................................................................................................................................................................................................................................................................................................................................75 ...............................................................................................(729)Cash flow hedge ..............................................................................................................................................................................................................................................................................................................................................................................................................................(1,001) .....................................................................................(6,008)Fair value hedge ................................................................................................................................................................................................................................................................................................................................................................................................................................(2,120) .....................................................................................11,076Available for sale........................................................................................................................................................................................................................................................................................................................................................................................................................................................(1) ...............................................................................................(454)Loans and receivables/liabilities1
.....................................................................................................................................................................................................................................................................................................................................(2,413) .............................................................................(18,024).............................................................................................................................................................................................................................................................................................................................................................................................................................................................................................................................(5,460) .............................................................................(14,139)
1 Measured at amortized cost
Net gains and losses on financial instruments by category:
116_Constantia Flexibles IFRS Consolidated Financial Statements 2016 / Notes to the Consolidated Financial Statements

M. Contingent Liabilities/Receivables and Contingencies
Contingent liabilities are not recognized in the consolidated balance sheet, except in the case of contingent liabilities accounted for under IFRS 3. They are disclosed when the outflow of resources embodying economic benefits is pos-sible, but the requirements for recognition of a provisionare not met.
A contingent asset is not recognized in the consolidated financial statements, but is disclosed when an inflow ofeconomic benefit is probable.
LitigationAll material litigation in the Constantia Flexibles Group is described in detail in Section I, Notes to the Consolidated Balance Sheet, Note 11, Material litigation.
Environmental contaminationThe Constantia Flexibles Group is not aware of any signifi-cant environmental contamination at the reporting date that has a more than negligible probability of occurrence.
(in € thousand) 2016 2015
Discounted bank drafts ............................................................................................................................................................................................................................................................................................................................................................................................................................3 ...............................................................................................................74Bank guarantees received .............................................................................................................................................................................................................................................................................................................................................................................................291 .......................................................................................................334.................................................................................................................................................................................................................................................................................................................................................................................................................................................................................................................................................294 ........................................................................................................408
Other
Notes to the Consolidated Financial Statements / IFRS Consolidated Financial Statements 2016 Constantia Flexibles_117
The bank guarantees received relate mainly to a building deposit.
Since July 1, 2015, Constantia Flexibles Group GmbHhas been party to a loan agreement of Constantia Flexi-bles Holding GmbH in the amount of €1,340 million asan additional guarantor. Moreover, collateral agreements (pledging of bank accounts, receivables, and shares) were entered into by Constantia Flexibles Group GmbH. The
liability of Constantia Flexibles Group GmbH from guaran-tee undertakings and collateral agreements was limitedby contractual terms to the permissible extent, according to the national capital maintenance provisions (“limitation clauses”). The purpose of the limitation clause is to limit the scope of the guarantees and collateral to those amounts which correspond to the national capital mainte-nance rules and the explicit statement in the respective contracts that the mandatory provisions of the national

(in € million) 2016 2015
Share-based payments ...................................................................................................................................................................................................................................................................................................................................................................................................................0.0 .............................................................................................................3.3Current due payments ........................................................................................................................................................................................................................................................................................................................................................................................................................8.2 .....................................................................................................11.2Benefits for termination of contract ........................................................................................................................................................................................................................................................................................................................................(1.3) .............................................................................................................3.8Post-employment benefits ..................................................................................................................................................................................................................................................................................................................................................................................................0.2 .............................................................................................................0.3.....................................................................................................................................................................................................................................................................................................................................................................................................................................................................................................................................................7.1 .....................................................................................................18.6
118_Constantia Flexibles IFRS Consolidated Financial Statements 2016 / Notes to the Consolidated Financial Statements
capital maintenance provisions are applicable. This can also lead to a situation in which the amount secured in the appropriate guarantees and collateral is zero. The extent to which a liability actually exists cannot be conclusively confirmed at present.
In addition, Constantia Flexibles Group GmbH has issued a guarantee of €15 million in favor of Bank BNP Fortis to secure a loan of Parikh Packaging Pvt. Ltd.
N. Related Party Disclosures
The ultimate controlling company of Constantia Flexibles Group GmbH is Wendel S.E., which is based in Paris, France. The consolidated financial statements are pub-lished at the Commercial Court in Paris, France.
All business transactions between the companies within the Group and related entities and individuals have been conducted on an arm’s length basis.
A loan of €400 thousand (2015: €171 thousand) to the Management Board was outstanding at the end of the re-porting period. The interest rate is 1%. The loan matures in June 2018. A loan was repaid by an amount of €135 thousand (2015: €31 thousand) in the reporting period. The interest rate was 3.5%.
No other material transactions of any kind, in particular contracts for the sale of significant assets, were entered into. The key management personnel of Constantia Flexibles were awarded the following compensationin 2016:

Performance-based compensation currently amounts to an average of 50% of total compensation and is linked to the achievement of certain key performance figures. The earnings targets are specified as part of a multi-year budget. The exemption provision of Section 266 no. 7 UGB is exercised.
A consulting agreement was entered into with a member of the Management Board in 2016. It commences on the day after the termination of the employment relationship, for a period of two years, with the right to terminate the agreement after the expiration of twelve months and in compliance with the notice period. The consulting activities are compensated on the basis of a flat fee per consulting day, for at least 65 consulting days per year.
In addition, there is a D&O liability insurance for the mem-bers of the Management Board of Constantia Flexibles Group GmbH. The premium amounts to €75 thousand (2015: €75 thousand).
Since 2013, occupational pension provisions for the mem-bers of the Management Board have been made via con-tribution-based insurance plans, for which the Company carries no obligation to make additional contributions. In addition, there are also performance-based insurance plans.
As of October 20, 2016, Constantia Flexibles Group GmbH has had its own Supervisory Board again. There is also a Supervisory Board at Constantia Flexibles Holding GmbH, some of whose members are also members of the Super-visory Board of Constantia Flexibles Group GmbH. There were no Supervisory Board expenses at Constantia Flexibles Group GmbH in 2016.
A loan of €1,528 thousand was extended to the non- consolidated entity Constantia San Prospero S.r.l. as of December 31, 2016. Supply and service relationships with Group holding com-panies in fiscal year 2016:
(in € thousand) Received (+) Receivables Payables and completed (-)
Constantia Flexibles Holding GmbH ........................................................................................................................................................................................................................(19,317) ........................................................................6,944 ........................................................187,859Constantia Flexibles GmbH .........................................................................................................................................................................................................................................................................................................34 ........................................................................1,705 ..........................................................................................34Constantia Flexibles Beteiligungs GmbH ................................................................................................................................................................................................................................22 ..................................................................................892 ..................................................................................................0 .................................................................................................................................................................................................................................................................................................................................................................................................................................(19,261) ........................................................................9,541 .........................................................187,893
Notes to the Consolidated Financial Statements / IFRS Consolidated Financial Statements 2016 Constantia Flexibles_119

O. Auditors’ Fees
Pursuant to § 238 No. 18 of the Austrian Commercial Code (UGB), audit fees due in the reporting year are reportedin the consolidated financial statements of Wendel Group SE.
120_Constantia Flexibles IFRS Consolidated Financial Statements 2016 / Notes to the Consolidated Financial Statements
Supply and service relationships with Group holding companies in fiscal year 2015:
(in € thousand) Received (+) Receivables Payables and completed (-)
Constantia Flexibles Holding GmbH ........................................................................................................................................................................................................................(14,963) ..................................................................................633 ........................................................593,602Constantia Flexibles Beteiligungs GmbH ................................................................................................................................................................................................................................14 ....................................................................................................................................................................................................................
Constantia Flexibles GmbH .........................................................................................................................................................................................................................................................................................................34 ....................................................................................................................................................................................................................
Constantia Lux Parent S.A. .......................................................................................................................................................................................................................................................................................................................................................................................................................22 ..........................................................................................................
.................................................................................................................................................................................................................................................................................................................................................................................................................................(14,915) ...................................................................................655 .........................................................593,602

Interest in % Interest in %Name Location directly* indirectly** Fully consolidated
Constantia Flexibles International GmbH ..............................................................................................................................................................................................................Vienna, A .....................................................................................................................100.00 .........................................................................100.00 H&N Suzhou Packaging Materials Co. Ltd. .................................................................................................................................................................................Taicang, RC ..........................................................................................................100.00 .........................................................................100.00 Constantia CM Labels SDN. BHD....................................................................................................................................................................................................................Kuala Lumpur, MAL ........................................................................100.00 .........................................................................100.00 Constantia Flexibles DMCC ................................................................................................................................................................................................................................................Dubai, UAE ............................................................................................................100.00 .........................................................................100.00 Constantia Flexibles Sales B.V. ...................................................................................................................................................................................................................................Gameren, NL ...................................................................................................100.00 .........................................................................100.00 Constantia St. Petersburg OOO ...............................................................................................................................................................................................................................St. Petersburg, RUS.............................................................................99.90 ...............................................................................99.90 Afripack Holdings Pty. Ltd. ......................................................................................................................................................................................................................................................Mobeni, ZA ..................................................................................................................95.00 ...............................................................................95.00 Afripack International ............................................................................................................................................................................................................................................................................Pailles, MU .............................................................................................................100.00 ...............................................................................95.00 Afriflex East Africa Ltd. ...............................................................................................................................................................................................................................................Embakasi, KE .................................................................................................100.00 ...............................................................................95.00 Standard Labels Ltd. .........................................................................................................................................................................................................................................................Pailles, MU .............................................................................................................100.00 ...............................................................................95.00 Afripack Consumer Flexibles Pty. Ltd. .......................................................................................................................................................................................................Mobeni, ZA ..................................................................................................................74.00 ...............................................................................70.30 Bag and Pouch Converters Pty. Ltd. .........................................................................................................................................................................................Muizenberg, ZA ...............................................................................................51.00 ...............................................................................35.85 Afripack Pty. Ltd.................................................................................................................................................................................................................................................................................................Durban, ZA ..................................................................................................................74.00 ...............................................................................70.30 CF Australia Holding Pty. Ltd. ......................................................................................................................................................................................................................................Sydney, AU ............................................................................................................100.00 .........................................................................100.00 CF Australia Pty. Ltd. ...........................................................................................................................................................................................................................................................................Sydney, AU ............................................................................................................100.00 .........................................................................100.00 Cunamara Investments Pty. Ltd. ...............................................................................................................................................................................................................................Victoria, AU ...........................................................................................................100.00 .........................................................................100.00 Pemara Pty. Ltd. .............................................................................................................................................................................................................................................................................Victoria, AU ...........................................................................................................100.00 .........................................................................100.00 Pemara Asia Holding Pte Ltd. ...................................................................................................................................................................................................................Singapur, SG.....................................................................................................100.00 .........................................................................100.00 Pemara Labels (Vietnam) Ltd. .............................................................................................................................................................................................Binh Duong Province, VN ...............................................100.00 .........................................................................100.00 Pemara Labels (Malaysia) SDN. BHD. .........................................................................................................................................................Selangor, MAL..............................................................................................100.00 .........................................................................100.00 PT. Pemara Labels Indonesia ................................................................................................................................................................................................Jababeka Cikarang-Bekasi, ID .........................100.00 .........................................................................100.00 Pemara Labels (Philippines) Inc. ...................................................................................................................................................................................Laguna, PH ..........................................................................................................100.00 .........................................................................100.00 Constantia Teich GmbH .................................................................................................................................................................................................................................................................Weinburg, A .........................................................................................................100.00 .........................................................................100.00 Constantia Flexibles Poland Holding Sp.Z.o.o. ...............................................................................................................................................Krakau, PL .............................................................................................................100.00 .........................................................................100.00 Constantia ColorCap Sp. z.o.o. .................................................................................................................................................................................................................Jejkowice, PL .................................................................................................100.00 .........................................................................100.00 Constantia Verpackungen Deutschland GmbH ..........................................................................................................................................Wangen im Allgäu, D ...................................................................100.00 .........................................................................100.00 Constantia Aloform GmbH ................................................................................................................................................................................................................................Werdohl, D ..............................................................................................................100.00 .........................................................................100.00 Constantia Imballaggi SRL ...............................................................................................................................................................................................................................Schio, I...............................................................................................................................100.00 .........................................................................100.00 Constantia Emballage France SARL ......................................................................................................................................................................................Versailles, F ..........................................................................................................100.00 .........................................................................100.00 Corona Packaging ApS .............................................................................................................................................................................................................................................Ishoej, DK .................................................................................................................100.00 .........................................................................100.00 Constantia Sittingbourne Ltd. ...............................................................................................................................................................................................Sittingbourne, GB ................................................................................100.00 .........................................................................100.00 Constantia Jeanne d’Arc SAS ...................................................................................................................................................................................................................Joinville, F .................................................................................................................100.00 .........................................................................100.00 Constantia Flexibles Sales AB ................................................................................................................................................................................................................Stockholm, S .....................................................................................................100.00 .........................................................................100.00 Constantia Flexibles Sales Ltd. ..............................................................................................................................................................................................................Girvan, GB ..............................................................................................................100.00 .........................................................................100.00 Constantia Tobepal S.L.U......................................................................................................................................................................................................................................Logroño, E ..............................................................................................................100.00 .........................................................................100.00 Constantia Oai Hung Manufacturing Joint Stock Company .................................................................Ho Chi Minh City, VN ........................................................................51.00 ...............................................................................51.00 Asas Ambalaj A.S. ....................................................................................................................................................................................................................................................................Ankara, TR..............................................................................................................100.00 .........................................................................100.00 Constantia Flexibles Bucuresti S.R.L. ...............................................................................................................................................................Budesti, RO .........................................................................................................100.00 .........................................................................100.00 Constantia Flexibles Sales GmbH .................................................................................................................................................................................................Vienna, A .....................................................................................................................100.00 .........................................................................100.00 Constantia Patz Ges.m.b.H. ..............................................................................................................................................................................................................................Natschbach-Loipersbach, A ......................................100.00 .........................................................................100.00 Constantia Teich Poland Sp. z.o.o. ...................................................................................................................................................................................................Kleszczów, PL................................................................................................100.00 .........................................................................100.00 CJSC Constantia Kuban .........................................................................................................................................................................................................................................Timashevsk, RUS .................................................................................100.00 .........................................................................100.00 Constantia Hueck Folien GmbH & Co KG ...............................................................................................................................................................Pirk, D .................................................................................................................................100.00 .........................................................................100.00 HC Beteiligungs GmbH.......................................................................................................................................................................................................................Pirk, D .................................................................................................................................100.00 .........................................................................100.00 Constantia Louvain BVBA .......................................................................................................................................................................................Louvain-La-Neuve, B ..................................................................100.00 .........................................................................100.00 Constantia Flexibles Sales s.r.o ...................................................................................................................................................................Marianske Lazne, CZ ..................................................................100.00 .........................................................................100.00 Constantia Hueck Folien Geschäftsführungs GmbH ...................................................................................................................Pirk, D .................................................................................................................................100.00 .........................................................................100.00 Constantia Flexibles America Co. .........................................................................................................................................................................................................................Blythewood, USA..................................................................................100.00 .........................................................................100.00 Constantia Blythewood LLC..........................................................................................................................................................................................................................Blythewood, USA..................................................................................100.00 .........................................................................100.00
P. Group Entities
Notes to the Consolidated Financial Statements / IFRS Consolidated Financial Statements 2016 Constantia Flexibles_121

Interest in % Interest in %Name Location directly* indirectly**
Constantia Colmar LLC ..............................................................................................................................................................................................................................................Colmar, USA ......................................................................................................100.00 .........................................................................100.00 Constantia Flexibles Sales LLC ............................................................................................................................................................................................................Barrington, USA .......................................................................................100.00 .........................................................................100.00 GPC Holdings Coöperatif UA.........................................................................................................................................................................................................................................Amsterdam, NL .........................................................................................100.00 .........................................................................100.00 GPC Holdings BV ....................................................................................................................................................................................................................................................................Amsterdam, NL .........................................................................................100.00 .........................................................................100.00 Aluprint S de R.L. de C.V. ..................................................................................................................................................................................................................San Luis Potosí, MX ......................................................................100.00 .........................................................................100.00 Global Packaging USA Corp. .................................................................................................................................................................................................Miami, USA ...........................................................................................................100.00 .........................................................................100.00 GPC III BV ..............................................................................................................................................................................................................................................................................Amsterdam, NL .........................................................................................100.00 .........................................................................100.00 GPC III Packaging Holdings Mexico S de R.L. de C.V. ...................................................................Monterrey, MX ..............................................................................................100.00 .........................................................................100.00 Grafo Regia S.A. de C.V. ...........................................................................................................................................................................Monterrey, MX ..............................................................................................100.00 .........................................................................100.00 Parikh Packaging Pvt. Ltd..............................................................................................................................................................................................................Ahmedabad, IN ................................................................................................75.00 ...............................................................................75.00 SGH (No. 2) Ltd. ...............................................................................................................................................................................................................................................................................................Cwmbran, GB .................................................................................................100.00 .........................................................................100.00 Spear Group Holdings Ltd. ...............................................................................................................................................................................................................................Cwmbran, GB .................................................................................................100.00 .........................................................................100.00 Spearsystem Packaging (Asia) PTE Ltd..................................................................................................................................................Singapore, SG ...............................................................................................100.00 .........................................................................100.00 Spear Ltd. .................................................................................................................................................................................................................................................................................Cwmbran, GB .................................................................................................100.00 .........................................................................100.00 Spear Europe Ltd. ..........................................................................................................................................................................................................................Cwmbran, GB .................................................................................................100.00 .........................................................................100.00 Spearsystem Packaging (Africa) (Pty) Ltd....................................................................................................................Boksburg, SA ........................................................................................................74.90 ...............................................................................74.90 Spear USA Inc. .......................................................................................................................................................................................................................................Mason, USA ........................................................................................................100.00 .........................................................................100.00 Gardoc Inc. ..................................................................................................................................................................................................................................Milford, USA .......................................................................................................100.00 .........................................................................100.00 Precision Printing and Packaging Inc. ..................................................................................................................Clarksville, USA .........................................................................................100.00 .........................................................................100.00 Constantia Flexibles Germany GmbH .......................................................................................................................................................................................................Frankfurt, D ..........................................................................................................100.00 .........................................................................100.00 Constantia Shared Service Germany GmbH ......................................................................................................................................................Pirk, D .................................................................................................................................100.00 .........................................................................100.00 Constantia Fromm GmbH ....................................................................................................................................................................................................................................Remshalden-Geradstetten, D ...............................100.00 .........................................................................100.00 Constantia Labels GmbH .....................................................................................................................................................................................................................................Heiligenstadt, D ........................................................................................100.00 .........................................................................100.00 Constantia Nusser GmbH ..............................................................................................................................................................................................................Wangen im Allgäu, D ...................................................................100.00 .........................................................................100.00 Constantia Ebert GmbH .....................................................................................................................................................................................................................Wiesbaden, D ..................................................................................................100.00 .........................................................................100.00 Haendler & Natermann GmbH ...............................................................................................................................................................................................................Hann. Münden, D ..................................................................................100.00 .........................................................................100.00 Haendler & Natermann Iberica SLU ...................................................................................................................................................................Sevilla, E .......................................................................................................................100.00 .........................................................................100.00 Haendler et Natermann Benelux SPRL/BVBA ...................................................................................................................Waterloo, B............................................................................................................100.00 .........................................................................100.00 Verstraete in mould labels N.V. .....................................................................................................................................................................Maldegem, B ..........................................................................................................51.00 ...............................................................................51.00 Novis Casa de Editura si Tipografia S.R.L. ...........................................................................................................................................Cluj- Napoca, RO ..................................................................................100.00 .........................................................................100.00 SAS Sim‘EDIT ...............................................................................................................................................................................................................................................................Ablis, F ..............................................................................................................................100.00 .........................................................................100.00 SAS SIM’EDIT Imprimeurs ......................................................................................................................................................................................Couëron, F ....................................................................................................................99.99 ...............................................................................99.99 Exprim SARL ..............................................................................................................................................................................................................................................Ablis, F ..............................................................................................................................100.00 .........................................................................100.00 SIM’Label Inc. ............................................................................................................................................................................................................................................Cowansville, CAN .................................................................................100.00 .........................................................................100.00 Etipack SARL............................................................................................................................................................................................................................................Vittel, F..............................................................................................................................100.00 .........................................................................100.00 Printer Labels Inc. ...........................................................................................................................................................................................................................Ontario, USA .....................................................................................................100.00 .........................................................................100.00Constantia Finance Holding GmbH .....................................................................................................................................................................................................................................Vienna, A .....................................................................................................................100.00 .........................................................................100.00 Constantia Shared Service Austria GmbH ....................................................................................................................................................................................Weinburg, A .........................................................................................................100.00 .........................................................................100.00Eveku Österreich GmbH....................................................................................................................................................................................................................................................................................Vienna, A .....................................................................................................................100.00 .........................................................................100.00 Eveku Spain SL. .................................................................................................................................................................................................................................................................................................Madrid, E .....................................................................................................................100.00 .........................................................................100.00 Eveku Deutschland GmbH .....................................................................................................................................................................................................................................................Hann. Münden, D ..................................................................................100.00 .........................................................................100.00 Eveku Netherlands BV......................................................................................................................................................................................................................................................................Amsterdam, NL .........................................................................................100.00 .........................................................................100.00 Eveku Belgium SPRL ..........................................................................................................................................................................................................................................................................Liege, B..........................................................................................................................100.00 .........................................................................100.00
* From the perspective of the direct parent companies** From the perspective of the Constantia Flexibles Group GmbH
122_Constantia Flexibles IFRS Consolidated Financial Statements 2016 / Notes to the Consolidated Financial Statements

For the Management BoardVienna, March 31, 2017
Alexander BaumgartnerChief Executive Officer
Stephan KühneChief Financial Officer
Q. Other Disclosures
Events after the end of the reporting periodTalks concerning the potential sale of the Labels Division took place in the first quarter of 2017. A substantiationof the sales process is currently still not foreseeable, which is why it is not possible to provide any details about the financial dimension of a potential sale. There is currently a project to support a potential transaction, as well as a structuring of the planned sales process. A sale could be realized within the next 12 months – as of the publication date of these consolidated financial statements. The business intended for a potential sale achieved sales of € 604.7 million euro and EBITDA of € 100.8 million euro in 2016.
On March 1, 2017, the Constantia Flexibles Group agreed to acquire TR Alucap S.r.l., Italy’s leading dairy lidding man-ufacturer. The transaction was made with immediate effect. TR Alucap has over 50 employees and is domiciled in Borgo Valsugana near Trento, the region that is home to
the largest number of yoghurt manufacturers in Italy. Until the acquisition, the plant was owned by two private equity firms, and reported annual sales of almost €20 million. The company specializes in manufacturing aluminum die-cut lids and plastic films for local dairies and international food manufacturers.
Governing bodies of the GroupThe following people were active in the reporting period:
a. On the Management Board Alexander Baumgartner Peter Alexander Frauenknecht (until 4/30/2016) Stephan Kühne (since 10/21/2016)
b. On the Supervisory Board Roland Lienau, Chairman (since 10/20/2016) Albrecht von Alvensleben, member (since 10/20/2016) Patrick Tanguy, member (since 10/20/2016) Ulrich Köstlin, member (since 10/20/2016) Mathias Hlubek, member (since 10/20/2016)
Notes to the Consolidated Financial Statements / IFRS Consolidated Financial Statements 2016 Constantia Flexibles_123

For the Management BoardVienna, March 31, 2017
Alexander BaumgartnerChief Executive Officer
Stephan KühneChief Financial Officer
Statement of the legal representative pursuant to§ 82 Para. 4 Z 3 of the austrian stock exchange actI hereby confirm that, to the best of my knowledge, theconsolidated financial statements, prepared in accordancewith the applicable accounting standards, convey thetruest possible representation of the net assets, finances,and earnings of the Group, that the Group managementreport represents the Group’s business developments,business results, and overall situation in such a way as toensure the truest possible representation of the net as-sets, finances, and earnings of the Group, and that theGroup management report describes the main risks anduncertainties to which the Group is exposed.
I hereby confirm that, to the best of my knowledge, thefinancial statements of the parent company, prepared inaccordance with the applicable accounting standards,convey the truest possible representation of the netassets, finances, and earnings of the Company, that themanagement report represents the Company’s businessdevelopment, business results, and overall situation insuch a way as to ensure the truest possible representationof the net assets, finances, and earnings, and that themanagement report describes the significant risks anduncertainties to which the Company is exposed.
Statement of the Management Board
124_Constantia Flexibles IFRS Consolidated Financial Statements 2016 / Statement of the Management Board

Auditor’s Report
Auditor’s Report / IFRS Consolidated Financial Statements 2016 Constantia Flexibles_125
Report on the Consolidated Financial Statements
Audit OpinionWe have audited the consolidated financial statements of Constantia Flexibles Group GmbH, Vienna, and its sub-sidiaries (the Group), which comprise the consolidated balance sheet as at December 31, 2016, the separate consolidated income statement, the consolidated state-ment of comprehensive income, the consolidated state-ment of cash flows and the consolidated statement of changes in equity for the fiscal year then ended, and the notes to the consolidated financial statements.
In our opinion, the accompanying consolidated financial statements comply with legal requirements and give a true and fair view of the financial position of the Group as at December 31, 2016, and of its financial performance and cash flows for the year then ended in accordance with the International Financial Reporting Standards (IFRSs) as adopted by the EU and the additional requirements under Section 245a Austrian Commercial Code.
Basis for OpinionWe conducted our audit in accordance with Austrian generally accepted auditing standards. Those standards require the application of the International Standards on Auditing (ISAs). Our responsibilities under those provisions and standards are further described in the “Auditor’s Responsibilities for the Audit of the Consolidated Financial Statements” section of our report. We are independent of the Group in accordance with Austrian Generally Accept-ed Accounting Principles and professional requirements, and we have fulfilled our other ethical responsibilities in accordance with these requirements. We believe that the audit evidence we have obtained is sufficient and appro-priate to provide a basis for our opinion.
Key Audit MattersKey audit matters are those matters that, in our professional judgment, were of most significance in our audit of the consolidated financial statements of the fiscal year. These matters were addressed in the context of our audit of the consolidated financial statements as a whole, and in form-ing our opinion thereon, and we do not provide a separate opinion on these matters.
We have structured key audit matters as follows:• Descriptions of individual key audit matters• Audit approach and findings• Reference to related disclosures
1. Impairment test of goodwill
Description of the individual key audit matterGoodwill is allocated to the Food, Pharma and Labels divisions, respectively. The measurement of goodwill resulting from business combinations requires manage-ment to make significant judgments, estimates and assumptions. Management tests goodwill for impairment on an annual basis or whenever an indication of impair-ment exists.
In the reporting year, goodwill of the “Afripack Group”, the “Pemara Group” as well as of Constantia Oai Hung Manufacturing Joint Stock Company was consolidatedfor the first time and tested for impairment at division level.
Audit approach and findingsWe have scrutinized the judgments made by management, asking PwC internal measurement experts to reconcile the models used and the assumptions made with appropriate benchmarks based on our knowledge of the industry and on our past experience, as well as to assess and recalculate whether any impairment in accordance with IAS 36 exists.
Based on this, our audit procedures included an assessment of whether the estimates made by management with regard to the measurement of goodwill and the related recognition in the consolidated financial statements as at December 31, 2016 were appropriate.
Reference to related disclosuresPlease refer to the notes, chapters D. and I.
Responsibilities of Management and the Supervisory Board for the Consolidated Financial Statements Management is responsible for the preparation and fair presentation of these consolidated financial statements in accordance with International Financial Reporting Standards (IFRSs) as adopted by the EU, and the addi-tional requirements under Section 245a UGB, and for such internal control as management determines is necessary to enable the preparation of consolidated financial statements that are free from material mis-statement, whether due to fraud or error.
126_Constantia Flexibles IFRS Consolidated Financial Statements 2016 / Auditor’s Report
In preparing the consolidated financial statements, man-agement is responsible for assessing the Group’s ability to continue as a going concern, disclosing, as applicable, matters related to going concern and using the going concern basis of accounting unless management either intends to liquidate the Group or to cease operations, or has no realistic alternative but to do so.
The supervisory board is responsible for overseeing the Group’s financial reporting process.
Auditor’s Responsibilities for the Audit of the Consolidated Financial Statements Our objectives are to obtain reasonable assurance about whether the consolidated financial statements as a whole are free from material misstatement, whether due to fraud or error, and to issue an auditor’s report that includes our opinion. Reasonable assurance is a high level of assur-ance, but is not a guarantee that an audit conducted in accordance with Austrian generally accepted auditing standards, which require the application of ISAs, will always detect a material misstatement when it exists. Misstatements can arise from fraud or error and are con-sidered material if, individually or in the aggregate, they could reasonably be expected to influence the economic decisions of users taken on the basis of these consoli-dated financial statements.
As part of an audit in accordance with Austrian generally accepted auditing standards, which require the application of ISAs, we exercise professional judgment and maintain professional skepticism throughout the audit.
We also:
• identify and assess the risks of material misstatement of the consolidated financial statements, whether due to fraud or error, design and perform audit procedures responsive to those risks, and obtain audit evidence that is sufficient and appropriate to provide a basis for our opinion. The risks of not detecting a material misstate-ment resulting from fraud is higher than for one resulting from error, as fraud may involve collusion, forgery, inten-tional omissions, misrepresentations, or the override of internal control.
• obtain an understanding of internal control relevant to the audit in order to design audit procedures that are appropriate in the circumstances, but not for the purpose of expressing an opinion on the effectiveness of the Group’s internal control.
• evaluate the appropriateness of accounting policies used and the reasonableness of accounting estimates and re-lated disclosures made by management.
• conclude on the appropriateness of management’s use of the going concern basis of accounting and, based on the audit evidence obtained, whether a material uncer-tainty exists related to events or conditions that may cast significant doubt on the Group’s ability to continue as a going concern. If we conclude that a material uncertainty exists, we are required to draw attention in our auditor’s report to the related disclosures in the consolidated fi-nancial statements or, if such disclosures are inadequate, to modify our opinion. Our conclusions are based on the audit evidence obtained up to the date of our auditor’s report. However, future events or conditions may cause the Group to cease to continue as a going concern.
• evaluate the overall presentation, structure and content of the consolidated financial statements, including the disclosures, and whether the consolidated financial statements represent the underlying transactions and events in a manner that achieves fair presentation.
• obtain sufficient appropriate audit evidence regarding the financial information of the entities or business activ-ities within the Group to express an opinion on the con-solidated financial statements. We are responsible for the direction, supervision and performance of the group audit. We remain solely responsible for our audit opinion.
We communicate with the supervisory board regarding, among other matters, the planned scope and timing of the audit and significant audit findings, including any significant deficiencies in internal control that we identify during our audit.
We also provide the supervisory board with a statement that we have complied with all relevant ethical require-ments regarding independence, and to communicate with them all relationships and other matters that may reasona-bly be thought to bear on our independence, and where applicable, related safeguards.

Auditor’s Report / IFRS Consolidated Financial Statements 2016 Constantia Flexibles_127
From the matters communicated with the supervisory board, we determine those matters that were of most significance in the audit of the consolidated financial statements of the current period and are therefore the key audit matters. We describe these matters in our audi-tor’s report unless law or regulation precludes public disclosure about the matter or when, in extremely rare circumstances, we determine that a matter should not be communicated in our report because the adverse consequences of doing so would reasonably be expected to outweigh the public interest benefits of such communi-cation.
Report on Other Legal and Regulatory Requirements
Comments on the Management Report for the GroupPursuant to the Austrian Commercial Code, the manage-ment report for the Group is to be audited as to whether it is consistent with the consolidated financial statements and as to whether the management report for the Group was prepared in accordance with the applicable legal requirements.
Management is responsible for the preparation of the management report for the Group in accordance with the Austrian Commercial Code.
We conducted our audit in accordance with Austrian Standards on Auditing for the audit of the management report for the Group.
Opinion: In our opinion, the management report for the Group was prepared in accordance with the applicable legal requirements and is consistent with the consolidated financial statements.
Statement: Based on the findings during the audit of the consolidated financial statements and due to the obtained understanding concerning the Group and its circumstanc-es no material misstatements in the management report for the Group came to our attention.
Other informationManagement is responsible for the other information.The other information comprises the information included in the annual report, but does not include the consolidated financial statements, the management report for the Group and the auditor’s report. The annual report is expected to be made available to us after the date of this auditor’s report.
Our opinion on the consolidated financial statements does not cover the other information and we will not express any form of assurance conclusion thereon.
In connection with our audit of the consolidated financial statements, our responsibility is to read the other infor-mation identified above when it becomes available and, in doing so, consider whether the other information is materially inconsistent with the consolidated financial statements or our knowledge obtained in the audit, orotherwise appears to be materially misstated.
Responsible Engagement PartnerResponsible for the proper performance of the engage-ment is Mr. Horst Bernegger, Austrian Certified PublicAccountant.
PwC Wirtschaftsprüfung GmbHVienna, March 31, 2017
Mag. Horst BerneggerAustrian Certified Public Accountant

Imprint
PublisherConstantia Flexibles Group GmbHRivergate, Handelskai 921200 ViennaAustriaT +43 1 888 56 40 1000F +43 1 888 56 40 [email protected] FN 332189 pVienna Commercial Court
ContactGroup CommunicationsDaniel Smith, Head of Group Communications
ConsultingGrayling Austria GmbHDirk Moser-Delarami, Ute Greutter
DesignBrainds, Marken und Design GmbH
DisclaimerThis annual report was prepared with due care, and all information contained therein was reviewed. Rounding,typographical, and printing errors may nevertheless appear. The annual report contains information and forecastsbased on the future performance of the ConstantiaFlexibles Group. The forecasts present estimates based on all available information at the time the annual report was published. Should the assumptions underlying the forecasts turn out to be wrong, actual results may vary.This annual report is available in English and German.In case of discrepancies, the German text is binding.