Financial reform and the monetary transmission mechanism ...
28
Financial reform and the monetary transmission mechanism: the case of Thailand Tanya Sirivedhin Introduction It is generally accepted that the financial liberalisation and reforms under- taken thus far in Thailand have opened up new avenues and increased opportunities for financial market development. The implications are, however, less clear for other areas of the economy. Moreover, in the new environment of closer financial integration and strong capital flows, the effectiveness of monetary policy has often been called into question. This paper attempts to explain the impact of financial deregulation on the real economy, as well as its effects on the operating procedures of monetary policy. The paper is organised into six parts. Section 1 provides a broad overview of current monetary policy management and mechanisms. Section 2 analyses the effects of financial liberalisation on various aspects of the economy and certain indicators, namely the financial sector, domestic interest rates, the capital market, the foreign exchange market and the private corporate sector. Section 3 briefly discusses the three main channels of monetary policy transmission: credit, interest rates and wealth. Section 4 is an empirical study on the implications of the transmission mechanism for the economy using a vector autoregression (VAR) model. Section 5 looks at future tasks and challenges for improving monetary management. Section 6 concludes the paper. 1. The framework of monetary policy management and mechanisms This section reviews the framework of monetary policy management and mechanisms in Thailand. The overall objective of monetary policy is to achieve sustainable economic growth with a reasonable level of internal and external stability. Of particular concern is price stability, which is defined as a low and stable rate of inflation. In the past, the Bank of 195
Transcript of Financial reform and the monetary transmission mechanism ...
Financial reform and the monetary transmissionmechanism: the case of Thailand
Tanya Sirivedhin
Introduction
It is generally accepted that the financial liberalisation and reforms under-taken thus far in Thailand have opened up new avenues and increasedopportunities for financial market development. The implications are,however, less clear for other areas of the economy. Moreover, in the newenvironment of closer financial integration and strong capital flows, theeffectiveness of monetary policy has often been called into question. Thispaper attempts to explain the impact of financial deregulation on the realeconomy, as well as its effects on the operating procedures of monetarypolicy. The paper is organised into six parts. Section 1 provides a broadoverview of current monetary policy management and mechanisms.Section 2 analyses the effects of financial liberalisation on various aspectsof the economy and certain indicators, namely the financial sector,domestic interest rates, the capital market, the foreign exchange marketand the private corporate sector. Section 3 briefly discusses the threemain channels of monetary policy transmission: credit, interest ratesand wealth. Section 4 is an empirical study on the implications of thetransmission mechanism for the economy using a vector autoregression(VAR) model. Section 5 looks at future tasks and challenges for improvingmonetary management. Section 6 concludes the paper.
1. The framework of monetary policy management andmechanisms
This section reviews the framework of monetary policy management andmechanisms in Thailand. The overall objective of monetary policy is toachieve sustainable economic growth with a reasonable level of internaland external stability. Of particular concern is price stability, which isdefined as a low and stable rate of inflation. In the past, the Bank of
195
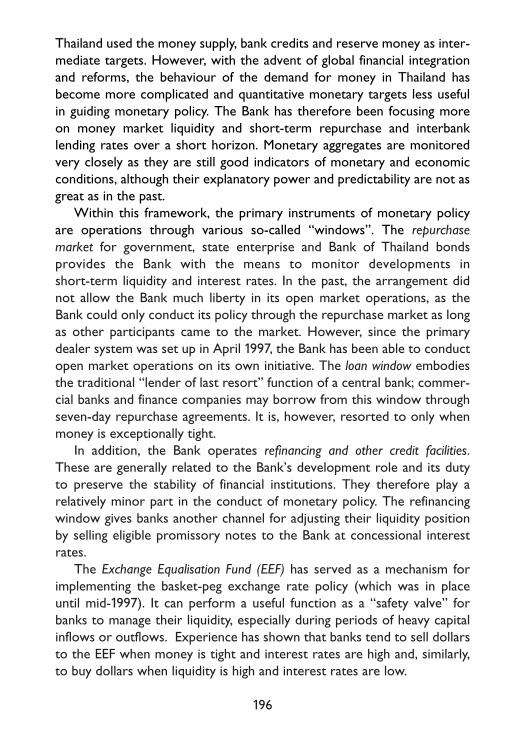
Thailand used the money supply, bank credits and reserve money as inter-mediate targets. However, with the advent of global financial integrationand reforms, the behaviour of the demand for money in Thailand hasbecome more complicated and quantitative monetary targets less usefulin guiding monetary policy. The Bank has therefore been focusing moreon money market liquidity and short-term repurchase and interbanklending rates over a short horizon. Monetary aggregates are monitoredvery closely as they are still good indicators of monetary and economicconditions, although their explanatory power and predictability are not asgreat as in the past.
Within this framework, the primary instruments of monetary policyare operations through various so-called “windows”. The repurchase
market for government, state enterprise and Bank of Thailand bondsprovides the Bank with the means to monitor developments inshort-term liquidity and interest rates. In the past, the arrangement didnot allow the Bank much liberty in its open market operations, as theBank could only conduct its policy through the repurchase market as longas other participants came to the market. However, since the primarydealer system was set up in April 1997, the Bank has been able to conductopen market operations on its own initiative. The loan window embodiesthe traditional “lender of last resort” function of a central bank; commer-cial banks and finance companies may borrow from this window throughseven-day repurchase agreements. It is, however, resorted to only whenmoney is exceptionally tight.
In addition, the Bank operates refinancing and other credit facilities.These are generally related to the Bank’s development role and its dutyto preserve the stability of financial institutions. They therefore play arelatively minor part in the conduct of monetary policy. The refinancingwindow gives banks another channel for adjusting their liquidity positionby selling eligible promissory notes to the Bank at concessional interestrates.
The Exchange Equalisation Fund (EEF) has served as a mechanism forimplementing the basket-peg exchange rate policy (which was in placeuntil mid-1997). It can perform a useful function as a “safety valve” forbanks to manage their liquidity, especially during periods of heavy capitalinflows or outflows. Experience has shown that banks tend to sell dollarsto the EEF when money is tight and interest rates are high and, similarly,to buy dollars when liquidity is high and interest rates are low.
196

In all, monetary policy operations have mainly relied on intervention inthe repurchase market as a way of containing sharp volatility in short-term interest rates, with sterilisation operations being carried out tocounter the tendency towards large shifts in liquidity when necessary.This approach is normally supported by a strong policy signal as to thepreferred direction of domestic interest rates, such as an adjustment ofthe “Bank Rate”, as well as a systemic tightening of prudential regulations
such as those on liquid assets, capital adequacy, loan loss provisions andforeign exchange exposure. For example, commercial banks are requiredto hold liquid assets, averaged over a fortnight, of not less than 7¤% oftheir deposit base;1 the capital/risk asset ratio has been raised to 8.5¤% forcommercial banks, and 7.5¤% for foreign bank branches and financecompanies, while the reserve requirement against doubtful debt has beenincreased to 100¤%. The rule on net foreign exchange exposure limits hasalso been strengthened, allowing banks to run positions in terms of theirfirst-tier capital of no more than 20¤% overbought and 15¤% oversold.
2. Financial liberalisation and its effects2
The country’s financial liberalisation process can be generally character-ised as following a gradual approach, implemented in steps so as to allowfinancial institutions and consumers to adjust to the new environment.Prior to reform, the level of competition between financial institutionswas relatively low while monetary management was effected largelythrough the use of direct control measures, such as interest rate ceilingsand exchange control regulations. With the rapid growth of the Thaieconomy and the wave of globalisation and reforms, the first comprehen-sive financial reform plan was formulated in 1990. The objectives of theplan were to increase the efficiency of the financial system and to enhance
197
1 Liquid assets comprise at least 2% non-interest-bearing deposits at the Bank of Thailand, amaximum of 2.5% vault cash, and – making up the remainder – bonds issued by the Government,approved state enterprises, specialised financial institutions or the Bank of Thailand. The range ofeligible securities was widened mainly on account of the declining supply of government bonds inthe market. The maintenance period was also lengthened (from one week previously) in order togive banks more room to adjust their reserves and thus help somewhat to limit fluctuations inthe money market.
2 Sections 2 and 3 of this paper are drawn partly from Duriyaprapan and Supapongse(1996).
the competitiveness of Thai financial institutions. The first phase of thethree-year Financial System Development Plan (1990–92) encompassedfour major areas: financial deregulation and liberalisation; development offinancial instruments and facilities; strengthening of the supervision andexamination of the financial system; and development of the paymentsystem.
The authorities took the initiative further under the second FinancialSystem Development Plan (1993–95), aimed at increasing financial marketefficiency, mobilising domestic savings and developing Thailand into aregional financial centre. It should also be noted that financial reformmeasures were introduced in parallel with economic reforms in otherareas, including the fiscal and industrial sectors, and price deregulation.In addition, the objectives of the plan were consistent with nationaleconomic policy, as laid down in the Seventh National Economic andSocial Development Plan (1992–96).
The third Financial System Development Plan (1996–98) was launchedwith four main objectives: to support the economy’s growth potential andensure the stability of the economic and financial system; to broaden,deepen and strengthen the financial system; to enhance the efficiency ofsupervision and examination; and to develop financial infrastructures,including information technology and human resources development.
The financial reforms undertaken so far entail many important changesto the financial system that include, for example, the removal of controlson interest rates, the liberalisation of the capital account – with only a fewrestrictions on capital outflows remaining, new entries into the domesticfinancial market, and the development of the country’s debt market andinstruments. Some of the major accomplishments are summarised inAnnex 1.
The impact of financial liberalisation on the economy is examined inthe five major areas below.
(a) Growth of the financial sector
During the last few years, Thailand’s financial sector has grown signifi-cantly in terms of both depth and breadth. As shown in Table 1, theprogress in financial deepening is revealed by the development of themoney supply/GDP ratio. The M2/GDP ratio rose from 64.6¤% in 1989 to78.7¤% in 1994. Moreover, the M3/GDP ratio (i.e. using the definition ofthe money supply including other financial institutions’ deposits) also
198

199
Table 1Growth of the financial sector
In billions of baht, unless otherwise indicated
1989 1990 1991 1992 1993 1994 1995
GDP at current prices . . . . . 1,868.4 2,186.0 2,507.0 2,827.2 3,163.9 3,597.4 4,169.4*percentage change . . . . . . . 19.1 17.0 14.7 12.8 11.9 13.7 15.9
M1 . . . . . . . . . . . . . . . . 174.7 195.4 222.4 249.7 296.2 346.5 388.3percentage change . . . . . . . 17.6 11.8 13.8 12.3 18.6 17.0 12.1
M2 . . . . . . . . . . . . . . . . 1,207.1 1,529.1 1,832.4 2,117.8 2,507.1 2,829.4 3,310.6percentage change . . . . . . . 26.3 26.7 19.8 15.6 18.4 12.9 17.0
M3 . . . . . . . . . . . . . . . . 1,477.5 1,873.8 2,246.3 2,662.8 3,187.1 3,747.9 n.a.percentage change . . . . . . . 28.8 26.8 19.9 20.8 19.7 17.6 n.a.
M1/GDP in % . . . . . . . . . . 9.4 8.9 8.9 8.8 9.4 9.6 9.3M2/GDP in % . . . . . . . . . . 64.6 69.9 73.1 74.9 79.2 78.7 79.4M3/GDP in % . . . . . . . . . . 79.1 85.7 89.6 94.2 100.7 104.2 n.a.Total assets . . . . . . . . . . . 2,022.3 2,553.8 3,078.0 3,714.1 4,725.6 6,031.5 7,653.3percentage change . . . . . . . 25.5 26.3 20.5 20.7 27.2 27.6 26.9
Total assets/GDP in % . . . . . 108.2 116.8 122.8 131.4 167.1 167.7 183.6
* Preliminary.

increased substantially, from 79.1% in 1989 to 104.2¤% in 1994. This impliesthat the role of other financial institutions in savings mobilisation alsoincreased during this period.
In the meantime, the number of inhabitants per commercial bankbranch declined from 26,721 in 1987 to 20,659 in 1994. This suggests thatcommercial banks are now able to provide more effective services, andthis trend is likely to continue with the establishment of new types offinancial institution such as the Export and Import Bank of Thailand andthe Thai Rating and Information Services (TRIS).
(b) Determination and movements of interest rates
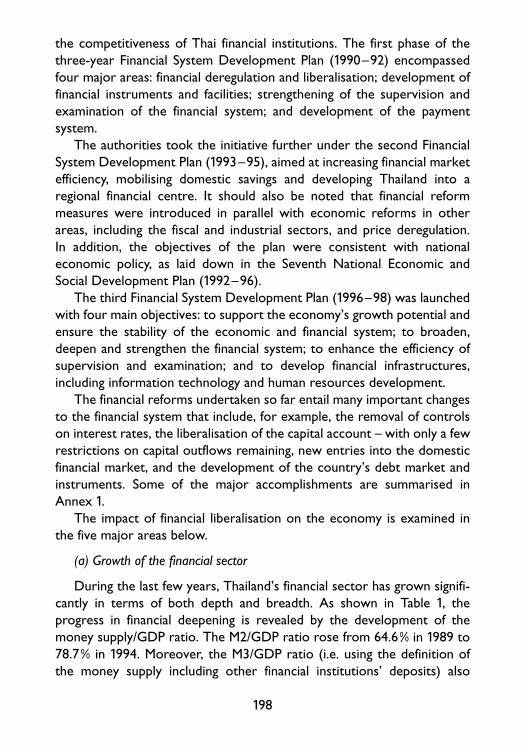
The removal of interest rate ceilings and other financial reformspromoted increasingly flexible capital movements, especially those relatedto short-term private loans. External factors are therefore playing anincreasing role in the determination of domestic interest rates. As notedby Subhaswadikul (1995), the long-run equilibrium level of domesticinterest rates is mostly determined by foreign interest rates.3 This reflectsthe increasing degree of openness of the Thai financial market sinceexchange control deregulation.
At the same time, the reforms have also led to more variability andless predictability in domestic interest rates. Commercial banks’ depositand lending rates have tended to adjust more frequently and with a largermagnitude in the 1990s than in the 1980s (Table 2). This is because the
200
3 Since 1989, foreign interest rates have gained greater influence on the Thai money market.Subhaswadikul (1995) estimated the domestic interest rate function as follows:
it = .823 + .895 (i*+fp)t +.00003 SCBLt + .504 SPet
(1.64) (18.99)* (1.03) (.755)–.108 smgthu
t – .059 smgthut-1 – .202 smgthu
t-2
(–1.52) (–.810) (–2.83)*+.280D(i*+fp)t – .064 SCBLgtht – .045 SCBLgtht-1
(2.44)* (–2.45)* (–1.76)*where i = domestic interest rate (interbank rate)
(i*+fp) = eurodollar rateSCBL = fiscal balanceSPe = expected inflationsmgthu = money surprisesD(i*+fp) = change in the eurodollar rateSCBLgth = change in the fiscal balancet = time t
This study uses the cointegration method and the sample period 1989–95. It indicates thatthe long-run equilibrium level of the domestic interest rate is mostly determined by the foreigninterest rate. The coefficient estimate of the foreign interest rate is about 0.9, implying that a 1.0percentage point rise in the foreign interest rate will result in a rise in the domestic interest rateof 0.9 percentage points, other factors remaining constant.
201
Table 2Selected short-term interest rates, 1985–95
B/R R/P I/B D/R MOR MLR MRR*
1985 Q1 . . . . . 12.00, 13.50 .. .. 11.00–13.00 16.50 16.20 ..Q2 . . . . . 12.00, 13.50 .. .. 11.00 16.50 16.50 ..Q3 . . . . . 11.00, 12.00 .. .. 10.50 15.50 15.50 ..Q4 . . . . . 11.00, 12.00 .. .. 10.50 15.50 15.50 ..
1986 Q1 . . . . . 10.00, 11.00 .. .. 9.00 14.00 14.00 ..Q2 . . . . . 10.00, 11.00 .. .. 8.50 14.00 14.00 ..Q3 . . . . . 8.00 .. .. 6.75 12.25 12.00 ..Q4 . . . . . 8.00 .. .. 6.75 12.25 12.00 ..
1987 Q1 . . . . . 8.00 .. .. 6.75 11.50 11.50 ..Q2 . . . . . 8.00 .. .. 6.75 11.50 11.50 ..Q3 . . . . . 8.00 .. .. 6.75 11.50 11.50 ..Q4 . . . . . 8.00 .. .. 6.75 11.50 11.50 ..
1988 Q1 . . . . . 8.00 .. .. 6.75 11.50 11.50 ..Q2 . . . . . 8.00 .. .. 6.75 11.50 11.50 ..Q3 . . . . . 8.00 .. .. 6.75–7.50 11.30 11.50 ..Q4 . . . . . 8.00 .. .. 6.75–9.50 12.00 12.00 ..
1989 Q1 . . . . . 8.00 9.26 10.47 9.00–9.50 12.00 12.00 ..Q2 . . . . . 8.00 9.24 9.80 9.50 12.00–12.50 12.00–12.50 ..Q3 . . . . . 8.00 9.59 10.80 9.50 12.50 12.50 ..Q4 . . . . . 8.00 10.44 11.30 9.50 12.50–13.50 12.50 ..
1990 Q1 . . . . . 8.00 9.81 10.32 11.00–11.50 13.55 13.56 ..Q2 . . . . . 9.50 10.98 12.01 11.50 14.48 14.48 ..Q3 . . . . . 9.50 12.77 14.71 12.50–13.50 14.71 14.71 ..Q4 . . . . . 12.00 13.01 14.43 13.00–15.50 15.69 15.41 ..

202
Table 2 (continued)Selected short-term interest rates, 1985–95
B/R R/P I/B D/R MOR MLR MRR*
1991 Q1 . . . . . 12.00 12.25 13.64 14.00–14.50 16.38 16.13 ..Q2 . . . . . 12.00 11.00 12.81 13.25–14.50 15.54 15.37 ..Q3 . . . . . 11.00 10.36 10.70 12.50 15.99 15.99 ..Q4 . . . . . 11.00 6.70 7.46 10.50–11.50 14.66 14.66 ..
1992 Q1 . . . . . 11.00 5.39 5.48 8.50–9.00 13.16 13.16 ..Q2 . . . . . 11.00 6.34 7.66 8.00 12.06 12.06 ..Q3 . . . . . 11.00 6.39 7.38 8.00–9.00 12.00 12.00 ..Q4 . . . . . 11.00 5.95 7.21 7.50–9.50 11.80 11.80 ..
1993 Q1 . . . . . 11.00 5.79 8.12 7.50–9.50 11.40 11.40 ..Q2 . . . . . 10.00 7.53 8.60 7.50–9.50 11.25 11.25 ..Q3 . . . . . 9.00 6.02 6.34 7.50 11.25 11.25 ..Q4 . . . . . 9.00 3.55 3.10 6.50–7.00 10.95 10.95 12.50
1994 Q1 . . . . . 9.00 6.22 7.24 6.50–7.25 10.09 10.09 11.75Q2 . . . . . 9.00 7.49 8.00 7.50–8.75 10.44 10.44 11.75Q3 . . . . . 9.50 8.22 7.35 8.25–9.50 11.22 11.22 11.75Q4 . . . . . 9.50 7.27 6.41 8.75–10.00 11.54 11.54 12.00–12.25
1995 Q1 . . . . . 10.50 9.99 13.30 10.00–11.50 12.13 12.13 12.50–13.00Q2 . . . . . 10.50 11.29 11.41 10.25–12.00 13.43 13.43 13.00–13.50Q3 . . . . . 10.50 9.06 9.24 10.50–11.50 13.63 13.63 13.50–14.00Q4 . . . . . 10.50 9.25 10.17 10.50–12.50 13.83 13.83 14.00–14.50
Notes: B/R = Bank Rate (or Discount Rate)R/P = Repurchase Rate (30 days)I/B = Interbank RateD/R = Deposit Rate (3–6 months)MOR = Minimum Overdraft RateMLR = Minimum Lending RateMRR = Minimum Retail Rate.
* Introduced from October 1993.Source: Bank of Thailand Annual Bulletin (various issues).

liberalisation process allows greater flexibility for commercial banks andother financial institutions to adjust their interest rate policies to suittheir strategies and financial environments. The task of maintaining stablemoney market rates has therefore become increasingly difficult.
(c) Capital market developments
Financial deregulation and reform have contributed significantly to thedevelopment of the Thai capital market. As shown in Table 3, marketcapitalisation as a percentage of GDP rose from 29.4¤% in 1990 to 85.9¤% in1995. The SET (Stock Exchange of Thailand) index rose from 612.9 in 1990to peak at 1,682.9 in 1993, before declining to 1,280.8 in 1995 in line withslowing economic activity. Meanwhile, the types of investor have widenedto cover not only small investors but also institutional investors such asprovident funds, mutual funds and insurance companies.
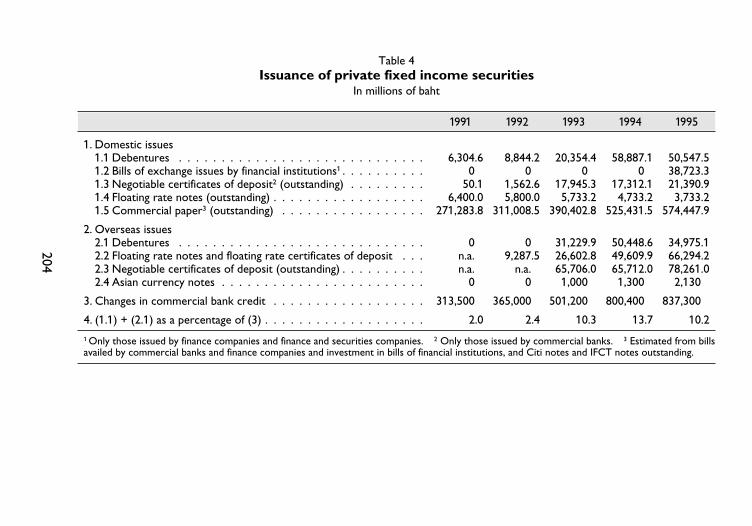
In parallel with this development, the private debt market has assumedan increasingly important role in the capital market. For the domesticmarket, new issues of debentures, which totalled Baht 8.8 billion in 1992,rose to Baht 50.5 billion in 1995 (Table 4). Convertible debentures
203
Table 3Stock market indicators, 1990–95
1990 1991 1992 1993 1994 1995
Number of quoted companies . . . 214.0 276.0 320.0 369.0 450.0 485.0Capitalisation(in billions of baht) . . . . . . . . . 613.5 897.2 1,485.0 3,325.4 3,300.8 3,564.6(as a percentage of GDP) . . . . . 29.4 35.8 52.5 105.1 91.8 85.9
New capital raisings1
(in billions of baht) . . . . . . . . . 17.5 55.1 55.7 55.1 137.2 122.9Trading value(in billions of baht) . . . . . . . . . 627.2 793.1 1,860.1 2,201.1 2,113.9 1,535.0(as a percentage of capitalisation) . 102.2 88.4 125.3 66.2 64.0 43.1
Foreign/total turnover(in percentages) . . . . . . . . . . . 14.4 8.2 7.2 17.02 21.02 26.32
SET index (1975 = 100) . . . . . . . 612.9 711.4 893.4 1,682.9 1,360.1 1,280.8(percentage change) . . . . . . . . –30.3 16.1 25.6 88.4 –19.2 –5.8
Average dividend yield(in percentages) . . . . . . . . . . . 3.63 3.59 2.91 2.01 1.86 2.25
Average price/earnings ratio . . . . 13.81 15.59 16.29 26.09 19.51 19.75
1 At market prices. 2 Including transactions through sub-brokers.
204
Table 4Issuance of private fixed income securities
In millions of baht
1991 1992 1993 1994 1995
1. Domestic issues1.1 Debentures . . . . . . . . . . . . . . . . . . . . . . . . . . . . . 6,304.6 8,844.2 20,354.4 58,887.1 50,547.51.2 Bills of exchange issues by financial institutions1 . . . . . . . . . . 0.0 0.0 0.0 0.0 38,723.31.3 Negotiable certificates of deposit2 (outstanding) . . . . . . . . . 50.1 1,562.6 17,945.3 17,312.1 21,390.91.4 Floating rate notes (outstanding) . . . . . . . . . . . . . . . . . . 6,400.0 5,800.0 5,733.2 4,733.2 3,733.21.5 Commercial paper3 (outstanding) . . . . . . . . . . . . . . . . . 271,283.8 311,008.5 390,402.8 525,431.5 574,447.9
2. Overseas issues2.1 Debentures . . . . . . . . . . . . . . . . . . . . . . . . . . . . . 0.0 0.0 31,229.9 50,448.6 34,975.12.2 Floating rate notes and floating rate certificates of deposit . . . n.a..0 9,287.5 26,602.8 49,609.9 66,294.22.3 Negotiable certificates of deposit (outstanding) . . . . . . . . . . n.a..0 n.a..0 65,706.0 65,712.0 78,261.02.4 Asian currency notes . . . . . . . . . . . . . . . . . . . . . . . . 0.0 0.0 1,000.0 1,300.0 2,130.0
3. Changes in commercial bank credit . . . . . . . . . . . . . . . . . . 313,500.0 365,000.0 501,200.0 800,400.0 837,300.0
4. (1.1) + (2.1) as a percentage of (3) . . . . . . . . . . . . . . . . . . . 2.0 2.4 10.3 13.7 10.2
1 Only those issued by finance companies and finance and securities companies. 2 Only those issued by commercial banks. 3 Estimated from billsavailed by commercial banks and finance companies and investment in bills of financial institutions, and Citi notes and IFCT notes outstanding.

increased eightfold during 1993–95, while unit trusts also grew markedlybefore registering more moderate growth in 1995.
The volume of fixed income instruments placed in overseas marketsalso rose sharply, owing mainly to the higher degree of capital mobilityresulting from the liberalisation process. The volume of debentures roseby 61.5¤% in 1994. Total fixed income issues overseas increased fromBaht 58.8 billion in 1993 to Baht 103.4 billion in 1995.
The Thai capital market has therefore emerged as a more sophisti-cated market, substantially integrated into the world market. The degreeof linkage can be observed in the growth of net private capital inflows,which has been persistently large over the past few years. Portfolioinvestment rose from Baht 36.6 billion in 1989 to Baht 84.9 billion in 1995,of which Baht 53.6 billion was equity investment (Table 5).
The increased openness of the capital account has led to a higherdegree of capital mobility, largely reflected in the growing importanceover the years of offshore credits through the Bangkok InternationalBanking Facilities (BIBF) and non-resident baht accounts. Since their intro-duction in 1993, BIBF credits have grown at an annual rate of around 5¤%,while non-resident baht deposits increased more than eightfold during1985–95. A large part of non-resident baht deposits are intended forinvestment on the SET. With the growing importance of the capitalmarket and more accessible overseas markets, firms therefore have alarger choice of external financing options, and households a wider rangeof saving options.
(d) Efficiency of the foreign exchange market
The degree of capital movement can also be observed in the volume oftransactions in the foreign exchange market, both spot and forward. Sincedomestic interest rates tend to move in the same direction as foreigninterest rates, the differential between the one-month repurchase rateand the one-month eurorate plus the forward premium tended todecrease during 1989–94, as shown in Graph 1. This suggests that activityin arbitrage should show a generally declining trend, reflecting improvedmarket efficiency.
(e) Financing of activity in the private corporate sector
The opening of the capital account has allowed overseas fund-raisingto become an increasingly important source of financing. Total external
205

206
Table 5Net flows on private financial account
In billions of baht
1985 1986 1987 1988 1989 1990 1991 1992 1993 1994 1995
1. Banks . . . . . . . . . . . . . . . . –14.2 –22.0 5.9 21.5 –7.7 40.9 –6.6 49.1 91.0 349.9 279.7Commercial banks . . . . . . . . –14.2 –22.0 5.9 21.5 –7.7 40.9 –6.6 49.1 –102.2 96.4 77.2BIBFs . . . . . . . . . . . . . . . . – – – – – – – – 193.2 253.4 202.4
2. Non-banks . . . . . . . . . . . . . 19.6 12.5 16.5 74.1 159.9 238.6 268.8 188.1 169.9 –248.0 243.92.1 Direct investment . . . . . . 4.4 6.9 4.7 27.3 44.4 61.1 47.1 50.2 36.4 22.7 29.62.1.1 Foreign direct investment . 4.4 6.9 9.0 28.0 45.7 65.0 51.4 53.7 43.8 33.2 49.72.1.2 Thai direct investment . . . – – – 4.3 –0.6 –1.3 –3.6 –4.3 –3.5 – 7.4 –210.6 –20.12.2 Other loans . . . . . . . . . 2.1 – 3.3 –16.0 4.6 46.9 114.9 143.7 69.2 – 61.2 –146.7 35.32.3 Portfolio investment . . . . 3.9 2.5 12.9 11.2 36.7 11.5 3.8 14.1 122.6 27.5 84.92.3.1 Equity securities . . . . . . . 3.9 2.5 12.9 11.2 36.7 11.5 0.9 11.5 67.9 –210.3 53.62.3.2 Debt securities . . . . . . . – – – – – – 2.9 2.6 54.8 37.8 31.32.4 Non-resident baht accounts 10.8 9.7 10.6 21.7 28.1 34.3 52.4 44.5 67.8 51.1 87.92.5 Trade credits . . . . . . . . – 2.0 – 3.6 3.7 8.7 3.1 15.2 19.0 7.8 13.6 11.4 8.32.6 Other . . . . . . . . . . . . 0.5 0.4 0.6 0.5 0.7 1.6 2.7 2.3 – 9.4 –214.1 – 2.2
3. Total . . . . . . . . . . . . . . . . 5.4 – 9.4 22.4 95.6 152.2 279.4 262.2 237.2 260.9 301.9 523.6

financing of Thai enterprises as a percentage of GDP rose from 15.7¤% in1989 to 26.9¤% in 1995. As observed by Callen and Reynolds (1996),between 1980 and 1990 about two-thirds of investment is estimated tohave been financed by internal funds. In 1991–95 the ratio fell to one-third. Within external finance, debt has been the most importantfinancing source and, within this category, financial intermediariespredominate. At the same time, as the leverage ratio of firms increases,so too does the risk in their management because they become moresusceptible to changes in overseas markets.
3. Channels of monetary policy transmission
The financial reform process has led to a close relationship of domesticmoney and capital markets with overseas markets and has complicatedthe task of implementing monetary policy. Moreover, the increasedvolatility of domestic interest rates and greater capital mobility have had aconsiderable impact on the real economy and have exerted pressure onthe management of macroeconomic policy. Naturally, under the exchangerate arrangement in place until mid-1997, the coexistence of a fullyindependent monetary policy and perfect capital mobility has been
207
Graph 1One-month repurchase and eurorate
In percentages

unattainable. The Bank of Thailand, therefore, needed to find an accept-able balance between monetary policy autonomy and openness of thecapital account. To achieve that objective and formulate the appropriatemonetary policy framework, it is necessary to understand how the realeconomy can be affected through the different channels of transmission ofmonetary policy.
(a) Credit availability effects
Following the introduction of the BIBF in 1993, borrowers now havemore convenient access to foreign loans at a lower cost compared withdomestic borrowing. As a result, the outstanding amount of commercialbank credits (including BIBFs and out-in lending) has risen sharply, fromBaht 1,479 billion in 1990 to Baht 4,300.9 billion in 1995 (Table 6), andaverage credit growth during 1993–95 was almost 26% per year. Thetotal private credits extended by commercial banks (including BIBF) andfinance companies in 1995 accounted for 89.5% of total credit outstandingextended by all financial institutions in Thailand.
Although recent statistics show that about 90¤% of BIBF lending wasused to finance productive sectors such as exports, manufacturing, tradeand investment, the Bank deemed it necessary to restrain the excessivegrowth of BIBF lending by implementing a number of measures: first, BIBFunits, besides commercial banks, are required to submit credit plans;
208
Table 6Commercial bank credits and property registration fees
In billions of baht
Commercial bank credits Property registration fees
1985 . . . . . . . . . . . . 514.30 2.071986 . . . . . . . . . . . . 532.20 2.141987 . . . . . . . . . . . . 666.80 3.211988 . . . . . . . . . . . . 849.90 5.811989 . . . . . . . . . . . . 1,107.50 8.621990 . . . . . . . . . . . . 1,479.00 13.971991 . . . . . . . . . . . . 1,792.70 10.621992 . . . . . . . . . . . . 2,161.70 11.811993 . . . . . . . . . . . . 2,662.90 13.801994 . . . . . . . . . . . . 3,463.30 16.801995 . . . . . . . . . . . . 4,300.90 14.74

secondly, the minimum size of BIBF loans was raised from US$ 0.5 millionto US$ 2.0 million; thirdly, under the regulation on net open foreignexchange positions, certain types of BIBF lending can no longer be treatedas foreign assets; finally, short-term foreign borrowing by BIBFs is subjectto a 7¤% reserve requirement. Finance companies have since 1995 alsobeen required to submit credit plans consistent with the Bank’s guideline.In parallel with these developments, the private sector has increasinglyrelied on direct financing and foreign borrowing. The importance of thecredit availability effect therefore seems to have been eroded over time.
(b) Interest rate effects
Under the current exchange rate regime and given the close linkagesbetween domestic and foreign money markets, domestic money marketrates, in the long run, cannot be significantly different from US dollarinterest rates. However, if measures to reduce capital mobility are intro-duced or the expected rate of exchange rate depreciation increases, adifferential between domestic and foreign money market rates canpersist. As mentioned in the previous section, the increased linkagebetween domestic and foreign money markets has reduced the Bank ofThailand’s autonomy in conducting interest rate policy. Hence, the Bankhas needed to implement price-based capital control measures to enableit to pursue a high interest rate policy to regain economic stability.
With a higher degree of leverage in the household and corporatesectors, partly caused by financial liberalisation, the interest rate is likelyto become a more important channel of monetary transmission. More-over, long-term interest rates, namely time deposit rates and theMinimum Lending Rate (MLR), are now more responsive to changes inshort-term money market rates. Therefore, the Bank of Thailand’s policyhas been geared towards maintaining stability in interbank rates andrepurchase market rates.
(c) Wealth effects
Since the period of financial liberalisation, there has been a greaterrange of financial assets in the portfolios of the household and corporatesectors. As indicated in Table 3, stock market capitalisation increased five-fold and the stock index rose by 121.9¤% during 1991–94. The participationof foreign investors also expanded significantly, as evidenced by theincrease in the share of non-residents’ transactions on the SET from 8.2¤%
209

of total turnover in 1991 to 21% in 1994. During the same period, thevalue of properties also registered a marked increase (Table 6). Propertyregistration fees, which are the proxy for property prices, climbed by58¤%. However, the rapid rise in wealth seemed to have a negative corre-lation with households’ average propensity to save, i.e. the ratio ofhousehold saving to disposable income, which declined from 14¤% in 1987to 7¤% in 1995.4 Although Thailand’s national saving as a percentage ofGDP has risen steadily, the contribution of the corporate sector toprivate saving has grown, while that of households has dropped signifi-cantly, especially since 1989. In other words, while there has been adeclining trend in the average propensity to save of households, thehousehold sector has also been receiving a somewhat smaller share ofnational income. A limited share of income, therefore, implies a limitedcontribution to national saving.
4. The transmission mechanism and some implications for realeconomic activity
The monetary transmission mechanism is usually defined by the impact ofa change in the monetary policy instrument (e.g. the short-term interestrate or base money) on intermediate variables (such as broad money ordomestic credit) and final objectives (output and inflation). This sectionexamines a model using VARs5 to characterise the dynamic relationshipbetween the key indicators in the economy in order to understand themonetary policy transmission mechanism in Thailand. A VAR model canbe used to predict the impact of a shock in the interest rate and domesticcredit on real economic activity. This study therefore aims to comparethe impact of such a change before and after financial deregulation. To thisend, a VAR was estimated using the interbank rate, domestic credit, the
210
4 For details, see Bank of Thailand (1996a).5 A VAR model is a system of OLS equations that estimate how each variable is related to
the lagged values of all variables in the system. For example:xt = a1xt–1 + a2xt– 2 + ··· + ajxt–j + b1Yt + ··· + bkYt–k + et
where x = vector of endogenous variablesY = vector of exogenous variablese = vector of error terms

private investment index and the consumer price index.6 Exogenousvariables introduced to isolate an external shock were LIBOR, an oil priceindex and the exchange rate. Monthly data for the period 1980:1–1996:6were used. The study period was divided into two subperiods:1980:1–1989:12 (before liberalisation) and 1990:1–1996:6 (after liberalisa-tion).
Graphs 2 and 3 show the impulse response7 of domestic credit, theprivate investment index and the consumer price index to an “interbankrate shock”. Graph 2 demonstrates results for the period before theliberalisation. Domestic credit is predicted to rise to its initial value inthree months and then to decline. The private investment index increasesto its initial value in four months and then declines. The price indexregisters a steep fall for four months after the shock. The results forthe period after liberalisation are given in Graph 3. Domestic credit ispredicted to go down substantially for three months and then to riseslightly, with some fluctuations throughout the period. The private invest-ment index increases after the shock and starts to decline after month six.However, the pattern of change in the private investment index seems tobe a random walk, which implies that an “interbank rate shock” has noeffect. The price index is predicted to remain almost unchanged for fourmonths and then to increase substantially.
The impulse responses of economic variables to a “domestic creditshock” are analysed in Graphs 4 and 5 for the period before and afterfinancial liberalisation, respectively. Graph 4 shows the results for theperiod before liberalisation. The interbank rate is predicted to risesubstantially for three months and then to decline. The private investmentindex increases slowly for three months after the shock. The price indexstarts to rise in month two, then declines in month four. The results forthe period after liberalisation are shown in Graph 5. The interbank rate is
211
6 These variables are listed in the order used, i.e. a shock of the interbank rate at time t canaffect all variables in the system at t. However, the implications of VARs have some limitations,in view of the limited number of observations that are generally available in macroeconomicanalysis and introduction of several lags of each variable can consume a lot of degree of freedom,especially for the period of post-liberalisation.
7 In VARs, it is not always easy to interpret each coefficient, especially since the signs of thecoefficients sometimes alternate. Therefore, the impulse response functions in the VAR modelare shown. Eight lags of endogenous and exogenous variables were included in the VAR esti-mated. All variables appearing in this study were used in terms of logs except the interbank rateand LIBOR, where the log of domestic credit, the private investment index and the CPI areINDCREDIT, INPRI and INCPI, respectively.

212
Graph 2Impulse responses to an interbank interest rate shock*
Pre-liberalisation
0.004
0.002
0
–0.002
–0.004
–0.006
–0.008
–0.010
0.02
0.01
0
–0.01
–0.02
–0.03
–0.04
0.001
0
–0.001
–0.002
–0.003
–0.004
–0.005
* Response to a one-standard deviation innovation ± 2 standard errors.

213
Graph 3Impulse responses to an interbank interest rate shock*
Post-liberalisation
0.002
0
–0.002
–0.004
–0.006
–0.008
0.015
0.010
0.005
0
–0.005
–0.010
–0.015
0.002
0.001
0
–0.001
–0.002
* Response to a one-standard deviation innovation ± 2 standard errors.

214
Graph 4Impulse responses to a domestic credit shock*
Pre-liberalisation
0.4
0.3
0.2
0.1
0
–0.1
–0.2
0.015
0.010
0.005
0
–0.005
–0.010
–0.005
–0.020
0.003
0.002
0.001
0
–0.001
–0.002
–0.003
* Response to a one-standard deviation innovation ± 2 standard errors.

215
Graph 5Impulse responses to a domestic credit shock*
Post-liberalisation
1.2
0.8
0.4
0
–0.4
–0.8
0.02
0.01
0
–0.01
–0.02
0.002
0.001
0
–0.001
–0.002
* Response to a one-standard deviation innovation ± 2 standard errors.

216
predicted to rise substantially for five months and then to fall steeply. Theprivate investment index goes up gradually for eight months and thendeclines. The price index is predicted to increase for two months andthen to decrease.
As shown in Graphs 2 and 3, the responses of the economic activityvariables to the “interbank rate shock” seem to be more distinctive afterthe liberalisation in 1990. Domestic credit starts to go down immediately.The “interbank rate shock” seems to have no effect on the private invest-ment index after liberalisation. This may be due to the greater reliance onforeign financing. The adjustments of domestic credit and the price indexseem to be more sensitive to shock after liberalisation. According toGraphs 4 and 5, the responses of all variables to the “domestic creditshock” are more significant after financial liberalisation. However, thepatterns of change of all three variables are similar to the random walk inboth periods. This implies that the “domestic credit shock” has no effecton all three variables in both periods. In all, interest rate policy seems tobe more efficient than credit policy, especially after financial liberalisation.
5. Improving monetary controls
Although monetary policy management has so far proved adequate ininfluencing domestic financial conditions, new instruments for monetarycontrol are needed in order to cope with the huge and volatile movementof foreign capital. As noted in two recent empirical studies,8 the scope forsterilisation is found to be somewhat limited in the long run, although inthe short run there appears to be some room for monetary policy. As aresult, the Bank of Thailand has widened its range of market-based mone-tary policy instruments so as to improve the effectiveness of monetarymanagement. In this regard, starting with foreign exchange swaps, newmethods of monetary operations have been used more actively, so as tobetter influence the liquidity of the money market. Bank of Thailandbonds with maturities ranging from one month to two years have beenauctioned every Friday since August 1995. This approach provides theBank of Thailand with an additional channel to absorb liquidity on its own
8 See the studies by Robinson, Byeon and Teja (1991) and Schadler, Carkovic, Bennett andKhan (1993) quoted in Nijathaworn (1995).

initiative and provides an essential operational framework that will helpdevelop the securities market. In this connection, the planned appoint-ment of primary dealers and outright purchases or sales of securities bythe Bank of Thailand will be another significant development, as it willprovide an important means of influencing the liquidity of the bankingsystem and short-term interest rates. Finally, efforts to further developthe foreign exchange market will be intensified so that it can betterwithstand volatility and adverse shocks. On a broader scale, closercooperation among regional central banks to exchange views and enterinto liquidity support arrangements should help ensure financial stabilitywithin the region.
6. Conclusion
After a period of difficulty during 1979–84 and a period of consolidationin 1985–86, the Thai economy recorded unprecedented economicgrowth in the following four years. In parallel with this development,major steps were taken to liberalise the financial sector so that themomentum of economic growth could continue into the future.
The effects of financial liberalisation on the financial system and theeconomy as a whole have many facets. It is quite clear that financial liber-alisation has spurred the pace of financial deepening and broadening andhelped create a wider range of financial assets in the portfolios of thehousehold and corporate sectors. It has also brought about a closerlinkage between domestic and foreign markets. However, the task ofmonetary management has become more complex, with a lower degreeof autonomy. As suggested by the impulse response functions ofeconomic activities to a “domestic credit shock” in the VARs estimated, itis inadequate to monitor commercial banks’ credits amidst the increasingpopularity of direct financing and foreign borrowing. In addition, withrespect to the study of the “interbank rate shock” using the VAR model,although domestic interest rates have become a major channel of mone-tary transmission, they are largely influenced by foreign interest rates. Italso appears that the “interbank rate shock” has no impact on privateinvestment. Moreover, the wealth effect seems to exert a stronger impacton household saving behaviour, and needs to be a major consideration inthe conduct of monetary policy.
217

Annex I
Major financial liberalisation and reforms
April 1975 The Securities Exchange of Thailand begins trading (namechanged to the Stock Exchange of Thailand (SET) in 1991).
1979 The repurchase market is established to help develop the moneymarket and facilitate the free flow of money between foreignexchange and domestic markets, and to serve as a vehicle for theimplementation of monetary policy.
March 1985 The Bank of Thailand encourages commercial banks to introduceBIBOR – Bangkok Interbank Offered Rate – as a reference forthe pricing of floating rate loans to customers.
May 1985 Controls on the opening of letters of credit are lifted.
1986 The interest rate ceiling on credit to priority sectors is lifted.
June 1989 The interest rate ceiling on time deposits with a maturity of morethan one year is lifted.
March 1990 The interest rate ceiling on time deposits with a maturity of oneyear or less is abolished.
May 1990 Acceptance of obligations under Article VIII of the IMF’s Articlesof Agreement and relaxation of foreign exchange controls byliberalising all current account transactions and reducing restric-tions on capital movements.
April 1991 Second-stage liberalisation of foreign exchange controls, includingmore liberal outward transfer of funds for investment, provisionfor foreign investors to repatriate investment project dividendsand proceeds from sales of stocks.
January 1992 Removal of the interest rate ceiling on savings deposits.Revision of the rural credit policy.
March 1992 Expansion of the scope of activities of commercial banks, financecompanies and securities companies.Enactment of the Securities and Exchange Act (B.E. 2535).
June 1992 Ceilings on savings deposit rates and all lending rates are abol-ished.
January 1993 Adoption of the Basle standard (capital to risk asset ratio) forcommercial banks.
218

March 1993 The Bangkok International Banking Facility (BIBF) is established.Participants may provide three types of service: banking to non-residents in foreign currencies and baht (“out-out” transactions),banking to domestic residents in foreign currencies only (“out-in”transactions), and international financial and investment bankingservices.
July 1993 The first credit rating agency, Thai Rating and InformationServices (TRIS), is established.
August 1993 The Export-Import Bank of Thailand Act (B.E. 2536) is promul-gated, to be effective from 7th September 1993. The EXIM Bankis established in February 1994.
October 1993 Commercial banks are required to announce the MinimumLending Rate (MLR), the Minimum Retail Rate (MRR) and themaximum margin to be added to the MRR as a reference rate forcustomers other than those eligible for the MLR.
February 1994 Third round of the liberalisation of foreign exchange controls.
1. The limit on the amount of baht that can be taken out to coun-tries sharing a border with Thailand, and to Vietnam, is raisedfrom Baht 250,000 to Baht 500,000.
2. The limit on the amount of foreign currency that may be takenout when travelling abroad is abolished.
3. The limit on the amount of foreign investment by Thai resi-dents requiring no prior approval from the Bank of Thailand israised from US$ 5 million to US$ 10 million.
4. Residents are permitted to use foreign exchange originatingfrom abroad to service external obligations without surrenderingit or depositing it in a domestic banking account.
March 1994 Finance companies and finance and securities companies arepermitted to open credit offices outside the Bangkok area.
May 1994 Conditions are drawn up for BIBFs to open branches outside theBangkok area.
July 1994 Adoption of Basle standards for finance companies. Financecompanies are required to maintain a 7% capital/risk asset ratio.
August 1994 Finance companies are allowed to open representative officesabroad.BIBFs are authorised to open provincial branches.Guidelines are issued on the separation of finance business fromsecurities business.
November 1994 The Bond Dealers’ Club is set up to function as a secondarymarket for debt instruments.
219

February 1995 The Cabinet approves the Financial System Development Plan(1995–2000) drawn up jointly by the Bank of Thailand, theMinistry of Finance and the Securities and Exchange Commission.
March 1995 Adjustment of the new calculation of the MRR based on totaldeposit cost.
May 1995 Adoption of the Basle guidelines for commercial banks on riskmanagement in derivatives trading.Finance companies are authorised to mobilise funds from thepublic by issuing bills of exchange (B/Es). The minimum amount ofeach domestic B/E is Baht 10 million. Finance companies may alsoissue B/Es abroad after seeking approval from the Bank of Thai-land.Crédit foncier companies are allowed to operate as loan serviceagents.Guidelines on mobilising funds in the form of contractual savingare issued.
July 1995 Commercial banks are permitted to act as customers’ unsecureddebenture holder representatives.
August 1995 Commercial banks are required to hold no less than 7% of non-resident baht accounts in the form of demand and time depositsat the Bank of Thailand.
September 1995 Adjustment of the measurement of net foreign exchange expo-sure for Thai banks.
October 1995 Finance companies are authorised to issue bills of exchange andcertificates of deposit in foreign currency on the offshore marketwith a maturity of not less than one year.
January 1996 New guidelines are adopted for central bank lending to commer-cial banks, finance companies and finance and securities compa-nies. The loan window is henceforward operated via repurchaseagreements instead of securities pledging.
March 1996 Announcement of the issuance of long-term Bank of Thailandbonds:
1. Bonds with a maturity of one year will be auctioned every twomonths for Baht 1,000 million each, effective April 1996.
2. Bonds with a maturity of two years will be auctioned everyquarter for Baht 500 million each, effective June 1996. Institutionsqualified to participate in the auction include commercial banks,finance companies, the Government Savings Bank and the Finan-cial Institutions Development Fund.
May 1996 Adoption of a 100% ratio for provision against doubtful debt forfinance companies, finance and securities companies, and créditfoncier companies.
220

June 1996 Short-term offshore borrowing by financial institutions is subjectto a 7% liquidity requirement.
July 1996 The new electronic clearing system (ECS) begins operation.
October 1996 The first-tier capital/risk asset ratio for commercial banks israised from 5.5 to 6%, and the overall capital/risk asset ratio to8.5%.The capital/risk asset ratio of finance companies is increased from7.0 to 7.5%, with the existing ratio for first-tier capital, effective1st January 1997. (From 1st January 1998, the overall capital/riskasset ratio will increase to 8%, with the ratio for first-tier capitalat 5.5%.)
November 1996 Upgrading of seven new foreign BIBFs to full branch status.
221

References
Bank of Thailand, Economic Research Department (1996a): “Private saving in Thai-land”. Bank of Thailand Economic Focus, 1(2), April– June.
Bank of Thailand, Economic Research Department (1996b): “Analysing Thailand’sshort-term debt”. Bank of Thailand Economic Focus, 1(3), July–September.
Callen, Tim and Patricia Reynolds (1996): “Capital market developments and finan-cial deregulation in Thailand and Malaysia: implications for financial structure and themonetary transmission mechanism”. International Monetary Fund.
Chotewattanakul, Jinda et al. (1994): “Monetary policies and strategies”. SEACEN
Course Paper, Kuala Lumpur, Malaysia. Duriyaprapan, Chittima (1995): “Deregulation process: the Thai experience”.
Paper presented at ASEAN Banking Council Conference Workshop on Treasury, thePhilippines.
Duriyaprapan, Chittima and Mathec Supapongse (1996): “Financial liberalization:case study of Thailand”, in Monetary Authority of Singapore: Proceedings of the 12th
Pacific Basin Central Bank Conference on “The Impact of Financial Market Development on
the Real Economy”. Singapore, 18th–20th December 1996.Hataiseree, Rungsun (1993): “The demand for money in Thailand: a cointegration
and error-correction approach”. Singapore Economic Review, 38(2), pp. 195–230.Hataiseree, Rungsun (1995a): “Capital mobility, sterilization and monetary policy:
some evidence from Thailand since 1980”. Papers on Policy Analysis and Assessment,Bank of Thailand, pp. 27–51.
Hataiseree, Rungsun (1995b): “Financial liberalization and its effect on monetarypolicy: Thailand’s recent evidences”. Chulalongkorn Review (7), pp. 102–19.
Nijathaworn, Bandid (1995): “Capital flows, policy response, and the role of fiscaladjustment: the Thai experience”. Papers on Policy Analysis and Assessment, Bank ofThailand, pp. 13–26.
Robinson, D., Y. Byeon and R. Teja (1991): “Thailand: adjusting to success: currentpolicy issues”. IMF Occasional Paper, No. 85, International Monetary Fund.
Schadler, S., M. Carkovic, A. Bennett and R. Kahn (1993): “Recent experienceswith surges in capital inflows”. IMF Occasional Paper, No. 108, International MonetaryFund.
Subhaswadikul, Mathinee (1995): “Determination of short-term interest rate andthe degree of financial openness: a case study of Thailand”. Papers on Policy Analysis and
Assessment, Bank of Thailand, pp. 80–96 (in Thai).Sucharitakul, C. and V. Arromdee (1994): “An evaluation of Thailand’s financial
reform”. Papers on Policy Analysis and Assessment, Bank of Thailand, pp. 72–100 (inThai).
Wibulswasdi, Chaiyawat (1995): “Strengthening the domestic financial system”.Papers on Policy Analysis and Assessment, Bank of Thailand, pp. 1–12.
222