Financial Protectionism? First Tests The Journal of Finance Andrew K Rose (UC Berkeley, CEPR and...
37
Financial Protectionism? First Tests The Journal of Finance Andrew K Rose (UC Berkeley, CEPR and NBER) and Tomasz Wieladek (Bank of England)
-
Upload
paula-hall -
Category
Documents
-
view
216 -
download
0
Transcript of Financial Protectionism? First Tests The Journal of Finance Andrew K Rose (UC Berkeley, CEPR and...

Financial Protectionism? First Tests
The Journal of Finance
Andrew K Rose(UC Berkeley, CEPR and NBER)
and Tomasz Wieladek(Bank of England)

The Usual Disclaimer
• Research presented here solely reflects the views of the authors and not those of the Bank of England
2

Motivation
• Great recession frequently compared to ‘Great Depression’
• Trade protectionism blamed for spreading/deepening ‘Great Depression’
• Little evidence of substantive ‘classic’ trade protectionism in ‘Great Recession’
3

Motivation (2)
• But public sector financial system interventions occurred around the world...
0
1
2
3
4
5
6
7
Italy
Spain
Switzerland
France G20
Portugal
Germany UK US
Austria
Ireland
Public capital injection as a fraction of 2008 GDP
Source: IMF
4

Motivation (3)
• ... and cross-border bank lending fell by an unprecedented amount at the same time.– “Flight Home” or “Great
Retrenchment”
0
5000
10000
15000
20000
25000
30000
35000
40000
Dec.1977 Mar.1984 Jun.1990 Sep.1996 Dec.2002 Mar.2009
USD bn
Real BIS bank external asset claims
Source: BIS
5

Motivation (4)
• In this paper we ask if the two are related:
– Q: Has government support (nationalization, public capital injection, unusual liquidity support) for banks affected their foreign lending?
– That is, did the ‘Great Recession’ financial interventions lead to a new type of protectionism, financial protectionism?
6

Definition of Financial Protectionism
• Public intervention leads to nationalistic change in banks’ lending behaviour:– Less lending to foreigners (quantities)– Higher interest rates to foreigners (prices)– More lending and/or lower interest rates to
residents
7

Investigating Financial Protectionism
• Key: a) differential effect on quantities and/or prices to foreigners/domestics, only after b) public intervention– Suggests difference in difference approach (which
we use)
• Preview of Results: find effects in both quantities and prices– Use three different data sets
8

Main Data Set
• BIS datasets do not provide individual bank breakdown– So can’t compare foreign/domestic banks or
private/public banks
• Publicly available micro datasets do not provide data on external lending
• Accordingly, we use a confidential Bank of England dataset to test this hypothesis
9

Data (2)• The database provides comprehensive balance
sheet information for all banks operating in the UK at quarterly horizon (1997Q3 – 2010Q1)
• Data usually used for regulatory purposes and national account statistics (→ measurement error taken seriously)
• Data covers 487 banks, 56 of whom are UK-owned– Number of observations = 9,615
10

Data (3)
• Public sector interventions data collected by us, conducting bank-by-bank Google searches for ‘ “bank name” nationalisation nationalise privatise’
• Constructed suitable binary dummies for: privatisation, nationalisation, public capital injection, liquidity support
12

Public Interventions:Temporal Clustering
All figures are percentages.
Nationalisation(5 British/15
Foreign)
Capital Injection(17 British/59 Foreign)
Unusual Access to Loan Guarantee (30 British/10 Foreign)
2008Q3 20 0 5
2008Q4 30 70 83
2008H2 50 70 88
2008 55 71 88
2009H1 10 15 10
2008H2-2009H1 60 85 98
13

Empirical Approach• First (main) dependent variable: ‘Loan mix’
– Loan mix = Lending to UK residents/ Sum of Lending to UK residents and non-residents
• Bank by bank (not group!)
• Second dependent variable: Interest rate– Effective interest rate on new UK private non-
financial corporation loans of less than one year maturity
• Third dependent variable: LTV/LTI ratio of loan-level mortgage loans
14

Histogram of ‘Loan Mix’0
12
34
De
nsity
0 .5 1
(56) British Banks
01
23
45
De
nsity
0 .5 1British/Total Loans
(431) non-British Banks
Data for up to 487 banks, 1997Q3-2010Q1Bank Lending by Bank Nationality
15

Empirical Approach (2)
• Fall in the ‘Loan mix’ and/or increase in interest rate following foreign bank public sector intervention consistent with Financial Protection
• Similarly interpret increase in the ‘Loan mix’ and/or decrease in interest rate following UK bank public sector intervention
18

Empirical Approach (3)• Yi,t is the dependent variable
• {αi} - bank-specific fixed effects – heterogeneity
• {βt} - time fixed effects– Common shocks
• Nati,t – = 1 British bank i is nationalised at or before
time t– =-1 if a foreign bank is nationalised at or
before time t, 0 otherwise
• NatUK,i,t – =1 if British bank i is nationalised at or
before time t
• Priv, Cap, and LL are analogues for banks that are privatised, the recipients of public capital injections, and receive unusual access to liquidity, or loan guarantees;
• ε is a well-behaved disturbance term;
Yi,t = αi + βt +
γNati,t + γUKNatUK,i,t
+ δPrivi,t + δUKPrivUK,i,t
+ ζCapi,t + ζUKCapUK,i,t
+ θLLi,t + εi,t (1)
Empirical model
19
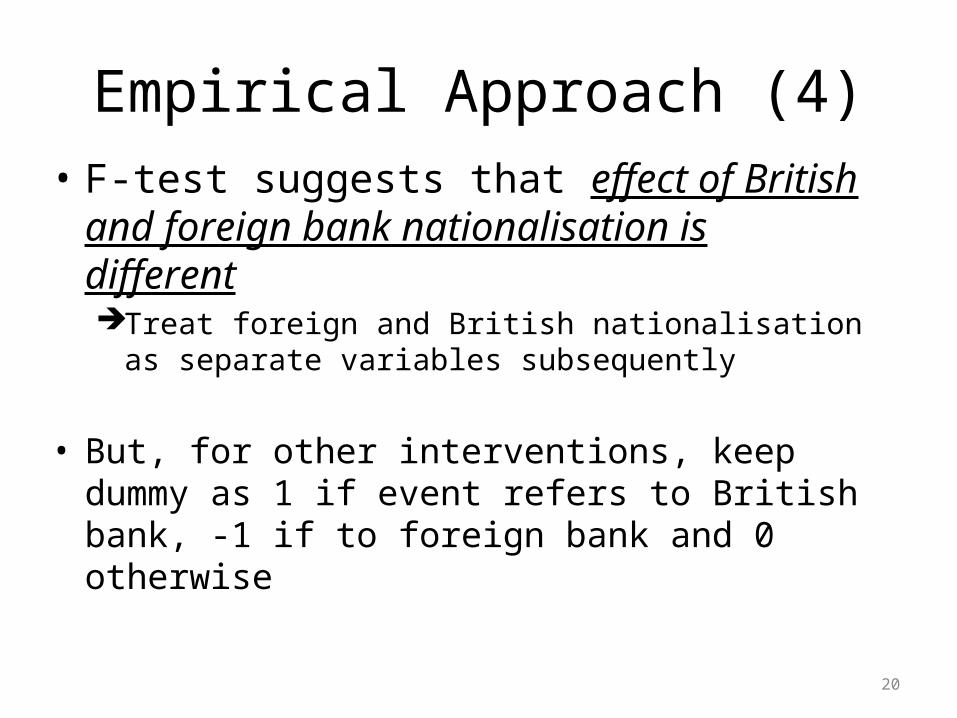
Empirical Approach (4)• F-test suggests that effect of British and
foreign bank nationalisation is differentTreat foreign and British nationalisation as separate
variables subsequently
• But, for other interventions, keep dummy as 1 if event refers to British bank, -1 if to foreign bank and 0 otherwise
20

Empirical Approach (5)
• NatFOR,i,t
= 1 Foreign bank i is nationalised at or before time t, 0 otherwise• NatUK,i,t
– =1 if British bank i is nationalised at or before time t , 0 otherwise• All other interventions
– = 1 British bank i is nationalised at or before time t– =-1 if a foreign bank is nationalised at or before time t, 0 otherwise
• Note presence of comprehensive time and bank FE
Yi,t = αi + βt + γFORNatFOR,i,t + γUKNatUK,i,t + δPrivi,t + ζCapi,t + θLLi,t + εi,t (2)
21

ResultsEstimates of Equation (1)Nationalisation (γ) 10.9**
(2.1)British Nationalisation (γUK)
-10.5**(2.2)
Access to Unusual Loans/Liquidity (δ)
1.9(1.1)
British Access to Unusual Loans/Liquidity (δUK)
1.8(1.2)
Capital Injection (ζ) -1.2*(.5)
British Capital Injection (ζUK)
-1.0(.9)
Privatization (θ) 10.8**(3.1)
British Privatization n/aForeign=British effects (p-value)
.00**
Foreign=British effects except Nationalisation (p-value)
.23
Observations 9,615R2 .92RMSE 9.21
• F-test suggests that effect of British and foreign bank nationalisation is different
Treat foreign and British nationalisation as separate variables subsequently
But, for other interventions, keep dummy as 1 if event refers to British bank, -1 if to foreign bank and 0 otherwise
22

Results (2): Sensitivity AnalysisAfter: Foreign
NationalisationBritish
NationalisationUnusual Access to Loans or Liquidity
Public Capital Injection
ForeignPrivatisation
Default -10.9**(2.1)
.5(.5)
2.8**(.6)
-1.3**(.5)
-10.8**(3.1)
Denominator Variant
-10.6**(2.1)
1.5*(.6)
1.5*(.6)
-.9(.5)
-12.3**(3.4)
Robust SEs, not clustered
-10.9**(2.7)
.5(1.9)
2.8(1.5)
-1.3(1.0)
-10.8**(2.8)
Traditional SEs -10.9**(2.0)
.5(2.0)
2.8*(1.2)
-1.3(.8)
-10.8**(3.4)
Weight by Log Loans
-10.6**(2.0)
.1(.4)
2.6**(.6)
-1.4**(.4)
-11.5**(3.1)
Weight by Log Assets
-10.8**(2.0)
.2(.5)
2.7**(.6)
-1.4**(.4)
-11.2**(3.1)
Control for Total Loans
-9.9**(2.0)
-.5(.5)
3.5**(.6)
-1.1*(.5)
-10.9**(3.1)
Control for Total Assets
-9.8**(2.0)
-.5(.5)
3.8**(.5)
-.9(.5)
-10.9**(3.1)
Tobit -11.7**(.6)
-3.2(2.3e+7)
-.1(.4)
-.6**(.1)
-10.0**(88.)
23

Results (3): Cutting Up the SampleAfter: Foreign
NationalisationBritish
NationalisationUnusual Access to Loans or Liquidity
Public Capital Injection
ForeignPrivatisation
Default -10.9**(2.1)
.5(.5)
2.8**(.6)
-1.3**(.5)
-10.8**(3.1)
BigBanks
-8.6**(2.41)
-1.6**(.41)
1.1*(.5)
.1(.4)
-19.7**(2.9)
SmallBanks
3.4(12.6)
5.8(3.1)
6.3(3.4)
-.5(3.0)
-2.5**(.6)
Drop British Banks -10.9**(2.1)
n/a 1.9(1.1)
-1.2*(.5)
-10.5**(3.1)
Drop pre-2000 -11.9**(2.2)
-.6(.5)
2.7**(.6)
-1.3**(.5)
-1.0**(.3)
Drop >|2σ| outliers
-9.9**(1.2)
2.8**(.8)
-.1(.5)
-.0(.3)
-8.5**(2.6)
24

Results (4): Adding Controls
ExtraControl:
Foreign Nationalisation
British Nationalisation
Unusual Access to Loans or
Liquidity
Public Capital
Injection
ForeignPrivatisatio
n
Control
Default (none)
-10.9**(2.1)
.5(.5)
2.8**(.6)
-1.3**(.5)
-10.8**(3.1)
LoanGrowth
-10.8**(1.9)
.6(.5)
3.0**(.6)
-1.4**(.5)
-10.8**(3.2)
-.9**(.3)
Asset Growth
-11.1*(2.1)
.4(.5)
2.9**(.6)
-1.4**(.5)
-10.8**(3.2)
.030**(.004)
Capital Adequacy
-11.1**(2.1)
.0(.5)
3.1**(.6)
-1.3**(.5)
-10.9**(3.1)
4.4**(.8)
Capital Adequacy, variant
-11.1**(2.1)
-.0(.5)
3.1**(.6)
-1.3**(.5)
-10.8**(3.1)
4.3**(.8)
Assets/Capital (Leverage)
-10.8**(2.1)
-1.5**(.4)
2.8**(.6)
-1.5**(.5)
-10.6**(3.1)
-3e-7(4e-7)
Assets/Capital (Leverage) , variant
-10.9**(2.1)
.5(.5)
2.9**(.6)
-1.3**(.5)
-10.8**(3.1)
-3e-7(4e-7)
Wholesale Market Dependence
-10.9**(2.1)
.5(.6)
2.8**(.6)
-1.3**(.5)
-10.8**(3.1)
1.2(3.0)
25

Results (5): More ControlsForeign
NationalisationBritish
NationalisationUnusual Access
to Loans or Liquidity
Public Capital
Injection
ForeignPrivatisatio
n
Control
Profits/Assets
-8.2**(2.7)
.5(.5)
1.8**(.5)
-.7(.4)
n/a 34.(20.)
Profits/Assets, variant #1
-8.4**(2.7)
.5(.5)
1.8**(.5)
-.6(.4)
n/a 31.(25.)
Profits/Assets, variant #2
-8.4(2.7)
.5(.5)
1.8**(.5)
-.6(.4)
n/a 30.(25.)
Dividends/Assets
-8.5**(2.7)
.5(.5)
1.7**(.5)
-.6(.5)
n/a -16.(207.)
26

Results (6): Important ControlsForeign
NationalisationBritish
NationalisationUnusual Access
to Loans or Liquidity
Public Capital
Injection
ForeignPrivatisati
on
Control
Bank Nationality x Time FE
-16.1**(3.2)
1.8(2.1)
4.0**(1.4)
-.9(1.0)
-4.7(3.7)
F(•)= 1.2**
Status-Switching Banks
-9.5**(2.2)
1.2(.6)
1.6**(.5)
-1.0*(.4)
-10.8**(3.1)
F(•)= 36**
EC Objection or Investigation
-10.7*(4.2)
.3(.6)
2.8**(.6)
-1.3**(.5)
10.8**(3.1)
F(•)= 1.0
Demand Proxy
-11.4**(2.2)
-0.2(0.5)
2.9**(0.6)
-1.4**(0.5)
n/a 0.5**(0.2)
27
Note: inclusion of Bank-Nationality x Time FE wipes out any potential country x time-specific effects (exchange rates, national business cycles, …)
•“Flight Home” or “Great Retrenchment”

Results (7): Even More Controls
ExtraControl:
Foreign Nationalisation
British Nationalisation
Unusual Access to Loans or
Liquidity
Public Capital
InjectionDefault (none)
-10.9**(2.1)
.5(.5)
2.8**(.6)
-1.3**(.5)
Set #1 -9.7**(1.8)
-2.9**(.4)
4.0**(.6)
-1.2*(.6)
Set #2 -7.9*(2.8)
.8(.5)
2.0**(.5)
-.8(.5)
Set #1 & #2
-8.9**(2.5)
-3.1*(1.3)
3.6**(.7)
-.2(.5)
28
•Set #1: loan growth; asset growth; log total assets; capital adequacy; assets/capital (leverage); wholesale market dependence.
•Set #2: non-performing loan ratio; dividend ratio; profit ratio.

Numerator or Denominator?
• A potential explanation– Ex ante possible that nationalization leads to
denominator growth>numerator growth– Unclear if this is financial protectionism or not– Does this explain the story?
29

Numerators and Denominators
• Growth rates economically, statistically similar for numerator, denominator:– All observations– Split by British/Foreign– Split by Private/Nationalized
• Combinations as well
30

Conclusion from ‘Loan mix’
• British banks behaviour does not appear to change following nationalisation
• But foreign banks lend more outside and less in the UK following nationalisation– Highly statistically significant, robust, size of effect
reasonable– We interpret this as evidence of financial
protectionism– Not trivial: 12% loan activity nationalized
32

Interest rates as Regressand
• With imperfect competition, banks can charge interest rates above cost of capital (Freixas and Rochet, 2008)
• Previous work rejects perfect competition in the UK (Claessens and Laeven, 2004)
• So look for evidence of financial protectionism in interest rate data
33

Interest rates as Regressand (2)
• ‘Effective’ (weighted by loan) interest rate data are only available since 2004Q1 and for 40 largest lenders to a particular sector– sample much smaller 679 observations
• We use effective interest rate on new private non-financial corporation loans of less than one year maturity as the dependent variable
34

Results After: Foreign
NationalisationBritish
NationalisationUnusual Access
to Loans or Liquidity
Public Capital Injection
Default .71**(.07)
.19(.17)
.15*(.06)
.04(.05)
Interest Rate Variant .86**(.25)
-.83**(.16)
.08(.14)
.29(.16)
Robust SEs,not clustered
.71**(.08)
.19(.14)
.15(.10)
.04(.07)
TraditionalSEs
.71**(.17)
.19(.10)
.15(.08)
.04(.07)
Weight by Log Loans .71**(.07)
.16(.17)
.20**(.07)
.03(.06)
Weight by Log Assets .71**(.07)
.18(.16)
.17**(.06)
.04(.05)
Control for Total Loans .71**(.07)
.18(.16)
.17*(.07)
.04(.06)
Control for Total Assets .71**(.07)
.21(.16)
.14*(.05)
.03(.06)
Drop >|2σ| outliers .70**(.07)
.08(.06)
.10*(.04)
.05(.04)
35

Interest Rate Conclusion• Effect of foreign nationalisation statistically
significant, correct sign and robustConsistent with financial protectionism
• Effect of British nationalisation typically Insignificant
Consistent with earlier results
• Results robust to choice of dependent variable
36

Mortgage Data Set
• FSA collects transactions-level data since 4/05– Access to mortgage loan data– All financial institutions (approximately 8.5 mn
observations)– Bilateral (borrower, mortgage features)– Borrower heterogeneity allows controlling for
demand– Important, politicized market
37

Mortgage ResultsLoan/Income (Mean=280)
Foreign National’n
British National’n
Foreign Capital
Injection
British Capital
Injection
British Unusual
Access to Loans or Liquidity
Default -115.75**(41.63)
10.58(12)
44.06(42.40)
16.75(9.09)
4.68(10.43)
Borrower characteristics
-97.95**(30.51)
13.64**(3.55)
40.72(31.09)
1.98(4.85)
2.14(9.33)
Borrower characteristics + Set of Controls #1
-117.18**(36.39)
9.71*(3.95)
47.66(36.75)
6.50(7.79)
-6.16*(5.41)
Borrower characteristics + Set of Controls #2
-106.04**(38.61)
13.24**(3.77)
47.28(39.10)
2.56(5.46)
-1.97(7.21)
38

Mortgage ResultsLoan/Value (Mean=63.5)
Foreign National’n
British National’n
Foreign Capital
Injection
British Capital
Injection
British Unusual
Access to Loans or Liquidity
Default -15.69*(6.87)
2.07(4.62)
-0.57(6.93)
2.64(2.82)
-0.47(1.39)
Borrower characteristics
-11.02*(5.26)
1.46(1.77)
-2.33(5.25)
-1.40(1.02)
-1.25(1.06)
Borrower characteristics + Set of Controls #1
-13.87*(5.63)
0.13(2.05)
-1.04(5.73)
0.02(1.69)
-2.49**(0.76)
Borrower characteristics + Set of Controls #2
-12.07*(5.97)
1.39(1.36)
-1.39(1.36)
-.70(1.04)
-2.18**(0.81)
39

Unfinished Business:Future Research
1. Microeconomic causes of large public interventions
2. Liabilities side of banks’ balance sheets3. Welfare consequences
40

Overall Summary• First evidence of behaviour consistent with
financial protectionism for foreign, but not British banks– Use bank-level quarterly panel with time- and bank-
specific fixed effects– After British nationalizations, little happens to
interest rates or loan mix of British banks– After foreign nationalizations, foreign banks cut back
more on British loans and mortgages, raise interest rates
41