
Financial Profitability Analysis of Dairy Marketing in ...
20
Journal of Science and Sustainable Development (JSSD), 2018, 6(1), 87-105 Copyright © Ambo University ISSN: 2304-2702 (print); 2414-4479 (online) DOI: https://doi.org/10.20372/au.jssd.6.1.2018.084 Journal of Science and Sustainable Development (JSSD), 2018, 6(1), 87-105 ISSN 2304-2702 Financial Profitability Analysis of Dairy Marketing in Bako Tibe District, Ethiopia Bultossa Terefe Department of Agribusiness and Value Chain Management, College of Agriculture and Veterinary Science, Ambo University , P.O.Box 19,Ambo, Ethiopia. E-Mail: [email protected]. Abstract The study was carried out to analyze the financial profitability of dairy farmers in Bako Tibe district, Ethiopia. The necessary data was obtained from dairy producing households through survey. In addition, data was collected from secondary sources such as District Agricultural office, Bako Agricultural and Mechanization Research Centres. Gross margin and descriptive statistics was employed to analyze financial profitability of dairy farmers. Besides, total Revenue less total variable costs and OLS were used in examining financial profitability of the dairy farmers. The study revealed that financial profitability was affected by distance from market, extension visit, education level of the house hold head, number of milking cows owned and family size. The results indicated that production and marketable surplus should be improved through introducing improved technologies and adequate marketing infrastructure such as roads and transport facilities. Transportation infrastructure and facilities should be established between rural and urban areas in the district to enhance market participation. The results also pointed out that there should be adequate marketing link, through institutional arrangements such as dairy cooperatives, between the rural producers and urban consumers to reduce transactions cost. Relaxing the criteria required to obtain bank and micro credit and forming a well functioning urban and rural financial system would also enable resource poor farm households participate in dairy markets and improve the supply of dairy products. Keywords: Financial profitability, gross margin, market participation, volume of market participation Introduction The livelihoods of 1.3 billion people in developing countries depend directly or indirectly on livestock production (World Bank, 2008 and FAO, 2009). Globally, livestock contributes about 40 percent to the agricultural gross domestic product (GDP) and constitutes about 30 percent of the agricultural GDP in the developing world (World Bank, 2009). These estimates highlight the important contribution of livestock to sustainable agricultural development. The contribution of livestock to the world’s food supply, family nutrition, incomes, employment, soil fertility, livelihoods, transport and sustainable agricultural production continues to be a subject of significant review and debate. Furthermore, estimates show that globally, livestock provide animal traction to almost a quarter of the total area under crop production (Devendra, 2010). Livestock also
Transcript of Financial Profitability Analysis of Dairy Marketing in ...
Journal of Science and Sustainable Development (JSSD), 2018, 6(1), 87-105Copyright © Ambo UniversityISSN: 2304-2702 (print); 2414-4479 (online)DOI: https://doi.org/10.20372/au.jssd.6.1.2018.084
Journal of Science and Sustainable Development (JSSD), 2018, 6(1), 87-105 ISSN 2304-2702
Financial Profitability Analysis of Dairy Marketing in Bako Tibe District, Ethiopia
Bultossa Terefe Department of Agribusiness and Value Chain Management, College of Agriculture and Veterinary Science,
Ambo University , P.O.Box 19,Ambo, Ethiopia. E-Mail: [email protected].
Abstract
The study was carried out to analyze the financial profitability of dairy farmers in Bako Tibe district, Ethiopia. The necessary data was obtained from dairy producing households through survey. In addition, data was collected from secondary sources such as District Agricultural office, Bako Agricultural and Mechanization Research Centres. Gross margin and descriptive statistics was employed to analyze financial profitability of dairy farmers. Besides, total Revenue less total variable costs and OLS were used in examining financial profitability of the dairy farmers. The study revealed that financial profitability was affected by distance from market, extension visit, education level of the house hold head, number of milking cows owned and family size. The results indicated that production and marketable surplus should be improved through introducing improved technologies and adequate marketing infrastructure such as roads and transport facilities. Transportation infrastructure and facilities should be established between rural and urban areas in the district to enhance market participation. The results also pointed out that there should be adequate marketing link, through institutional arrangements such as dairy cooperatives, between the rural producers and urban consumers to reduce transactions cost. Relaxing the criteria required to obtain bank and micro credit and forming a well functioning urban and rural financial system would also enable resource poor farm households participate in dairy markets and improve the supply of dairy products.
Keywords: Financial profitability, gross margin, market participation, volume of market participation
Introduction
The livelihoods of 1.3 billion people in developing countries depend directly or indirectly on livestock production (World Bank, 2008 and FAO, 2009). Globally, livestock contributes about 40 percent to the agricultural gross domestic product (GDP) and constitutes about 30 percent of the agricultural GDP in the developing world (World Bank, 2009). These estimates highlight the important
contribution of livestock to sustainable agricultural development.
The contribution of livestock to the world’s food supply, family nutrition, incomes, employment, soil fertility, livelihoods, transport and sustainable agricultural production continues to be a subject of significant review and debate. Furthermore, estimates show that globally, livestock provide animal traction to almost a quarter of the total area under crop production (Devendra, 2010). Livestock also
Financial profitability analysis of dairy marketing in Bako Tibe district [1]
Journal of Science and Sustainable Development (JSSD), 2018, 6(1), 87-105 ISSN 2304-2702
provides safety net in times of need in the form of liquid assets and a strategy of diversification for food production (Franzel, S. and Wambugu, C., 2007). All these reviews and studies thus far have shown that livestock plays multiple roles in the livelihoods of people in developing poor communities. Agriculture is the mainstay of the Africa’s economy, foreign exchange earnings, industry inputs and domestic consumptions are from this sector. Most of the population are engaged in agricultural activity and earn their livelihood from the sector. In Ethiopia, agriculture provides employment to about 80 percent of the population, and generates 50 percent of the GDP. According to CSA (1995), about 72 percent of farm households cultivate holdings of less than 1 hectare and the average land holding size is 0.8 hectare. Moreover, the highlands of Ethiopia are one of the densely populated and poorest regions in the world with per capita income of US$ 513 (MOFED, 2011/12). Like in many developing countries, poverty, food insecurity and poor nutrition are persistent problems especially among the rural population predominantly dependent on low productive semi–subsistence farming. Population growth (World Bank, 1989; Cleaver and Gotz, 1994), and declining agricultural productivity and inadequate market participation of producers (World Bank, 1991) are few of the factors underlie this trend.
Countries currently with highest standards of living are those that have
a well–developed animal agriculture; as demand for animal products increases with economic development. In Ethiopian context, despite the huge potential the country has to produce milk and milk products, there is a chronic shortage of the product in most part of the country. This arises mainly from insufficient production coupled with inhibitive cultural taboos related to consumption and absence of proper processing and marketing (Zegeye, 2003).
Therefore, improving livestock productivity and their respective marketing activities may improve the sector’s contribution to the GDP and improves the live standards of the nation.
Dairying is a means of providing an additional source of employment and income to small and marginal farmers. The smallholder farmers produce about 93% of dairy products (Tsehay, 1998). It is only a small quantity of this production that is marketed in the form of liquid milk; the larger volume is processed into different dairy products for home consumption and sales. The low marketable output generates limitations to explore distant but rewarding markets due to high transaction costs arising from transportation and high opportunity cost of labor involved. Again dependable marketing system is not yet developed to market milk and milk products. Producers and consumers are spatially separated; most farmers are found in the rural areas while consumers or profitable market is found in urban areas. Most

Bultossa Terefe [2]
Journal of Science and Sustainable Development (JSSD), 2018, 6(1), 87-105 ISSN 2304-2702
of the milk supply is distributed from producer to consumer through informal means in both rural and urban areas. The informal market involves direct delivery of fresh milk by producers to consumers in the immediate neighbourhoods.
Therefore, improving the position of smallholders to actively engage in the market is one of the most important development challenges.
In Ethiopia, fresh milk sales by smallholder farmers are important only when they are close to formal milk marketing facilities such as government enterprise or milk groups. Results from a sample of farmers in Northern Shewa in 1986 estimated that 96% of the marketable milk was sold to the Dairy Development Enterprise (Debrah and Berhanu, 1991). Farmers far from such formal marketing outlets prefer to produce other dairy products such as cooking butter and cottage cheese. The vast majority of milk produced outside urban centres in Ethiopia is processed into dairy products by the households and sold to traders or other households in local markets (Debrah and Berhanu, 1991). The major portion of the milk production comes from small dairy farmers with few milk animals located in the rural areas. Products on animal farm is supposed to reach the market; the nearer the market the lesser would be the transportation charges and loss due to spoilage.
Enhancing the ability of smallholder dairy farmers to participate in the
market and improve their financial profitability is one of the most pressing development challenges (Jones, 1998). Various factors could limit the diary farmers’ participation in the market and their financial returns. These factors may originate in technical barriers including lack of market information, structural elements, storage, transportation, processing and government programmes and policies. Costs of marketing are usually high due to poorly developed physical and institutional facilities, absence of marketing services such as standardization, market information, financing arrangement, storage and transportation and processing. This would otherwise result in high risk of marketing and high barriers to growth, and poorly motivated producers and inadequate marketing institutions. It could also be due to farmers’ poor management practices and lack of information whether dairy marketing is profitable or not. Identifying factors that influence smallholders’ market participation and financial profitability is important to develop policies and institutions that support smallholder dairy farmers. Besides, identifying and analyzing important variables in dairy marketing financial profitability of smallholder dairy farmers would help stakeholders to make informed decisions. With this regard, the exiting evidence shows that such scientific study is lacking for Bako Tibe areas. Moreover, the rural and the peri urban areas of Bako Tibe District have the potential for high live stock

Financial profitability analysis of dairy marketing in Bako Tibe district [3]
Journal of Science and Sustainable Development (JSSD), 2018, 6(1), 87-105 ISSN 2304-2702
production and dairy products; but the district experiences chronic shortage of dairy products. As a result, the present study was intended to analyze the financial profitability of dairy marketing in Bako Tibe district. Objectives
The study was intended to:
• Analyze the financial profitability of smallholder dairy farmers.
• Identify major problems facing smallholder dairy farmers.
Materials and Methods Description of the study area The study was restricted to Bako Tibe district which is one of the 304 (265 rural & 39 urban) districts of Oromia National Regional State (BoFED, 2008). The district is found in West
Shewa Administrative Zone, Oromia Regional State, located at about 250 km west of Addis Ababa, at latitude of 9.120 and at a longitude of 37.050. The area and its environs have potential for both crop and livestock productions which are mainly practiced by smallholder semi subsistence farmers. There are about 127,615 cattle, 3,438 sheep, 11,600 Goats, 9,709 horses, 9,200 Donkeys, 4,668 mule and 8,033 Poultry in the district (Bako Tibe District Agricultural and Rural Development Office). There are also a growing number of Commercial farms in the area. The sample size for this study was restricted and limited to five peasant associations and 90 randomly selected households in dairy producers’ survey. Moreover, the study is limited to only dairy marketing and financial profitability analysis.
Figure 2. Map of Bako Tibe District
Bultossa Terefe [4]
Journal of Science and Sustainable Development (JSSD), 2018, 6(1), 87-105 ISSN 2304-2702
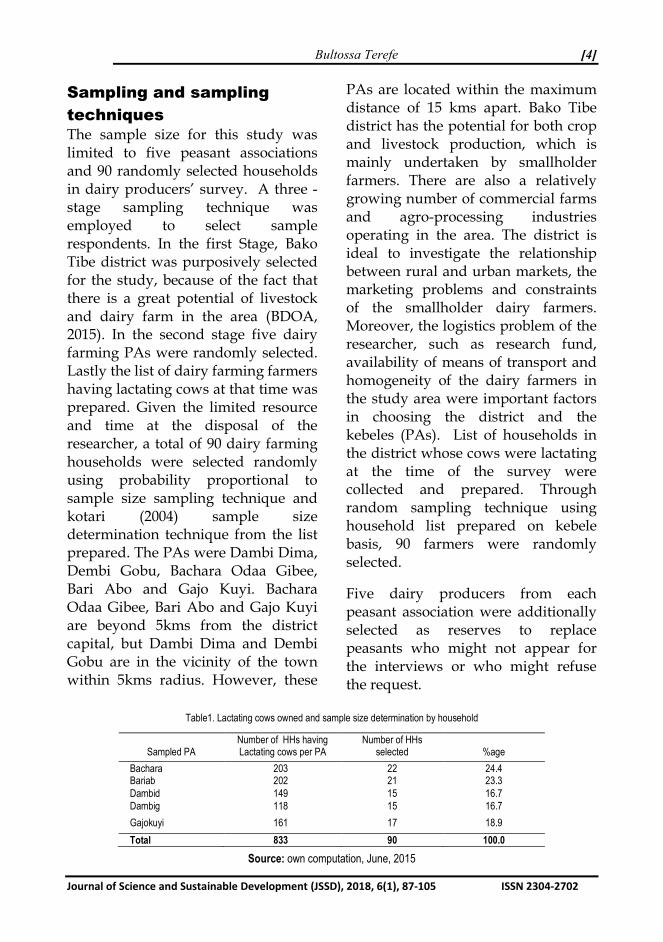
Sampling and sampling techniques The sample size for this study was limited to five peasant associations and 90 randomly selected households in dairy producers’ survey. A three - stage sampling technique was employed to select sample respondents. In the first Stage, Bako Tibe district was purposively selected for the study, because of the fact that there is a great potential of livestock and dairy farm in the area (BDOA, 2015). In the second stage five dairy farming PAs were randomly selected. Lastly the list of dairy farming farmers having lactating cows at that time was prepared. Given the limited resource and time at the disposal of the researcher, a total of 90 dairy farming households were selected randomly using probability proportional to sample size sampling technique and kotari (2004) sample size determination technique from the list prepared. The PAs were Dambi Dima, Dembi Gobu, Bachara Odaa Gibee, Bari Abo and Gajo Kuyi. Bachara Odaa Gibee, Bari Abo and Gajo Kuyi are beyond 5kms from the district capital, but Dambi Dima and Dembi Gobu are in the vicinity of the town within 5kms radius. However, these
PAs are located within the maximum distance of 15 kms apart. Bako Tibe district has the potential for both crop and livestock production, which is mainly undertaken by smallholder farmers. There are also a relatively growing number of commercial farms and agro-processing industries operating in the area. The district is ideal to investigate the relationship between rural and urban markets, the marketing problems and constraints of the smallholder dairy farmers. Moreover, the logistics problem of the researcher, such as research fund, availability of means of transport and homogeneity of the dairy farmers in the study area were important factors in choosing the district and the kebeles (PAs). List of households in the district whose cows were lactating at the time of the survey were collected and prepared. Through random sampling technique using household list prepared on kebele basis, 90 farmers were randomly selected.
Five dairy producers from each peasant association were additionally selected as reserves to replace peasants who might not appear for the interviews or who might refuse the request.
Table1. Lactating cows owned and sample size determination by household
Source: own computation, June, 2015
Sampled PA
Number of HHs having Lactating cows per PA
Number of HHs selected
%age
Bachara 203 22 24.4 Bariab 202 21 23.3 Dambid 149 15 16.7 Dambig 118 15 16.7 Gajokuyi 161 17 18.9 Total 833 90 100.0

Financial profitability analysis of dairy marketing in Bako Tibe district [5]
Journal of Science and Sustainable Development (JSSD), 2018, 6(1), 87-105 ISSN 2304-2702
In order to examine the sales patterns and marketing behaviour of the different categories of producers, additional criteria were employed. The criteria behind the selection of peasant associations were distance to market and district capital, and criterion adopted behind the selection of sample households was producers with some form of dairy products.
Rural kebeles were classified according to their distance from Bako town, the first group being those within 5 kms of Bako town, and the second those beyond 5 kms. And the maximum was 15 kms from the town. Using concentric circle the number of kebeles in the first and second group were 2 and 3, respectively. The sampling frame of, Dambi Dima, Dembi Gobu, Bachara, Bari Abo and Gajo Kuyi were identified. Three-stage sampling technique was employed; first Bako Tibe District was purposively selected. Second peasant associations were randomly selected, and then dairy producing farmers were determined and registered in lists. Through proportional probability, reasonable and representing dairy producing households from Dambi Dima, Dembi Gobu, Bachara, Bari Abo and Gajo Kuyi were selected from the registered lists of dairy producers.
Methods of data collection Both secondary and primary data were used for the study. Structured questionnaire were developed for field data collection. Key informants
were also interviewed to collect relevant information on livestock and dairy traders, extension agents, and researchers. Market survey was carried out to obtain information on prices to know the direction of dairy products flow and market conduct.
Data was collected from concerned organizations and individuals involved in the marketing of dairy products. Moreover, sample questionnaires were conducted preceding the survey and training was given to data collectors. The training was supported by practical data collection.
Data analysis The financial profitability analysis of the dairy farmers was determined using the gross margin which is the total revenue from dairy products sales minus total variable cost of production of a given dairy product (Mendoza and Rosegrant, 1995). Ahmad (2004) asserts that gross margin is applicable because of its accuracy in estimating financial profitability. Hence, gross margin was calculated for milk, butter and cheeses as shown below: Gross Margin of Milk = Total Revenue from sale of milk – Total Cost of milk production
Gross Margin of Butter = Total Revenue from sale of butter –Total Cost of Butter production
Gross Margin of cheese = Total Revenue from sale of cheese –Total Cost of Cheese production

Bultossa Terefe [6]
Journal of Science and Sustainable Development (JSSD), 2018, 6(1), 87-105 ISSN 2304-2702
Result and Discussions
Characteristics of dairy market participants and non-participants From a total of 90 dairy producing sampled households, 44 (48.8%) were market participants as they sold some forms of dairy product , while 46
(51.2%) did not participate in the sale of any dairy products. About 9% of the households participating in the market were female headed. Among market participants, 40 (90.1%) were male headed house hold market participants. The total female headed households in the sample were 13 (14.5%) and the male headed households as a whole was 77 (85.5%)
Table 2. Dairy marketing participants by ex of house hold head
Sex Participants (n) % Non Participants (n) % Total (n) % Female 4 9.09 9 19.5 13 14.5
Male 40 90.1 37 80.5 77 85.5 Total 44 100 46 100 90 100
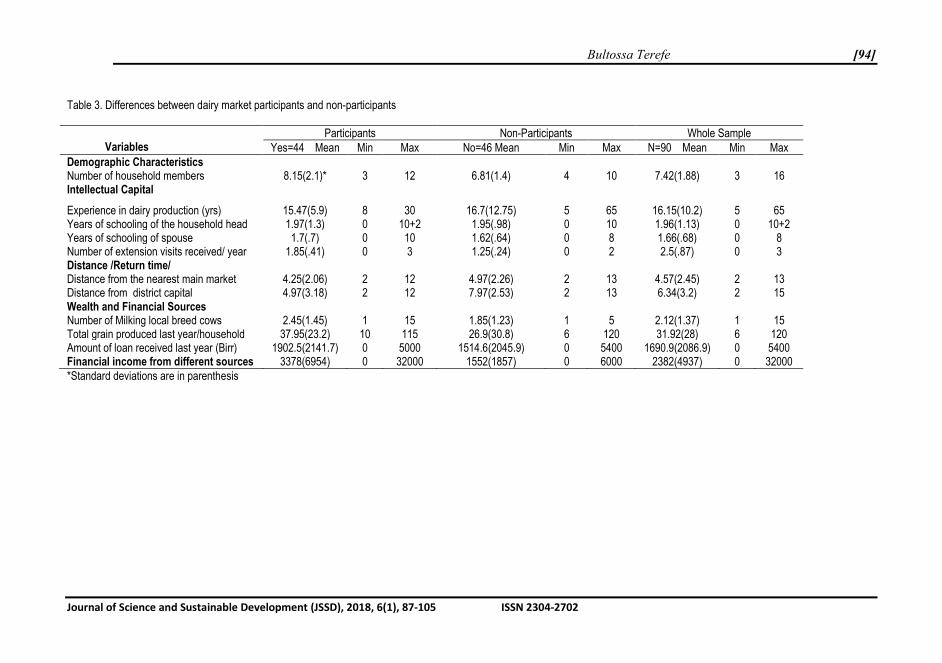
As it can be seen from table 3, dairy market participating households have more family members than non dairy market participating households. Credit was primarily obtained from micro credit institutions, and informal lenders such as farmers and traders if collateral are available. Micro credit is typically short-term loan that can help in financing working capital, but not investment capital required to improve market participation. Informal credit from conventional lenders was often quick and less difficult to obtain, but because of the risk involved, it was very restricted in amount, and involve restrictive conditions in terms of repayment and interest. Informal lenders, such as usurers in rural areas charge more than 50 percent annual interest rate on loans. This high cost of borrowing was due to shortages of credit facilities, which in turn reduces the size of working capital. Besides abnormally high interest rate of these loans,
opportunity costs of rural households are also high as they are supposed to sell dairy products to pay back the loans quickly.
Credit from family or friends (love capital), bears often no-interest, are also a significant source of finance. Fifteen percent (15%) of the sample households obtained credit from family and friends while 23.3% received from financial institutions in the survey year.
Livestock in the area are kept mainly for draught power. Milk production is only secondary. Dairying is used in the district to diversify operations and provide a continuous income especially for the poor. In the district, it is woman who decides how much to milk and how much to sale and children before school mostly perform the herding. Women who have exclusive right over income from dairy when the income is not significant sell of surplus milk and other dairy derivatives.

Bultossa Terefe [94]
Journal of Science and Sustainable Development (JSSD), 2018, 6(1), 87-105 ISSN 2304-2702
Table 3. Differences between dairy market participants and non-participants
Variables
Participants Non-Participants Whole Sample Yes=44 Mean Min Max No=46 Mean Min Max N=90 Mean Min Max
Demographic Characteristics Number of household members 8.15(2.1)* 3 12 6.81(1.4) 4 10 7.42(1.88) 3 16 Intellectual Capital
Experience in dairy production (yrs) 15.47(5.9) 8 30 16.7(12.75) 5 65 16.15(10.2) 5 65 Years of schooling of the household head 1.97(1.3) 0 10+2 1.95(.98) 0 10 1.96(1.13) 0 10+2 Years of schooling of spouse 1.7(.7) 0 10 1.62(.64) 0 8 1.66(.68) 0 8 Number of extension visits received/ year 1.85(.41) 0 3 1.25(.24) 0 2 2.5(.87) 0 3 Distance /Return time/ Distance from the nearest main market 4.25(2.06) 2 12 4.97(2.26) 2 13 4.57(2.45) 2 13 Distance from district capital 4.97(3.18) 2 12 7.97(2.53) 2 13 6.34(3.2) 2 15 Wealth and Financial Sources Number of Milking local breed cows 2.45(1.45) 1 15 1.85(1.23) 1 5 2.12(1.37) 1 15 Total grain produced last year/household 37.95(23.2) 10 115 26.9(30.8) 6 120 31.92(28) 6 120 Amount of loan received last year (Birr) 1902.5(2141.7) 0 5000 1514.6(2045.9) 0 5400 1690.9(2086.9) 0 5400 Financial income from different sources 3378(6954) 0 32000 1552(1857) 0 6000 2382(4937) 0 32000 *Standard deviations are in parenthesis
Financial profitability analysis of dairy marketing in Bako Tibe district [95]
Journal of Science and Sustainable Development (JSSD), 2018, 6(1), 87-105 ISSN 2304-2702
Market-oriented households keep few crossbred animals. Keeping crossbred dairy cow’s increases income from dairy as expected and brings financial obligations to the household because of credit during initial purchase of the animals and high feed and management demand. In this case, men try to control the income from dairy to settle financial obligations and try to meet the expenditure of feed and other expenses. Because of the relatively smaller processed production of butter, cheese and yoghurt from milk of crossbred dairy cows, households tend to sell liquid milk without processing it into these dairy derivatives. In the particular study area very few dairy farmers own milking cross dairy cows, while the majority dairy farmers owns local dairy milking cows.
Characteristics by sample location Sample households in Danbi dima, Bachara Odaa Gibee, Bari Abo and Gajo Kuyi had no crossbred dairy cows and none of them sold liquid
milk but sold dairy products such as butter and cheese, which have better shelf life preceding the survey. The volume of sale of butter and cheese per household was also relatively higher for Dambi Dima, Bachara and Gajo Kuyi farmers. Here the effect of distance can be clearly demonstrated in dairy market participation and volume of sales. In the rural areas of the district far from urban centre where there was little or no saving and accumulation of capital, the existing cultural and traditional taboos were inhibitive of selling of dairy products (locally called “the whites of cows”). Much of the product consumed during cultural and religious celebration and the remaining is freely given to near-by poor farmers and relatives for free. Those households were aged or had more experience in dairying and better per capita grain production. Households that were far from the district capital were more bound to their cultures and traditions than households close to urban centres.
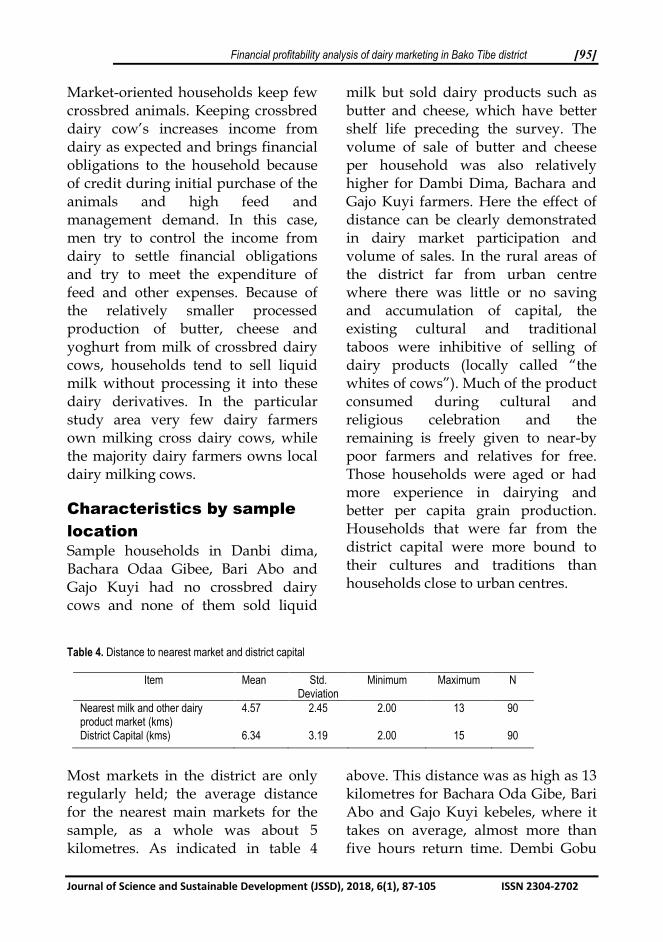
Table 4. Distance to nearest market and district capital
Item Mean Std. Deviation
Minimum Maximum N
Nearest milk and other dairy product market (kms)
4.57 2.45 2.00 13 90
District Capital (kms) 6.34 3.19 2.00 15 90
Most markets in the district are only regularly held; the average distance for the nearest main markets for the sample, as a whole was about 5 kilometres. As indicated in table 4
above. This distance was as high as 13 kilometres for Bachara Oda Gibe, Bari Abo and Gajo Kuyi kebeles, where it takes on average, almost more than five hours return time. Dembi Gobu

Bultossa Terefe [96]
Journal of Science and Sustainable Development (JSSD), 2018, 6(1), 87-105 ISSN 2304-2702
and Dambi Dima kebeles were located close to district capital and main market as compared to the other kebeles; it takes nearly two hours of return time from the district and nearest main market. The longer distance implies that people less often go to market and more time was required to get to market. Forms of dairy sale by households The most marketable product in rural, peri urban and urban areas was butter. Of the total 48.8% of market participating households, 38% participated in butter sale, 7.8% participated in selling milk and 3% participated in cheese sale, spatially the sale of cheese and milk were
restricted to urban and peri urban areas while the sale of butter were undertaken anywhere in the district, even though the majority of the product were taken to urban markets. As depicted in Table 5, households have a tendency of selling one dairy product at a time. Many households participate in selling butter and market participating farm households tend to sell one type of dairy product at a time. Equal number of sample households sold milk and cheese. Better combination was observed between butter and cheese. The combination of milk with other dairy products was weak and this shows that milk-selling households try to specialize in selling milk.
Table 5. Households selling different forms of airy products
Market participating households Number Percentage Households selling butter 24 38 Households selling milk 4 7.8 Households selling cheese 2 3 Households selling butter and cheese 6 6.6 Households selling butter and milk 3 3.3 Households selling milk and cheese 2 0.1 Households selling butter, cheese and milk 5 5.5
Uses of income from dairy Many households in the study area are not market oriented and much of dairy product is, therefore, allocated for household consumption. Moreover 15.4% of dairy products produced are sold. The rest 84.6% of dairy products especially butter is used during cultural and religious festivals as cosmetics and preparation of varieties of cultural foods. Only little surplus left is taken to the market
to meet different financial obligations of the households.
Dairy income is used to cover expenditures on replacement of stock and farm inputs, students’ school material, purchase of other foods and coffee, health expenditure for both cattle and human (Table 6). More than 16.7% of the sample households allocate their income to cover student expenses as their first priority.
Financial profitability analysis of dairy marketing in Bako Tibe district [97]
Journal of Science and Sustainable Development (JSSD), 2018, 6(1), 87-105 ISSN 2304-2702
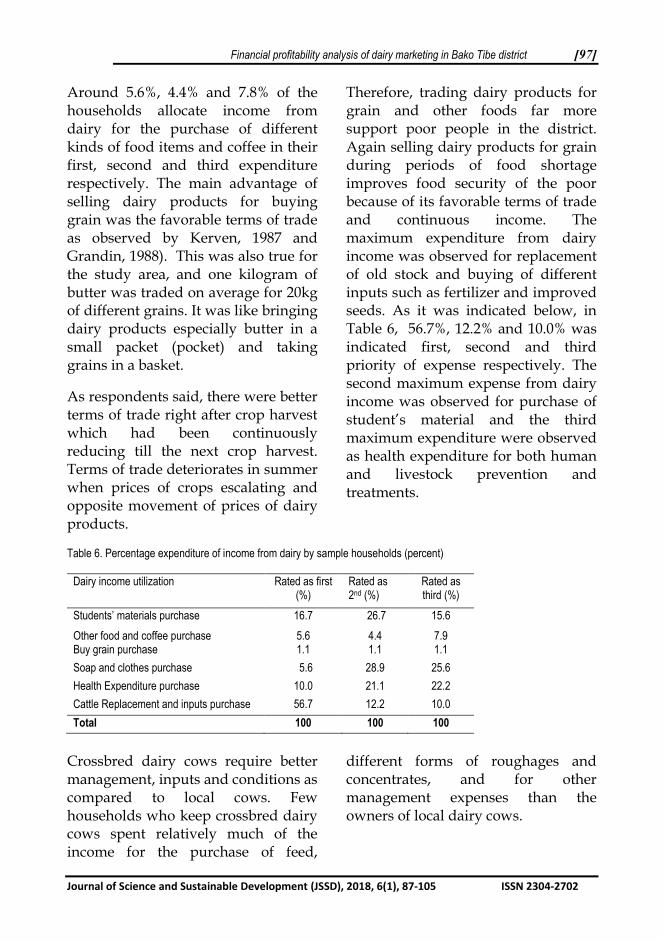
Around 5.6%, 4.4% and 7.8% of the households allocate income from dairy for the purchase of different kinds of food items and coffee in their first, second and third expenditure respectively. The main advantage of selling dairy products for buying grain was the favorable terms of trade as observed by Kerven, 1987 and Grandin, 1988). This was also true for the study area, and one kilogram of butter was traded on average for 20kg of different grains. It was like bringing dairy products especially butter in a small packet (pocket) and taking grains in a basket.
As respondents said, there were better terms of trade right after crop harvest which had been continuously reducing till the next crop harvest. Terms of trade deteriorates in summer when prices of crops escalating and opposite movement of prices of dairy products.
Therefore, trading dairy products for grain and other foods far more support poor people in the district. Again selling dairy products for grain during periods of food shortage improves food security of the poor because of its favorable terms of trade and continuous income. The maximum expenditure from dairy income was observed for replacement of old stock and buying of different inputs such as fertilizer and improved seeds. As it was indicated below, in Table 6, 56.7%, 12.2% and 10.0% was indicated first, second and third priority of expense respectively. The second maximum expense from dairy income was observed for purchase of student’s material and the third maximum expenditure were observed as health expenditure for both human and livestock prevention and treatments.
Table 6. Percentage expenditure of income from dairy by sample households (percent)
Dairy income utilization Rated as first (%)
Rated as 2nd (%)
Rated as third (%)
Students’ materials purchase 16.7 26.7 15.6 Other food and coffee purchase 5.6 4.4 7.9 Buy grain purchase 1.1 1.1 1.1 Soap and clothes purchase 5.6 28.9 25.6 Health Expenditure purchase 10.0 21.1 22.2 Cattle Replacement and inputs purchase 56.7 12.2 10.0 Total 100 100 100
Crossbred dairy cows require better management, inputs and conditions as compared to local cows. Few households who keep crossbred dairy cows spent relatively much of the income for the purchase of feed,
different forms of roughages and concentrates, and for other management expenses than the owners of local dairy cows.

Bultossa Terefe [98]
Journal of Science and Sustainable Development (JSSD), 2018, 6(1), 87-105 ISSN 2304-2702
Dairy product movement Sample households produced 1573.5 litres of milk per week. Most of the milk produced, about 1235 litres (78.5%), was processed into butter and 32 litres (2.05%) was sold in a liquid
form (Table 7). The remaining 203.10 litres (12.9%) was consumed in the household in liquid milk form, and 42 litres (16.55%) was processed into yoghurt and cheese.
Table 7.Utilization of milk among sample farm households
Dairy products Litres Percent Milk for human consumption in the household 203.10 12.9
Milk sold 32 2.05 Milk processed into butter 1235 78.5 Milk processed into yoghurt & cheese 103.4 6.55 Total milk produced 1573.5 100
Dairy products in the hands of market participating and non-participating farm households had different uses. Non-participating households use dairy products in a variety of ways. Depending on the households’ preferences, consumption was either in the form of liquid milk or processed into different dairy derivatives, then as cooking butter and cosmetics. Market-participating households besides consuming some milk at the household allocated some amount of dairy products for sale in different forms. These households also consumed and sold dairy products of different forms, non-participating households prefer to consume processed dairy products 371 litres (73%) and unprocessed milk 137 (23%). Dairy products with market participating households move through longer marketing chains. This is the result of additional activities performed by dairy producers and value adding functions (processing, transporting and storage) of
marketing middlemen in terms of form, time and place.
The movement of dairy products with market participating households can be compared with the flow of a river. Innumerable dairy producers at the one end are forming the source of flow and many consumers at the other extreme forming destinations. Marketing middlemen on the other hand act as a link between the two extremes and form course of a river and giving organization to the flow. Price differences among geographical locations or spatially separated markets are a gravity initiating the flow and giving direction.
Financial profitability of smallholders in dairy marketing As it can be seen from Table 8 below, production of any dairy product at farm gate level is profitable. Moreover, production of butter is the most profitable one, hence 89.50%

Financial profitability analysis of dairy marketing in Bako Tibe district [99]
Journal of Science and Sustainable Development (JSSD), 2018, 6(1), 87-105 ISSN 2304-2702
gross margin is made by butter production and marketing. The second most profitable product is production and marketing of milk. Hence it produces about 65.30% gross margin. The third profitable production and marketing was production and marketing of “irgo” as
it produces about 59.45% Gross margin.
Production and marketing of cheese produced about 42.50% of gross margin at farm gate level and stood fourth in the financial profitability analysis.
Table 8. Dairy producers gross margin at farm gate level Dairy Product
Qty produced
lit,kg
Unit Price
Total value of production
(bxc)
Unit Pron
cost
Total Prond. Cost (exb)
Gross
Margin (d-f)
% Gross Margin
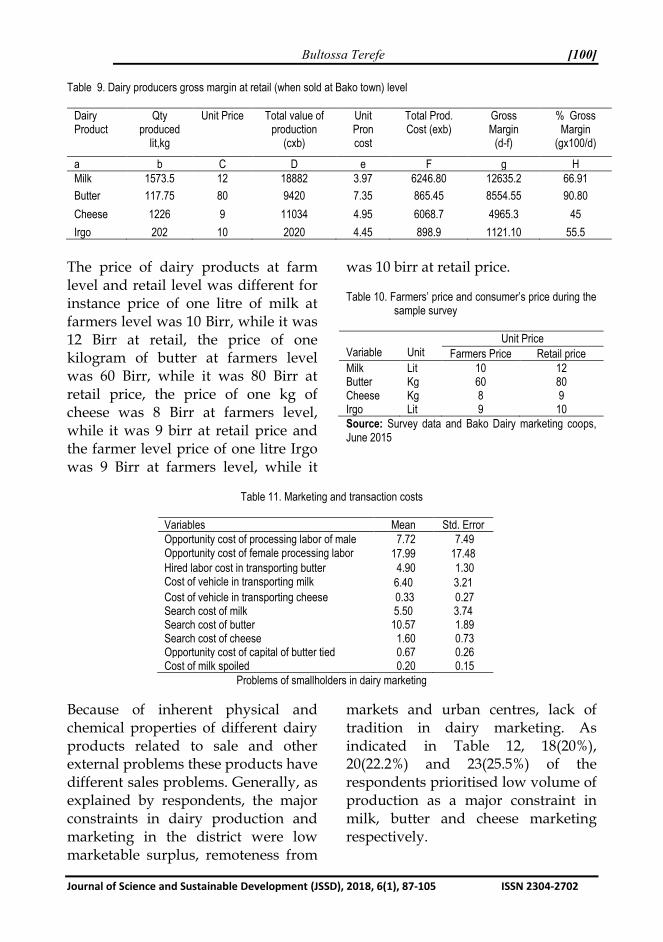
(gx100/d) a b C d e F G h Milk 1573.5 10 15,735 3.47 5460.05 10,274.95 65.30 Butter 117.75 60 7,065 6.30 741.85 6,323.15 89.50 Cheese 1226 8 9,808 4.60 5639.60 4168.40 42.50 Irgo 202 9 1,818 3.65 737.30 1080.70 59.45 As depicted in table 9 below dairy production and marketing at retail level or at urban/district capital is more profitable than at farm gate level. A farmer producing and marketing butter can make gross margin of about 91%, a farmer producing and marketing milk can make gross margin of about 66.9%, a farmer producing and marketing of irgo can make a gross margin of about 55.5% and a farmer producing and marketing of cheese can make a gross margin of about 45%. In general producing and marketing of dairy products by small farmers can produce a significant return and profit
to the dairy farmers and dairy market participants.
Small-scale dairy processing and marketing individuals and coops in the district received further boost of prices for dairy products. The dairy industry has seen some changes due to the emergence of small-scale dairy producing urban and peri urban households, few small scale milk processing and marketing dairy cooperative which participate both in formal and informal markets such as Bako Small scale Dairy Producers Marketing cooperatives get better financial share and profit from the dairy production and marketing.
Bultossa Terefe [100]
Journal of Science and Sustainable Development (JSSD), 2018, 6(1), 87-105 ISSN 2304-2702
Table 9. Dairy producers gross margin at retail (when sold at Bako town) level
Dairy Product
Qty produced
lit,kg
Unit Price Total value of production
(cxb)
Unit Pron cost
Total Prod. Cost (exb)
Gross Margin
(d-f)
% Gross Margin
(gx100/d)
a b C D e F g H Milk 1573.5 12 18882 3.97 6246.80 12635.2 66.91 Butter 117.75 80 9420 7.35 865.45 8554.55 90.80 Cheese 1226 9 11034 4.95 6068.7 4965.3 45 Irgo 202 10 2020 4.45 898.9 1121.10 55.5
The price of dairy products at farm level and retail level was different for instance price of one litre of milk at farmers level was 10 Birr, while it was 12 Birr at retail, the price of one kilogram of butter at farmers level was 60 Birr, while it was 80 Birr at retail price, the price of one kg of cheese was 8 Birr at farmers level, while it was 9 birr at retail price and the farmer level price of one litre Irgo was 9 Birr at farmers level, while it
was 10 birr at retail price. Table 10. Farmers’ price and consumer’s price during the
sample survey Variable
Unit
Unit Price Farmers Price Retail price
Milk Lit 10 12 Butter Kg 60 80 Cheese Kg 8 9 Irgo Lit 9 10 Source: Survey data and Bako Dairy marketing coops, June 2015
Table 11. Marketing and transaction costs
Variables Mean Std. Error Opportunity cost of processing labor of male 7.72 7.49 Opportunity cost of female processing labor 17.99 17.48 Hired labor cost in transporting butter 4.90 1.30 Cost of vehicle in transporting milk 6.40 3.21 Cost of vehicle in transporting cheese 0.33 0.27 Search cost of milk 5.50 3.74 Search cost of butter 10.57 1.89 Search cost of cheese 1.60 0.73 Opportunity cost of capital of butter tied 0.67 0.26 Cost of milk spoiled 0.20 0.15
Problems of smallholders in dairy marketing
Because of inherent physical and chemical properties of different dairy products related to sale and other external problems these products have different sales problems. Generally, as explained by respondents, the major constraints in dairy production and marketing in the district were low marketable surplus, remoteness from
markets and urban centres, lack of tradition in dairy marketing. As indicated in Table 12, 18(20%), 20(22.2%) and 23(25.5%) of the respondents prioritised low volume of production as a major constraint in milk, butter and cheese marketing respectively.

Financial profitability analysis of dairy marketing in Bako Tibe district [101]
Journal of Science and Sustainable Development (JSSD), 2018, 6(1), 87-105 ISSN 2304-2702
Low production itself seems to be the result of the reduced per capita natural pasture due to increasing demand for land for crop production
and increasing population. Again, the majority of dairy cows are indigenous animals, which have low milk production performance.
Table 12.Problems of dairy marketing of smallholders by commodity type
* Values in ( ) are in percentages The low marketable surplus imposes limitation on exploring distant but rewarding and lucrative markets. Consequently, processed dairy products, which have lower volume and perishable nature, such as butter and cheese, were sold within the villages where market outlets and producers bargaining power were limited.
Remoteness coupled with high perishable and bulky natures of liquid milk have important effects on market participation decision and its volume of sales. Some respondents, 20(22.22%), indicated that because of their long distance from markets and major urban centres, they were unable to participate in the milk markets. This has restricted their participation in spatial arbitrage and profitable transaction. The reduced market involvement in turn is expected to lead into reduced dairy production and low farm income. Distances have relatively minimum effect on butter
and cheese sales because of reduced volume and less perish ability.
Sales of cattle in general and dairy cows in particular were very low. Most households were reluctant to sell or cull poor performing dairy cows. Only 20 (22.22%) and 3 (3.3%) of the sample households sold livestock and dairy cows, respectively, in the year preceding the survey. Increasing dairy production through the increase in the number of poor performing dairy cows is very limited because of the continuously decreasing pasture and forage. Overstocking the land with livestock degrades the land and further diminishes fodder and pasture supply. Increase in the dairy production, therefore, should be achieved through the adoption of high yielding dairy cows which can be both local and crossbred. Market infrastructure tends to be deficient in the district. Even though, there was a good beginning. There is
Marketing Problem Milk Butter Cheese No problem 2(2.2) 1(1.1) 5(5.5) Far from market or town 20(22.2) 10(11.1) 12(13.3) Lack of feed 25(27.7) 25(27.7) 25(27.7)
Low production 18(20) 20(22.2) 23(25.5) No tradition of selling dairy products 8(8.8) 9(10) 9(10) Livestock Disease 17(18.8) 25(27.7) 16(17.7) Total 90(100) 90(100) 90(100)

Bultossa Terefe [102]
Journal of Science and Sustainable Development (JSSD), 2018, 6(1), 87-105 ISSN 2304-2702
lack of appropriate roads, communication means, and electricity and there is also lack of appropriate storage for perishable dairy products. This resulted into significant deterioration costs. As the consequence, market supply heavily depends on quantities produced alone and not adjusted from stock. This situation reinforces seasonality and price volatility like reduced supply and associated high price in dry season as opposed to wet season. Econometric analysis Factors affecting financial profitability and gross margin As expected FAMSZE was significant and negatively affects the gross margin of small holder dairy farmers at 5% significant level. This is mainly, even though, as family size increases the work force of the small holders increases. Family size in the study
area showed negative relationship, because large family size in the area consumes larger amount of dairy products. Hence this cases the reduction in gross margin. Schooling of the house hold head (SCHOOLINGH) affected the gross margin significantly and positively at 5% significant level. This was as per expectation. Return time from the nearest dairy market (RETRNTMMRT) affected gross margin negatively with 1% significant level. This is again as per expected, hence as return time from the nearest dairy market increases gross margin will decrease.
Extension service EXTENSERCE as expected significantly and positively affects gross margin at 1% significant level. Milking cows owned (MILCOWSLOCAL) as expected significantly and positively affects gross margin at 1% significance level.
Table 12. Regression output of variables on gross margin
Gmargin Coef. Std. Err. t Sig Leve [95% Conf, Interval] SEXH -65.24479 48.4343 -1.35 0.182 -161.6898 31.20023 DAIRYEXP .5527465 1.476688 0.37 0.709 -2.387714 3.493207 FAMSZE -17.20516 8.925142 -1.93 0.050** -34.98039 0.5640665 SCHOOLINGS 6.63716 25.61091 0.26 0.796 -44.36067 57.63499 SCHOOLINGH 31.86798 17.99828 1.77 0.050** -3.971164 67.70713 RETRNTMMRT -50.17266 5.039836 -8.45 0.000*** -62.00038 -38.34493 RETRNTMDISCP 6.463542 6.717818 0.96 0.339 -6.913343 19.84043 EXTENSERCE 201.3117 38.74866 5.20 0.000*** 124.1555 278.4722 AMTLOANRVD .0123931 .0098975 1.25 0.214 -0.0073153 0.0321015 MILCOWSLOCAL 52.78789 11.68192 4.52 0.000*** 29.52621 76.04956 OFFARMINCM .0018217 .0049542 0.37 0.714 -0.008433 0.0116867 GRAINPRDN -.4680866 .7733495 -.61 0.547 -2.008022 1.071849 -CONS 479.8152 110.9931 4.32 0.000*** 258.7997 700.8307
*** Significant at 0.01 probability level ** Significant at 0.05 probability level * Significant at 0.1 probability level
Financial profitability analysis of dairy marketing in Bako Tibe district [103]
Journal of Science and Sustainable Development (JSSD), 2018, 6(1), 87-105 ISSN 2304-2702
Conclusion The present study clearly indicated that butter and milk productions and marketing are the most profitable products in Bako Tibe district. Family size, return time from the nearest dairy products market, extension service delivered, number of milking cows owned and education level of the household heads significantly determine the financial profitability of small holder dairy farmers. The study also pointed out that milk marketing is changing rapidly with increasing market oriented small scale dairy producers and milk marketing outlets such as dairy producers and marketing cooperative in Bako town which gets better price and profit. The study has also given insight that dairy market in the study area was characterized by the prevalence of unconcentrated supplies. Products are supplied by a very few number of producers from different areas. At buyers’ level, market was also weak for butter and cheese. On the other hand, milk market at buyers’ level was weakly oligopolistic. Dairy producers participating in dairy products marketing have been making more profits when they sell at Bako town (the district capital) than local markets. In the study area, dairy farmers faced major problems such as lack of feed, lack of infrastructures, low dairy production and live stock diseases.
Recommendations Based on the present study, the following recommendations were drawn:
• The farming community should be provided with quality animals, both local and crossbred;
• The farming community should be provided with balanced animal feeds;
• Capacity building trainings on animal feeds storage and health services should be provided ;
• Due consideration has to be given to establish and strengthen cooperatives in dairy marketing;
• The notion and practices of agricultural marketing extension should be properly addressed;
• Transportation facilities should be in place to manage livestock products during collection and transportation;
• Financial capital has to be provided to stimulate dairy market participation, financial profitability and volume decision;
• Modern dairy processing technologies should be used to contribute to income generation;
• There should be viable marketing link between diary producers and consumers;
• Members should properly understand and implement the objectives of dairy cooperatives, and
• There should be applicable government policies to support dairy cooperatives.

Bultossa Terefe [104]
Journal of Science and Sustainable Development (JSSD), 2018, 6(1), 87-105 ISSN 2304-2702
References Bakhsh , K. 2004. Factors Affecting
Profitability and Yield of Carrot in Two Districts in Punjab. Pakistan: International Journal of Agriculture Biology, Vol 5: 794 – 798.
Debrah S. and Berhanu A. 1991. Dairy marketing in Ethiopia: Markets of first sale and producer’s marketing patterns. ILCA Research Report 19. ILCA (International Livestock Center for Africa), Addis Ababa, Ethiopia. 21p.
Devendra, C. and Sevilla, C.C. 2010. Availability and use of feed resources in crop–animal systems in Asia. Agricultural Systems, Vol 71: 59–73.
Food and Agriculture Organization of the United Nations 2009. Livestock’s long shadow:
Environmental issues and options. FAO, Rome, Italy.
Franzel, S. and Wambugu, C. 2007. The uptake of fodder shrubs among smallholders in East Africa: Key elements that facilitate widespread adoption. In: Hare, M.D. & Wongpichet, K. (Eds) Forages: A pathway to prosperity for smallholder farmers. Proceedings of an International Symposium, Faculty of Agriculture, Ubon Ratchathani University, Thailand.
Grandin, B. E. 1988. Wealth and pastoral dairy production: A case study from Maasailand. Human Ecology 16: 1-21.
Jabbar, M.A., E. Tambi and G. M. 1997. A Methodology for characterizing dairy marketing
systems. Market Oriented Smallholder Dairying Research Working Document No.3. ILR
(International Livestock Research Institute), Nairobi, Kenya. 62p.
John, H. McCoy and M.E. S.1998. Livestock and Meat marketing. Third Edition, Van Nostrand
Reinhold Company, New York, U. S. A. 84p.
Jones, O. W. 1972. Marketing Staple Foods in Tropical Africa. London, Cornell University press.
Kothari, C.R. 1990. Research methodology: Methods and techniques. Second Edition. Washwa Prakashan Pub. New Delhi, India. 468p.
Ministry of Finance and Economic Development (MOFED) 2011/12, Annual Progress Report for F.Y. 2011/12 Growth and Transformation Plan.
Mondoza, M.S. and M. R. 1995. Pricing behavior in Philippines corn market: Implication for food marketing efficiency. Research Report No 101. IFPRI (International Food Policy Research Institute). 84p.
Tsehay R. 1998. Prospects of Ethiopian dairy development. Pp.149-151.
Proceeding of the Role of Village Dairy Cooperatives in Dairy Development: Prospects for Improving Dairy in Ethiopia, Addis Ababa, Ethiopia, 22-24 April 1998.
Working report, 2012, 2013 Bako Tibe
Financial profitability analysis of dairy marketing in Bako Tibe district [105]
Journal of Science and Sustainable Development (JSSD), 2018, 6(1), 87-105 ISSN 2304-2702
District Agriculture and Rural Development office.
World Bank 1989. Sub-Saharan Africa: From crisis to sustainable growth (A long term perspective study). World Bank, Washington D.C., USA. 278p.
World Bank 1991. Poverty and hunger: Issues and options for food security in Developing Countries. World Bank Policy Study, Washington D.C., USA. 82p.
World Bank 2002. World Development Report. World Bank, Washington, D.C, USA. 262p.
World Bank 2008 . World Development Report 2008. The World Bank, Washington D.C., USA.
World Bank 2009. World Development Report 2008. The World Bank, Washington D.C., USA.
Zegeye Y. 2003. Challenges and opportunities of livestock marketing in Ethiopia. Pp.48-58. Proceedings of the 10th Annual Conference of the Ethiopian Society of Animal Production (ESAP) held in Addis Ababa, August 2002.


