FINANCIAL PERFORMANCE AND SWOT …ijbel.com/wp-content/uploads/2017/09/ACC-95.pdfFINANCIAL...
13
International Journal of Business, Economics and Law, Vol. 13, Issue 1 (August) ISSN 2289-1552 2017 1 FINANCIAL PERFORMANCE AND SWOT ANALYSIS TO INCREASE PROFITABILITY IN REGIONAL OWNED ENTERPRISE (BUMD) BEKASI CITY, INDONESIA Hanifah Hery Syaerul Homan ABSTRACT Regional Owned Enterprises (ROE/BUMD) is a regional company that generally companies do not conduct business activities and only supervise the company - a subsidiary company owned. So the forward pullback of BUMD will depend on the advance of the retreat of these partners in general. BUMD mission there are two that must serve the social community but on the other hand must increase the profit so as to contribute to PAD. So rarely do BUMDs that perform optimally. In this case the researcher is interested to study more about the performance of BUMD and give input through the analysis of financial ratios and SWOT (Strengths, Weakness, Opportunities, and Threats) analysis, so as to increase profit. The purpose of this research is to know financial performance in liquidity, solvency, profitability and activity aspect and SWOT analysis. So, the object under study is the financial performance including the ratio of liquidity, solvency, profitability, effectiveness and SWOT analysis related to strength, weakness, opportunities, and threats. The subject in this research is PT. Mitra Patriot in Bekasi city consisting of PT. Patriot Jaya Bekasi its business is engaged in the field as a producer of organic fertilizer, PT. Synergy Patriot Bekasi is engaged in managing household gas channel and sales of commercial gas and PT. Menara Patriot Engaged in the management of licensing and construction in the field of telecommunications. The results showed that the ratios of liquidity, solvency, profitability, and activity of PT. Synergy Patriot and PT. Menara Patriot are in poor condition when compared to the ratio of the average of similar industries. This requires both companies to plan strategies based on SWOT analysis. Keywods : Financial performance, SWOT Analysis (Strengths, Weakness, Opportunities, and Threats) and earnings. Introduction State-owned enterprises managed by local governments are called regional enterprises (BUMD). BUMD is a company established by local government whose capital is mostly or entirely owned by local government. The purpose of establishing a local company for the development and development of economic potential in the area concerned. Thus, BUMD must optimize its management in order to truly become a reliable economic power so that it can play an active role, both in carrying out its functions and duties as well as the strength of its regional economy. Viewed from the purpose BUMD is expected to contribute enormously to the Original Revenue. To achieve these objectives, BUMDs are sustained by regulations or the existence of substantial regional autonomy provides consequences for the role of Regional Owned Enterprises (BUMD) in sustaining PAD. In addition, there should be efforts to optimize in improving professionalization in terms of management, human resources and facilities and adequate infrastructure so that it has a position parallel to the strength of other economic sectors. BUMDs actually have two sufficient dilemmas from the business side, namely as a regional company that must serve the public interest in the field of services and business, but on the other hand has a target to increase the local revenue. Both of these goals are actually difficult to be realized optimally, because it has a difference. But because the demands of the local government, inevitably have to run so rarely BUMDs whose performance is maximal or good, although it has been given opportunities with some favorable rules. In carrying out its business BUMD can establish cooperative relationships with other parties (business partners) of the same type, and conduct equity participation in other business entities. With the principle of mutual benefit in accordance with applicable provisions. The Company does not conduct business activities and only supervises the subsidiaries owned. So the performance of these partners combined or consolidated the results with BUMD, in the sense that the subsidiary company is merged with the parent company. So going back and forth BUMD will depend on the withdrawal of the partners in general. This condition occurs as in the Bekasi City, where the BUMD almost collapsed due to the efforts of partners who engaged for 3 (three) consecutive years to lose. In the year 2013 suffered losses of Rp 1,810,818,601, the year 2014 loss of Rp 599,862,483 and in 2015 suffered losses Rp 1.931.178.302 More clearly can be seen in Table 1.1 below. Based on table 1, indicates that the regional companies in Bekasi City suffered considerable losses when compared with the revenue it receives. Conditions like this cannot be allowed, because it will have an impact on the perpetuation of the company. Therefore, it is necessary immediately find the cause to then be able to take strategic steps to overcome them. Then, as researchers, we interested to examine more deeply, the losses that occur. With a deeper review will probably provide benefits, to the local enterprises and other BUMD in general. As for what we will examine is analyze the financial statements from various aspects, both liquidity, solvency, profitability and activity aspects, after which we will examine SWOT analysis, to see weaknesses, strengths, opportunities and strategies. This SWOT analysis will illustrate the situation at hand, and not a magical
Transcript of FINANCIAL PERFORMANCE AND SWOT …ijbel.com/wp-content/uploads/2017/09/ACC-95.pdfFINANCIAL...

International Journal of Business, Economics and Law, Vol. 13, Issue 1 (August) ISSN 2289-1552 2017
1
FINANCIAL PERFORMANCE AND SWOT ANALYSIS TO INCREASE PROFITABILITY IN REGIONAL OWNED ENTERPRISE (BUMD) BEKASI CITY, INDONESIA
Hanifah
Hery Syaerul Homan
ABSTRACT Regional Owned Enterprises (ROE/BUMD) is a regional company that generally companies do not conduct business activities and only supervise the company - a subsidiary company owned. So the forward pullback of BUMD will depend on the advance of the retreat of these partners in general. BUMD mission there are two that must serve the social community but on the other hand must increase the profit so as to contribute to PAD. So rarely do BUMDs that perform optimally. In this case the researcher is interested to study more about the performance of BUMD and give input through the analysis of financial ratios and SWOT (Strengths, Weakness, Opportunities, and Threats) analysis, so as to increase profit. The purpose of this research is to know financial performance in liquidity, solvency, profitability and activity aspect and SWOT analysis. So, the object under study is the financial performance including the ratio of liquidity, solvency, profitability, effectiveness and SWOT analysis related to strength, weakness, opportunities, and threats. The subject in this research is PT. Mitra Patriot in Bekasi city consisting of PT. Patriot Jaya Bekasi its business is engaged in the field as a producer of organic fertilizer, PT. Synergy Patriot Bekasi is engaged in managing household gas channel and sales of commercial gas and PT. Menara Patriot Engaged in the management of licensing and construction in the field of telecommunications. The results showed that the ratios of liquidity, solvency, profitability, and activity of PT. Synergy Patriot and PT. Menara Patriot are in poor condition when compared to the ratio of the average of similar industries. This requires both companies to plan strategies based on SWOT analysis. Keywods : Financial performance, SWOT Analysis (Strengths, Weakness, Opportunities, and Threats) and earnings.
Introduction State-owned enterprises managed by local governments are called regional enterprises (BUMD). BUMD is a company established by local government whose capital is mostly or entirely owned by local government. The purpose of establishing a local company for the development and development of economic potential in the area concerned. Thus, BUMD must optimize its management in order to truly become a reliable economic power so that it can play an active role, both in carrying out its functions and duties as well as the strength of its regional economy. Viewed from the purpose BUMD is expected to contribute enormously to the Original Revenue. To achieve these objectives, BUMDs are sustained by regulations or the existence of substantial regional autonomy provides consequences for the role of Regional Owned Enterprises (BUMD) in sustaining PAD. In addition, there should be efforts to optimize in improving professionalization in terms of management, human resources and facilities and adequate infrastructure so that it has a position parallel to the strength of other economic sectors. BUMDs actually have two sufficient dilemmas from the business side, namely as a regional company that must serve the public interest in the field of services and business, but on the other hand has a target to increase the local revenue. Both of these goals are actually difficult to be realized optimally, because it has a difference. But because the demands of the local government, inevitably have to run so rarely BUMDs whose performance is maximal or good, although it has been given opportunities with some favorable rules. In carrying out its business BUMD can establish cooperative relationships with other parties (business partners) of the same type, and conduct equity participation in other business entities. With the principle of mutual benefit in accordance with applicable provisions. The Company does not conduct business activities and only supervises the subsidiaries owned. So the performance of these partners combined or consolidated the results with BUMD, in the sense that the subsidiary company is merged with the parent company. So going back and forth BUMD will depend on the withdrawal of the partners in general. This condition occurs as in the Bekasi City, where the BUMD almost collapsed due to the efforts of partners who engaged for 3 (three) consecutive years to lose. In the year 2013 suffered losses of Rp 1,810,818,601, the year 2014 loss of Rp 599,862,483 and in 2015 suffered losses Rp 1.931.178.302 More clearly can be seen in Table 1.1 below. Based on table 1, indicates that the regional companies in Bekasi City suffered considerable losses when compared with the revenue it receives. Conditions like this cannot be allowed, because it will have an impact on the perpetuation of the company. Therefore, it is necessary immediately find the cause to then be able to take strategic steps to overcome them. Then, as researchers, we interested to examine more deeply, the losses that occur. With a deeper review will probably provide benefits, to the local enterprises and other BUMD in general. As for what we will examine is analyze the financial statements from various aspects, both liquidity, solvency, profitability and activity aspects, after which we will examine SWOT analysis, to see weaknesses, strengths, opportunities and strategies. This SWOT analysis will illustrate the situation at hand, and not a magical

International Journal of Business, Economics and Law, Vol. 13, Issue 1 (August) ISSN 2289-1552 2017
2
analysis tool capable of providing an outlet for every problem at hand. But by analyzing it will open, how BUMD can maintain or advance its performance in the future. Based on this background, the authors are interested to examine with the title "Analysis Of Financial Performance And SWOT (Strengths,Weakness, Opportunities, Threats) In Order To Increase Profit in Regional Owned Enterprise (BUMD) In Bekasi City”.
Table 1: Statement of Profit and Loss of Regional Company in Bekasi City Period 2013 to 2015
Information 2013 2014 2015
Income 555.813.868 6.067.690.144 148.022.940 Cost of goods sold 157.500.000 4.303.518.117 892.918.991 Gross profit (loss) 398.313.868 1.764.171.997 596.103.949 General/administrative expenses 1.680.279.648 2.011.660.587 2.349.2115.724 Profit and loss (1.680.279.648) 2.011.660.587 2.349.215.724 Other income and expenses (527.11.142) (134.264.143) (172.755.280) Deposit at parent company 40.000.000 Profit and loss before tax (1.809.156.922) (421.752.733) (1.925.867.055) Estimated income tax (1.661.679) (178.109.750) (5.311.247) Profit and loss after tax (1.810.818.601) (599.862.483) (1.931.178.302)
Source: Financial statement data of audit result is processed The study was conducted on one of the BUMDs in the city of Bekasi, because the city of bekasi is an indrustri city, which is quite a lot of its regional companies. The BUMD partners to be studied are PT. Mitra Patriot which has 3 partners namely PT. Patriot Jaya Bekasi, PT, Synergi Patriot Bekasi and PT Menara Patriot. These three partners are engaged in a very potential business The purpose of this study is 1) to know the financial performance in the aspects of liquidity, solvability, profitability and activity at PT. Mitra Patriot in the Bekasi city; 2) to know SWOT analysis (Strengths, Weakness, Opportunities, and Threats at PT. Mitra Patriot in Bekasi city 3) giving input and suggestion and strategy based on financial performance analysis result in liquidity aspect, solvability, profitability and activity and analysis SWOT (Strenghts, Weakness, Opportunities, and Threats that can increase earnings in PT. Mitra Patriot in the Bekasi city. LITERATUR REVIEW Regional owned enterprises (BUMD) BUMD cannot be separated from the development of policies related to State Owned Enterprises (SOEs). In the beginning, SOEs are state enterprises either in the form of bodies based on civil law as well as those in the form of legal entities under public law, among others those based on the Indonesian Companies Act of 1927 No. 419 and state-owned enterprises established under the Law of Indonesia (Year 1925 Number 448). BUMDs in the city of Bekasi have quite a lot of partners. The city of Bekasi includes an industrial city that buffers the city of Jakarta (the capital of Indonesia). According to Efendi (2014), the Mayor of Bekasi, the excess of Bekasi city compared with other cities is a strategic location that connects a number of economic centers, has upper-middle class property, international education facilities and continues to attract investment, for example, General Motors was investing US $ 150 million. Financial Performance Analysis Performance by Mulyadi (2010) is the periodic determination of operational effectiveness of an organization, organization and its employees based on predetermined targets, standards and criteria. Organizations are essentially run by humans so performance appraisal is an assessment of human behavior in carrying out the role they play in the organization. Pabundu (2008) discloses that performance as a result of the work function or activity of a person or group in an organization that is influenced by various factors to achieve organizational goals within the given time period. Armstrong and Baron quoted by Wibowo (2008) define the performance of the company is the work or work achievement, which has a broader meaning not only declare as the work but also how the work process takes place. Financial performance analysis is a tool used to assess the extent to which the company can achieve the expected goal by looking at various aspects, including aspects of liquidity, solvency, profitability and activity (Subramanyam, 2013). Liquidity ratio is a ratio that describes the ability of companies to meet short-term obligations means how much the company's ability in paying debts - short-term obligations (maturities) maturity used to measure how liquid a company. The liquidity ratio is Current ratio, Cash ratio, Quick ratio and Working Capital to total asset ratio (Subramanyam, 2013). According to Subramanyam (2013), solvability ratio is the ratio used to measure the extent to which company assets are financed with debt. This means how much debt burden borne by the company compared with its assets. The solvability ratio is debt to assets ratio, debt to equity ratio, long term debt to equity ratio and tangible assets debt coverage ratio. Profitability ratios are used to assess a company's ability to make a profit. This ratio also gives a measure of the level of management effectiveness of a company. This is shown by the profits generated from sales and investment income. In essence, this ratio shows the efficiency of

International Journal of Business, Economics and Law, Vol. 13, Issue 1 (August) ISSN 2289-1552 2017
3
the company. The profitability ratio is gross profit margin, operating profit margin, net profit margin, earnings power of investment return on assets and return on equity. Activity ratio is used to measure the effectiveness of companies in using their assets, including to measure the level of efficiency of companies in utilizing existing resources. This ratio is also used to assess the company's ability to carry out daily activities. Included in the activity ratio are total assets turnover, working capital turnover, fixed assets turnover, inventory turnover, cash turn over and receivable turn over. Strengths, Weakness, Opportunities, and Threats (SWOT) Here is an explanation of SWOT analysis according to David (2016) is as follows:
1. Strenghts Strengths are resources, skills or other advantages related to the company's competitors and market needs that can be served by the company that is expected to be served. Strength is a special competition that provides a competitive advantage for companies in the market.
2. Weakness Weaknesses are limitations or deficiencies in resources, skills and capabilities that effectively hamper the company's performance. Such limitations may include facilities, financial resources, management skills and marketing skills can be the source of a company's weaknesses.
3. Opportunities Opportunities are important situations that are profitable in the corporate environment. Important trends are one source of opportunity, such as technological change and increased relationships between the company and the buyer or supplier is an overview of the opportunities for the company.
4. Threats Threats are important situations that are not profitable in the corporate environment. Threats are a major disruption to the present or desired position of the company. The existence of new or revised government regulations may pose a threat to the company's success.
Rowe (2014) explained that the benefits of financial performance analysis one of which can increase corporate profits, can increase the value (valuation) company and reduce the risk that may be done by the board with decisions that benefit themselves. Sangkarjo and Kleinsteuber (2002:8), suggested that SWOT analysis can determine realistic business objectives, in accordance with the conditions of the company and therefore expected to be more easily achieved. Further, Rangkuti (2008:19) suggests that SWOT analysis compares the external factors of opportunities and threats with internal strengths and weaknesses. Opportunities, threats, strengths and weaknesses can provide inspiration in increasing profits (Roland, 2011). RESEARCH METHOD This research uses a descriptive method, explaining the characteristics of variables studied in a situation. The subject in this research is PT. Patriot partner which has 3 partners namely PT. Patriot Jaya Bekasi its business is engaged in the field as a producer of organic fertilizer, PT, Sinergi Patriot Bekasi is engaged in managing household gas channel and sales of commercial gas and PT. Menara Patriot is engaged in the management of licensing and construction in telecommunication. DISCUSSION Financial Performance in Aspect of Liquidity, Solvability, Profitability And Activities at PT. Patriot Jaya Bekasi. The company has an unfavorable level of liquidity because the ratio is very high from the industry average for 2015. From the figure 1 in 2015 the current ratio is 10,209%. This is because the company has no debt in 2014 and 2015 has relatively small short-term debt. In addition, most of the assets owned are current assets. For more details, it is shown in Figure 1 below.
Figure 1: The Development Of Liquidity Ratio Of PT. Patriot Jaya
0% 0% 0% 8%
10,209%
1,012% 1,012%8%
0% 2000%4000% 6000% 8000%
10000% 12000%
a.CurrentRasio
b.CashRasio
c.AcidTestRasio
d.WorkingCapitaltoTotalAssets
Rasio
2014
2015

International Journal of Business, Economics and Law, Vol. 13, Issue 1 (August) ISSN 2289-1552 2017
4
According to Figure 2, the tangible assets debt coverage is very high in 2014 and 2015 that are 232% and 180%. The company has a level of solvability is not good because the ratio is above the industry average. This is due to the existence of several components in the statement of financial position such as assets, high liabilities but inversely proportional to low capital. For more details, the following is presented in Figure 2 below.
Figure 2: The Development Of Solvability Ratio Of PT. Patriot Jaya
According to Figure 3, the company has a negative profitability ratio, such as -244% for OPM in 2015 and -18% for ROA. It is means that the company has a very unfavorable level of profitability because the ratio is very low from the industry average. This is because the company in 2014 has no income while 2015 has a low income but the burden of business production costs and general administrative expenses issued very high. For more details, the following is presented in Figure 3 below.
Figure 3:The Development Of Profitability Ratios Of PT. Patriot Jaya
The company has an unfavorable level of activity because the ratio is below the industry average. This is because the company does not have revenues from sales in 2014 and 2015 income from relatively small sales. In addition, assets owned are high. For more details, the following is presented in Figure 4 below.
76% 43% 76%
232%
125%56%
125%180%
0% 50%
100% 150% 200%250%
TotalDebttoEquityRasio
TotalDebttoAssetsRasio
LongTermDebttoEquity
Rasio
TangibleAssetsDebtCoverage
2014
2015
0% 0% 0%
-17% -29%
-199%
-244% -244%
-19% -42%
-300% -250% -200% -150% -100% -50% 0%
GPM OPM NPM ROA ROE2014
2015

International Journal of Business, Economics and Law, Vol. 13, Issue 1 (August) ISSN 2289-1552 2017
5
Figure 4: The development of activity ratio of PT. Patriot Jaya
Financial Performance in Aspect of Liquidity, Solvability, Profitability and Activities at PT. Sinergi Patriot Bekasi. From the level of liquidity described above, the overall company has too high liquidity (over) because the ratio is very high from the industry average. This is because the company has no debt in 2011 and in 2012 - 2015 has relatively small short-term debt. In addition, its current assets are mainly debtors of shareholders and high treasury. For more details, the following is presented in Figure 5 below.
Figure 5: The development of liquidity ratio of PT. Sinergi Patriot Bekasi
. The level of solvency owned by the company is too low (under) because the ratio is very low from the industry average (35%). This is because PT. Sinergi Patriot from 2012 - 2015 have only short-term debt components with relatively low value but the company's assets and equity are high. For more details, the following is presented in Figure 6 below.
0.00 0.00 0.00 0.00 0.000.080.92
0.081.01
9.22
0.000.001.002.003.004.005.006.007.008.009.00
10.00
2014
2015
0%
86,249%90,371%
18,737%925%
0% 20000%
40000% 60000% 80000%
100000%
2011 2012 2013 2014 2015
rasio
liku
idita
s%
CurrentRasio
CashRasio
AcidTestRasio
WorkingCapitaltoTotalAssetsRasio
0% 0.1% 0.1% 0.5%
10%
0% 0.1% 0.1% 0.5%
11%
0%
5%
10%
15%
2011 2012 2013 2014 2015
a.TotalDebttoEquityRasio b.TotalDebttoAssetsRasio
c.LongTermDebttoEquityRasio d.TangibleAssetsDebtCoverage

International Journal of Business, Economics and Law, Vol. 13, Issue 1 (August) ISSN 2289-1552 2017
6
Figure 6 : The development of solvency ratio of PT. Sinergi Patriot Bekasi
From the level of profitability, overall the company has a very bad level of profitability because the ratio is very low from the industry average. This is because the company in 2011 has no income while 2012 - 2015 has income and does not have a burden of production costs of business but general administration expenses are issued very high. For more details, the following is presented in Figure 7 below.
Figure 7: The development of profitability ratio of PT. Sinergi Patriot Bekasi
The company has an unfavorable level of activity because the ratio is below the industry average. This is because the company has a relatively small income. In addition, assets owned are high. For more details, the following is presented in Figure 8 below.
Figure 8 : The development of activity ratio of PT. Sinergi Patriot Bekasi
Financial Performance in Aspect of Liquidity, Solvability, Profitability and Activities at PT. Menara Patriot From the existing liquidity level, overall the company has a bad liquidity level because there is a ratio that is (over) too high from the industry average. This is because PT. Menara Patriot has high account receivables and other receivables. For more details, the following is presented in Figure 9 below
100%
-685% -684%
-46% -46%
-800% -700% -600% -500% -400% -300% -200% -100%
0% 100% 200%
GPM OPM NPM ROA ROE2011
2012
2013
2014
2015
0 0 0 0 0
0.070.07 5.51 0.26 0.09
0.460.44
51.6
1.57 0.67
0.40.41
67.69
0
1.78 0.53
0.730.89
8.52
7.20.9
01020304050607080
TATO WCTO FATO ITO CTO RTO
rasio
aktivita
s%
2011
2012
2013
2014
2015
International Journal of Business, Economics and Law, Vol. 13, Issue 1 (August) ISSN 2289-1552 2017
7
Figure 9 : Development of Liquidity Ratio of PT. Menara Patriot
From the existing level of solvability, overall the company has a poor level of solvency because there is an over-ratio of the industry average and there is also an under-ratio. This happens because the obligations of the company only comes from short-term liability company does not have long-term obligations. For more details is presented below in the figure 10 below:
Figure 10 : The Development Of Solvency Ratio Of PT. Menara Patriot
From the existing level of profitability, overall the company has an unfavorable level of profitability because it is under the condition of the industry average caused by the payment of administrative and general burden is very high. For more details, the following is presented in Figure 11 below.
Figure 10 : The development of profitability ratio of PT. Menara Patriot
From the existing level of activity, the overall company has an unfavorable level of activity because it is in the under condition of the industry average caused by the company's trade receivables is very high. For more details, the following is presented in Figure 12 below.
1892%
148%
1847%
92%318%
59%
318%68%
485%
14%
343%78%
0% 200%400% 600% 800%
1000% 1200%1400% 1600% 1800% 2000%
a.CurrentRasio b.CashRasio c.AcidTestRasio
d.WorkingCapitaltoTotalAssetsRasio
2013
2014
2015
5% 5%0% 0%
45%
31%
0% 0%
25% 20%
0% 0% 0%
10% 20% 30% 40% 50%
TotalDebttoEquityRasio
TotalDebttoAssetsRasio
FixedAssestTurnOver
InventoryTurnOver
2013 2014 2015
25%
-203% -202%
-19% -21%
26% 10% 7% 11% 16%24%
-109% -111% -61% -76%
-300%
-200%
-100%
0%
100%
GPM OPM NPM ROA ROE
rasio
profitab
ilitas%
AxisTitle
2013
2014
2015
International Journal of Business, Economics and Law, Vol. 13, Issue 1 (August) ISSN 2289-1552 2017
8
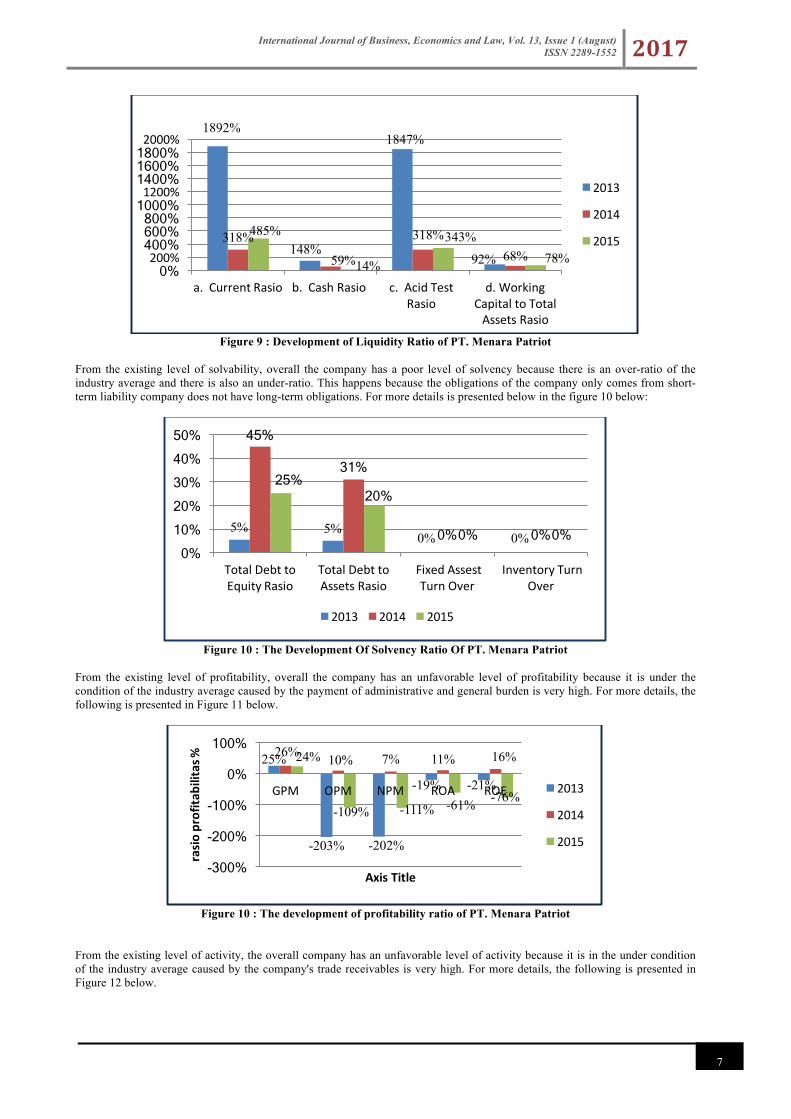
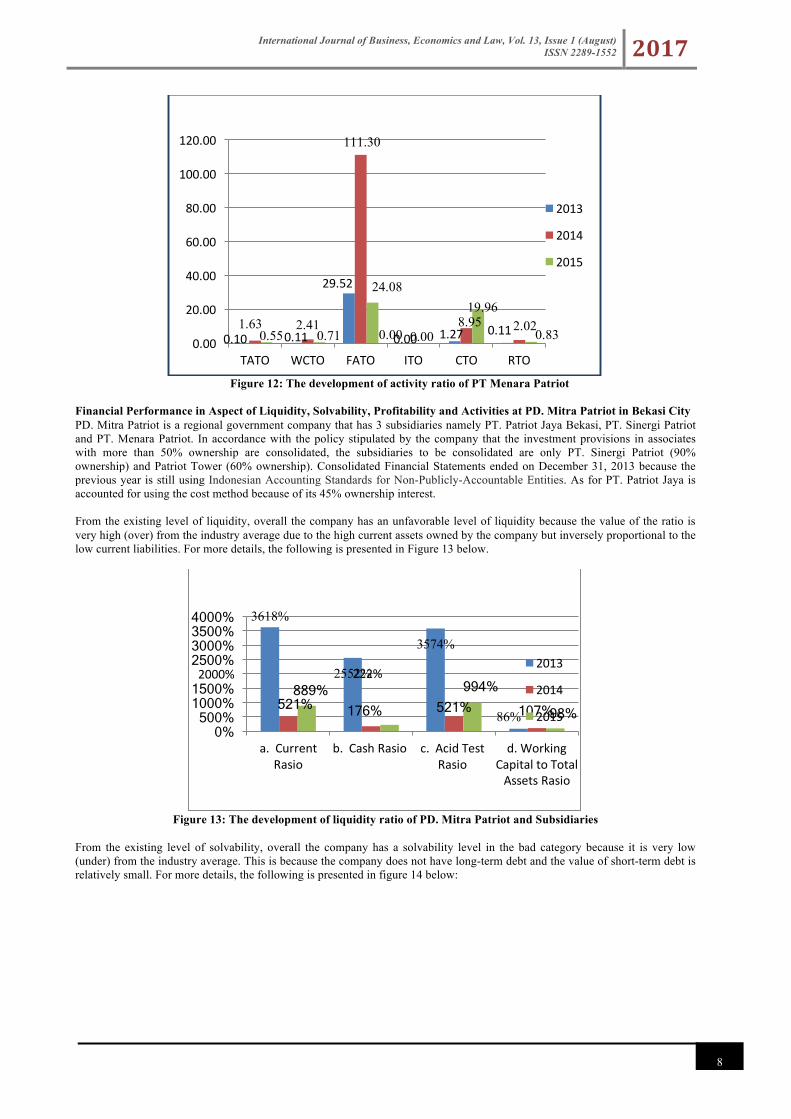
Figure 12: The development of activity ratio of PT Menara Patriot
Financial Performance in Aspect of Liquidity, Solvability, Profitability and Activities at PD. Mitra Patriot in Bekasi City PD. Mitra Patriot is a regional government company that has 3 subsidiaries namely PT. Patriot Jaya Bekasi, PT. Sinergi Patriot and PT. Menara Patriot. In accordance with the policy stipulated by the company that the investment provisions in associates with more than 50% ownership are consolidated, the subsidiaries to be consolidated are only PT. Sinergi Patriot (90% ownership) and Patriot Tower (60% ownership). Consolidated Financial Statements ended on December 31, 2013 because the previous year is still using Indonesian Accounting Standards for Non-Publicly-Accountable Entities. As for PT. Patriot Jaya is accounted for using the cost method because of its 45% ownership interest. From the existing level of liquidity, overall the company has an unfavorable level of liquidity because the value of the ratio is very high (over) from the industry average due to the high current assets owned by the company but inversely proportional to the low current liabilities. For more details, the following is presented in Figure 13 below.
Figure 13: The development of liquidity ratio of PD. Mitra Patriot and Subsidiaries
From the existing level of solvability, overall the company has a solvability level in the bad category because it is very low (under) from the industry average. This is because the company does not have long-term debt and the value of short-term debt is relatively small. For more details, the following is presented in figure 14 below:
0.10 0.11
29.52
0.00 1.27 0.111.63 2.41
111.30
0.008.95 2.02
0.55 0.71
24.08
0.00
19.96
0.830.00
20.00
40.00
60.00
80.00
100.00
120.00
TATO WCTO FATO ITO CTO RTO
2013
2014
2015
3618%
2552%
3574%
86%521% 176% 521% 107%
889% 222%
994%
98% 0%
500% 1000% 1500% 2000%2500% 3000% 3500% 4000%
a.CurrentRasio
b.CashRasio c.AcidTestRasio
d.WorkingCapitaltoTotalAssetsRasio
2013
2014
2015

International Journal of Business, Economics and Law, Vol. 13, Issue 1 (August) ISSN 2289-1552 2017
9
Figure 14: The Development Of Solvability Ratio Of PD. Mitra Patriot
From the existing level of profitability, overall the company has an unfavorable level of profitability due to the very low ratio (under) of the industry average due to operating expenses or very high operating expenses. For more details, the following is presented in Figure 15 below.
Figure 15: The development of profitability ratio of PD. Mitra Patriot and Subsidiaries
From the existing level of activity, the overall company has an unfavorable level of activity because there is an over-ratio of the industry average and there is also an under-ratio. This happens because the liabilities of the company only come from high accounts receivable. For more details, the following is presented in Figure 16 below:
2% 2%
21%
17%
11% 10%
0% 0% 0%
5%
10%
15%
20%
25%
a.TotalDebttoEquityRasio
b.TotalDebttoAssetsRasio
c.LongTermDebttoEquity
Rasio
d.TangibleAssetsDebtCoverage
2013
2014
2015
72%
-231%
-326%
-36% -37%
29%
-4%
-99%
-9% -11%
40%
-118% -130%
-45% -50%
-350% -300% -250% -200% -150% -100% -50% 0%
50% 100%
GPM OPM NPM ROA ROE2013
2014
2015

International Journal of Business, Economics and Law, Vol. 13, Issue 1 (August) ISSN 2289-1552 2017
10
Figure 16: Trends in activity ratio of PD Mitra Patriot and Subsidiaries
SWOT Analysis (Strengths, Weakness, Opportunities, and Threats) at PT. Mitra Patriot in Bekasi City External Environment Government action affects the business strategy environment, because through various regulations it can increase business opportunities and challenges.
a. The development of Jabodetabek (Jakarta, Bogor, Depok, Tangerang and Bekasi) area Bekasi city is part of jabodetabek area, as the region is experiencing a very rapid development. Bekasi City has the main drivers of the economy in the sectors: 1) agriculture, 2) industry, 3) electricity, gas and drinking water and 4) trade, hotel and restaurant.
b. Local Government has a commitment to participate in developing regional business one of partnership partnership. • PT. Patriot Jaya Bekasi is the result of cooperation Regional Company (PD) Mitra Patriot with PT. Simpang
Jaya two Subang which aims to assist the government in the effort to fulfill the need of conversion of organic fertilizer to organic nationally through utilizing organic waste in Bekasi City.
• PT. Sinergi Patriot has cooperated in the operation of 4,628 household gas connection with PT. Jabar Energi In addition, the company has also cooperated with the operation, besides it also applies the management of gas well Jatinegara together with PT. Pasundan Resources. The establishment of this company aims to assist the government in the management of household gas located in Rawalumbu housing Bekasi Municipality and gas distribution and gas sales of Jatinegara well in Bekasi City. PT.Menara Patriot in form through cooperation with PT. PPP and PT. Padi Mekatel. Aims to improve the existence of companies that function as implementers, managers, and drivers of telecommunications business.
c. Local government capital participation The authorized capital of the Regional Company (PD) Mitra Patriot is Rp 20,000,000,000.00 (twenty billion rupiahs) of this capital consists of separated regional assets, capital assistance from the central government, provincial government, other legal entities or institutions and grants from parties Legal and not binding.
d. Regional Autonomy (Law Number 32 Year 2004) Article 10 of Law Number 32 Year 2004, paragraph 1, explains that the government shall administer the governmental affairs under its jurisdiction, unless the government affairs of the law are determined to be government affairs, then article 2 explains that in administering governmental affairs, which constitutes regional authority as paragraph 1, the regional government shall exercise the widest possible autonomy The extension to govern and manage their own governance based on autonomy and assistance tasks. The law is the legal basis as well as the opportunity to create creativity and innovation in the management of regional development to carry out leverage (acceleration) development of the region of Bekasi City.
e. National Economic Policy Monetary and fiscal policies affect the national economy and the region. Such policies, whether directly or indirectly, such as interest rates, exchange rates, exports, tariffs, taxes, subsidies etc., have an effect on economic growth as well as on inflationary factors.
Internal Environment Before a strategic planning is developed there needs to be an analysis of the relationship between management functions by studying corporate structure, corporate culture and corporate resources. a. Organizational structure
0.11 0.144.12 0.47 0.19
0.95 1.30
64.27
1.58 3.110.35 0.44
12.43
0.00 0.63 1.570.0010.0020.0030.0040.0050.0060.0070.00
dalamkaliputaran
2013
2014
2015

International Journal of Business, Economics and Law, Vol. 13, Issue 1 (August) ISSN 2289-1552 2017
11
Board of Trustees 1. H. Abdul Manan (Chairman) 2. Drs. H. Eddy Dadyo, M.Si. (Secretary) 3. Drs. Hasan Lizami, S.Ak. (Member) 4. H. Prayitno Salim (Member) 5. Drs. H. Agustian, M.Si. (Member)
Director 1. Drs. H. Abdul Hadie, MM. (President Director)
b. Corporate Values
1. Commitment, hold firmly everything that has been established. 2. Trust, Good intent always precedes every step made. 3. Cooperation, in an effort to achieve goals and objectives implemented together, harmonious, dynamic and
synergistic. 4. Openness, always receive suggestions and criticism in order to improve the performance of local companies. 5. Responsibility, always try to optimally perform the duties and functions of the Regional Company.
c. Corporate Workflow 1. The patriot partner regional company is a regional company that is engaged in the service of urban public
facilities and its management. 2. The partner company of the patriot partner is headed by a President Director who is responsible to the Mayor
through the Board of Trustees. 3. The Regional Company (PD) Mitra Patriot in performing its duties is under the administrative coordination of the
Regional Secretary.
d. Fixed assets owned by PT. Patriot Jaya Bekasi is high. e. Consolidated financial statement between PD. Mitra Patriot and subsidiaries analyzed show that the liquidity ratio is
too high (over) from the industry average, while the solvency and profitability ratios are very low (under) from the industry average.
Table 2: SWOT Analysis PD. Mitra Patriot Partners and Subsidiaries
Strengths • High fixed assets. • Liquidity and activity ratios that are too high (over) • The scope of many business activities • Strategic business location
Weaknesses • High operating costs • Corporate Culture • Human Resource Development
Opportunities • The government's commitment to make BUMDs a
source of PAD. • Broad market opportunities • Open a new business type • Government policy • The Spirit of Regional Autonomy
Threats • Government interference in corporate management • The emergence of new technology • The entry of new competitors • Negative image of government companies
CONCLUSION Liquidity of PT. Sinergi Patriot and PT. Menara Patriot are in bad condition because it is too high (over) from the industry average. This is because the company has a relatively small short-term debt while the components of trade receivables are quite high. This results in a poor liquidation ratio of the parent (PD. Mitra Patriot) as well as the very high ratio of the industry's average caused by current assets owned by a high company sourced from components of receivables, other receivables and High cash but inversely proportional to low current liabilities. Solvability Ratio of PT. Patriot synergy and Patriot Tower are in bad condition because too low (under) of industry average caused by firms only have relatively low short term obligation. This resulted in a solvency ratio owned by the parent (PD Mitra Patriot) which is in a bad category because it is very under the industry average, because the company does not have long-term debt and the value of short-term debt is relatively small . Profitability ratios of PT. Sinergi Patriot and PT. Menara Patriot are in bad condition because it is very low (under) from industry average caused by PT. Sinergi Patriot has no income while the administrative and general expenses incurred by the two subsidiaries are very high. Ratio of profitability owned by PD. Mitra Patriot are in bad shape due to the very low ratio (under) of the industry average due to operating expenses or very high operating expenses.

International Journal of Business, Economics and Law, Vol. 13, Issue 1 (August) ISSN 2289-1552 2017
12
PT. Sinergi Patriot and PT. Menara Patriot are in bad condition because they are under the industry average due to the relatively small revenue of the company while the assets (trade receivables) are very high. So the ratio of activity PD. Mitra Patriot are also in bad shape because there is an over-ratio of the industry average and there is also an under-ratio. This happens because the liabilities of the company only comes from high accounts receivable. SO (strengths, opportunities) Strategy that is Expanding the distribution network; Maximizing Assets owned; Improving the quality of human resources through education and training programs and Adding new partners or business networks. WO (weaknesses, opportunities) Strategy that is Conducting efficiency in operational area; Improving employee professionalism by providing a clear reward and punishment system. ST (strengths, threats) Strategy that is Improve the quality of performance so that the image in the community to be good; Improving product quality and Preparation of a good business plan. WT (weaknesses, threats) strategy of improving corporate culture; Conducting training related to Regional Owned Enterprises BUMD business and Utilizing technology to tie the value of the company. RECOMMENDATION Based on the results of research and conclusion, recommended some things that can be useful as a consideration to improve the company's financial performance in the future.
1. PD. Mitra Patriot and entities are recommended to improve the payment of customer debt so that the receivables owned by the company become small. The company must to maximize the sales volume and evaluate the expenses incurred by the company and to manage the assets properly so that the solvency ratio of the company is in good condition.
2. PD. Mitra Patriot and entities should pay attention to the following a. Strengths
Companies must maintain the quality of products and services to consumers so that consumers. b. Weaknesses
The company focuses more on managing operating costs and improving the quality of human resources. c. Opportunities
Companies must be good at taking the opportunity or opportunity of choosing the best strategy that can be applied by the company by using the strengths owned by PD. Mitra Patriot, as well as take advantage of long-term opportunities
d. Threats The company should further improve the quality in order to to compete with the new company.
REFERENCES Brigham, E.F. and Houston, J.F. (2010). Dasar – Dasar Manajemen Keuangan (Fundamentals of Financial Management). Edisi
5 Buku 1. Jakarta: Salemba Empat, hlm 1- 432. David, F. R., (2006). Manajemen Strategis (Strategic Management). Edisi Sepuluh (tenth edition), Penerbit Salemba Empat,
Jakarta. Efendi, R. (2014). “Kota Bekasi Memiliki Tujuh Fakta Kelebihan yang Menarik”. Independent News. Retrieve :
http://www.indepnews.com/2014/10/kota-bekasi-memiliki-tujuh-fakta.html (August, 4, 2017) Fajarini, I. and Firmansyah, R. (2012). “Pengaruh Intellectual Capital Terhadap Kinerja Keuangan perusahaan (Studi Empiris
Perusahaan Lq 45)” Jurnal Dinamika Akuntansi (The Influence of Intellectual Capital on Corporate Financial Performance (Empirical Study of Company Lq 45) "Journal of Dinamika Akuntansi), Vol 4, No.1.
Hanafi, M. dan Halim, A. (2014) Analisis Laporan Keuangan (Financial Statement Analysis). Edisi 4. Yogyakarta: UPP STIM YKPN. hlm 1 – 214.
Jogiyanto, 2005, Sistem Informasi Strategik untuk Keunggulan Kompetitif (Strategic Information System for Competitive Advantage), Penerbit Andi Offset, Yogyakarta.
Kasmir, 2015. Analisis Laporan Kuangan (Financial Statement Analysis), Penerbit Rajawali Pers, Jakarta. Klammer, T.P. and S. A. Reed.2000 “Operating Cash Flow Formats: Does Format Influence Decision?” journal of Accounting
and Public Policy. Kothari, S.; dan J. Zimmerman. 2012 “Price and Return Models.” Journal of Accounting and Economics 20,. Kross, W.; and D. Schroeder. (1989). “Firm Prominence and the Differentian Infomation Content of Quarterly Earning
Announcements.” Journal of Business, Finance and Accounting, musim semi 1989, hlm 55-74. Mulyadi. (2010), Sistem Akuntans (Accounting System)i. Edisi 3. Jakarta: Salemba Empat. Orniati, Y. (2009).” Laporan Keuangan Sebagai Alat untuk Menilai Kinerja Keuangan” Jurnal Ekonomi Bisnis (Financial
Statement as a Tool for Assessing Financial Performance "Journal of Business Economics), No.3.

International Journal of Business, Economics and Law, Vol. 13, Issue 1 (August) ISSN 2289-1552 2017
13
Pandu, P.. (2003). Studi Banding Kebijakan Privatisasi BUMN di Beberapa Negara,Jurnal Kajian Ekonomi dan Keuangan (Comparative Study on Privatization Policy of SOEs in Several Countries, Journal of Economic and Financial Studies,), Vol.7, No.4
Pabundu. (2008). Budaya Organisasi dan Peningkatan Kinerja Perusahaan (Organizational Culture and Corporate Performance Improvement), Penerbit Bumi Aksara
Porter, M. E. (1993). Competiton Advantages: creatng and Sustaining Superior Performance.New York: The FreePress. Porter, M. E. (1993). Keunggulan Bersaing Menciptakan dan Mempertahankan Kinerja unggul, Jakarta: Erlangga. Rangkuti, F. (2006). Analisis SWOT Teknik Pembedah Kasus Bisnis: Reorientasi Konsep Perencanaan Stategis untuk
Menghadapi Abad 21, Edisi Keempat belas, Jakarta: PT. Gramedia Pustaka Utama Rangkuti, F. (2014). Manajemen Persediaan: Aplikasi di hidang bisnis,Edisi kedua, Jakarta: PT Rajawali Roger, Kerin, Mahay an. (2003). Stategic Marker Planning, Allyn and Bacon. Simon and Schuster, Inc. Roland, C. (2011). Policy Formulating and Admistration, Homewood Richard D.Irwin. Rowe R. M. and Dickel. (2014), Strategic Management and Business Policy: A Medhodological Approach, Reading
Massachusetts: Addison-Wesley Publishing Co.Inc Sekaran, U. (2006). Research Methods For Business, John Wiley & Sons,Inc New York. Sugiono. (2013)Metodolog Penelitian manajemen bisnis Subramanyam, K.R dan Wild, JJ. Harsey (2010), Analisis Laporan Keuangan (Financial Statement Analysis). Edisi 10. Jakarta:
Salemba Empat. Ujiyanto, M. A. and Pramuka, B.A. (2007). “Mekanisme Corporate Governance, Manajemen Laba dan Kinerja Keuangan (
Studi pada Perusahaan go Publik Sektor Manufaktur )”. Simposium Nasional Akuntansi.( Corporate Governance Mechanism, Profit Management and Financial Performance (Study on Company go Public Manufacturing Sector)". National Symposium on Accountin)
Undang – undang nomor 448 tahun 1925 tentang Perbendaharaan Indonesia. (Law number 448 of 1925 on the Indonesian Treasury)
Thoyib, A. (2005).”Hubungan Kepemimpinan, Budaya, Strategi, dan Kinerja: Pendekatan Konsep” Jurnal Manajemen dan Kewirausahaan,( "Relationship of Leadership, Culture, Strategy, and Performance: Concept Approach" Journal of Management and Entrepreneurship) Vol. 7, No.1.
Hanifah Sekolah Tinggi Ilmu Ekonomi Ekuitas, Bandung, Indonesia Email: [email protected] Hery Syaerul Homan Sekolah Tinggi Ilmu Ekonomi Ekuitas, Bandung, Indonesia Email: [email protected]