Financial Overview - Wells Fargo · PDF file- Government and agency mortgage-backed securities...
45
Financial Overview John Shrewsberry Chief Financial Officer May 11, 2017 © 2017 Wells Fargo & Company. All rights reserved. Confidential.
Transcript of Financial Overview - Wells Fargo · PDF file- Government and agency mortgage-backed securities...
Financial Overview
John Shrewsberry Chief Financial Officer
May 11, 2017
© 2017 Wells Fargo & Company. All rights reserved. Confidential.

5-year track record of strong and steady results
18,897
21,878 23,057 22,894
21,938
2012 2013 2014 2015 2016
Wells Fargo Net Income ($ in billions, except EPS)
$3.36 $3.89 $4.10 $4.12 $3.99
Diluted earnings per common share
� Strong results reflect the strength of our diversified business model
- 1Q17 was the 18th consecutive quarter of generating earnings greater than $5 billion
- Industry leading returns with 1Q17 Return on Assets (ROA) and Return on Equity (ROE) of 1.15% and 11.54%, respectively
� Durable long-term advantages: - Diversified and balanced revenue
sources - Industry leading distribution - Leading market share in key financial
products - Large and low-cost deposit base - Relationship focus - Credit risk discipline - Capital strength
Wells Fargo 2017 Investor Day Financial Overview 1

History of steady earnings and low volatility
GAAP Reported Earnings Return on Equity (ROE) vs. Volatility (1)
(1Q12-1Q17, $ in millions)
8,000 18.0%
7,000
6,000
5,000 12.0%
USB
WFC JPM
C BAC
PNC 4,000
3,000
2,000 6.0%
1,000
2016
RO
E
-1Q12 1Q13 1Q14 1Q15 1Q16 1Q17
0.0% (1,000)0% 10% 20% 30% 40% 50% 60% 70%
BAC C JPM WFC
Normalized Standard Deviation of ROE (1)
One of only two companies in the U.S., and the only bank, to earn over $5 billion for 18 consecutive quarters
Source: SNL. (1) Annual results from 2012 through 2016.
Wells Fargo 2017 Investor Day Financial Overview 2
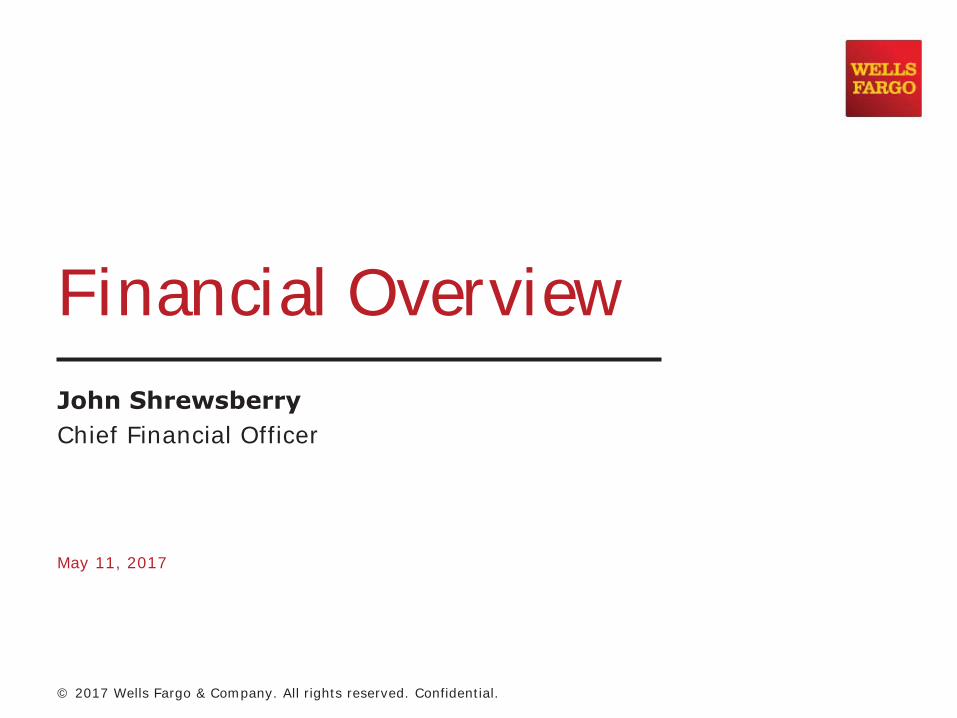
Growth in book value vs. peers
$27.64
$29.48
$32.19
$33.78 $35.18
8%
7%
6% 6%
5% 5%
USB WFC PNC JPM C BAC
Book Value per Common Share (1) Book Value (1) and Declared Dividends per Common Share vs. Peers (4 year CAGR) (2)
2012 2013 2014 2015 2016
� Book value has increased 27% since 2012, a 6% CAGR � Book value + dividends declared per common share has increased 29% since 2012, a 7%
CAGR
(1) Book value per common share is common stockholders' equity divided by common shares outstanding. (2) Source: SNL. 4-year CAGR = 2012-2016.
Wells Fargo 2017 Investor Day Financial Overview 3

Strong performance vs. peers in 2016
13.4% 11.5% 10.2% 8.9%
6.7% 6.6%
USB WFC JPM PNC BAC C ROE ROTCE
2016 Return on Equity (ROE) vs. Peers (Source: SNL)
55.3%
58.3% 59.3%
60.2%
62.5%
65.7%
USB JPM WFC C PNC BAC
2016 Efficiency Ratio (2) vs. Peers (Source: SNL)
13.9%
17.4%
13.0% 11.3%
9.5% 7.6%
(1)
81% 74%
70% 65%
61%
41%
PNC C USB JPM WFC BAC
1.36%
1.16% 1.10% 1.00%
0.82% 0.82%
USB WFC PNC JPM BAC C
2016 Return on Assets (ROA) vs. Peers (Source: SNL)
2016 Net Payout Ratio (3) vs. Peers (Source: SNL)
(1)Tangible common equity is a non-GAAP financial measure and represents total equity less preferred equity, noncontrolling interests, and goodwill and certain identifiable intangible assets (including goodwill and intangible assets associated with certain of our nonmarketable equity investments but excluding mortgage servicing rights), net of applicable deferred taxes. The methodology of determining tangible common equity may differ among companies. Management believes that return on average tangible common equity (ROTCE), which utilizes tangible common equity, is a useful financial measure because it enables investors and others to assess the Company's use of equity. See page 41 for additional information. (2) Efficiency ratio defined as noninterest expense divided by total revenue. (3) Net payout ratio means the ratio of (i) common stock dividends and share repurchases less issuances and stock compensation-related items, divided by (ii) net income applicable to common stock.
Wells Fargo 2017 Investor Day Financial Overview 4

Balance Sheet Positioning
Balance Sheet evolution - Assets
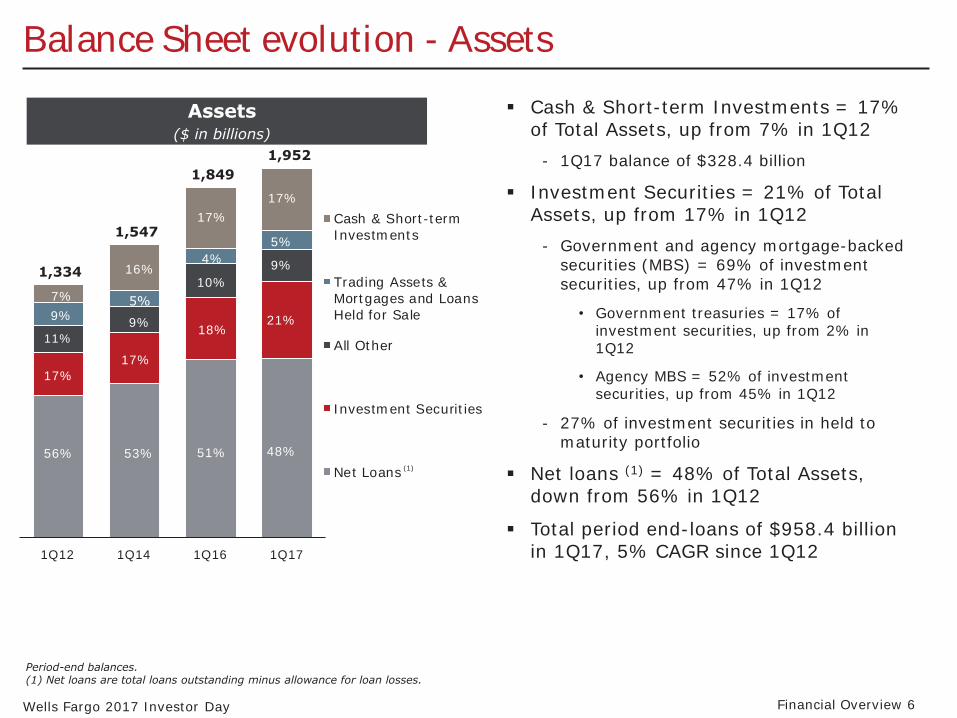
Assets ($ in billions)
1,952
Cash & Short-term Investments
Trading Assets & Mortgages and Loans Held for Sale
All Other
Investment Securities
(1)Net Loans
1,334
1,547
1,849
1Q12 1Q14 1Q16 1Q17
17%
4%
10%
18%
51% 48%
21%
9%
17%
5%
16%
5%
9%
17%
53%
7% 9%
11%
17%
56%
� Cash & Short-term Investments = 17% of Total Assets, up from 7% in 1Q12
- 1Q17 balance of $328.4 billion
� Investment Securities = 21% of Total Assets, up from 17% in 1Q12
- Government and agency mortgage-backed securities (MBS) = 69% of investment securities, up from 47% in 1Q12
• Government treasuries = 17% of investment securities, up from 2% in 1Q12
• Agency MBS = 52% of investment securities, up from 45% in 1Q12
- 27% of investment securities in held to maturity portfolio
� Net loans (1) = 48% of Total Assets, down from 56% in 1Q12
� Total period end-loans of $958.4 billion in 1Q17, 5% CAGR since 1Q12
Period-end balances. (1) Net loans are total loans outstanding minus allowance for loan losses.
Wells Fargo 2017 Investor Day Financial Overview 6
5%
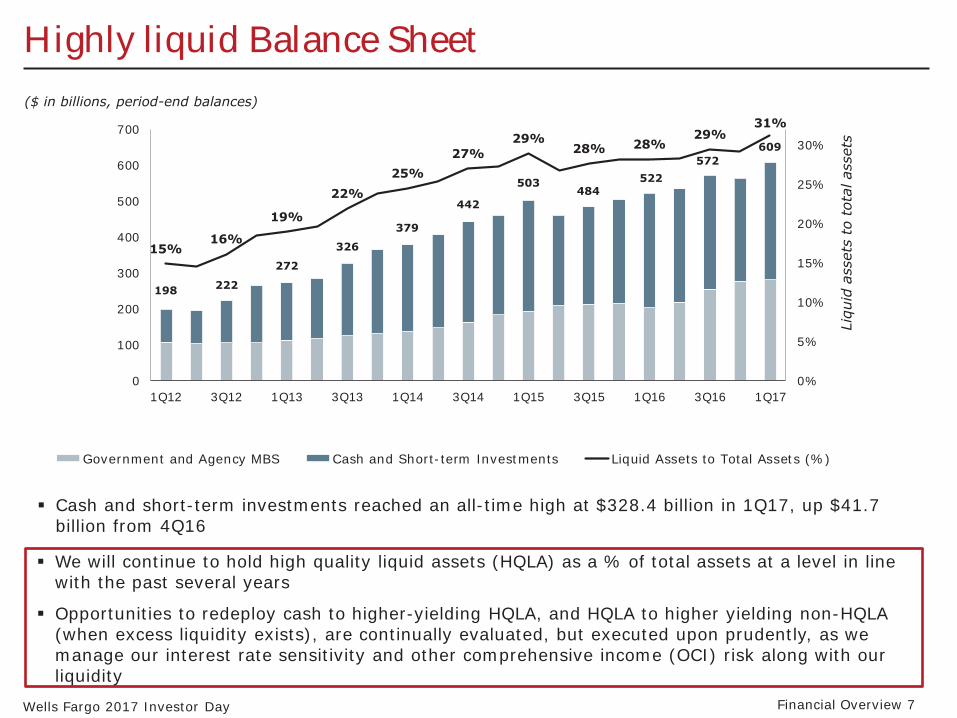
Highly liquid Balance Sheet ($ in billions, period-end balances)
31%
1Q12 3Q12 1Q13 3Q13 1Q14 3Q14 1Q15 3Q15 1Q16 3Q16 1Q17
Government and Agency MBS Cash and Short-term Investments Liquid Assets to Total Assets (%)
� Cash and short-term investments reached an all-time high at $328.4 billion in 1Q17, up $41.7 billion from 4Q16
15% 16%
19%
22% 25%
27% 29%
28% 28% 29%
0%
5%
10%
15%
20%
25%
30%
0
100
200
300
400
500
600
700
Liqu
id a
sset
s to
tot
al a
sset
s
572 522
484503
442
379
326
272
222198
609
� We will continue to hold high quality liquid assets (HQLA) as a % of total assets at a level in line with the past several years
� Opportunities to redeploy cash to higher-yielding HQLA, and HQLA to higher yielding non-HQLA (when excess liquidity exists), are continually evaluated, but executed upon prudently, as we manage our interest rate sensitivity and other comprehensive income (OCI) risk along with our liquidity
Wells Fargo 2017 Investor Day Financial Overview 7
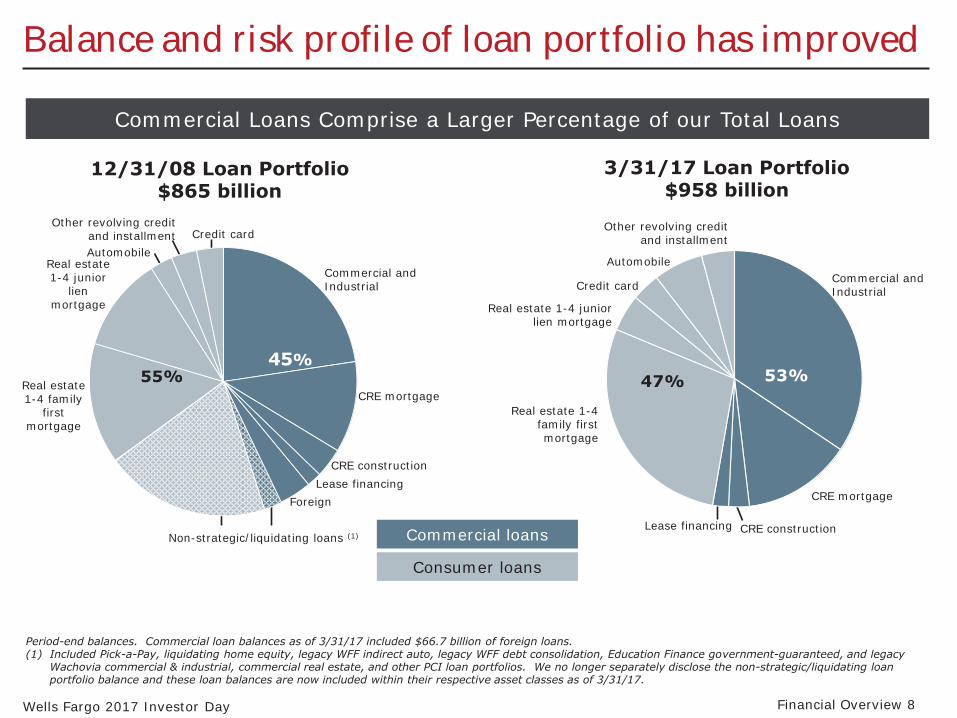
Balance and risk profile of loan portfolio has improved
Commercial Loans Comprise a Larger Percentage of our Total Loans
12/31/08 Loan Portfolio $865 billion
Other revolving credit and installment Credit card Automobile
Real estate Commercial and 1-4 junior Industrial lien
mortgage
Real estate 1-4 family
Foreign
CRE construction
45% 55%
CRE mortgage first
mortgage
Lease financing
Commercial loans
3/31/17 Loan Portfolio $958 billion
Commercial and Industrial
CRE mortgage
Real estate 1-4 family first mortgage
Real estate 1-4 junior lien mortgage
Credit card
Automobile
Other revolving credit and installment
53%47%
Lease financing CRE construction Non-strategic/liquidating loans (1)
Consumer loans
Period-end balances. Commercial loan balances as of 3/31/17 included $66.7 billion of foreign loans. (1) Included Pick-a-Pay, liquidating home equity, legacy WFF indirect auto, legacy WFF debt consolidation, Education Finance government-guaranteed, and legacy
Wachovia commercial & industrial, commercial real estate, and other PCI loan portfolios. We no longer separately disclose the non-strategic/liquidating loan portfolio balance and these loan balances are now included within their respective asset classes as of 3/31/17.
Wells Fargo 2017 Investor Day Financial Overview 8

Strong credit performance
2.0
1.2
0.3
0.6
1.1
0.6
2.4
1.4
0.8 0.7
0.9 0.81.25%
0.72%
0.41% 0.33% 0.38% 0.34%
Provision Expense and Net Charge-offs ($ in billions)
1Q12 1Q13 1Q14 1Q15 1Q16 1Q17
Provision Expense Net Charge-offs Net charge-off rate
� Improvement in credit quality since 1Q12 reflects strength in residential real estate – Provision expense of $605 million in 1Q17, down $1.4 billion from 1Q12, or 70%
– Net charge-offs of $805 million in 1Q17, down $1.6 billion from 1Q12, or 66%
Wells Fargo 2017 Investor Day Financial Overview 9
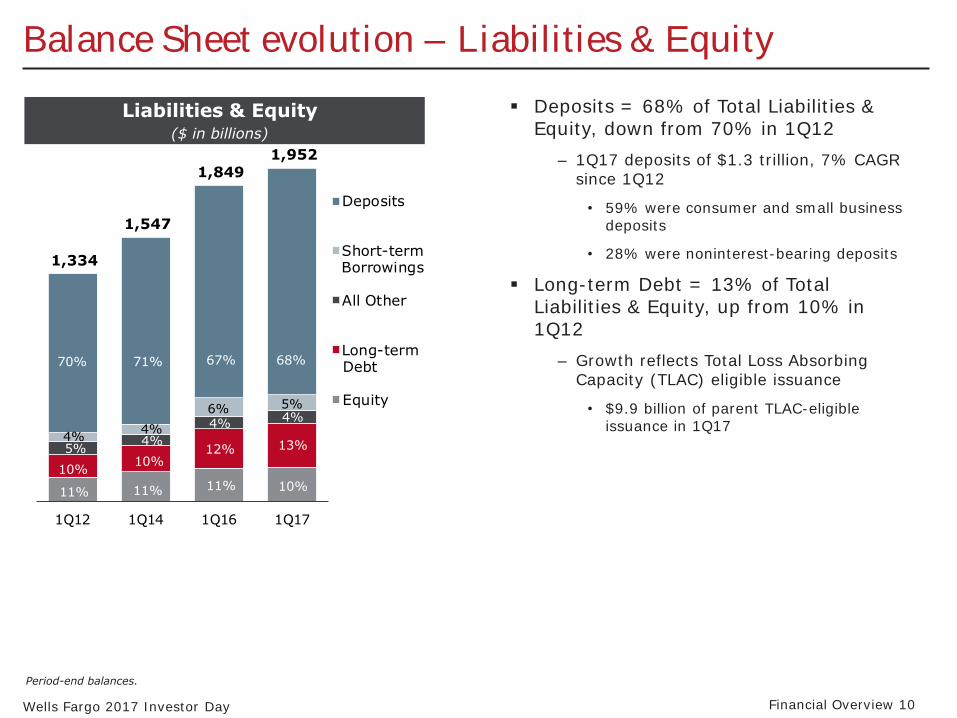
Balance Sheet evolution – Liabilities & Equity
Liabilities & Equity ($ in billions)
� Deposits = 68% of Total Liabilities & Equity, down from 70% in 1Q12
– 1Q17 deposits of $1.3 trillion, 7% CAGR since 1Q12
• 59% were consumer and small business deposits
• 28% were noninterest-bearing deposits
� Long-term Debt = 13% of Total Liabilities & Equity, up from 10% in 1Q12
– Growth reflects Total Loss Absorbing Capacity (TLAC) eligible issuance
• $9.9 billion of parent TLAC-eligible issuance in 1Q17
Period-end balances.
Wells Fargo 2017 Investor Day Financial Overview 10
1,334
1,547
1,849
1,952
1Q12 1Q14 1Q16 1Q17
Deposits
Short-termBorrowings
All Other
Long-termDebt
Equity
70% 71% 67%
4% 4%
6%
5% 4%
4%
10% 10%
12%
11% 11% 11%
68%
5% 4%
13%
10%
TLAC requirement
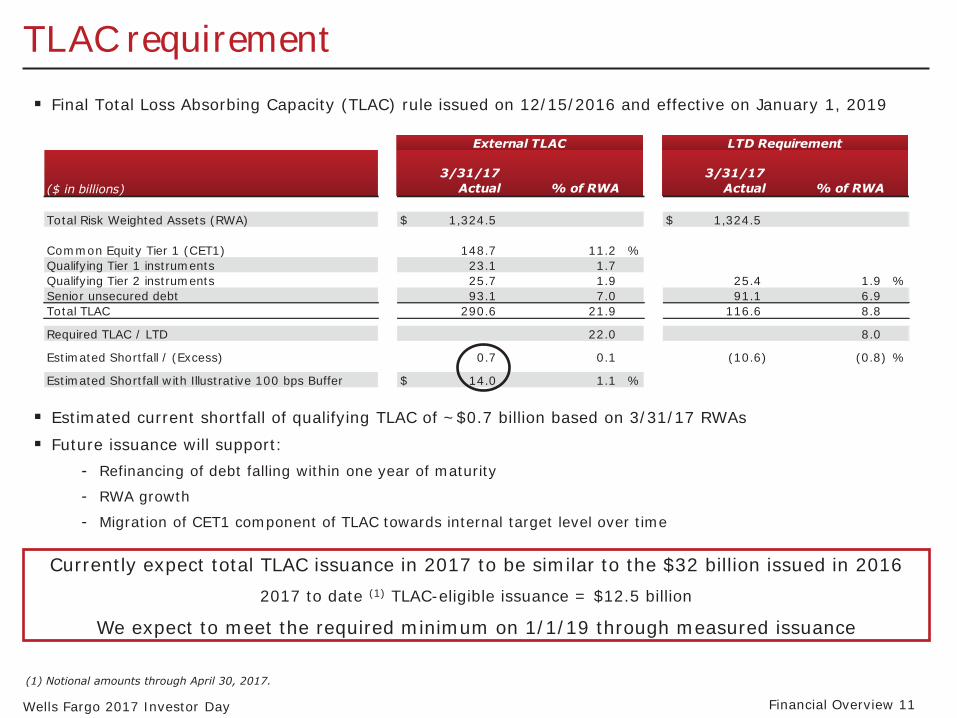
� Final Total Loss Absorbing Capacity (TLAC) rule issued on 12/15/2016 and effective on January 1, 2019
External TLAC LTD Requirement
($ in billions) 3/31/17
Actual % of RWA 3/31/17
Actual % of RWA
Total Risk Weighted Assets (RWA) $ 1,324.5 $ 1,324.5
Common Equity Tier 1 (CET1) 148.7 11.2 % Qualifying Tier 1 instruments 23.1 1.7 Qualifying Tier 2 instruments 25.7 1.9 25.4 1.9 % Senior unsecured debt 93.1 7.0 91.1 6.9 Total TLAC 290.6 21.9 116.6 8.8
Required TLAC / LTD 22.0 8.0
Estimated Shortfall / (Excess) 0.7
14.0
0.1 (10.6) (0.8) %
Estimated Shortfall with Illustrative 100 bps Buffer $ 1.1 %
� Estimated current shortfall of qualifying TLAC of ~$0.7 billion based on 3/31/17 RWAs
� Future issuance will support: - Refinancing of debt falling within one year of maturity
- RWA growth
- Migration of CET1 component of TLAC towards internal target level over time
Currently expect total TLAC issuance in 2017 to be similar to the $32 billion issued in 2016
2017 to date (1) TLAC-eligible issuance = $12.5 billion
We expect to meet the required minimum on 1/1/19 through measured issuance
(1) Notional amounts through April 30, 2017.
Wells Fargo 2017 Investor Day Financial Overview 11

Revenue trends
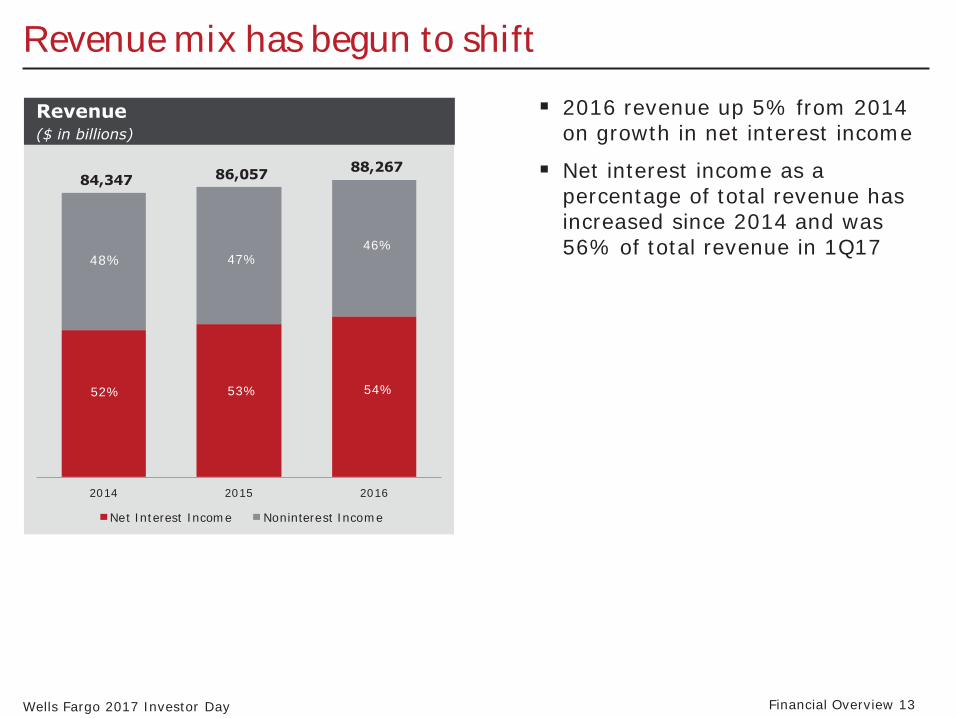
Revenue mix has begun to shift
84,347 86,057 88,267
2014 2015 2016
Net Interest Income Noninterest Income
Revenue ($ in billions)
52% 53% 54%
48% 47% 46%
� 2016 revenue up 5% from 2014 on growth in net interest income
� Net interest income as a percentage of total revenue has increased since 2014 and was 56% of total revenue in 1Q17
Wells Fargo 2017 Investor Day Financial Overview 13

Net interest income growth despite lower NIM
43,527
45,301
47,754
2014 2015 2016 Net Interest Margin (NIM)
Net Interest Income ($ in millions)
3.11% 2.95% 2.86%
� 2016 net interest income up 10% from 2014 despite a 25 bps decrease in the NIM � Net interest income growth
reflected strong earning asset growth
Expect to grow net interest income year-over-year in 2017 by low to mid single percentage points, but results will be influenced by a number of factors including
the absolute level of rates, steepness of yield curve, earning asset growth and mix, and the competitive landscape for loan and deposit pricing
Wells Fargo 2017 Investor Day Financial Overview 14
Asset sensitivity illustration
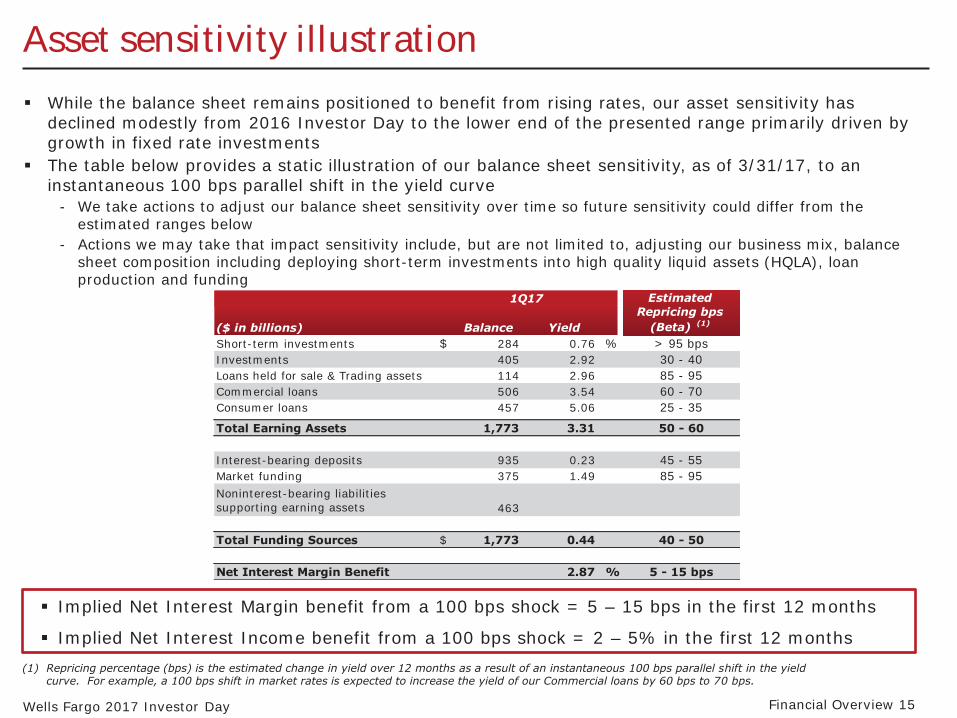
� While the balance sheet remains positioned to benefit from rising rates, our asset sensitivity has declined modestly from 2016 Investor Day to the lower end of the presented range primarily driven by growth in fixed rate investments
� The table below provides a static illustration of our balance sheet sensitivity, as of 3/31/17, to an instantaneous 100 bps parallel shift in the yield curve
- We take actions to adjust our balance sheet sensitivity over time so future sensitivity could differ from the estimated ranges below
- Actions we may take that impact sensitivity include, but are not limited to, adjusting our business mix, balance sheet composition including deploying short-term investments into high quality liquid assets (HQLA), loan production and funding
($ in billions) Balance Yield
Estimated Repricing bps
(Beta) (1)
1Q17
Short-term investments $ 284 0.76 % > 95 bps Investments 405 2.92 30 - 40 Loans held for sale & Trading assets 114 2.96 85 - 95 Commercial loans 506 3.54 60 - 70 Consumer loans 457 5.06 25 - 35
Total Earning Assets 1,773 3.31 50 - 60
Interest-bearing deposits 935 0.23 45 - 55 Market funding 375 1.49 85 - 95 Noninterest-bearing liabilities supporting earning assets 463
Total Funding Sources $ 1,773 0.44 40 - 50
Net Interest Margin Benefit 2.87 % 5 - 15 bps
� Implied Net Interest Margin benefit from a 100 bps shock = 5 – 15 bps in the first 12 months
� Implied Net Interest Income benefit from a 100 bps shock = 2 – 5% in the first 12 months (1) Repricing percentage (bps) is the estimated change in yield over 12 months as a result of an instantaneous 100 bps parallel shift in the yield
curve. For example, a 100 bps shift in market rates is expected to increase the yield of our Commercial loans by 60 bps to 70 bps.
Wells Fargo 2017 Investor Day Financial Overview 15
Diversity of noninterest income has driven stability
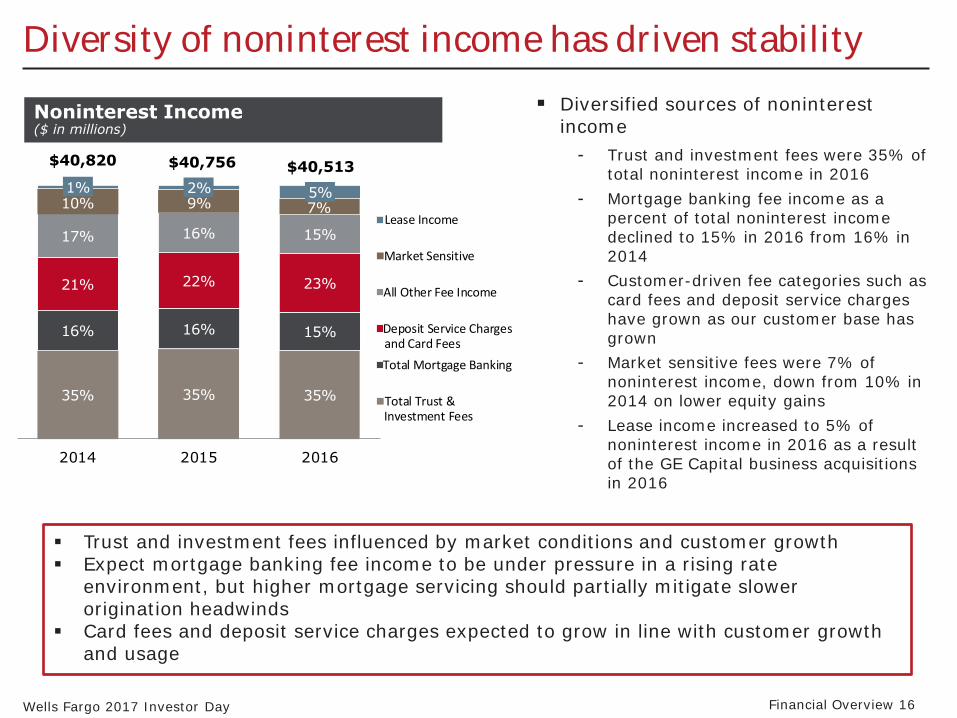
Noninterest Income ($ in millions)
� Diversified sources of noninterest income
- Trust and investment fees were 35% of total noninterest income in 2016
- Mortgage banking fee income as a percent of total noninterest income declined to 15% in 2016 from 16% in 2014
- Customer-driven fee categories such as card fees and deposit service charges have grown as our customer base has grown
- Market sensitive fees were 7% of noninterest income, down from 10% in 2014 on lower equity gains
- Lease income increased to 5% of noninterest income in 2016 as a result of the GE Capital business acquisitions in 2016
� Trust and investment fees influenced by market conditions and customer growth � Expect mortgage banking fee income to be under pressure in a rising rate
environment, but higher mortgage servicing should partially mitigate slower origination headwinds
� Card fees and deposit service charges expected to grow in line with customer growth and usage
Wells Fargo 2017 Investor Day Financial Overview 16
35% 35% 35%
16% 16% 15%
21% 22% 23%
17% 16% 15%
10% 9% 7%
1% 2% 5%
2014 2015 2016
Lease Income
Market Sensitive
All Other Fee Income
Deposit Service Chargesand Card Fees
Total Mortgage Banking
Total Trust &Investment Fees
$40,820 $40,756 $40,513

Expense and Reinvestment
Noninterest expense analysis
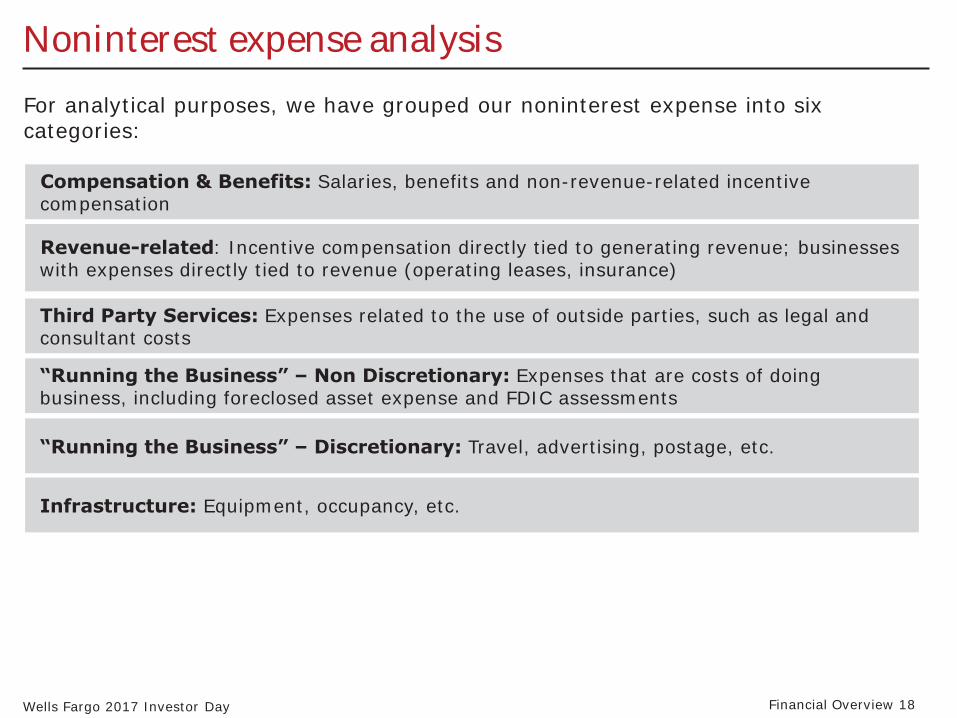
For analytical purposes, we have grouped our noninterest expense into six categories:
Compensation & Benefits: Salaries, benefits and non-revenue-related incentive compensation
Revenue-related: Incentive compensation directly tied to generating revenue; businesses with expenses directly tied to revenue (operating leases, insurance)
Third Party Services: Expenses related to the use of outside parties, such as legal and consultant costs
“Running the Business” – Non Discretionary: Expenses that are costs of doing business, including foreclosed asset expense and FDIC assessments
“Running the Business” – Discretionary: Travel, advertising, postage, etc.
Infrastructure: Equipment, occupancy, etc.
Wells Fargo 2017 Investor Day Financial Overview 18

Noninterest expense trends by type of expenditure
� Compensation & Benefits
� Revenue-related
� Running the Business – Non Discretionary
� Running the Business – Discretionary
� Third Party Services
� Infrastructure
2014 2016
Total Noninterest Expense ($ in billions)
$49.0 $52.4
� Noninterest expense increased 7% from 2014 to 2016 driven by: - Higher compensation and benefits, - Higher revenue-related expense and - Increased third party spend, - Partially offset by lower discretionary spend
Wells Fargo 2017 Investor Day Financial Overview 19

Compensation & Benefits expense driven by investment in technology and risk
2014 2016 Incentive Comp not Directly tied to Revenue and All Other Personnel Expense Salaries & Benefits driven by FTE Count
264.5
269.1
Compensation & Benefits ($ in billions)
$22.9 $24.6
Active FTEs
� 7% increase reflected higher salaries and employee benefits expense
- 61% of the increase reflected salary actions including annual increases, as well as the impact of higher-cost FTEs
- 24% of the increase was from higher employee benefits expense
- 15% of the increase was due to a 2% net increase in FTEs driven by growth in Risk, Technology and Wholesale (partly due to the GE Capital business acquisitions in 2016)
Enterprise Information Technology FTE
2014 2015 2016
� Technology spend makes up a significant portion of our annual spending
- Spent $7.1 billion in 2016, up 5% from 2015
- ~50% was personnel expense and the remainder was primarily infrastructure
Corporate Risk FTE
2014 2015 2016
Wells Fargo 2017 Investor Day Financial Overview 20
Revenue-related expenses up driven by GE Capital business acquisitions
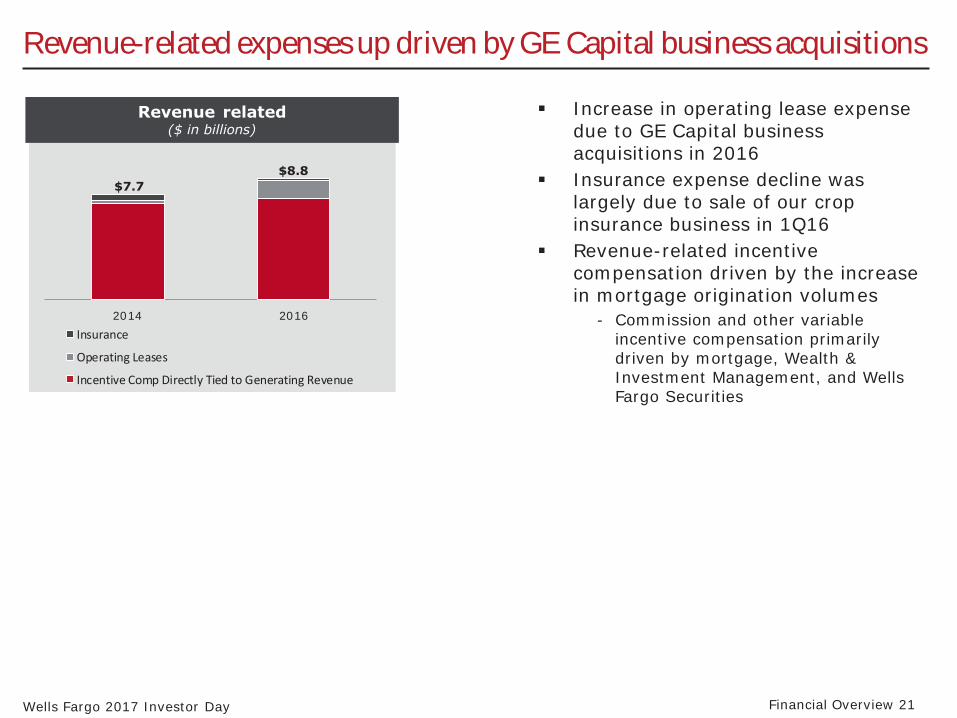
Revenue related ($ in billions)
� Increase in operating lease expense due to GE Capital business acquisitions in 2016
$8.8 � Insurance expense decline was $7.7
largely due to sale of our crop insurance business in 1Q16
� Revenue-related incentive compensation driven by the increase in mortgage origination volumes
2014 2016 - Commission and other variable Insurance incentive compensation primarily Operating Leases driven by mortgage, Wealth & Incentive Comp Directly Tied to Generating Revenue Investment Management, and Wells
Fargo Securities
Wells Fargo 2017 Investor Day Financial Overview 21
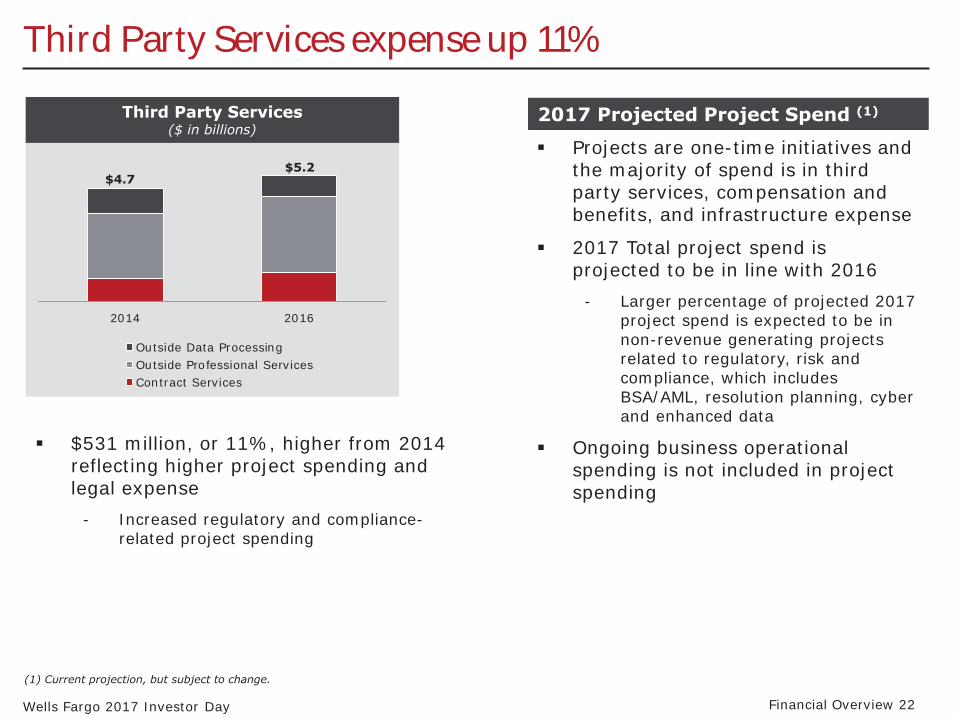
Third Party Services expense up 11%
2017 Projected Project Spend (1)
2014 2016
Outside Data Processing Outside Professional Services Contract Services
Third Party Services ($ in billions)
$5.2 $4.7
� $531 million, or 11%, higher from 2014 reflecting higher project spending and legal expense
- Increased regulatory and compliance-related project spending
� Projects are one-time initiatives and the majority of spend is in third party services, compensation and benefits, and infrastructure expense
� 2017 Total project spend is projected to be in line with 2016
- Larger percentage of projected 2017 project spend is expected to be in non-revenue generating projects related to regulatory, risk and compliance, which includes BSA/AML, resolution planning, cyber and enhanced data
� Ongoing business operational spending is not included in project spending
(1) Current projection, but subject to change.
Wells Fargo 2017 Investor Day Financial Overview 22

Non-discretionary up on higher operating losses and FDIC expense
� $320 million increase since 2014 reflected:
- $359 million higher operating losses driven by higher litigation accruals
- $240 million increase in FDIC expense driven in part by temporary surcharge
- $280 million increase in All Other, which includes insurance premiums, charitable contributions, etc.
- Partially offset by $381 million decline in foreclosed assets expense due to improving home prices, as well as lower deposit intangible amortization
Wells Fargo 2017 Investor Day Financial Overview 23
2014 2016
$6.1 $6.4
“Running the Business” – Non Discretionary
($ in billions)
All Other
Foreclosed Assets
Operating Losses
FDIC & Other Deposit Assessments
Core Deposit & Other Intangibles
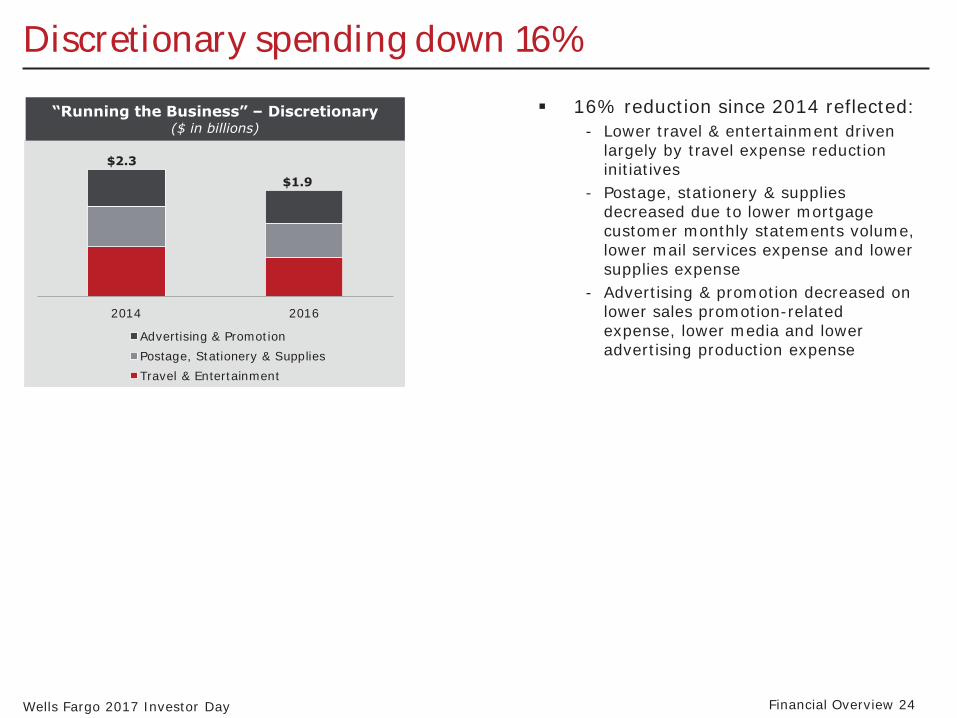
Discretionary spending down 16%
� 16% reduction since 2014 reflected: - Lower travel & entertainment driven
largely by travel expense reduction $2.3 initiatives
- Postage, stationery & supplies decreased due to lower mortgage customer monthly statements volume, lower mail services expense and lower supplies expense
- Advertising & promotion decreased on lower sales promotion-related expense, lower media and lower advertising production expense
2014 2016
Advertising & Promotion Postage, Stationery & Supplies Travel & Entertainment
$1.9
Wells Fargo 2017 Investor Day Financial Overview 24
“Running the Business” – Discretionary
($ in billions)

Infrastructure expenses stable even as we have grown
Infrastructure ($ in billions)
� Stable expense since 2014 reflected: - 2% decline in net occupancy expense
driven by ongoing efforts in real $5.4 $5.4 estate management, including
facilities optimization and efficiency initiatives
- Equipment expense increase driven by higher software license and maintenance fees
- Telecommunications expense down driven by lower telephone and data rates 2014 2016
Equipment Net Occupancy Telecommunications
Wells Fargo 2017 Investor Day Financial Overview 25
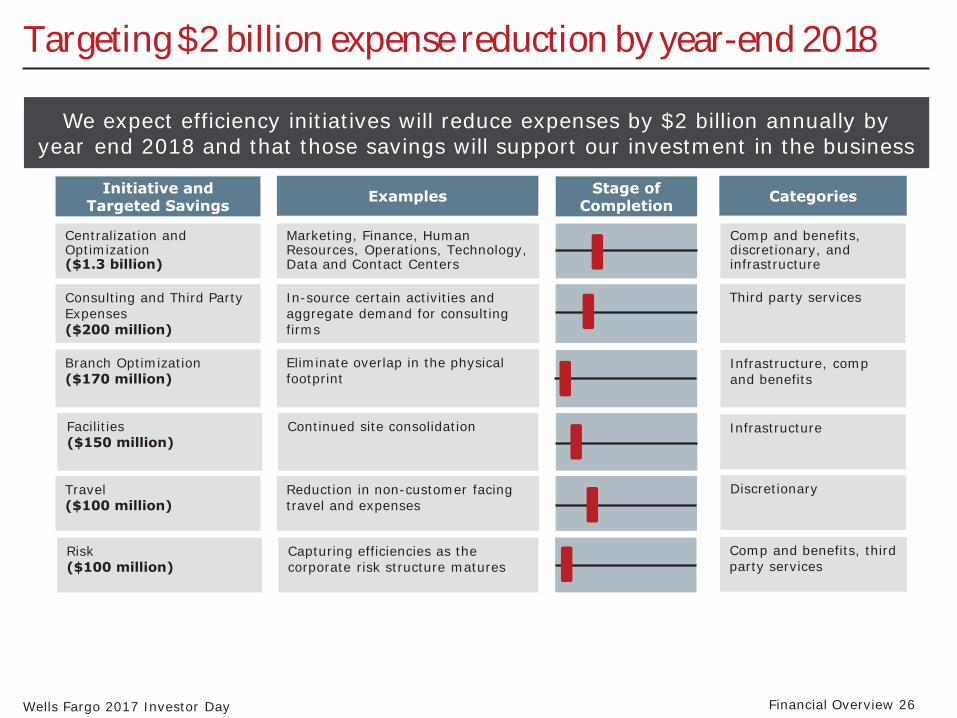
Targeting $2 billion expense reduction by year-end 2018
Initiative and Targeted Savings CategoriesExamples Stage of
Completion
We expect efficiency initiatives will reduce expenses by $2 billion annually by year end 2018 and that those savings will support our investment in the business
Centralization and Optimization ($1.3 billion)
Consulting and Third Party Expenses($200 million)
Branch Optimization ($170 million)
Facilities($150 million)
Travel($100 million)
Risk ($100 million)
Marketing, Finance, Human Resources, Operations, Technology, Data and Contact Centers
In-source certain activities and aggregate demand for consulting
firms
Eliminate overlap in the physical footprint
Continued site consolidation
Reduction in non-customer facing travel and expenses
Capturing efficiencies as the corporate risk structure matures
Comp and benefits, discretionary, and infrastructure
Third party services
Infrastructure, comp and benefits
Infrastructure
Discretionary
Comp and benefits, third party services
Wells Fargo 2017 Investor Day Financial Overview 26
Additional $2 billion in saves anticipated by year end 2019
We expect an additional $2 billion in annual expense reductions by the end of 2019; these savings are projected to go to the “bottom line”
Saves will be driven by a deepened focus and continued improvement on effectiveness and productivity to drive efficiency, including: � Consolidating similar operational activities to provide better economies of scale
� Improving processes, including using digital technology to automate manual processes
� Outsourcing of certain non-differentiated capabilities
� Rationalizing product sets
� Applying industry best practices to our call centers via technology and call routing
� Consolidation of duplicative processes across the lines of business
� Ongoing reduction in facilities driven by the continued move from physical to digital
Wells Fargo 2017 Investor Day Financial Overview 27

Capital positioning
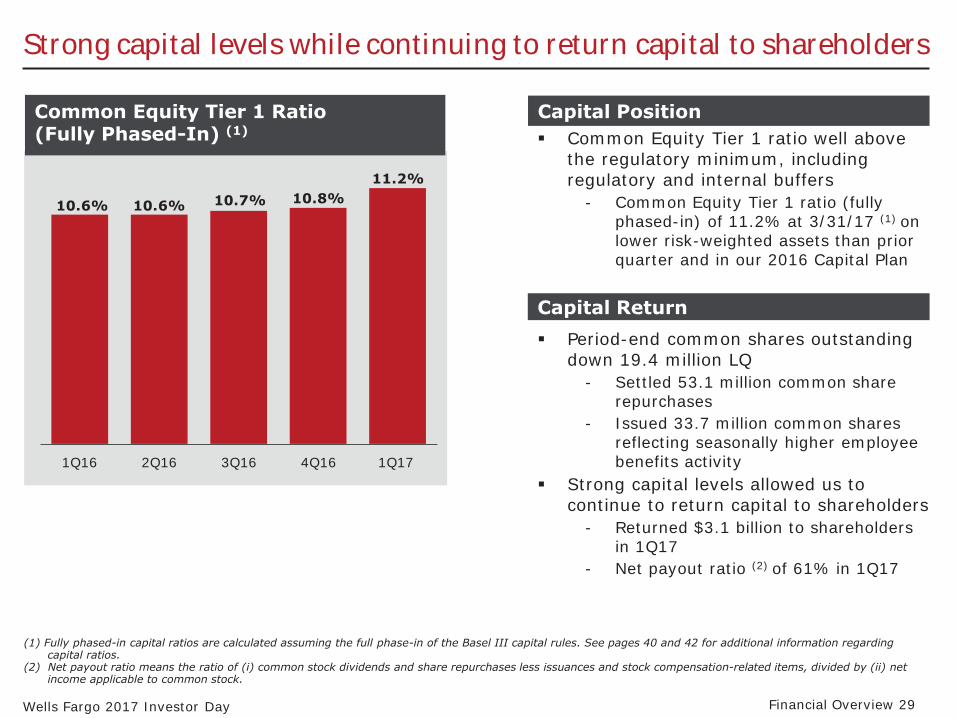
Strong capital levels while continuing to return capital to shareholders
Capital PositionCommon Equity Tier 1 Ratio (Fully Phased-In) (1) � Common Equity Tier 1 ratio well above
the regulatory minimum, including 11.2% regulatory and internal buffers
10.7% 10.8% - Common Equity Tier 1 ratio (fully phased-in) of 11.2% at 3/31/17 (1) on lower risk-weighted assets than prior quarter and in our 2016 Capital Plan
10.6% 10.6%
Capital Return � Period-end common shares outstanding
down 19.4 million LQ - Settled 53.1 million common share
repurchases - Issued 33.7 million common shares
reflecting seasonally higher employee 1Q16 2Q16 3Q16 4Q16 1Q17 benefits activity
� Strong capital levels allowed us to continue to return capital to shareholders
- Returned $3.1 billion to shareholders in 1Q17
- Net payout ratio (2) of 61% in 1Q17
(1) Fully phased-in capital ratios are calculated assuming the full phase-in of the Basel III capital rules. See pages 40 and 42 for additional information regarding capital ratios.
(2) Net payout ratio means the ratio of (i) common stock dividends and share repurchases less issuances and stock compensation-related items, divided by (ii) net income applicable to common stock.
Wells Fargo 2017 Investor Day Financial Overview 29
4.5%
2.5%
2.0%
1.0%
1.5%
1.8% 1.7%
2.0%
2.5%
Common Equity Tier 1 (CET1) Tier 1 Capital Tier 2 Capital
Minimum Capital Ratio
13.5%
Capital Conservation
Buffer
GSIB Surcharge (3)
Internal Buffer
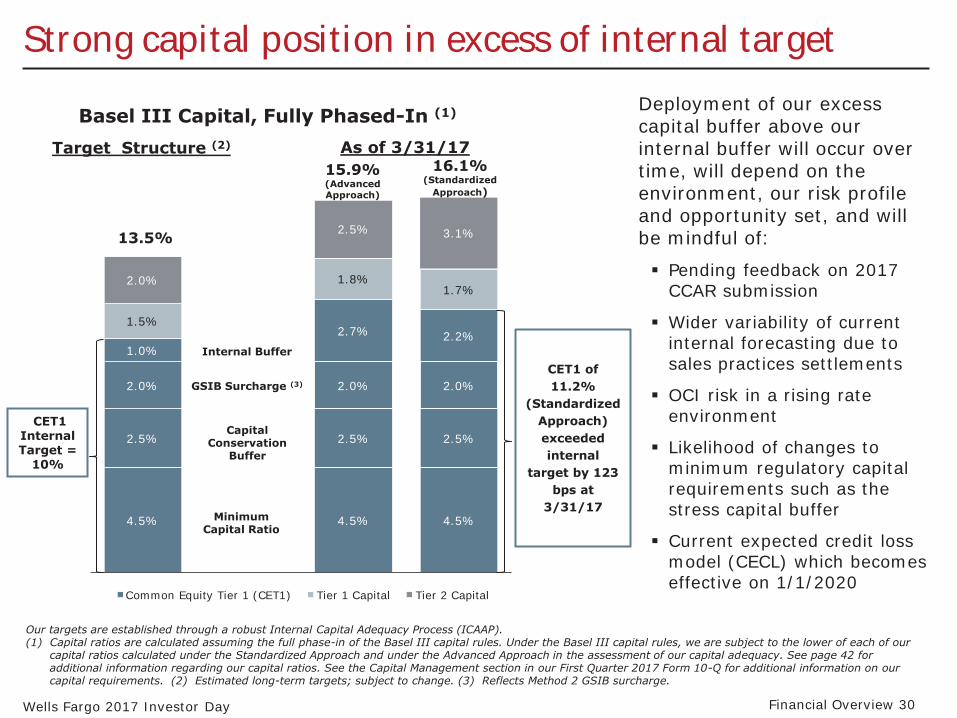
Strong capital position in excess of internal target
Basel III Capital, Fully Phased-In (1)
Target Structure (2) As of 3/31/17 16.1%15.9%
(Standardized (Advanced Approach) Approach)
3.1%
CET1 Internal Target =
10%
4.5%
2.5%
2.0%
2.2%
4.5%
2.5%
2.0%
2.7%
CET1 of 11.2%
(Standardized Approach) exceeded internal
target by 123 bps at
3/31/17
Our targets are established through a robust Internal Capital Adequacy Process (ICAAP).
Deployment of our excess capital buffer above our internal buffer will occur over time, will depend on the environment, our risk profile and opportunity set, and will be mindful of: � Pending feedback on 2017
CCAR submission
� Wider variability of current internal forecasting due to sales practices settlements
� OCI risk in a rising rate environment
� Likelihood of changes to minimum regulatory capital requirements such as the stress capital buffer
� Current expected credit loss model (CECL) which becomes effective on 1/1/2020
(1) Capital ratios are calculated assuming the full phase-in of the Basel III capital rules. Under the Basel III capital rules, we are subject to the lower of each of our capital ratios calculated under the Standardized Approach and under the Advanced Approach in the assessment of our capital adequacy. See page 42 for additional information regarding our capital ratios. See the Capital Management section in our First Quarter 2017 Form 10-Q for additional information on our capital requirements. (2) Estimated long-term targets; subject to change. (3) Reflects Method 2 GSIB surcharge.
Wells Fargo 2017 Investor Day Financial Overview 30

Targets
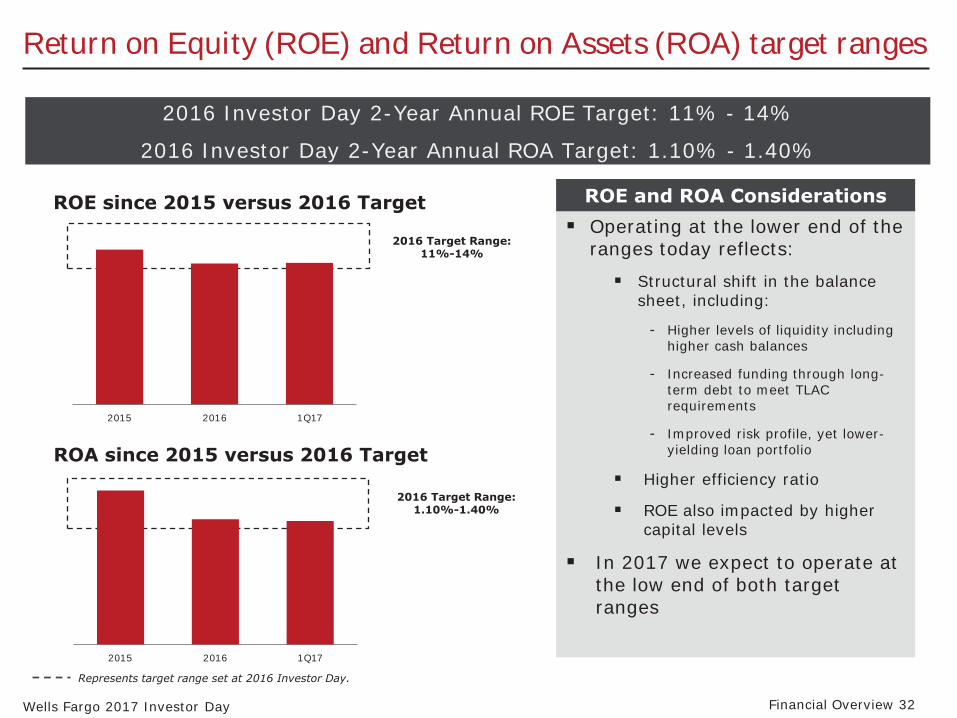
Return on Equity (ROE) and Return on Assets (ROA) target ranges
2016 Investor Day 2-Year Annual ROE Target: 11% - 14%
2016 Investor Day 2-Year Annual ROA Target: 1.10% - 1.40%
ROE and ROA Considerations � Operating at the lower end of the
2016 Target Range: 11%-14% ranges today reflects:
� Structural shift in the balance sheet, including:
- Higher levels of liquidity including higher cash balances
- Increased funding through long-term debt to meet TLAC requirements
- Improved risk profile, yet lower-yielding loan portfolio ROA since 2015 versus 2016 Target
ROE since 2015 versus 2016 Target
2015 2016 1Q17
� Higher efficiency ratio 2016 Target Range:
1.10%-1.40% � ROE also impacted by higher capital levels
� In 2017 we expect to operate at the low end of both target ranges
2015 2016 1Q17
Represents target range set at 2016 Investor Day.
Wells Fargo 2017 Investor Day Financial Overview 32
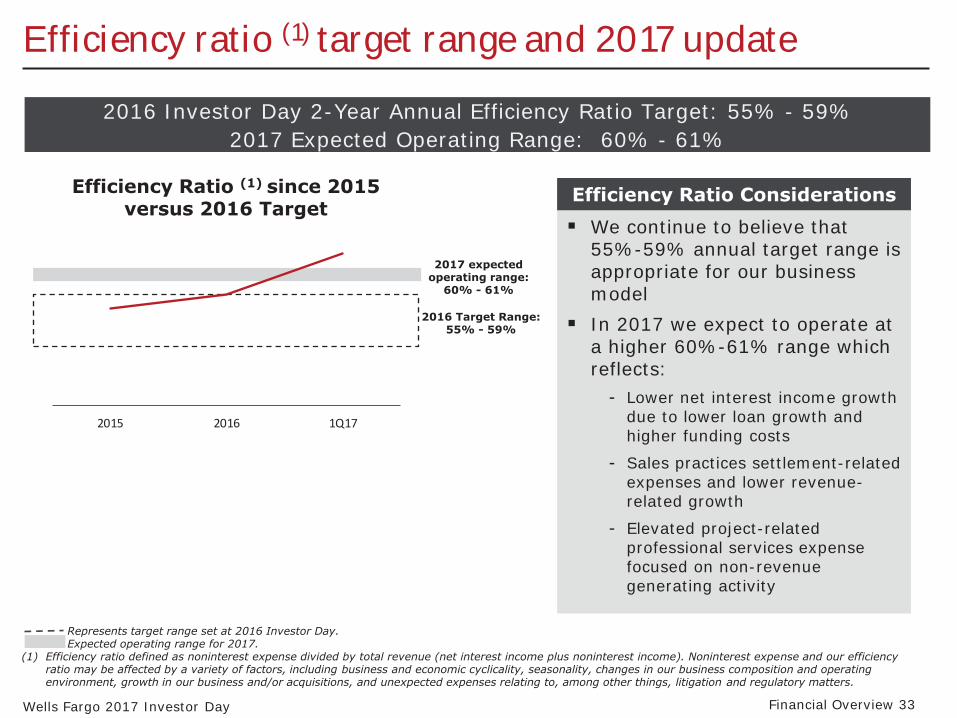
Efficiency ratio (1) target range and 2017 update
2016 Investor Day 2-Year Annual Efficiency Ratio Target: 55% - 59% 2017 Expected Operating Range: 60% - 61%
Efficiency Ratio (1) since 2015 versus 2016 Target
Efficiency Ratio Considerations � We continue to believe that
55%-59% annual target range is 2017 expected
operating range: appropriate for our business 60% - 61% model
2016 Target Range: 55% - 59% � In 2017 we expect to operate at
a higher 60%-61% range which reflects:
- Lower net interest income growth due to lower loan growth and 2015 2016 1Q17 higher funding costs
- Sales practices settlement-related expenses and lower revenue-related growth
- Elevated project-related professional services expense focused on non-revenue generating activity
Represents target range set at 2016 Investor Day. Expected operating range for 2017.
(1) Efficiency ratio defined as noninterest expense divided by total revenue (net interest income plus noninterest income). Noninterest expense and our efficiency ratio may be affected by a variety of factors, including business and economic cyclicality, seasonality, changes in our business composition and operating environment, growth in our business and/or acquisitions, and unexpected expenses relating to, among other things, litigation and regulatory matters.
Wells Fargo 2017 Investor Day Financial Overview 33

Organic capital growth has supported strong payouts
($ in millions) 2012 2013 2014 2015 2016 1Q17
Net Income Applicable to Common Stock $17,999 20,889 21,821 21,470 20,373 5,056
Common Stock Dividends 4,658 6,086 7,067 7,580 7,661 1,903
Gross Share Repurchases 3,918 5,356 9,414 8,697 8,116 2,175 Gross Capital Returned to Shareholders 8,576 11,442 16,481 16,277 15,777 4,078
Net Share Repurchases / (Issuance) (160) 1,098 5,398 5,037 4,797 1,195 Net Capital Returned to Shareholders 4,499 $ 7,184 12,465 12,616 12,458 3,098
Dividend Payout Ratio (1) 25.9% 29.1% 32.4% 35.3% 37.6% 37.6% Net Payout Ratio (2) 25.0% 34.4% 57.1% 58.8% 61.2% 61.3%
(1) Dividend payout ratio means the ratio of (i) common stock dividends, divided by (ii) net income applicable to common stock. (2) Net payout ratio means the ratio of (i) common stock dividends and share repurchases less issuances and stock compensation-related items, divided
by (ii) net income applicable to common stock.
Wells Fargo 2017 Investor Day Financial Overview 34
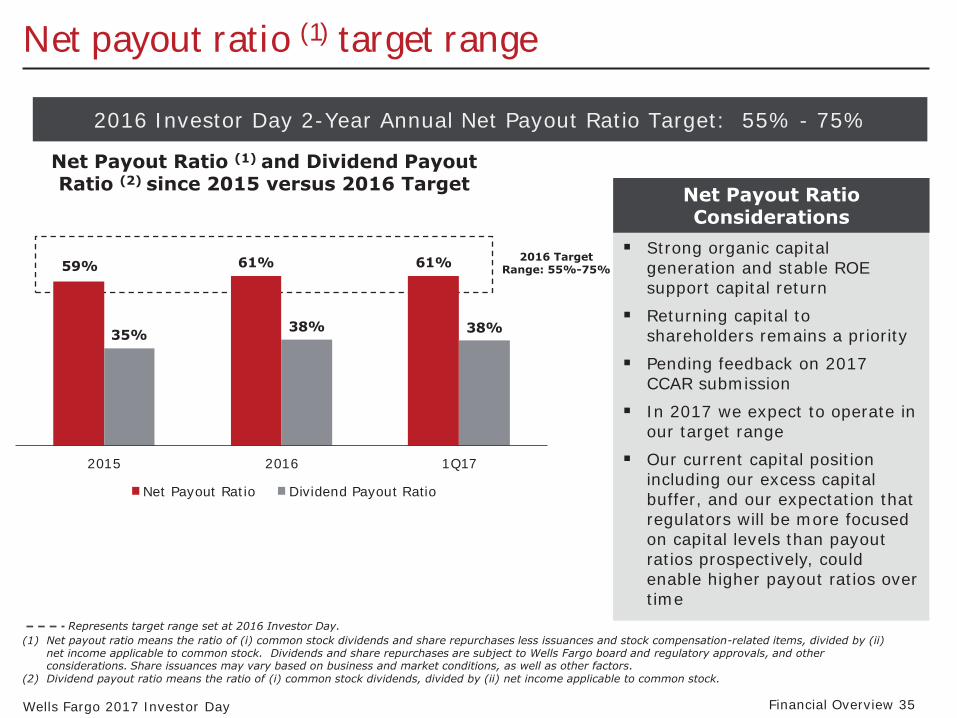
Net payout ratio (1) target range
2016 Investor Day 2-Year Annual Net Payout Ratio Target: 55% - 75%
Net Payout Ratio (1) and Dividend Payout Ratio (2) since 2015 versus 2016 Target
59% 61% 61%
35% 38% 38%
2015 2016 1Q17
Net Payout Ratio Dividend Payout Ratio
2016 Target Range: 55%-75%
Net Payout Ratio Considerations
� Strong organic capital generation and stable ROE support capital return
� Returning capital to shareholders remains a priority
� Pending feedback on 2017 CCAR submission
� In 2017 we expect to operate in our target range
� Our current capital position including our excess capital buffer, and our expectation that regulators will be more focused on capital levels than payout ratios prospectively, could enable higher payout ratios over time
Represents target range set at 2016 Investor Day. (1) Net payout ratio means the ratio of (i) common stock dividends and share repurchases less issuances and stock compensation-related items, divided by (ii)
net income applicable to common stock. Dividends and share repurchases are subject to Wells Fargo board and regulatory approvals, and other considerations. Share issuances may vary based on business and market conditions, as well as other factors.
(2) Dividend payout ratio means the ratio of (i) common stock dividends, divided by (ii) net income applicable to common stock.
Wells Fargo 2017 Investor Day Financial Overview 35
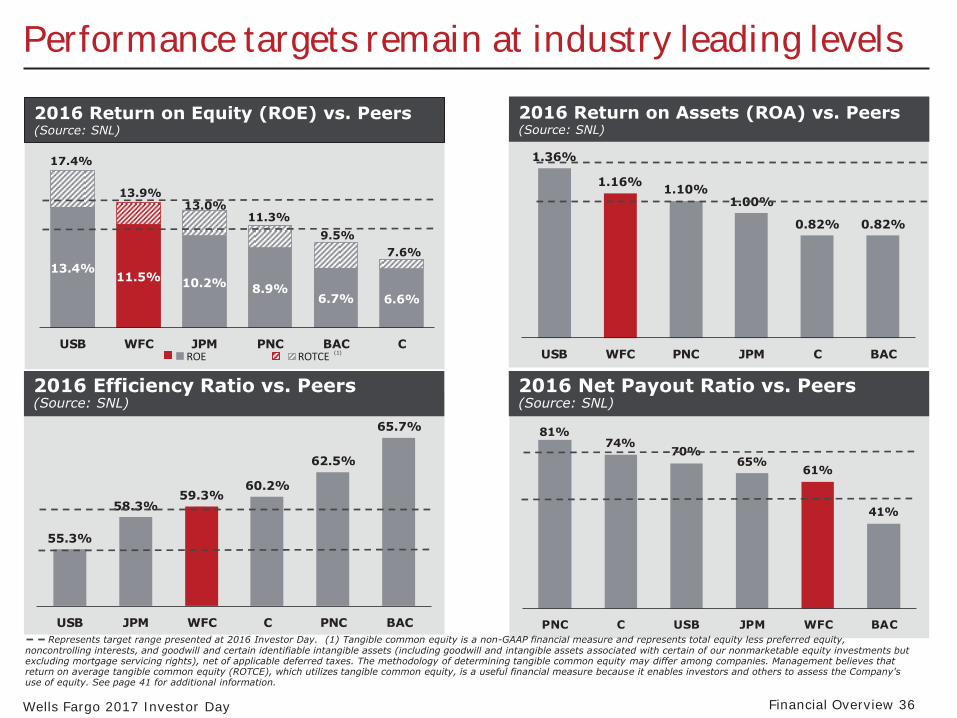
Performance targets remain at industry leading levels
13.4% 11.5% 10.2% 8.9%
6.7% 6.6%
USB WFC JPM PNC BAC C ROE ROTCE
2016 Return on Equity (ROE) vs. Peers (Source: SNL)
55.3%
58.3% 59.3%
60.2%
62.5%
65.7%
USB JPM WFC C PNC BAC
2016 Efficiency Ratio vs. Peers(Source: SNL)
13.9%
17.4%
13.0% 11.3%
9.5% 7.6%
(1)
81% 74%
70% 65%
61%
41%
PNC C USB JPM WFC BAC
1.36%
1.16% 1.10% 1.00%
0.82% 0.82%
USB WFC PNC JPM C BAC
2016 Return on Assets (ROA) vs. Peers (Source: SNL)
2016 Net Payout Ratio vs. Peers(Source: SNL)
Represents target range presented at 2016 Investor Day. (1) Tangible common equity is a non-GAAP financial measure and represents total equity less preferred equity, noncontrolling interests, and goodwill and certain identifiable intangible assets (including goodwill and intangible assets associated with certain of our nonmarketable equity investments but excluding mortgage servicing rights), net of applicable deferred taxes. The methodology of determining tangible common equity may differ among companies. Management believes that return on average tangible common equity (ROTCE), which utilizes tangible common equity, is a useful financial measure because it enables investors and others to assess the Company's use of equity. See page 41 for additional information.
Wells Fargo 2017 Investor Day Financial Overview 36

Potential drivers of improved returns and efficiency in 2018
� Potential drivers and hypothetical assumptions (1) including ROE, ROA and Efficiency Ratio
Revenue
Noninterest Expense
� 2018 total revenue up ~1% from 2017 on net interest income growth
- Steady and consistent rise in interest rates - Moderately steeper yield curve
� 2018 expenses down modestly, <1%, from 2017
� 35 bps of net charge-offs in 2018 Provision Expense
Efficiency Ratio ROE ROA 12.30% 1.15% 1.17% 60.3% 57.4%
11.44%
(2) (1) (2) (1) (2) (1)TTM 2018 TTM 2018 TTM 2018
(1) Hypothetical; not to be interpreted as guidance. This is just as illustrative example of where we could operate given these hypothetical assumptions. Results will vary based on business and market conditions, as well as other factors.
(2) Trailing twelve months, 2Q16 through 1Q17.
Wells Fargo 2017 Investor Day Financial Overview 37

Summary
� Diversified business model allows us to perform consistently over the cycle
� Balance sheet is modestly asset sensitive - Expect to grow net interest income year-over-year in 2017 by low to mid single
percentage points
� Key expense takeaways: - $2.0 billion of annual expense savings anticipated by year-end 2018, and those
savings will help offset investment spending that is already in our run-rate
- We expect an additional $2.0 billion in annual expense savings by year-end 2019; these savings are projected to go to the “bottom line”
� Performance targets takeaways: - 2017 ROE and ROA are expected to be at low end of target ranges
- 2017 Efficiency ratio is expected to be elevated at 60%-61%
- 2-year annual performance targets established in 2016 remain at industry-leading levels
� Potential upside revenue opportunities across the company
Wells Fargo 2017 Investor Day Financial Overview 38

Appendix
Common Equity Tier 1 (Fully Phased-In)
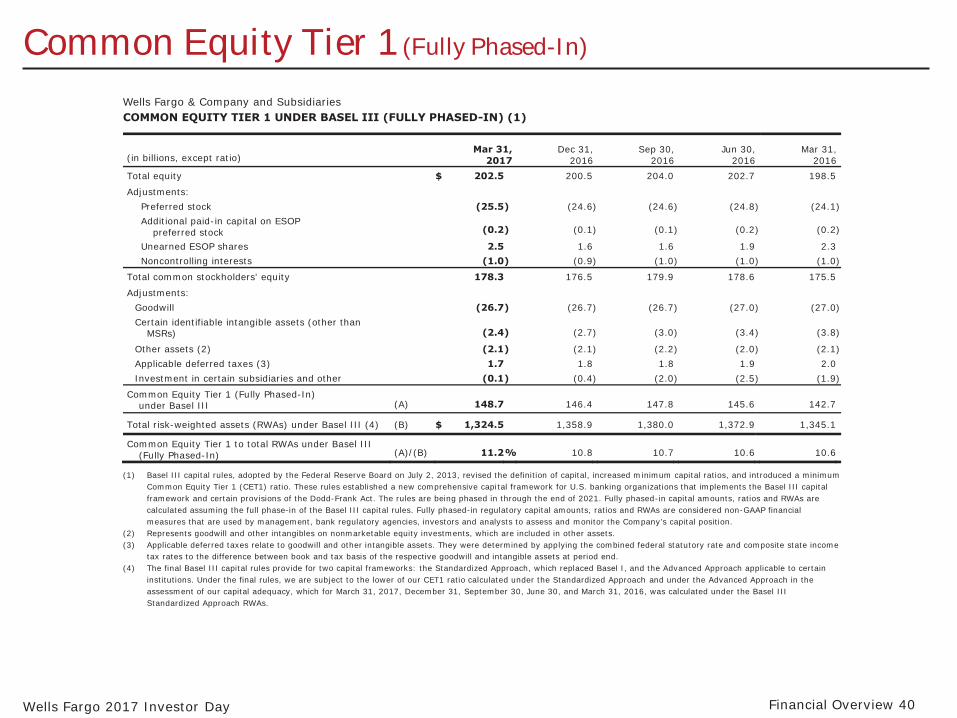
Wells Fargo & Company and Subsidiaries COMMON EQUITY TIER 1 UNDER BASEL III (FULLY PHASED-IN) (1)
Mar 31, Dec 31, Sep 30, Jun 30, Mar 31,(in billions, except ratio) 2017 2016 2016 2016 2016 Total equity $ 202.5 200.5 204.0 202.7 198.5
Adjustments: Preferred stock (25.5) (24.6) (24.6) (24.8) (24.1) Additional paid-in capital on ESOP
preferred stock (0.2) (0.1) (0.1) (0.2) (0.2)
Unearned ESOP shares 2.5 1.6 1.6 1.9 2.3 Noncontrolling interests (1.0) (0.9) (1.0) (1.0) (1.0)
Total common stockholders' equity 178.3 176.5 179.9 178.6 175.5
Adjustments: Goodwill (26.7) (26.7) (26.7) (27.0) (27.0) Certain identifiable intangible assets (other than
MSRs) (2.4) (2.7) (3.0) (3.4) (3.8)
Other assets (2) (2.1) (2.1) (2.2) (2.0) (2.1) Applicable deferred taxes (3) 1.7 1.8 1.8 1.9 2.0 Investment in certain subsidiaries and other (0.1) (0.4) (2.0) (2.5) (1.9)
Common Equity Tier 1 (Fully Phased-In) under Basel III (A) 148.7 146.4 147.8 145.6 142.7
Total risk-weighted assets (RWAs) under Basel III (4) (B) $ 1,324.5 1,358.9 1,380.0 1,372.9 1,345.1
Common Equity Tier 1 to total RWAs under Basel III (Fully Phased-In) (A)/(B) 11.2% 10.8 10.7 10.6 10.6
(1) Basel III capital rules, adopted by the Federal Reserve Board on July 2, 2013, revised the definition of capital, increased minimum capital ratios, and introduced a minimum Common Equity Tier 1 (CET1) ratio. These rules established a new comprehensive capital framework for U.S. banking organizations that implements the Basel III capital framework and certain provisions of the Dodd-Frank Act. The rules are being phased in through the end of 2021. Fully phased-in capital amounts, ratios and RWAs are calculated assuming the full phase-in of the Basel III capital rules. Fully phased-in regulatory capital amounts, ratios and RWAs are considered non-GAAP financial measures that are used by management, bank regulatory agencies, investors and analysts to assess and monitor the Company’s capital position.
(2) Represents goodwill and other intangibles on nonmarketable equity investments, which are included in other assets. (3) Applicable deferred taxes relate to goodwill and other intangible assets. They were determined by applying the combined federal statutory rate and composite state income
tax rates to the difference between book and tax basis of the respective goodwill and intangible assets at period end. (4) The final Basel III capital rules provide for two capital frameworks: the Standardized Approach, which replaced Basel I, and the Advanced Approach applicable to certain
institutions. Under the final rules, we are subject to the lower of our CET1 ratio calculated under the Standardized Approach and under the Advanced Approach in the assessment of our capital adequacy, which for March 31, 2017, December 31, September 30, June 30, and March 31, 2016, was calculated under the Basel III Standardized Approach RWAs.
Wells Fargo 2017 Investor Day Financial Overview 40

Return on average tangible common equity (ROTCE) Wells Fargo & Company and Subsidiaries TANGIBLE COMMON EQUITY (1)
Year ended (in millions, except ratios) Dec 31, 2016
Return on average tangible common equity (1):
Net income applicable to common stock (A) $ 20,373
Average total equity 200,690
Adjustments:
Preferred stock (24,363)
Additional paid-in capital on ESOP preferred stock (161)
Unearned ESOP shares 2,011
Noncontrolling interests (936)
Average common stockholders’ equity (B) 177,241
Adjustments:
Goodwill (26,700)
Certain identifiable intangible assets (other than MSRs) (3,254)
Other assets (2) (2,117)
Applicable deferred taxes (3) 1,897
Average tangible common equity (C) $ 147,067
Return on average common stockholders' equity (ROE) (A)/(B) 11.49% Return on average tangible common equity (ROTCE) (A)/(C) 13.85
(1) Tangible common equity is a non-GAAP financial measure and represents total equity less preferred equity, noncontrolling interests, and goodwill and certain identifiable intangible assets (including goodwill and intangible assets associated with certain of our nonmarketable equity investments but excluding mortgage servicing rights), net of applicable deferred taxes. The methodology of determining tangible common equity may differ among companies. Management believes that return on average tangible common equity, which utilizes tangible common equity, is a useful financial measure because it enables investors and others to assess the Company's use of equity.
(2) Represents goodwill and other intangibles on nonmarketable equity investments, which are included in other assets.
(3) Applicable deferred taxes relate to goodwill and other intangible assets. They were determined by applying the combined federal statutory rate and composite state income tax rates to the difference between book and tax basis of the respective goodwill and intangible assets at period end.
Wells Fargo 2017 Investor Day Financial Overview 41
Basel III capital components and ratios (Fully phased-in)
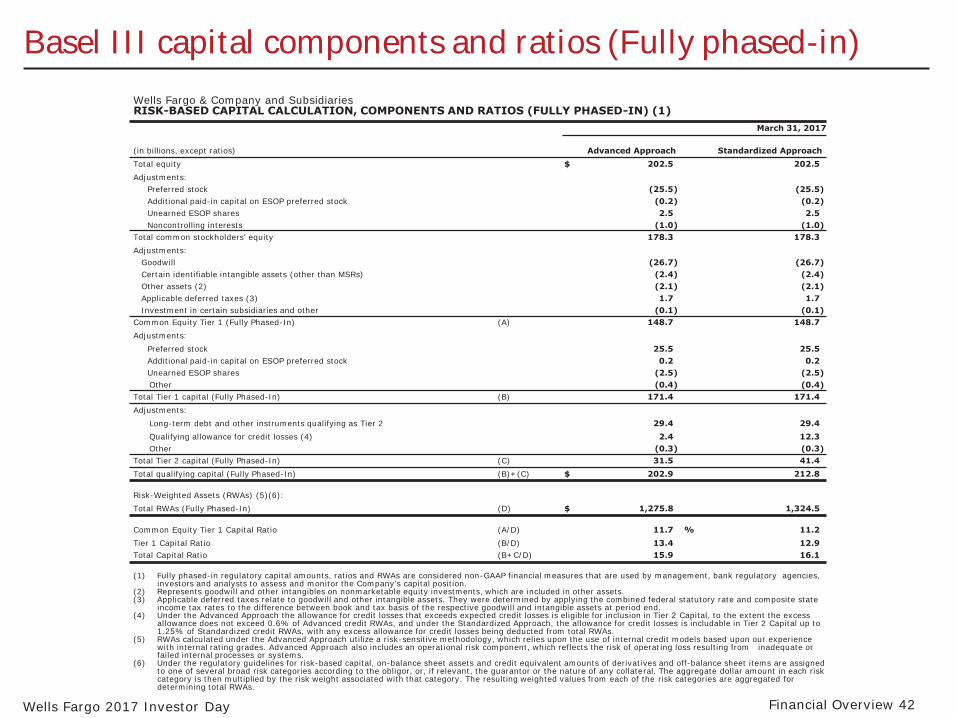
Wells Fargo & Company and Subsidiaries RISK-BASED CAPITAL CALCULATION, COMPONENTS AND RATIOS (FULLY PHASED-IN) (1)
(in billions, except ratios) Adva Approach nced Stan
March 31, 2017
Approach dardizedTotal equity $ 202.5 202.5 Adjustments:
Preferred stock (25.5) (25.5) Additional paid-in capital on ESOP preferred stock (0.2) (0.2) Unearned ESOP shares 2.5 2.5 Noncontrolling interests (1.0) (1.0)
Total common stockholders' equity 178.3 178.3 Adjustments:
Goodwill (26.7) (26.7) Certain identifiable intangible assets (other than MSRs) (2.4) (2.4) Other assets (2) (2.1) (2.1) Applicable deferred taxes (3) 1.7 1.7 Investment in certain subsidiaries and other (0.1) (0.1)
Common Equity Tier 1 (Fully Phased-In) (A) 148.7 148.7 Adjustments:
Preferred stock 25.5 25.5 Additional paid-in capital on ESOP preferred stock 0.2 0.2 Unearned ESOP shares (2.5) (2.5) Other (0.4) (0.4)
Total Tier 1 capital (Fully Phased-In) (B) 171.4 171.4 Adjustments:
Long-term debt and other instruments qualifying as Tier 2 Qualifying allowance for credit losses (4) Other
Total Tier 2 capital (Fully Phased-In) Total qualifying capital (Fully Phased-In)
(C) (B)+(C) $
29.4 2.4
(0.3) 31.5
202.9
29.4 12.3 (0.3) 41.4
212.8
Risk-Weighted Assets (RWAs) (5)(6): Total RWAs (Fully Phased-In) (D) $ 1,275.8 1,324.5
Common Equity Tier 1 Capital Ratio Tier 1 Capital Ratio Total Capital Ratio
(A/D) (B/D) (B+C/D)
11.7 % 13.4 15.9
11.2 12.9 16.1
(1) Fully phased-in regulatory capital amounts, ratios and RWAs are considered non-GAAP financial measures that are used by management, bank regulatory agencies, investors and analysts to assess and monitor the Company’s capital position.
(2) Represents goodwill and other intangibles on nonmarketable equity investments, which are included in other assets. (3) Applicable deferred taxes relate to goodwill and other intangible assets. They were determined by applying the combined federal statutory rate and composite state
income tax rates to the difference between book and tax basis of the respective goodwill and intangible assets at period end. (4) Under the Advanced Approach the allowance for credit losses that exceeds expected credit losses is eligible for inclusion in Tier 2 Capital, to the extent the excess
allowance does not exceed 0.6% of Advanced credit RWAs, and under the Standardized Approach, the allowance for credit losses is includable in Tier 2 Capital up to 1.25% of Standardized credit RWAs, with any excess allowance for credit losses being deducted from total RWAs.
(5) RWAs calculated under the Advanced Approach utilize a risk-sensitive methodology, which relies upon the use of internal credit models based upon our experiencewith internal rating grades. Advanced Approach also includes an operational risk component, which reflects the risk of operating loss resulting from inadequate or failed internal processes or systems.
(6) Under the regulatory guidelines for risk-based capital, on-balance sheet assets and credit equivalent amounts of derivatives and off-balance sheet items are assigned to one of several broad risk categories according to the obligor, or, if relevant, the guarantor or the nature of any collateral. The aggregate dollar amount in each risk category is then multiplied by the risk weight associated with that category. The resulting weighted values from each of the risk categories are aggregated for determining total RWAs.
Wells Fargo 2017 Investor Day Financial Overview 42

Biography

John Shrewsberry Senior EVP, Chief Financial Officer � Senior Executive Vice President John Shrewsberry is the chief financial officer
responsible for Wells Fargo’s financial management functions including accounting and control, financial planning and analysis, line of business finance functions, asset-liability management, treasury, tax management, investor relations, and the company’s investment portfolios. John is also responsible for Wells Fargo’s corporate development, information technology, corporate properties and security, and corporate strategy functions. John serves on the Wells Fargo Operating and Market Risk Committees and is based in San Francisco.
� A 22-year veteran of banking and investing, John served as head of Wells Fargo Securities from 2006 through May 2014, where he was responsible for investment banking and capital markets activity. From 2001 through 2005, he was the group head of Wells Fargo Commercial Capital, the successor to a commercial finance company he co-founded that became part of Wells Fargo in 2001. Previously, John worked at Goldman Sachs and Credit Suisse First Boston in the principal finance areas. He started his career as a Certified Public Accountant at Coopers & Lybrand.
� John earned his B.A. in economics from Claremont McKenna College and an M.B.A. from the Yale School of Management.
� John currently serves on the board for the Committee on Capital Markets Regulation, the Financial Economics Institute, the Yale School of Management, the Yale Corporation Investment Committee and he is active with the Juvenile Diabetes Research Foundation.
Wells Fargo 2017 Investor Day Financial Overview 44